editorial and business address: chemical engineering education
TRANSCRIPT
Winter 2003 1
Chemical Engineering Education Volume 37 Number 1 Winter 2003
CHEMICAL ENGINEERING EDUCATION (ISSN 0009-2479) is published quarterly by the Chemical EngineeringDivision, American Society for Engineering Education, and is edited at the University of Florida. Correspondenceregarding editorial matter, circulation, and changes of address should be sent to CEE, Chemical Engineering Department,University of Florida, Gainesville, FL 32611-6005. Copyright © 2003 by the Chemical Engineering Division, AmericanSociety for Engineering Education. The statements and opinions expressed in this periodical are those of the writers and notnecessarily those of the ChE Division, ASEE, which body assumes no responsibility for them. Defective copies replaced ifnotified within 120 days of publication. Write for information on subscription costs and for back copy costs and availability.POSTMASTER: Send address changes to Chemical Engineering Education, Chemical Engineering Department., Universityof Florida, Gainesville, FL 32611-6005. Periodicals Postage Paid at Gainesville, Florida and additional post offices.
EDITORIAL AND BUSINESS ADDRESS:Chemical Engineering Education
Department of Chemical EngineeringUniversity of Florida • Gainesville, FL 32611
PHONE and FAX : 352-392-0861e-mail: [email protected]
EDITORTim Anderson
ASSOCIATE EDITORPhillip C. Wankat
MANAGING EDITORCarole Yocum
PROBLEM EDITORJames O. Wilkes, U. Michigan
LEARNING IN INDUSTRY EDITORWilliam J. Koros, Georgia Institute of Technology
• CHAIRMAN •E. Dendy Sloan, Jr.
Colorado School of Mines
• MEMBERS •Pablo Debenedetti
Princeton University
Dianne DorlandRowan University
Thomas F. EdgarUniversity of Texas at Austin
Richard M. FelderNorth Carolina State University
Bruce A. FinlaysonUniversity of Washington
H. Scott FoglerUniversity of Michigan
William J. KorosGeorgia Institute of Technology
David F. OllisNorth Carolina State University
Ronald W. RousseauGeorgia Institute of Technology
Stanley I. SandlerUniversity of Delaware
Richard C. SeagraveIowa State University
C. Stewart SlaterRowan University
James E. SticeUniversity of Texas at Austin
Donald R. WoodsMcMaster University
� DEPARTMENT2 Vanderbilt University, M. Douglas LeVan
� EDUCATOR8 Robert Hesketh of Rowan University, C. Stewart Slater
� CLASSROOM14 Introducing the Stochastic Simulation of Chemical Reactions: Using
the Gillespie Algorithm and MATLAB,Joaquín Martínez-Urreaga, José Mira, Camino González-Fernández
20 Construction and Visualization of VLE Envelopes in Mathcad,Jasper L. Dickson, John A. Hart, IV, Wei-Yin Chen
� CURRICULUM24 Frontiers of Chemical Engineering: A Chemical Engineering Freshman
Seminar,Frank M. Bowman, R. Robert Balcarcel, G. Kane Jennings,Bridget R. Rogers
� RANDOM THOUGHTS30 How to Survive Engineering School
Richard M. Felder
� MEMBRANES IN ChE EDUCATION32 Introduction
33 Analysis of Membrane Processes in the Introduction-to-ChE Course,Andrew L. Zydney
38 A Press RO System: An Interdisciplinary Reverse Osmosis Project forFirst-Year Engineering Students,
S. Scott Moor, Edmond P. Saliklis, Scott R. Hummel, Yih-Choung Yu
46 A Compendium of Open-Ended Membrane Problems in the Curriculum, G. Glenn Lipscomb
52 Exploring the Potential of Electrodialysis,Stephanie Farrell, Robert P. Hesketh, C. Stewart Slater
60 Tools for Teaching Gas Separation Using Polymers,David T. Coker, Rajeev Prabhakar, Benny D. Freeman
68 Membrane Projects with an Industrial Focus in the Curriculum,Stephanie Farrell, Robert P. Hesketh, Mariano J. Savelski,
Kevin D.Dahm, C. Stewart Slater
74 A Simple Analysis for Gas Separation Membrane Experiments,Richard A. Davis, Orville C. Sandall
44 Book Review
45 Letter to the Editor
51 Stirred Pots
PUBLICATIONS BOARD
2 Chemical Engineering Education
Like our discipline, the Department of ChemicalEngineering at Vanderbilt University is experi-encing a significant expansion beyond its tradi-
tional roots toward advanced materials, bioengineering,and other product and application areas. To respond tochanges in the field and to take a strong leadership rolein research developments in the future, the Departmenthas concentrated on building expertise through facultyrecruitment, revising both undergraduate and graduatecurricula, and cultivating ambitious interdisciplinary re-search thrusts. The University’s established world-classresearch prominence in medicine, biology, and environ-mental studies augments its advantages in reaching itsfuture goals.
VANDERBILT UNIVERSITYEstablished in 1873, Vanderbilt University has a long-
standing tradition for academic excellence. CorneliusVanderbilt, “The Commodore,” contributed approxi-mately one million dollars of his personal fortune to builda university that could help repair the post-Civil-War riftsamong geographical areas of the nation. The Universitycontinues to cultivate a tradition of collegiality, interdis-ciplinary teamwork, and cohesion.
The University, now a national arboretum, is locatedon 330 park-like acres one and one-half miles from down-town Nashville. It has ten schools, which provide a fullrange of undergraduate, graduate, and professional pro-grams. There are four schools with undergraduate pro-grams: the School of Engineering, the College of Artsand Science, Peabody College (education), and the BlairSchool of Music. The Graduate School confers MA, MS,
and PhD degrees. The PhD is offered in 39 disciplines. In addition,there are schools of medicine, nursing, management, law, and di-vinity. Vanderbilt has about 1,900 full-time faculty members and adiverse student body with 6,200 undergraduates and 4,300 gradu-ate and professional students.
Vanderbilt’s Chancellor, Gordon Gee, joined the University twoyears ago after having been President of West Virginia University,the University of Colorado, Ohio State University, and Brown Uni-versity. Changes have been occurring throughout the University. Aresidential college system for undergraduates is being strongly con-sidered, and graduate research is an area of considerable focus.The Board of Trust, the University’s governing body, has con-tributed significant funds for several new interdisciplinary re-search initiatives.
Nashville is called the “Athens of the South” and “Music City
ChE department
© Copyright ChE Division of ASEE 2003
VanderbiltUniversity
ChE at...
M. DOUGLAS LEVAN
Vanderbilt University • Nashville, TN 37235
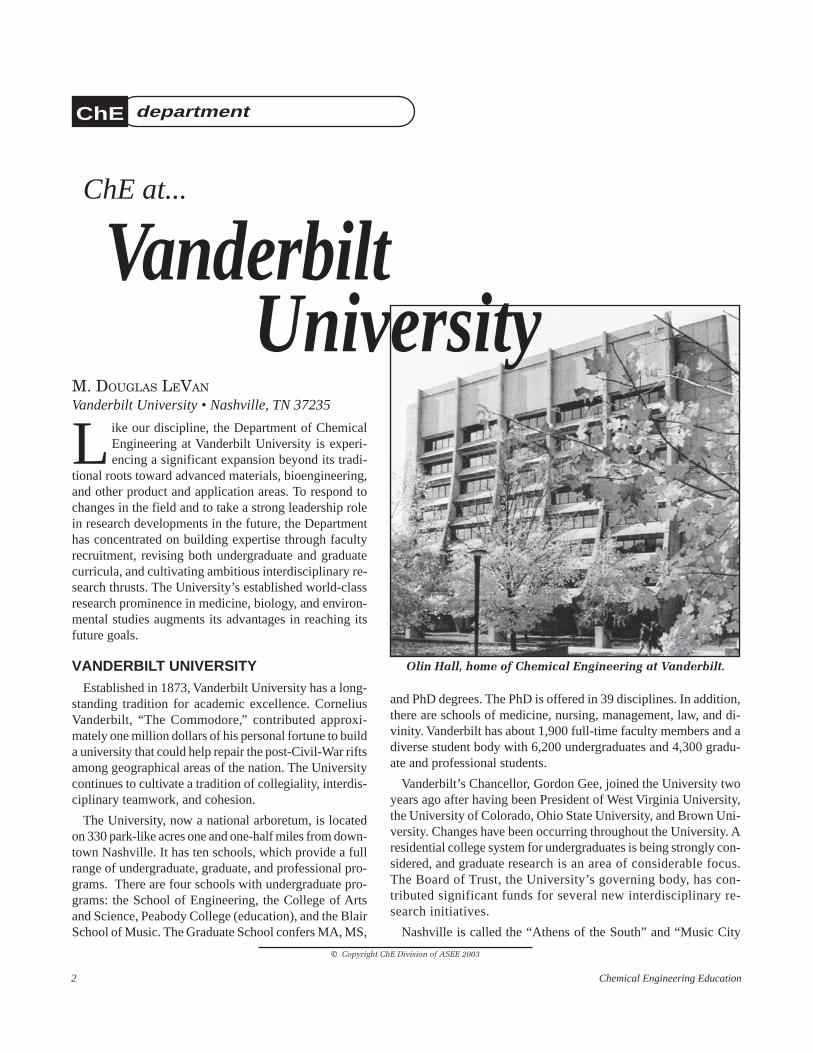
Olin Hall, home of Chemical Engineering at Vanderbilt.
Winter 2003 3
USA” and is the capital of Tennessee. The city and surroundingarea support a wide range of activities with performing arts andmuseums, professional sports teams, and many outdoor activi-ties. Nashville is one of the South’s major focal points for bank-ing, healthcare, insurance, publishing, and entertainment. TheNashville area is home to more than a dozen colleges and uni-versities. Vanderbilt is a major contributor to the intellectuallife of Nashville.
THE SCHOOL OF ENGINEERINGIn 1874, the year following the founding donation by Cornelius
Vanderbilt to the University, engineering was announced as one often schools within the Department of Philosophy, Science, and Lit-erature. Engineering classes began in 1879 in drafting, surveying,applied mechanics, structures, water supply, sanitary engineering,and mechanical power. The first Bachelor of Engineering degreewas awarded in 1880. Engineering was organized as a departmentin 1886 and became a school again in 1915, when departments wererenamed schools and schools were renamed departments.
Graduate work in the School of Engineering began with chemi-cal engineering. An MS program in chemical engineering was ap-proved in 1943, and the first two MS degrees were awarded in1946. The first PhD program in engineering to be approved bythe Graduate School was in chemical engineering in 1962. Thefirst PhD conferred in engineering went to a chemical engi-neering student in 1964.
Kenneth F. Galloway joined Vanderbilt in Fall 1996 as Dean ofthe School of Engineering and Professor of Electrical Engineering.Dean Galloway restructured the School by consolidating some de-partmental administrative structures. The School now has five De-partments: Biomedical Engineering, Chemical Engineering, Civil
and Environmental Engineering, Electrical Engineeringand Computer Science, and Mechanical Engineering. TheDepartment of Electrical Engineering and Computer Sci-ence also offers a degree in Computer Engineering. TheSchool also offers degrees through programs in Engineer-ing Science, Management of Technology, and an Interdis-ciplinary Program in Materials Science.
Dean Galloway encouraged growth of research pro-grams. Sponsored research activity within the School hasmore than doubled since 1996, and research expenditurescurrently average $300,000 per faculty member.
The Dean also began a vigorous program of fund rais-ing to improve facilities within the School. A new center-piece of the School, Featheringill Hall, was formally dedi-cated in September 2002. It has a large three-storyatrium and many areas for small-group interactions.Undergraduates throughout Vanderbilt have voted it thebest building on campus.
. . . theDepartment of
ChemicalEngineering
at VanderbiltUniversity
is experiencinga significant
expansionbeyond itstraditional
rootstoward
advancedmaterials,
bioengineering,and other
product andapplication
areas.
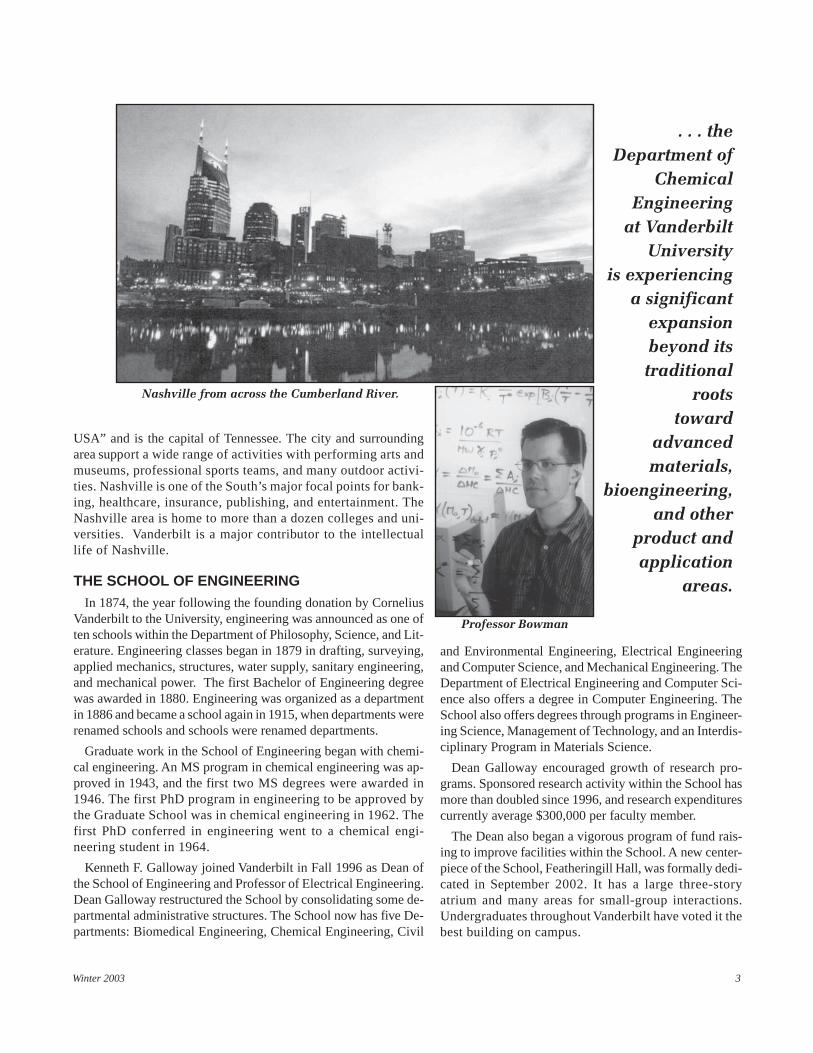
Professor Bowman
Nashville from across the Cumberland River.
4 Chemical Engineering Education
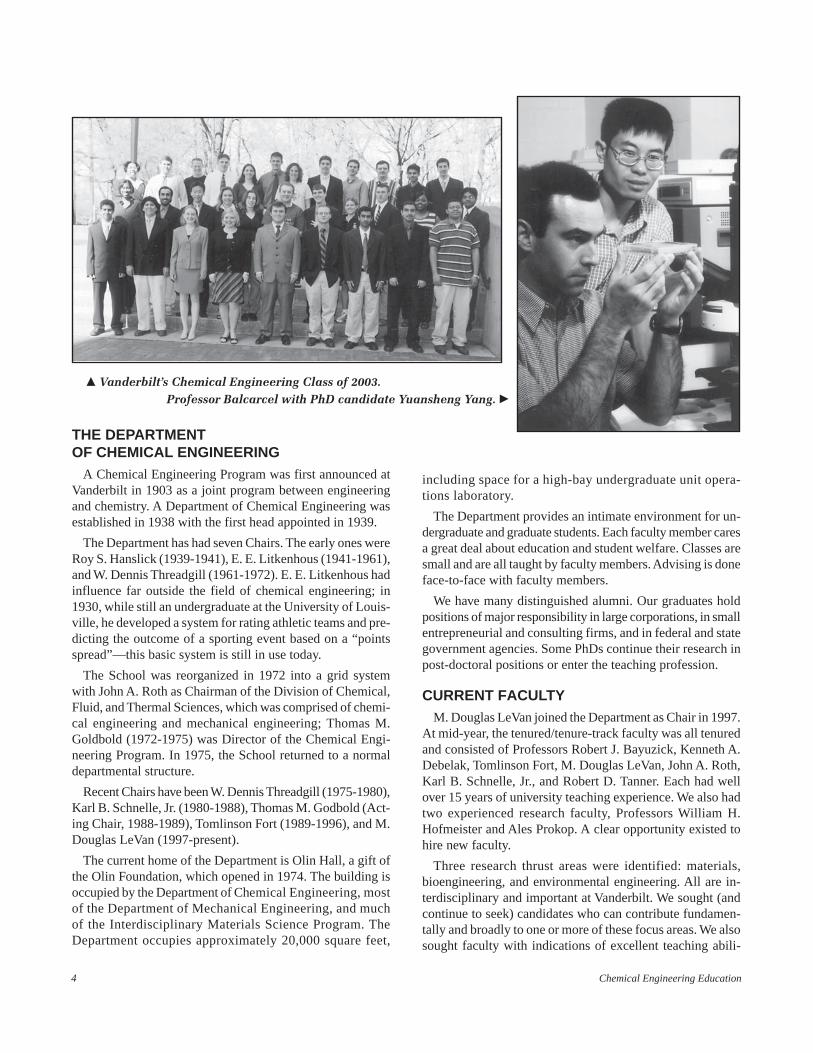
� Vanderbilt’s Chemical Engineering Class of 2003.Professor Balcarcel with PhD candidate Yuansheng Yang. �
THE DEPARTMENTOF CHEMICAL ENGINEERING
A Chemical Engineering Program was first announced atVanderbilt in 1903 as a joint program between engineeringand chemistry. A Department of Chemical Engineering wasestablished in 1938 with the first head appointed in 1939.
The Department has had seven Chairs. The early ones wereRoy S. Hanslick (1939-1941), E. E. Litkenhous (1941-1961),and W. Dennis Threadgill (1961-1972). E. E. Litkenhous hadinfluence far outside the field of chemical engineering; in1930, while still an undergraduate at the University of Louis-ville, he developed a system for rating athletic teams and pre-dicting the outcome of a sporting event based on a “pointsspread”—this basic system is still in use today.
The School was reorganized in 1972 into a grid systemwith John A. Roth as Chairman of the Division of Chemical,Fluid, and Thermal Sciences, which was comprised of chemi-cal engineering and mechanical engineering; Thomas M.Goldbold (1972-1975) was Director of the Chemical Engi-neering Program. In 1975, the School returned to a normaldepartmental structure.
Recent Chairs have been W. Dennis Threadgill (1975-1980),Karl B. Schnelle, Jr. (1980-1988), Thomas M. Godbold (Act-ing Chair, 1988-1989), Tomlinson Fort (1989-1996), and M.Douglas LeVan (1997-present).
The current home of the Department is Olin Hall, a gift ofthe Olin Foundation, which opened in 1974. The building isoccupied by the Department of Chemical Engineering, mostof the Department of Mechanical Engineering, and muchof the Interdisciplinary Materials Science Program. TheDepartment occupies approximately 20,000 square feet,
including space for a high-bay undergraduate unit opera-tions laboratory.
The Department provides an intimate environment for un-dergraduate and graduate students. Each faculty member caresa great deal about education and student welfare. Classes aresmall and are all taught by faculty members. Advising is doneface-to-face with faculty members.
We have many distinguished alumni. Our graduates holdpositions of major responsibility in large corporations, in smallentrepreneurial and consulting firms, and in federal and stategovernment agencies. Some PhDs continue their research inpost-doctoral positions or enter the teaching profession.
CURRENT FACULTYM. Douglas LeVan joined the Department as Chair in 1997.
At mid-year, the tenured/tenure-track faculty was all tenuredand consisted of Professors Robert J. Bayuzick, Kenneth A.Debelak, Tomlinson Fort, M. Douglas LeVan, John A. Roth,Karl B. Schnelle, Jr., and Robert D. Tanner. Each had wellover 15 years of university teaching experience. We also hadtwo experienced research faculty, Professors William H.Hofmeister and Ales Prokop. A clear opportunity existed tohire new faculty.
Three research thrust areas were identified: materials,bioengineering, and environmental engineering. All are in-terdisciplinary and important at Vanderbilt. We sought (andcontinue to seek) candidates who can contribute fundamen-tally and broadly to one or more of these focus areas. We alsosought faculty with indications of excellent teaching abili-
Winter 2003 5
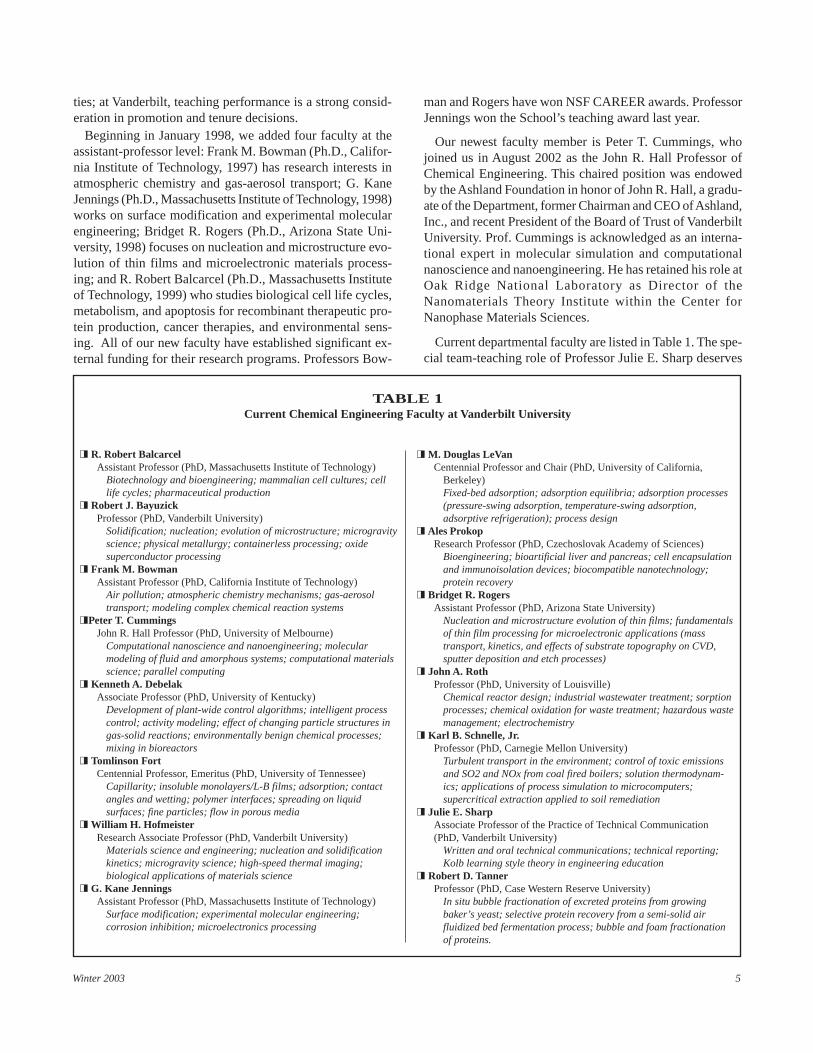
� R. Robert BalcarcelAssistant Professor (PhD, Massachusetts Institute of Technology)
Biotechnology and bioengineering; mammalian cell cultures; celllife cycles; pharmaceutical production
� Robert J. BayuzickProfessor (PhD, Vanderbilt University)
Solidification; nucleation; evolution of microstructure; microgravityscience; physical metallurgy; containerless processing; oxidesuperconductor processing
� Frank M. BowmanAssistant Professor (PhD, California Institute of Technology)
Air pollution; atmospheric chemistry mechanisms; gas-aerosoltransport; modeling complex chemical reaction systems
�Peter T. CummingsJohn R. Hall Professor (PhD, University of Melbourne)
Computational nanoscience and nanoengineering; molecularmodeling of fluid and amorphous systems; computational materialsscience; parallel computing
� Kenneth A. DebelakAssociate Professor (PhD, University of Kentucky)
Development of plant-wide control algorithms; intelligent processcontrol; activity modeling; effect of changing particle structures ingas-solid reactions; environmentally benign chemical processes;mixing in bioreactors
� Tomlinson FortCentennial Professor, Emeritus (PhD, University of Tennessee)
Capillarity; insoluble monolayers/L-B films; adsorption; contactangles and wetting; polymer interfaces; spreading on liquidsurfaces; fine particles; flow in porous media
� William H. HofmeisterResearch Associate Professor (PhD, Vanderbilt University)
Materials science and engineering; nucleation and solidificationkinetics; microgravity science; high-speed thermal imaging;biological applications of materials science
� G. Kane JenningsAssistant Professor (PhD, Massachusetts Institute of Technology)
Surface modification; experimental molecular engineering;corrosion inhibition; microelectronics processing
� M. Douglas LeVanCentennial Professor and Chair (PhD, University of California,
Berkeley)Fixed-bed adsorption; adsorption equilibria; adsorption processes(pressure-swing adsorption, temperature-swing adsorption,adsorptive refrigeration); process design
� Ales ProkopResearch Professor (PhD, Czechoslovak Academy of Sciences)
Bioengineering; bioartificial liver and pancreas; cell encapsulationand immunoisolation devices; biocompatible nanotechnology;protein recovery
� Bridget R. RogersAssistant Professor (PhD, Arizona State University)
Nucleation and microstructure evolution of thin films; fundamentalsof thin film processing for microelectronic applications (masstransport, kinetics, and effects of substrate topography on CVD,sputter deposition and etch processes)
� John A. RothProfessor (PhD, University of Louisville)
Chemical reactor design; industrial wastewater treatment; sorptionprocesses; chemical oxidation for waste treatment; hazardous wastemanagement; electrochemistry
� Karl B. Schnelle, Jr.Professor (PhD, Carnegie Mellon University)
Turbulent transport in the environment; control of toxic emissionsand SO2 and NOx from coal fired boilers; solution thermodynam-ics; applications of process simulation to microcomputers;supercritical extraction applied to soil remediation
� Julie E. SharpAssociate Professor of the Practice of Technical Communication(PhD, Vanderbilt University)
Written and oral technical communications; technical reporting;Kolb learning style theory in engineering education
� Robert D. TannerProfessor (PhD, Case Western Reserve University)
In situ bubble fractionation of excreted proteins from growingbaker’s yeast; selective protein recovery from a semi-solid airfluidized bed fermentation process; bubble and foam fractionationof proteins.
TABLE 1Current Chemical Engineering Faculty at Vanderbilt University
ties; at Vanderbilt, teaching performance is a strong consid-eration in promotion and tenure decisions.
Beginning in January 1998, we added four faculty at theassistant-professor level: Frank M. Bowman (Ph.D., Califor-nia Institute of Technology, 1997) has research interests inatmospheric chemistry and gas-aerosol transport; G. KaneJennings (Ph.D., Massachusetts Institute of Technology, 1998)works on surface modification and experimental molecularengineering; Bridget R. Rogers (Ph.D., Arizona State Uni-versity, 1998) focuses on nucleation and microstructure evo-lution of thin films and microelectronic materials process-ing; and R. Robert Balcarcel (Ph.D., Massachusetts Instituteof Technology, 1999) who studies biological cell life cycles,metabolism, and apoptosis for recombinant therapeutic pro-tein production, cancer therapies, and environmental sens-ing. All of our new faculty have established significant ex-ternal funding for their research programs. Professors Bow-
man and Rogers have won NSF CAREER awards. ProfessorJennings won the School’s teaching award last year.
Our newest faculty member is Peter T. Cummings, whojoined us in August 2002 as the John R. Hall Professor ofChemical Engineering. This chaired position was endowedby the Ashland Foundation in honor of John R. Hall, a gradu-ate of the Department, former Chairman and CEO of Ashland,Inc., and recent President of the Board of Trust of VanderbiltUniversity. Prof. Cummings is acknowledged as an interna-tional expert in molecular simulation and computationalnanoscience and nanoengineering. He has retained his role atOak Ridge National Laboratory as Director of theNanomaterials Theory Institute within the Center forNanophase Materials Sciences.
Current departmental faculty are listed in Table 1. The spe-cial team-teaching role of Professor Julie E. Sharp deserves
6 Chemical Engineering Education
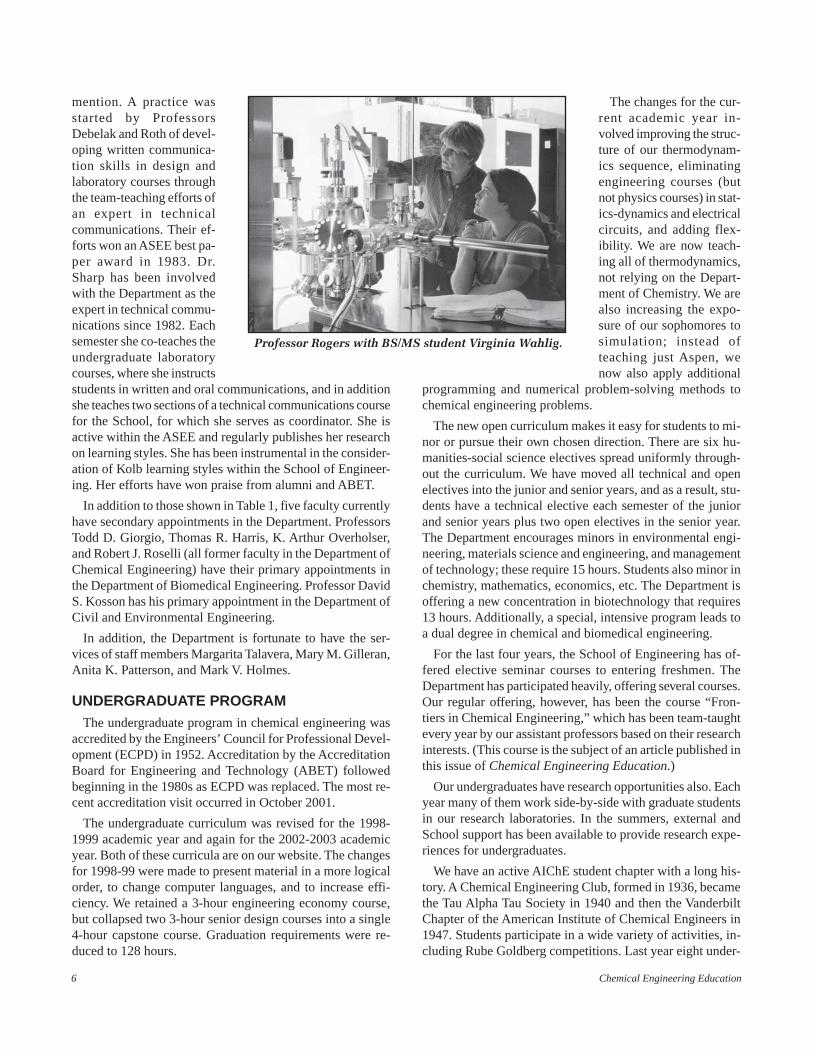
Professor Rogers with BS/MS student Virginia Wahlig.
mention. A practice wasstarted by ProfessorsDebelak and Roth of devel-oping written communica-tion skills in design andlaboratory courses throughthe team-teaching efforts ofan expert in technicalcommunications. Their ef-forts won an ASEE best pa-per award in 1983. Dr.Sharp has been involvedwith the Department as theexpert in technical commu-nications since 1982. Eachsemester she co-teaches theundergraduate laboratorycourses, where she instructsstudents in written and oral communications, and in additionshe teaches two sections of a technical communications coursefor the School, for which she serves as coordinator. She isactive within the ASEE and regularly publishes her researchon learning styles. She has been instrumental in the consider-ation of Kolb learning styles within the School of Engineer-ing. Her efforts have won praise from alumni and ABET.
In addition to those shown in Table 1, five faculty currentlyhave secondary appointments in the Department. ProfessorsTodd D. Giorgio, Thomas R. Harris, K. Arthur Overholser,and Robert J. Roselli (all former faculty in the Department ofChemical Engineering) have their primary appointments inthe Department of Biomedical Engineering. Professor DavidS. Kosson has his primary appointment in the Department ofCivil and Environmental Engineering.
In addition, the Department is fortunate to have the ser-vices of staff members Margarita Talavera, Mary M. Gilleran,Anita K. Patterson, and Mark V. Holmes.
UNDERGRADUATE PROGRAMThe undergraduate program in chemical engineering was
accredited by the Engineers’ Council for Professional Devel-opment (ECPD) in 1952. Accreditation by the AccreditationBoard for Engineering and Technology (ABET) followedbeginning in the 1980s as ECPD was replaced. The most re-cent accreditation visit occurred in October 2001.
The undergraduate curriculum was revised for the 1998-1999 academic year and again for the 2002-2003 academicyear. Both of these curricula are on our website. The changesfor 1998-99 were made to present material in a more logicalorder, to change computer languages, and to increase effi-ciency. We retained a 3-hour engineering economy course,but collapsed two 3-hour senior design courses into a single4-hour capstone course. Graduation requirements were re-duced to 128 hours.
The changes for the cur-rent academic year in-volved improving the struc-ture of our thermodynam-ics sequence, eliminatingengineering courses (butnot physics courses) in stat-ics-dynamics and electricalcircuits, and adding flex-ibility. We are now teach-ing all of thermodynamics,not relying on the Depart-ment of Chemistry. We arealso increasing the expo-sure of our sophomores tosimulation; instead ofteaching just Aspen, wenow also apply additional
programming and numerical problem-solving methods tochemical engineering problems.
The new open curriculum makes it easy for students to mi-nor or pursue their own chosen direction. There are six hu-manities-social science electives spread uniformly through-out the curriculum. We have moved all technical and openelectives into the junior and senior years, and as a result, stu-dents have a technical elective each semester of the juniorand senior years plus two open electives in the senior year.The Department encourages minors in environmental engi-neering, materials science and engineering, and managementof technology; these require 15 hours. Students also minor inchemistry, mathematics, economics, etc. The Department isoffering a new concentration in biotechnology that requires13 hours. Additionally, a special, intensive program leads toa dual degree in chemical and biomedical engineering.
For the last four years, the School of Engineering has of-fered elective seminar courses to entering freshmen. TheDepartment has participated heavily, offering several courses.Our regular offering, however, has been the course “Fron-tiers in Chemical Engineering,” which has been team-taughtevery year by our assistant professors based on their researchinterests. (This course is the subject of an article published inthis issue of Chemical Engineering Education.)
Our undergraduates have research opportunities also. Eachyear many of them work side-by-side with graduate studentsin our research laboratories. In the summers, external andSchool support has been available to provide research expe-riences for undergraduates.
We have an active AIChE student chapter with a long his-tory. A Chemical Engineering Club, formed in 1936, becamethe Tau Alpha Tau Society in 1940 and then the VanderbiltChapter of the American Institute of Chemical Engineers in1947. Students participate in a wide variety of activities, in-cluding Rube Goldberg competitions. Last year eight under-
Winter 2003 7
graduates attended the AIChE Student Conference in PuertoRico. For the 2002 Annual AIChE Meeting, the Departmentsupported a trip for 12 undergraduates to attend.
GRADUATE PROGRAM AND RESEARCH
A majority of our graduate students are PhD students. Mostare supported in their first year as teaching assistants, althoughsome support for new students as research assistants is usu-ally available. After the first academic year, almost all stu-dents are supported as research assistants from research grantsfor the duration of their studies. Some multi-year “topping”awards are also available.
Graduate course requirements were changed for the 1999-2000 academic year and again for the 2002-2003 academicyear. For 1999-2000, we revised our graduate core courserequirements, moving to a more research-oriented chemicalengineering science core. For 2002-2003, we reducedcoursework requirements for PhD students and made somemodifications to our core course structure. We now offer sixcore courses: applied mathematics for chemical engineers,thermodynamics, transport phenomena, chemical kinetics,simulation, and separation science and engineering.
An MS student must take 24 hours of coursework, a gradu-ate school requirement. This includes five core courses. Athesis is required. (The Master of Engineering, an ad-vanced professional degree, is offered by the School ofEngineering.)
We require a PhD student to take a minimum of 30 hoursof coursework beyond the bachelor’s degree. This includesthe six core courses. Many students take more than 30 hoursof coursework, but this load is designed to allow students tospend the majority of their studies on original research forthe dissertation. PhD students work with their research advi-sor under the guidance of a PhD committee towards fulfill-ing all requirements for the degree.
Research laboratories within the Department are equippedfor experimental and computational investigations of mate-rials, bioengineering, environmental engineering, adsorptionand surface chemistry, chemical reaction engineering, andprocess modeling and control. Interdisciplinary research op-portunities exist with researchers in other departments in theSchool of Engineering, the natural sciences, and medicine.Our faculty participate in the Interdisciplinary Program inMaterials Science and in an NSF-sponsored EngineeringResearch Center for Bioengineering Educational Technolo-gies. We also participate in two new University-supportedinterdisciplinary research initiatives—the Vanderbilt Institutefor Nanoscale Science and Engineering (VINSE) and theVanderbilt Institute for Integrative Bioengineering Researchand Education (VIIBRE). Activities are currently develop-ing within the Vanderbilt Institute for Environmental Riskand Resources Management (VIERRM).
We currently have an annual Tis Lahiri Memorial Seminar,named after a former graduate student and supported by anendowment. This seminar has an educational flavor. Recentspeakers include H. Scott Fogler, Richard M. Felder, PhillipC. Wankat, Ronald W. Rousseau, John M. Prausnitz, EdwardL. Cussler, and Arthur W. Westerberg.
We also have an active Chemical Engineering GraduateStudent Association (ChEGSA) that represents graduatestudent interests and sponsors a variety of social events.They have had great leadership and help the Departmentin many ways.
OUR FUTURE
The Chemical Engineering Department has changed con-siderably in the last six years. Nine of the fourteen full-timefaculty members listed in Table 1 were not in the Departmentin late 1996. We have been working toward improved under-graduate and graduate curricula and expanding our researchactivities. The changes will continue.
Our curricula and research programs reflect the broaden-ing of the chemical engineering profession from its chemicaland petrochemical heritage toward advanced materials,bioengineering, environmental concerns, and other applica-tion-based and product areas. Vanderbilt University as a wholeis strong in biological research, with a world-class researchhospital; this creates broad opportunities for collaborativeresearch on biologically related topics.
We seek advice on our programs in many ways. A princi-pal avenue is through our Departmental External AdvisoryCommittee. We also seek advice from alumni and corporatefriends through a newsletter, “The Catalyst,” edited by Pro-fessors Schnelle and Sharp. The Chair has formed an Under-graduate Student Council, which provides him with adviceon the undergraduate program, and he serves as advisor toChEGSA.
Essentially all Departments want to improve not only theirrankings but also their quality and visibility. We are certainlyno exception. We have been working on improvements fromall angles. We recognize the many opportunities that we haveat Vanderbilt.
Information: More information on the Department is avail-able at http://www/vuse.vanderbilt.edu/~cheinfo/che.htm.Questions should be directed to [email protected].
Acknowledgements: Photographs were taken by DavidCrenshaw and Darryl Nelson. Kenneth A. Debelak, Vivian F.Cooper-Capps, and Julie E. Sharp provided many helpfulcomments.
Reference: Jacobs, D., “102 Years: A Story of the First Cen-tury of Vanderbilt University School of Engineering,”Vanderbilt University Alumni Association, Nashville, 1975.❐
8 Chemical Engineering Education
Ifirst met Robert Hesketh at the 1992 Chemical Engineering Sum-mer School in Bozeman, Montana. Phil Wankat and I led a work-shop that he attended, and I immediately noticed his enthusiasm
for engineering education. As a result of that meeting, he and I later co-authored an article on separations for CEE.[1] Little did I know that Iwould eventually have the opportunity to hire him as one of the found-ing members of the Rowan Chemical Engineering Department!
During Robert’s faculty interview at Rowan we were impressed withhis enthusiasm and his ideas for the freshman engineering program.We knew that his ideas on the use of a coffee machine would work as abasis for our hands-on approach to engineering education at Rowan.We felt he was a perfect fit for the new engineering education programat Rowan, and his dedication to teaching has since been rewarded byseveral educational awards from ASEE, including the 2002 Robert G.Quinn Award, the 1999 Ray W. Fahien Award, the 1998 Dow Out-standing New Faculty Award, the 2001, 1999, and 1998 Joseph J.Martin Awards, and four other teaching awards. To date he hasobtained over $2 million in external funding from federal, stateand industrial sources.
As one of the founding faculty members of the College of Engineer-ing and Chemical Engineering Department at Rowan University, Rob-ert has spearheaded an effort to develop the industrial component ofthe four-year sequence of the multidisciplinary engineering clinic. Inaddition, he has created several courses that integrate experiments andlectures in an inductive framework within chemical engineering. Hehas made many major contributions in laboratory methods that dem-onstrate chemical engineering practice and principles, the most notableof which uses the coffee maker. He has helped advance the state-of-the-art in laboratory-based education nationally through his manypublications, presentations, and seminars at ASEE and workshopssupported by NSF.
ROBERT’S EARLY YEARSWhat were the major influences in Robert’s early years? His mother,
Joyce, claims it was the time she spent with him in his crucial develop-mental years. “He was always happy and singing,” she says. Robert
Robert Hesketh
© Copyright ChE Division of ASEE 2003
ChE educator
of Rowan University
C. STEWART SLATER
Rowan University • Glassboro, NJ 08028
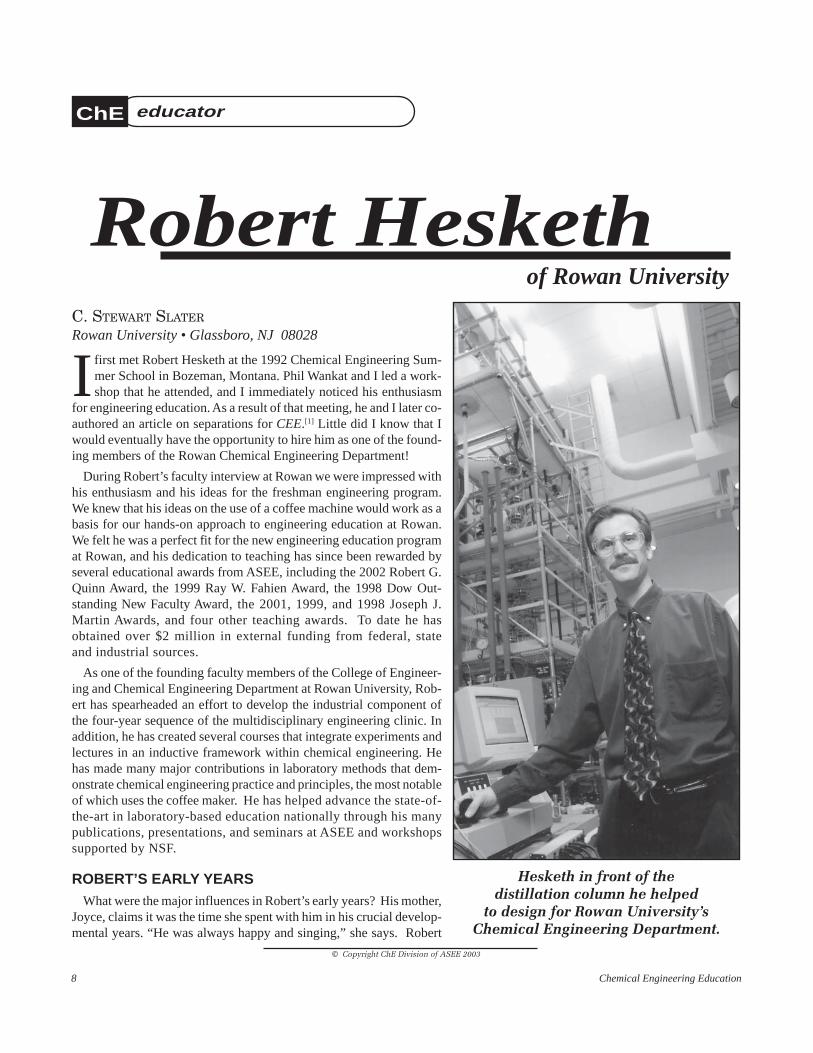
Hesketh in front of thedistillation column he helped
to design for Rowan University’sChemical Engineering Department.
Winter 2003 9
was born into a family with music and engineering skills onSeptember 28, 1960, near Philadelphia, Pennsylvania. Hismother is an accomplished musician with specialties in Frenchhorn, piano, organ and harp. His father, Howard, receivedthree degrees in chemical engineering from PennsylvaniaState University—State College and is also an accomplishedviolinist. After earning his Master’s degree, Howard servedin the army and later returned to DuPont, where he be-came a senior chemical engineer. He returned to col-lege for his PhD in chemical engineering after work-ing for Beryllium Corporation and Bell Laboratoriesof Western Electric. In 1970 he accepted a faculty po-sition at Southern Illinois University. During his yearsat SIU he wrote 18 books in the areas of air pollutionand hazardous waste management. Based on his indus-trial experience, Robert’s dad always had a special ap-preciation for the practical side of engineering.
Robert’s enthusiastic personality is reflected by the activi-ties of his early childhood: playing the cello, Boy Scouts,running, and academics. He started playing cello in fourthgrade and joined the family ensemble, together with brothersHoward and Ryan and sisters Joy and Melody. There are manytheories on the effect of classical music on improving mathskills[2] and it appears that Robert benefited, as evidenced byhis receiving the O. K. Bowen Award for Mathematics upongraduation from Carbondale Community High School. Hebelieves that playing a musical instrument also develops aphilosophy of practice-makes-perfect. He feels that while itis often impossible to solve a complex problem right at thebeginning, just as it is impossible to master a new orchestralpiece of music on first reading, through music he learned atan early age how to break the music or a problem intosmaller, more manageable, pieces to work on. Music wasone of the aspects of Robert’s life that gave him confi-dence in who he is today.
Robert was a nontraditional sports enthusiast. His dad be-lieved that physical activities are an essential part of life, sohe began running with his father at the SIU playing fieldsand eventually set his high school’s record in the mile with atime of 4:29 minutes. He also led his cross-country team forthe last two years in high school. Again, these early experi-ences helped Robert develop his work ethic. By practicing(in this case running) every day he was able to drop his half-mile, mile, and two-mile times a few seconds each race. Hisdad also had plenty of work around the house for Robert toattend to, including installing a swimming pool, building sev-eral new houses, mowing the multi-acre lawn, etc. Robertwas raised with the philosophy that one needs to work hardto become excellent.
Robert and his brothers developed a love for the outdoorsin Boy Scouts. His father was the Scout Master and led amonthly expedition into the forests of Southern Illinois. Manyadventures were had by Robert and his family such as 20-
mile hikes, camping in below freezing weather, and back-packing on extended weekends. Robert later became an EagleScout, the highest rank obtainable in Scouting. One of hismerit badges was in orienteering, where he was able to com-bine his passion for running through the woods with his prob-lem-solving abilities. He tells me that he still enjoys standingalone in the woods with a map and a compass asking him-
self, “Where am I now?”! Robert became very successful atorienteering and traveled around the country on weekends tocompete in national competitions. The highlight of hisorienteering was competing on the U.S. Team at the 1984University World Championships in Jönköping, Sweden.
Robert started working on environmental projects as a re-sult of his father’s work in air pollution control. In the 1970s,Robert’s dad started a pilot plant project at the SIU powerplant to show that sulfur dioxide emissions from coal couldbe controlled using venturi scrubbers. Robert and his broth-ers became a team and assisted their dad on stack tests. Inmany cases these tests were done either in freezing condi-tions on the top of a building or in the middle of summer atelevated rooftop temperatures.
UNIVERSITY LIFERobert had two requisites in selecting a college: running
and chemical engineering. He was good at math, chemistry,and physics and was a natural for chemical engineering.Robert’s dad said that he could go to any university in thecountry, but agreed only to pay an amount of tuition equal toSIU’s! The result was that Robert went to SIU for two yearsand then transferred to the University of Illinois at Champaign-Urbana. While at SIU, Robert continued working with hisfather by conducting developmental work to support a patenton the catenary grid scrubber. This work resulted in Robert’sfirst publication as an undergraduate and gave him practicalexperience in designing experiments—he learned that ducttape was excellent for temporary seals on large clear plasticsections of piping! In addition, Robert’s father wrote his firsttextbook in 1972 titled, Understanding & Controlling Air Pol-lution.[3] It would eventually be used in over fifty universi-ties as a text in air-pollution control and would be updatedseveral times.[4] Robert was extremely fortunate to watch howhis father produced a text, and he worked as an office assistant,typing portions of the copy that were sent to the publisher.
Robert has spearheaded an effort to develop theindustrial component of the four-year sequence
of the multidisciplinary engineering clinic[and]has created several courses that
integrate experiments and lecturesin an inductive framework. . .
10 Chemical Engineering Education
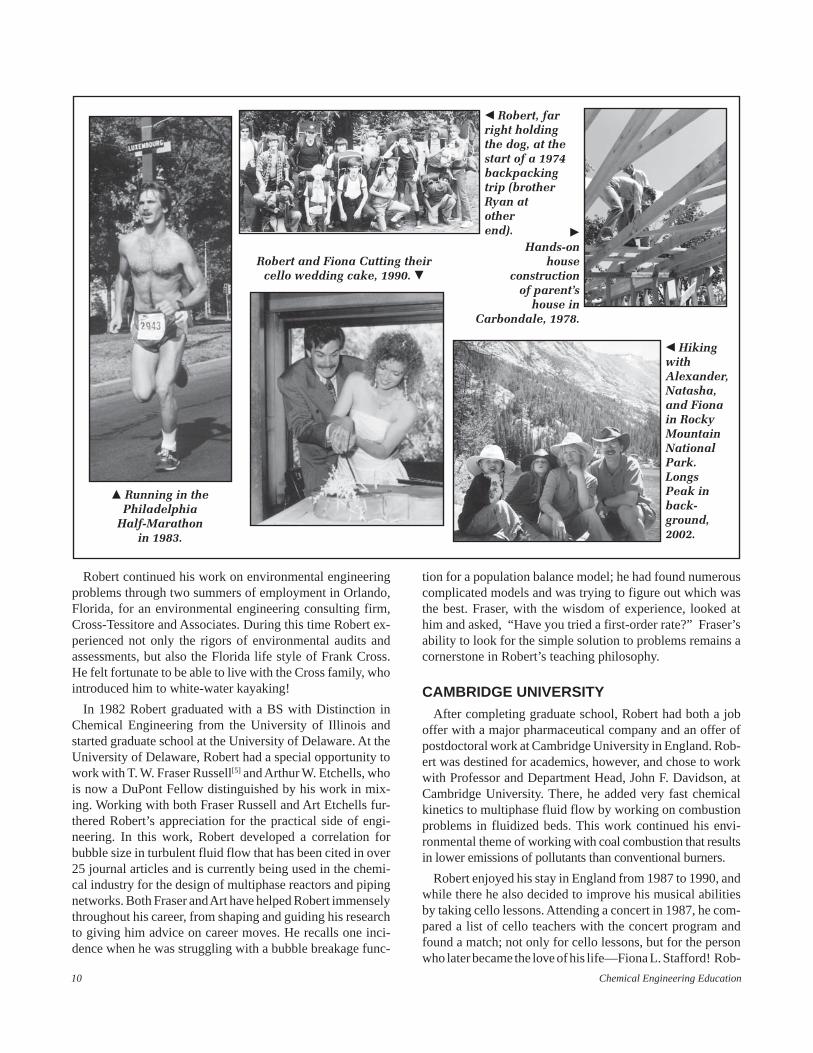
� Robert, farright holdingthe dog, at thestart of a 1974backpackingtrip (brotherRyan atotherend).
� HikingwithAlexander,Natasha,and Fionain RockyMountainNationalPark.LongsPeak inback-ground,2002.
� Running in thePhiladelphia
Half-Marathonin 1983.
Robert and Fiona Cutting theircello wedding cake, 1990. �
�
Hands-onhouse
constructionof parent’s
house inCarbondale, 1978.
Robert continued his work on environmental engineeringproblems through two summers of employment in Orlando,Florida, for an environmental engineering consulting firm,Cross-Tessitore and Associates. During this time Robert ex-perienced not only the rigors of environmental audits andassessments, but also the Florida life style of Frank Cross.He felt fortunate to be able to live with the Cross family, whointroduced him to white-water kayaking!
In 1982 Robert graduated with a BS with Distinction inChemical Engineering from the University of Illinois andstarted graduate school at the University of Delaware. At theUniversity of Delaware, Robert had a special opportunity towork with T. W. Fraser Russell[5] and Arthur W. Etchells, whois now a DuPont Fellow distinguished by his work in mix-ing. Working with both Fraser Russell and Art Etchells fur-thered Robert’s appreciation for the practical side of engi-neering. In this work, Robert developed a correlation forbubble size in turbulent fluid flow that has been cited in over25 journal articles and is currently being used in the chemi-cal industry for the design of multiphase reactors and pipingnetworks. Both Fraser and Art have helped Robert immenselythroughout his career, from shaping and guiding his researchto giving him advice on career moves. He recalls one inci-dence when he was struggling with a bubble breakage func-
tion for a population balance model; he had found numerouscomplicated models and was trying to figure out which wasthe best. Fraser, with the wisdom of experience, looked athim and asked, “Have you tried a first-order rate?” Fraser’sability to look for the simple solution to problems remains acornerstone in Robert’s teaching philosophy.
CAMBRIDGE UNIVERSITYAfter completing graduate school, Robert had both a job
offer with a major pharmaceutical company and an offer ofpostdoctoral work at Cambridge University in England. Rob-ert was destined for academics, however, and chose to workwith Professor and Department Head, John F. Davidson, atCambridge University. There, he added very fast chemicalkinetics to multiphase fluid flow by working on combustionproblems in fluidized beds. This work continued his envi-ronmental theme of working with coal combustion that resultsin lower emissions of pollutants than conventional burners.
Robert enjoyed his stay in England from 1987 to 1990, andwhile there he also decided to improve his musical abilitiesby taking cello lessons. Attending a concert in 1987, he com-pared a list of cello teachers with the concert program andfound a match; not only for cello lessons, but for the personwho later became the love of his life—Fiona L. Stafford! Rob-
Winter 2003 11
He is one ofthe foundingprofessors ofthe new andinnovative
engineeringclinic. His for-ward-lookingideas on mea-surement, de-
sign, and coursecontent were
incorporated intothe engineeringclinic starting
from the time ofhis first inter-
view at RowanUniversity.
ert became one of Fiona’s biggest fans. Their wedding in1990 was notable in that the cello section of the Cam-bridge Philharmonic Society played before the weddingand their cake was in the shape of a cello! As a specialtreat for Robert’s relatives, he held the wedding rehearsaldinner at Trinity College, where they got a real taste ofCambridge University life.
Robert’s passion for engineering educationhad its genesis at Cambridge. The English lovetea, which is served twice a day to all the fac-ulty, staff and students, but Robert wanted realcoffee (not the jars of instant had by all otherpostgrads) and formed a coffee club. It washighly successful until the coffee machineplugged up. So, Robert and his future best man,A. B. Pandit, took the coffee machine apartand cleaned out the tubular heat exchanger.He learned two things: that Cambridge hasvery hard water and that coffee machines arefascinating.
TULSA UNIVERSITYRobert’s next decision was whether to accept
a job offer from a British university or one fromTulsa University in Oklahoma. He had intro-duced Fiona to San Francisco at the 1989 AIChEannual meeting and apparently convinced herthat the rest of the United States was just likeSan Francisco, so Tulsa won out.
At Tulsa Robert was profoundly influencedin engineering education by his colleagues Ri-chard Thompson, Ramon Cerro, and Martin Abraham. AsDepartment Chair, Rich Thompson introduced Robert to theAmerican Society of Engineering Education by sending himto his first Chemical Engineering Summer School in Mon-tana. The friendships he formed at this first summer schoolhelped guide him as an engineering educator. Rich Felderand Rebecca Brent are still major influences on his teachingstyle. He has attended at least four effective-teaching work-shops and has avidly tried new teaching strategies from eachworkshop. Based on these workshops, he has employed co-operative learning and an inductive teaching style in hisclasses. He has also gained important aspects of teaching fromeducational leaders such as Jim Stice (instructional objec-tives) and Don Woods (problem-based learning).
Robert also developed a successful teaching and researchprogram at Tulsa and ultimately received three teachingawards, including Professor of the Year in the College of En-gineering and Applied Sciences. By the end of his tenure inTulsa, he had obtained $670,000 in external funding, includ-ing NSF Research Initiation and DuPont Young Professorawards. An outlet for Robert’s teaching enthusiasm was foundin a series of three NSF Young Scholars Programs at Tulsa,
where he worked with Martin Abraham, John Henshaw (ME),and Keith Wisecarver. In these programs Robert expandedhis coffee-machine experience into a series of young schol-ars experiments and as an outreach tool for student recruit-ment. At Tulsa Robert also was influenced by the work ofRamon Cerro in both his hands-on laboratory experiments aswell as his love of theory.
A NEW STYLE OFENGINEERING EDUCATION:ROWAN
Robert is a leader in teaching innovations atRowan. He is one of the founding professors ofthe new and innovative engineering clinic. Hisforward-looking ideas on measurement, design,and course content were incorporated into theengineering clinic starting from the time of hisfirst interview at Rowan University. After ob-serving Robert’s excellent leadership skills,Dean James Tracey chose him to be the Fresh-man Engineering Clinic Coordinator. The en-gineering clinic at Rowan is unique to engineer-ing education in that engineers are activelyengaged in hands-on engineering science andpractice through the interdisciplinary clinicfor eight semesters.
ENGINEERING CLINIC SEQUENCEAs a founding faculty member of the Col-
lege of Engineering, Robert has taken a lead-ing role in developing the engineering clinic
program—one of the most innovative vehicles for educatingengineers. Starting from the novel hands-on freshman semes-ters in measurement and reverse engineering, he has influ-enced each subsequent engineering clinic. In the sophomoreclinic, he started the detailed planning of the original linkagebetween the writing faculty and the engineering projects. Thisplanning was further developed by Drs. Anthony Marcheseand Jim Newell. The junior and senior clinics have been de-veloped into industrially related engineering projects. Rob-ert brought the first industrially funded project and helpedformulate the Clinic Affiliates program where industry isasked to sponsor engineering clinic projects for the juniorand senior years. The upper-level engineering clinic has beenvertically integrated by having juniors, seniors, and graduatestudents work on projects funded by industry and the gov-ernment. He has also worked on integrating the Rowan hall-marks into the syllabus of the clinic. None of these achieve-ments would have been possible without the energetic, inno-vative, idea-generating faculty of the engineering college.
Robert works with every member of the chemical engi-neering faculty on industrial and classroom projects. He servesas a mentor for faculty to bring in these projects and has
12 Chemical Engineering Education
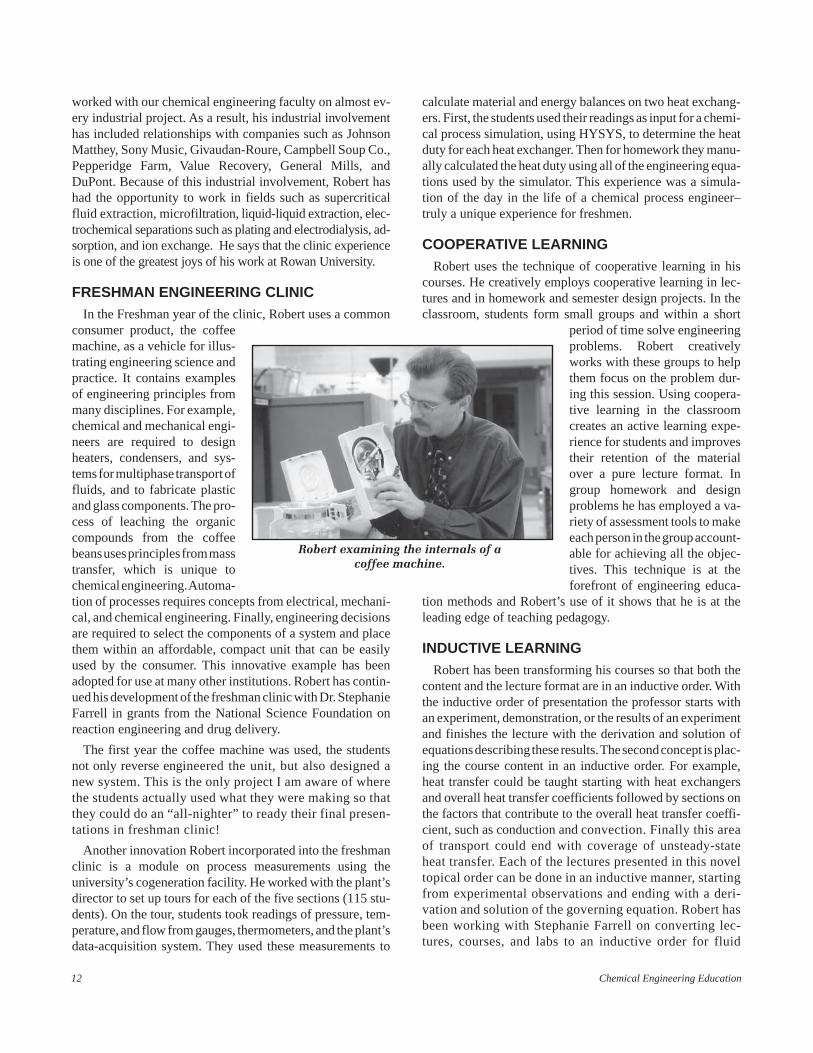
Robert examining the internals of acoffee machine.
worked with our chemical engineering faculty on almost ev-ery industrial project. As a result, his industrial involvementhas included relationships with companies such as JohnsonMatthey, Sony Music, Givaudan-Roure, Campbell Soup Co.,Pepperidge Farm, Value Recovery, General Mills, andDuPont. Because of this industrial involvement, Robert hashad the opportunity to work in fields such as supercriticalfluid extraction, microfiltration, liquid-liquid extraction, elec-trochemical separations such as plating and electrodialysis, ad-sorption, and ion exchange. He says that the clinic experienceis one of the greatest joys of his work at Rowan University.
FRESHMAN ENGINEERING CLINICIn the Freshman year of the clinic, Robert uses a common
consumer product, the coffeemachine, as a vehicle for illus-trating engineering science andpractice. It contains examplesof engineering principles frommany disciplines. For example,chemical and mechanical engi-neers are required to designheaters, condensers, and sys-tems for multiphase transport offluids, and to fabricate plasticand glass components. The pro-cess of leaching the organiccompounds from the coffeebeans uses principles from masstransfer, which is unique tochemical engineering. Automa-tion of processes requires concepts from electrical, mechani-cal, and chemical engineering. Finally, engineering decisionsare required to select the components of a system and placethem within an affordable, compact unit that can be easilyused by the consumer. This innovative example has beenadopted for use at many other institutions. Robert has contin-ued his development of the freshman clinic with Dr. StephanieFarrell in grants from the National Science Foundation onreaction engineering and drug delivery.
The first year the coffee machine was used, the studentsnot only reverse engineered the unit, but also designed anew system. This is the only project I am aware of wherethe students actually used what they were making so thatthey could do an “all-nighter” to ready their final presen-tations in freshman clinic!
Another innovation Robert incorporated into the freshmanclinic is a module on process measurements using theuniversity’s cogeneration facility. He worked with the plant’sdirector to set up tours for each of the five sections (115 stu-dents). On the tour, students took readings of pressure, tem-perature, and flow from gauges, thermometers, and the plant’sdata-acquisition system. They used these measurements to
calculate material and energy balances on two heat exchang-ers. First, the students used their readings as input for a chemi-cal process simulation, using HYSYS, to determine the heatduty for each heat exchanger. Then for homework they manu-ally calculated the heat duty using all of the engineering equa-tions used by the simulator. This experience was a simula-tion of the day in the life of a chemical process engineer–truly a unique experience for freshmen.
COOPERATIVE LEARNINGRobert uses the technique of cooperative learning in his
courses. He creatively employs cooperative learning in lec-tures and in homework and semester design projects. In theclassroom, students form small groups and within a short
period of time solve engineeringproblems. Robert creativelyworks with these groups to helpthem focus on the problem dur-ing this session. Using coopera-tive learning in the classroomcreates an active learning expe-rience for students and improvestheir retention of the materialover a pure lecture format. Ingroup homework and designproblems he has employed a va-riety of assessment tools to makeeach person in the group account-able for achieving all the objec-tives. This technique is at theforefront of engineering educa-
tion methods and Robert’s use of it shows that he is at theleading edge of teaching pedagogy.
INDUCTIVE LEARNINGRobert has been transforming his courses so that both the
content and the lecture format are in an inductive order. Withthe inductive order of presentation the professor starts withan experiment, demonstration, or the results of an experimentand finishes the lecture with the derivation and solution ofequations describing these results. The second concept is plac-ing the course content in an inductive order. For example,heat transfer could be taught starting with heat exchangersand overall heat transfer coefficients followed by sections onthe factors that contribute to the overall heat transfer coeffi-cient, such as conduction and convection. Finally this areaof transport could end with coverage of unsteady-stateheat transfer. Each of the lectures presented in this noveltopical order can be done in an inductive manner, startingfrom experimental observations and ending with a deri-vation and solution of the governing equation. Robert hasbeen working with Stephanie Farrell on converting lec-tures, courses, and labs to an inductive order for fluid
Winter 2003 13
mechanics, heat transfer, and transport.
GREEN ENGINEERINGRobert came full circle with respect to his dad’s textbooks.
After helping with the production of an earlier version, hefinally taught a course in air pollution control using his father’s1996 textbook.[6] In addition to this course, Robert is cur-rently conducting research on methods to reduce the emis-sions from diesel engines in school buses, with funding fromthe New Jersey Department of Transportation. The chief prob-lem in this area is particulate emissions, and his dad’s text,Fine Particulates in Gaseous Media,[7] has been very useful.
Robert is currently leading an effort to integrate green en-gineering into the undergraduate curriculum. Green engineer-ing is the design, commercialization, and use of processesand products that are feasible and economical, while mini-mizing generation of pollution at the source and risk to hu-man health and the environment. This way of thinking em-braces the concept that decisions to protect human health andthe environment can have the greatest impact and cost effec-tiveness when applied early to the design and developmentphase of a process or product. With the help of Kathryn Hollar,Robert just received a three-year grant from the EPA to over-see the development of course-specific modules in greenengineering and is looking for faculty who will help himwith this endeavor.
WORKSHOP LEADERUsing hands-on experiments, Robert has presented his ideas
on education at national meetings and workshops. At the 1997ASEE Chemical Engineering Summer School for universityfaculty, he co-led a one-day workshop on UndergraduateLaboratories. At this workshop he led participants throughheat transfer, pressure measurement, and coffee strength ex-periments. He also gave a presentation on innovative teach-ing techniques in the laboratory. In the summers of 1998 and1999, Robert and I led a series of workshops based on a grantwe wrote together titled, “A Multidisciplinary Workshop onNovel Process Science and Engineering Principles for Col-lege Faculty.” For this workshop Robert developed new ex-periments in batch processing (a breadmaker), reaction engi-neering (catalytic oxidation of VOCs), and polymers (fluid-ized bed coating), and continued to develop experiments us-ing the coffeemaker. These experiments were conducted byparticipating faculty from around the country through sup-port from the NSF Undergraduate Faculty Enhancement Pro-gram. At the 1998 AIChE annual meeting Robert helped PhilWankat and myself direct a workshop on teaching effective-ness where he presented a session on active learning tech-niques in lecture courses and had faculty perform an experi-ment with the instrumented coffee machine. Most recentlyRobert co-led a workshop on Innovative Laboratory Experi-ments with Stephanie Farrell and myself at the 2002 ASEE
Chemical Engineering Summer School in Boulder, Colorado.
PROFESSIONAL SOCIETY SERVICERobert is highly active in both ASEE and AIChE. He has
published and presented his work in ASEE’s Chemical Engi-neering Education, the proceedings of the Annual Confer-ence, and at ASEE zone and regional meetings. He has chairedsessions in education for both ASEE and AIChE. Most nota-bly, he organized the first ever Topical Conference on Edu-cation at an AIChE annual meeting titled, “Chemical Engi-neering Education in the New Millennium.” Currently he isthe chair of Group 4—Education in AIChE and was previ-ously Vice-Chair of 4 and Chair of 4a—Undergraduate Edu-cation. In addition to this service work, Robert has helpedformulate the Chem-E-Car competition and has served as thecompetition’s emcee since the races began.
THE MOUNTAINSRobert retains his passion for music and the outdoors. His
family has grown from two cellos to four with the addition ofAlexander (5 years old) and Natasha (9 years old). They alsolove to travel as a family to the Rocky Mountain NationalPark on hiking expeditions. They have gone to the moun-tains nearly every summer since getting the “mountain bug”in 1992 at the Bozeman Chemical Engineering SummerSchool. Robert enjoys hikes with his family, and last sum-mer their longest hike was by Odessa Lake (with an eleva-tion of 10,020 ft and total distance of 9.5 miles) and the mostthrilling was climbing up a waterfall to Sky Pond (for a totaldistance of 9.2 miles).
Robert is destined to climb higher mountains not only inColorado, but also in his professional life. Throughout hislife he has uniquely mixed chemical engineering with his loveof music and the outdoors. His educational innovations havetouched the lives of numerous students, not only at Rowanand Tulsa, but also at many schools throughout the countrythat have adopted these methods. He is a trusted friend and akey member of the Rowan chemical engineering team.
REFERENCES1. Wankat, P. C., R. P. Hesketh, K. H. Schulz, and C. S. Slater, “Separa-
tions - What to Teach Undergraduates.” Chem. Eng. Educ., 28 (1) 12(1994)
2. Shaw, G. L., Keeping Mozart in Mind, Academic Press, September(1999)
3. Hesketh, Howard E., Understanding & Controlling Air Pollution, AnnArbor Science Publishers, Inc. Ann Arbor MI, (1972 and 1974)
4. Hesketh, Howard E., Air Pollution Control, Ann Arbor Science Pub-lishers, Inc. Ann Arbor MI, (1979 and 1981)
5. “T. W. Fraser Russell—An Appreciation by his Colleagues,” Chem.Eng. Educ., 31(2) 74 (1997)
6. Hesketh, Howard E., Air Pollution Control: Traditional and Hazard-ous Pollutants, Technomic Publishing Co., Inc., Lancaster, PA (1991and 1996)
7. Hesketh, H. E., Fine Particles in Gaseous Media, 2nd Ed., Lewis Pub-lishers, Chelsea, Michigan (1986) ❐

14 Chemical Engineering Education
INTRODUCING THESTOCHASTIC SIMULATION OF
CHEMICAL REACTIONSUsing the Gillespie Algorithm and MATLAB
JOAQUÍN MARTÍNEZ-URREAGA, JOSÉ MIRA, CAMINO GONZÁLEZ-FERNÁNDEZ
Universidad Politécnica de Madrid • José Gutiérrez Abascal-2 • 28006 Madrid, Spain
There are two main approaches to numerically modeland simulate the time evolution of chemical reactingsystems. In the deterministic approach, the set of dif-
ferential equations describing the time evolution of the con-centrations is solved using either analytical or numerical meth-ods such as Euler or Runge-Kutta. It is assumed that the com-plete time evolution of the reacting system is contained inthe solution of the set of equations, i.e., given a set of initialconditions, only one trajectory is possible. In this paper, atrajectory is a concentration-time curve. It corresponds to areacting species in a given experiment and describes the timeevolution of the reacting system in such an experiment.
In the stochastic approach, each individual reaction is con-sidered a random event that can take place with a certain prob-ability. Thus the time evolution of the concentrations dependson a series of consecutive probabilistic events. Given a set ofinitial conditions, there are many possible trajectories, eachwith its own probability and with the sum of probabilitiesadding up to one. These trajectories may be drawn by usingthe probabilistic rate law.
The increasing interest of stochastic methods has beenpointed out by Schieber in this journal.[1] More recently,Scappin and Canu[2] have reviewed the use of stochastic mod-els for simulating the dynamics of complex chemical sys-tems and have shown that these models allow for easy iden-tification of the main reaction paths in reacting systems in-volving hundreds of elementary steps.
In addition, several other authors[3,4] have pointed out thatdeterministic models cannot accurately simulate the dynam-ics of systems in which the time evolution depends on thebehavior of a very small number of molecules. Interestingexamples of such systems are individual cells in living or-
ganisms. McAdams and Arkin[4] have pointed out that
. . . Even in clonal cell populations and under the most uniformexperimental conditions, considerable variation is observed in therates of development, morphology, and the concentration of eachmolecular species in each cell. These fluctuations . . . play afundamental role in the evolution of the living systems. . . .
These fluctuations may be predicted and explained by thestochastic models but not by the deterministic ones.
Traditionally, the deterministic methods are by far the mostcommonly used in modeling the time evolution of chemical
ChE classroom
© Copyright ChE Division of ASEE 2003
Joaquín Martinez Urreaga is Associate Pro-fessor in the Department of Industrial ChemicalEngineering at the Universidad Politécnica deMadrid, Spain. He received his MSc (1982) andPhD (1988) from the Universidad de Zaragoza(Spain). His current fields of interest includeteaching chemistry and research on interfacesand degradation in materials.
Camino González-Fernández obtained her de-gree in Nuclear Engineering in 1987 and herPhD in 1993, both from the UniversidadPolitécnica de Madrid. She is Associate Pro-fessor in the Department of Statistics at theUniversidad Politécnica de Madrid. Her currentfields of interest include teaching and researchon applied statistics.
José Mira obtained a Masters Degree in En-gineering in 1986 and in 1995 a PhD in Ap-plied Statistics, both from the UniversidadPolitécnica de Madrid. He is presently an As-sociate Professor at that University.

Winter 2003 15
reacting systems. The above remarks, however, may justifythe usefulness of introducing undergraduate students to theuse of stochastic methods to model chemical reactions.
In order to achieve better understanding of the fundamen-tals of the stochastic simulation of chemical reactions, it isinteresting that students develop their own software tools tocarry out the simulation. We present here the basics of thestochastic simulation of a well-known, simple process—theAB equilibrium process—compared to the deterministic simu-lation of the same process. In the stochastic simulation, wefollow the numerical method developed by Gillespie.[5]
Both simulations are carried out with MATLAB, a nu-merical computation package of increasing use in chemi-cal engineering education.
This example may prove useful for studying how the pre-dictions of the stochastic model relate to the deterministicpredictions (and to real-life experiences). To extend the sto-chastic simulation to other chemical processes, the studentscan either develop the corresponding MATLAB software,taking as a starting point the MATLAB software supplied inthis paper, or they can use commercial simulation software.Two of these commercial programs (freely downloadablefrom the Internet) are noted in this paper.
SIMULATION OFTHE AB EQUILIBRIUM PROCESS
We have chosen as our example the process
A Bk
k
1
2
← →
because
Figure 1. Deterministic (solid) and stochastic (dash, dot)trajectories for the AB equilibrium process. The stochastictrajectories were obtained in two consecutive runs. Initialconditions were
NA(0) = 175; NB(0) = 25; k1 = 4 e-3 s-1; k2 = 1 e-3 s-1.
• It describes various real processes, such as the hy-drolysis of lactone to γ -hydroxybutyric acid in stronghydrochloric acid.[6]
• It has been previously treated by different authors.[6,7]
• It is simple enough to be modeled by the undergradu-ate students. In order to make the modeling easier, wewill assume an isothermal process at constant volume.
Deterministic Simulation
The differential rate laws can be written as
dN t
dtk N t k N t
dN t
dtk N t k N t
AB A
BA B
( ) = ( ) − ( ) ( )
( ) = ( ) − ( ) ( )
2 1
1 2
1
2
where NA(t) and N
B(t) are the numbers of molecules after a
given reaction time t, and k1 and k
2 are the direct and reverse
reaction rate constants.
Once the initial values of NA(t) and N
B(t), (N
A(0) and N
B(0))
are specified, it is assumed that the solution of these differen-tial equations describes the complete time evolution of thereacting system. Figure 1 shows an example of the time evo-lution of N
A(t) and N
B(t) predicted by this approach for N
A(0)
= 175, NB(0) = 25, k
1 = 0.004 s-1 and k
2 = 0.001 s-1. These
trajectories were calculated using the MATLAB programslisted in Appendices 1 and 2. In the deterministic approach,given a set of initial conditions, all runs will give the sametrajectory.
The equilibrium values of NA and N
B (N
A,eq and N
B,eq) may
be easily calculated by the students. At equilibrium,
k N k NA eq B eq1 2 3, ,= ( )Using the mass balance, we obtain
NA eq A BN N k k, /= ( ) + ( )[ ] + ( )[ ] ( )0 0 1 41 2
In our case, NA,eq
= 200/5 = 40 and NB.eq
= 160.
Stochastic Simulation
As mentioned above, the stochastic simulation of a chemi-cal reacting system is rather different from the deterministicone. Each reaction is a random event that can take place witha given probability, which is a function of the reaction rateconstants and the number of molecules. There are many pos-sible trajectories, which we can draw by using the probabi-listic rate law. Thus the development of the stochastic simu-lation requires a deep foundation of the probability theory. Acomplete description of the stochastic treatment of the ABequilibrium process can be found in a text by Steinfeld, Fran-cisco, and Hase.[7]
In this paper we describe the development of a MATLABapplication for the generation of stochastic trajectories byusing the Gillespie algorithm.[5] Gillespie developed an el-
16 Chemical Engineering Education
egant and efficient algorithm that uses Monte Carlo techniquesto carry out the numerical stochastic simulation of any givenchemical reacting system and demonstrated that this simula-tion gives an accurate description of the time evolution of thesystem.
In the Gillespie algorithm, the probability of each reactionis obtained by multiplying the reaction rate constant by thenumber of combinations of molecules that can lead to thereaction. For the AB process, the numbers of combinationsare
N NAA
BBN and N
1 1
= =
respectively. In order to develop this algorithm, we first mustdefine
� dta time interval so small that either only one reaction orno reaction at all can occur in the interval (t, t+dt) (i.e.,dN
A(t) = N
A(t+dt) - N
A(t) can only take the values -1, 0,
and 1).
� k1, k
2
k1 is defined so that k
1dt is the probability that any A
molecule will react to give a B molecule in (t, t+dt) andsimilarly for k
2.
� W+[N
A(t)], W
-[N
A(t)]
two positive functions such that W+[N
A(t)]dt and W
-
[NA(t)]dt are the probabilities that, given that the num-
ber of molecules of A at time t is NA(t), at time t+dt the
number of molecules NA(t+dt) is equal to N
A(t)+1 and
NA(t)-1, respectively. W
+[N
A(t)]dt and W
-[N
A(t)]dt are
conditional probabilities (conditional on the value ofN
A(t)) and play an essential role in defining the sto-
chastic model. In our example, taking into account theabove definitions of k
1 and k
2, these functions are
W k N
W k N
N t t
N t t
A B
A A
+
−
( )[ ] ( ) ( )
( )[ ] ( ) ( )
=
=
2
1
5
6
After defining the initial conditions, Ni(0) and the constant
ki, the Gillespie algorithm generates time steps of variable
length, depending on the probabilities of the reactions and onthe random nature of the process (a random number is usedto generate the time steps). Subsequently, a second randomnumber is generated to determine which of the two possiblereactions occurs, taking into account the reaction probabili-ties. Next, the N
i(t) values are updated according to the sto-
ichiometry and the process is repeated.
In order to determine the above reaction probabilities andtime steps, we need to define
� a[NA(t)]
a non-negative function such that a[NA(t)]dt is the
probability that the number of molecules of A, which
takes the value NA(t) at time t, suffers a unitary in-
crement (positive or negative) in the differential in-terval (t, t
+dt). It verifies
a W WN t N t N tA A A( )[ ] ( )[ ] ( )[ ] ( )= ++ − 7
� w±[NX(t)]
probability that the process, which has suffered anincrement of one on either sense, does it positivelyor negatively (+1 for w
+ and -1 for w
-). These are
also conditional probabilities (conditional on the factthat a reaction has taken place). Evidently
w w
w
N t N t
N tW N t
a N t
X X
XX
X
+ −
±±
( )[ ] ( )[ ] ( )
( )[ ] ( )[ ]( )[ ] ( )
+ =
=
1 8
9
� urandom time step. It is the random variable “time tothe next reaction given that the number of moleculesof A at time t is N
A(t).”
� po[N
A(t), u]
complementary distribution function for u. Probabil-ity that the number of molecules of X, which takesthe value N
A(t) in time t, does not suffer any changes
in (t, t+u). It can be shown[5] that
po A AN t u a N t u( )[ ] − ( )[ ]{ } ( )=, exp 10
The distribution of u is an exponential with mean 1/a[NA(t)].
Using the Monte Carlo method, we can generate a suitablevalue of the random number u using[5,7]
u a N t rA= ( )[ ]{ } ( ) ( )1 1 11/ log /
where r is a random number of the uniform distribution be-tween 0 and 1. Note that the random time step decreases inaverage as the probability that any chemical change takesplace in the time interval increases.
Thus the algorithm of generation of stochastic trajectoriescan be written
1. Initialize t=0. Introduce the initial values NA(0) and
NB(0), k
1 and k
2. Define the total number of reactions
Z.
2. Generate a value of u: first a random number r isgenerated from the uniform distribution in (0,1) andthen u = {1/a[N
A(t)]} log(1/r).
3. Generate a second number r’ from the uniformdistribution in (0,1). This random number determineswhich reaction will occur, based on conditionalprobabilities. If w
-[N
A(t)] > r’, then take v = -1 and if
not, v = 1.
4. Update the process: t = t + u; NA(t+u) = N
A(t) + v
5. If the total number of reactions i < Z, go back to step
Winter 2003 17
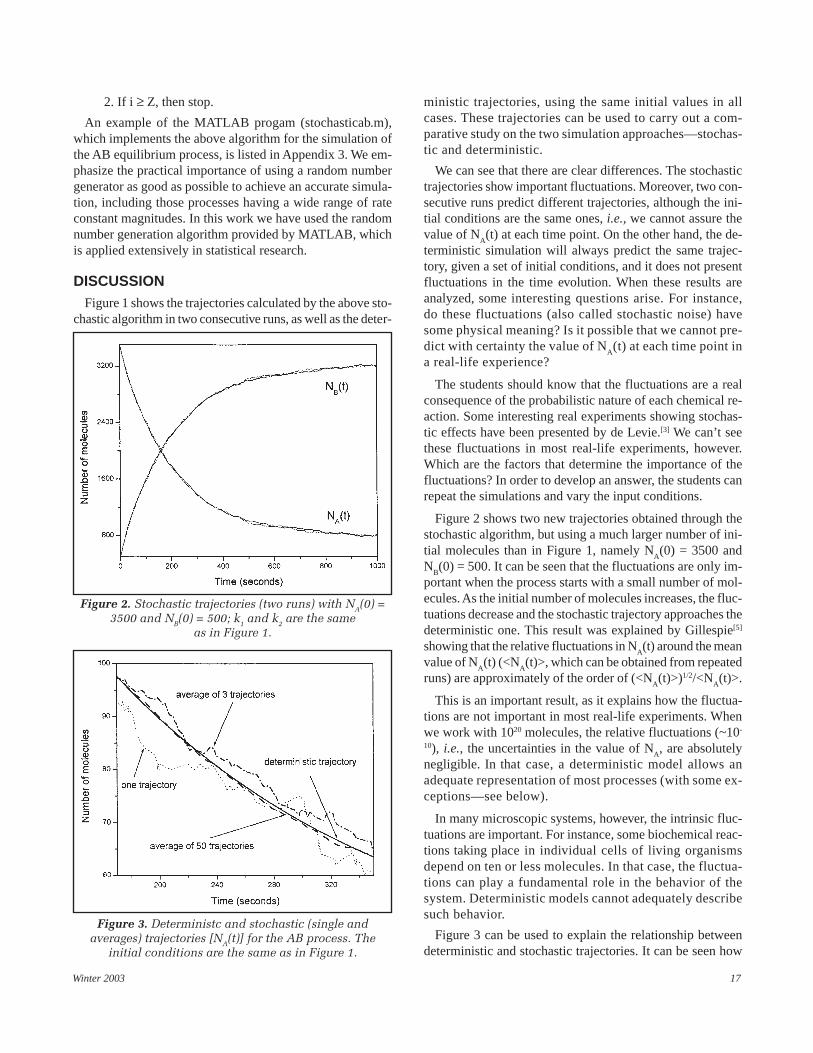
Figure 2. Stochastic trajectories (two runs) with NA(0) =3500 and NB(0) = 500; k1 and k2 are the same
as in Figure 1.
Figure 3. Deterministc and stochastic (single andaverages) trajectories [NA(t)] for the AB process. The
initial conditions are the same as in Figure 1.
2. If i ≥ Z, then stop.
An example of the MATLAB progam (stochasticab.m),which implements the above algorithm for the simulation ofthe AB equilibrium process, is listed in Appendix 3. We em-phasize the practical importance of using a random numbergenerator as good as possible to achieve an accurate simula-tion, including those processes having a wide range of rateconstant magnitudes. In this work we have used the randomnumber generation algorithm provided by MATLAB, whichis applied extensively in statistical research.
DISCUSSIONFigure 1 shows the trajectories calculated by the above sto-
chastic algorithm in two consecutive runs, as well as the deter-
ministic trajectories, using the same initial values in allcases. These trajectories can be used to carry out a com-parative study on the two simulation approaches—stochas-tic and deterministic.
We can see that there are clear differences. The stochastictrajectories show important fluctuations. Moreover, two con-secutive runs predict different trajectories, although the ini-tial conditions are the same ones, i.e., we cannot assure thevalue of N
A(t) at each time point. On the other hand, the de-
terministic simulation will always predict the same trajec-tory, given a set of initial conditions, and it does not presentfluctuations in the time evolution. When these results areanalyzed, some interesting questions arise. For instance,do these fluctuations (also called stochastic noise) havesome physical meaning? Is it possible that we cannot pre-dict with certainty the value of N
A(t) at each time point in
a real-life experience?
The students should know that the fluctuations are a realconsequence of the probabilistic nature of each chemical re-action. Some interesting real experiments showing stochas-tic effects have been presented by de Levie.[3] We can’t seethese fluctuations in most real-life experiments, however.Which are the factors that determine the importance of thefluctuations? In order to develop an answer, the students canrepeat the simulations and vary the input conditions.
Figure 2 shows two new trajectories obtained through thestochastic algorithm, but using a much larger number of ini-tial molecules than in Figure 1, namely N
A(0) = 3500 and
NB(0) = 500. It can be seen that the fluctuations are only im-
portant when the process starts with a small number of mol-ecules. As the initial number of molecules increases, the fluc-tuations decrease and the stochastic trajectory approaches thedeterministic one. This result was explained by Gillespie[5]
showing that the relative fluctuations in NA(t) around the mean
value of NA(t) (<N
A(t)>, which can be obtained from repeated
runs) are approximately of the order of (<NA(t)>)1/2/<N
A(t)>.
This is an important result, as it explains how the fluctua-tions are not important in most real-life experiments. Whenwe work with 1020 molecules, the relative fluctuations (~10-
10), i.e., the uncertainties in the value of NA, are absolutely
negligible. In that case, a deterministic model allows anadequate representation of most processes (with some ex-ceptions—see below).
In many microscopic systems, however, the intrinsic fluc-tuations are important. For instance, some biochemical reac-tions taking place in individual cells of living organismsdepend on ten or less molecules. In that case, the fluctua-tions can play a fundamental role in the behavior of thesystem. Deterministic models cannot adequately describesuch behavior.
Figure 3 can be used to explain the relationship betweendeterministic and stochastic trajectories. It can be seen how

18 Chemical Engineering Education
the average of stochastic trajectories approaches the deter-ministic trajectory as the number of averaged trajectoriesincreases (i.e., the deterministic trajectories can be ex-plained as the average behavior of the whole set of pos-sible stochastic trajectories).
Finally, students can see that both the stochastic and deter-ministic approaches predict the same final state for the ABequilibrium process, but this is not evident in all cases, evenat a macroscopic scale. There are processes with more thanone possible stable final state. These processes will evolvetoward one of the possible final states, each evolution havinga probability that depends on the initial conditions. This is aninfrequent behavior in nature, which can be explained andpredicted using a stochastic approach.[5]
EXTENDING THE SIMULATION TO OTHERREACTIONS: COMMERCIAL PROGRAMS
Once the students understand the fundamentals of the sto-chastic simulation of chemical reactions, the application tothe simulation of other chemical processes can be carried outusing commercial simulation programs or even by develop-ing new MATLAB software similar to the programs presentedhere. The key point of this development is obtaining the func-tions W
+[N
A(t)] and W
-[N
A(t)], which represent the sources
and wells of A molecules in each chemical process.
The commercial programs save user time since he/she onlyhas to provide a suitable mechanism and the set of initialdata. Moreover, most of these programs include a built-incollection of developed (and interesting) examples. Of theseveral commercial packages available, we will focus ontwo high-quality programs that can be freely downloadedfrom the Internet.
Chemical Kinetics Simulator (CKS 1.01 currently avail-able in versions for OS 2 2.x and higher, Apple Macintoshand Power Macintosh, and Microsoft Windows, 3.1/Windows,95/Windows NT) was developed at IBM’s Almaden ResearchCenter in San Jose, California, and can be downloaded fromits homepage.[8] It is an easy-to-use program (with an excel-lent tutorial) that allows the accurate stochastic simulation ofchemical reactions, including those in which changes in vol-ume, pressure, or temperature are expected. For instance, itmay work with explosions. The simulations included in thepackage may also be useful as learning tools. Some examplesof these simulations are the copolymerization of two mono-mers, a catalytic process in a batch reactor, and the simula-tion of gas phase reactions in a CVD reactor.
StochSim is a stochastic simulator with a marked focus onbiochemical processes. In this case the examples includedsimulate, for instance the Michaelis-Menten enzyme kinet-ics and the Lotka Volterra process. It was written by CarlFirth at the University of Cambridge. The currently availableversion 1.4[9] consists of a platform-independent core simula-
tion engine encapsulating the stochastic algorithm and a sepa-rate graphical user interface. The stochastic algorithm usedin this program is rather different from the Gillespie algo-rithm; here each molecule is represented as a separate soft-ware object. This is advantageous for simulating processesin which the physical and chemical properties of the reactingmolecules change in the course of the reaction.[10]
CONCLUSIONSStochastic models are playing an increasing role in the simu-
lation of chemical and biochemical processes, as they allowadequate prediction of the so-called stochastic effects, includ-ing the intrinsic fluctuations of the system. These fluctua-tions can play a fundamental role in the evolution of theliving systems and, in general, in the behavior of manymicroscopic systems.
In this paper the Gillespie algorithm is proposed as a suit-able tool for introducing undergraduate students to the basicsof the stochastic simulation of chemical reactions. Applica-tion of the Gillespie algorithm to a simple and well-knownreaction, the AB equilibrium process, is presented. Using thisalgorithm, the students can develop their own MATLAB pro-grams to carry out the stochastic simulations of the ABprocess and then use the results to analyze the main dif-ferences between the stochastic and the deterministic mod-eling of a chemical reaction.
Two examples of MATLAB programs are presented. Stu-dents can also easily adapt these two programs to other reac-tion schemes. Finally, two commercial simulation programs(freely downloadable from the Internet) are proposed as ad-ditional tools for extending the stochastic simulation to otherchemical processes.
ACKNOWLEDGMENTS
The authors are grateful to the referees for their helpfulcomments and suggestions.
REFERENCES
1. Schieber, J.D., “Applied Stochastic for Engineering,” Chem. Eng. Ed.,27(4), 170 (1993)
2. Scappin, M., and P. Canu, “Analysis of Reaction Mechanisms throughStochastic Simulation,” Chem. Eng. Sci., 56, 5157 (2001)
3. De Levie, R., “Stochastics: The Basis of Chemical Dynamics,” J. Chem.Ed., 77(6), 771 (2000)
4. McAdams, H.H., and A. Arkin, “It’s a Noisy Business! Genetic Regu-lation at the Nanomolar Scale,” Trends in Genetics, 15(2), 65 (1999)
5. Gillespie. D., Markov Processes: An Introduction for Physical Scien-tists, Academic Press, Inc., New York, NY (1984)
6. Fahidy, T.Z., “Solving Chemical Kinetics Problems by the MarkovChain Approach,” Chem. Eng. Ed., 27(1), 42 (1993)
7. Steinfeld, J.I., J.S. Francisco, and W.L. Hase, Chemical Kinetics andDynamics, Prentice Hall, Englewood Cliffs, NJ (1989)
8. CKS home page: <http://www.almaden.ibm.com/st/msim/> (AvailableSept. 2002)
9. Download StochSim: <ftp://ftp.cds.caltech.edu/pub/dbray> (AvailableSept. 2002)
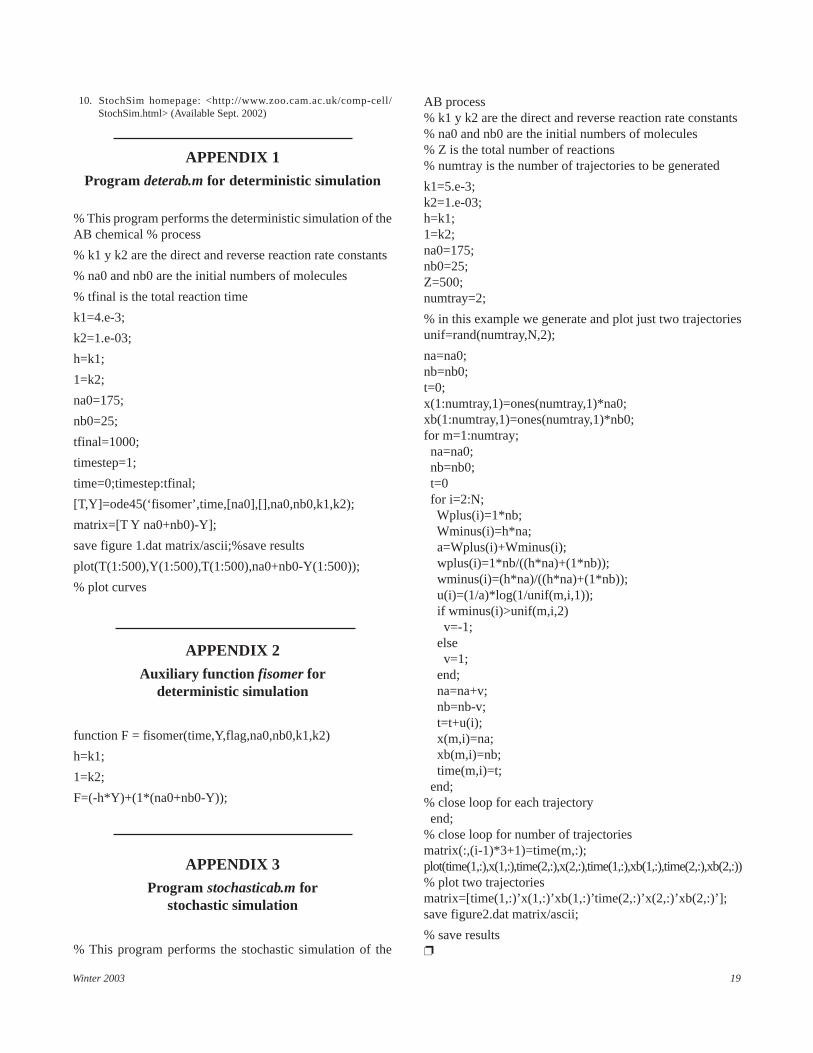
Winter 2003 19
10. StochSim homepage: <http://www.zoo.cam.ac.uk/comp-cell/StochSim.html> (Available Sept. 2002)
APPENDIX 1Program deterab.m for deterministic simulation
% This program performs the deterministic simulation of theAB chemical % process
% k1 y k2 are the direct and reverse reaction rate constants
% na0 and nb0 are the initial numbers of molecules
% tfinal is the total reaction time
k1=4.e-3;
k2=1.e-03;
h=k1;
1=k2;
na0=175;
nb0=25;
tfinal=1000;
timestep=1;
time=0;timestep:tfinal;
[T,Y]=ode45(‘fisomer’,time,[na0],[],na0,nb0,k1,k2);
matrix=[T Y na0+nb0)-Y];
save figure 1.dat matrix/ascii;%save results
plot(T(1:500),Y(1:500),T(1:500),na0+nb0-Y(1:500));
% plot curves
APPENDIX 2Auxiliary function fisomer for
deterministic simulation
function F = fisomer(time,Y,flag,na0,nb0,k1,k2)
h=k1;
1=k2;
F=(-h*Y)+(1*(na0+nb0-Y));
APPENDIX 3Program stochasticab.m for
stochastic simulation
% This program performs the stochastic simulation of the
AB process% k1 y k2 are the direct and reverse reaction rate constants% na0 and nb0 are the initial numbers of molecules% Z is the total number of reactions% numtray is the number of trajectories to be generated
k1=5.e-3;k2=1.e-03;h=k1;1=k2;na0=175;nb0=25;Z=500;numtray=2;
% in this example we generate and plot just two trajectoriesunif=rand(numtray,N,2);
na=na0;nb=nb0;t=0;x(1:numtray,1)=ones(numtray,1)*na0;xb(1:numtray,1)=ones(numtray,1)*nb0;for m=1:numtray; na=na0; nb=nb0; t=0 for i=2:N; Wplus(i)=1*nb; Wminus(i)=h*na; a=Wplus(i)+Wminus(i); wplus(i)=1*nb/((h*na)+(1*nb)); wminus(i)=(h*na)/((h*na)+(1*nb)); u(i)=(1/a)*log(1/unif(m,i,1)); if wminus(i)>unif(m,i,2) v=-1; else v=1; end; na=na+v; nb=nb-v; t=t+u(i); x(m,i)=na; xb(m,i)=nb; time(m,i)=t; end;% close loop for each trajectory end;% close loop for number of trajectoriesmatrix(:,(i-1)*3+1)=time(m,:);plot(time(1,:),x(1,:),time(2,:),x(2,:),time(1,:),xb(1,:),time(2,:),xb(2,:))% plot two trajectoriesmatrix=[time(1,:)’x(1,:)’xb(1,:)’time(2,:)’x(2,:)’xb(2,:)’];save figure2.dat matrix/ascii;
% save results❐

20 Chemical Engineering Education
CONSTRUCTION AND VISUALIZATION OFVLE ENVELOPES IN MATHCAD
JASPER L. DICKSON, JOHN A. HART, IV, WEI-YIN CHEN
University of Mississippi • University, MS 38677-1848
One of the major objectives of a thermodynamicscourse is to introduce the modeling of vapor-liquidequilibrium (VLE). Over the past 25 years, Profes-
sor Kenneth Jolls has developed visual aides to graphicallydemonstrate various thermodynamic functions and phase dia-grams. According to Dr. Jolls, “One of the problems withthermodynamics is that, to many students, it has no solid be-ginning. It doesn’t start with concrete notions.”[1] The devel-opment and implementation of three-dimensional graphicsfacilitate the cognition of important building blocks of chemi-cal engineering thermodynamics. Its significance is also re-flected by the fact that P-xy-T phase diagrams are shown onthe covers of the newest editions of the two popular text-books on chemical engineering thermodynamics.[2,3]
There have been various engines used to generate three-dimensional graphs. In Dr. Jolls’s earliest attempts to displaythe steam tables graphically, a simple, locally developed 3-Dgraphing program was used to generate the plots.[1,4,5] Sincethat time, he has used more sophisticated software to pro-duce more complicated plots. For example, he used the graph-ing package MOVIE.BYU[1] to produce the three-dimensionalsurfaces of the Peng-Robinson equation of state (PR EOS).Using these drawings, the unstable, metastable, and stable zonescan easily be illustrated. He has also developed three-dimen-sional graphs for the ideal and the van der Waals gases as wellas the Joule-Thomson expansion coefficient.[1]
Several commercial software packages have been devel-oped over the years for various computational applicationsin teaching, including the construction of three-dimensionaldiagrams. At the University of Mississippi, Mathcad is intro-duced early in the chemical engineering curriculum and isused as one of the computational tools for courses at differ-ent levels; it is also selected as the principal computationalworkhorse for courses on thermodynamics.
Using limited P-x and P-xy data of a benzene/cyclopentane
system, this paper demonstrates the construction of three-di-mensional, P-xy-T, phase envelopes based on two indepen-dent procedures in Mathcad; both examples have served asthe templates in our pedagogical process. In the first approach,the phase envelope is constructed based on Barker’s algo-rithm along with the Wilson equations and virial EOS for theestimations of the activity coefficients and fugacity coeffi-cients, respectively. In the second approach, the phase dia-gram is constructed based on the Peng-Robinson equation ofstate along with the one- and two-parameter models of thevan der Waals mixing rule. Regression of three sets of P-xydata at three different temperatures yields the parametersin these governing equations. Using these parameters, theP-xy-T envelopes were generated and extended to themixture’s critical region.
MODEL DEVELOPMENT AND DISCUSSIONThe experimental data used for the VLE modeling was
obtained from Hermsen and Prausnitz.[6] The data includedtotal pressures and liquid-phase compositions for the ben-zene/cyclopentane system at three temperatures: 25°C,35°C, and 45°C. The component properties were obtainedfrom Reid, et al.[7]
Jasper L. Dickson received his MS and BS in Chemical Engineering fromthe University of Mississippi. He is currently pursuing a PhD in ChemicalEngineering at the University of Texas at Austin. His research interestshave been in the area of colloid science.John A. Hart, IV is a graduate student at the Department of ChemicalEngineering of the University of Mississippi. He has received his BS inForensic Chemistry and his BS in Chemical Engineering from the Univer-sity of Mississippi also. His research interest is environmental remediation.Wei-Yin Chen is Professor of Chemical Engineering at the University ofMississippi. His teaching and research interests have been in reactionengineering, thermodynamics, and mathematical modeling. He received aPhD in Chemical Engineering from the City University of New York, an MSin Chemical Engineering from the Polytechnic Institute of New York, anMS in Applied Mathematics and Statistics from the State University of NewYork at Stony Brook, and a BS in Chemical Engineering from TunghaiUniversity.
© Copyright ChE Division of ASEE 2003
ChE classroom
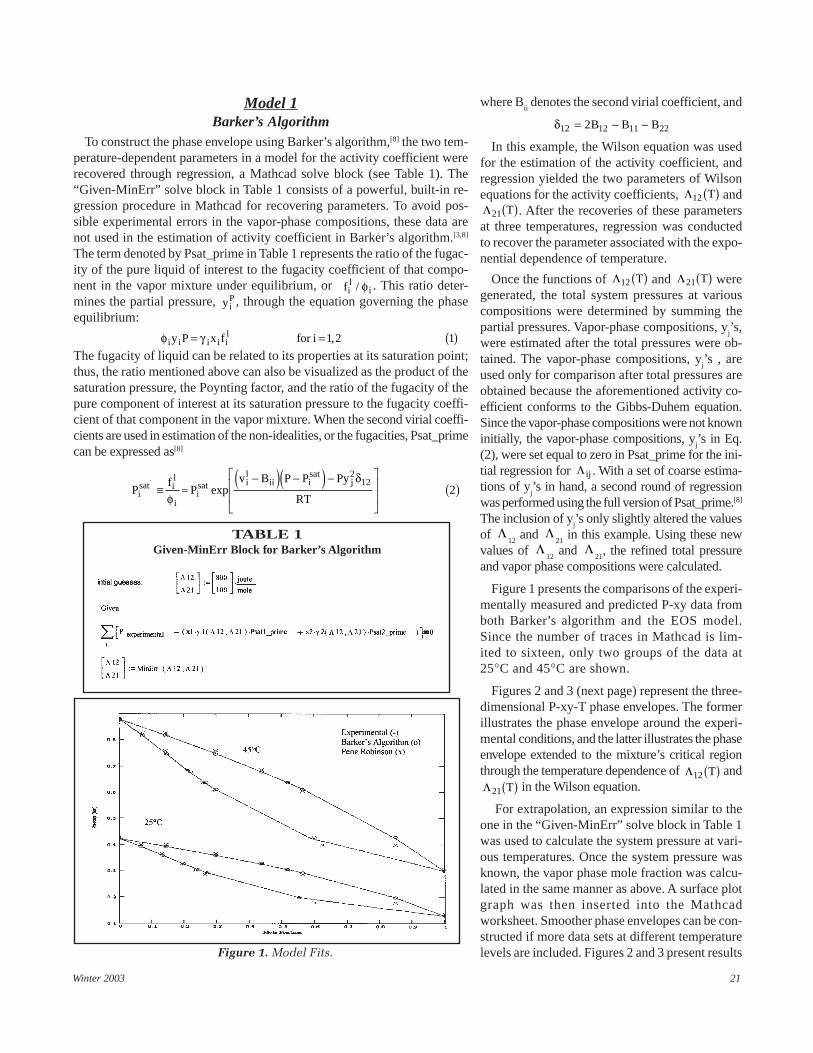
Winter 2003 21
Model 1Barker’s Algorithm
To construct the phase envelope using Barker’s algorithm,[8] the two tem-perature-dependent parameters in a model for the activity coefficient wererecovered through regression, a Mathcad solve block (see Table 1). The“Given-MinErr” solve block in Table 1 consists of a powerful, built-in re-gression procedure in Mathcad for recovering parameters. To avoid pos-sible experimental errors in the vapor-phase compositions, these data arenot used in the estimation of activity coefficient in Barker’s algorithm.[3,8]
The term denoted by Psat_prime in Table 1 represents the ratio of the fugac-ity of the pure liquid of interest to the fugacity coefficient of that compo-nent in the vapor mixture under equilibrium, or fi
li/ φ . This ratio deter-
mines the partial pressure, yiP , through the equation governing the phase
equilibrium:
φ γi i i i ily P x f for i= = ( )1 2 1,
The fugacity of liquid can be related to its properties at its saturation point;thus, the ratio mentioned above can also be visualized as the product of thesaturation pressure, the Poynting factor, and the ratio of the fugacity of thepure component of interest at its saturation pressure to the fugacity coeffi-cient of that component in the vapor mixture. When the second virial coeffi-cients are used in estimation of the non-idealities, or the fugacities, Psat_primecan be expressed as[8]
Pf
Pv B P P Py
RTisat i
l
iisat i
lii i
satj'
exp≡ ≈−( ) −( ) −
( )
φ
δ212
2
TABLE 1Given-MinErr Block for Barker’s Algorithm
where Bii denotes the second virial coefficient, and
δ12 12 11 222= − −B B B
In this example, the Wilson equation was usedfor the estimation of the activity coefficient, andregression yielded the two parameters of Wilsonequations for the activity coefficients, Λ12 T( ) andΛ21 T( ). After the recoveries of these parametersat three temperatures, regression was conductedto recover the parameter associated with the expo-nential dependence of temperature.
Once the functions of Λ12 T( ) and Λ21 T( ) weregenerated, the total system pressures at variouscompositions were determined by summing thepartial pressures. Vapor-phase compositions, y
j’s,
were estimated after the total pressures were ob-tained. The vapor-phase compositions, y
j’s , are
used only for comparison after total pressures areobtained because the aforementioned activity co-efficient conforms to the Gibbs-Duhem equation.Since the vapor-phase compositions were not knowninitially, the vapor-phase compositions, y
j’s in Eq.
(2), were set equal to zero in Psat_prime for the ini-tial regression for Λ ij . With a set of coarse estima-tions of y
j’s in hand, a second round of regression
was performed using the full version of Psat_prime.[8]
The inclusion of yj’s only slightly altered the values
of Λ12
and Λ21
in this example. Using these newvalues of Λ
12 and Λ
21, the refined total pressure
and vapor phase compositions were calculated.
Figure 1 presents the comparisons of the experi-mentally measured and predicted P-xy data fromboth Barker’s algorithm and the EOS model.Since the number of traces in Mathcad is lim-ited to sixteen, only two groups of the data at25°C and 45°C are shown.
Figures 2 and 3 (next page) represent the three-dimensional P-xy-T phase envelopes. The formerillustrates the phase envelope around the experi-mental conditions, and the latter illustrates the phaseenvelope extended to the mixture’s critical regionthrough the temperature dependence of Λ12 T( ) andΛ21 T( ) in the Wilson equation.
For extrapolation, an expression similar to theone in the “Given-MinErr” solve block in Table 1was used to calculate the system pressure at vari-ous temperatures. Once the system pressure wasknown, the vapor phase mole fraction was calcu-lated in the same manner as above. A surface plotgraph was then inserted into the Mathcadworksheet. Smoother phase envelopes can be con-structed if more data sets at different temperaturelevels are included. Figures 2 and 3 present resultsFigure 1. Model Fits.
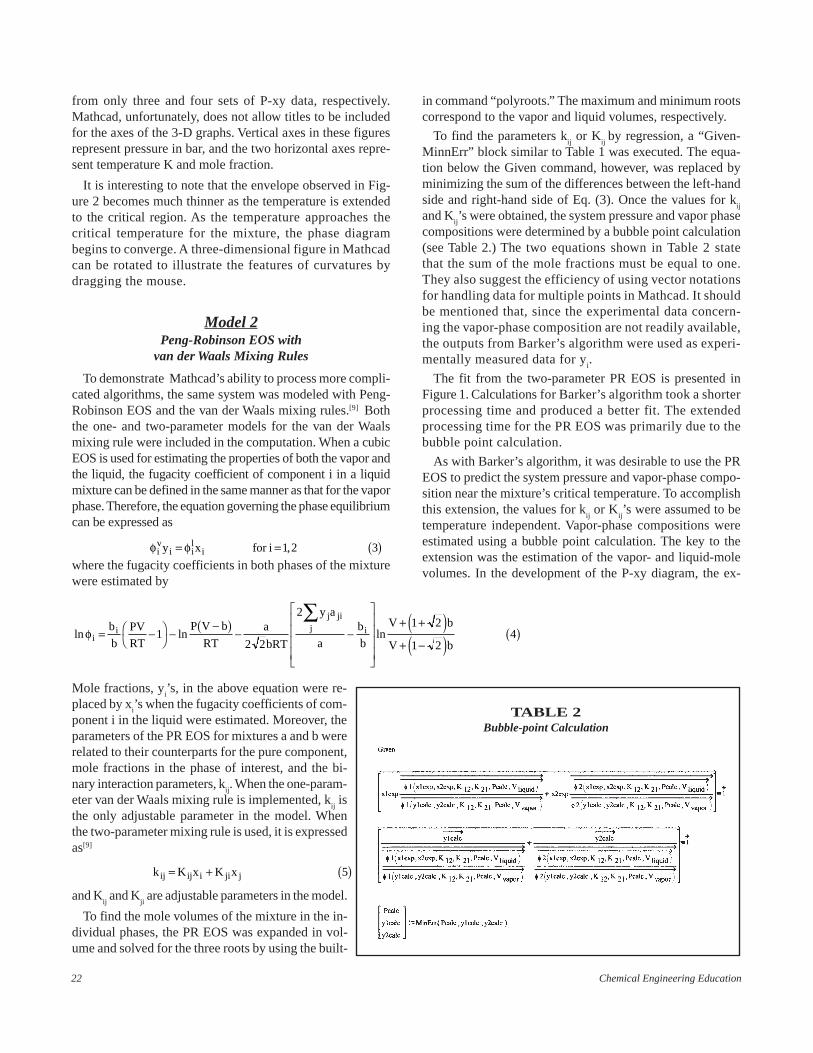
22 Chemical Engineering Education
from only three and four sets of P-xy data, respectively.Mathcad, unfortunately, does not allow titles to be includedfor the axes of the 3-D graphs. Vertical axes in these figuresrepresent pressure in bar, and the two horizontal axes repre-sent temperature K and mole fraction.
It is interesting to note that the envelope observed in Fig-ure 2 becomes much thinner as the temperature is extendedto the critical region. As the temperature approaches thecritical temperature for the mixture, the phase diagrambegins to converge. A three-dimensional figure in Mathcadcan be rotated to illustrate the features of curvatures bydragging the mouse.
Model 2Peng-Robinson EOS with
van der Waals Mixing Rules
To demonstrate Mathcad’s ability to process more compli-cated algorithms, the same system was modeled with Peng-Robinson EOS and the van der Waals mixing rules.[9] Boththe one- and two-parameter models for the van der Waalsmixing rule were included in the computation. When a cubicEOS is used for estimating the properties of both the vapor andthe liquid, the fugacity coefficient of component i in a liquidmixture can be defined in the same manner as that for the vaporphase. Therefore, the equation governing the phase equilibriumcan be expressed as
φ φiv
i il
iy x for i= = ( )1 2 3,
where the fugacity coefficients in both phases of the mixturewere estimated by
ln ln lnφ ii
j jij ib
b
PV
RT
P V b
RT
a
bRT
y a
a
b
b
V b
V b= −
−
−( ) − −
+ +( )+ −( ) ( )
∑1
2 2
21 2
1 24
Mole fractions, yi’s, in the above equation were re-
placed by xi’s when the fugacity coefficients of com-
ponent i in the liquid were estimated. Moreover, theparameters of the PR EOS for mixtures a and b wererelated to their counterparts for the pure component,mole fractions in the phase of interest, and the bi-nary interaction parameters, k
ij. When the one-param-
eter van der Waals mixing rule is implemented, kij is
the only adjustable parameter in the model. Whenthe two-parameter mixing rule is used, it is expressedas[9]
k K x K xij ij i ji j= + ( )5
and Kij and K
ji are adjustable parameters in the model.
To find the mole volumes of the mixture in the in-dividual phases, the PR EOS was expanded in vol-ume and solved for the three roots by using the built-
TABLE 2Bubble-point Calculation
in command “polyroots.” The maximum and minimum rootscorrespond to the vapor and liquid volumes, respectively.
To find the parameters kij or K
ij by regression, a “Given-
MinnErr” block similar to Table 1 was executed. The equa-tion below the Given command, however, was replaced byminimizing the sum of the differences between the left-handside and right-hand side of Eq. (3). Once the values for k
ij
and Kij’s were obtained, the system pressure and vapor phase
compositions were determined by a bubble point calculation(see Table 2.) The two equations shown in Table 2 statethat the sum of the mole fractions must be equal to one.They also suggest the efficiency of using vector notationsfor handling data for multiple points in Mathcad. It shouldbe mentioned that, since the experimental data concern-ing the vapor-phase composition are not readily available,the outputs from Barker’s algorithm were used as experi-mentally measured data for y
i.
The fit from the two-parameter PR EOS is presented inFigure 1. Calculations for Barker’s algorithm took a shorterprocessing time and produced a better fit. The extendedprocessing time for the PR EOS was primarily due to thebubble point calculation.
As with Barker’s algorithm, it was desirable to use the PREOS to predict the system pressure and vapor-phase compo-sition near the mixture’s critical temperature. To accomplishthis extension, the values for k
ij or K
ij’s were assumed to be
temperature independent. Vapor-phase compositions wereestimated using a bubble point calculation. The key to theextension was the estimation of the vapor- and liquid-molevolumes. In the development of the P-xy diagram, the ex-
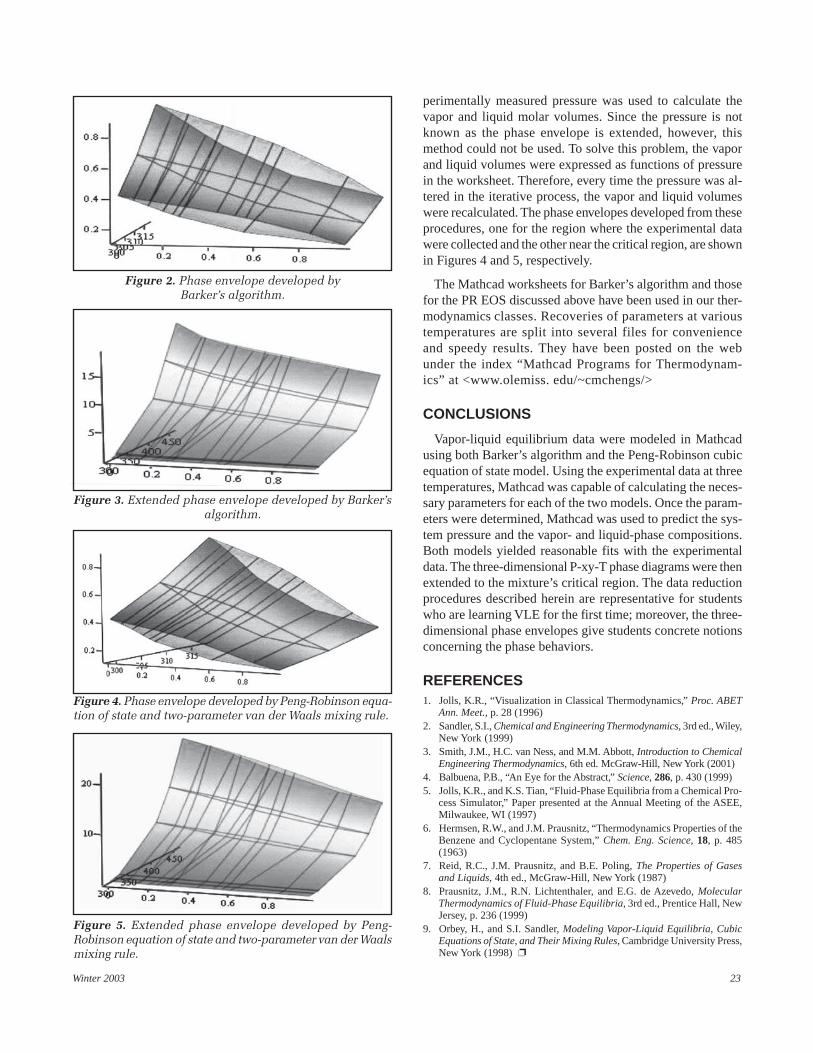
Winter 2003 23
Figure 2. Phase envelope developed byBarker’s algorithm.
Figure 3. Extended phase envelope developed by Barker’salgorithm.
perimentally measured pressure was used to calculate thevapor and liquid molar volumes. Since the pressure is notknown as the phase envelope is extended, however, thismethod could not be used. To solve this problem, the vaporand liquid volumes were expressed as functions of pressurein the worksheet. Therefore, every time the pressure was al-tered in the iterative process, the vapor and liquid volumeswere recalculated. The phase envelopes developed from theseprocedures, one for the region where the experimental datawere collected and the other near the critical region, are shownin Figures 4 and 5, respectively.
The Mathcad worksheets for Barker’s algorithm and thosefor the PR EOS discussed above have been used in our ther-modynamics classes. Recoveries of parameters at varioustemperatures are split into several files for convenienceand speedy results. They have been posted on the webunder the index “Mathcad Programs for Thermodynam-ics” at <www.olemiss. edu/~cmchengs/>
CONCLUSIONS
Vapor-liquid equilibrium data were modeled in Mathcadusing both Barker’s algorithm and the Peng-Robinson cubicequation of state model. Using the experimental data at threetemperatures, Mathcad was capable of calculating the neces-sary parameters for each of the two models. Once the param-eters were determined, Mathcad was used to predict the sys-tem pressure and the vapor- and liquid-phase compositions.Both models yielded reasonable fits with the experimentaldata. The three-dimensional P-xy-T phase diagrams were thenextended to the mixture’s critical region. The data reductionprocedures described herein are representative for studentswho are learning VLE for the first time; moreover, the three-dimensional phase envelopes give students concrete notionsconcerning the phase behaviors.
REFERENCES1. Jolls, K.R., “Visualization in Classical Thermodynamics,” Proc. ABET
Ann. Meet., p. 28 (1996)2. Sandler, S.I., Chemical and Engineering Thermodynamics, 3rd ed., Wiley,
New York (1999)3. Smith, J.M., H.C. van Ness, and M.M. Abbott, Introduction to Chemical
Engineering Thermodynamics, 6th ed. McGraw-Hill, New York (2001)4. Balbuena, P.B., “An Eye for the Abstract,” Science, 286, p. 430 (1999)5. Jolls, K.R., and K.S. Tian, “Fluid-Phase Equilibria from a Chemical Pro-
cess Simulator,” Paper presented at the Annual Meeting of the ASEE,Milwaukee, WI (1997)
6. Hermsen, R.W., and J.M. Prausnitz, “Thermodynamics Properties of theBenzene and Cyclopentane System,” Chem. Eng. Science, 18, p. 485(1963)
7. Reid, R.C., J.M. Prausnitz, and B.E. Poling, The Properties of Gasesand Liquids, 4th ed., McGraw-Hill, New York (1987)
8. Prausnitz, J.M., R.N. Lichtenthaler, and E.G. de Azevedo, MolecularThermodynamics of Fluid-Phase Equilibria, 3rd ed., Prentice Hall, NewJersey, p. 236 (1999)
9. Orbey, H., and S.I. Sandler, Modeling Vapor-Liquid Equilibria, CubicEquations of State, and Their Mixing Rules, Cambridge University Press,New York (1998) ❐
Figure 4. Phase envelope developed by Peng-Robinson equa-tion of state and two-parameter van der Waals mixing rule.
Figure 5. Extended phase envelope developed by Peng-Robinson equation of state and two-parameter van der Waalsmixing rule.
24 Chemical Engineering Education
FRONTIERS OFCHEMICAL ENGINEERING
A Chemical Engineering Freshman Seminar
FRANK M. BOWMAN, R. ROBERT BALCARCEL, G. KANE JENNINGS, BRIDGET R. ROGERS
Vanderbilt University • Nashville, TN 37235-1604
In this paper we will describe a new seminar elective forfreshman engineering students titled “Frontiers of Chemi-cal Engineering.” We have designed the seminar to in-
troduce freshmen to the field and profession of chemical en-gineering by using examples from cutting-edge research toillustrate fundamental concepts. Exposing students to chemi-cal engineering in their first semester provides an earlierchance for them to catch the excitement of chemical engi-neering and should help them make better-informed decisionsregarding their educational plans.
Chemical engineering students at many universities receivelittle, if any, exposure to chemical engineering as freshmen.For example, at Vanderbilt University freshman chemicalengineering majors primarily take large lecture courses inmath, physics, chemistry, and general engineering. Theirsophomore year consists of only a single chemical engineer-ing course each term, along with organic chemistry, math,and physics. This traditional curriculum leaves students withfew opportunities to interact with professors in their majoruntil their junior and senior years. Additionally, the large in-troductory lecture courses of the freshman year, which of-ten provide little opportunity for student involvement, seta pattern of expectation, hopefully incorrect, for the learn-ing and teaching methods to be used throughout the re-mainder of their program.
Compounding these problems, most freshmen have a poorunderstanding of the engineering profession in general andchemical engineering in particular. Often, students do notbegin to see the big picture of the chemical engineering pro-fession until the senior capstone design course. Consequently,they form impressions of chemical engineering, make deci-sions on which major to pursue, and set expectations forthe college learning environment early in the college ca-reer—all based almost entirely on non-engineering coursesand professors.
We feel that our chemical engineering profession has anobligation to educate prospective chemical engineering stu-dents regarding the broad applicability of chemical engineer-ing principles, the multitude of available career paths, andthe many other opportunities that our graduates normally re-ceive. Such information should be made available to studentsas early as possible—certainly to new students in the firstsemester of their freshman year.
Many engineering programs across the country have modi-fied their freshman curricula to address these challenges. Avariety of approaches has been used, including general engi-neering courses, design-based courses,[1-4] orientationcourses,[5-8] and seminars.[9-11] General engineering coursesbring together students from all engineering majors to pro-vide a consistent grounding in basic engineering principlesand skills, such as engineering problem solving, communi-cation tools and skills, basic computer literacy, mathematical
Frank Bowman is Assistant Professor of Chemical Engineering atVanderbilt University. He received his BS from Brigham Young Univer-sity in 1991 and his PhD from Caltech in 1997, both in chemical engi-neering. His research interests include atmospheric aerosol modelingand chemical mechanism analysis.Robert Balcarcel is Assistant Professor of Chemical Engineering atVanderbilt University. He received his BS from the University of Califor-nia, Berkeley, in 1993 and his PhD from MIT in 1999, both in chemicalengineering. His research interests include improvement and metabolicengineering of mammalian cell cultures for biopharmaceutical produc-tion and analysis of chemical and biological agents.Kane Jennings is Assistant Professor of Chemical Engineering atVanderbilt University. He received his BS in chemical engineering fromAuburn University in 1993, an MS in chemical engineering practice fromMIT in 1996, and a PhD in chemical engineering from MIT in 1998. Hisresearch is focused on ultrathin organic films.Bridget Rogers is Assistant Professor of Chemical Engineering atVanderbilt University. She received her PhD and MS degrees from Ari-zona State University and her BS degree from the University of Colo-rado, Boulder, all in chemical engineering. Her research program fo-cuses on film formation, microstructure evolution, and material proper-ties of UHV-CVD deposited high permittivity dielectric thin films.
© Copyright ChE Division of ASEE 2003
ChE curriculum
Winter 2003 25
modeling, and computer programming. Design-based coursesuse real-world, hands-on experiences to introduce the engi-neering design process, teamwork, and engineering prob-lem-solving skills. Orientation-type courses help studentsmake the transition from high school to college and intro-duce them to the engineering profession, including topics suchas campus policies and resources, time management and studyskills, exposure to various engineering disciplines and jobfunctions, and professional ethics. Seminar courses foster stu-dent/engineering faculty interactions using small-group dis-cussions on a variety of engineering related topics.
FRESHMAN ENGINEERING AT VANDERBILT
The Vanderbilt University School of Engineering has re-cently introduced a variety of freshman seminar electives forthe purpose of providing students greater access to engineer-ing faculty, helping them make more informed career choices,and developing diverse learning and problem-solving skills.[11]
These seminars are one-semester-hour courses, taught entirelyby full-time professors, with a limited student enrollment(typically 10-15 students). Faculty involvement is voluntaryand professors are free to teach on anything within their areaof expertise. In the academic year 2001-2002, approximatelyhalf of the freshman engineering students participated in afreshman seminar. Both student and faculty response to theprogram has been very favorable. These seminars comple-ment the existing freshman engineering curriculum. Within
TABLE 1Objectives for Freshman Chemical Engineering Seminar
� Demonstrate What Chemical Engineering IsEnable students to
• Explain what a chemical engineer does• Identify products that chemical engineers make• Identify companies that employ chemical engineers
� Touch on Chemical Engineering PrinciplesIntroduce students to the chemical engineering principles of
• Material balances• Chemical and phase equilibrium• Mass transfer• Reaction kinetics
� Introduce the Frontiers of Chemical EngineeringProvide students with an introduction to the nontraditionalchemical engineering topics of
• Biopharmaceutical production• Molecular self-assembly• Atmospheric particles• Semiconductor fabrication
� Get the Freshmen Off to a Good Start• Excite them about engineering and chemical engineering• Provide an opportunity for them to get to know each other• Introduce them to chemical engineering faculty• Prepare and encourage them to participate in under- graduate research
the School of Engineering, the choice of engineering majoris formally delayed until the beginning of the sophomore year.All freshman engineering students take a common generalengineering course (“Introduction to Computing in Engineer-ing”—teamwork skills, engineering method, computer tools)and a C++- or Matlab-based programming course (“Program-ming and Problem Solving”).
COURSE DESCRIPTION
As part of the seminar program, we have developed andteach a “Frontiers in Chemical Engineering” seminar. Eachprofessor spends three to four weeks teaching a unit that isfocused on his or her research area. During the past threeyears we have used examples from the modern topics ofbiopharmaceutical production, semiconductor fabrication,atmospheric particle formation, and molecular self-assem-bly to introduce the profession and principles of chemicalengineering to the students.
In designing the course, we have identified the four mainelements listed in Table 1. The first three items are specificacademic objectives that help guide the selection of coursecontent (what is taught). The last item is more general anddefines the desired learning environment (how the course istaught). Within the individual research units, each of theseelements is repeated. The goal is for students to see severaldifferent fields within chemical engineering, to see differentapplications of the same principles, and to interact with dif-ferent faculty members.
Real-world applications that are familiar to students areused to motivate interest in each of the research topics. Forexample, biopharmaceutical production is introduced as a wayto treat diseases such as diabetes or to decrease transplantrejections. The unit on atmospheric particles is started by ask-ing the question, “Why do we care about particles in the at-mosphere?”, which leads to discussions of how particles in-fluence global climate, the ozone hole, and human health.Molecular self-assembly is explored as a process that cancreate coatings for applications such as corrosion protectionof naval ships, chemical and biological sensors, biocompatiblemedical devices, and water-resistant fabrics. The section onsemiconductor fabrication includes a discussion of how solidstate transistors work and an exercise that involves role play-ing a process engineer evaluating a problem costing the com-pany $250,000 per day. The role-playing exercise emphasizes
We have designed the seminarto introduce freshmen to the field and
profession of chemical engineeringby using examples from cutting-
edge research to illustratefundamental concepts.
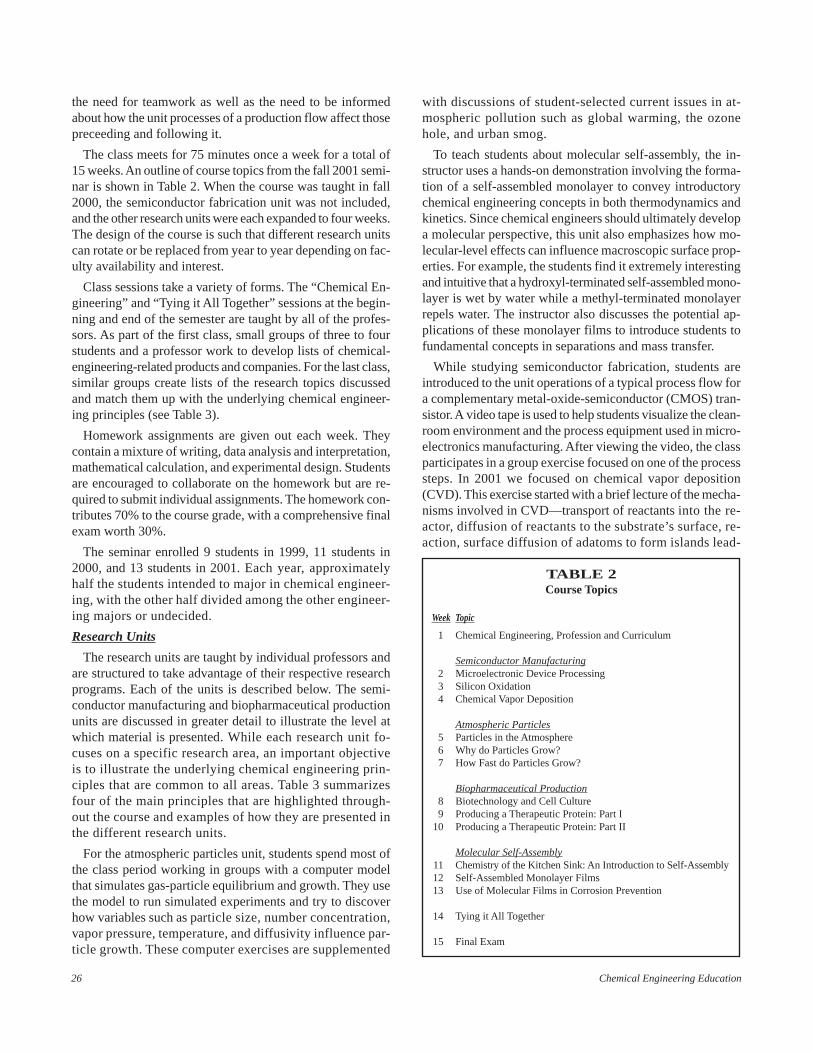
26 Chemical Engineering Education
TABLE 2Course Topics
Week Topic
1 Chemical Engineering, Profession and Curriculum
Semiconductor Manufacturing2 Microelectronic Device Processing3 Silicon Oxidation4 Chemical Vapor Deposition
Atmospheric Particles5 Particles in the Atmosphere6 Why do Particles Grow?7 How Fast do Particles Grow?
Biopharmaceutical Production8 Biotechnology and Cell Culture9 Producing a Therapeutic Protein: Part I
10 Producing a Therapeutic Protein: Part II
Molecular Self-Assembly11 Chemistry of the Kitchen Sink: An Introduction to Self-Assembly12 Self-Assembled Monolayer Films13 Use of Molecular Films in Corrosion Prevention
14 Tying it All Together
15 Final Exam
the need for teamwork as well as the need to be informedabout how the unit processes of a production flow affect thosepreceeding and following it.
The class meets for 75 minutes once a week for a total of15 weeks. An outline of course topics from the fall 2001 semi-nar is shown in Table 2. When the course was taught in fall2000, the semiconductor fabrication unit was not included,and the other research units were each expanded to four weeks.The design of the course is such that different research unitscan rotate or be replaced from year to year depending on fac-ulty availability and interest.
Class sessions take a variety of forms. The “Chemical En-gineering” and “Tying it All Together” sessions at the begin-ning and end of the semester are taught by all of the profes-sors. As part of the first class, small groups of three to fourstudents and a professor work to develop lists of chemical-engineering-related products and companies. For the last class,similar groups create lists of the research topics discussedand match them up with the underlying chemical engineer-ing principles (see Table 3).
Homework assignments are given out each week. Theycontain a mixture of writing, data analysis and interpretation,mathematical calculation, and experimental design. Studentsare encouraged to collaborate on the homework but are re-quired to submit individual assignments. The homework con-tributes 70% to the course grade, with a comprehensive finalexam worth 30%.
The seminar enrolled 9 students in 1999, 11 students in2000, and 13 students in 2001. Each year, approximatelyhalf the students intended to major in chemical engineer-ing, with the other half divided among the other engineer-ing majors or undecided.
Research Units
The research units are taught by individual professors andare structured to take advantage of their respective researchprograms. Each of the units is described below. The semi-conductor manufacturing and biopharmaceutical productionunits are discussed in greater detail to illustrate the level atwhich material is presented. While each research unit fo-cuses on a specific research area, an important objectiveis to illustrate the underlying chemical engineering prin-ciples that are common to all areas. Table 3 summarizesfour of the main principles that are highlighted through-out the course and examples of how they are presented inthe different research units.
For the atmospheric particles unit, students spend most ofthe class period working in groups with a computer modelthat simulates gas-particle equilibrium and growth. They usethe model to run simulated experiments and try to discoverhow variables such as particle size, number concentration,vapor pressure, temperature, and diffusivity influence par-ticle growth. These computer exercises are supplemented
with discussions of student-selected current issues in at-mospheric pollution such as global warming, the ozonehole, and urban smog.
To teach students about molecular self-assembly, the in-structor uses a hands-on demonstration involving the forma-tion of a self-assembled monolayer to convey introductorychemical engineering concepts in both thermodynamics andkinetics. Since chemical engineers should ultimately developa molecular perspective, this unit also emphasizes how mo-lecular-level effects can influence macroscopic surface prop-erties. For example, the students find it extremely interestingand intuitive that a hydroxyl-terminated self-assembled mono-layer is wet by water while a methyl-terminated monolayerrepels water. The instructor also discusses the potential ap-plications of these monolayer films to introduce students tofundamental concepts in separations and mass transfer.
While studying semiconductor fabrication, students areintroduced to the unit operations of a typical process flow fora complementary metal-oxide-semiconductor (CMOS) tran-sistor. A video tape is used to help students visualize the clean-room environment and the process equipment used in micro-electronics manufacturing. After viewing the video, the classparticipates in a group exercise focused on one of the processsteps. In 2001 we focused on chemical vapor deposition(CVD). This exercise started with a brief lecture of the mecha-nisms involved in CVD—transport of reactants into the re-actor, diffusion of reactants to the substrate’s surface, re-action, surface diffusion of adatoms to form islands lead-
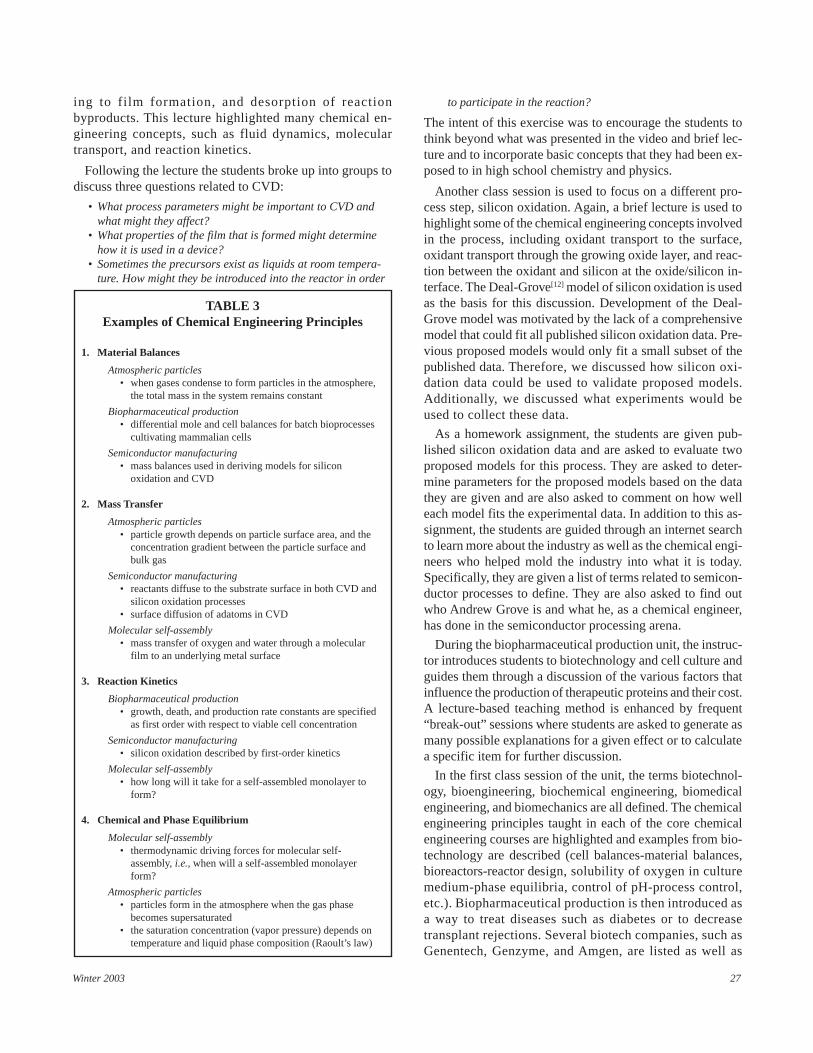
Winter 2003 27
TABLE 3Examples of Chemical Engineering Principles
1. Material Balances
Atmospheric particles• when gases condense to form particles in the atmosphere,
the total mass in the system remains constant
Biopharmaceutical production• differential mole and cell balances for batch bioprocesses
cultivating mammalian cells
Semiconductor manufacturing• mass balances used in deriving models for silicon
oxidation and CVD
2. Mass Transfer
Atmospheric particles• particle growth depends on particle surface area, and the
concentration gradient between the particle surface andbulk gas
Semiconductor manufacturing• reactants diffuse to the substrate surface in both CVD and
silicon oxidation processes• surface diffusion of adatoms in CVD
Molecular self-assembly• mass transfer of oxygen and water through a molecular
film to an underlying metal surface
3. Reaction Kinetics
Biopharmaceutical production• growth, death, and production rate constants are specified
as first order with respect to viable cell concentration
Semiconductor manufacturing• silicon oxidation described by first-order kinetics
Molecular self-assembly• how long will it take for a self-assembled monolayer to
form?
4. Chemical and Phase Equilibrium
Molecular self-assembly• thermodynamic driving forces for molecular self-
assembly, i.e., when will a self-assembled monolayerform?
Atmospheric particles• particles form in the atmosphere when the gas phase
becomes supersaturated• the saturation concentration (vapor pressure) depends on
temperature and liquid phase composition (Raoult’s law)
ing to film formation, and desorption of reactionbyproducts. This lecture highlighted many chemical en-gineering concepts, such as fluid dynamics, moleculartransport, and reaction kinetics.
Following the lecture the students broke up into groups todiscuss three questions related to CVD:
• What process parameters might be important to CVD andwhat might they affect?
• What properties of the film that is formed might determinehow it is used in a device?
• Sometimes the precursors exist as liquids at room tempera-ture. How might they be introduced into the reactor in order
to participate in the reaction?
The intent of this exercise was to encourage the students tothink beyond what was presented in the video and brief lec-ture and to incorporate basic concepts that they had been ex-posed to in high school chemistry and physics.
Another class session is used to focus on a different pro-cess step, silicon oxidation. Again, a brief lecture is used tohighlight some of the chemical engineering concepts involvedin the process, including oxidant transport to the surface,oxidant transport through the growing oxide layer, and reac-tion between the oxidant and silicon at the oxide/silicon in-terface. The Deal-Grove[12] model of silicon oxidation is usedas the basis for this discussion. Development of the Deal-Grove model was motivated by the lack of a comprehensivemodel that could fit all published silicon oxidation data. Pre-vious proposed models would only fit a small subset of thepublished data. Therefore, we discussed how silicon oxi-dation data could be used to validate proposed models.Additionally, we discussed what experiments would beused to collect these data.
As a homework assignment, the students are given pub-lished silicon oxidation data and are asked to evaluate twoproposed models for this process. They are asked to deter-mine parameters for the proposed models based on the datathey are given and are also asked to comment on how welleach model fits the experimental data. In addition to this as-signment, the students are guided through an internet searchto learn more about the industry as well as the chemical engi-neers who helped mold the industry into what it is today.Specifically, they are given a list of terms related to semicon-ductor processes to define. They are also asked to find outwho Andrew Grove is and what he, as a chemical engineer,has done in the semiconductor processing arena.
During the biopharmaceutical production unit, the instruc-tor introduces students to biotechnology and cell culture andguides them through a discussion of the various factors thatinfluence the production of therapeutic proteins and their cost.A lecture-based teaching method is enhanced by frequent“break-out” sessions where students are asked to generate asmany possible explanations for a given effect or to calculatea specific item for further discussion.
In the first class session of the unit, the terms biotechnol-ogy, bioengineering, biochemical engineering, biomedicalengineering, and biomechanics are all defined. The chemicalengineering principles taught in each of the core chemicalengineering courses are highlighted and examples from bio-technology are described (cell balances-material balances,bioreactors-reactor design, solubility of oxygen in culturemedium-phase equilibria, control of pH-process control,etc.). Biopharmaceutical production is then introduced asa way to treat diseases such as diabetes or to decreasetransplant rejections. Several biotech companies, such asGenentech, Genzyme, and Amgen, are listed as well as
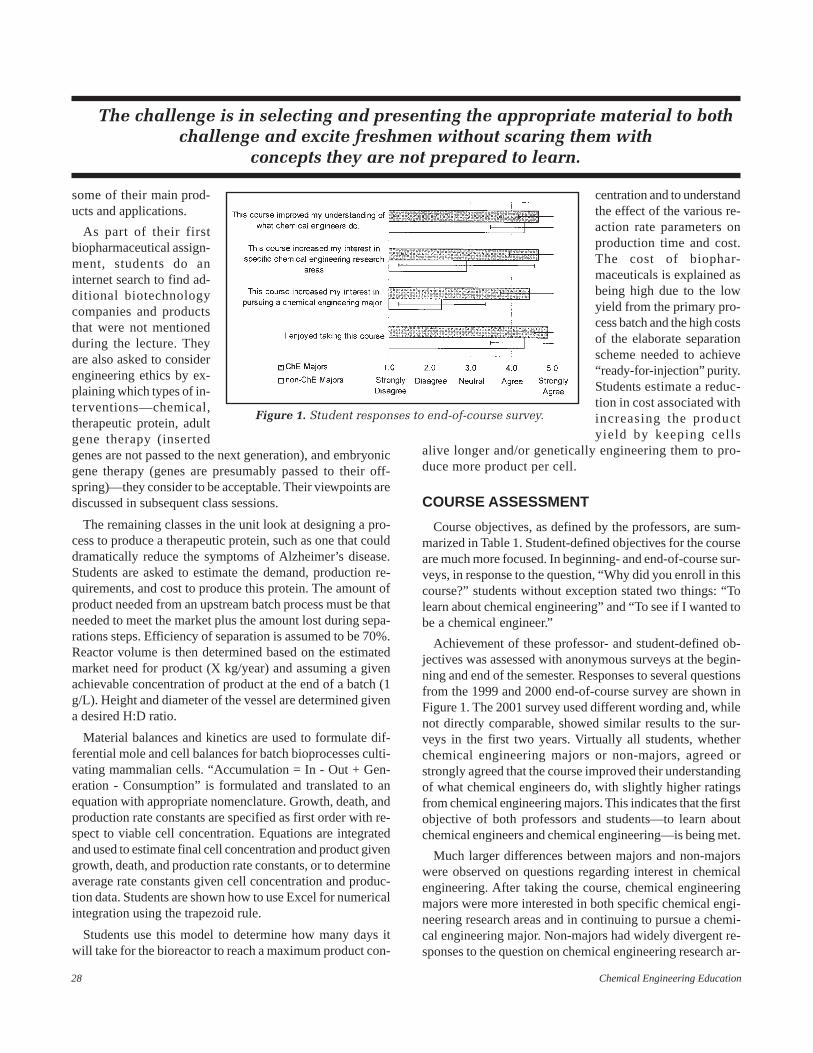
28 Chemical Engineering Education
Figure 1. Student responses to end-of-course survey.
The challenge is in selecting and presenting the appropriate material to bothchallenge and excite freshmen without scaring them with
concepts they are not prepared to learn.
some of their main prod-ucts and applications.
As part of their firstbiopharmaceutical assign-ment, students do aninternet search to find ad-ditional biotechnologycompanies and productsthat were not mentionedduring the lecture. Theyare also asked to considerengineering ethics by ex-plaining which types of in-terventions—chemical,therapeutic protein, adultgene therapy (insertedgenes are not passed to the next generation), and embryonicgene therapy (genes are presumably passed to their off-spring)—they consider to be acceptable. Their viewpoints arediscussed in subsequent class sessions.
The remaining classes in the unit look at designing a pro-cess to produce a therapeutic protein, such as one that coulddramatically reduce the symptoms of Alzheimer’s disease.Students are asked to estimate the demand, production re-quirements, and cost to produce this protein. The amount ofproduct needed from an upstream batch process must be thatneeded to meet the market plus the amount lost during sepa-rations steps. Efficiency of separation is assumed to be 70%.Reactor volume is then determined based on the estimatedmarket need for product (X kg/year) and assuming a givenachievable concentration of product at the end of a batch (1g/L). Height and diameter of the vessel are determined givena desired H:D ratio.
Material balances and kinetics are used to formulate dif-ferential mole and cell balances for batch bioprocesses culti-vating mammalian cells. “Accumulation = In - Out + Gen-eration - Consumption” is formulated and translated to anequation with appropriate nomenclature. Growth, death, andproduction rate constants are specified as first order with re-spect to viable cell concentration. Equations are integratedand used to estimate final cell concentration and product givengrowth, death, and production rate constants, or to determineaverage rate constants given cell concentration and produc-tion data. Students are shown how to use Excel for numericalintegration using the trapezoid rule.
Students use this model to determine how many days itwill take for the bioreactor to reach a maximum product con-
centration and to understandthe effect of the various re-action rate parameters onproduction time and cost.The cost of biophar-maceuticals is explained asbeing high due to the lowyield from the primary pro-cess batch and the high costsof the elaborate separationscheme needed to achieve“ready-for-injection” purity.Students estimate a reduc-tion in cost associated withincreasing the productyield by keeping cells
alive longer and/or genetically engineering them to pro-duce more product per cell.
COURSE ASSESSMENT
Course objectives, as defined by the professors, are sum-marized in Table 1. Student-defined objectives for the courseare much more focused. In beginning- and end-of-course sur-veys, in response to the question, “Why did you enroll in thiscourse?” students without exception stated two things: “Tolearn about chemical engineering” and “To see if I wanted tobe a chemical engineer.”
Achievement of these professor- and student-defined ob-jectives was assessed with anonymous surveys at the begin-ning and end of the semester. Responses to several questionsfrom the 1999 and 2000 end-of-course survey are shown inFigure 1. The 2001 survey used different wording and, whilenot directly comparable, showed similar results to the sur-veys in the first two years. Virtually all students, whetherchemical engineering majors or non-majors, agreed orstrongly agreed that the course improved their understandingof what chemical engineers do, with slightly higher ratingsfrom chemical engineering majors. This indicates that the firstobjective of both professors and students—to learn aboutchemical engineers and chemical engineering—is being met.
Much larger differences between majors and non-majorswere observed on questions regarding interest in chemicalengineering. After taking the course, chemical engineeringmajors were more interested in both specific chemical engi-neering research areas and in continuing to pursue a chemi-cal engineering major. Non-majors had widely divergent re-sponses to the question on chemical engineering research ar-

Winter 2003 29
eas, either strongly disagreeing or strongly agreeing that thecourse increased their interest. Concerning pursuit of a chemi-cal engineering major, the course tended to make non-majorsless interested. These results suggest that the course has beenmore effective at confirming students original selection of amajor rather than recruiting non-majors into chemical engi-neering. Written student comments support this view, withchemical engineering majors saying, “Now I am sure this iswhat I want to major in,” and non-majors saying “I found outthat I do not want to be a chemical engineer and that otherfields interest me more.”
Both sets of students tended to agree or strongly agree thatthey enjoyed taking the course, with exceptionally favorableresponses from the chemical engineering majors. That non-majors, despite a demonstrated preference for other engineer-ing majors, enjoyed the course is taken as a sign that the courseis providing the desired positive experience for freshmanengineering students.
Faculty response to the seminar has also been favorable.We have appreciated the opportunity to get to know our stu-dents early in their college careers. As we encounter them inother courses, we find that we have already established a re-lationship with them, which helps us connect better with theentire class. Presumably, this experience is reciprocated, andstudents also feel more comfortable interacting with us. Anadditional benefit has been that several students have ex-pressed interest in our individual research programs, and somehave begun working as undergraduate research assistants inour research labs.
The overall time commitment for preparing and teachingthe seminar, particularly when divided among three or fourprofessors, is quite reasonable. But it was noted that prepara-tion time for each class period was higher for this course com-pared to semester-long courses. The challenge is in selectingand presenting the appropriate material to both challenge andexcite freshmen without scaring them with concepts they arenot prepared to learn.
AREAS FOR IMPROVEMENTWe have identified a few areas for improvement in upcom-
ing years. Greater coordination between the individual re-search units is needed so that the seminar is a coherent, inte-grated course and not merely a collection of unrelated mini-seminars. Related to this, initially we noted a deficiency inmeeting the objective of introducing basic chemical engineer-ing principles, so in 2001, greater emphasis was placed on com-mon underlying ideas in each research unit to help tie the coursetogether and provide a better understanding of these principles.
Assessment surveys need to be refined to better measureachievement of the stated course objectives. The progress ofpast seminar students should be followed to determine what,if any, impact the course may have had on their college expe-rience. Unfortunately, due to the limited and voluntary en-
rollment, accurate comparison to a control group of studentswho didn’t take the seminar is not practical.
The first time the course was taught, we found two- or three-week units to be too short. Three to four weeks for each re-search area was better, because it allowed more time to ex-plore the research topic. A certain amount of backgroundmaterial is essential when introducing unfamiliar subjects,but our goal is to achieve sufficient depth to intellectu-ally challenge the students. Part of this challenge is in-herent in making graduate-level research topics accessibleto a freshman audience.
Overall, we feel the course has been quite successful. Stu-dents have learned more about chemical engineering, and byexposure to our different research areas they have gained aclearer view of the wide scope of opportunities available tothem. Perhaps most importantly, freshman engineering stu-dents have had the opportunity to begin their college experi-ence working closely with other engineering students and withengineering faculty. The experience has proved enjoyable andbeneficial for all involved. The format of the course is flex-ible and should be easily adaptable to other chemical engi-neering departments.
ACKNOWLEDGMENTS
Frank Bowman would like to thank the National ScienceFoundation for supporting development of the educationalaerosol computer model under Grant ATM-9985108.
REFERENCES
1. Ambrose, S.A., and C.H. Amon, “Systematic Design of a First-YearMechanical Engineering Course at Carnegie Mellon University,” J.Eng. Ed., 86, 173 (1997)
2. Carlson, B., et al., “A Motivational First-Year Electronics Lab Course,”J. Eng. Ed., 86, 357 (1997)
3. Sheppard, S., and R. Jenison, “Examples of Freshman Design Educa-tion,” Int. J. Eng. Ed., 13, 248 (1997)
4. Burton, J.D., and D.M. White, “Selecting a Model for Freshman Engi-neering Design,” J. Eng. Ed., 88, 327 (1999)
5. Landis, R.B., “Improving Student Success Through a Model ‘Intro-duction to Engineering’ Course,” Proc. 1992 ASEE Ann. Conf., To-ledo, OH (1992)
6. Hatton, D.M., P.C. Wankat, and W.K. LeBold, “The Effects of an Ori-entation Course on the Attitudes of Freshmen Engineering Students,”J. Eng. Ed., 87, 23 (1998)
7. Porter, R.L., and H. Fuller, “A New ‘Contact-Based’ First Year Engi-neering Course,” J. Eng. Ed., 87, 399 (1998)
8. Budny, D., “The Freshman Seminar: Assisting the Freshman Engi-neering Student’s Transition from High School to College,” Proc. 2001ASEE Ann. Conf., Albuquerque, NM (2001)
9. Merritt, T.R., E.M. Murman, and D.L. Friedman, “Engaging Fresh-men Through Advisor Seminars,” J. Eng. Ed., 86, 29 (1997)
10. Richardson, C., “Freshman Retention in Engineering Technology Pro-grams at Rochester Institute of Technology,” Proc. 1997 ASEE Ann.Conf., Milwaukee, WI (1997)
11. Overholser, K.A., “Engineering Freshman Seminars,” Proc. 2001 ASEEAnn. Conf., Albuquerque, NM (2001)
12. Deal, B.E., and A.S. Grove, “General Relationship for the Thermal
Oxidation of Silicon,” J. Appl. Phys., 36, 3770 (1965) ❐
30 Chemical Engineering Education
Dear Engineering Student:
Don’t take the title of this column literally. Despite the in-comprehensible lectures, endless homework, and impossibletests, studying engineering has rarely been fatal. Neverthe-less, things may not always go quite the way you would like—classes with absurd amounts of work and test averages in the50s are facts of life in engineering. I had lots of classes likethat when I was where you are now, and I complained aboutthem just as loudly. Unfortunately, while complaining maymake you feel better, it won’t do a thing for your grades.
I’d like to propose several better ways to help yourself.First, though, let me suggest that the real problem may not bethat professor who’s making your life miserable. It is thatover the years you may have unconsciously bought into amessage that goes like this: “My teachers know everything Ineed to know to be an engineer. Their job is to tell it to me inlectures, and my job is to soak it up and then repeat it onexams. If I can do that, I’ve learned it.”
Wrong! That approach may have worked in high schoolbut it begins to fail in college, and once you get into the plantor research lab, it stops working completely. Out there, thereare no professors, lectures, or texts with worked-out ex-amples, and the problems don’t come neatly packaged withall the information needed to solve them. In fact, oftenthe hardest part of a real problem is figuring out exactlywhat the problem is.
But you also need to remember this. Around the world,hundreds of thousands of engineers—most no smarter thanyou, many not as smart—who once struggled with their ownconfusing instructors and unreadable texts and didn’t under-stand entropy any better than you do, are out there doing justfine. Every day they figure out what they need to know tosolve their problems, and then they solve them. If they couldlearn to do that, so can you. What I’d like to do here is give
you five simple tips to help you start learning it now. If youfind yourself struggling in classes, give the tips a try. If theywork (and I’m pretty sure that they will), you’ll have an easiertime in school and hit the ground running in your first job.
TIP 1
Figure out what might make coursematerial clearer and try to get it in class.
Do you ever find yourself expressing one of these com-mon complaints? “I need practical, real-world applicationsbefore I can understand something, but all we get in class istheory.” “I want to understand how things work, but all weget are facts to memorize and formulas to substitute into.” “Iunderstand what I see—pictures, diagrams, demonstrations—better than what I hear and read, but all we get are wordsand formulas.”
If you do, pay attention to yourself—identifying whatyou’re missing in a course is the first step toward getting it.The obvious next step is to ask your professor, in or out ofclass, for whatever it may be. Most professors genuinely wanttheir students to learn—that’s why they became professors—and often complain that their students rarely ask questionsexcept “Are we responsible for this on the test?” So if youdon’t understand something, try asking for something that
HOW TOSURVIVE ENGINEERING SCHOOL
RICHARD M. FELDER
North Carolina State University • Raleigh, NC 27695
Random Thoughts . . .
© Copyright ChE Division of ASEE 2003
Richard M. Felder is Hoechst Celanese Pro-fessor Emeritus of Chemical Engineering atNorth Carolina State University. He receivedhis BChE from City College of CUNY and hisPhD from Princeton. He is coauthor of the textElementary Principles of Chemical Processes(Wiley, 2000) and codirector of the ASEE Na-tional Effective Teaching Institute

Winter 2003 31
might clarify it. “Could you give an example of how you woulduse that formula?” “Could you sketch what that (device, so-lution, plot) might look like?” “Where did that equation youjust wrote come from?” Even if you’re afraid a question maysound stupid, ask it anyway. I guarantee that others in theclass are equally confused and will be grateful to you forhaving the courage to speak up. And if you need more help,go to the professor’s office and ask for it.
Caution, however. Even instructors who really want to helpwill get annoyed if they think you’re trying to get them to doyour homework for you. Never ask your instructor for helpon a problem until you have made a serious effort to solve itby yourself. When you ask, be prepared to show what youtried and how far you got. Bring in your flow charts and freebody diagrams and calculations, including the ones that didn’twork. The more you bring in, the more likely you are to getthe help you need.
TIP 2Read
Some textbooks try to clarify difficult material by givingpractical illustrations and explanations. Check out those partsof your text if you’re having trouble rather than just search-ing for solved examples that look like the homework prob-lems. Another good strategy is to look at a second refer-ence on the same subject—a different text, a handbook,or a Web site. Even if you can’t find the crystal-clear ex-planations and examples you’d like, just reading aboutthe same topic in two different places can make a big dif-ference in understanding.
TIP 3Work with other students
When you work alone and get stuck on something, youmay be tempted to give up, where in a group someone canusually find a way past the difficulty. Working with othersmay also show you better ways to solve problems than theway you have been using. Here are two ideas for makinggroupwork effective.
� Outline problem solutions by yourself first and then workout the details in your group. Someone in every group is gen-erally fastest at figuring out how to start problem solutionsand does it for every problem. If that student isn’t you, youmay have to figure it out for the first time on the test, whichis not a particularly good time to do it. Outlining the solu-tions before meeting with the group is the way to avoid thisdisaster.
� Get group members—especially the weaker ones—to
explain all completed problem solutions before ending aproblem-solving session. If everyone can do that, the ses-sion worked.
TIP 4Consult experts
Sometimes you’ll run into a problem that completely stumpsyou and everyone you’re working with. When practicing en-gineers run into such problems, as they all do occasionally,they consult experts. You also have experts available to you.Your course instructor is an obvious candidate, but that doesn’talways work out. Other potential consultants include gradu-ate teaching assistants, other professors who teach thesame course, students who have previously taken thecourse, smart classmates, and tutors. No matter whom yougo to, though, go early: waiting until two days before thefinal exam probably won’t cut it.
TIP 5Believe that you have what it takes
to be a good engineer.
If this advice is hard for you to take now, you’re probablysuffering from what psychologists refer to as the ImpostorPhenomenon, which is like a tape that plays inside people’sheads. If you’re an engineering student looking around at yourclassmates, the tape goes something like this: “These peopleare good—they understand all this stuff. They really belonghere…but I don’t. Over the years I’ve somehow managed tofool them all—my family, my friends, my teachers. They allthink I’m smart enough to be here, but I know better…andthe very next hard test or hard question I get in class willfinally reveal me as the impostor I am.” And what wouldhappen next is too horrible to contemplate, so at that pointyou just rewind and replay the tape.
What you don’t know is that almost everyone else in theclass is playing the same tape, and the student in the frontrow with the straight-A average is playing it louder than any-one else. Furthermore, the tape is usually wrong. If you sur-vived your first year of engineering school, you almost cer-tainly have what it takes to be an engineer. Just remember allyour predecessors who had the same self-doubts you havenow and did just fine. You do belong here, and you’ll getthrough it just like they did. Try to relax and enjoy the trip.[1]
Sincerely,
Richard Felder
1. For more about student survival skills and the Impostor Phenomenon,see <www.ncsu.edu/felder-public/Student_handouts.html>
All of the Random Thoughts columns are now available on the World Wide Web athttp://www.ncsu.edu/effective_teaching and at http://che.ufl.edu/~cee/
32 Chemical Engineering Education
When I was an undergraduate studying chemical en-gineering, there really was no significant membrane in-dustry worth mentioning. That has certainly changed.Today, the membrane industry has sales of several bil-lion dollars a year. This includes major applications inthe treatment of kidney disease by hemodialysis, theseparation of commodity gases such as oxygen and ni-trogen, the purification of therapeutic proteins and phar-maceuticals, and the treatment and desalination of natu-ral and industrial waters.
About two years ago, the North American MembraneSociety conducted a survey to determine the extent towhich membrane science and technology was coveredin the undergraduate chemical engineering curriculum.This survey revealed a number of programs with sig-nificant membrane-related material, including specificlaboratory experiments, open-ended design problems,and significant sections in both core and elective ChEcourses. In most cases, however, the teaching was doneby only one or two “experts,” typically faculty who hadsignificant personal experience in the membrane field.Departments that had no faculty working on membranestended to have little if any coverage of membrane prob-lems within their undergradute programs.
Motivated in large part by the results of this survey,the Membrane-Based Separations Area and the Educa-tion Division of the AIChE decided to co-sponsor a ses-sion on Membranes in the Chemical Engineering Cur-riculum at the 2001 Annual Meeting. The session wasan enormous success, with a series of fascinating pre-sentations covering a wide range of membrane problemswithin the undergraduate curriculum. The papers pre-sented in this issue of Chemical Engineering Educationare a direct result of this session, and I would like topersonally thank Tim Anderson for his encouragementand support in putting this special issue together.
The papers that follow have been organized “chrono-
logically,” beginning with examples of how to introducemembrane technology in the Introduction to ChemicalEngineering course and then moving through examplesin mass transfer, separations, the undergraduate labora-tory, and senior design. The specific problems/examplescover the full range of membrane applications, includ-ing problems in
1) Design of appropriate hemodialysis therapy for thetreatment of kidney disease
2) Optimization of gas separations using hollow fibermodules
3) Removal of impurities from therapeutic proteins usingmembrane diafiltration
4) Desalination of salt water by reverse osmosis orelectrodialysis
5) Recovery of precious metals from spent catalysts6) Concentration of apple juice using ultrafiltration7) Production of ethylene in a ceramic membrane reactor
Our hope is that these papers will provide faculty withexamples that they can use in their classes so that allchemical engineering undergraduates can be exposed tosome of the important principles and applications ofmembrane technology. The authors have tried, whereverpossible, to provide sufficient details and references sothat faculty can use these examples in their teaching. Inaddition, all of the authors have indicated they would behappy to answer questions about the problems, and sev-eral of the papers contain URLs that provide links tomore detailed descriptions of the process simulators orlab experiments.
The North American Membrane Society (NAMS) willalso be hosting an education section on its website(www.membranes.org), and anyone who is using these(or other) membrane problems within their courses isstrongly encouraged to contact NAMS so that this infor-mation can be disseminated as effectively as possiblethroughout the chemical engineering community.
INTRODUCTIONTO SPECIAL SECTION ON
MEMBRANES INCHEMICAL ENGINEERING EDUCATION
Andrew L. ZydneyThe Pennsylvania State University • University Park, PA 16802
Winter 2003 33
ANALYSIS OFMEMBRANE PROCESSES
In the Introduction-to-ChE Course
ANDREW L. ZYDNEY
University of Delaware • Newark, DE 19716
The introductory course in most chemical engineeringdepartments is designed to meet a broad range of edu-cational goals. They typically include: 1) providing
information that will enable students to determine if chemi-cal engineering is the “correct” major for them; 2) providinga foundation for subsequent courses in the curriculum; and3) teaching significant chemical engineering principles, par-ticularly in the area of mass balances.[1] Traditional introduc-tory courses, e.g., those based on the classical book by Felderand Rousseau,[2] focus primarily on the use of steady-statemass (and energy) balances to describe the behavior of a widerange of chemical processes. These courses often include asmall section on transient processes at the end of the semes-ter, such as Chapter 11 in the Felder and Rousseau[2] text orChapter 7 of Himmelblau.[3] Russell and Denn[4] take a verydifferent approach, emphasizing transient balance equationsright from the beginning. This approach has the advantage ofallowing the instructor to focus on the key concepts of “rate”and characteristic times, an aspect that is often lost in coursesthat emphasize steady-state processes.
One of the challenges of introducing students to transientmass balances is a lack of interesting and effective problemsthat analyze the behavior of non-reacting systems (batch re-actor problems provide a very effective introduction to time-dependent reacting systems). Russell and Denn[4] devote morethan an entire chapter to the analysis of draining and fillingtanks—a problem that illustrates the important concepts butone that generates very little excitement and enthusiasmamong the students. Himmelblau[3] also uses the tank drain-ing problem as a primary example, along with problems ondiluting a salt solution with water. Felder and Rousseau[2] tryto make the tank draining problem a little more interestingby examining the water level in a reservoir during a period ofdrought and the water volume in a storage tank that has aleak. But students often see these problems as artificial, inpart because of the seemingly arbitrary functions given
for the rate of inflow and outflow, and they provide littleopportunity for the students to think about process designconsiderations.
The University of Delaware uses the text by Russell andDenn[4] as the basis for its introductory chemical engineeringcourse, which is taught in the spring semester of the fresh-man year. The course is divided into three main sections:
• Transient mass balances in nonreacting systems• Transient mass balances in reacting systems, including the
analysis of batch reactors and CSTRs• Interfacial mass transfer
The traditional material in this course has been supplementedwith a series of membrane problems specifically designed toillustrate the key concepts involved in the analysis of tran-sient mass balances. These membrane problems are “real,”they are easy for students to relate to, they tend to be muchmore interesting than the traditional tank draining and fillingproblem, they provide a much better introduction to the rangeof problems and application areas of interest to chemical en-gineers, and they give students an opportunity to think aboutreal design issues, even when they are freshmen.
APPLE JUICE CONCENTRATIONUSING REVERSE OSMOSIS
Apple juice can be concentrated by a reverse osmosis sytem
© Copyright ChE Division of ASEE 2003
Andrew Zydney is currently Professor andEndowed Chair in the Department of Chemi-cal Engineering at The Pennsylvania State Uni-versity. He received his PhD from MIT in 1985and was a faculty member at the University ofDelaware from 1985 to 2001. He has beenactively involved in membrane research formore than twenty years, with emphasis on bio-technological and biomedical applications.
Membranes in ChE Education

34 Chemical Engineering Education
Figure 1. Fed-batch system for producing apple juiceconcentrate.
Membranes in ChE Education
using the fed-batch process shown in Figure 1. Fresh juice isfed to a recycle tank, with the juice from the recycle tankthen passing through the reverse osmosis unit where water isremoved through the membrane. The concentrated juice isreturned to the recycle tank—the system is designed to oper-ate so that the volume in the recycle tank remains constantthroughout the process. At the end of the process, a concen-trated juice product is obtained in the recycle tank. It can befrozen and sold as “apple juice concentrate” or the concen-trated juice can be shipped and then reconstituted at a remotesite by simply adding water. This latter process can lead tosignificant cost-savings since a much smaller volume of juiceneeds to be shipped across the country. One of the concernswith this process is that the membrane is never “perfect,”meaning that there will be a small loss of flavor componentsthrough the membrane during the concentration process. Thisis why many juice companies will specifically advertise onthe label that their juice is “not from concentrate.” Cheryanand Alvarez[5] provide a more detailed discussion of mem-brane processes for juice concentration.
The goal of the problem is to evaluate the fraction of flavorcomponents that are lost during a process designed to take10,000 L of fresh juice and produce 500 L of apple juice con-centrate. To simplify the analysis, we assume that the con-centration of flavor components in the filtrate stream collectedthrough the membrane is equal to a certain fraction (S) of theflavor concentration in the stream that enters the membraneunit. This latter assumption is simply the definition of themembrane sieving coefficient. This type of constitutive rela-tion must be determined experimentally, playing a role analo-gous to the rate expression in batch reactor problems.[4]
The problem is solved by writing both total and compo-nent mass balances around the recycle tank and the reverseosmosis unit (shown by the dashed line in Figure 1):
d V
dtQ Q
d VC
dtQ C SQ C
feed feed filtrate filtrate
feed feed filtrate
ρρ ρ
( )= − ( )
( ) = − ( )
1
2
where C is the concentration of the flavor components in thefeed tank. If we make the assumption of a constant (uniform)density, then the total mass balance simply reduces toQ
filtrate=Q
feed since V is constant. This conclusion is also valid
for a juice in which the density is a linear function of theflavor concentration.[4] The component mass balance is thenreadily integrated to give
lnC SC
S C
SQ t
Vfeed
feed
feed−−( )
= −
( )
13
where the concentration of flavor components in the recycletank at the start of the process is equal to C
feed. This equation
can be easily solved for the final concentration of flavor com-ponents, with t evaluated as the time required to process10,000 L of juice (or in this case, to add 9,500 L of juice tothe 500 L initially present in the recycle tank). The overallflavor recovery is then evaluated as the ratio of the final massof flavor components in the juice (VC
final) to the initial mass
of flavor components
Recov
exp
eryVC
V C
V V S SV V
V
SVfinal
total feed
total
total= =
− −( ) −−
( )
1
4
where Vtotal
is the total amount of juice (in this case, 10,000L).
In addition to solving the mass balance equations, there area number of interesting design issues that the students canbegin to think about, such as what would happen to the finalconcentration of flavor components in the recycle tank if itwere poorly mixed. For example, if the recycle stream is re-turned to the top of the recycle tank, then the concentrationof flavor components will be lower in the bottom of the tank(near the tank exit), which will reduce the amount of flavorthat is lost through the membrane. Although this situationcannot be modeled quantitatively this early in the curricu-lum, the qualitative behavior of the system is quite easy toexplain. The discussion of mixing provides a great opportu-nity for the instructor to talk about the residence time in therecycle tank and the different design approaches that can beused to achieve good mixing in a large tank.
The students can also be asked to consider what (if any)difference would occur if the juice concentration were ac-complished using a batch process instead of the fed-batchsystem shown in Figure 1. In this case, all of the juice isplaced in a single large tank, the feed stream entering the
Winter 2003 35
Membranes in ChE Education
The traditional material inthis course has been supplemented with
a series of membrane problems specificallydesigned to illustrate the key concepts
involved in the analysis of transientmass balances.
tank is eliminated, and the volume in the tank decreases withtime as fluid is removed through the membrane. This prob-lem can either be analyzed qualitatively based on physicalinsights about the batch process, or the students can developand solve the mass balance equations for the batch system(easily assigned as a homework problem after presenting thefed-batch analysis in class). The final expression for the fla-vor recovery in the batch system is simply
RecoveryV
Vfinal
initial
S
=
( )5
It is relatively easy to show that there is always less flavorlost using the batch process. This is because the concentra-tion of flavor components in the recycle tank in the fed-batchprocess increases much more rapidly than that in the batchsystem due to the smaller volume in the recycle tank, leadingto a greater passage of flavor components through the mem-brane. Given that result, the students can think about whyone might still decide to use a fed-batch process for the juiceconcentration. One practical reason is that it can be difficultto maintain a well-mixed solution as one goes from an initialvolume of 10,000 L to a final volume of 500 L in the batchprocess. The lack of mixing not only affects the flavor loss, italso affects the filtrate flow rate that can be achieved in themembrane unit. The batch process also requires the use of avery large (and expensive) feed tank. In addition, the fed-batch process provides greater design flexibility for use inmultiple processes in a single commercial facility.
IMPURITY REMOVAL FROMRECOMBINANT THERAPEUTIC PROTEINS
The biotechnology industry now produces a wide range oftherapeutic proteins using recombinant gene technology. TheDNA of interest is cloned into an appropriate microorganismor mammalian cell line, enabling those cells to produce thedesired protein using their natural metabolic processes. Cur-rent commercial recombinant products include: insulin forthe treatment of diabetes, tissue plasminogen activator usedas an anti-clotting agent for the treatment of stroke and heartattack, human growth hormone for the treatment of dwarf-ism, and erythropoietin as a red blood cell stimulating agentfor the treatment of anemia. A nice review of recombinantgene technology is provided by Glick and Pasternak.[6]
One of the critical issues in the production of therapeuticproteins is the high degree of purification that must beachieved, particularly since these molecules are typicallygiven directly into the bloodstream by intravenous injection.The bulk of the purification is typically done using some com-bination of affinity, ion exchange, and/or hydrophobic inter-
action chromatography. Small impurities (e.g., buffer com-ponents and excess salt), however, are generally removedby membrane diafiltration. Van Reis and Zydney[7] pro-vide a nice review of the principles of diafiltration forbioprocessing applications.
The diafiltration process looks very similar to the applejuice concentration shown in Figure 1. The membrane isnearly fully retentive to the protein of interest, but allowsrelatively unhindered passage of the small impurity throughthe membrane. The solution containing the therapeutic pro-tein is contained in the recycle tank, and a protein- and impu-rity-free buffer solution is continually added to the tank tomaintain a constant solution volume while the impurity iswashed through the membrane.
The transient mass balance for the constant volumediafiltration process is
VdC
dtSQ Cfiltrate= − ( )6
where S, the membrane sieving coefficient, is equal to theratio of the impurity concentration in the filtrate solution tothat in the feed. Equation (6) can be integrated to give a simpledecaying exponential relating the impurity concentration attime t to the initial concentration of the impurity in the pro-tein solution. The results are more conveniently expressed interms of the total volume of protein-free buffer that must beused to reduce the impurity concentration to a desired targetlevel
C
C
SV
Vfinal
initial
buffer= −
( )exp 7
The membrane diafiltration can be used in combination withan ultrafiltration process to achieve protein concentration andimpurity removal in a single processing step.[7]
This same diafiltration process is also used as part of a vi-ral inactivation step. For example, an appropriate solvent ordetergent is first added to the protein solution to achieve aconcentration that is sufficient to inactivate nearly all viruses.The solvent/detergent is then removed by diafiltration, typi-cally to a target of less than 10 ppm (parts per million). Thisis an ideal opportunity to talk about product safety issues,
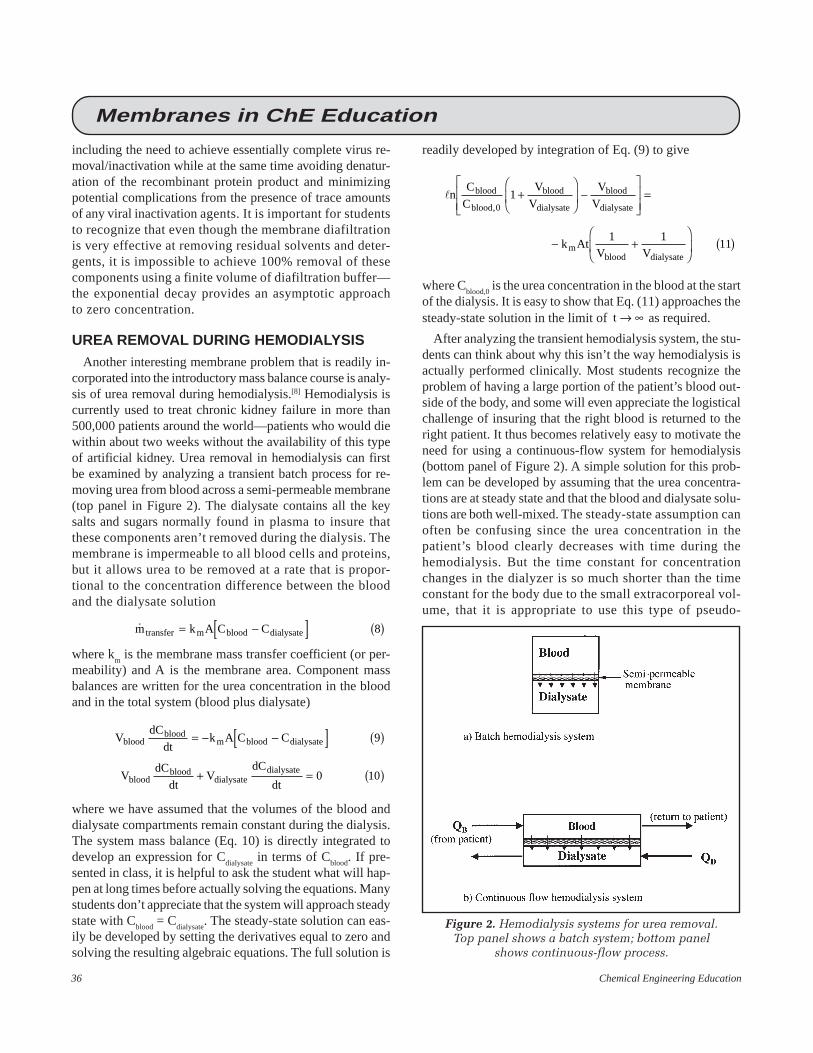
36 Chemical Engineering Education
Figure 2. Hemodialysis systems for urea removal.Top panel shows a batch system; bottom panel
shows continuous-flow process.
Membranes in ChE Education
including the need to achieve essentially complete virus re-moval/inactivation while at the same time avoiding denatur-ation of the recombinant protein product and minimizingpotential complications from the presence of trace amountsof any viral inactivation agents. It is important for studentsto recognize that even though the membrane diafiltrationis very effective at removing residual solvents and deter-gents, it is impossible to achieve 100% removal of thesecomponents using a finite volume of diafiltration buffer—the exponential decay provides an asymptotic approachto zero concentration.
UREA REMOVAL DURING HEMODIALYSISAnother interesting membrane problem that is readily in-
corporated into the introductory mass balance course is analy-sis of urea removal during hemodialysis.[8] Hemodialysis iscurrently used to treat chronic kidney failure in more than500,000 patients around the world—patients who would diewithin about two weeks without the availability of this typeof artificial kidney. Urea removal in hemodialysis can firstbe examined by analyzing a transient batch process for re-moving urea from blood across a semi-permeable membrane(top panel in Figure 2). The dialysate contains all the keysalts and sugars normally found in plasma to insure thatthese components aren’t removed during the dialysis. Themembrane is impermeable to all blood cells and proteins,but it allows urea to be removed at a rate that is propor-tional to the concentration difference between the bloodand the dialysate solution
m k A C Ctransfer m blood dialysate= −[ ] ( )8
where km is the membrane mass transfer coefficient (or per-
meability) and A is the membrane area. Component massbalances are written for the urea concentration in the bloodand in the total system (blood plus dialysate)
VdC
dtk A C C
VdC
dtV
dC
dt
bloodblood
m blood dialysate
bloodblood
dialysatedialysate
= − −[ ] ( )
+ = ( )
9
0 10
where we have assumed that the volumes of the blood anddialysate compartments remain constant during the dialysis.The system mass balance (Eq. 10) is directly integrated todevelop an expression for C
dialysate in terms of C
blood. If pre-
sented in class, it is helpful to ask the student what will hap-pen at long times before actually solving the equations. Manystudents don’t appreciate that the system will approach steadystate with C
blood = C
dialysate. The steady-state solution can eas-
ily be developed by setting the derivatives equal to zero andsolving the resulting algebraic equations. The full solution is
readily developed by integration of Eq. (9) to give
lnC
C
V
V
V
V
k AtV V
blood
blood
blood
dialysate
blood
dialysate
mblood dialysate
,01
1 111
+
−
=
− +
( )
where Cblood,0
is the urea concentration in the blood at the startof the dialysis. It is easy to show that Eq. (11) approaches thesteady-state solution in the limit of t → ∞ as required.
After analyzing the transient hemodialysis system, the stu-dents can think about why this isn’t the way hemodialysis isactually performed clinically. Most students recognize theproblem of having a large portion of the patient’s blood out-side of the body, and some will even appreciate the logisticalchallenge of insuring that the right blood is returned to theright patient. It thus becomes relatively easy to motivate theneed for using a continuous-flow system for hemodialysis(bottom panel of Figure 2). A simple solution for this prob-lem can be developed by assuming that the urea concentra-tions are at steady state and that the blood and dialysate solu-tions are both well-mixed. The steady-state assumption canoften be confusing since the urea concentration in thepatient’s blood clearly decreases with time during thehemodialysis. But the time constant for concentrationchanges in the dialyzer is so much shorter than the timeconstant for the body due to the small extracorporeal vol-ume, that it is appropriate to use this type of pseudo-

Winter 2003 37
Membranes in ChE Education
steady-state approximation. The final result is
C
C
Qk A
Q
Qk A
Qk A
Bout
Bin
Bm
D
Bm
Dm
=+
+
+( )
1
1
12
where CBout
and CBin
are the urea concentrations in the bloodleaving and entering the dialyzer, and Q
B and Q
D are the
blood and dialysate flow rates. More sophisticated solu-tions can be developed for countercurrent flow if the stu-dents are able to handle the concepts and mathematicsrequired for analysis of the position-dependent differen-tial mass balances in this system.[8]
Although the well-mixed analysis provides a simple ana-lytical expression, most students don’t immediately appreci-ate the implications of the final result. For example, the analy-sis clearly shows that the outlet urea concentration in the blooddoesn’t go to zero as the membrane area becomes infinite. Inaddition, this equation seems to imply that increasing theblood flow rate is detrimental since it increases the urea con-centration in the blood stream that is returned to the patient(although it also increases the rate of urea removal from thebody). This leads nicely into a discussion of the key designcriteria for the dialyzer.
It is also relatively easy to couple analysis of thehemodialyzer with the transient mass balances describing theurea concentration within the body (treated as a well-mixed“tank”). The resulting equations can be used to examine theperformance of a clinical dialysis session at reducing the ureaconcentration to a safe level. Current clinical practice is forpatients with complete kidnez•¶ailure to undergo four-hourdialysis sessions three times a week, 52 weeks a year. Thetotal cost of providing hemodialysis in the United States isapproximately $15 billion per year, essentially all of whichis paid by the Federal government. This is a great opportu-nity for a discussion about some of the ethical and economicissues involved in the development and delivery of expen-sive new medical technologies, an issue that is likely to be-come even more important in the coming years.
Another hemodialysis design issue that can be worth dis-cussing is the importance of minimizing the extracorporealblood volume while maintaining a large surface area for masstransfer. Current clinical dialyzers use a parallel array of morethan 10,000 narrow hollow fiber membranes (inner diameterof about 200 µm) to achieve a surface area of close to twosquare meters. Smaller diameter fibers, approaching the 6-8µm diameter of the blood capillaries within the kidney, wouldfurther increase the ratio of surface area to blood volume.Blood clotting becomes a major problem in these very nar-
row fibers, however, even in the presence of a strong anti-coagulant like heparin. This leads nicely into a discussion ofbiomaterials and some of the issues involved in the develop-ment of truly biocompatible polymeric materials that stillmaintain the desired mechanical and mass transport charac-teristics needed for this type of biomedical device.
SUMMARYThe membrane problems described in this paper provide
an attractive set of examples for introducing students to keyconcepts in the analysis of transient material balances in non-reacting systems. Related problems can also be developedfor the analysis of gas separation membrane processes (e.g.,the production of oxygen from air) and on the behavior ofmembrane reactors (e.g., the use of palladium membranes toremove hydrogen and thereby improve product yield in equi-librium-limited dehydrogenation reactions).
All of these membrane problems are of real commercialinterest, they provide students some exposure to new appli-cation areas of chemical engineering, and they give the in-structor an opportunity to introduce basic concepts of pro-cess design at a very early stage in the curriculum.
Student response to these problems in the Introduction toChemical Engineering course at the University of Delawarehas been outstanding. They definitely appreciate being ableto analyze real-world problems even as freshmen, and theyclearly enjoy the opportunity to begin thinking about processdesign issues. In addition, these membrane examples givestudents a perspective into the kinds of problems and pro-cesses that they will encounter throughout their undergradu-ate chemical engineering education.
REFERENCES1. Solen, K.A., and J. Harb, “An Introductory ChE Course for First-Year
Students,” Chem. Eng. Ed., 32(1), 52 (1998)2. Felder, R.M., and R.W. Rousseau, Elementary Principles of Chemical
Processes, 3rd ed., John Wiley & Sons, Inc., New York, NY (2000)3. Himmelblau, D.M., Basic Principles and Calculations in Chemical
Engineering, 6th ed., Prentice Hall, Upper Saddle River, NJ (1996)4. Russell, T.W.F., and M.M. Denn, Introduction to Chemical Engineer-
ing Analysis, John Wiley & Sons, Inc., New York, NY (1972)5. Cheryan, M., and J. Alvarez, “Food and Beverage Industry Applica-
tions,” in Membrane Separations Technology: Principles and Appli-cations, R.D. Noble and S. A. Sterns, eds., Elsevier, Amsterdam (1995)
6. Glock, B.R., and J.J. Pasternak, Molecular Biotechnology: Principlesand Applications of Recombinant DNA, 2nd ed., American Society forMicrobiology Press, Washington, DC (1998)
7. van Reis, R., and A.L. Zydney, “Protein Ultrafiltration,” in Encyclo-pedia of Bioprocess Technology: Fermentation, Biocatalysis, andBioseparation, M.C. Flickinger and S.W. Drew, eds., pp 2197-2214,John Wiley & Sons, Inc., New York, NY (1999)
8. Galletti, P.M., C.K. Colton, and M.J. Lysaght, “Artificial Kidney,” inThe Biomedical Engineering Handbook, Vol. II, 2nd ed., J.D. Bronzino,ed., CRC Press, Boca Raton, FL (2000) ❐

38 Chemical Engineering Education
A PRESS RO SYSTEMAn Interdisciplinary Reverse Osmosis Project
for First-Year Engineering Students
S. SCOTT MOOR, EDMOND P. SALIKLIS, SCOTT R. HUMMEL, YIH-CHOUNG YU
Lafayette College • Easton, PA 18042
Attempting to create a project that includes chemical,civil, electrical, and mechanical engineering is a chal-lenging task. At Lafayette College we try to include
such a project in our Introduction to Engineering course.While finding electro-mechanical projects is relatively easy,it is difficult to include the process nature of chemical engi-neering in projects that are typically product oriented.
Among engineering programs that use an introduction-to-engineering course, a wide range of projects and laboratoriesis used. At the 2002 ASEE annual meeting, several mechani-cal or electro-mechanical projects were described, includinga sundial, wind power for a ski resort public-transit system,and an orbital sander.[1-3] At Rowan University, the FreshmanClinic provides a year-long lab experience withmultidisciplinary experiments that use measurement as thetheme.[4,5] They use a wide range of approaches and projects,including reverse engineering, engineering analysis of thehuman body,[6] and the production of beer.[7] Recently, theyincluded a project that involves using a membrane fuel cellto charge batteries for a LEGO® Mindstorms robot.[8]
Many programs rotate through several different labs thatillustrate different disciplines in order to include chemicalengineering. At Notre Dame, a year-long introductory courseuses four projects with the LEGO Mindstorms brick—con-trol of pH is one of these four projects.[9] North Carolina Stateuses a series of laboratories, one of which is a reverse osmo-sis experiment.[10] At Virginia Tech several laboratories andprojects are used with one laboratory being focused on asimple mass balance,[11] while Drexel University’s E4 programuses a laboratory focused on measurements to introduce stu-dents to engineering.[12] The environmental engineering pro-gram at the University of Dayton uses a sand-and-charcoalfilter where students analyze both the filtration process and
the support structure.[13] In very few cases does one projectinclude concepts from both chemical engineering and otherbranches of engineering.
For many years, C.S. Slater (Rowan University) has devel-oped and advocated several reverse osmosis experimentsbased on PUR brand portable RO systems.[5,14] Both the Uni-versity of Minnesota at Duluth and Manhattan College havealso developed laboratories based on the PUR systems.[15,16]
We have developed a project based on a simple dead-endreverse osmosis (RO) test system at Lafayette College. Theequipment consists of a cylindrical vessel with a small pis-ton-and-lever arm used to create the pressure. Each disci-pline examines different issues with the device: in the chemi-
S. Scott Moor is Assistant Professor of Chemical Engineering at LafayetteCollege. He received a BS and MS in Chemical Engineering from M.I.T.in 1978. After a decade in industry he returned to academia at the Uni-versity of California, Berkeley, where he received a PhD in Chemical En-gineering and an MA in Statistics in 1995. His current research focuseson educational materials development and on the visualization of fluidand transport dynamics in Wurster coating, in fluidized beds, and in spraydrying.Edmond Saliklis is Assistant Professor in the Department of Civil andEnvironmental Engineering at Lafayette College. He received his BS fromthe University of Illinois-Chicago in 1984, his MS from Syracuse Univer-sity in 1988, and his PhD from the University of Wisconsin-Madison in1992, all in Civil Engineering. His current research focuses on the me-chanics of thin wood-based plates and thin concrete and masonry shells.Scott Hummel is Assistant Professor of Mechanical Engineering atLafayette College. He earned a BS at the University of Hartford in 1988,an MS at Stevens Institute of Technology in 1996, and a PhD at LehighUniversity in 1998. His current research focuses on the wear propertiesof nonlubricated stainless steel components and on the LENS rapidprototyping process.Yih-Choung Yu is Assistant Professor of Electrical and Computer Engi-neering at Lafayette College. He received a BSEE degree from ChineseCulture University in Taipei, Taiwan, in 1987, an MSEE degree from theState University of New York at Binghamton in 1992, and a PhD degreefrom the University of Pittsburgh. His research interests include controlapplications for bioengineering and medical device development.
© Copyright ChE Division of ASEE 2003
Membranes in ChE Education
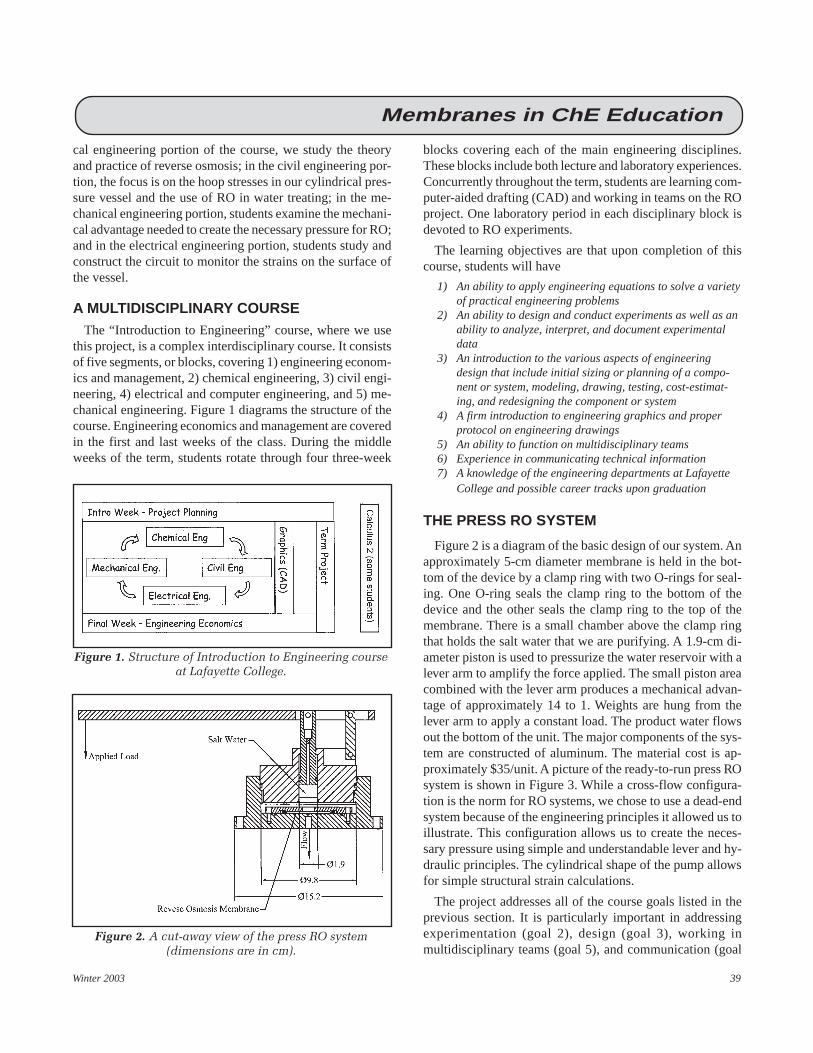
Winter 2003 39
cal engineering portion of the course, we study the theoryand practice of reverse osmosis; in the civil engineering por-tion, the focus is on the hoop stresses in our cylindrical pres-sure vessel and the use of RO in water treating; in the me-chanical engineering portion, students examine the mechani-cal advantage needed to create the necessary pressure for RO;and in the electrical engineering portion, students study andconstruct the circuit to monitor the strains on the surface ofthe vessel.
A MULTIDISCIPLINARY COURSEThe “Introduction to Engineering” course, where we use
this project, is a complex interdisciplinary course. It consistsof five segments, or blocks, covering 1) engineering econom-ics and management, 2) chemical engineering, 3) civil engi-neering, 4) electrical and computer engineering, and 5) me-chanical engineering. Figure 1 diagrams the structure of thecourse. Engineering economics and management are coveredin the first and last weeks of the class. During the middleweeks of the term, students rotate through four three-week
Figure 1. Structure of Introduction to Engineering courseat Lafayette College.
blocks covering each of the main engineering disciplines.These blocks include both lecture and laboratory experiences.Concurrently throughout the term, students are learning com-puter-aided drafting (CAD) and working in teams on the ROproject. One laboratory period in each disciplinary block isdevoted to RO experiments.
The learning objectives are that upon completion of thiscourse, students will have
1) An ability to apply engineering equations to solve a varietyof practical engineering problems
2) An ability to design and conduct experiments as well as anability to analyze, interpret, and document experimentaldata
3) An introduction to the various aspects of engineeringdesign that include initial sizing or planning of a compo-nent or system, modeling, drawing, testing, cost-estimat-ing, and redesigning the component or system
4) A firm introduction to engineering graphics and properprotocol on engineering drawings
5) An ability to function on multidisciplinary teams6) Experience in communicating technical information7) A knowledge of the engineering departments at Lafayette
College and possible career tracks upon graduation
THE PRESS RO SYSTEM
Figure 2 is a diagram of the basic design of our system. Anapproximately 5-cm diameter membrane is held in the bot-tom of the device by a clamp ring with two O-rings for seal-ing. One O-ring seals the clamp ring to the bottom of thedevice and the other seals the clamp ring to the top of themembrane. There is a small chamber above the clamp ringthat holds the salt water that we are purifying. A 1.9-cm di-ameter piston is used to pressurize the water reservoir with alever arm to amplify the force applied. The small piston areacombined with the lever arm produces a mechanical advan-tage of approximately 14 to 1. Weights are hung from thelever arm to apply a constant load. The product water flowsout the bottom of the unit. The major components of the sys-tem are constructed of aluminum. The material cost is ap-proximately $35/unit. A picture of the ready-to-run press ROsystem is shown in Figure 3. While a cross-flow configura-tion is the norm for RO systems, we chose to use a dead-endsystem because of the engineering principles it allowed us toillustrate. This configuration allows us to create the neces-sary pressure using simple and understandable lever and hy-draulic principles. The cylindrical shape of the pump allowsfor simple structural strain calculations.
The project addresses all of the course goals listed in theprevious section. It is particularly important in addressingexperimentation (goal 2), design (goal 3), working inmultidisciplinary teams (goal 5), and communication (goal
Figure 2. A cut-away view of the press RO system(dimensions are in cm).
Membranes in ChE Education

40 Chemical Engineering Education
Membranes in ChE Education
Figure 3. A press RO system ready to run.
6). It also provides concrete examples of the application ofeach of the engineering disciplines (goal 7). It is hoped thatthe project will be interesting, enjoyable, and accessible toour first-year students.
CHEMICAL ENGINEERING BLOCKThis project provides a wealth of chemical engineering top-
ics, including osmotic pressure, equilibrium, flux, rate basedseparation, and fluid processing. The general concepts of os-motic pressure and solution equilibrium are discussed. Thevan’t Hoff equation is used to estimate osmotic pressure
∏ = ( )CRT 1
where II is the osmotic pressure, C is the molar concentra-tion of ions, R is the universal gas constant, and T is the ab-solute temperature. This equation assumes a dilute ideal so-lution that follows Raoult’s law. For the solutions, we areusing (0-14 g/l NaCl), the van’t Hoff equation predicts 3-5%high and is adequate for our needs.[17] Wankat presents thetheory for more accurate estimations of osmotic pressure forother situations.[18]
There is some disagreement on the exact mechanism forreverse osmosis, but the solution-diffusion theory is the mostwidely accepted.[18,19] In this picture of membrane function,the membrane has no true pores. Rather, the membrane istreated as a separate phase. The solvent and solute dissolvein and diffuse through the membrane.
Students are then introduced to the concept of flux and itsproportionality to driving force. We present the simplifiedcase of the driving force as the pressure above osmotic. Theresulting equation for flux is
Jq
SA P IIw = = −( ) ( )∆ ∆σ 2
where Jw is the volumetric flux of water through the mem-
brane, q is the total flow through the membrane, A is the wa-ter permeability constant, σ is the Staverman coefficient, Sis the membrane area, and ∆P is the applied pressure acrossthe membrane.[19] Assuming that the Staverman coefficientequals one in Eq. (2) implies that the solute is perfectly ex-cluded. This is a simplification of the real case, but it is fre-quently used.[5,17,18,20]
Equation (3) shows a simple and common model for thesolute (salt) flux through the membrane under a concentra-tion gradient:
J B C Cs feed product= −( ) ( )3
where Js is the molar flux of solvent, B is the salt permeabil-
ity constant, and the driving force (Cfeed
- Cproduct
) is the saltconcentration difference across the membrane. Again, a more
complete version of the theory would include a second re-flection coefficient.[19] Using the first two equations, studentsare able to complete a design problem determining a pres-sure drop and membrane area that will meet a given purifica-tion need. For these simple first-pass sizing problems, weassume that the solute flux will be negligible.
The concepts behind these equations and their simplifica-tions are explained to the students. We then ask them to evalu-ate how well these concepts (particularly the simplifications)are playing out in our experimental system. A short sectionin Perry’s on reverse osmosis and nanofiltration provides somehelpful conceptual background in a brief presentation.[20] Theissues considered include the nature of membranes, recov-ery, concentration polarization, pretreatment, rate-based sepa-rations, and cartridge configurations.
Concentration polarization is a particularly important is-sue. The salt concentration near the membrane is increasedbecause salt is being transported to the membrane by bulkflow, but then it is being retained by the membrane. This in-crease in concentration near the membrane affects the os-motic pressure and the potential flux of solute. A mass diffu-sion model is required to estimate this effect.[18,21-23]
Students experiment on the press RO system, examiningthe impact of pressure and salt concentration on the purifiedwater flow rate. They determine the water permeability con-
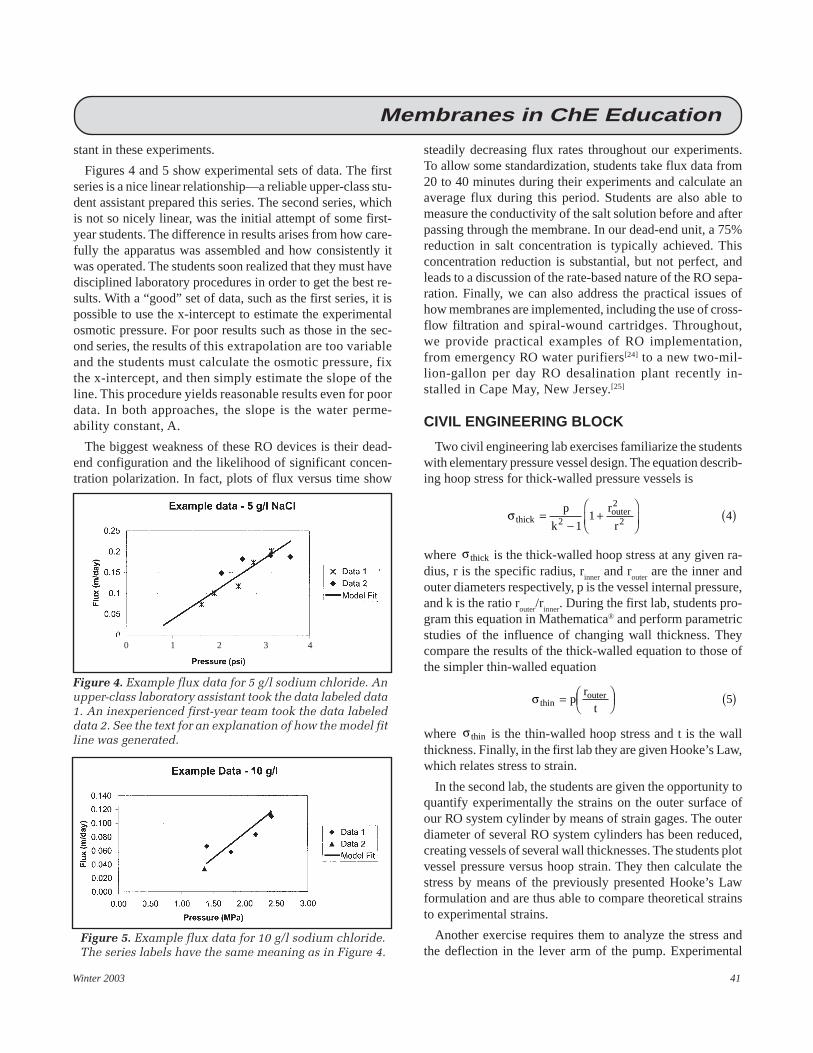
Winter 2003 41
Membranes in ChE Education
Figure 4. Example flux data for 5 g/l sodium chloride. Anupper-class laboratory assistant took the data labeled data1. An inexperienced first-year team took the data labeleddata 2. See the text for an explanation of how the model fitline was generated.
Figure 5. Example flux data for 10 g/l sodium chloride.The series labels have the same meaning as in Figure 4.
stant in these experiments.
Figures 4 and 5 show experimental sets of data. The firstseries is a nice linear relationship—a reliable upper-class stu-dent assistant prepared this series. The second series, whichis not so nicely linear, was the initial attempt of some first-year students. The difference in results arises from how care-fully the apparatus was assembled and how consistently itwas operated. The students soon realized that they must havedisciplined laboratory procedures in order to get the best re-sults. With a “good” set of data, such as the first series, it ispossible to use the x-intercept to estimate the experimentalosmotic pressure. For poor results such as those in the sec-ond series, the results of this extrapolation are too variableand the students must calculate the osmotic pressure, fixthe x-intercept, and then simply estimate the slope of theline. This procedure yields reasonable results even for poordata. In both approaches, the slope is the water perme-ability constant, A.
The biggest weakness of these RO devices is their dead-end configuration and the likelihood of significant concen-tration polarization. In fact, plots of flux versus time show
steadily decreasing flux rates throughout our experiments.To allow some standardization, students take flux data from20 to 40 minutes during their experiments and calculate anaverage flux during this period. Students are also able tomeasure the conductivity of the salt solution before and afterpassing through the membrane. In our dead-end unit, a 75%reduction in salt concentration is typically achieved. Thisconcentration reduction is substantial, but not perfect, andleads to a discussion of the rate-based nature of the RO sepa-ration. Finally, we can also address the practical issues ofhow membranes are implemented, including the use of cross-flow filtration and spiral-wound cartridges. Throughout,we provide practical examples of RO implementation,from emergency RO water purifiers[24] to a new two-mil-lion-gallon per day RO desalination plant recently in-stalled in Cape May, New Jersey.[25]
CIVIL ENGINEERING BLOCK
Two civil engineering lab exercises familiarize the studentswith elementary pressure vessel design. The equation describ-ing hoop stress for thick-walled pressure vessels is
σ thickouterp
k
r
r=
−+
( )2
2
211 4
where σ thick is the thick-walled hoop stress at any given ra-dius, r is the specific radius, r
inner and r
outer are the inner and
outer diameters respectively, p is the vessel internal pressure,and k is the ratio r
outer/r
inner. During the first lab, students pro-
gram this equation in Mathematica® and perform parametricstudies of the influence of changing wall thickness. Theycompare the results of the thick-walled equation to those ofthe simpler thin-walled equation
σ thinouterp
r
t=
( )5
where σ thin is the thin-walled hoop stress and t is the wallthickness. Finally, in the first lab they are given Hooke’s Law,which relates stress to strain.
In the second lab, the students are given the opportunity toquantify experimentally the strains on the outer surface ofour RO system cylinder by means of strain gages. The outerdiameter of several RO system cylinders has been reduced,creating vessels of several wall thicknesses. The students plotvessel pressure versus hoop strain. They then calculate thestress by means of the previously presented Hooke’s Lawformulation and are thus able to compare theoretical strainsto experimental strains.
Another exercise requires them to analyze the stress andthe deflection in the lever arm of the pump. Experimental
0 1 2 3 4
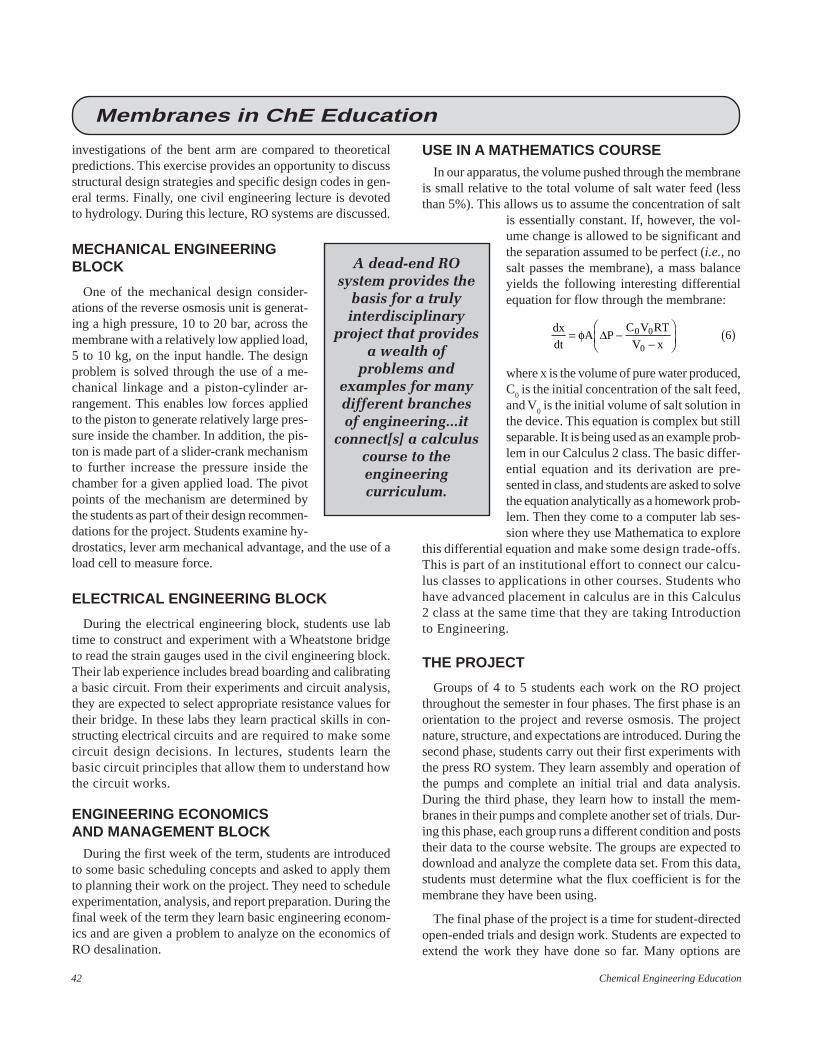
42 Chemical Engineering Education
Membranes in ChE Education
investigations of the bent arm are compared to theoreticalpredictions. This exercise provides an opportunity to discussstructural design strategies and specific design codes in gen-eral terms. Finally, one civil engineering lecture is devotedto hydrology. During this lecture, RO systems are discussed.
MECHANICAL ENGINEERINGBLOCK
One of the mechanical design consider-ations of the reverse osmosis unit is generat-ing a high pressure, 10 to 20 bar, across themembrane with a relatively low applied load,5 to 10 kg, on the input handle. The designproblem is solved through the use of a me-chanical linkage and a piston-cylinder ar-rangement. This enables low forces appliedto the piston to generate relatively large pres-sure inside the chamber. In addition, the pis-ton is made part of a slider-crank mechanismto further increase the pressure inside thechamber for a given applied load. The pivotpoints of the mechanism are determined bythe students as part of their design recommen-dations for the project. Students examine hy-drostatics, lever arm mechanical advantage, and the use of aload cell to measure force.
ELECTRICAL ENGINEERING BLOCK
During the electrical engineering block, students use labtime to construct and experiment with a Wheatstone bridgeto read the strain gauges used in the civil engineering block.Their lab experience includes bread boarding and calibratinga basic circuit. From their experiments and circuit analysis,they are expected to select appropriate resistance values fortheir bridge. In these labs they learn practical skills in con-structing electrical circuits and are required to make somecircuit design decisions. In lectures, students learn thebasic circuit principles that allow them to understand howthe circuit works.
ENGINEERING ECONOMICSAND MANAGEMENT BLOCK
During the first week of the term, students are introducedto some basic scheduling concepts and asked to apply themto planning their work on the project. They need to scheduleexperimentation, analysis, and report preparation. During thefinal week of the term they learn basic engineering econom-ics and are given a problem to analyze on the economics ofRO desalination.
USE IN A MATHEMATICS COURSEIn our apparatus, the volume pushed through the membrane
is small relative to the total volume of salt water feed (lessthan 5%). This allows us to assume the concentration of salt
is essentially constant. If, however, the vol-ume change is allowed to be significant andthe separation assumed to be perfect (i.e., nosalt passes the membrane), a mass balanceyields the following interesting differentialequation for flow through the membrane:
dx
dtA P
C V RT
V x= −
−
( )φ ∆ 0 0
06
where x is the volume of pure water produced,C
0 is the initial concentration of the salt feed,
and V0 is the initial volume of salt solution in
the device. This equation is complex but stillseparable. It is being used as an example prob-lem in our Calculus 2 class. The basic differ-ential equation and its derivation are pre-sented in class, and students are asked to solvethe equation analytically as a homework prob-lem. Then they come to a computer lab ses-sion where they use Mathematica to explore
this differential equation and make some design trade-offs.This is part of an institutional effort to connect our calcu-lus classes to applications in other courses. Students whohave advanced placement in calculus are in this Calculus2 class at the same time that they are taking Introductionto Engineering.
THE PROJECT
Groups of 4 to 5 students each work on the RO projectthroughout the semester in four phases. The first phase is anorientation to the project and reverse osmosis. The projectnature, structure, and expectations are introduced. During thesecond phase, students carry out their first experiments withthe press RO system. They learn assembly and operation ofthe pumps and complete an initial trial and data analysis.During the third phase, they learn how to install the mem-branes in their pumps and complete another set of trials. Dur-ing this phase, each group runs a different condition and poststheir data to the course website. The groups are expected todownload and analyze the complete data set. From this data,students must determine what the flux coefficient is for themembrane they have been using.
The final phase of the project is a time for student-directedopen-ended trials and design work. Students are expected toextend the work they have done so far. Many options are
A dead-end ROsystem provides the
basis for a trulyinterdisciplinary
project that providesa wealth of
problems andexamples for manydifferent branchesof engineering...it
connect[s] a calculuscourse to theengineeringcurriculum.
Winter 2003 43
Membranes in ChE Education
given for this extension: they can take additional data to an-swer questions arising from their earlier analysis; they canrun experiments with a different membrane, differentseals, or a different technique; they can vary the salt used.Students are asked to consider how they would improvethe test apparatus.
In addition, each group is given a unique RO sizing prob-lem. An example problem is
A small and exclusive island resort requires an improved watersupply for the roughly 150 people who are there at any given time.The resort estimates it will need 30 gallons/person each day. Thereis a large brackish water supply on the island with a salt concen-tration of 13 g/l as NaCl.
Students are expected to use the water permeability constantthat they determined from their experiments to calculate pos-sible pressures and membrane areas. They are expected toconsider the economic ramifications of their choices. In thissimplified analysis, the operating costs are considered to bethe cost of creating pressure. This cost is determined by cal-culating the energy required for pumping. We use the basicformula
powerPQ= ( )∆η
7
to determine the power required. Students assume that theyare using a cross-flow configuration and that they are able torecover the pressure energy of the waste stream. ∆P is thepressure increase across the pump, Q is the volumetric flowrate, η is the pump efficiency (we use 0.80), and power isthe power required. The capital cost of the plant is consid-ered to be a function of membrane area. Students are giventhe following scale-up formula to estimate the capital cost:
C m A= ( ) ( )4500 81 5 0 75$ / . .
where C is the estimated capital cost (in $), and A is the mem-brane area (in m2). In their economic sections they havebeen taught to calculate net present value and are expectedto consider the optimum trade-off between capital and op-erating costs.
ASSESSMENT AND COMMENTS
The project was evaluated based on re-examining finalproject reports from half of the student groups involved inthe class (16 out of 32 groups) and based on instructors’ ob-servations. Reports were re-examined with a particularfocus on the students’ demonstration of experimentationskills (goal 2) and design skills (goal 3). Throughout thisanalysis it is difficult to separate the project impact fromthe course as a whole.
The chance for students to experiment with the system
throughout the term was one of the strengths of this project.The final reports included an analysis of flux experiments atdifferent concentrations and pressures, plus student-designedstudies. In reviewing the final reports, 88% of the groupsanalyzed flux experiments completely and correctly. A re-view of the student-designed studies showed that 79% metour expectation of solid creative experiments that fit the timeand equipment constraints. Students completed a wide rangeof additional experiments, including testing an alternativemembrane; using calcium chloride instead of sodium chlo-ride; examining variations in flux decline with time andconcentration; studying an alternative clamping mecha-nism that has a longer back diffusion path; and examin-ing hold-up volume by comparing piston stroke move-ment to volume collected.
Reports included two different engineering design sections:the specific RO sizing problem and suggested design improve-ments for the RO press. As pertains to the sizing problem, in80% of the cases, the basic RO analysis was correct, but aswe move to more advanced analysis, the number of studentgroups mastering the concepts drops off. The idea of an eco-nomic trade off between pressure and membrane area wasclearly understood by 63% of the groups. A majority (56%)completed the expected economic estimates, but only a thirdincluded an analysis of the time value of money. All of thepercentages were a bit lower than we had hoped.
The students’ work on design improvements to the testpumps showed mixed results. In almost all cases (fourteenreports), the students had solid initial proposals for how toimprove our apparatus, but the detailing of their designs wasweak. In only five cases did the students complete detaileddesign calculations and make their designs specific. Suggestedimprovements included
• Modifying the lever arm to reduce deflection (change thematerial and/or dimensions
• Increasing the piston stroke to increase the volume of waterpumped per stroke
• Implementing a cross-flow configuration• Adding agitation to the system to reduce concentration
polarization• Adding additional instrumentation to the units
This project was designed from the beginning to bemultidisciplinary. Almost all student reports mention aspectsfrom all four BS engineering disciplines. The instructors foundthat they needed each other’s skills to design and understandthis project. We freely pointed this out to the students.
CONCLUSIONA dead-end RO system provides the basis for a truly inter-
disciplinary project that provides a wealth of problems and
44 Chemical Engineering Education
examples for many different branches of engineering. In ad-dition, it is used to connect a calculus course to the engineer-ing curriculum. The project provided a particularly good in-troduction to engineering experimentation. Student designwork on the project was good, but could be strengthened—particularly in the details of full design calculations and eco-nomic analysis.
REFERENCES1. Johnson, R., and L. Anneberg, “Sundials Make Interesting Freshman
Design Projects,” Proc. Conf. Amer. Soc. Eng. Ed., Session 2793 (2002)2. Soysal, O.A., “Project Based Learning of Energy Conversion Prin-
ciples at Freshman Level,” Proc. Conf. Amer. Soc. Eng. Ed., Session2533 (2002)
3. Ochs, J.B., T.A. Watkins, and B.W. Boothe, “Cultivating an Entrepre-neurial Spirit through Cross-Disciplinary Student Teams in FreshmanProjects Course,” Proc. Conf. Amer. Soc. Eng. Ed., Session 3454 (2002)
4. Hesketh, R.P., K. Jahan, A.J. Marchese, T.R. Chandrupatla, R.A.Dusseau, C.S. Slater, and J.L. Schmalzel, “Multidisciplinary Experi-mental Experiences in the Freshman Clinic at Rowan University,” Proc.Conf. Amer. Soc. Eng. Ed., Session 2326 (1997)
5. Hesketh, R.P., and C.S. Slater, “Innovative and Economical Bench-Scale Process Engineering Experiments,” Int. J. Eng. Ed., 16(4), 327(2000)
6. Farrell, S., R. Hesketh, K. Hollar, M. Savelski, C.S. Slater, R. Spect,“Don’t Waste Your Breath,” Proc. Conf. Amer. Soc. Eng. Ed., Session1613 (2002)
7. Farrell, S., R.P. Hesketh, J.A. Newell, and C.S. Slater, “IntroducingFreshmen to Reverse Process Engineering and Design through Inves-tigation of the Brewing Process,” Int. J. Eng. Ed., 17(6), 588 (2001)
8. Hollar, K., F. Lau, L. Head, K. Jahan, E. Constans, P. von Lockette,and B. Pietrucha, “Bugbots! A Multidisciplinary Design Project forEngineering Students,” Proc. Conf. Amer. Soc. Eng. Ed., Session 2426(2002)
9. Brockman, J.B., T.E. Fuja, and S.M. Batill, “A Multidisciplinary CourseSequence for First-Year Engineering Students,” Proc. Conf. Amer. Soc.Eng. Ed., Session 2253 (2002)
10. Beaudoin, D.L., and D.F. Ollis, “A Product and Process EngineeringLaboratory for Freshmen,” J. Eng. Ed., 84(3), 279 (1995)
This book is intended as a reference volume by the au-thor. Educators will find the book useful for several top-ics that are not covered by textbooks or other referencevolumes.
In addition to standard chapters on residence time dis-tribution and reactor models for non-ideal flow, there isan extensive chapter (91 pages) on mixing in tanks, mix-
ChE book review
Modeling of Chemical Kinetics andReactor Design
by A. Kayode Coker
2nd edition; 1095 pages plus CD-ROM; US $195. ISBN 0-88415-481-5 (2001)Published by Butterworth-Heinemann, 225 Wildwood Avenue,
11. Connor, J.B., and J.C. Malzahn Kampe, “First-Year Engineering atVirginia Polytechnic Institute and State University: A Changing Ap-proach,” Proc. Conf. Amer. Soc. Eng. Ed., Session 2553 (2002)
12. Quinn, R.G., “E4 Introductory Engineering Test, Design, and Simula-tion Laboratory,” J. Eng. Ed., 82(4), 223 (1993)
13. Safferman, S.I., M. Zoghi, and D.H. Farhey, “First-Year Civil andEnvironmental Engineering Design Experience,” J. Eng. Ed., 90(4),645 (2001)
14. Slater, C.S., and J.D. Paccione, “A Reverse Osmosis System for anAdvanced Separation Process Laboratory,” Chem. Eng. Ed., 22, 138(1987)
15. Lodge, K.B., R.A. Davis, D. Dorland, and D.N. Baria, “Experimentsin Waste Processing for Undergraduates,” Proc. Conf. Amer. Soc. Eng.Ed., Session 2513 (1997)
16. Assif-Anid, N.M., and H. C. Hollein, “Incorporating Biotechnologyin the Chemical Engineering Curriculum,” Proc. Conf. Amer. Soc. Eng.Ed., Session 2276 (2002)
17. Baker, R.W., E.L. Cussler, W. Eykamp. W.J. Koros, R.L. Riley, and H.Strathman, Membrane Separation Systems: Research and Develop-ment Needs Assessment, Final Report, Contract Number DE-AC01-88ER30133, U.S. Department of Energy (1990)
18. Wankat, P.C., “Membranes,” Part III in Rate Controlled Separations,Klawer, Amsterdam (1990)
19. Cussler, E.L., “Membranes,” Chapter 17 in Diffusion: Mass Transferin Fluid Systems, 2nd ed., Cambridge University Press (1997)
20. Eykamp, W., “Reverse Osmosis and Nanofiltration,” in Perry’s Chemi-cal Engineers’ Handbook, 7th ed., R.H. Perry, D.W. Green, and J.O.Maloney, eds., pp. 22-48 thru 22-52, McGraw-Hill (1997)
21. McCabe, W.L., J.C. Smith, and P. Harriott, “Membrane SeparationProcesses,” Chapter 26 in Unit Operations of Chemical Engineering,6th ed., McGraw-Hill, 857 (2001)
22. Mahlab, D., N. Ben Joseph, and G. Belfort, “Interferometric Measure-ment of Concentration Polarization Profile for Dissolved Species inUnstirred Batch Hyperfiltration (Reverse Osmosis),” Chem. Eng.Comm., 6, 225 (1980)
23. Ho, W.S.W., and K.K. Sirkar, Membrane Handbook, Van NostrandReinhold (1992)
24. Proctor & Gamble, PUR Survivor 06, at http://www.purwater.com/L3_mar_end_06.shtml, retrieved 7/2002
25. Avedissian, E., Cape May’s Desalination Plant’s No Albatross!, at http://www.capemay.com/Desalination.html, retrieved 7/2002 ❐
ing by static elements, and heat transfer in agitated tanks.
There is also a chapter (47 pages) that introduces theuse of computational fluid dynamic simulators for study-ing mixing and flow in reactors. That chapter discussesexamples of mixing and reaction in a stirred tank and flowin a radial flow catalyst bed. On the CD, there are beauti-ful and informative color images of transient mixing and
Winter 2003 45
reaction of a competitive-consecutive reaction in a stirredtank.
Other chapters in the book, which aren’t covered or arecovered only briefly by other books, include a chapter(80 pages) on biochemical reactions and reactors. Thereis an extensive chapter (134 pages) on safety, includingdescriptions of calorimeters used to characterize reactions,calculations of vent sizes, and a brief discussion ofHAZOP analysis. Scale-up of reactors is considered in achapter (47 pages) that discusses the use of dimensionalsimilitude in combination with reactor models.
Another strong point of the book is the numerous ex-amples that are worked in detail. Many of these exampleproblems are supplemented by Excel spreadsheets andcomputer programs on the CD.
The CD also has a unit conversion program and PDFfiles with explanations of numerical methods and a cross-reference between examples in the book and supportingmaterial on the CD. Source code (Fortran 77) for all ofthe software programs on the CD is included along withthe executables. Unfortunately, temporary files producedduring compilation (object, make, compiler interface) arealso included, which (in addition to the lack of sub-fold-ers in each chapter’s folder) makes finding the file neededto run the program harder than necessary. A DOS pro-gram is available for calculating heats of reaction at reac-tion temperature with input of stoichiometry, standardheats of formation, and heat capacity formula coefficients.
To the Editor:
Reference is made to the article by Ang and Braatz,“Experimental Projects for the Process Control Labo-ratory” [CEE, 36(3), p. 182, 2002]. The exercise thathas to do with “dye concentration” can also be donewith the control of a hot-water stream instead of adye stream flowing into the tank. Just as a colori-meter indicates the amount of dye stream, so too canthermocoupling indicate the amount of hot-waterstream; otherwise the experimental apparatus wouldbe the same.
We find a convenience in not needing to deal witha dye stream disposal problem at the “Drain” indi-cated in their figure. Our water stream is collectedand reused.
Dale L. SchrubenTexas A&M Kingsville
ChE letter to the editor
Author’s Response
We agree that control of temperature using a hot-water stream issafe, with no waste disposal issues—which is why this is used inmany control apparatuses (e.g., as in apparatuses 5, 7, and 10 de-scribed in the article). An advantage of the dye concentration controlexperiment is that students can directly visualize the open- and closed-loop dynamics and the extent of nonideal mixing, as they observe thecolor changes in the tank.
Before constructing any apparatus, Materials Safety Data Sheetsshould be consulted for safety and disposal considerations for allchemicals that are intended for use in the experiments. The instuctionalvalue of a particular apparatus with particular chemicals should beweighed against capital and operating costs and any safety or dis-posal issues. There are many internet resources for viewing MSDSs(e.g., see <http://www.ilpi.com/msds/#Internet>).
Richard D. BraatzUniversity of Illinois
Other programs are Windows double-clickableexecutables that display text output in the output windowand write output files to disk. A recommendation for fu-ture editions is to change the file extensions to “txt” fromthose used for the input (“dat”) and output (“res”) so thatthey can be accessed easily by double-clicking.
There are several topics that are not covered by the book.Other than brief mention and sketches in a chapter men-tioning types of reactors, there is nothing on multiple-phase reaction systems. There is nothing on reaction-dif-fusion in porous catalysts or non-catalytic solids. Thereis brief discussion on pressure drop but none on the effectof pressure drop of gases on reaction rate. There are acouple brief discussions of selectivity and yield in two-reaction systems, but nothing on more complex multiple-reaction systems. The thermodynamics section would ben-efit from a worked example on reaction equilibrium com-position. There are no end-of-chapter problems that canbe used for student assignments.
Other chapters in the book cover standard material suchas reaction mechanisms, analysis of kinetic data, designand comparison of the “ideal” reactor types, thermal ef-fects, and residence time distribution.
Richard K. Herz
Chemical Engineering Program andMechanical & Aerospace Eng. Dept.University of California, San Diego
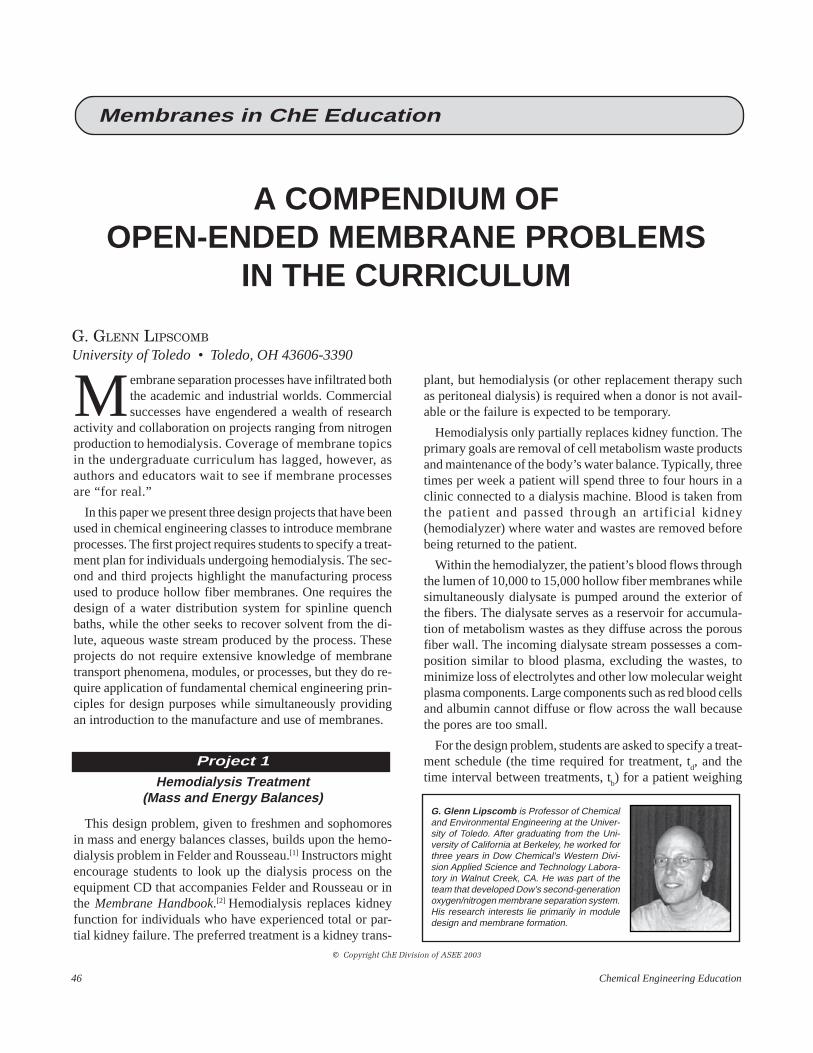
46 Chemical Engineering Education
A COMPENDIUM OFOPEN-ENDED MEMBRANE PROBLEMS
IN THE CURRICULUM
G. GLENN LIPSCOMB
University of Toledo • Toledo, OH 43606-3390
Membrane separation processes have infiltrated boththe academic and industrial worlds. Commercialsuccesses have engendered a wealth of research
activity and collaboration on projects ranging from nitrogenproduction to hemodialysis. Coverage of membrane topicsin the undergraduate curriculum has lagged, however, asauthors and educators wait to see if membrane processesare “for real.”
In this paper we present three design projects that have beenused in chemical engineering classes to introduce membraneprocesses. The first project requires students to specify a treat-ment plan for individuals undergoing hemodialysis. The sec-ond and third projects highlight the manufacturing processused to produce hollow fiber membranes. One requires thedesign of a water distribution system for spinline quenchbaths, while the other seeks to recover solvent from the di-lute, aqueous waste stream produced by the process. Theseprojects do not require extensive knowledge of membranetransport phenomena, modules, or processes, but they do re-quire application of fundamental chemical engineering prin-ciples for design purposes while simultaneously providingan introduction to the manufacture and use of membranes.
Project 1
Hemodialysis Treatment(Mass and Energy Balances)
This design problem, given to freshmen and sophomoresin mass and energy balances classes, builds upon the hemo-dialysis problem in Felder and Rousseau.[1] Instructors mightencourage students to look up the dialysis process on theequipment CD that accompanies Felder and Rousseau or inthe Membrane Handbook.[2] Hemodialysis replaces kidneyfunction for individuals who have experienced total or par-tial kidney failure. The preferred treatment is a kidney trans-
© Copyright ChE Division of ASEE 2003
G. Glenn Lipscomb is Professor of Chemicaland Environmental Engineering at the Univer-sity of Toledo. After graduating from the Uni-versity of California at Berkeley, he worked forthree years in Dow Chemical’s Western Divi-sion Applied Science and Technology Labora-tory in Walnut Creek, CA. He was part of theteam that developed Dow’s second-generationoxygen/nitrogen membrane separation system.His research interests lie primarily in moduledesign and membrane formation.
plant, but hemodialysis (or other replacement therapy suchas peritoneal dialysis) is required when a donor is not avail-able or the failure is expected to be temporary.
Hemodialysis only partially replaces kidney function. Theprimary goals are removal of cell metabolism waste productsand maintenance of the body’s water balance. Typically, threetimes per week a patient will spend three to four hours in aclinic connected to a dialysis machine. Blood is taken fromthe patient and passed through an artificial kidney(hemodialyzer) where water and wastes are removed beforebeing returned to the patient.
Within the hemodialyzer, the patient’s blood flows throughthe lumen of 10,000 to 15,000 hollow fiber membranes whilesimultaneously dialysate is pumped around the exterior ofthe fibers. The dialysate serves as a reservoir for accumula-tion of metabolism wastes as they diffuse across the porousfiber wall. The incoming dialysate stream possesses a com-position similar to blood plasma, excluding the wastes, tominimize loss of electrolytes and other low molecular weightplasma components. Large components such as red blood cellsand albumin cannot diffuse or flow across the wall becausethe pores are too small.
For the design problem, students are asked to specify a treat-ment schedule (the time required for treatment, t
d, and the
time interval between treatments, tb) for a patient weighing
Membranes in ChE Education
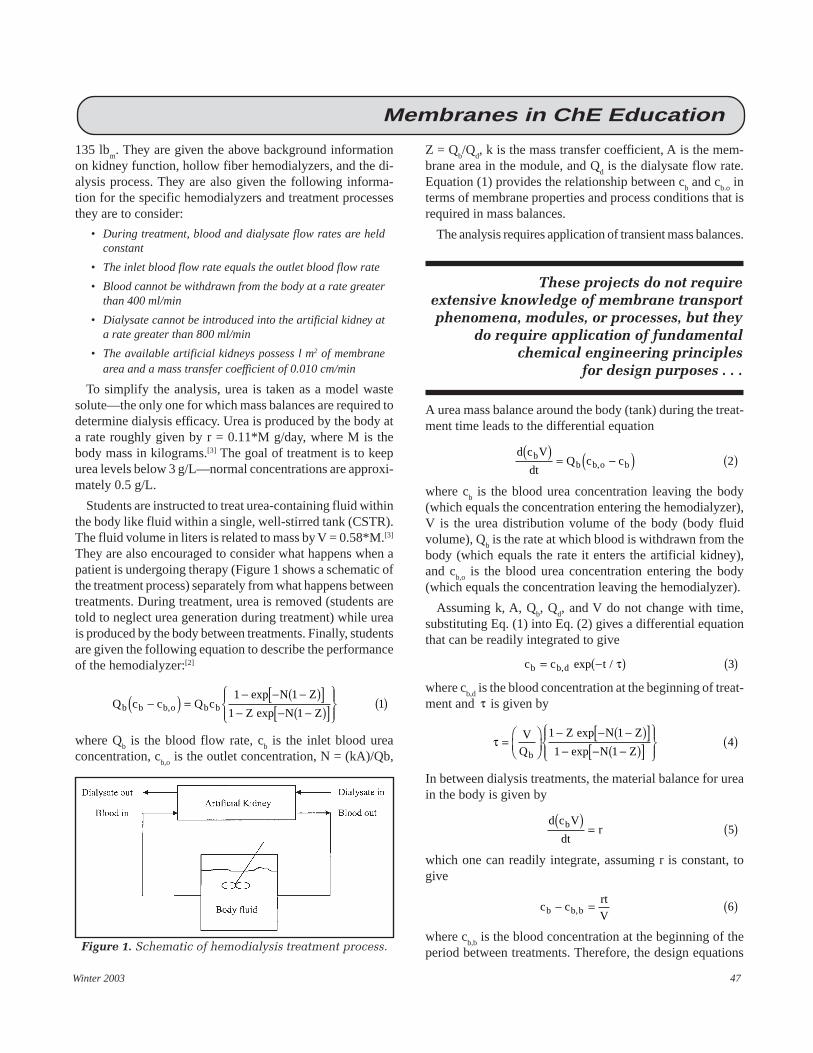
Winter 2003 47
135 lbm. They are given the above background information
on kidney function, hollow fiber hemodialyzers, and the di-alysis process. They are also given the following informa-tion for the specific hemodialyzers and treatment processesthey are to consider:
• During treatment, blood and dialysate flow rates are heldconstant
• The inlet blood flow rate equals the outlet blood flow rate
• Blood cannot be withdrawn from the body at a rate greaterthan 400 ml/min
• Dialysate cannot be introduced into the artificial kidney ata rate greater than 800 ml/min
• The available artificial kidneys possess l m2 of membranearea and a mass transfer coefficient of 0.010 cm/min
To simplify the analysis, urea is taken as a model wastesolute—the only one for which mass balances are required todetermine dialysis efficacy. Urea is produced by the body ata rate roughly given by r = 0.11*M g/day, where M is thebody mass in kilograms.[3] The goal of treatment is to keepurea levels below 3 g/L—normal concentrations are approxi-mately 0.5 g/L.
Students are instructed to treat urea-containing fluid withinthe body like fluid within a single, well-stirred tank (CSTR).The fluid volume in liters is related to mass by V = 0.58*M.[3]
They are also encouraged to consider what happens when apatient is undergoing therapy (Figure 1 shows a schematic ofthe treatment process) separately from what happens betweentreatments. During treatment, urea is removed (students aretold to neglect urea generation during treatment) while ureais produced by the body between treatments. Finally, studentsare given the following equation to describe the performanceof the hemodialyzer:[2]
Q c c Q cN Z
Z N Zb b b o b b−( ) =− − −( )[ ]
− − −( )[ ]
( ),
exp
exp
1 1
1 11
where Qb is the blood flow rate, c
b is the inlet blood urea
concentration, cb,o
is the outlet concentration, N = (kA)/Qb,
Figure 1. Schematic of hemodialysis treatment process.
Z = Qb/Q
d, k is the mass transfer coefficient, A is the mem-
brane area in the module, and Qd is the dialysate flow rate.
Equation (1) provides the relationship between cb and c
b.o in
terms of membrane properties and process conditions that isrequired in mass balances.
The analysis requires application of transient mass balances.
A urea mass balance around the body (tank) during the treat-ment time leads to the differential equation
d c V
dtQ c cb
b b o b( )
= −( ) ( ), 2
where cb is the blood urea concentration leaving the body
(which equals the concentration entering the hemodialyzer),V is the urea distribution volume of the body (body fluidvolume), Q
b is the rate at which blood is withdrawn from the
body (which equals the rate it enters the artificial kidney),and c
b,o is the blood urea concentration entering the body
(which equals the concentration leaving the hemodialyzer).
Assuming k, A, Qb, Q
d, and V do not change with time,
substituting Eq. (1) into Eq. (2) gives a differential equationthat can be readily integrated to give
c c tb b d= −( ) ( ), exp / τ 3
where cb,d
is the blood concentration at the beginning of treat-ment and τ is given by
τ =
− − −( )[ ]− − −( )[ ]
( )V
Q
Z N Z
N Zb
1 1
1 14
exp
exp
In between dialysis treatments, the material balance for ureain the body is given by
d c V
dtrb( )
= ( )5
which one can readily integrate, assuming r is constant, togive
c crt
Vb b b− = ( ), 6
where cb,b
is the blood concentration at the beginning of theperiod between treatments. Therefore, the design equations
Membranes in ChE Education
These projects do not requireextensive knowledge of membrane transportphenomena, modules, or processes, but they
do require application of fundamentalchemical engineering principles
for design purposes . . .
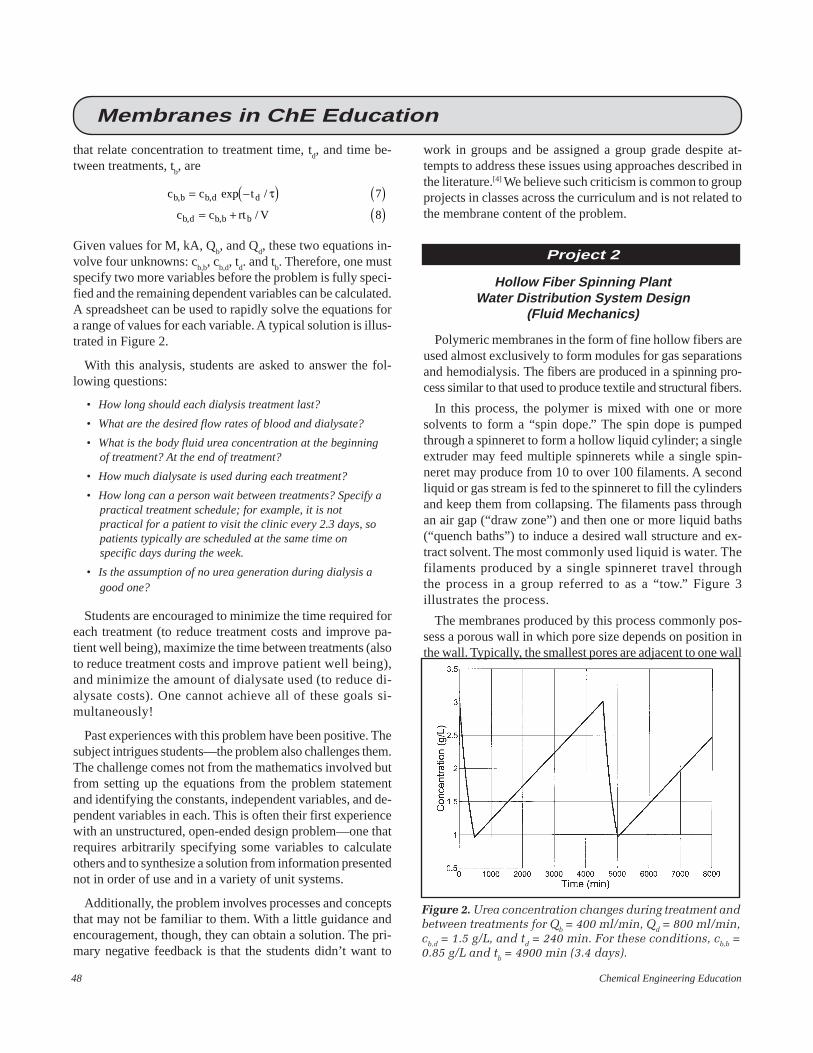
48 Chemical Engineering Education
Figure 2. Urea concentration changes during treatment andbetween treatments for Qb = 400 ml/min, Qd = 800 ml/min,cb,d = 1.5 g/L, and td = 240 min. For these conditions, cb,b =0.85 g/L and tb = 4900 min (3.4 days).
Membranes in ChE Education
that relate concentration to treatment time, td, and time be-
tween treatments, tb, are
c c t
c c rt V
b b b d d
b d b b b
, ,
, ,
exp /
/
= −( ) ( )= + ( )
τ 7
8
Given values for M, kA, Qb, and Q
d, these two equations in-
volve four unknowns: cb,b
, cb,d
, td. and t
b. Therefore, one must
specify two more variables before the problem is fully speci-fied and the remaining dependent variables can be calculated.A spreadsheet can be used to rapidly solve the equations fora range of values for each variable. A typical solution is illus-trated in Figure 2.
With this analysis, students are asked to answer the fol-lowing questions:
• How long should each dialysis treatment last?
• What are the desired flow rates of blood and dialysate?
• What is the body fluid urea concentration at the beginningof treatment? At the end of treatment?
• How much dialysate is used during each treatment?
• How long can a person wait between treatments? Specify apractical treatment schedule; for example, it is notpractical for a patient to visit the clinic every 2.3 days, sopatients typically are scheduled at the same time onspecific days during the week.
• Is the assumption of no urea generation during dialysis agood one?
Students are encouraged to minimize the time required foreach treatment (to reduce treatment costs and improve pa-tient well being), maximize the time between treatments (alsoto reduce treatment costs and improve patient well being),and minimize the amount of dialysate used (to reduce di-alysate costs). One cannot achieve all of these goals si-multaneously!
Past experiences with this problem have been positive. Thesubject intrigues students—the problem also challenges them.The challenge comes not from the mathematics involved butfrom setting up the equations from the problem statementand identifying the constants, independent variables, and de-pendent variables in each. This is often their first experiencewith an unstructured, open-ended design problem—one thatrequires arbitrarily specifying some variables to calculateothers and to synthesize a solution from information presentednot in order of use and in a variety of unit systems.
Additionally, the problem involves processes and conceptsthat may not be familiar to them. With a little guidance andencouragement, though, they can obtain a solution. The pri-mary negative feedback is that the students didn’t want to
work in groups and be assigned a group grade despite at-tempts to address these issues using approaches described inthe literature.[4] We believe such criticism is common to groupprojects in classes across the curriculum and is not related tothe membrane content of the problem.
Project 2
Hollow Fiber Spinning PlantWater Distribution System Design
(Fluid Mechanics)
Polymeric membranes in the form of fine hollow fibers areused almost exclusively to form modules for gas separationsand hemodialysis. The fibers are produced in a spinning pro-cess similar to that used to produce textile and structural fibers.
In this process, the polymer is mixed with one or moresolvents to form a “spin dope.” The spin dope is pumpedthrough a spinneret to form a hollow liquid cylinder; a singleextruder may feed multiple spinnerets while a single spin-neret may produce from 10 to over 100 filaments. A secondliquid or gas stream is fed to the spinneret to fill the cylindersand keep them from collapsing. The filaments pass throughan air gap (“draw zone”) and then one or more liquid baths(“quench baths”) to induce a desired wall structure and ex-tract solvent. The most commonly used liquid is water. Thefilaments produced by a single spinneret travel throughthe process in a group referred to as a “tow.” Figure 3illustrates the process.
The membranes produced by this process commonly pos-sess a porous wall in which pore size depends on position inthe wall. Typically, the smallest pores are adjacent to one wall

Winter 2003 49
Figure 3. Schematic of a typical fiber spinning plant witha single quench bath.
Figure 4. Water distribution system in a fiber spinningplant.
Figure 5. Bath schematic.
TABLE 1Design Constraints for Water Distribution System
� Water flow rates range from 1 - 2 m3/hr and solvent concentra-tion cannot exceed 1% by weight.
� Centrifugal pumps are available in integral horsepower ratingsfrom 1 to 10 hp and increments of 5 hp above 10 hp. Assume80% efficiency and NPSH = 2 m.
� Use 12-gauge stainless steel tubing and at most two sizes: onefor the supply and one for the return.
� Minimum working distance between pump and tank is 0.5 m.
� Neglect pressure changes in the distribution manifold.
� Account for entrance and exit losses for all tanks.
� All fitting losses may be approximated by an increase in therequired straight pipe length of 10% except for the specific onesmentioned above.
� The water stream is always near 25°C.
� The viscosity and density of the water stream do not change untilthe solvent concentration exceeds 10%.
� The packed beds are mounted vertically and flow is upward. Thebottom of each bed is 0.5 m off the ground. The stream exitingfrom the packed bed empties into the top of the storage tanks.
� Packing is 1-cm diameter spheres ( ρ = 2000 kg/m3), bed voidfraction ranges from 0.45 to 0.55, packing adsorbs 1 kg solvent/kg packing, and exiting water stream is solvent free until packingis saturated.
� Cylindrical beds are available in 0.5 m, 1 m, 1.5 m, and 2 mdiameters. Use an aspect ratio of 3.
Membranes in ChE Education
and the largest adjacent to the other wall. Fibers range in sizefrom approximately 100 to 400 microns outer diameter and75 to 300 microns inner diameter, while pore sizes range fromAngstroms (molecular size) to microns.
Students in fluid mechanics classes were asked to design awater distribution system for the water baths. The circulationloop contains an adsorption column to remove solvent since
the solvent concentration in the baths must be kept belowsome critical level to produce “good” fiber. Figure 4 illus-trates the water distribution system, while Figure 5 illustratesthe dimensions of each water bath.
For the analysis, a range of water flows was specified thatwould ensure the solvent concentration remains below themaximum allowable value. Simplified packed bed perfor-mance and design guidelines were given for sizing purposes.Additionally, constraints on the piping, pumps, pump loca-tion, and the storage tank were specified. These are summa-rized in Table 1.
The students were asked to provide
• A piping diagram• Pump placement and horsepower• Packed bed dimensions and packing requirements• An inventory of required equipment
The analysis consists primarily of application of macroscopicmomentum balances (i.e., the Bernoulli equation), basic pumpsizing principles, and mass balances. The equipment inven-tory for a typical design is provided in Table 2 (next page).
Student response to the problem was positive. Unsolicited

50 Chemical Engineering Education
TABLE 2Typical Equipment Inventory for
Water Distribution System
� 5-hp centrifugal pump (160 psig discharge) for water supply tobaths from storage tank
� 6-hp centrifugal pump (210 psig discharge) for water return tostorage tank from baths
� 230 ft 7/8 in OD 12-gauge stainless steel tubing� Four stainless steel 7/8-in tees� Ten globe valves� Two vessels (1m x 3m) for packed beds� 2 m3 packing for packed beds� One vessel (2m x 2m) for the storage tank (illustrated in Figure 4)� Four water baths (illustrated in Figure 5)
Figure 6. Schematic of a typical fiber spinning plant withtwo quench baths.
TABLE 3Fiber Spinning Process Specifications
� The spin dope consists of 32.5 weight percent N-methylpyrrolidone (C
5H
9NO), 15.5 weight percent ethylene glycol, and
the balance polycarbonate.� The spin dope is extruded at a rate of 5 lb
m/min. This is fed to three
spinnerets that each produce 60 fibers.� The 180 liquid filaments enter into a water bath maintained at 5°C
and spend approximately 5 seconds in the bath.� Upon exiting from the first bath, approximately 65% of the
ethylene glycol is removed and 45% of the N-methyl pyrrolidone.An equal volume of water replaces the organic solvents.
� The total solvent composition of the first bath must be kept belowone weight percent.
� The fiber enters a second bath maintained at a temperature of 85°Cand spends approximately 10 minutes in the bath.
� Upon exiting from the second bath, virtually all of the organicsolvents have been removed and replaced by an equal volume ofwater.
� The total solvent composition of the second bath must be keptbelow 10 weight percent.
� Makeup water for the baths comes from city water lines but mustbe distilled to purify it.
� Makeup water should be returned at the temperature of the bath.However, you do not have to provide temperature control for eitherbath.
� To reuse the solvents, the water content must be less than oneweight percent.
Membranes in ChE Education
comments on course evaluation forms included “I liked thegroup project” and “The design project was a good idea ex-cept for the whole group work thing.” As with the previousproblem, students were not comfortable working in groupsdespite attempts to address their concerns.
Project 3
Hollow Fiber Spinning Plant Solvent Recovery(Senior Design)
In the senior design class, students were asked to design aseparation system to recover solvent from the water leavingthe quench baths for recycle within the process. The econom-ics of membrane manufacture can be very sensitive to sol-vent losses and environmental costs associated with wastedisposal. Consequently, this problem might be used as a pol-lution prevention example in the design course.
The spinning process for this problem is illustrated in Fig-ure 6. The primary difference between this process and theprocess illustrated in Figure 3 is that two quench baths inseries are used to remove the solvent. Students were givenessential process specifications (see Table 3) and asked todesign the recovery process. A fiber spinning process withsimilar characteristics is described in the patent literature.[5]
Each student group had to provide the following designinformation:
• What is the required makeup water flow rate for eachbath? At what rate is water removed from each bathfor treatment?
• What are the design specifications for each unitoperation in the solvent recovery process?
• Provide a complete PFD for the process, including atable of stream and unit operation properties.
• Estimate process costs and compare to the cost ofsimply returning the wastewater to the city sewersystem at a concentration of less than 0.1 weightpercent organics.
As one might expect, most groups considered dis-tillation processes. Common process simulators(e.g., ChemCAD) can be used for the design of in-dividual columns and column trains. Considerationof other unit operations such as reverse osmosis,pervaporation, or adsorption requires hand calcula-tions and contact with potential vendors.
The separation process design is complicated bythe tight requirements on the water effluent fromthe first bath —total solvent concentration less than1% by weight. For the given process specifications,a minimum of approximately 120 lb
m/min of water

Winter 2003 51
Membranes in ChE Education
must be fed to the first bath. Some of the effluent from thefirst bath can be used as the feed water to the second, but thewater flow through the second bath is an order of magnitudeless (about 12 lb
m/min), so most of the dilute effluent from
the first bath must be sent to the separation process.
One can recover solvent from the combined bath effluentsat sufficiently high purity (less than 1 weight percent water)to permit reuse with a single modest column (five stages andreflux ratio of 2). Water recovery to permit reuse in the firstbath is more problematic. Large columns with high refluxratios are required to increase water purity above 99%, themaximum allowed concentration of the effluent from the firstbath; use of multiple columns is undesirable since water (thehighest concentration component) goes overhead in each col-umn. Therefore, most designs send some water to waste treat-ment and replace it with fresh water. The trade-offs betweenthe cost of water disposal, cost of solvent lost in the waste-water, and column energy and capital costs dictate the finaldesign. Instructors may use cost information from standarddesign texts (e.g., Turton, et al.[6]) to evaluate the trade-off.Other configurations that students have considered includesending the effluent from each bath to separate columns andsending only the effluent from the second bath (with the high-est solvent concentration) to a column. In the latter configu-ration, all of the effluent from the first bath is sent to wastetreatment.
CONCLUSIONSThree design problems that illustrate hollow fiber mem-
brane manufacturing processes and use of membranes in sepa-ration processes are described. The problems have been usedin classes that range from the freshman/sophomore to senioryears in the curriculum. These problems are unique in theiremphasis on membrane manufacture. Upon request, detailedproblem statements and sample solutions can be provided.
REFERENCES1. Felder, R.M., and R.W. Rousseau, Elementary Principles of Chemical
Processes, 3rd ed., John Wiley & Sons, New York, NY (2000)2. Kessler, S.B., and E. Klein, “Dialysis,” in Membrane Handbook, W.S.
Ho and K.K. Sirkar, eds., Van Nostrand Reinhold, New York NY (1992)3. Galletti, P.M., C.K. Colton, and M.J. Lysaght, “Artificial Kidney,” in
The Biomedical Engineering Handbook, J.D. Bronzino, ed., CRC Press,Boca Raton, FL (1995)
4. Felder, R.M., and R. Brent, “Cooperative Learning in TechnicalCourses: Procedures, Pitfalls, and Payoffs,” ERIC Document Repro-duction Service, ED 377038 (1994) Available on-line at <http://www2.ncsu.edu/unity/lockers/users/f/felder/public/Papers/Coopreport.html>
5. Sanders, E.S., D.O. Clark, J.A. Jensvold, H.N. Beck, G.G. Lipscomb,and F.L. Coan, Process for Preparing POWADIR Membranes fromTetrahalobisphenol A Polycarbonates, US Patent 4,772,392, issuedSept. 20, 1988.
6. Turton, R., R.C. Bailie, W.B. Whiting, and J.A. Shaeiwitz, Analysis,Synthesis, and Design of Chemical Processes, Prentice Hall, Upper
Saddle River, NJ (1998) ❐
Ludwig Boltzmann’s Disorder
Herr Doktor Boltzmann has a vision rareOf gases as a flight of tiny ballsIn random 3-D motion that would dareAllow him to explain their force on walls.
Ernst Mach insists that physics must be strictAnd not be mocked, since atoms are not real.Observables alone cannot be tricked;Thereby, vague theories shall be brought to heel.
But Boltzmann’s disarray achieves a feat—Bold inf’rences drawn from how atoms fly.He reinterprets what is meant by heat,And temp’rature and pressure by the bye.
At length, chaotic motion proves its worth,As entropy’s conceived and has its birth.
After reading David Lindley’s book Boltzmann’s Atom, Professor Robert R. Hudgins (University of Waterloo) wasinspired to pen his thoughts on two subjects very familiar to chemical engineers. He shares those thoughts here...
Gibbs’ Phase Rule
J. Willard Gibbs, the pedant in this tale,Reflecting on an elemental stateOf matter at his alma mater, Yale,Took to his books and never sought a mate.
In love with equilibrium he stayed(No doubt both metaphorical and real).When do P phases coexist? He playedWith arguments with consecrated zeal.
As countrymen pursued uncivil war‘Round F degrees of freedom for their slaves,Gibbs solved, with C components of savoir,A theorem that, when understood, draws raves.
Robust and brief (‘twould make a fine tatoo),Proclaims F equals C less P plus two.
ChE stirred pots
52 Chemical Engineering Education
EXPLORING THEPOTENTIAL
OF ELECTRODIALYSIS
STEPHANIE FARRELL, ROBERT P. HESKETH, C. STEWART SLATER
Rowan University • Glassboro, NJ 08028
Electrodialysis is an electrochemical membrane sepa-ration technique for ionic solutions that has been usedin industry for several decades.[1] It can be used in
the separation and concentration of salts, acids, and basesfrom aqueous solutions, the separation of monovalent ionsfrom multivalent ions, and the separation of ionic compoundsfrom uncharged molecules. It can be used for either electro-lyte reduction in feed streams or recovery of ions from dilutestreams.[2-4] Industrial applications encompass several indus-tries and include the production of potable water frombrackish water, removal of metals from wastewater, dem-ineralization of whey, deacidification of fruit juices, andthe removal of organic acids from fermentation broth.[1,2-
5] Additional examples of the applications of electrodi-alysis are given in Table 1.
As a selective transport technique, electrodialysis uses anion-selective membrane as a physical barrier through whichions are transported away from a feed solution. An energy-intensive phase change is unnecessary, in contrast to the com-mon separation techniques of distillation and freezing.[6] Theuse of an organic solvent, as is often required with other se-lective transport techniques such as liquid extraction, isavoided with electrodialysis. In addition, electrodialysis istypically performed under mild temperature conditions, mak-ing it particularly attractive for food, beverage, and pharma-ceutical applications that deal with heat liable substances.
In typical chemical engineering undergraduate curricula,students are exposed to traditional separations methods witha heavy emphasis on operations such as distillation, extrac-tion, and absorption. The need for incorporation of membranetechnology into the chemical engineering curriculum has at-tracted recent attention.[7-9]
The membrane separation processes mentioned above em-ploy “traditional” driving forces such as concentration and
Stephanie Farrell is Associate Professor of Chemical Engineering atRowan University. She received her BS in 1986 from the University ofPennsylvania, her MS in 1992 from Stevens Institute of Technology, andher PhD in 1996 from New Jersey Institute of Technology. Her teachingand research interests are in controlled drug delivery and biomedical en-gineering.Robert Hesketh is Professor of Chemical Engineering at Rowan Univer-sity. He received his BS in 1982 from the University of Illinois and his PhDfrom the University of Delaware in 1987. His research is in the areas ofreaction engineering, novel separations, and green engineering.C. Stewart Slater is Chair of the Chemical Engineering Department atRowan University. He is a two-time recipient of the Martin Award, andother awards include the Westinghouse, Carlson, and Dow. He is the found-ing chair of the innovative, hands-on undergraduate-focused chemicalengineering program at Rowan. He is on the editorial board of ChemicalEngineering Education and The International Journal of Engineering Edu-cation.
pressure gradients, in contrast to electrodialysis, which useselectrical potential to drive the separation. The first treatmentof electrodialysis in the educational literature appeared in1931.[10] In this work, Kendall and Gebauer-Fuelnegg presentthree reasons why electrodialysis remains among the “ne-glected methods” of organic chemistry: 1) its treatment intextbooks is inadequate, 2) its advantages and applicabilityare not generally recognized, and 3) simple and efficient typesof electrodialyzers are not generally available. While bench-scale electrodialysis equipment is now readily available fromvarious manufacturers, electrodialysis is not commonly ad-dressed in chemical engineering curricula, due primarily tothe first two reasons presented above. Several reference booksinclude excellent treatment of electrodialysis theory and ap-plications,[1,3-5,11] but this material is not easily “distilled” intomaterial that can be introduced in the undergraduate class-room or laboratory, particularly if the professor has limitedexperience with membrane separations.
Increasing interest in electrochemical education is reflectedby recent publications that address electrochemical reactorsfor synthesis and pollution control.[12-17] Kendall and Gebauer-
© Copyright ChE Division of ASEE 2003
Membranes in ChE Education

Winter 2003 53
TABLE 1Industrial Applications of Electrodialysis
Electrolyte reduction • Potable water from brackish water
• Nitrate removal for drinking water
• Boiler water, cooling tower water, effluentsteam desalting
• Cheese whey demineralization
• Fruit juice deacidification
• Sugar and molasses desalting
• Potassium tartrate removal from wine
• Blood plasma protein recovery
• Demineralization of amino acid solutions inthe food industry
• Acid removal from organic products
Electrolyte recovery • Edible salt production from seawater
• Ag(I) salts from photographic waste
• Zn(II) from galvanizing rinse water
• Organic salts from fermentation broth
• Amino acids from protein hydrolysates
• Salts, acids, and alkali from industrial rinsewaters
Miscellaneous • Conversion of organic salts into acid and base(bipolar membrane ED)
• Salt splitting
Fuelnegg[10] made a strong case for inclusion of electrodialy-sis in the chemistry curriculum and described inexpensivelaboratory set-ups for simple and rapid laboratory investiga-tions. Literature that specifically explores electrodialysis inchemical engineering and chemistry education is scarce,however. Garcia-Garcia, et al., have developed an excit-ing experiment for the desalting of an amino acid solu-
tion using electrodialysis as an alternative to precipita-tion using organic solvents.[18]
This paper describes a hands-on investigation of electrodi-alysis that introduces the basic principles and applications ofelectrodialysis technology. The effects of various processoperating conditions on the system performance are exploredexperimentally. Emphasis is given to data analysis and engi-neering calculations related to rate of ion transfer, Faraday’slaw, efficiency, energy consumption, and separation perfor-mance. These experiments can be implemented in core chemi-cal engineering courses such as unit operations and separa-tion processes, or in elective or graduate-level courses ingreen/environmental engineering, wastewater treatment, elec-trochemical engineering, pharmaceutical engineering, andfood engineering. Through these experiments, students arenot only exposed to an innovative membrane separation ex-periment, but they also gain a greater knowledge of experi-mental skills and calculations relevant to the membrane field.
FUNDAMENTALS
The principle that governs electrodialysis is an electricalpotential difference across an alternating series of cation andanion exchange membranes between an anode and a cath-ode. The feed solution containing both positive and negativeions enters the membrane stack to which a voltage is applied,thus causing the migration of the ions toward their respectiveelectrodes. The cation exchange membranes allow the trans-fer of cations but inhibit the transfer of anions. Conversely,anion exchange membranes allow the transfer of anions butinhibit the transfer of cations. The result is alternating com-partments containing streams of dilute ion concentration(diluate) and streams rich in ion concentration (concentrate)exiting the stack. An ionic rinse solution is circulated pastthe electrodes to maintain conductivity of the membrane stackwhile preventing potentially corrosive ions from the feedsolution from contacting the electrodes. This concept isillustrated in Figure 1 with a feed solution of a salt (C+A-
) in aqueous solution.
The electrodialysis membrane stack comprises electrodesand membranes separated by gaskets and spacers. The spac-ers are turbulence-promoting support mesh used to create thecompartments through which the solutions flow. Uniform flowdistribution and prevention of internal leakage through spacerand gasket design are critical to system performance. Stackdesign is discussed by Strathmann.[3]
Material balances can be written for streams entering andexiting the membrane stack, as ions are transported from thefeed stream to the concentrate stream. The molar rate of trans-fer of an ionic species to a stream passing through the mem-Figure 1. The principles of electrodialysis.
Membranes in ChE Education
54 Chemical Engineering Education
brane stack is
m F C F Ci i i i i= − ( )2 2 1 1 1
where the subscript 2 is the stream exiting the stack and 1 isthe stream entering the stack, superscript i represents eitherthe feed or concentrate stream, F is volumetric flowrate, and
C is concentration of the species being transported. In batchrecirculation mode, the streams exiting the stack are returneddirectly to the well-mixed reservoir vessels. The solutions inthe reservoir vessels are then fed to the stack. The unsteady-state material balance on the reservoir vessel is
d
dtV C F C F Ci i i i i i
1 1 1 2 2 2( ) = − ( )
Equating Eqs. (1) and (2) yields an expression for the molarrate of change in the reservoir vessels in terms of measuredreservoir volume Vi and concentration
md
dtV Ci i= − ( ) ( )1 3
Transfer of ions to and from the rinse solutions does takeplace, and this rate of transfer is found by an overall balanceon the three streams (feed, rinse, and concentrate):
˙ ˙ ˙m m mr c f+ + = ( )0 4
Electrodialysis is commonly performed in either constant-voltage or constant-current mode. Calculations relating volt-age and current to power consumption and efficiency are ofcritical interest, and basic equations that will be used for pro-cess evaluation are presented here.
The cell voltage and current within a membrane stack arerelated through Ohm’s Law
� = × ( )I R 5
where � is the voltage (V), I is the current (A), and R is theresistance of the membrane stack ( ). The resistance of themembrane stack is due to the friction of the ions with themembranes and the aqueous solution while being transferredfrom one solution to another.[5] At high voltages, the systemdoes not follow Ohm’s Law, and the interested reader is re-
ferred to standard texts such as Mulder[1] for the descriptionof other regimes.
The power consumption necessary for the removal of ionsfrom the feed solution is proportional to the current and thestack resistance. The necessary power, P(J/s), is representedby
P I R= ( )2 6
This equation does not account for power necessary to pumpthe feed, rinse, or diluate streams.[1]
Combination of Eqs. (5) and (6) results in a power expres-sion in terms of measured variables voltage and current, andthe number of membrane pairs in the stack, n,
P nI= ( )� 7
Current is the rate of charge passed through the stack
Idc
dt= ( )8
where c = charge passed (Coul) and t is time (s). For a systemoperated at constant voltage, the power consumption willchange throughout the run as the current changes. The poweris defined as the rate of energy consumption
PdE
dt= ( )9
To determine the total energy consumed in time t, Eqs. (7)and (8) are substituted into Eq. (9), which is integrated fromtime 0 to t to obtain
E n c= ( )� 10
The efficiency of the membrane stack is a measure of thesystem’s ability to use the current effectively in the removalof ions. The minimum (theoretical) charge, c
min, required to
transfer m moles of ions through the membrane stack is ex-pressed by Faraday’s Law
c zmmin = ( )� 11
where z is the valence and � is Faraday’s Constant (96,500c/mol). The efficiency, η , of the stack compares the mini-mum theoretical charge to the actual charge required to trans-port ions through a stack having n membrane pairs[3]
η = ( )c
ncmin 12
An efficiency of less than one indicates that not all of thecharge passed by the electrodialysis system was used to trans-fer ions from one stream to another. Potential causes of aless-than-perfect efficiency include less-than-perfect ion se-lectivity of the membranes, the potential of parallel currentpaths within the membrane stack, and the transfer of water
Membranes in ChE Education
The electrodialysis sytem is easy to operateand the students can perform the suggested
experiments in a typical undergraduatelaboratory period. The experiments can
be used in a variety of undergraduateclasses, including a unit operations
laboratory or separations course.
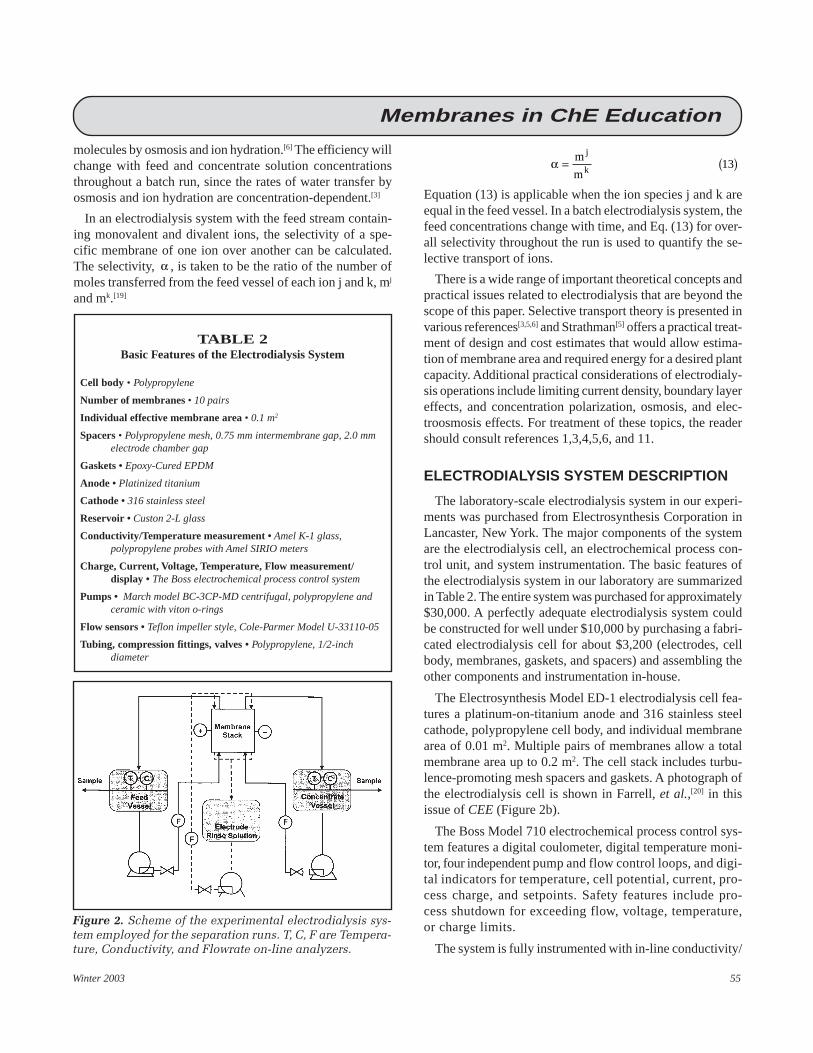
Winter 2003 55
molecules by osmosis and ion hydration.[6] The efficiency willchange with feed and concentrate solution concentrationsthroughout a batch run, since the rates of water transfer byosmosis and ion hydration are concentration-dependent.[3]
In an electrodialysis system with the feed stream contain-ing monovalent and divalent ions, the selectivity of a spe-cific membrane of one ion over another can be calculated.The selectivity, α , is taken to be the ratio of the number ofmoles transferred from the feed vessel of each ion j and k, mj
and mk.[19]
TABLE 2Basic Features of the Electrodialysis System
Cell body • Polypropylene
Number of membranes • 10 pairs
Individual effective membrane area • 0.1 m2
Spacers • Polypropylene mesh, 0.75 mm intermembrane gap, 2.0 mmelectrode chamber gap
Gaskets • Epoxy-Cured EPDM
Anode • Platinized titanium
Cathode • 316 stainless steel
Reservoir • Custon 2-L glass
Conductivity/Temperature measurement • Amel K-1 glass,polypropylene probes with Amel SIRIO meters
Charge, Current, Voltage, Temperature, Flow measurement/display • The Boss electrochemical process control system
Pumps • March model BC-3CP-MD centrifugal, polypropylene andceramic with viton o-rings
Flow sensors • Teflon impeller style, Cole-Parmer Model U-33110-05
Tubing, compression fittings, valves • Polypropylene, 1/2-inchdiameter
α = ( )m
m
j
k 13
Equation (13) is applicable when the ion species j and k areequal in the feed vessel. In a batch electrodialysis system, thefeed concentrations change with time, and Eq. (13) for over-all selectivity throughout the run is used to quantify the se-lective transport of ions.
There is a wide range of important theoretical concepts andpractical issues related to electrodialysis that are beyond thescope of this paper. Selective transport theory is presented invarious references[3,5,6] and Strathman[5] offers a practical treat-ment of design and cost estimates that would allow estima-tion of membrane area and required energy for a desired plantcapacity. Additional practical considerations of electrodialy-sis operations include limiting current density, boundary layereffects, and concentration polarization, osmosis, and elec-troosmosis effects. For treatment of these topics, the readershould consult references 1,3,4,5,6, and 11.
ELECTRODIALYSIS SYSTEM DESCRIPTION
The laboratory-scale electrodialysis system in our experi-ments was purchased from Electrosynthesis Corporation inLancaster, New York. The major components of the systemare the electrodialysis cell, an electrochemical process con-trol unit, and system instrumentation. The basic features ofthe electrodialysis system in our laboratory are summarizedin Table 2. The entire system was purchased for approximately$30,000. A perfectly adequate electrodialysis system couldbe constructed for well under $10,000 by purchasing a fabri-cated electrodialysis cell for about $3,200 (electrodes, cellbody, membranes, gaskets, and spacers) and assembling theother components and instrumentation in-house.
The Electrosynthesis Model ED-1 electrodialysis cell fea-tures a platinum-on-titanium anode and 316 stainless steelcathode, polypropylene cell body, and individual membranearea of 0.01 m2. Multiple pairs of membranes allow a totalmembrane area up to 0.2 m2. The cell stack includes turbu-lence-promoting mesh spacers and gaskets. A photograph ofthe electrodialysis cell is shown in Farrell, et al.,[20] in thisissue of CEE (Figure 2b).
The Boss Model 710 electrochemical process control sys-tem features a digital coulometer, digital temperature moni-tor, four independent pump and flow control loops, and digi-tal indicators for temperature, cell potential, current, pro-cess charge, and setpoints. Safety features include pro-cess shutdown for exceeding flow, voltage, temperature,or charge limits.
The system is fully instrumented with in-line conductivity/
Figure 2. Scheme of the experimental electrodialysis sys-tem employed for the separation runs. T, C, F are Tempera-ture, Conductivity, and Flowrate on-line analyzers.
Membranes in ChE Education

56 Chemical Engineering Education
temperature probes (K-1, AMEL, Milan, Italy), programmablemicroprocessor conductivity/resistivity indicator (modelSIRIO, AMEL s.r.l., Milan, Italy), Teflon impeller flow sen-sor (model U-33110-05, Cole Parmer, Vernon Hills, IL) withratemeter/totalizer (model DP78A, Omega Engineering, Inc.,Stamford, CT). Determination of cation concentrations formixed monovalent-divalent cation solutions was made usingion selective electrodes (divalent cation electrode Model 93-32 and ammonium electrode model 93-18 with sensing mod-ule, Thermo Orion, Beverly, MA).
The electrodialysis process is shown schematically in Fig-ure 2, and a photograph of the system is shown in the com-panion paper by Farrell, et al., (Figure 2a).[20] The system isoperated in batch recirculation mode. Continuous and batchmodes of operation, along with their relative advantages anddisadvantages, are described by Shaffer and Mintz.[6]
ION EXCHANGE MEMBRANESThe performance of ion-permeable membranes used in elec-
trochemical processes depends on several properties. Thedesirable characteristics of membranes used in electrodialy-sis applications include[5,21] selectivity between ions of oppo-site charge, high ionic conductivity, low electrical conduc-tion, long-term chemical stability, mechanical strength, andresistance to fouling. These characteristics are determined bythe membrj„ı matrix polymer and the fixed ionic moiety thateffects the ion selectivity of the membrane. Strathmann[5]
describes the challenges of optimization of these properties.Polymer materials such as polystyrene, polyethylene, andpolysulfone are often chosen for the membrane matrix and
Manufacturer Tradename Material Special Features Location
Solvay Perfluorinated film with fixed pyridine (anion-permeable) or France sulfonic acid (cation-permeable)
FuMA-Tech Polyetherketones, polysulfone, polyphenylene oxide Germany
Tokuyama Soda Neosepta® Styrene-divinyl benzene Robust high mechanical strength; JapanModerate electrical resistance
Asahi Glass Selemiom® Polystyrene-based Very low electrical resistance Japan
Asahi Chemical Aciplex® Styrene-divinyl benzene/PVC backing Japan
Ionics, Inc. Heterogeneous polystyrene-based/acrylic fabric, with fixed Rugged, low resistance, high select- MA, USAsulfonate (cation-permeable) and quarternary ammonium cations ivity, chemically stable, low fouling(anion-permeable)
Dupont Co. Nafion® Perflourinated sulfuric acid polymer Cation permeable NC, USA
Sybron Ionac® Heterogeneous resin-PVDF/fabric High mechanical strength NJ, USA
TABLE 3Ion Exchange Membranes Used in Electrodialysis Applications(Information from References 3, 21, and Membrane Manufacturers)
are often cross-linked to ensure stability. Fixed ionic moi-eties such as SO
3-, COO-, PO
32-, HPO
2-, AsO
32-, and SeO
3- are
commonly used for cation exchange membranes, and NH3+,
RNH2+, R
3N+, R
2N+, R
3P+, R
2S+, are common choices for an-
ion-exchange membranes.[5]
There are several manufacturers of ion-selective membranesfor a variety of electrochemical process applications. Table 3provides information on the materials and features of severalion exchange membranes used in electrodialysis applications.Detailed information on membrane manufacturers and mem-brane characteristics is provided in reference books[3,21] anddirectly from the manufacturers. Membrane replacement costsare on the order of $100/m2.
Tokuyama Soda Neosepta® ion-exchange membranes areused in our experiments. Two Neosepta cation exchangemembanes, CMX and CMS, were investigated, while the sameanion exchange membranes, Neosepta AMX, were used inall experiments. Neosepta AMX and CMX membranes arestandard grade, general-purpose polystyrene-based ion ex-change membranes. Neosepta CMS membranes have a thincationic charged layer on the membrane surface that increasesthe selectivity between monovalent cations (i.e., NH4+) andmultivalent cations (i.e., Mg2+). Neosepta membranes havehigh ionic selectivity, low electric resistance, and a low dif-fusion coefficient for solute or solvent. They exhibit high me-chanical strength and high dimensional stability, and arehighly resistant to chemical attack.
EXPERIMENTALAmmonium cations and chloride anions are contaminating
Membranes in ChE Education

Winter 2003 57
species that are commonly present in industrial processstreams. In this investigation, we considered removal of am-monium chloride from an aqueous stream. Experiments wereperformed to study the effect of the following parameters inthe removal of NH
4Cl from water: the initial concentration
of the concentrate vessel, the applied cell voltage, and theselection of the membranes. Additional experiments couldbe conducted to investigate other process parameters such asnumber of membrane pairs, flow rate, feed concentration, andtemperature (within the limits of the membranes). The sys-tem performance was evaluated using efficiency, selectivity,power, and energy consumption calculations.
The membrane stack was constructed with five pairs ofcation and anion exchange membranes, with a cation ex-change membrane adjacent to each electrode as describedabove. A solution of 0.5 M ammonium sulfate was used as
Figure 3. Effect of initial concentrate concentration atconstant voltage. Process operating conditions: 13 V, 1 M
feed (initial), AMX/CMX membranes.
the anolyte/catholyte rinse solution in order to prevent gen-eration of chlorine or hypochlorite, which would be hazard-ous. The feed solution was aqueous NH
4Cl or NH
4Cl/MgCl
2
with a total initial salt concentration of approximately 1.0 M.The concentrate stream was an aqueous NH
4Cl with an ini-
tial concentration between 0.05 and 0.2 M (specified for eachrun). At the anode, the expected predominant reaction in thissystem with a neutral solution is the formation of oxygen
2 4 4 142 2H O O H eg�( ) ( )+ −→ + + ( )
At the cathode, the formation of hydrogen gas is the pre-dominant reaction in neutral solution
2 2 2 152 2H O e H OHg ag�( )−
( ) ( )−+ → + ( )
The system was operated in a constant voltage, batch recir-culation mode. Flowrates were 0.5 L/min for the feed andconcentrate streams, and 0.7 L/min for the combined anolyteand catholyte streams. The following data were collected atregular intervals of ten minutes or less: liquid volume in eachvessel, conductivity of each stream, current, charge passed,and temperature. Completion of experiments took between70 and 90 minutes, depending on the applied voltage andother operating parameters. The experiment was consid-ered complete when the current dropped to approximately1.0 A. The ion concentrations were determined using con-ductivity measurements.
Initial concentration of the concentrate vessel is importantbecause it is a key parameter in the resistance of the mem-brane stack. If the concentrate stream initially has an ex-tremely low ion concentration, water splitting may occur inorder to provide the ions necessary to carry the current. (Wa-ter splitting generates hydrogen ions and hydroxyl ions, which
are capable of migrating through the cation- or anion-selective membranes, respectively; this may result inpH changes in the diluate and concentrate compart-ments.) Thus, the concentrate stream is usually“primed” with a low electrolyte concentration to fa-cilitate transport of the desired ions from the feedstream. To illustrate this, the system performance iscompared using different initial concentrate vessel con-centrations. The effect of the initial ion concentrationin the concentrate stream is shown in Figure 3.
These runs were performed at a constant voltage of13 V using a 1.0 M NH
4Cl feed and 0.5 M (NH
4)
2SO
4
rinse, and the initial concentrate concentration wasvaried from 0.05 M to 0.2 M NH
4Cl. The figure shows
the decline in the feed ion concentration throughoutthe course of the runs. The rate of ion transport increaseswith increasing initial concentrate concentration. At
Figure 4. Effect of voltage on the feed concentration. Processoperating conditions: 1 M feed (initial), 0.1 concentrate (initial),
and AMX/CMX membranes.
Membranes in ChE Education
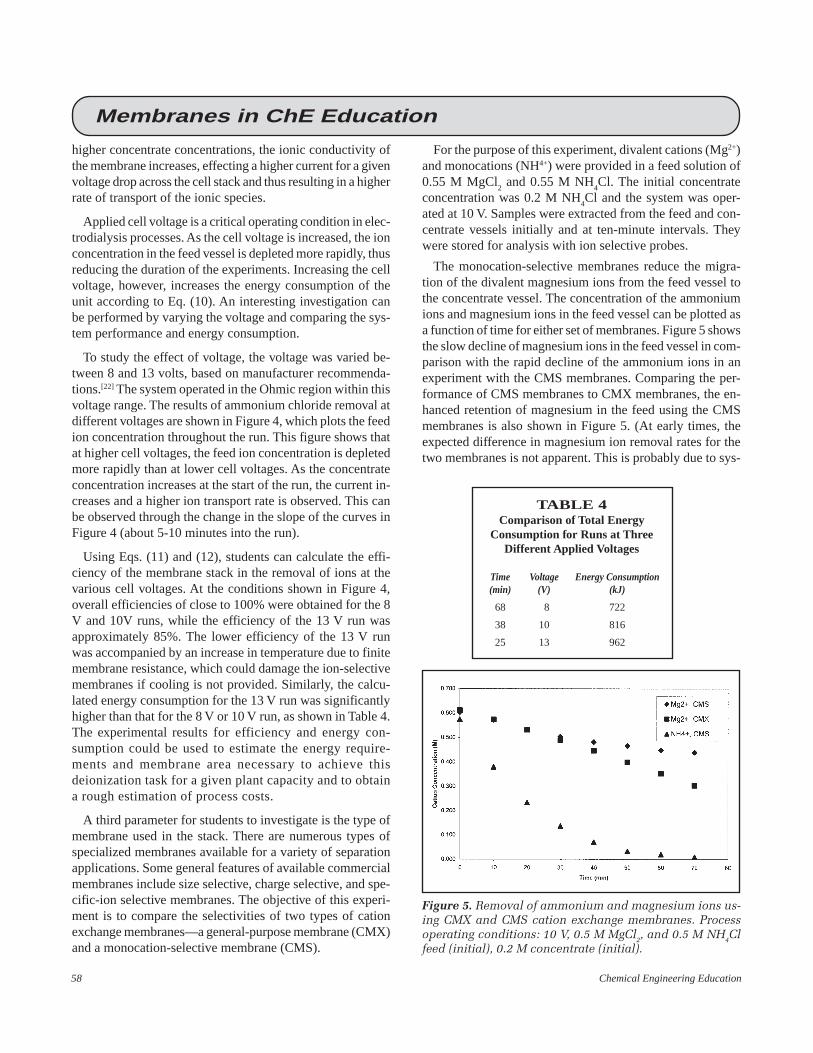
58 Chemical Engineering Education
higher concentrate concentrations, the ionic conductivity ofthe membrane increases, effecting a higher current for a givenvoltage drop across the cell stack and thus resulting in a higherrate of transport of the ionic species.
Applied cell voltage is a critical operating condition in elec-trodialysis processes. As the cell voltage is increased, the ionconcentration in the feed vessel is depleted more rapidly, thusreducing the duration of the experiments. Increasing the cellvoltage, however, increases the energy consumption of theunit according to Eq. (10). An interesting investigation canbe performed by varying the voltage and comparing the sys-tem performance and energy consumption.
To study the effect of voltage, the voltage was varied be-tween 8 and 13 volts, based on manufacturer recommenda-tions.[22] The system operated in the Ohmic region within thisvoltage range. The results of ammonium chloride removal atdifferent voltages are shown in Figure 4, which plots the feedion concentration throughout the run. This figure shows thatat higher cell voltages, the feed ion concentration is depletedmore rapidly than at lower cell voltages. As the concentrateconcentration increases at the start of the run, the current in-creases and a higher ion transport rate is observed. This canbe observed through the change in the slope of the curves inFigure 4 (about 5-10 minutes into the run).
Using Eqs. (11) and (12), students can calculate the effi-ciency of the membrane stack in the removal of ions at thevarious cell voltages. At the conditions shown in Figure 4,overall efficiencies of close to 100% were obtained for the 8V and 10V runs, while the efficiency of the 13 V run wasapproximately 85%. The lower efficiency of the 13 V runwas accompanied by an increase in temperature due to finitemembrane resistance, which could damage the ion-selectivemembranes if cooling is not provided. Similarly, the calcu-lated energy consumption for the 13 V run was significantlyhigher than that for the 8 V or 10 V run, as shown in Table 4.The experimental results for efficiency and energy con-sumption could be used to estimate the energy require-ments and membrane area necessary to achieve thisdeionization task for a given plant capacity and to obtaina rough estimation of process costs.
A third parameter for students to investigate is the type ofmembrane used in the stack. There are numerous types ofspecialized membranes available for a variety of separationapplications. Some general features of available commercialmembranes include size selective, charge selective, and spe-cific-ion selective membranes. The objective of this experi-ment is to compare the selectivities of two types of cationexchange membranes—a general-purpose membrane (CMX)and a monocation-selective membrane (CMS).
TABLE 4Comparison of Total Energy
Consumption for Runs at ThreeDifferent Applied Voltages
Time Voltage Energy Consumption(min) (V) (kJ)
68 8 722
38 10 816
25 13 962
Figure 5. Removal of ammonium and magnesium ions us-ing CMX and CMS cation exchange membranes. Processoperating conditions: 10 V, 0.5 M MgCl2, and 0.5 M NH4Clfeed (initial), 0.2 M concentrate (initial).
For the purpose of this experiment, divalent cations (Mg2+)and monocations (NH4+) were provided in a feed solution of0.55 M MgCl
2 and 0.55 M NH
4Cl. The initial concentrate
concentration was 0.2 M NH4Cl and the system was oper-
ated at 10 V. Samples were extracted from the feed and con-centrate vessels initially and at ten-minute intervals. Theywere stored for analysis with ion selective probes.
The monocation-selective membranes reduce the migra-tion of the divalent magnesium ions from the feed vessel tothe concentrate vessel. The concentration of the ammoniumions and magnesium ions in the feed vessel can be plotted asa function of time for either set of membranes. Figure 5 showsthe slow decline of magnesium ions in the feed vessel in com-parison with the rapid decline of the ammonium ions in anexperiment with the CMS membranes. Comparing the per-formance of CMS membranes to CMX membranes, the en-hanced retention of magnesium in the feed using the CMSmembranes is also shown in Figure 5. (At early times, theexpected difference in magnesium ion removal rates for thetwo membranes is not apparent. This is probably due to sys-
Membranes in ChE Education
Winter 2003 59
tem equilibration and run-to-run variations that are most ap-parent at start-up. The difference in removal rates for the tworuns is evident after 20 minutes.)
The overall selectivity throughout the run, for ammoniumrelative to magnesium, is calculated using Eq. (13), using thetotal number moles of each ion removed from the feed at thecompletion of a 70-minute run. The total number of moles ofeach ion transferred from the feed is determined by integrat-ing Eq. (3) for the duration of the run.
For the general-purpose CMX membrane, the overall se-lectivity was 1.04, indicating that the average removal ratesof ammonium and magnesium are approximately equal. Forthe monocation-selective membrane, the overall selectiv-ity was 2.8, indicating that the CMS membrane selectivelyenhances the removal of monovalent ammonium ions fromthe feed.
CONCLUSIONS
We have developed an experimental investigation of thepractical engineering aspects of electrodialysis. Students in-vestigate the effects of operating parameters such as concen-trate concentration and applied voltage. Membrane selectionis explored through comparison of two cation exchange mem-branes for the selective removal of competing cations.
Additional experiments could be conducted to investigateother process parameters such as the number of membranepairs, flow rate, feed concentration, and temperature (withinthe limits of the membranes). Data analysis and calculationsemphasize practical engineering considerations such as en-ergy consumption, efficiency, and selectivity.
The electrodialysis sytem is easy to operate and the stu-dents can perform the suggested experiments in a typicalundergraduate laboratory period. These experiments can beused in a variety of undergraduate classes, including a unitoperations laboratory or separations course. Advanced coursesthat would be enhanced with electrodialysis experiments arespecialized topics courses such as green/environmental en-gineering, wastewater treatment, electrochemical engineer-ing, pharmaceutical engineering, and food engineering.
ACKNOWLEDGMENTS
Support for the laboratory development activity describedin this paper was provided for by Johnson Matthey, Inc., agrant (DUE 9850535) from the National Science Founda-tion, and the Chemical Engineering Department at RowanUniversity. The authors gratefully acknowledge the work ofRowan engineering students, particularly Natalie Deflece andCraig Rogers, in conducting experiments.
REFERENCES
1. Mulder, M., Basic Principles of Membrane Technology, 2nd ed., KluwerAcademic Publishers, Dordrecht, Holland (1996)
2. Electrosynthesis Company promotional literature at<www.electrosynthesis.com> accessed May 6, 2001
3. Strathmann, H., “Electrodialysis” in Synthetic Membranes: Science,Engineering, and Applications, P.M. Bungay, H.K. Lonsdale, andM.N.D. de Pinho, eds., Reidel Publishing Company, Dordrecht, Hol-land (1986)
4. Davis, T.A., “Electrodialysis,” in Handbook of Industrial MembraneTechnology, M.C. Porter, ed., Noyes Publications, Park Ridge, NJ(1990)
5. Strathmann, H. “Electrodialysis,” in Membrane Handbook, W.S. Hoand K.K. Sirkar, eds., Van Nostrand Reinhold, New York, NY (1992)
6. Shaffer, L.H., and M.S. Mintz, Principles of Desalination, AcademicPress, Inc., New York, NY (1980)
7. Slater, C.S., “Teaching the Engineering Aspects of Membrane ProcessTechnology,” J. Membr. Sci., 62, 239 (1991)
8. Slater, C.S., and H.C. Hollein, “Educational Initiatives in TeachingMembrane Technology,” Desal., 90, 291 (1993)
9. Slater, C.S., “Education on Membrane Science and Technology” inMembrane Processes in Separation and Purification, J.G. Crespo andK.W. Boddeker, eds., Kluwer Academic Publishers, Dordrecht, Neth-erlands, pg. 479 (1994)
10. Kendall, A.I., and E. Gebauer-Fuelnegg, “Electrodialysis with SimpleApparatus,” J. Chem. Ed., 8, 1634 (1931)
11. Lacey, R.E., “Basis of Electromembrane Processes” in Industrial Pro-cessing with Membranes, R.E. Lacey and S. Loeb, eds., John Wileyand Sons, New York, NY (1972)
12. Ottewill, G., and F. Walsh, “Education Topics Number 2: The Speedof Metal Deposition and Dissolution,” Trans. Inst. Met. Finish, 77(5),209 (1999)
13. Walsh, F., and G. Ottewill, “Education Topic Number 3: Electrochemi-cal Cell Reactions,” Trans. Inst. Met. Finish, 77(4), 169 (1999)
14. Walsh. F., and D. Robinson, “Electrochemical Filter-Press Reactors:Technology Designed for Versatility and Efficiency,” Electrochemi-cal Soc. Interface, 7(2), 40 (1998)
15. Walsh, F., and G. Ottewill, “Electrochemical Cells,” Chem. Rev., 5(4),2 (1996)
16. Trinidad, P., and F. Walsh, “Conversion Expressions for Electrochemi-cal Reactors Which Operate Under Mass Transport Controlled Reac-tion Conditions: Part 1. Batch Reactor, PFR, and CSTR,” Int. J. Eng.Ed., 14(6), 431 (1998)
17. Expósito, E., M.J. Inglés, J. Iniesta, J. González-García, P. Bonete, V.García-García, and V. Montiel, “Removal of Heavy Metals in Waste-water by Electrochemical Treatment,” Chem. Eng. Ed., 33(2), 172(1999)
18. García-García, V., V. Montiel, J. González-García, E. Expósito, J.Iniesta, P. Bonete, and E.M. Inglés, “The Application of Electrodialy-sis to Desalting an Amino Acid Solution,” J. Chem. Ed., 77(11), 1477(2000)
19. Wankat, P.C., Rate Controlled Separations, Kluwer, Amsterdam (1990)20. Farrell, S., R.P. Hesketh, M.J. Savelski, K.D. Dahm, and C.S. Slater,
“Membrane Projects with an Industrial Focus in the Curriculum,”Chem. Eng. Ed., 37(1), 68 (2003)
21. Davis, T.A., J.D. Genders, and D. Pletcher, A First Course in Ion Per-meable Membranes, The Electrochemical Consultancy, Hants, England(1997)
22. Personal communication with Duane Mazur, Electrosynthesis Com-pany, June 9, 1999 ❐
Membranes in ChE Education
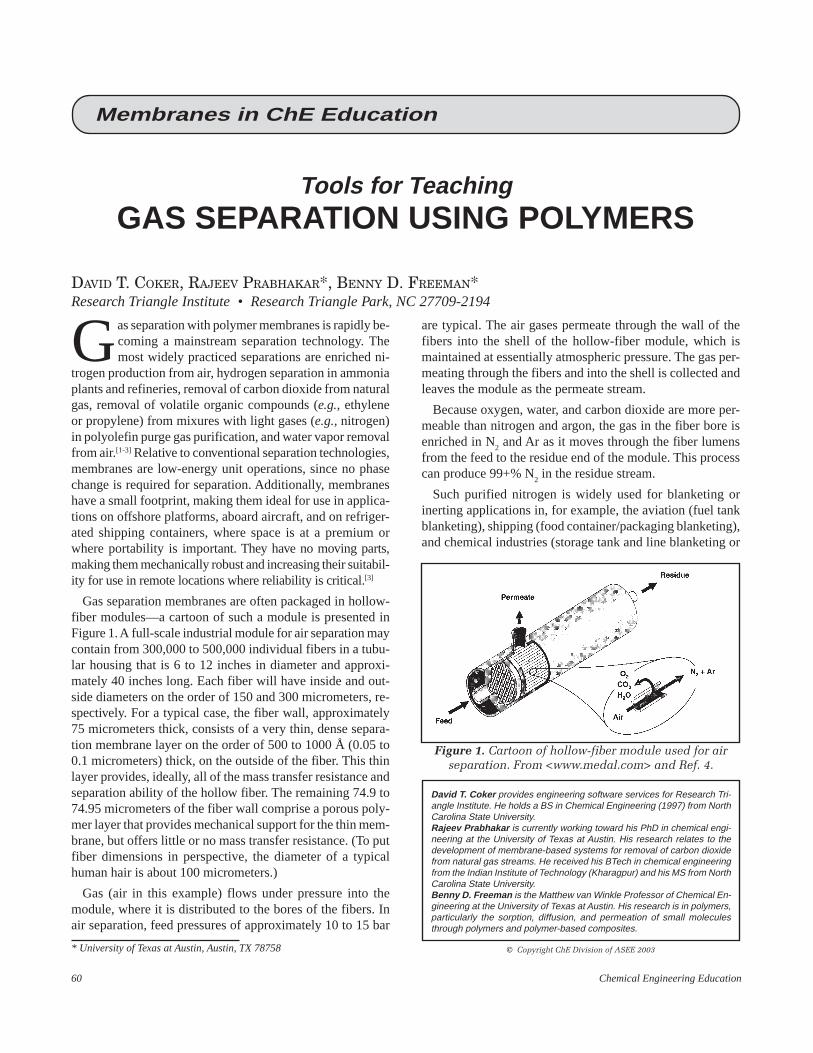
60 Chemical Engineering Education
Tools for TeachingGAS SEPARATION USING POLYMERS
DAVID T. COKER, RAJEEV PRABHAKAR*, BENNY D. FREEMAN*Research Triangle Institute • Research Triangle Park, NC 27709-2194
* University of Texas at Austin, Austin, TX 78758
Gas separation with polymer membranes is rapidly be-coming a mainstream separation technology. Themost widely practiced separations are enriched ni-
trogen production from air, hydrogen separation in ammoniaplants and refineries, removal of carbon dioxide from naturalgas, removal of volatile organic compounds (e.g., ethyleneor propylene) from mixures with light gases (e.g., nitrogen)in polyolefin purge gas purification, and water vapor removalfrom air.[1-3] Relative to conventional separation technologies,membranes are low-energy unit operations, since no phasechange is required for separation. Additionally, membraneshave a small footprint, making them ideal for use in applica-tions on offshore platforms, aboard aircraft, and on refriger-ated shipping containers, where space is at a premium orwhere portability is important. They have no moving parts,making them mechanically robust and increasing their suitabil-ity for use in remote locations where reliability is critical.[3]
Gas separation membranes are often packaged in hollow-fiber modules—a cartoon of such a module is presented inFigure 1. A full-scale industrial module for air separation maycontain from 300,000 to 500,000 individual fibers in a tubu-lar housing that is 6 to 12 inches in diameter and approxi-mately 40 inches long. Each fiber will have inside and out-side diameters on the order of 150 and 300 micrometers, re-spectively. For a typical case, the fiber wall, approximately75 micrometers thick, consists of a very thin, dense separa-tion membrane layer on the order of 500 to 1000 Å (0.05 to0.1 micrometers) thick, on the outside of the fiber. This thinlayer provides, ideally, all of the mass transfer resistance andseparation ability of the hollow fiber. The remaining 74.9 to74.95 micrometers of the fiber wall comprise a porous poly-mer layer that provides mechanical support for the thin mem-brane, but offers little or no mass transfer resistance. (To putfiber dimensions in perspective, the diameter of a typicalhuman hair is about 100 micrometers.)
Gas (air in this example) flows under pressure into themodule, where it is distributed to the bores of the fibers. Inair separation, feed pressures of approximately 10 to 15 bar
David T. Coker provides engineering software services for Research Tri-angle Institute. He holds a BS in Chemical Engineering (1997) from NorthCarolina State University.Rajeev Prabhakar is currently working toward his PhD in chemical engi-neering at the University of Texas at Austin. His research relates to thedevelopment of membrane-based systems for removal of carbon dioxidefrom natural gas streams. He received his BTech in chemical engineeringfrom the Indian Institute of Technology (Kharagpur) and his MS from NorthCarolina State University.Benny D. Freeman is the Matthew van Winkle Professor of Chemical En-gineering at the University of Texas at Austin. His research is in polymers,particularly the sorption, diffusion, and permeation of small moleculesthrough polymers and polymer-based composites.
Figure 1. Cartoon of hollow-fiber module used for airseparation. From <www.medal.com> and Ref. 4.
are typical. The air gases permeate through the wall of thefibers into the shell of the hollow-fiber module, which ismaintained at essentially atmospheric pressure. The gas per-meating through the fibers and into the shell is collected andleaves the module as the permeate stream.
Because oxygen, water, and carbon dioxide are more per-meable than nitrogen and argon, the gas in the fiber bore isenriched in N
2 and Ar as it moves through the fiber lumens
from the feed to the residue end of the module. This processcan produce 99+% N
2 in the residue stream.
Such purified nitrogen is widely used for blanketing orinerting applications in, for example, the aviation (fuel tankblanketing), shipping (food container/packaging blanketing),and chemical industries (storage tank and line blanketing or
Membranes in ChE Education
© Copyright ChE Division of ASEE 2003
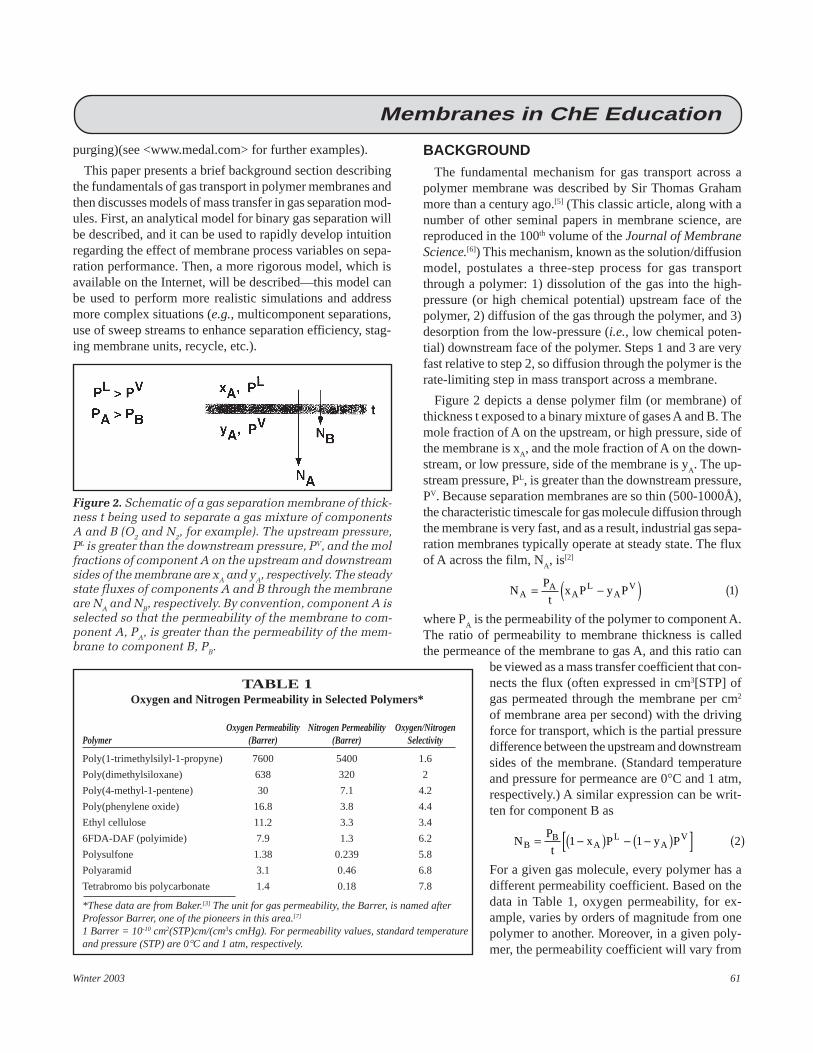
Winter 2003 61
purging)(see <www.medal.com> for further examples).
This paper presents a brief background section describingthe fundamentals of gas transport in polymer membranes andthen discusses models of mass transfer in gas separation mod-ules. First, an analytical model for binary gas separation willbe described, and it can be used to rapidly develop intuitionregarding the effect of membrane process variables on sepa-ration performance. Then, a more rigorous model, which isavailable on the Internet, will be described—this model canbe used to perform more realistic simulations and addressmore complex situations (e.g., multicomponent separations,use of sweep streams to enhance separation efficiency, stag-ing membrane units, recycle, etc.).
Figure 2. Schematic of a gas separation membrane of thick-ness t being used to separate a gas mixture of componentsA and B (O2 and N2, for example). The upstream pressure,PL is greater than the downstream pressure, PV, and the molfractions of component A on the upstream and downstreamsides of the membrane are xA and yA, respectively. The steadystate fluxes of components A and B through the membraneare NA and NB, respectively. By convention, component A isselected so that the permeability of the membrane to com-ponent A, PA, is greater than the permeability of the mem-brane to component B, PB.
BACKGROUNDThe fundamental mechanism for gas transport across a
polymer membrane was described by Sir Thomas Grahammore than a century ago.[5] (This classic article, along with anumber of other seminal papers in membrane science, arereproduced in the 100th volume of the Journal of MembraneScience.[6]) This mechanism, known as the solution/diffusionmodel, postulates a three-step process for gas transportthrough a polymer: 1) dissolution of the gas into the high-pressure (or high chemical potential) upstream face of thepolymer, 2) diffusion of the gas through the polymer, and 3)desorption from the low-pressure (i.e., low chemical poten-tial) downstream face of the polymer. Steps 1 and 3 are veryfast relative to step 2, so diffusion through the polymer is therate-limiting step in mass transport across a membrane.
Figure 2 depicts a dense polymer film (or membrane) ofthickness t exposed to a binary mixture of gases A and B. Themole fraction of A on the upstream, or high pressure, side ofthe membrane is x
A, and the mole fraction of A on the down-
stream, or low pressure, side of the membrane is yA. The up-
stream pressure, PL, is greater than the downstream pressure,PV. Because separation membranes are so thin (500-1000Å),the characteristic timescale for gas molecule diffusion throughthe membrane is very fast, and as a result, industrial gas sepa-ration membranes typically operate at steady state. The fluxof A across the film, N
A, is[2]
NP
tx P y PA
AA
LA
V= −( ) ( )1
where PA is the permeability of the polymer to component A.
The ratio of permeability to membrane thickness is calledthe permeance of the membrane to gas A, and this ratio can
be viewed as a mass transfer coefficient that con-nects the flux (often expressed in cm3[STP] ofgas permeated through the membrane per cm2
of membrane area per second) with the drivingforce for transport, which is the partial pressuredifference between the upstream and downstreamsides of the membrane. (Standard temperatureand pressure for permeance are 0°C and 1 atm,respectively.) A similar expression can be writ-ten for component B as
NP
tx P y PB
BA
LA
V= −( ) − −( )[ ] ( )1 1 2
For a given gas molecule, every polymer has adifferent permeability coefficient. Based on thedata in Table 1, oxygen permeability, for ex-ample, varies by orders of magnitude from onepolymer to another. Moreover, in a given poly-mer, the permeability coefficient will vary from
TABLE 1Oxygen and Nitrogen Permeability in Selected Polymers*
Oxygen Permeability Nitrogen Permeability Oxygen/NitrogenPolymer (Barrer) (Barrer) Selectivity
Poly(1-trimethylsilyl-1-propyne) 7600 5400 1.6
Poly(dimethylsiloxane) 638 320 2
Poly(4-methyl-1-pentene) 30 7.1 4.2
Poly(phenylene oxide) 16.8 3.8 4.4
Ethyl cellulose 11.2 3.3 3.4
6FDA-DAF (polyimide) 7.9 1.3 6.2
Polysulfone 1.38 0.239 5.8
Polyaramid 3.1 0.46 6.8
Tetrabromo bis polycarbonate 1.4 0.18 7.8
*These data are from Baker.[3] The unit for gas permeability, the Barrer, is named afterProfessor Barrer, one of the pioneers in this area.[7]
1 Barrer = 10-10 cm2(STP)cm/(cm3s cmHg). For permeability values, standard temperatureand pressure (STP) are 0°C and 1 atm, respectively.
Membranes in ChE Education

62 Chemical Engineering Education
Figure 3. Permeate purity as a function of mem-brane selectivity for a feed composition, xA, of 1 molepercent A (99 mol percent B) and a pressure ratioof 20.
Membranes in ChE Education
one gas to the next, and it is this property that allows the polymerto separate gas mixtures. The data in Table 1 indicate that oxygenis always more permeable than nitrogen in all polymers, and theratio of O
2 to N
2 permeability, the selectivity, varies from 1.6 to
7.8 in the materials shown. Typically, as the permeability of apolymer to oxygen increases, its selectivity decreases, and viceversa.[8.9] In the most widely used gas separation membranes, per-meability coefficients often decrease with increasing gas mol-ecule size, so most gas separation membranes are more perme-able to small molecules (e.g., H
2) than to larger molecules (e.g.,
CH4). There are interesting exceptions to this general rule, and
membranes based on such materials may become more common-place in the near future.[10-12]
ANALYTICAL CROSSFLOW MODEL
The mole fraction of gas A on the permeate or downstream sideof the membrane is given by the flux of component A through themembrane divided by the total gas flux through the membrane
yN
N N
P
tx P y P
P
tx P y P
P
tx P y P
AA
A B
AA
LA
V
AA
LA
V BA
LA
V=
+=
−( )−( )+ −( ) − −( )[ ]
( )
1 1
3
This expression can be reorganized as follows to permit a directcalculation of permeate purity:
yR
x
R
Rx
Rx
A
A A
A
=+ −( ) +
−( )+
−( )
+ −( ) +
−
( )1 1
1
21
1
41
1 11
1 42
1 2
α
α
α α
α
/
where the selectivity, α , is defined as the ratio of permeabilitycoefficients ( α =P
A/P
B) and the pressure ratio, R, is defined as the
ratio of feed to permeate pressure (R=Pl/PV). Equation 4 can beused to determine the effect of feed composition, pressure ratio,and membrane selectivity on the mole fraction of gas producedby a membrane.
There are two limits of Eq. (4) that provide insight into thefactors that govern the ultimate separation performance of mem-branes. It is easier to see these two limits if, instead of using Eq.(4) directly, we use the following equivalent reorganized form ofEq. (3):
y
y
Rx y
R x yA
A
A A
A Aα 1 1 15
−( ) = −−( ) − −( ) ( )
Figure 3 presents the permeate purity as a function of membraneselectivity, and the two limits of interest are shown. The first limit
to be discussed is the pressure ratio limit. As membraneselectivity increases, the permeate mole fraction, y
A, will
increase, but yA can only increase up to the point that the
partial pressure of component A on the upstream side (xAPL)
of the membrane equals that on the downstream side (yAPV).
At this point, the driving force for transport of A across themembrane is zero, the flux of component A goes to zero,and there can be no further increase in the mole fraction ofcomponent A in the permeate. Therefore, in the limit of veryhigh selectivity (i.e., as α → ∞ in Eq. 5 and, therefore, Eq4), Eq. (5) reduces to
y RxA A= ( )6
That is, at high selectivity, the purity of gas produced islimited by the pressure ratio. Of course, the value of y
A can
never be greater than unity.
This limit has industrial significance in situations wereselectivity is very high and process conditions dictate a smallpressure ratio between permeate and feed streams. An ex-ample is the removal of hydrogen from mixtures with hy-drocarbons in hydrotreaters in refineries.[3] The hydrocar-bons in such a mixture would be methane and higher hy-drocarbons, all of which are less permeable than methanein the membranes used for such separations. Typically, H
2
is hundreds of times more permeable than CH4 and other
components in such a mixture.[2] But typical upstream anddownstream pressures would be 120 and 30 bar, respec-tively,[3] so the pressure ratio would only be 4. In such acase, having very high selectivity does not result in much

Winter 2003 63
Figure 4. Permeate purity as a function of pressureratio for a feed composition, xA, of 1 mole percentA (99 mol percent B) and a selectivity of 30.
Membranes in ChE Education
higher-purity H2 in the permeate because the H
2 permeation
is at or near the limit where its partial pressure upstream anddownstream are almost equal.
Another example is dehydration of gas streams such as air.Typically, water is much more permeable than air gases inpolymers used for gas separation, so the amount of waterthat can be removed from a gas stream is often limited by theability to keep the partial pressure of water very low in thepermeate gas. This is often done by recycling some of thedry residue gas product back across the permeate side of themembrane to dilute the concentration of water being producedin the membrane. Such so-called purge or permeate sweepstrategies can markedly reduce the dew point of air producedby dehydration membranes.[4]
At the other extreme, if the membrane is operated with avacuum on the permeate side of the membrane (i.e., R → ∞),then Eq. 5 becomes
yx
xAA
A=
+ −( ) ( )αα1 1
7
and permeate purity is limited by polymer selectivity. As per-meate pressure, PV, decreases toward zero (or, equivalently,as the ratio of feed to permeate pressure increases to the pointthat the partial pressures of components A and B in the per-meate become very small relative to their partial pressures inthe feed), the flux of components A and B approach maxi-mum values based on membrane permeability, thickness,composition, and upstream pressure
NP
tx P and N
P
tx PA
AA
LB
BA
L→ → −( ) ( )1 8
When the expressions in Eq. (8) are used to evaluate perme-ate purity based on y
A = N
A/(N
A+N
B), Eq. (7) is obtained. In
this case, the mole fraction of component A in the permeateis then limited by the ability of the membrane to prevent trans-port of component B across the membrane; that is to say,permeate purity is limited by membrane selectivity. This limitis shown in Figure 3 and also in Figure 4, which presentspermeate mole fraction as a function of pressure ratio. Thislimit is reached when the pressure ratio is very high or themembrane selectivity is low.
An example of practical importance is the separation of N2
from CH4 in natural gas wells, a separation that is currently
not practiced industrially using membranes because of thisissue.[3] Many natural gas wells are contaminated with nitro-gen, which would need to be removed to bring the heatingvalue of the natural gas to pipeline specifications.[3] But poly-mer membranes rarely have an N
2/CH
4 selectivity greater than
2. In this case, even for large pressure ratios, the separationof this gas mixture is not good using membranes. For ex-ample, when the feed mole fraction of N
2 is 2%, the perme-
ate mole fraction of N2 is only 3.9%, and at a feed mole frac-
tion of 20%, the permeate mole fraction is only 33%. Thereis little separation, and most of the low-pressure permeatewaste gas is methane. That is (because the separation is poor),there is a large loss of methane into the low-pressure perme-ate stream with little removal of N
2 from the feed gas.
INTERNET MODELThe analytical model described above is applicable to sepa-
ration of binary mixtures only. Moreover, it does not accountfor the fact that as the feed gas travels through the hollowfibers, its composition changes as selective permeation stripsthe more permeable components from the feed-gas mixture.A classic extension of this model, due to Weller and Steiner,takes this factor into account.[13] This model, however, is nolonger strictly an analytical solution, Moreover, it cannotsimulate the countercurrent flow patterns that are used in-dustrially in gas-separation modules. As indicated qualita-tively in Figure 1, typical industrial permeators are designedto allow the feed gas and permeate gas to flow countercur-rent to one another. Moreover, this model does not allow forseparation of multicomponent mixtures of gases, which is amajor practical limitation.
The simple model described above has been extended toaccount for multicomponent gas separation and to simulatecountercurrent flow.[4,14] In this case, the governing mass bal-ance equations are coupled differential equations, and noanalytical solution is available. Numerical solutions to thismodel are available for public use at
http://membrane.ces.utexas.edu

64 Chemical Engineering Education
Figure 5. Schematic of hollow-fiber module divided into N stages. In analogy with labeling conventions used in distillation,the flow rate of gas leaving the upstream (i.e., residue) side of stage k is labeled Lk, and the flow rate of gas leaving thedownstream (i.e., permeate) side of stage k is labeled Vk. The flow rate of gas of component j that permeates from theupstream to the downstream side of stage k is m j,k . The mole fractions of component j leaving stage k on the upstream anddownstream sides of the membrane are xj,k and yj,k, respectively. Adapted from the literature.[4]
Membranes in ChE Education
The basic notion underlying the multicomponent, counter-current simulator developed by Coker, et al., is presented inFigure 5, which shows a diagram of the hollow-fiber modulefrom Figure 1 divided axially into N slices or stages. In atypical simulation, N ranges from a few hundred to severalthousand, depending on how rapidly the concentration of themost permeable species changes with axial position alongthe module. Inside each stage of the membrane, mass trans-fer occurs according to Eq. (1), which is written analogouslyfor each component.
Using an approach originally developed for staged unitoperations such as distillation,[15] the flow of each compo-nent from stage to stage is linked by a mass balance. The setof mass balances for each component on each stage can bewritten in the form of a family of tridiagonal matrices, whichare solved using the Thomas algorithm.[16] The mass balancesare nonlinear, so an iterative solution is required. Moreover,the model allows for pressure in the bore of the hollow fi-bers to change according to the Hagen-Poiseuille equa-tion, and this introduces another source of nonlinearityinto the problem. The details of the solution are providedin the literature.[4]
The simulation is organized to perform analysis calcula-tions. That is, the membrane permeation characteristics, thick-ness, fiber inner and outer diameter, fiber length, and num-ber of fibers are all specified via a graphical user interface,shown in Figure 6. The user may select bore-side or shell-side feed. It should be noted that the model is based on plugflow of gas through the module and fibers, so effects associ-ated with gas maldistribution in the module are not captured.The reader is directed to the work of Lipscomb and colleaguesfor a more detailed description of these effects.[17]
The so-called “pot length” of the fibers must be specifiedin the simulation. When membrane fibers are assembled intoa module, the membrane bundle is glued or “potted” on bothends in epoxy to provide a leak-free connection between the
fiber bundle and the module housing. Gas can travel downthe bore of the fibers in the potted region of the module, whichleads to a pressure drop along the bore of the fibers, but be-cause the fibers are covered with epoxy, there is no gas trans-port across the fiber wall. Typical values of pot length wouldbe 10 cm on each end of a fiber 100 cm long. So, in the case,the “active” length of a fiber (i.e., the length of fiber that isactive for mass transfer via permeation) would be 100 cm -2x10 cm (since the fiber is potted on both ends) = 80 cm.
An on-line databank is available with permeation proper-ties of a few common polymers, such as polysulfone, or theusers can supply their own permeation properties. The feedpressure, feed flowrate, feed composition, and permeate pres-sure are specified by the user. With these inputs, the simula-tor calculates the concentration, flow and pressure profiles inthe module, the residue and permeate composition andflowrate, and the residue pressure. The concentration and flowprofiles can be viewed as graphs built into the simulator. Auser can establish an account where membrane fiber and mod-ule data are stored, so that simulation conditions can be en-tered and stored for later use. Several example simulationscan be downloaded as pdf files.
USING THE INTERNET MODELFOR TEACHING
Two examples of the use of the model are presented. Otherexamples are given in the literature.[4,14] The first case involvesa membrane for air drying. The objective is to remove waterfrom air and produce dry air as the residue stream. In con-ventional gas-separation membranes, water is typically morepermeable (by a factor of 50 or more) than air gases such asN
2 and O
2, so H
2O/N
2 and H
2O/O
2 selectivities are very high.
Additionally, the mol fraction of water in air is low. For ex-ample, air at 40°C and 10 atmospheres total pressure (condi-tions that are common for feeding a gas-separation modulefor air separations), the mole fraction of water at saturation is
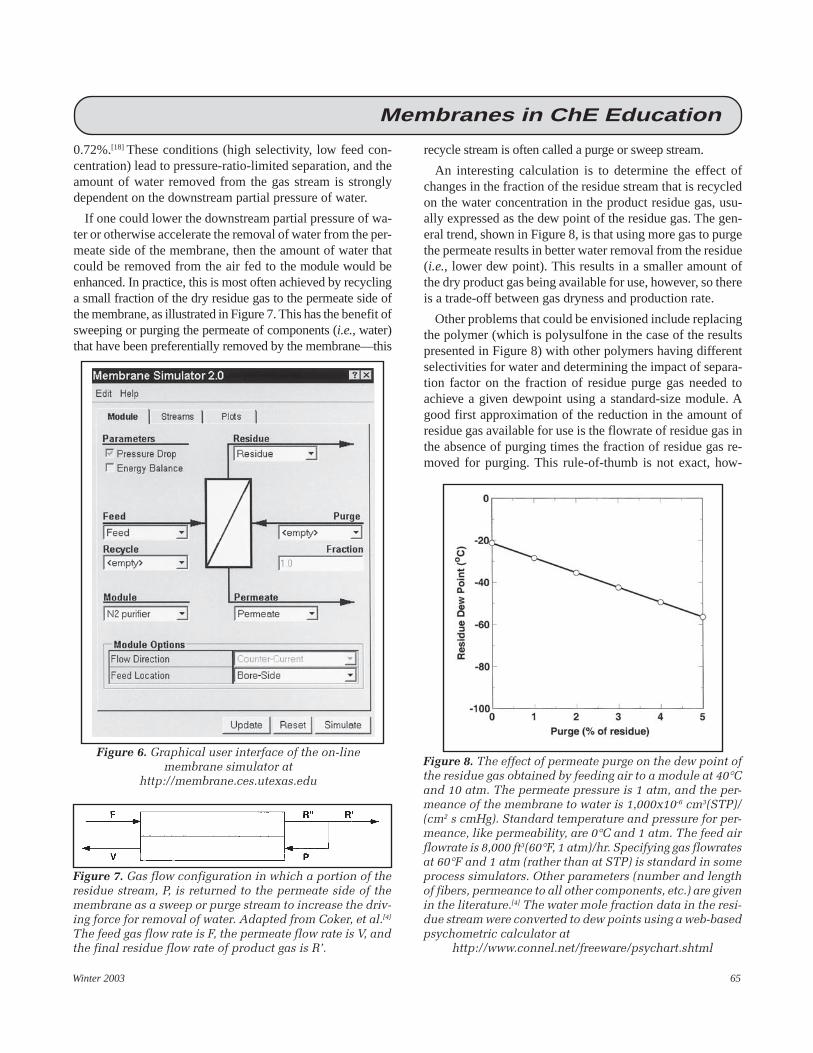
Winter 2003 65
Figure 6. Graphical user interface of the on-linemembrane simulator at
http://membrane.ces.utexas.edu
Figure 7. Gas flow configuration in which a portion of theresidue stream, P, is returned to the permeate side of themembrane as a sweep or purge stream to increase the driv-ing force for removal of water. Adapted from Coker, et al.[4]
The feed gas flow rate is F, the permeate flow rate is V, andthe final residue flow rate of product gas is R’.
Figure 8. The effect of permeate purge on the dew point ofthe residue gas obtained by feeding air to a module at 40°Cand 10 atm. The permeate pressure is 1 atm, and the per-meance of the membrane to water is 1,000x10-6 cm3(STP)/(cm2 s cmHg). Standard temperature and pressure for per-meance, like permeability, are 0°C and 1 atm. The feed airflowrate is 8,000 ft3(60°F, 1 atm)/hr. Specifying gas flowratesat 60°F and 1 atm (rather than at STP) is standard in someprocess simulators. Other parameters (number and lengthof fibers, permeance to all other components, etc.) are givenin the literature.[4] The water mole fraction data in the resi-due stream were converted to dew points using a web-basedpsychometric calculator at
http://www.connel.net/freeware/psychart.shtml
Membranes in ChE Education
0.72%.[18] These conditions (high selectivity, low feed con-centration) lead to pressure-ratio-limited separation, and theamount of water removed from the gas stream is stronglydependent on the downstream partial pressure of water.
If one could lower the downstream partial pressure of wa-ter or otherwise accelerate the removal of water from the per-meate side of the membrane, then the amount of water thatcould be removed from the air fed to the module would beenhanced. In practice, this is most often achieved by recyclinga small fraction of the dry residue gas to the permeate side ofthe membrane, as illustrated in Figure 7. This has the benefit ofsweeping or purging the permeate of components (i.e., water)that have been preferentially removed by the membrane—this
recycle stream is often called a purge or sweep stream.
An interesting calculation is to determine the effect ofchanges in the fraction of the residue stream that is recycledon the water concentration in the product residue gas, usu-ally expressed as the dew point of the residue gas. The gen-eral trend, shown in Figure 8, is that using more gas to purgethe permeate results in better water removal from the residue(i.e., lower dew point). This results in a smaller amount ofthe dry product gas being available for use, however, so thereis a trade-off between gas dryness and production rate.
Other problems that could be envisioned include replacingthe polymer (which is polysulfone in the case of the resultspresented in Figure 8) with other polymers having differentselectivities for water and determining the impact of separa-tion factor on the fraction of residue purge gas needed toachieve a given dewpoint using a standard-size module. Agood first approximation of the reduction in the amount ofresidue gas available for use is the flowrate of residue gas inthe absence of purging times the fraction of residue gas re-moved for purging. This rule-of-thumb is not exact, how-
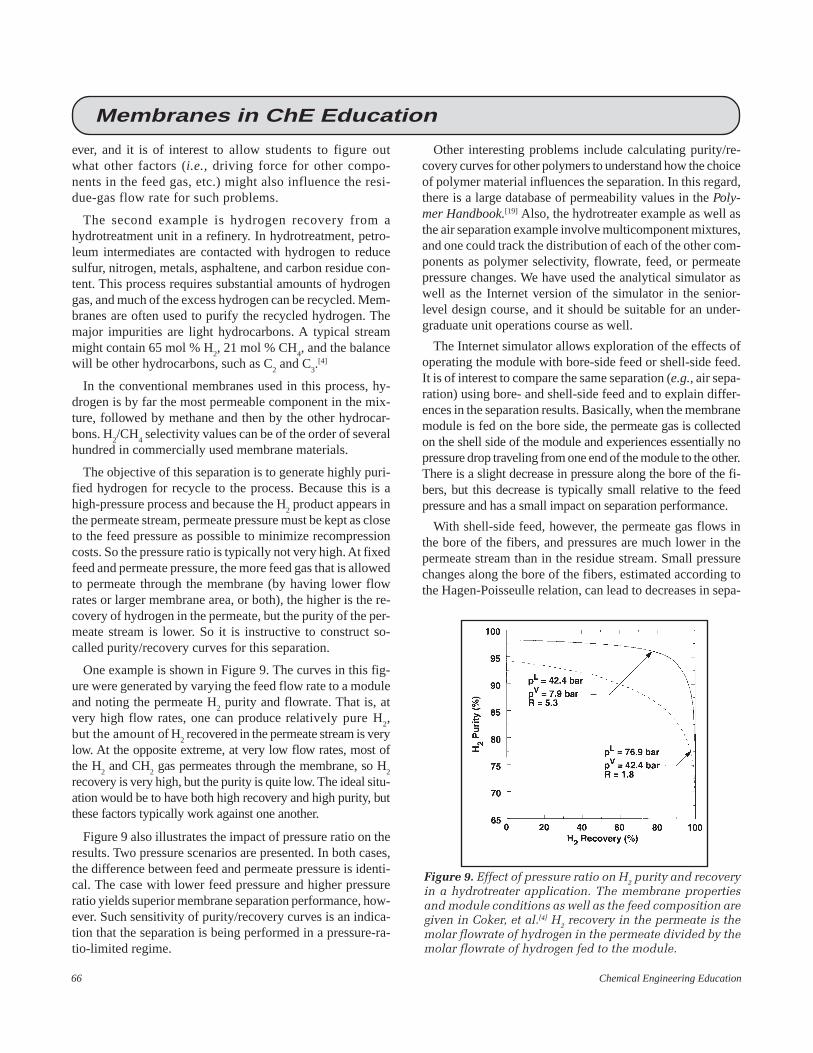
66 Chemical Engineering Education
Figure 9. Effect of pressure ratio on H2 purity and recoveryin a hydrotreater application. The membrane propertiesand module conditions as well as the feed composition aregiven in Coker, et al.[4] H2 recovery in the permeate is themolar flowrate of hydrogen in the permeate divided by themolar flowrate of hydrogen fed to the module.
Membranes in ChE Education
ever, and it is of interest to allow students to figure outwhat other factors (i.e., driving force for other compo-nents in the feed gas, etc.) might also influence the resi-due-gas flow rate for such problems.
The second example is hydrogen recovery from ahydrotreatment unit in a refinery. In hydrotreatment, petro-leum intermediates are contacted with hydrogen to reducesulfur, nitrogen, metals, asphaltene, and carbon residue con-tent. This process requires substantial amounts of hydrogengas, and much of the excess hydrogen can be recycled. Mem-branes are often used to purify the recycled hydrogen. Themajor impurities are light hydrocarbons. A typical streammight contain 65 mol % H
2, 21 mol % CH
4, and the balance
will be other hydrocarbons, such as C2 and C
3.[4]
In the conventional membranes used in this process, hy-drogen is by far the most permeable component in the mix-ture, followed by methane and then by the other hydrocar-bons. H
2/CH
4 selectivity values can be of the order of several
hundred in commercially used membrane materials.
The objective of this separation is to generate highly puri-fied hydrogen for recycle to the process. Because this is ahigh-pressure process and because the H
2 product appears in
the permeate stream, permeate pressure must be kept as closeto the feed pressure as possible to minimize recompressioncosts. So the pressure ratio is typically not very high. At fixedfeed and permeate pressure, the more feed gas that is allowedto permeate through the membrane (by having lower flowrates or larger membrane area, or both), the higher is the re-covery of hydrogen in the permeate, but the purity of the per-meate stream is lower. So it is instructive to construct so-called purity/recovery curves for this separation.
One example is shown in Figure 9. The curves in this fig-ure were generated by varying the feed flow rate to a moduleand noting the permeate H
2 purity and flowrate. That is, at
very high flow rates, one can produce relatively pure H2,
but the amount of H2 recovered in the permeate stream is very
low. At the opposite extreme, at very low flow rates, most ofthe H
2 and CH
2 gas permeates through the membrane, so H
2
recovery is very high, but the purity is quite low. The ideal situ-ation would be to have both high recovery and high purity, butthese factors typically work against one another.
Figure 9 also illustrates the impact of pressure ratio on theresults. Two pressure scenarios are presented. In both cases,the difference between feed and permeate pressure is identi-cal. The case with lower feed pressure and higher pressureratio yields superior membrane separation performance, how-ever. Such sensitivity of purity/recovery curves is an indica-tion that the separation is being performed in a pressure-ra-tio-limited regime.
Other interesting problems include calculating purity/re-covery curves for other polymers to understand how the choiceof polymer material influences the separation. In this regard,there is a large database of permeability values in the Poly-mer Handbook.[19] Also, the hydrotreater example as well asthe air separation example involve multicomponent mixtures,and one could track the distribution of each of the other com-ponents as polymer selectivity, flowrate, feed, or permeatepressure changes. We have used the analytical simulator aswell as the Internet version of the simulator in the senior-level design course, and it should be suitable for an under-graduate unit operations course as well.
The Internet simulator allows exploration of the effects ofoperating the module with bore-side feed or shell-side feed.It is of interest to compare the same separation (e.g., air sepa-ration) using bore- and shell-side feed and to explain differ-ences in the separation results. Basically, when the membranemodule is fed on the bore side, the permeate gas is collectedon the shell side of the module and experiences essentially nopressure drop traveling from one end of the module to the other.There is a slight decrease in pressure along the bore of the fi-bers, but this decrease is typically small relative to the feedpressure and has a small impact on separation performance.
With shell-side feed, however, the permeate gas flows inthe bore of the fibers, and pressures are much lower in thepermeate stream than in the residue stream. Small pressurechanges along the bore of the fibers, estimated according tothe Hagen-Poisseulle relation, can lead to decreases in sepa-
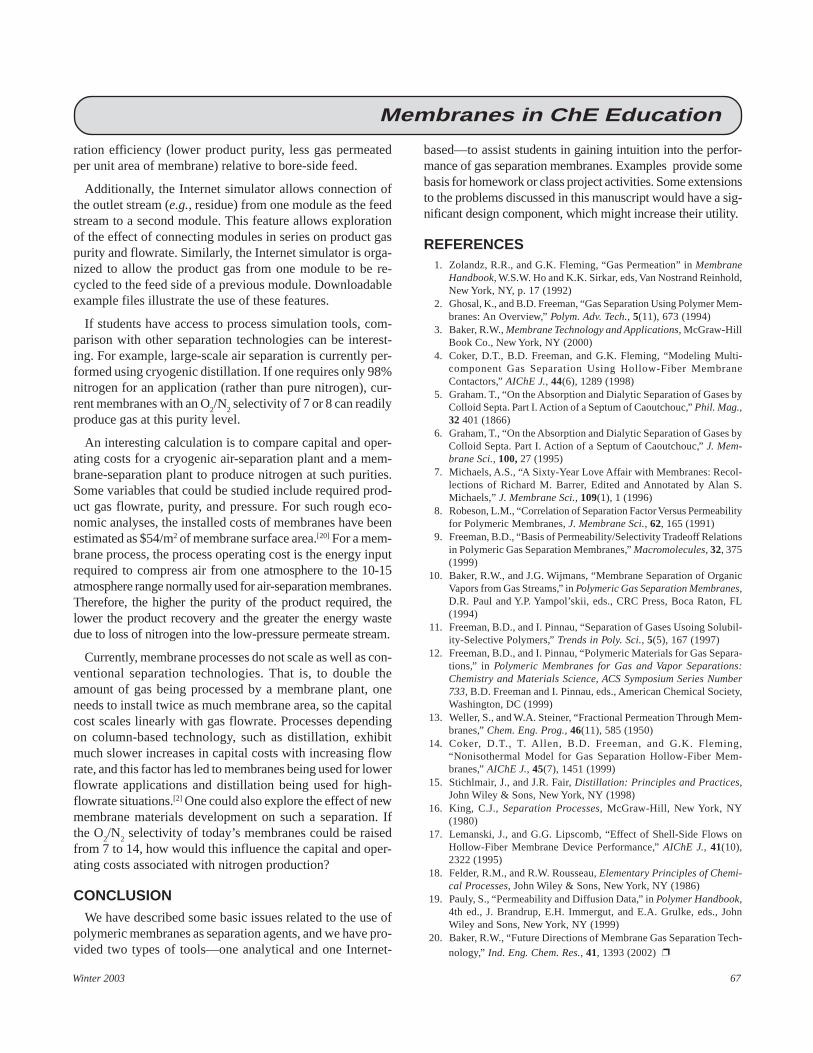
Winter 2003 67
Membranes in ChE Education
ration efficiency (lower product purity, less gas permeatedper unit area of membrane) relative to bore-side feed.
Additionally, the Internet simulator allows connection ofthe outlet stream (e.g., residue) from one module as the feedstream to a second module. This feature allows explorationof the effect of connecting modules in series on product gaspurity and flowrate. Similarly, the Internet simulator is orga-nized to allow the product gas from one module to be re-cycled to the feed side of a previous module. Downloadableexample files illustrate the use of these features.
If students have access to process simulation tools, com-parison with other separation technologies can be interest-ing. For example, large-scale air separation is currently per-formed using cryogenic distillation. If one requires only 98%nitrogen for an application (rather than pure nitrogen), cur-rent membranes with an O
2/N
2 selectivity of 7 or 8 can readily
produce gas at this purity level.
An interesting calculation is to compare capital and oper-ating costs for a cryogenic air-separation plant and a mem-brane-separation plant to produce nitrogen at such purities.Some variables that could be studied include required prod-uct gas flowrate, purity, and pressure. For such rough eco-nomic analyses, the installed costs of membranes have beenestimated as $54/m2 of membrane surface area.[20] For a mem-brane process, the process operating cost is the energy inputrequired to compress air from one atmosphere to the 10-15atmosphere range normally used for air-separation membranes.Therefore, the higher the purity of the product required, thelower the product recovery and the greater the energy wastedue to loss of nitrogen into the low-pressure permeate stream.
Currently, membrane processes do not scale as well as con-ventional separation technologies. That is, to double theamount of gas being processed by a membrane plant, oneneeds to install twice as much membrane area, so the capitalcost scales linearly with gas flowrate. Processes dependingon column-based technology, such as distillation, exhibitmuch slower increases in capital costs with increasing flowrate, and this factor has led to membranes being used for lowerflowrate applications and distillation being used for high-flowrate situations.[2] One could also explore the effect of newmembrane materials development on such a separation. Ifthe O
2/N
2 selectivity of today’s membranes could be raised
from 7 to 14, how would this influence the capital and oper-ating costs associated with nitrogen production?
CONCLUSIONWe have described some basic issues related to the use of
polymeric membranes as separation agents, and we have pro-vided two types of tools—one analytical and one Internet-
based—to assist students in gaining intuition into the perfor-mance of gas separation membranes. Examples provide somebasis for homework or class project activities. Some extensionsto the problems discussed in this manuscript would have a sig-nificant design component, which might increase their utility.
REFERENCES1. Zolandz, R.R., and G.K. Fleming, “Gas Permeation” in Membrane
Handbook, W.S.W. Ho and K.K. Sirkar, eds, Van Nostrand Reinhold,New York, NY, p. 17 (1992)
2. Ghosal, K., and B.D. Freeman, “Gas Separation Using Polymer Mem-branes: An Overview,” Polym. Adv. Tech., 5(11), 673 (1994)
3. Baker, R.W., Membrane Technology and Applications, McGraw-HillBook Co., New York, NY (2000)
4. Coker, D.T., B.D. Freeman, and G.K. Fleming, “Modeling Multi-component Gas Separation Using Hollow-Fiber MembraneContactors,” AIChE J., 44(6), 1289 (1998)
5. Graham. T., “On the Absorption and Dialytic Separation of Gases byColloid Septa. Part I. Action of a Septum of Caoutchouc,” Phil. Mag.,32 401 (1866)
6. Graham, T., “On the Absorption and Dialytic Separation of Gases byColloid Septa. Part I. Action of a Septum of Caoutchouc,” J. Mem-brane Sci., 100, 27 (1995)
7. Michaels, A.S., “A Sixty-Year Love Affair with Membranes: Recol-lections of Richard M. Barrer, Edited and Annotated by Alan S.Michaels,” J. Membrane Sci., 109(1), 1 (1996)
8. Robeson, L.M., “Correlation of Separation Factor Versus Permeabilityfor Polymeric Membranes, J. Membrane Sci., 62, 165 (1991)
9. Freeman, B.D., “Basis of Permeability/Selectivity Tradeoff Relationsin Polymeric Gas Separation Membranes,” Macromolecules, 32, 375(1999)
10. Baker, R.W., and J.G. Wijmans, “Membrane Separation of OrganicVapors from Gas Streams,” in Polymeric Gas Separation Membranes,D.R. Paul and Y.P. Yampol’skii, eds., CRC Press, Boca Raton, FL(1994)
11. Freeman, B.D., and I. Pinnau, “Separation of Gases Usoing Solubil-ity-Selective Polymers,” Trends in Poly. Sci., 5(5), 167 (1997)
12. Freeman, B.D., and I. Pinnau, “Polymeric Materials for Gas Separa-tions,” in Polymeric Membranes for Gas and Vapor Separations:Chemistry and Materials Science, ACS Symposium Series Number733, B.D. Freeman and I. Pinnau, eds., American Chemical Society,Washington, DC (1999)
13. Weller, S., and W.A. Steiner, “Fractional Permeation Through Mem-branes,” Chem. Eng. Prog., 46(11), 585 (1950)
14. Coker, D.T., T. Allen, B.D. Freeman, and G.K. Fleming,“Nonisothermal Model for Gas Separation Hollow-Fiber Mem-branes,” AIChE J., 45(7), 1451 (1999)
15. Stichlmair, J., and J.R. Fair, Distillation: Principles and Practices,John Wiley & Sons, New York, NY (1998)
16. King, C.J., Separation Processes, McGraw-Hill, New York, NY(1980)
17. Lemanski, J., and G.G. Lipscomb, “Effect of Shell-Side Flows onHollow-Fiber Membrane Device Performance,” AIChE J., 41(10),2322 (1995)
18. Felder, R.M., and R.W. Rousseau, Elementary Principles of Chemi-cal Processes, John Wiley & Sons, New York, NY (1986)
19. Pauly, S., “Permeability and Diffusion Data,” in Polymer Handbook,4th ed., J. Brandrup, E.H. Immergut, and E.A. Grulke, eds., JohnWiley and Sons, New York, NY (1999)
20. Baker, R.W., “Future Directions of Membrane Gas Separation Tech-
nology,” Ind. Eng. Chem. Res., 41, 1393 (2002) ❐
68 Chemical Engineering Education
MEMBRANE PROJECTSWITH AN INDUSTRIAL FOCUS
In The Curriculum
STEPHANIE FARRELL, ROBERT P. HESKETH, MARIANO J. SAVELSKI,KEVIN D. DAHM, C. STEWART SLATER
Rowan University • Glassboro, NJ 08028
Educational initiatives are crucial to the continued tech-nical growth and wide-scale commercialization ofmembrane processes. This paper discusses innovative
use of membrane technology in a project-oriented curricu-lum, building on the prior work of Slater, et al., who devel-oped membrane experiments in a conventional chemical engi-neering laboratory setting.[1-7] At Rowan University, the authorshave integrated membrane technology throughout the engineer-ing curriculum and involved student teams in a uniquemultidisciplinary laboratory project experience—the clinics.[8]
Chemical engineering education is traditionally a process-or systems-oriented curriculum, producing graduates who canapply their process expertise in many industries. Some ver-satility has been lost over the last several decades due to theoverwhelming emphasis on unit operations and design prob-lems pertaining to the petroleum industry. Separation-pro-cess needs exist both in the traditional process industries andin emerging areas such as biochemical engineering, specialtychemical manufacture, hazardous waste management, foodand beverage processing, microelectronics production, andbiomedical engineering.[9,10] Growth in these technologies willdepend on engineers who are well-educated in the field andhave a working knowledge of membrane applications in theseareas. Education should have a multidisciplinary perspectivewhere students from other fields can apply their expertise tosolving membrane-related process problems.[11]
The need for more instruction in membrane technology andin many other advanced separation processes has been previ-ously addressed.[12,13] Many schools have graduate courses inadvanced mass transfer and some have courses in membranetechnology, but introducing it to the undergraduate chemicalengineering curriculum is rare. A 1995 study[14] revealed thatonly 2.6% of lecture time in an undergraduate mass transfercourse is on the subject of membrane processes. ABET’s Cri-teria 2000 specifies many of the outcomes that are included
in this curriculum development: an ability to function in multi-disciplinary teams, designing and conducting experiments,understanding safety and environmental issues, analyzing andinterpreting data, and using modern engineering tools.[15]
ROWAN UNIVERSITY’SENGINEERING CLINIC
Rowan University is a comprehensive regional state uni-versity with six colleges: Business Administration, Commu-nications, Education, Engineering, Fine and Performing Arts,and Liberal Arts and Sciences. The College of Engineeringwas initiated using a major gift in 1992 from the Rowan Foun-dation.[16] The engineering program is taking a leadership roleby using innovative methods of teaching and learning, as rec-ommended by ASEE,[17] to prepare students for entry into a
Stephanie Farrell is Associate Professor of Chemical Engineering atRowan University. She received her BS in 1986 from the University ofPennsylvania, her MS in 1992 from Stevens Institute of Technology, andher PhD in 1996 from New Jersey Institute of Technology. Her teachingand research interests are in controlled drug delivery and biomedical en-gineering.Robert Hesketh is Professor of Chemical Engineering at Rowan Univer-sity. He received his BS in 1982 from the University of Illinois and his PhDfrom the University of Delaware in 1987. His research is in the areas ofreaction engineering, novel separations, and green engineering.Mariano J. Savelski is Assistant Professor of Chemical Engineering atRowan University. He received his BS in 1991 from the University of BuenosAires, his ME in 1994 from the University of Tulsa, and his PhD in 1999from the University of Oklahoma. His technical research is in the area ofprocess design and optimization with over seven years of industrial expe-rience.Kevin Dahm is Assistant Professor of Chemical Engineering at RowanUniversity. He received his PhD in 1998 from Massachusetts Institute ofTechnology. His primary technical expertise is in chemical kinetics andmechanisms, and his recent educational scholarship focuses on incorpo-rating computing and simulation into the curriculum.C. Stewart Slater is Professor and Chair of the Department of ChemicalEngineering at Rowan University. He received his BS, MS, and PhD fromRutgers University. His research and teaching interests are in separationand purification technology, laboratory development, and investigatingnovel processes for fields such as bio/pharmaceutical/food engineeringand specialty chemical manufacture.
Membranes in ChE Education
© Copyright ChE Division of ASEE 2003
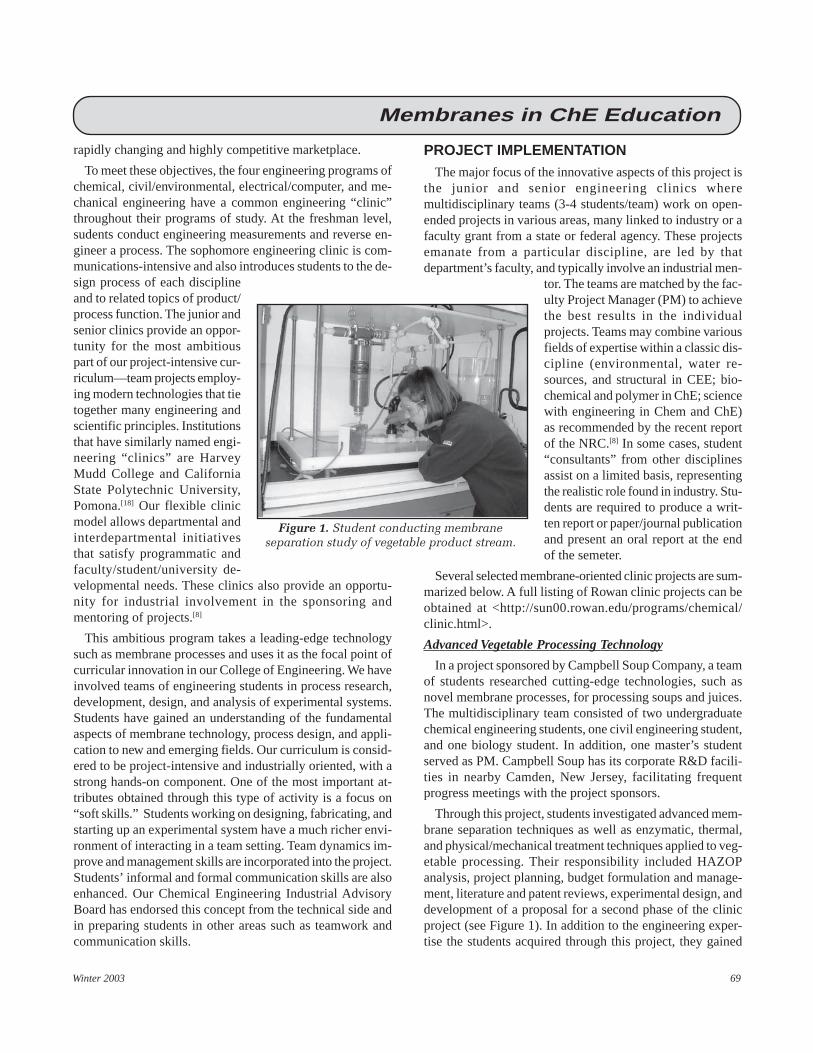
Winter 2003 69
rapidly changing and highly competitive marketplace.
To meet these objectives, the four engineering programs ofchemical, civil/environmental, electrical/computer, and me-chanical engineering have a common engineering “clinic”throughout their programs of study. At the freshman level,sudents conduct engineering measurements and reverse en-gineer a process. The sophomore engineering clinic is com-munications-intensive and also introduces students to the de-sign process of each disciplineand to related topics of product/process function. The junior andsenior clinics provide an oppor-tunity for the most ambitiouspart of our project-intensive cur-riculum—team projects employ-ing modern technologies that tietogether many engineering andscientific principles. Institutionsthat have similarly named engi-neering “clinics” are HarveyMudd College and CaliforniaState Polytechnic University,Pomona.[18] Our flexible clinicmodel allows departmental andinterdepartmental initiativesthat satisfy programmatic andfaculty/student/university de-velopmental needs. These clinics also provide an opportu-nity for industrial involvement in the sponsoring andmentoring of projects.[8]
This ambitious program takes a leading-edge technologysuch as membrane processes and uses it as the focal point ofcurricular innovation in our College of Engineering. We haveinvolved teams of engineering students in process research,development, design, and analysis of experimental systems.Students have gained an understanding of the fundamentalaspects of membrane technology, process design, and appli-cation to new and emerging fields. Our curriculum is consid-ered to be project-intensive and industrially oriented, with astrong hands-on component. One of the most important at-tributes obtained through this type of activity is a focus on“soft skills.” Students working on designing, fabricating, andstarting up an experimental system have a much richer envi-ronment of interacting in a team setting. Team dynamics im-prove and management skills are incorporated into the project.Students’ informal and formal communication skills are alsoenhanced. Our Chemical Engineering Industrial AdvisoryBoard has endorsed this concept from the technical side andin preparing students in other areas such as teamwork andcommunication skills.
PROJECT IMPLEMENTATIONThe major focus of the innovative aspects of this project is
the junior and senior engineering clinics wheremultidisciplinary teams (3-4 students/team) work on open-ended projects in various areas, many linked to industry or afaculty grant from a state or federal agency. These projectsemanate from a particular discipline, are led by thatdepartment’s faculty, and typically involve an industrial men-
tor. The teams are matched by the fac-ulty Project Manager (PM) to achievethe best results in the individualprojects. Teams may combine variousfields of expertise within a classic dis-cipline (environmental, water re-sources, and structural in CEE; bio-chemical and polymer in ChE; sciencewith engineering in Chem and ChE)as recommended by the recent reportof the NRC.[8] In some cases, student“consultants” from other disciplinesassist on a limited basis, representingthe realistic role found in industry. Stu-dents are required to produce a writ-ten report or paper/journal publicationand present an oral report at the endof the semeter.
Several selected membrane-oriented clinic projects are sum-marized below. A full listing of Rowan clinic projects can beobtained at <http://sun00.rowan.edu/programs/chemical/clinic.html>.
Advanced Vegetable Processing Technology
In a project sponsored by Campbell Soup Company, a teamof students researched cutting-edge technologies, such asnovel membrane processes, for processing soups and juices.The multidisciplinary team consisted of two undergraduatechemical engineering students, one civil engineering student,and one biology student. In addition, one master’s studentserved as PM. Campbell Soup has its corporate R&D facili-ties in nearby Camden, New Jersey, facilitating frequentprogress meetings with the project sponsors.
Through this project, students investigated advanced mem-brane separation techniques as well as enzymatic, thermal,and physical/mechanical treatment techniques applied to veg-etable processing. Their responsibility included HAZOPanalysis, project planning, budget formulation and manage-ment, literature and patent reviews, experimental design, anddevelopment of a proposal for a second phase of the clinicproject (see Figure 1). In addition to the engineering exper-tise the students acquired through this project, they gained
Figure 1. Student conducting membraneseparation study of vegetable product stream.
Membranes in ChE Education

70 Chemical Engineering Education
Figure 2. (a) Electrodialysis process system used in pre-cious metals separation clinic project. (b) Electrodialysiscell used in the process system.
a
b
Membranes in ChE Education
familiarity with Food and Drug Administration regulations,good manufacturing practices, and labeling requirements.
Engineers from Campbell’s demonstrated a high level ofcommitment to the project by attending monthly progressmeetings where the students gave oral presentations on theirprogress. This was followed by brainstorming and discus-sion sessions where the industrial representatives and facultyrefocused and fine-tuned the project. This industrial interac-tion helped maintain a high level of motivation among thestudents and maintained the focus and a fast pace of produc-tivity. In addition to the progress meetings, the student teamalso conducted a “lunch-and-learn” seminar at Campbell’s toshare their research with engineers, scientists, and marketingrepresentatives from the company. The ethusiastic responseof the audience at Campbell’s reaffirmed the industrial rel-evance and impact of the team’s clinic research project.
Campbell Soup Company is a strong supporter of our pro-gram, not only by supporting the clinic project mentionedabove, but also by employing both full-time and internshipstudents from our program. In the summer following the veg-etable processing project, two undergraduate students ac-cepted summer internships at Campbell’s. The students hadthe rewarding experience of successfully implementing twoof the technologies developed at Rowan into Campbell’s pro-cessing facilities in California and New Jersey.
Metals Purification Processes
Various metals purification projects have been sponsoredby Johnson Matthey, Inc. A precious metals “refinery” is op-erated at West Deptford, New Jersey, which is less than tenminutes from our campus. This close proximity facilitatesnumerous interactions and projects that we have with JohnsonMatthey. The company has sponsored three years of engi-neering clinic projects with the objective of investigatingnovel techniques that have the potential to replace current“traditional” refinery process units.
At the refinery, precious metals such as Pt, Pd, and Rh arepurified from feed streams containing many unwanted metalspecies and other impurities. The feed streams are made upof spent catalysts from which precious metals are recoveredand recycled to feed stream from mines. In the refinery, thereare many dissolution, selective-precipitation, and filtrationsteps. Using innovative membrane processes, the plant ca-pacity, product purity, and processing costs have the poten-tial to be improved. In essence, students have an opportunityin the engineering clinic to conduct engineering projects thatare equivalent in scope to those done by engineers in the plant.Our most successful project resulted in Johnson Matthey add-ing several new processing units to their refinery.
One of the Johnson Matthey projects involving membranes
was electrodialysis process development for separation of aprecious metal chloride salt solution that was contaminatedwith unwanted acids and salts. The traditional separation andpurification steps used in the production of these metal com-pound solutions include multiple precipitation and dilution stepsthat are time-consuming and labor intensive and result in a sig-nificant loss of product. Development of an alternative separa-tion and purification technique was the aim of this project.
The specific objectives of the projects were
• To design and build an electrodialysis unit for the separa-tion and purification of the desired process stream
• To investigate the performance of electrodialysis in theremoval of the salt contaminant from the product on alaboratory scale
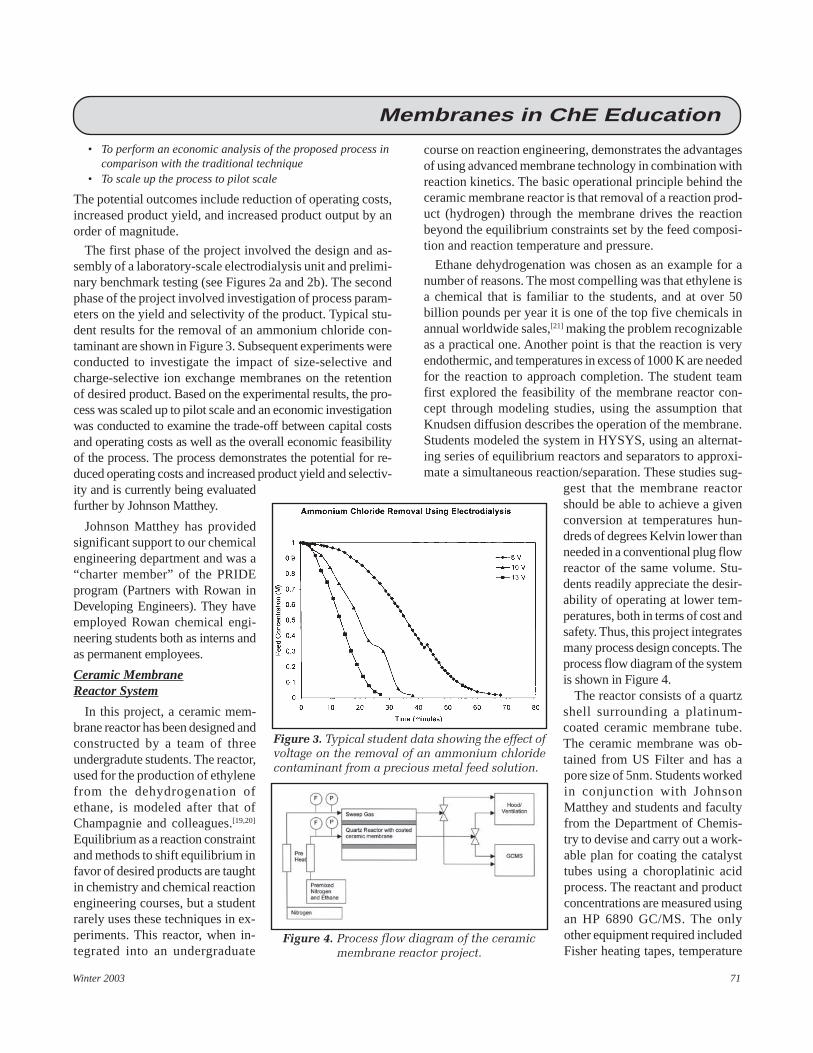
Winter 2003 71
Figure 3. Typical student data showing the effect ofvoltage on the removal of an ammonium chloridecontaminant from a precious metal feed solution.
Figure 4. Process flow diagram of the ceramicmembrane reactor project.
Membranes in ChE Education
• To perform an economic analysis of the proposed process incomparison with the traditional technique
• To scale up the process to pilot scale
The potential outcomes include reduction of operating costs,increased product yield, and increased product output by anorder of magnitude.
The first phase of the project involved the design and as-sembly of a laboratory-scale electrodialysis unit and prelimi-nary benchmark testing (see Figures 2a and 2b). The secondphase of the project involved investigation of process param-eters on the yield and selectivity of the product. Typical stu-dent results for the removal of an ammonium chloride con-taminant are shown in Figure 3. Subsequent experiments wereconducted to investigate the impact of size-selective andcharge-selective ion exchange membranes on the retentionof desired product. Based on the experimental results, the pro-cess was scaled up to pilot scale and an economic investigationwas conducted to examine the trade-off between capital costsand operating costs as well as the overall economic feasibilityof the process. The process demonstrates the potential for re-duced operating costs and increased product yield and selectiv-ity and is currently being evaluatedfurther by Johnson Matthey.
Johnson Matthey has providedsignificant support to our chemicalengineering department and was a“charter member” of the PRIDEprogram (Partners with Rowan inDeveloping Engineers). They haveemployed Rowan chemical engi-neering students both as interns andas permanent employees.
Ceramic MembraneReactor System
In this project, a ceramic mem-brane reactor has been designed andconstructed by a team of threeundergradute students. The reactor,used for the production of ethylenefrom the dehydrogenation ofethane, is modeled after that ofChampagnie and colleagues.[19,20]
Equilibrium as a reaction constraintand methods to shift equilibrium infavor of desired products are taughtin chemistry and chemical reactionengineering courses, but a studentrarely uses these techniques in ex-periments. This reactor, when in-tegrated into an undergraduate
course on reaction engineering, demonstrates the advantagesof using advanced membrane technology in combination withreaction kinetics. The basic operational principle behind theceramic membrane reactor is that removal of a reaction prod-uct (hydrogen) through the membrane drives the reactionbeyond the equilibrium constraints set by the feed composi-tion and reaction temperature and pressure.
Ethane dehydrogenation was chosen as an example for anumber of reasons. The most compelling was that ethylene isa chemical that is familiar to the students, and at over 50billion pounds per year it is one of the top five chemicals inannual worldwide sales,[21] making the problem recognizableas a practical one. Another point is that the reaction is veryendothermic, and temperatures in excess of 1000 K are neededfor the reaction to approach completion. The student teamfirst explored the feasibility of the membrane reactor con-cept through modeling studies, using the assumption thatKnudsen diffusion describes the operation of the membrane.Students modeled the system in HYSYS, using an alternat-ing series of equilibrium reactors and separators to approxi-mate a simultaneous reaction/separation. These studies sug-
gest that the membrane reactorshould be able to achieve a givenconversion at temperatures hun-dreds of degrees Kelvin lower thanneeded in a conventional plug flowreactor of the same volume. Stu-dents readily appreciate the desir-ability of operating at lower tem-peratures, both in terms of cost andsafety. Thus, this project integratesmany process design concepts. Theprocess flow diagram of the systemis shown in Figure 4.
The reactor consists of a quartzshell surrounding a platinum-coated ceramic membrane tube.The ceramic membrane was ob-tained from US Filter and has apore size of 5nm. Students workedin conjunction with JohnsonMatthey and students and facultyfrom the Department of Chemis-try to devise and carry out a work-able plan for coating the catalysttubes using a choroplatinic acidprocess. The reactant and productconcentrations are measured usingan HP 6890 GC/MS. The onlyother equipment required includedFisher heating tapes, temperature

72 Chemical Engineering Education
TABLE 1ABET Criterion 3 (a-k) in the Membrane Projects
Criterion Membrane Project Implementation
a Apply math, science and engineering • Projects apply basic mathematics such as in calculating fluxes. Chemistry is applied in understand-ing the nature of the solutions to be separated and membrane structure.
• Chemical engineering is applied from membrane mass transfer to process transport analysis.
b Design/conduct experiments and analyze data • The membrane projects involve experimentation—students must design the studies to be conductedand collect, correlate, and analyze their experimental results. Modern software tools are used.
c Design process • In most of the projects, the students design the bench-scale process unit to be used. In some of theprojects, students present a final scale-up “paper” design for plant implementation that may includemultiple sequential processes.
d Function of multidisciplinary teams • Inherent in the Rowan clinic program is that students perform the project in multidisciplinary ormultifunctional teams. Each students has a role simulating actual industrial membrane projectstaffing.
e Formulate/solve engineering problems •While many of the projects have their original problem statements formulated by industry, thestudent teams may refine the problem and obviously will be the ones solving the process problem.
f Professional and ethical responsibility • Students learn about many aspects, such as safe handling and disposal of chemicals, safety, andprocess responsibility.
g Communicate effectively • All students must give an oral report and submit a final written report at the end of each semester.• Additionally, students engage in meetings with industrial representatives and present/defend their
findings.• Senior Clinic counts as the “writing intensive” part of our curriculum.
h Impact of engineering on society • Through these projects, students learn the impact of membrane technology on society, such as inwaste management, water reuse, purification of pharmaceuticals, and energy conservation.
i Life-long learning • The membrane projects have stimulated students to consider continuing their education, and manyof them have gone on to pursue Masters or Doctoral degrees.
j Contemporary issues • Membrane processes are used in many contemporary problems facing society, such as environmen-tal management, health care, and the production of potable water.
k Modern engineering tools • Membranes are indeed a modern engineering process and therefore satisfies this broad category.Other modern engineering tools used in the membrane projects include analytical instrumentation,computer data acquisition/control, and computer hardware and software.
l University-specific criteria: Undergraduate • A unique criteria added at Rowan University was to engage undergraduate students in research inresearch/emerging fields emerging fields, which these membrane projects effectively do.
Membranes in ChE Education
controllers, and mass flow meters. The total cost of the sys-tem, including reactor and catalyst (but excluding the GC/MS, which was previously on site) was less than $2000.
In addition to illustrating important chemical engineeringconcepts, this setup also demonstrates some interesting prac-tical issues to the students. One point is that although “iso-thermal reactors” are routinely posed in problems and mod-eled by undergraduate students, students do not necessarilyappreciate the difficulty involved in carrying out a reactionthat is truly isothermal. In this case, the reaction is very en-dothermic and is carried out well above room temperature—both factors that complicate maintaining an isothermal reac-tion. Another issue is the difficulty of creating gas-tight sealswhen working with materials (such as the ceramic membrane)that expand significantly with increasing temperature. Work-ing with the chemical engineering lab technician, the studentsdevised a procedure for sealing the reactor after it had al-
ready been brought to temperature. After the experiment iscomplete, the temperature is maintained and the system ispurged with nitrogen before the seal is broken. Throughoutthe “design-and-build” phase of this project, the student teamworked with various technicians in the college, from machin-ing parts to electronic controls.
ASSESSMENTOf significant importance to chemical engineering educa-
tors is satisfying the new EC2000 requirements of ABET, themost vexing of which are the “soft skills” represented byCriterion 3, f-i. The projects mentioned above can effectivelysatisfy these criteria, and the outcomes can be effectively as-sessed in a sustainable way. Our program has firsthand expe-rience with this and has used various assessment instrumentsto verify the results. Table 1 indicates how the membraneprojects meet the EC2000 requirements.
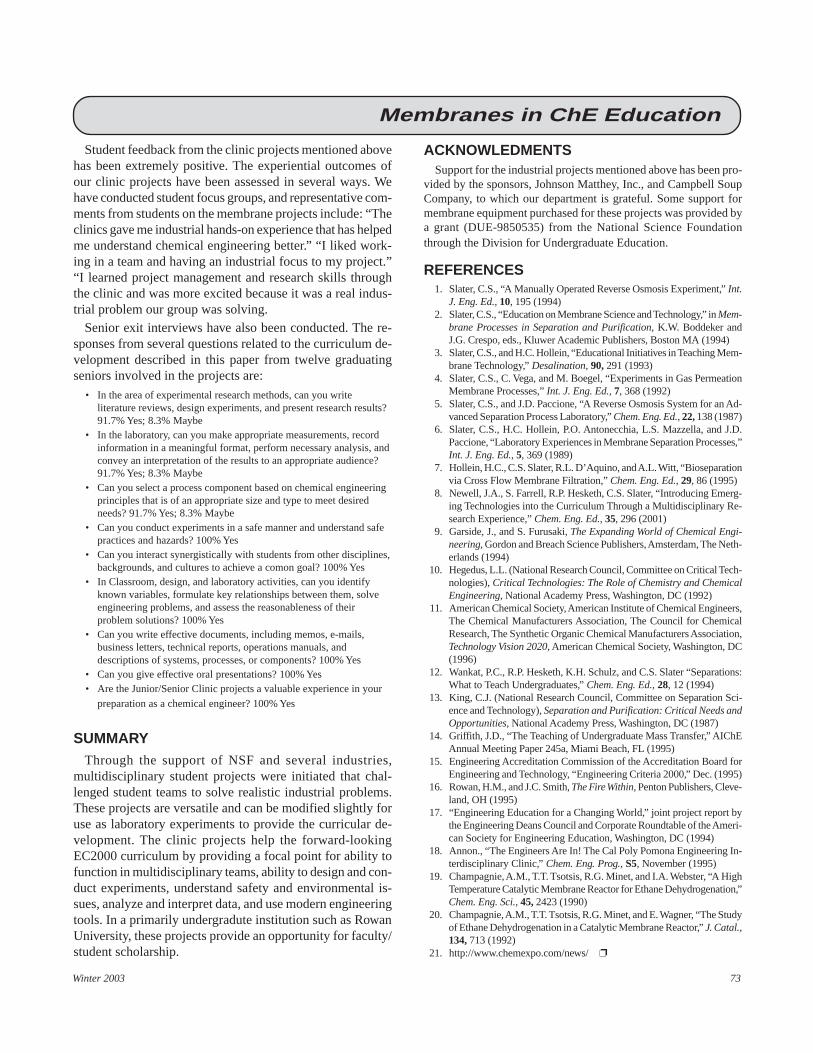
Winter 2003 73
Membranes in ChE Education
Student feedback from the clinic projects mentioned abovehas been extremely positive. The experiential outcomes ofour clinic projects have been assessed in several ways. Wehave conducted student focus groups, and representative com-ments from students on the membrane projects include: “Theclinics gave me industrial hands-on experience that has helpedme understand chemical engineering better.” “I liked work-ing in a team and having an industrial focus to my project.”“I learned project management and research skills throughthe clinic and was more excited because it was a real indus-trial problem our group was solving.
Senior exit interviews have also been conducted. The re-sponses from several questions related to the curriculum de-velopment described in this paper from twelve graduatingseniors involved in the projects are:
• In the area of experimental research methods, can you writeliterature reviews, design experiments, and present research results?91.7% Yes; 8.3% Maybe
• In the laboratory, can you make appropriate measurements, recordinformation in a meaningful format, perform necessary analysis, andconvey an interpretation of the results to an appropriate audience?91.7% Yes; 8.3% Maybe
• Can you select a process component based on chemical engineeringprinciples that is of an appropriate size and type to meet desiredneeds? 91.7% Yes; 8.3% Maybe
• Can you conduct experiments in a safe manner and understand safepractices and hazards? 100% Yes
• Can you interact synergistically with students from other disciplines,backgrounds, and cultures to achieve a comon goal? 100% Yes
• In Classroom, design, and laboratory activities, can you identifyknown variables, formulate key relationships between them, solveengineering problems, and assess the reasonableness of theirproblem solutions? 100% Yes
• Can you write effective documents, including memos, e-mails,business letters, technical reports, operations manuals, anddescriptions of systems, processes, or components? 100% Yes
• Can you give effective oral presentations? 100% Yes• Are the Junior/Senior Clinic projects a valuable experience in your
preparation as a chemical engineer? 100% Yes
SUMMARYThrough the support of NSF and several industries,
multidisciplinary student projects were initiated that chal-lenged student teams to solve realistic industrial problems.These projects are versatile and can be modified slightly foruse as laboratory experiments to provide the curricular de-velopment. The clinic projects help the forward-lookingEC2000 curriculum by providing a focal point for ability tofunction in multidisciplinary teams, ability to design and con-duct experiments, understand safety and environmental is-sues, analyze and interpret data, and use modern engineeringtools. In a primarily undergradute institution such as RowanUniversity, these projects provide an opportunity for faculty/student scholarship.
ACKNOWLEDMENTSSupport for the industrial projects mentioned above has been pro-
vided by the sponsors, Johnson Matthey, Inc., and Campbell SoupCompany, to which our department is grateful. Some support formembrane equipment purchased for these projects was provided bya grant (DUE-9850535) from the National Science Foundationthrough the Division for Undergraduate Education.
REFERENCES1. Slater, C.S., “A Manually Operated Reverse Osmosis Experiment,” Int.
J. Eng. Ed., 10, 195 (1994)2. Slater, C.S., “Education on Membrane Science and Technology,” in Mem-
brane Processes in Separation and Purification, K.W. Boddeker andJ.G. Crespo, eds., Kluwer Academic Publishers, Boston MA (1994)
3. Slater, C.S., and H.C. Hollein, “Educational Initiatives in Teaching Mem-brane Technology,” Desalination, 90, 291 (1993)
4. Slater, C.S., C. Vega, and M. Boegel, “Experiments in Gas PermeationMembrane Processes,” Int. J. Eng. Ed., 7, 368 (1992)
5. Slater, C.S., and J.D. Paccione, “A Reverse Osmosis System for an Ad-vanced Separation Process Laboratory,” Chem. Eng. Ed., 22, 138 (1987)
6. Slater, C.S., H.C. Hollein, P.O. Antonecchia, L.S. Mazzella, and J.D.Paccione, “Laboratory Experiences in Membrane Separation Processes,”Int. J. Eng. Ed., 5, 369 (1989)
7. Hollein, H.C., C.S. Slater, R.L. D’Aquino, and A.L. Witt, “Bioseparationvia Cross Flow Membrane Filtration,” Chem. Eng. Ed., 29, 86 (1995)
8. Newell, J.A., S. Farrell, R.P. Hesketh, C.S. Slater, “Introducing Emerg-ing Technologies into the Curriculum Through a Multidisciplinary Re-search Experience,” Chem. Eng. Ed., 35, 296 (2001)
9. Garside, J., and S. Furusaki, The Expanding World of Chemical Engi-neering, Gordon and Breach Science Publishers, Amsterdam, The Neth-erlands (1994)
10. Hegedus, L.L. (National Research Council, Committee on Critical Tech-nologies), Critical Technologies: The Role of Chemistry and ChemicalEngineering, National Academy Press, Washington, DC (1992)
11. American Chemical Society, American Institute of Chemical Engineers,The Chemical Manufacturers Association, The Council for ChemicalResearch, The Synthetic Organic Chemical Manufacturers Association,Technology Vision 2020, American Chemical Society, Washington, DC(1996)
12. Wankat, P.C., R.P. Hesketh, K.H. Schulz, and C.S. Slater “Separations:What to Teach Undergraduates,” Chem. Eng. Ed., 28, 12 (1994)
13. King, C.J. (National Research Council, Committee on Separation Sci-ence and Technology), Separation and Purification: Critical Needs andOpportunities, National Academy Press, Washington, DC (1987)
14. Griffith, J.D., “The Teaching of Undergraduate Mass Transfer,” AIChEAnnual Meeting Paper 245a, Miami Beach, FL (1995)
15. Engineering Accreditation Commission of the Accreditation Board forEngineering and Technology, “Engineering Criteria 2000,” Dec. (1995)
16. Rowan, H.M., and J.C. Smith, The Fire Within, Penton Publishers, Cleve-land, OH (1995)
17. “Engineering Education for a Changing World,” joint project report bythe Engineering Deans Council and Corporate Roundtable of the Ameri-can Society for Engineering Education, Washington, DC (1994)
18. Annon., “The Engineers Are In! The Cal Poly Pomona Engineering In-terdisciplinary Clinic,” Chem. Eng. Prog., S5, November (1995)
19. Champagnie, A.M., T.T. Tsotsis, R.G. Minet, and I.A. Webster, “A HighTemperature Catalytic Membrane Reactor for Ethane Dehydrogenation,”Chem. Eng. Sci., 45, 2423 (1990)
20. Champagnie, A.M., T.T. Tsotsis, R.G. Minet, and E. Wagner, “The Studyof Ethane Dehydrogenation in a Catalytic Membrane Reactor,” J. Catal.,134, 713 (1992)
21. http://www.chemexpo.com/news/ ❐

74 Chemical Engineering Education
A Simple Analysis ForGAS SEPARATION MEMBRANE
EXPERIMENTSRICHARD A. DAVIS, ORVILLE C. SANDALL*University of Minnesota Duluth • Duluth, MN 55812
* University of California, Santa Barbara, CA 93106© Copyright ChE Division of ASEE 2003
Membrane applications for gas separations have made rapid ad-vances over the past decde.[1] In some cases, membrane tech-nologies have been used to enhance or replace more traditional
methods of gas purification. The need for educating undergraduate chemi-cal engineering students about membrane-based separations has not goneunnoticed. Newer editions of popular separations textbooks have addedchapters on membranes with sections on gas permeation.[2-4]
Earlier, Davis and Sandall[5] described an undergraduate laboratory mem-brane experiment and analysis for separating the components of air. Itremains relevant today as one approach to providing students with hands-on experience with this important technology. The experimental objec-tives included an inverse mass transfer analysis of experimental data forkey membrane transport parameters. The original analysis involved solv-ing a set of differential species balances and fitting the results to experi-mental data by iterative, trial-and-error techniques. They found that thenumerical methods required to implement their analysis were beyond thescope of the undergraduate chemical engineering laboratory experience.Consequently, they provided students with True BASIC programs thatwere used to solve the model equations. Unfortunately, the programs werelimited to the specific membrane configuration in the laboratory. Stu-dents were unable to explore alternative designs using the validated mod-els without modifying the programs. In the meantime, several popular,modern, computational software applications (such as Excel, Mathcad,Matlab, or Polymath) have emerged that provide readily accessible toolsfor solving complex problems that involve nonlinear algebraic and dif-ferential equations. The drawbacks in the original analysis, along withdevelopments in computational tools, have led to a simpler alternativeanalysis described in this paper.
EXPERIMENTDavis and Sandall[5] provided specific details of the experimental ob-
jectives, apparatus, and procedure for a commercial hollow-fiber mem-brane unit for air separation. The Prism separator developed by Permea
Richard A. Davis is Associate Professor in the Department ofChemical Engineering at the University of Minnesota Duluth.He earned his BS in Chemical Engineering from Brigham YoungUniversity and his PhD from the University of California, SantaBarbara. He teaches a variety of courses in transport phenom-ena and separations, and his current research interests includeprocess modeling and optimization.Orville C. Sandall is Professor of Chemical Engineering atthe University of California, Santa Barbara. He is a graduate ofthe University of Alberta (BSc and MSc) and the University ofCalifornia, Berkeley (PhD). His teaching and research inter-ests are in the areas of mass transfer and separation processes.
Figure 1. Prism hollow-fiber membraneapparatus.
Membranes in ChE Education

Winter 2003 75
Corporation, shown in Figure 1, consists of four hollow-fi-ber membrane modules arranged in a series of columns. Eachmodule is a shell-and-tube arrangement of a bundle of hol-low-fiber membranes that are capped at the top. High-pres-sure feed air is introduced to the shell side of the fibers. Thepermeating gas flows through the hollow-fiber bores and iscollected in a manifold at the open end. The pressure dropacross the shell side of the membrane unit was found to benegligible.[5] The permeate streams are open to the atmosphere.The pressure at the closed end of the fiber bores is not di-rectly measurable in the current module arrangements. Infor-mation about fiber length, fiber inside diameter, and the num-ber of fibers in the Prism separator bundle is not available,but a conservative estimate of the pressure build-up in thefiber bore was calculated to increase by less than nine per-cent above atmospheric pressure for the range of experimen-tal operating conditions. For most of the experiments, thepressure build-up was estimated to be less than three percent.
Figure 2. Schematic of single, countercurrent flowcolumn or four columns with alternating flow patterns.
Modern gas-separation membrane modules introduce thehigh-pressure feed to the bore side of the fibers to eliminatechanneling and maintain a more uniform flow distribution.High-pressure feed to the fiber bores can result in a signifi-cant axial pressure drop in the fibers. Although not requiredfor this membrane module, the effects of pressure are includedin the analysis for completeness.
As shown in the schematic of Figure 2, the air-flow patternconsists of alternating countercurrent and cocurrent flowthrough the columns. The composition of the retentate andpermeate streams was measured with oxygen analyzers. Theflow rate of the retentate stream was measured with a volu-metric flow meter. The feed and permeate flow rates may becalculated by mass balances.
The membrane separator may be operated as four columnsin series, or as a single column by closing a valve on the tubeconnecting the retentate and feed streams between the firsttwo columns. The first column operates in countercurrent flowand was used to calibrate the membrane models from a seriesof runs performed at various feed-flow rates and pressures.The calibrated model was confirmed by favorable compari-sons of model predictions with experimental results from thefour-column configuration.
THEORY AND ANALYSISA differential model of binary gas separation in the mem-
brane experiment was validated by Davis and Sandall and issummarized next. For the conditions of the experiment, itcan be shown that a simplification to the equations permitsan algebraic solution.
The mathematical model of membrane gas separation wasbased on several key assumptions. First, the temperature wasassumed to be constant. Further, it was assumed that allstreams through the shell and permeate sides of the fiberswere in plug flow. The air fed to the unit was assumed to be abinary mixture of 79% N
2 and 21% O
2. All four columns were
assumed to have the same dimensions and specific area formass transfer. Finally, axial pressure drop was ignored forthe fiber bore. This assumption is valid for low permeate flowor large transmembrane pressure differences where smallchanges in permeate pressure are negligible relative to thehigh feed pressure.
� Differential Model
Walawender and Stern[6] derived the differential equationsfor a binary gas system in countercurrent and cocurrent plugflow patterns, shown ideally in Figures 3 and 4. Details ofthe derivation are available in several references.[3,5,6] For abinary gas system, the total mole and O
2 species balances
around the separator areFigure 4. Ideal countercurrent flow pattern.
Figure 3. Ideal cocurrent flow pattern
Membranes in ChE Education
76 Chemical Engineering Education
Membranes in ChE Education
n n n
x n x n y n
F R p
F F R R p p
= + ( )= + ( )
1
2
where nF, n
R, and n
p are the molar flow rates of the feed,
retentate, and permeate streams, respectively, and xF, x
R, and
xp are the feed, retentate, and permeate O
2 mole fractions,
respectively. The species balances around a differential vol-ume element in the membrane give
d xn Q xP yp dA
d x n Q x P y p dA
O
N
( ) = −( ) ( )
−( )[ ] = −( ) − −( )[ ] ( )2
2
3
1 1 1 4
'
'
where Q j' is the permeance of species j, A is the membrane
surface area, and P and p are the average retentate and per-meate side pressures, respectively.
For convenience in the analysis, Eqs. (1) to (4) were com-bined into the following dimensionless equations for coun-tercurrent flow:
Kdx
dA
x y
x yx xr y x x r yR
R i*
*= −−
−( ) −( ) − −( ) − −( )[ ]{ }( )
α 1 1 1
5
Kdy
dA
x y
x xy xr y y x r yR
R*
*= −−
−( ) −( ) − −( ) − −( )[ ]{ }( )
α 1 1 1
6
Kdn
dAxr y x r yR
*
**= −( ) + −( ) − −( ) ( )α 1 1 7
where yi is the mole fraction in the permeate at the closed
end of the fibers. The dimensionless transport parameters aredefined as
A A A
r P p
K n Q A p
Q Q
n n n
m
R R N m
O N
R
*
'
* ' '
*
/
/
/
/
/
= ( )= ( )
= ( )
= ( )
= ( )
8
9
10
11
12
2
2 2α
where Am is the total membrane area. The ideal separa-
tion factor, α*, was assumed constant, but the dimensionlesstransport parameter, K
R, was defined as a function of the
retentate molar flow rate. The solution to Eq. (7) was used tocheck the assumptions leading to the algebraic model ofthe next section. The countercurrent flow equations areintegrated from the retentate end of the membrane, sub-ject to the initial conditions
x x
y y
n
at AR
i
==
=
= ( )
*
*
1
0 13
Note the discontinuity in Eq. (6) at x = xR requires
application of l’Hôpital’s rule.[6]
The dimensionless cocurrent flow model equations are
Kdx
dA
x y
y xx xr y x x r y
Kdy
dA
x y
x xy xr y y x r y
FF
FF
**
**
= −−
−( ) −( ) − −( ) − −( )[ ]{ }( )
= −−
−( ) −( ) − −( ) − −( )[ ]{ }( )
α
α
1 1 1
14
1 1 1
15
where
Kn
Q A pF
F
N M
= ( )2
16'
The cocurrent model equations are integrated from the feedend, subject to the initial conditions
x x
y yat AF
i
==
= ( )* 0 17
The permeate composition at the capped end of the hollowfibers is calculated from the ratio of Eqs. (3) and (4)
y
y
xr y
x r yi
i
i
i1 1 118
−=
−[ ]−( ) − −( )[ ] ( )α*
where, for countercurrent flow, x = xR. For cocurrent flow, x
= xF. Equation (18) is quadratic in y
i. Note that there is an
error in the denominators of Eqs. (17) and (22) of the paperby Davis and Sandall.[5] The correct solution to the quadraticequation is
yxr r xr r xr
i =−( ) +( )+ − −( ) +( )+[ ] − −( )
−( )( )
α α α α
α
* * * *
*
1 1 1 1 4 1
2 1
19
2
Davis and Sandall successfully used the differential modelin their analysis of O
2/N
2 separation in the membrane mod-
ule. At the time, they found that the background required tosolve the model equations for α* and K
R was beyond the
scope of an undergraduate student in their laboratory course.Consequently, they developed True BASIC programs thatwere provided to the students to solve the model equations.Since then, advances in computational software (such asMathcad) have simplified the process of solving the model

Winter 2003 77
Figure 5. Example of Mathcad programming for inversemass transfer analysis for α* and KR.
Membranes in ChE Education
equations. Undergraduate students are now able to developtheir own solutions using standard numerical methods forsolving systems of nonlinear equations or differential equa-tions that are readily available in these computer tools.
Nevertheless, students are still required to set up a stan-dard method such as Euler’s or Runge-Kutta for the initial-value problems in order to find the values for α* and K
R by
inverse analysis of the first column in countercurrent flow.For example, Mathcad and Polymath do not permit their in-trinsic capabilities for solving systems of first-order differ-ential equations to be treated as part of another function. Anexample of programming required in Mathcad for the inversemass transfer is shown in Figure 5. This type of solution maybe intimidating for undergraduate students, depending on theirlevel of experience. This realization, along with the observa-tion that the composition profiles along the membrane wereapproximately linear, led to the following alternative analy-sis that avoids the initial-value problem solution requirementsentirely.
� Algebraic Model
Boucif, et al.,[7] presented a series solution to the binarycomponent differential model Eqs. (5), (6), (14), and (15)that requires a numerical solution to a pair of third-order poly-nomial equations. The solution to the series equations agreeswith numerical solutions to the differential model when thecut is less than 50%. The series solution does not includeaxial pressure effects in the feed or permeate gas, however.Hundyil and Koros[8] presented a more complete analysis ofhollow-fiber membrane modules for multicomponent gasseparation that includes pressure effects. Their approach isbased on a finite-volume element model that requires itera-tive solutions to a large system of nonlinear algebraic equa-tions. The finite-element approach is recommended when de-tailed information of pressure, temperature, and compositioneffects is required.
A simpler, alternative analysis of the membrane unit describedhere was developed that involves only the solution to a smallsystem of nonlinear algebraic equations and includes pres-sure effects when necessary. The simpler-model equationsare analogous to the shell-and-tube heat-exchanger designequations that are familiar to undergradute chemical engi-neering students. The following analysis assumes laminarflow and constant species permeances that are independentof the pressure and composition of the feed or permeate gas.The Hagen-Poisseuille equation is commonly used to calcu-late axial pressure effects[9]
dp
dz
RT n
p d Nf f
= ( )128204
µπ
where R is the ideal gas constant, T is the gas temperature, µis the gas viscosity, n is the variable molar flow rate of per-meate gas, d
f is the inside fiber bore diameter, and N
f is the
number of fibers in a bundle. Other expressions derived fromthe Hagen-Poisseuille equation have been developed to ac-count for compressibility and flow in porous channels whennecessary.[8,10-12]
It has been observed that when the change in the feed molefraction of oxygen is less than 50%, the differential balancesmay be replaced with algebraic expressions involving thelogarithmic mean of the transmembrane partial-pressure dif-ference.[13] In Eq. (3), let
∆ = − ( )xP yp 21
The driving force for diffusion across the membrane, ∆, isassumed to be a linear function of the change in the molarflow on the feed side of the membrane
d xn
d
xn xnR F
R F
( ) =( ) − ( )
−( )
∆ ∆ ∆22
Combine eqs. (2), (3), and (22), separate variables and inte-

78 Chemical Engineering Education
Figure 6.Numerical
results tosupport the
logarithmic-mean
assumptions forxF=0.21,xR=0.16,yp=0.48r=6.47
α*=5.9and KR=4900.
Membranes in ChE Education
grate
y nd
Q dAp p O R F
A
F
R ∆∆
∆ ∆∆
∆
∫ ∫= −( ) ( )2
0
23'
or
y n Q xP yp Ap p O lm m= −( ) ( )2
24'
where the log-mean difference in O2 partial pressure across
the membrane is defined as
xP ypxP yp xP yp
n xP yp xP yplmR F
R F
−( ) =−( ) − −( )
−( ) −( )[ ] ( )l /
25
A similar result is found for a N2 flux expression
1 1 1 262
−( ) = −( ) − −( )[ ] ( )y n Q x P y p Ap p N lm m'
The steady-state binary-gas membrane equations can be writ-ten in dimensionless form using the average pressures
x x y
y K xr y
y K x r y
F R p
p R lm
p R lm
= −( ) + ( )
= −( ) −( ) ( )
−( ) = −( ) −( ) − −( )[ ] ( )
1 27
1 28
1 1 1 1 29
θ θ
θ θ α
θ θ
*
where the cut is defined here as the ratio of permeate-to-feedflow rates
θ = ( )n np f/ 30
Alternative forms of Eqs. (28) and (29) in terms of KF are
y K xr y
y K x r y
p F lm
p F lm
θ α
θ
= −( ) ( )
−( ) = −( ) − −( )[ ] ( )
* 31
1 1 1 32
The permeate composition at the closed end of the hollow-fiber membranes is calculated from Eq. (19).
The experimental separation factor was calculated from themeasured compositions of the permeate and retentate streams
α =−( )−( ) ( )
y x
x y
p R
R p
1
133
Under conditions where the change in the feed composi-tion exceeds 50%, the log-mean model can be applied two ormore times as necessary across a module such that each cutdoes not exceed a 50% change in x
F from the previous step.
The pressure at the closed end of the fiber bore can be calcu-lated by assuming that the permeate flow rate is a linear func-tion of distance along the fiber
nn z
Lp= ( )34
where L is the fiber length. Equation (20) can be integratedwith substitution from Eq. (34) to give an estimate for thepermeate pressure at the closed end of the fibers[9]
p pRT Ln
d Nc
p
f f
= + ( )24
12835
µ
π
� Solution Method
The algebraic model Eqs. (19) and (27-29) represent a sys-tem with four degrees of freedom, or four equations in eightvariables: x
F, x
R, y
p, y
i, θ, α*, K
R, and r. The model was ini-
tially calibrated by fixing xF and r and measuring x
R and y
p,
leaving yi, θ, α*, and K
R as unknowns in the solution.
The solution of the system of nonlinear algebraic equa-tions requires an iterative, trial-and-error technique, such asNewton’s method. The log-mean approximation of the par-tial-pressure driving force is notoriously difficult to convergeunder these circumstances. Fortunately, there are good ap-proximations to the log-mean that avoid problems of diver-gence in the solution. The following form of the Chen ap-proximation was used:[14]
∆ ∆∆ ∆
∆ ∆∆ ∆2 1
2 11 2
1 21 3
236
−( ) ≅
+( )
( )ln /
/
Floudas noted that the Chen approximation to the log-meanhas the advantage that it becomes zero if either the feed orexit partial-pressure driving forces become zero.[15]
The four-column configuration requires sequential solutionto the countercurrent and cocurrent models. Note that n
2F =
n1R
and K2F
= K1R
between the first and second columns, andthat n
4F = n
3R and K
4F = K
3R between the third and fourth col-
umns. The feed flow rates to each column are calculated fromthe cut for the previous column.
RESULTS AND DISCUSSIONThe experimental data of Davis and Sandall[5] were used to
illustrate the analysis procedure. The assumption of Eq. (22)for the log-mean approximation was evaluated by plotting arepresentative numerical solution to Eq. (7), shown in Figure6. A linear least-squares regression of the numerical results

Winter 2003 79
TABLE 1Calibration Data[5] and Results for Single Countercurrent Column
Experimental Data Differential Model Algebraic Model
nRx102
P(kPa) (gmol/s) xR yp α* KR α* KR
377 0.73 0.18 0.43 5.81 31.1 5.82 31.1377 0.74 0.18 0.43 5.81 31.1 5.82 31.1377 1.03 0.19 0.44 5.98 49.6 5.98 49.6377 1.32 0.19 0.44 5.98 49.6 5.98 49.6377 2.54 0.20 0.44 5.71 98.7 5.71 98.6
515 0.62 0.15 0.45 5.93 26.2 5.97 26.1515 0.73 0.16 0.46 6.02 33.3 6.05 33.2515 0.95 0.17 0.47 6.12 43.9 6.14 43.9515 1.51 0.18 0.47 5.85 58.2 5.86 58.2515 2.25 0.19 0.48 5.96 92.1 5.96 92.1
653 0.74 0.14 0.46 5.78 31.5 5.84 31.4653 0.95 0.15 0.47 5.84 38.8 5.88 38.7653 1.32 0.16 0.48 5.90 49.1 5.93 49.0653 2.18 0.18 0.49 5.73 85.7 5.74 85.6653 3.44 0.19 0.5 5.81 135 5.81 135
Average 5.88 5.90
Figure 7. Example of Mathcad calculation for inversemass transfer analysis using the log-mean model.
Figure 8.
Correlation ofKR
with nr
for asingle
counter-current
flowcolumn
Figure 9.
Comparisonof
predictionswith
experimentalresults for air
separationin the four-
columnconfigura-
tion:�=377kPa,
�=515 kPa,=653 kPa.
Membranes in ChE Education
shows that the assumption of a linear function for ∆ is validfor the conditions of this laboratory experiment.
A sample calculation of the single countercurrent flowmodel calibration using Mathcad is shown in Figure 7. Theexperimental data and results of the algebraic model are com-pared with the results from the differential model in Table 1for α* and K
R. There are no significant differences in the
results between these models.
A linear relationship between the retentate flow rate andK
R is calculated for use in the remaining three column pre-
dictions. The linear function is plotted with the results in Fig-ure 5. The result of a linear least-squares regression gives
K nR R= × ( )4 0 10 373.
The average value of α* was calculated to be 5.9 assumingatmospheric pressure in the fiber bore. An increase in fiber-bore pressure would cause the experimentally determinedspecies permeances to decrease. The axial pressure drop hasbeen found to vary linearly with flow rate, however.[16] Thus,the slope in Eq. (37) is not affected by the small pressurebuild-up in the permeate stream.
Separation factors for the four-column configuration werepredicted from the sequential calculations of the model for arange of feed pressures and flow rates. The results plotted inFigure 9 show good agreement with the experimental valuescalculated from the data of Davis and Sandall.
All of these results lend confidence in the algebraic model.Students are able to quickly design alternative configurationsand explore the potential performance of competing designs.

80 Chemical Engineering Education
Membranes in ChE Education
For example, students usually start by comparing the perfor-mance of cocurrent and countercurrent flow. This leads to adesign for one column operating in countercurrent flow withthe same membrane surface area as the four columns. Thesingle column design gives a predicted increase of 10% N
2
recovery when compared to the modular design. Students mayuse the models to predict a dimensionless membrane area,1/K, to recover a desired fraction of oxygen fed to thepermeator. Other designs include four columns operating inparallel with countercurrent flow or four columns with thefeed side in series and the permeate side in parallel.
The Mathcad files used in the analysis are available at<www.d.umn.edu/~rdavis/cee>
CONCLUSIONSA membrane experiment for investigating gas separation
has been in use for over ten years in the undergraduate labo-ratory at the University of California, Santa Barbara. A simpleanalysis method was presented that requires only the solu-tion to a system of four algebraic equations. The simpler analy-sis is equally applicable to newer membrane configurationsthat introduce the high-pressure feed to the fiber bores in or-der to maintain better flow patterns in the membrane mod-ule. The experimental apparatus was designed to permitsingle- and four-column investigations of air separation. Thesingle column was used to calibrate the models for binarygas separation. Comparing results for the four-column op-eration validated the calibrated model. Good model and ex-perimental agreement lend confidence in the model and vali-date the model assumptions. Students are then able to use themodel to develop competing designs for gas separation andoptimize their designs for maximizing efficiency of separa-tion. The advantages of the simpler approach are that stu-dents can readily set up and solve the model equationswithout complicated programming. Students are also ableto explore alternative designs by building models andcomparing the results.
NOMENCLATUREA membrane area, m2
d diameter, mK dimensionless membrane transport parameterL fiber length, mn molar flow rate, gmol/sN number of fibers in a bundlep permeate side pressure, kPaP feed side pressure, kPaQ’ permeance, gmol/(s-kPa-m2)R ideal gas constant, kPa-m3/gmol-KT temperature, Kx feed stream mole fraction of oxygeny permeate stream mole fraction of oxygen
z variable fiber length, mGreek Symbols
α experimental separation factor∆ transmembrane partial pressure, kPaµ viscosity, N-m/s
θ cut of feed to permeate streamSubscripts/Superscripts
c closed end of fiber boree experimentalf fiberF feedi closed end of permeate streamlm log-mean resultm membraneN
2nitrogen
O2
oxygenp predictedR retentate* dimensionless or ideal parameter
REFERENCES1. Pandey, P., and R.S. Chauhan, “Membranes for Gas Separation,” Prog.
Polym. Sci., 26(6), 853 (2001)2. McCabe, W.L., J.C. Smith, and P. Harriott, Unit Operations of Chemi-
cal Engineering, 5th ed., McGraw-Hill, New York, NY (1993)3. Geankoplis, C., Transport Processes and Unit Operations, 3rd ed.,
Prentice-Hall, Englewood Cliffs, NJ (1993)4. Seader, J.D., and E.J. Henley, Separation Process Principles, John
Wiley and Sons, New York, NY (1998)5. Davis, R.A., and O.C. Sandall, “A Membrane Gas Separation Experi-
ment for the Undergraduate Laboratory,” Chem. Eng. Ed., 25(1), 10(1991)
6. Walawender, W.P., and S.A. Stern, “Analysis of Membrane Separa-tion Parameters. II: Counter-Current and Cocurrent Flow in a SinglePermeation Stage,” Sep. Sci., 7(5), 553 (1972)
7. Boucif, N., S. Majumdar, and K.K. Sirkar, “Series Solutions for a GasPermeator with Countercurrent and Cocurrent Flow,” Ind. Eng. Chem.Fund., 23, 470 (1984)
8. Thundyil, M.J., and W.J. Koros, “Mathematical Modeling of Gas Sepa-ration Permeators: For Radial Crossflow, Countercurrent, andCocurrent Hollow Fiber Membrane Modules,” J. Mem. Sci., 125, 275(1997)
9. Zolandz, R.R., and G.K. Fleming, “Design of Gas Permeation Sys-tems,” in Membrane Handbook, W.S. Ho and K.K. Sirkar, eds., VanNostrand Reinhold, New York, NY, p. 66 (1992)
10. Bruining, W.J., “A General Description of Flows and Pressures inHollow Fiber Membrane Modules,” Chem Eng. Sci., 44(6), 1441 (1989)
11. Federspiel, W.J., J.L. Williams, and B.G. Hattler, “Gas Flow Dynam-ics in Hollow-Fiber Membranes,” AIChE J., 42(7), 2094 (1996)
12. Lim, S.P., X. Tan, and K. Li, “Gas/Vapour Separation Using Mem-branes: Effect of Pressure Drop in Lumen of Hollow Fibers,” Chem.Eng. Sci., 55, 2641 (2000)
13. Mulder, M., Basic Principles of Membrane Technology, Kluwer Aca-demic Publishers, Dordrecht, Netherlands (1991)
14. Chen. J.J.J., “Comments on Improvements on a Replacement for theLogarithmic Mean,” Chem. Eng. Sci., 42(10), 2488 (1987)
15. Floudas, C.A., Nonlinear and Mixed-Integer Optimization, OxfordUniversity Press, Oxford (1995)
16. Vladisavljevic, G.T., and M.V. Mitrovic, “Pressure Drops and Hydrau-lic Resistances in a Three-Phase Hollow Fiber Membrane Contactorwith Frame Elements,” Chem. Eng. Proc., 40, 3 (2001) ❐