edinburgh research explorer...99 knee with a visual analogue pain scale (vas) from no pain (0) to...
TRANSCRIPT
Edinburgh Research Explorer
Changes in Bone Density in Metal-Backed and All-PolyethyleneMedial Unicompartmental Knee Arthroplasty
Citation for published version:Scott, CEH, Wade, FA, Bhattacharya, R, MacDonald, D, Pankaj, P & Nutton, RW 2016, 'Changes in BoneDensity in Metal-Backed and All-Polyethylene Medial Unicompartmental Knee Arthroplasty', Journal ofArthroplasty, vol. 31, no. 3, pp. 702–709. https://doi.org/10.1016/j.arth.2015.09.046
Digital Object Identifier (DOI):10.1016/j.arth.2015.09.046
Link:Link to publication record in Edinburgh Research Explorer
Document Version:Peer reviewed version
Published In:Journal of Arthroplasty
General rightsCopyright for the publications made accessible via the Edinburgh Research Explorer is retained by the author(s)and / or other copyright owners and it is a condition of accessing these publications that users recognise andabide by the legal requirements associated with these rights.
Take down policyThe University of Edinburgh has made every reasonable effort to ensure that Edinburgh Research Explorercontent complies with UK legislation. If you believe that the public display of this file breaches copyright pleasecontact [email protected] providing details, and we will remove access to the work immediately andinvestigate your claim.
Download date: 23. Feb. 2020

Changes in Bone Density in Metal-Backed and All-Polyethylene Medial Unicompartmental Knee Arthroplasty
Chloe E.H. Scott, BSc, MSc, FRCS(Tr&Orth) a,b Frazer A.Wade, FRCSEd (Orth) b Rajarshi Bhattacharya, MSc, FRCS(Tr&Orth) b Deborah MacDonald, BA(Hons) b Pankaj Pankaj, PhD a Richard W. Nutton, MD, FRCS(Orth) b a School of Engineering, University of Edinburgh, Edinburgh, UK b Department of Orthopaedics, Royal Infirmary of Edinburgh, Edinburgh, UK
Submitted to: The Journal of Arthroplasty
1
Changes in bone density in metal backed and all-polyethylene medial 1
unicompartmental knee arthroplasty 2
3
Abstract (200 words) 4
Background: Proximal tibial strain in medial unicompartmental knee replacement (UKR) may 5
alter bone mineral density (BMD) and cause pain. The aims of this retrospective cohort study 6
were to quantify and compare changes in proximal tibial BMD in metal-backed (MB) and all-7
polyethylene (AP) medial UKRs, correlating these with outcome, particularly ongoing pain. 8
Methods: Radiographs of 173 MB and 82 AP UKRs were analysed using digital radiograph 9
densitometry at 0, 1, 2 and 5 years. The mean greyscale of 4 proximal tibial regions was 10
measured and converted to a ratio: the GSRb (greyscale ratio b) where GSRb>1 represents 11
relative medial sclerosis. 12
Results: In both implants GSRb reduced significantly to 1 year and stabilised with no 13
differences between implants. Subgroup analysis showed less improvement in OKS in 14
patients whose GSRb increased by >10% at 1 year (40/255) compared to patients whose 15
GSRb reduced by >10% at both one (8.2 Vs 15.8, p=0.002) and five years (9.6 Vs 15.8, 16
p=0.022). Patients with persistently painful UKRs (17/255) showed no reduction in GSRb at 17
one year compared to a 20% reduction in those without pain (p=0.05). 18
Conclusions: BMD changes under medial UKAs are independent of metal backing. Medial 19
sclerosis appears to be associated with ongoing pain. 20
21
22
Keywords: Unicompartmental knee arthroplasty; bone mineral density; unexplained pain; 23
digital radiodensitometry. 24
25
26
Footnote 1 Abbreviations:
BMD Bone mineral density; GSRa Grey scale ratio a (digital radiodensitometry ratio
of medial to lateral proximal tibial condyles); GSRb Grey scale ratio b (digital
radiodensitometry ratio of medial fourth to lateral three fourths proximal tibial
2
Introduction 27
Joint registries show higher revision rates for unicompartmental knee arthroplasties (UKAs) 28
compared to total knee arthroplasties (TKAs) [1-3]. Unexplained pain is the second most 29
common reason for UKA revision after aseptic loosening [4, 5], and undoubtedly contributes to 30
the poorer survival of UKA compared to TKA. Elevated proximal tibial strain with repetitive 31
microfracture and remodelling may contribute to this pain [6]. Tibial bone models of UKAs 32
have shown greater microdamage under all-polyethylene tibial components compared to 33
metal-backed components [7]. In TKA, tibial component metal backing distributes stresses 34
more evenly than in all-polyethylene implants, but causes stress shielding along 35
undersurface projections [8]. The clinical significance of this is unclear with equivalent long 36
term outcomes in both types of TKAs [9]. Both overloading and shielding of bone can alter 37
bone mineral density (BMD). 38
Bone mineral density is routinely measured using dual x-ray absorptiometry (DEXA), but can 39
be measured using digital radiological densitometry. This technique derives changes in BMD 40
from calibrated anteroposterior (AP) radiographs of the knee and has been validated against 41
DEXA [10]. It has been used to assess changes in tibial BMD in TKA [11] and to investigate the 42
role of altered BMD in TKA failure [12]. Stress shielding and low BMD may cause reduced 43
cancellous support to implants resulting in subsidence. Alternatively, proximal tibial 44
microdamage and adaptive remodelling from overload may cause pain and a relative 45
increase in BMD under the implant. 46
The primary aim of this study was to examine changes in tibial BMD in medial UKAs of two 47
designs: a mobile bearing metal-backed implant (MB) and a fixed bearing all-polyethylene 48
implant (AP). We hypothesized that medial BMD would increase under the less stiff all-49
polyethylene tibial components due to repetitive microfracture and remodelling. Secondary 50
aims included investigating the effect of patient demographics on BMD and the effect of 51
BMD changes on clinical outcome, with particular reference to unexplained pain. 52
53
54
Materials and Methods 55
Ethical approval was obtained for this study. Patients who had undergone UKA from 1999-56
2007 at our institution were identified using our prospectively collected arthroplasty 57
database. All patients who had undergone a cemented Oxford mobile bearing metal-backed 58
UKA (MB) (Biomet, Swindon, United Kingdom) or a cemented Preservation fixed bearing all-59

3
polyethylene tibia UKA (AP) (DePuy, Johnson & Johnson Professional Inc., Raynham, 60
Massachusetts, USA) were included in the study. The second of bilateral UKAs were 61
excluded as were patients who had died. 62
Medical and operation notes were reviewed for all patients. Data recorded included age, 63
sex, weight, and body mass index (BMI). 64
To assess BMD, anteroposterior weight-bearing knee radiographs were examined at 5 time-65
points for each patient: pre-operative, immediate postoperative, and at 1, 2 and 5 years post-66
operatively. All radiographs on radiographic film were digitised using a UMAX Power Look 67
2100XL flatbed scanner (RSA Biomedical, Naperville, Illinois, USA) at 256 (8-bit) greyscale 68
and 300dpi resolution and were saved as TIFF files for analysis. Digital radiographs from the 69
PACS system (Kodak Carestream, Rochester, NY, USA) were exported for analysis as TIFF 70
files. Image analysis was performed using ImageJ 1.45m, a public domain Java based 71
scientific image processing and analysis package [13]. Implant alignment [14] and pixel value 72
statistics were measured following calibration, producing a range of greyscale values from 0-73
255 for each pixel. Each image was calibrated such that air (black pixels) had a value of 0 74
and the femoral component (white pixels) a value of 255 [11]. The mean greyscale value of 75
pixels within user defined regions of interest (ROIs) were calculated. Regions of interest 76
were defined using the tibial anatomical axis and standardised measurements (Table 1) to 77
create 4 ROIs: 2 medial (A1 and A2) and 2 lateral (A3 and A4) (Figure 1). Regional 78
boundaries were selected to maximise trabecular bone content and exclude artefact from 79
fibular head, cement and peripheral cortical bone [11] (Figure 1d). 80
81
Regions were transposed to all radiographs of a given patient to ensure the same areas 82
were measured. Mean density measurements were recorded for each ROIs in each patient 83
at each follow up. To facilitate quantitative comparison of radiographs taken at different 84
times, the mean grey scale was represented as a ratio, the greyscale ratio (GSR). This 85
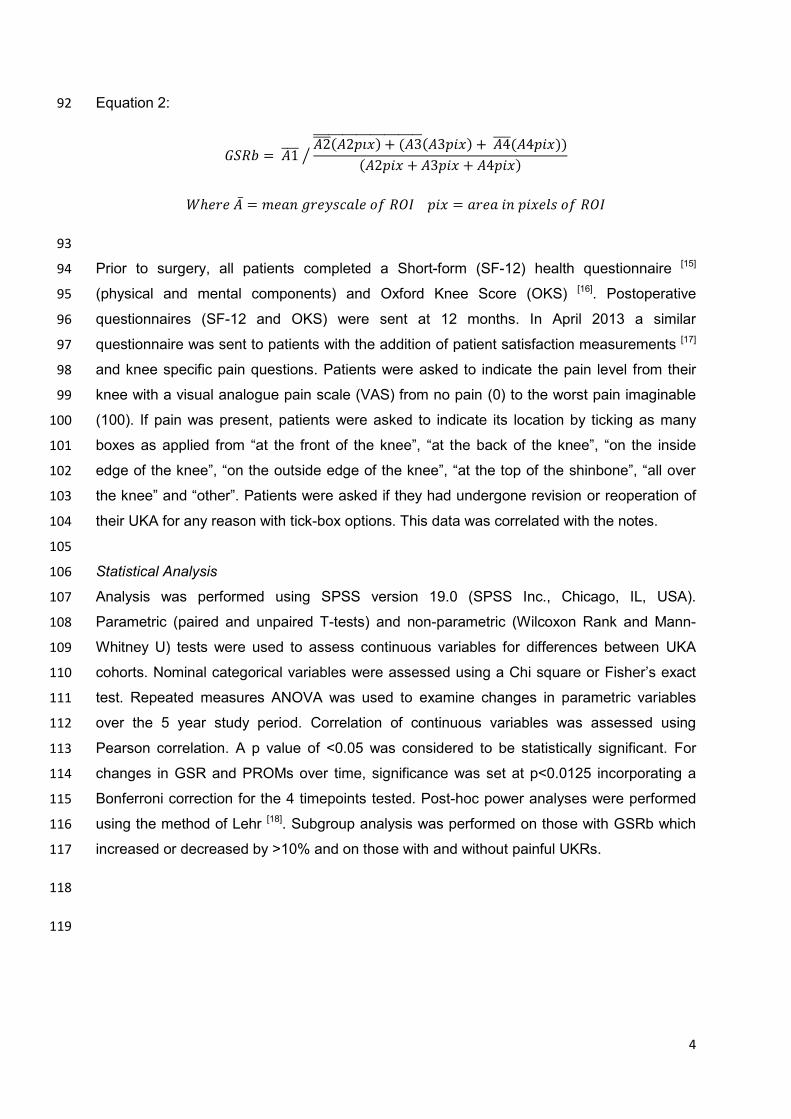
compared the density of medial to lateral ROIs (GSRa, equation 1) and the most medial ROI 86
to the remainder of the proximal tibia (GSRb, equation 2) corrected for area. All 87
measurements were taken by a single observer (CEHS). A GSR>1 reflected a relative 88
medial sclerosis. 89
Equation1: 90
𝐺𝑆𝑅𝑎 = (𝐴1̅̅ ̅̅ ̅(𝐴1𝑝𝑖𝑥) + 𝐴2̅̅̅̅ (𝐴2𝑝𝑖𝑥))
(𝐴1𝑝𝑖𝑥 + 𝐴2𝑝𝑖𝑥)
(𝐴3̅̅ ̅̅ ̅(𝐴3𝑝𝑖𝑥) + 𝐴4̅̅̅̅ (𝐴4𝑝𝑖𝑥))
(𝐴3𝑝𝑖𝑥 + 𝐴4𝑝𝑖𝑥)⁄
91
4
Equation 2: 92
𝐺𝑆𝑅𝑏 = 𝐴1̅̅̅̅ 𝐴2̅̅̅̅ (𝐴2𝑝𝑖𝑥) + (𝐴3̅̅ ̅̅ ̅̅ ̅̅ ̅̅ ̅̅ ̅̅ ̅̅ ̅̅ ̅̅ ̅̅ ̅(𝐴3𝑝𝑖𝑥) + 𝐴4̅̅̅̅ (𝐴4𝑝𝑖𝑥))
(𝐴2𝑝𝑖𝑥 + 𝐴3𝑝𝑖𝑥 + 𝐴4𝑝𝑖𝑥)⁄
𝑊ℎ𝑒𝑟𝑒 �̅� = 𝑚𝑒𝑎𝑛 𝑔𝑟𝑒𝑦𝑠𝑐𝑎𝑙𝑒 𝑜𝑓 𝑅𝑂𝐼 𝑝𝑖𝑥 = 𝑎𝑟𝑒𝑎 𝑖𝑛 𝑝𝑖𝑥𝑒𝑙𝑠 𝑜𝑓 𝑅𝑂𝐼
93
Prior to surgery, all patients completed a Short-form (SF-12) health questionnaire [15] 94
(physical and mental components) and Oxford Knee Score (OKS) [16]. Postoperative 95
questionnaires (SF-12 and OKS) were sent at 12 months. In April 2013 a similar 96
questionnaire was sent to patients with the addition of patient satisfaction measurements [17] 97
and knee specific pain questions. Patients were asked to indicate the pain level from their 98
knee with a visual analogue pain scale (VAS) from no pain (0) to the worst pain imaginable 99
(100). If pain was present, patients were asked to indicate its location by ticking as many 100
boxes as applied from “at the front of the knee”, “at the back of the knee”, “on the inside 101
edge of the knee”, “on the outside edge of the knee”, “at the top of the shinbone”, “all over 102
the knee” and “other”. Patients were asked if they had undergone revision or reoperation of 103
their UKA for any reason with tick-box options. This data was correlated with the notes. 104
105
Statistical Analysis 106
Analysis was performed using SPSS version 19.0 (SPSS Inc., Chicago, IL, USA). 107
Parametric (paired and unpaired T-tests) and non-parametric (Wilcoxon Rank and Mann-108
Whitney U) tests were used to assess continuous variables for differences between UKA 109
cohorts. Nominal categorical variables were assessed using a Chi square or Fisher’s exact 110
test. Repeated measures ANOVA was used to examine changes in parametric variables 111
over the 5 year study period. Correlation of continuous variables was assessed using 112
Pearson correlation. A p value of <0.05 was considered to be statistically significant. For 113
changes in GSR and PROMs over time, significance was set at p<0.0125 incorporating a 114
Bonferroni correction for the 4 timepoints tested. Post-hoc power analyses were performed 115
using the method of Lehr [18]. Subgroup analysis was performed on those with GSRb which 116
increased or decreased by >10% and on those with and without painful UKRs. 117
118
119
5
Results 120
The study group consisted of 173 MB and 82 AP UKRs in 255 patients. Table 2 details 121
preoperative patient characteristics. Table 3 details postoperative alignment. Significantly 122
more proximal tibia, as approximated by D4 (as a percentage of the tibial width) was 123
resected to implant the MB implant (mean 21.8%, SD 3.6) compared to the AP (17.9%, SD 124
2.6, p<0.001 unpaired T-test). Greater overhang was present in the MB group (mean 0.3, 125
SD 1.7) with underhang in the AP group (mean -0.9, SD 1.4, p<0.001 unpaired T-test). 126
There was no difference in resultant femorotibial angle between implants. 127
128
Grey Scale Ratios 129
A total of 945 radiographs were analysed. The greyscale within each ROI was normally 130
distributed, therefore mean greyscale was considered an appropriate measure. Across all 131
UKAs, GSRa did not change significantly with time. However, GSRb decreased significantly 132
in the first postoperative year, remaining stable thereafter (p<0.001, repeated measures 133
ANOVA) (Figure 2). 134
Prior to surgery, the AP group displayed significantly higher GSRb than the MB. GSRb 135
reduced significantly over the 5 year period in both AP (p<0.001, repeated measures 136
ANOVA) and MB UKAs (p=0.014, repeated measures ANOVA) (Figure 3). In both implants, 137
there was a significant negative correlation between preoperative GSRb and 1 year change 138
in GSRb (Pearson’s correlation AP-0.292, p<0.05; MB -0.607, p<0.01). There was no 139
correlation between tibial resection depth and GSRb change in either implant. 140
Using the method of Lehr, our minimal sample size of 82 would enable detection of a 13% 141
difference in GSRb at 1 year (SD 0.298) as significant at 80% power and a significance level 142
of 0.05. 143
144
PROMs 145
The mean follow-up for the >5year questionnaire was 100 months for all UKAs (62-158). 146
There were significant postoperative improvements in the physical component score (PCS) 147
of the SF-12 for both implants (p<0.001, repeated measures ANOVA) with no change from 1 148
to 5 years (MB p=0.203, AP p=0.793, paired T-tests). OKS improved significantly in both 149
implants (p<0.001, repeated measures ANOVA). Again this improvement occurred in the 150
6
first year with no significant changes thereafter and no differences between implants (Table 151
4). 152
153
There was no significant correlation between preoperative GSRb and preoperative OKS 154
(Pearson’s correlation 0.105). Nor was there correlation between absolute OKS and 155
absolute GSRb at 1 or 5 years in either implant (1yr: AP 0.09, MB 0.251; 5yrs: AP -0.004, 156
MB 0.11, Pearson’s correlation). However, negative linear correlations were found for 157
change in GSRb and improvement in OKS at 1 year (AP -0.312 p=0.044, MB -0.287 158
p=0.065) (Figure 4). 159
160
Overall 81% of MB patients and 78% of AP patients were satisfied with their knee at >5 161
years. Satisfaction with pain relief was high in both groups: MB 89% and AP 88%. Pain at >5 162
years (VAS 0-100) did not differ between implants, but did differ significantly between those 163
satisfied (MB 14.6 and AP 14.9) and those dissatisfied (MB 48.0 and AP 47.7, p<0001, 164
unpaired T test). The location of pain reported by patients is shown in Figure 5. The trend 165
towards more medial pain in the AP group was not significant (p=0.127, Chi squared). 166
167
Subgroup Analysis 168
Forty patients (12 AP and 28 MB) displayed a >10% increase in GSRb over 1 year with a 169
mean increase of 0.21 (SD 0.17). A >10% reduction in GSRb occurred in 113 patients with a 170
mean decrease of 0.34 in the first year (SD 0.20). In 103 patients GSRb changed by <10%. 171
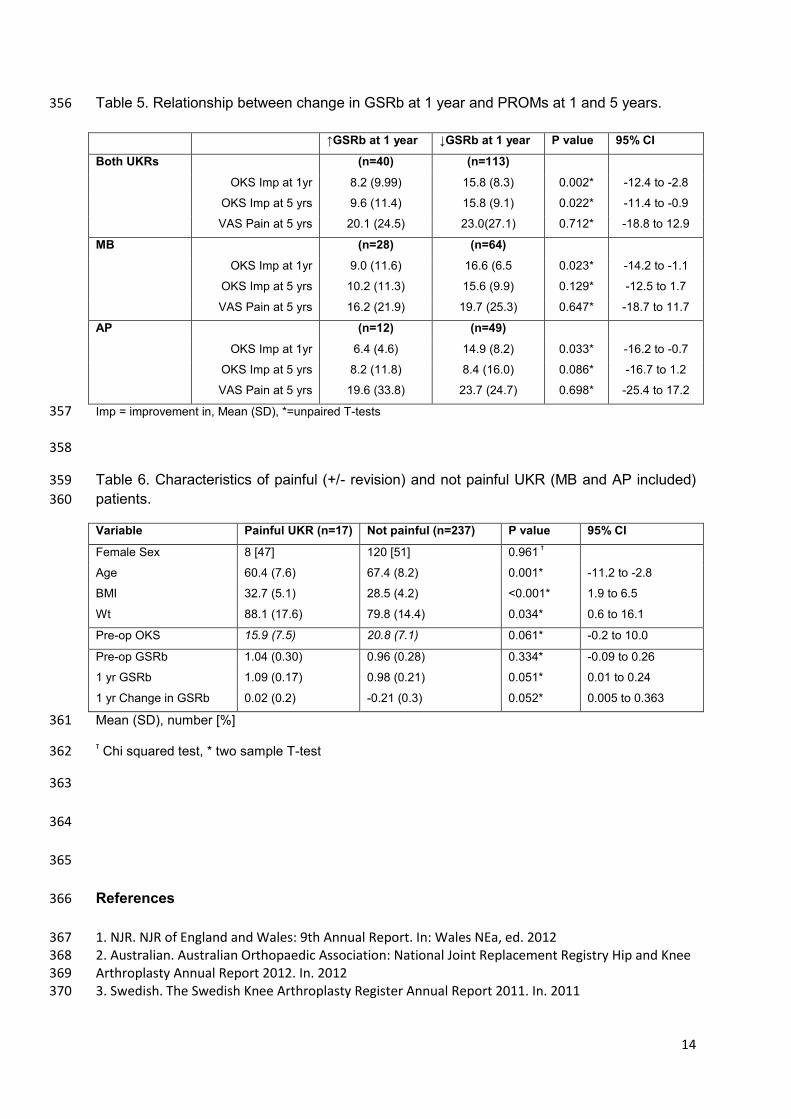
Improvement in OKS at 1 and 5 years differed significantly between those with increased 172
and decreased GSRb at 1 year (Table 5). 173
During the study period, 16/173 MB and 7/82 AP UKAs were revised. Figure 6 details modes 174
of failure. Revisions for pain (2MB and 5AP) were performed at mean 34 months (range 18-175
45). Despite no preoperative differences in GSRb, patients revised for pain had a mean 176
increase in GSRb of 10% in year 1 compared to a mean decrease of 20% in those not 177
revised for pain (p=0.017, unpaired T-test, 95%CI 0.06 to 0.6) (Figure 7). 178
Combining revisions for pain (2MB and 5AP) with patients “poorly” satisfied with pain relief 179
but not offered revision (6MB and 4AP), absolute GSRb at 1 year was higher compared to 180
non-painful UKAs, and this approached significance (p=0.051, Table 6). Mean GSRb 181
reduced over 1 year in patients without painful UKAs, but remained unchanged in painful 182
7
UKAs. Again, this approached significant (p=0.052, Table 6). Significantly less improvement 183
in the 1 year OKS (4.25, SD 11.1) was found following revision for pain compared to 184
revisions for all other modes of failure (19.4, SD 10.6, p=0.026 unpaired T-test). 185
186
Alignment 187
Though there was no difference in resultant femorotibial angle (FTA), the AP tibia was 188
implanted significantly more varised and with greater PTS than the MB (Table 3). The mean 189
tibial component coronal alignment for all UKAs was 86.7o (range 78-93). There was no 190
correlation between GSRb and tibial component coronal alignment (-0.073) or FTA (0.106, 191
Pearson’s correlation). There was no significant difference in GSRb between patients with 192
varus tibial components and those without using both 87o (1.0 Vs 0.96, p=0.263 student T-193
tests) and 85o (0.98 Vs. 0.99, p=0.865, student T-tests) definitions. There was no difference 194
in the tibial coronal alignment in those with painful UKAs (+/- revision) (mean 86.6o) and 195
those without (86.2o, p=0.684 student T-tests). Similarly there was no difference in sagittal 196
alignment between those dissatisfied with painful UKAs (+/- revision) (mean 87.6o) and those 197
without (86.7o, p=0.237 Mann Whitney U test). Femorotibial angle did not differ significantly 198
in those with painful UKAs and those without (177.4 Vs 177.5, p=0.882, student T-test). 199
200
Sex, Age and BMI 201
Females displayed a higher GSRb (higher relative medial BMD) in both groups at every time 202
point. In the MB group, the mean preoperative GSRb in women was 0.99 compared to 0.85 203
in men (p=0.005, 95%CI -0.25 to -0.05). These differences remained significant at 1 year. 204
There was no significant difference in the change in GSRb over the first year between men 205
and women in the MB group (p=0.602, unpaired T-test). In the AP group, again women had 206
a higher mean preoperative GSRb of 1.13 compared to men, 0.93 (p=0.001, 95% CI -0.33 to 207
-0.08, unpaired T-test). Once again these differences remained at 1 year, with no significant 208
differences in the change in GSRb over the years between the sexes. 209
Preoperative GSRb negatively correlated with age (Pearson’s correlation -0.440, p<0.01). 210
Younger patients displayed greater relative medial sclerosis preoperatively. No significant 211
correlation was apparent between change in GSRb at 1 year and age, absolute BMI, weight 212
or tibial resection depth in either implant. 213
8
Patients with a BMI >30 had significantly higher preoperative GSRb (1.03, SD 0.28) than 214
those with BMI <30 (0.93, SD0.27, p=0.025, 95%CI -0.2 to -0.01 unpaired T-test). BMI 215
above or below 30 had no effect on changes in GSRb in the MB group. In the AP group, the 216
differences in preoperative GSRb for patients with BMIs above or below 30 (BMI >30 GSRb 217
1.13 compared to BMI<30 GSRb 0.96, p=0.012, unpaired T-test) resolved by 1 year 218
postoperatively. 219
220
Discussion 221
The greatest changes in BMD were found immediately below the UKA tibial components at 222
the most medial quadrant measured, reflected by GSRb being the most reactive measure. 223
This is consistent with the findings of previous medial UKA DEXA studies [19]. The most 224
significant finding of this study was an overall decrease in medial sclerosis (GSRb) after 225
medial UKA with no differences apparent between all-polyethylene and metal-backed 226
implants. This finding contradicts our original hypothesis that greater medial sclerosis would 227
occur under the all-polyethylene components. This hypothesis was based upon 228
biomechanical data showing greater proximal tibial microdamage under all-polyethylene 229
compared to metal-backed UKA implants [7]. The relationship between implant and bone 230
turnover appears more complex in vivo than simply less stiff implants creating greater 231
cancellous bone overload, and thus sclerosis, via microfracture and adaptive remodelling or 232
avascularity. A number of confounding variables (age, weight, BMI, bone size, resection 233
depth, activity level, preoperative BMD and bone quality) affect loading and the response of 234
bone to this. We have attempted to investigate some of these variables here, but small 235
subgroups increase the possibility of type 2 errors and significant relationships may have 236
been missed. 237
238
Using the same digital radiological densitometry method, a similar reduction in medial BMD 239
has been found following TKA [11]. In isolated medial compartment osteoarthritis, progressive 240
medial tibial condyle overload elevates medial BMD compared to lateral [20]. Restoring 241
medial compartment height and femorotibial angle with a UKA offloads the medial condyle. 242
This would be expected to reduce medial BMD, and thus GSRb as occurred here during the 243
first postoperative year. This concurs with the hypothesis of Simpson et al [6] and with the 244
DEXA findings of others [19, 21]. To our knowledge is the first study to correlate such changes 245
with outcome in UKA. 246
9
247
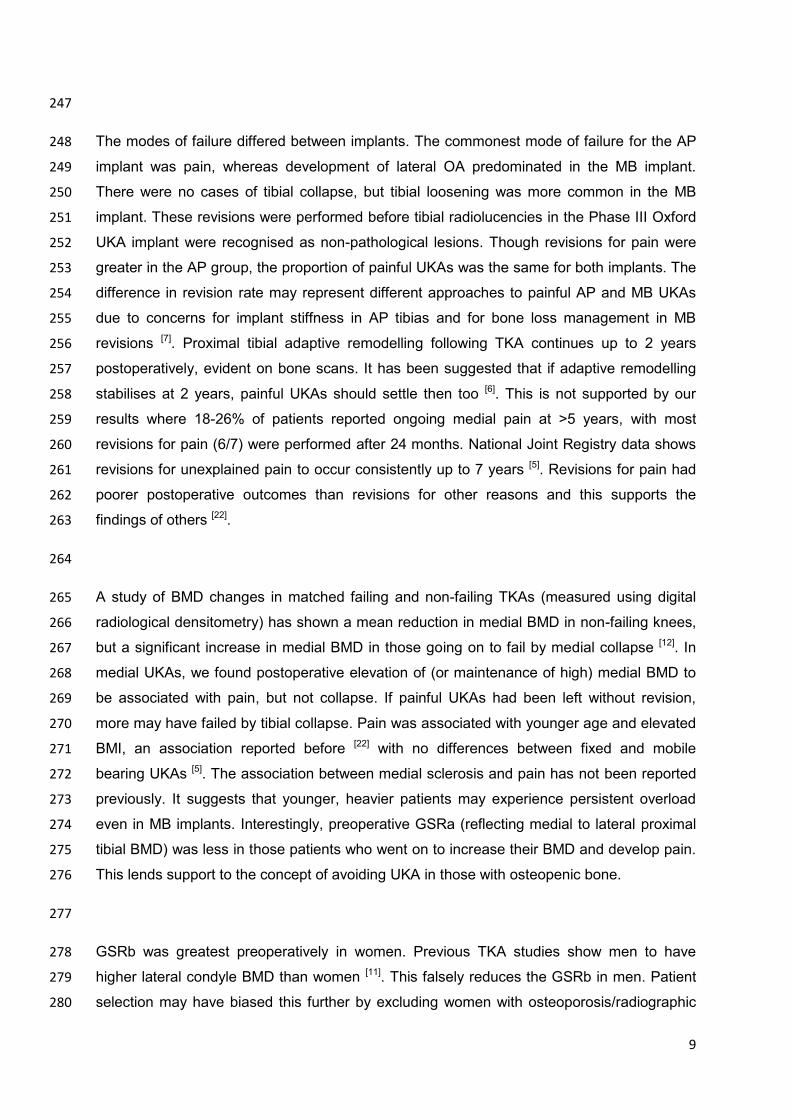
The modes of failure differed between implants. The commonest mode of failure for the AP 248
implant was pain, whereas development of lateral OA predominated in the MB implant. 249
There were no cases of tibial collapse, but tibial loosening was more common in the MB 250
implant. These revisions were performed before tibial radiolucencies in the Phase III Oxford 251
UKA implant were recognised as non-pathological lesions. Though revisions for pain were 252
greater in the AP group, the proportion of painful UKAs was the same for both implants. The 253
difference in revision rate may represent different approaches to painful AP and MB UKAs 254
due to concerns for implant stiffness in AP tibias and for bone loss management in MB 255
revisions [7]. Proximal tibial adaptive remodelling following TKA continues up to 2 years 256
postoperatively, evident on bone scans. It has been suggested that if adaptive remodelling 257
stabilises at 2 years, painful UKAs should settle then too [6]. This is not supported by our 258
results where 18-26% of patients reported ongoing medial pain at >5 years, with most 259
revisions for pain (6/7) were performed after 24 months. National Joint Registry data shows 260
revisions for unexplained pain to occur consistently up to 7 years [5]. Revisions for pain had 261
poorer postoperative outcomes than revisions for other reasons and this supports the 262
findings of others [22]. 263
264
A study of BMD changes in matched failing and non-failing TKAs (measured using digital 265
radiological densitometry) has shown a mean reduction in medial BMD in non-failing knees, 266
but a significant increase in medial BMD in those going on to fail by medial collapse [12]. In 267
medial UKAs, we found postoperative elevation of (or maintenance of high) medial BMD to 268
be associated with pain, but not collapse. If painful UKAs had been left without revision, 269
more may have failed by tibial collapse. Pain was associated with younger age and elevated 270
BMI, an association reported before [22] with no differences between fixed and mobile 271
bearing UKAs [5]. The association between medial sclerosis and pain has not been reported 272
previously. It suggests that younger, heavier patients may experience persistent overload 273
even in MB implants. Interestingly, preoperative GSRa (reflecting medial to lateral proximal 274
tibial BMD) was less in those patients who went on to increase their BMD and develop pain. 275
This lends support to the concept of avoiding UKA in those with osteopenic bone. 276
277
GSRb was greatest preoperatively in women. Previous TKA studies show men to have 278
higher lateral condyle BMD than women [11]. This falsely reduces the GSRb in men. Patient 279
selection may have biased this further by excluding women with osteoporosis/radiographic 280

10
osteopenia from undergoing UKA. The greater proportion of women in the AP group 281
undoubtedly contributed to the higher starting GSRb in this group. The lesser tibial resection 282
used in the AP implant may also have led to measurement of a more sclerotic region. 283
Younger patients, and those with BMI>30, displayed greater preoperative medial sclerosis, 284
suggesting that GSRb may reflect medial load. 285
286
Three previous studies have examined BMD in UKAs. Hooper et al [23] used DEXA in 79 287
uncemented Oxford UKAs comparing operated and non-operated knees at 2 years. They 288
found a mean decrease in BMD in all regions of the operated tibia, greatest medially 289
(corresponding to ROI A1). Changes over time were not examined and comparisons were 290
not with the preoperative knee. Soininvaara et al [19] performed DEXA scanning on 21 metal-291
backed fixed bearing UKAs up to 7 years reporting a mean increase in medial tibial condyle 292
BMD of 9% at 1 year. The ROIs used did not exclude cement, cortical condensations or 293
fibular head composite shadowing. Richmond et al [21] used quantitative CT to asses tibial 294
BMD in 26 MB and 24 AP UKAs reporting a mean reduction in BMD medially under the tibial 295
component of <5% in both UKAs, but significantly greater in the AP implant. Though studies 296
are few, there is little consistency in findings regarding BMD in UKA. It appears that BMD 297
increases in some patients and decreases in others. The bigger sample size in our study has 298
facilitated a more detailed examination of this than has been possible previously. 299
300
The digital radiodensitometry method used in this study can be used on any digital 301
radiograph using the public access software Image J, making it more accessible and 302
cheaper than DEXA scanning [13]. However, whilst this technique can be used to compare 303
relative BMDs, it is unsuitable for absolute values and requires validation before use as a 304
clinical decision making tool could be recommended. There is often reluctance to offer UKA 305
to patients with poor BMD due to concerns regarding tibial subsidence. Our results suggest 306
that caution may also be required in young, heavy patients who are at risk of continued 307
sclerosis and ongoing pain following UKA. 308
309
This study has a number of limitations, including its retrospective design. The tibial 310
component material is not the only design difference between these UKA implants as one is 311
fixed and the other mobile bearing. Digital radiological densitometry is an inferred rather than 312
a true measure of BMD, though it has been validated against DEXA scanning [10]. We have 313
11
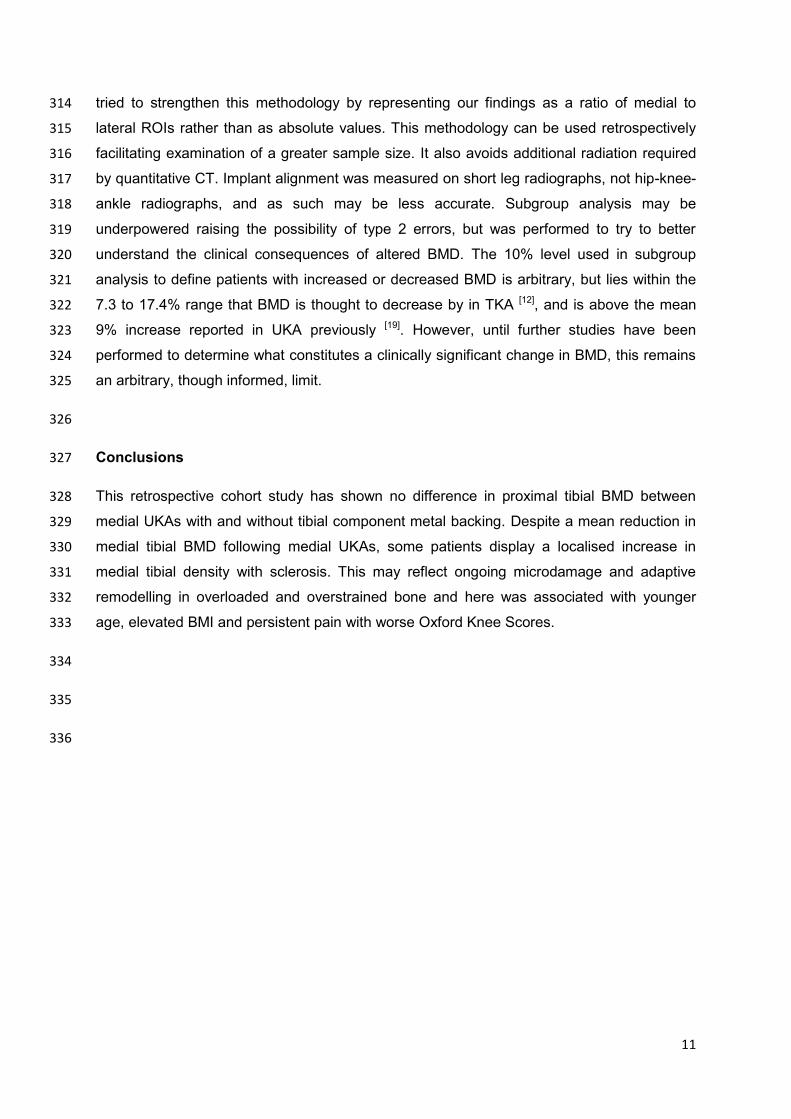
tried to strengthen this methodology by representing our findings as a ratio of medial to 314
lateral ROIs rather than as absolute values. This methodology can be used retrospectively 315
facilitating examination of a greater sample size. It also avoids additional radiation required 316
by quantitative CT. Implant alignment was measured on short leg radiographs, not hip-knee-317
ankle radiographs, and as such may be less accurate. Subgroup analysis may be 318
underpowered raising the possibility of type 2 errors, but was performed to try to better 319
understand the clinical consequences of altered BMD. The 10% level used in subgroup 320
analysis to define patients with increased or decreased BMD is arbitrary, but lies within the 321
7.3 to 17.4% range that BMD is thought to decrease by in TKA [12], and is above the mean 322
9% increase reported in UKA previously [19]. However, until further studies have been 323
performed to determine what constitutes a clinically significant change in BMD, this remains 324
an arbitrary, though informed, limit. 325
326
Conclusions 327
This retrospective cohort study has shown no difference in proximal tibial BMD between 328
medial UKAs with and without tibial component metal backing. Despite a mean reduction in 329
medial tibial BMD following medial UKAs, some patients display a localised increase in 330
medial tibial density with sclerosis. This may reflect ongoing microdamage and adaptive 331
remodelling in overloaded and overstrained bone and here was associated with younger 332
age, elevated BMI and persistent pain with worse Oxford Knee Scores. 333
334
335
336
12
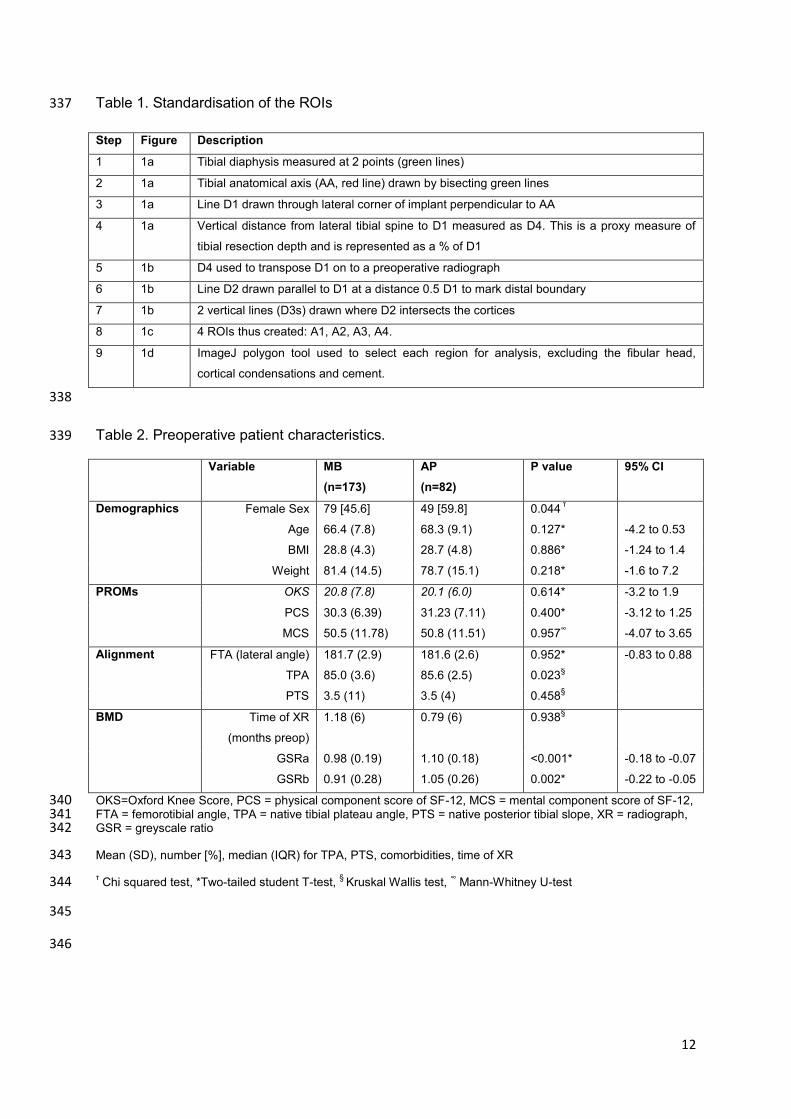
Table 1. Standardisation of the ROIs 337
Step Figure Description
1 1a Tibial diaphysis measured at 2 points (green lines)
2 1a Tibial anatomical axis (AA, red line) drawn by bisecting green lines
3 1a Line D1 drawn through lateral corner of implant perpendicular to AA
4 1a Vertical distance from lateral tibial spine to D1 measured as D4. This is a proxy measure of
tibial resection depth and is represented as a % of D1
5 1b D4 used to transpose D1 on to a preoperative radiograph
6 1b Line D2 drawn parallel to D1 at a distance 0.5 D1 to mark distal boundary
7 1b 2 vertical lines (D3s) drawn where D2 intersects the cortices
8 1c 4 ROIs thus created: A1, A2, A3, A4.
9 1d ImageJ polygon tool used to select each region for analysis, excluding the fibular head,
cortical condensations and cement.
338
Table 2. Preoperative patient characteristics. 339
Variable MB
(n=173)
AP
(n=82)
P value 95% CI
Demographics Female Sex 79 [45.6] 49 [59.8] 0.044 τ
Age 66.4 (7.8) 68.3 (9.1) 0.127* -4.2 to 0.53
BMI 28.8 (4.3) 28.7 (4.8) 0.886* -1.24 to 1.4
Weight 81.4 (14.5) 78.7 (15.1) 0.218* -1.6 to 7.2
PROMs OKS 20.8 (7.8) 20.1 (6.0) 0.614* -3.2 to 1.9
PCS 30.3 (6.39) 31.23 (7.11) 0.400* -3.12 to 1.25
MCS 50.5 (11.78) 50.8 (11.51) 0.957∞ -4.07 to 3.65
Alignment FTA (lateral angle) 181.7 (2.9) 181.6 (2.6) 0.952* -0.83 to 0.88
TPA 85.0 (3.6) 85.6 (2.5) 0.023§
PTS 3.5 (11) 3.5 (4) 0.458§
BMD Time of XR
(months preop)
1.18 (6) 0.79 (6) 0.938§
GSRa 0.98 (0.19) 1.10 (0.18) <0.001* -0.18 to -0.07
GSRb 0.91 (0.28) 1.05 (0.26) 0.002* -0.22 to -0.05
OKS=Oxford Knee Score, PCS = physical component score of SF-12, MCS = mental component score of SF-12, 340 FTA = femorotibial angle, TPA = native tibial plateau angle, PTS = native posterior tibial slope, XR = radiograph, 341 GSR = greyscale ratio 342
Mean (SD), number [%], median (IQR) for TPA, PTS, comorbidities, time of XR 343
τ Chi squared test, *Two-tailed student T-test,
§ Kruskal Wallis test,
∞ Mann-Whitney U-test 344
345
346
13
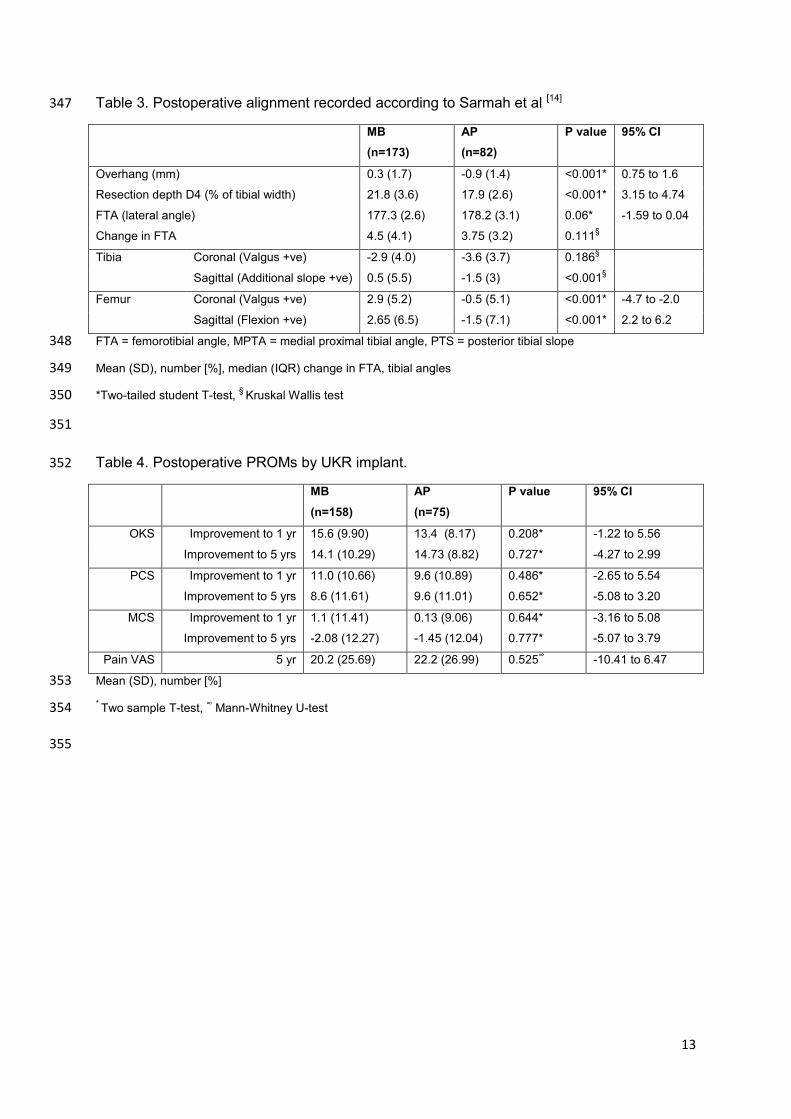
Table 3. Postoperative alignment recorded according to Sarmah et al [14] 347
MB
(n=173)
AP
(n=82)
P value 95% CI
Overhang (mm) 0.3 (1.7) -0.9 (1.4) <0.001* 0.75 to 1.6
Resection depth D4 (% of tibial width) 21.8 (3.6) 17.9 (2.6) <0.001* 3.15 to 4.74
FTA (lateral angle) 177.3 (2.6) 178.2 (3.1) 0.06* -1.59 to 0.04
Change in FTA 4.5 (4.1) 3.75 (3.2) 0.111§
Tibia Coronal (Valgus +ve) -2.9 (4.0) -3.6 (3.7) 0.186§
Sagittal (Additional slope +ve) 0.5 (5.5) -1.5 (3) <0.001§
Femur Coronal (Valgus +ve) 2.9 (5.2) -0.5 (5.1) <0.001* -4.7 to -2.0
Sagittal (Flexion +ve) 2.65 (6.5) -1.5 (7.1) <0.001* 2.2 to 6.2
FTA = femorotibial angle, MPTA = medial proximal tibial angle, PTS = posterior tibial slope 348
Mean (SD), number [%], median (IQR) change in FTA, tibial angles 349
*Two-tailed student T-test, §
Kruskal Wallis test 350
351
Table 4. Postoperative PROMs by UKR implant. 352
MB
(n=158)
AP
(n=75)
P value 95% CI
OKS Improvement to 1 yr 15.6 (9.90) 13.4 (8.17) 0.208* -1.22 to 5.56
Improvement to 5 yrs 14.1 (10.29) 14.73 (8.82) 0.727* -4.27 to 2.99
PCS Improvement to 1 yr 11.0 (10.66) 9.6 (10.89) 0.486* -2.65 to 5.54
Improvement to 5 yrs 8.6 (11.61) 9.6 (11.01) 0.652* -5.08 to 3.20
MCS Improvement to 1 yr 1.1 (11.41) 0.13 (9.06) 0.644* -3.16 to 5.08
Improvement to 5 yrs -2.08 (12.27) -1.45 (12.04) 0.777* -5.07 to 3.79
Pain VAS 5 yr 20.2 (25.69) 22.2 (26.99) 0.525∞ -10.41 to 6.47
Mean (SD), number [%] 353
* Two sample T-test,
∞ Mann-Whitney U-test 354
355
14
Table 5. Relationship between change in GSRb at 1 year and PROMs at 1 and 5 years. 356
↑GSRb at 1 year ↓GSRb at 1 year P value 95% CI
Both UKRs (n=40) (n=113)
OKS Imp at 1yr 8.2 (9.99) 15.8 (8.3) 0.002* -12.4 to -2.8
OKS Imp at 5 yrs 9.6 (11.4) 15.8 (9.1) 0.022* -11.4 to -0.9
VAS Pain at 5 yrs 20.1 (24.5) 23.0(27.1) 0.712* -18.8 to 12.9
MB (n=28) (n=64)
OKS Imp at 1yr 9.0 (11.6) 16.6 (6.5 0.023* -14.2 to -1.1
OKS Imp at 5 yrs 10.2 (11.3) 15.6 (9.9) 0.129* -12.5 to 1.7
VAS Pain at 5 yrs 16.2 (21.9) 19.7 (25.3) 0.647* -18.7 to 11.7
AP (n=12) (n=49)
OKS Imp at 1yr 6.4 (4.6) 14.9 (8.2) 0.033* -16.2 to -0.7
OKS Imp at 5 yrs 8.2 (11.8) 8.4 (16.0) 0.086* -16.7 to 1.2
VAS Pain at 5 yrs 19.6 (33.8) 23.7 (24.7) 0.698* -25.4 to 17.2
Imp = improvement in, Mean (SD), *=unpaired T-tests 357
358
Table 6. Characteristics of painful (+/- revision) and not painful UKR (MB and AP included) 359
patients. 360
Variable Painful UKR (n=17) Not painful (n=237) P value 95% CI
Female Sex 8 [47] 120 [51] 0.961 τ
Age 60.4 (7.6) 67.4 (8.2) 0.001* -11.2 to -2.8
BMI 32.7 (5.1) 28.5 (4.2) <0.001* 1.9 to 6.5
Wt 88.1 (17.6) 79.8 (14.4) 0.034* 0.6 to 16.1
Pre-op OKS 15.9 (7.5) 20.8 (7.1) 0.061* -0.2 to 10.0
Pre-op GSRb 1.04 (0.30) 0.96 (0.28) 0.334* -0.09 to 0.26
1 yr GSRb 1.09 (0.17) 0.98 (0.21) 0.051* 0.01 to 0.24
1 yr Change in GSRb 0.02 (0.2) -0.21 (0.3) 0.052* 0.005 to 0.363
Mean (SD), number [%] 361
τ Chi squared test, * two sample T-test 362
363
364
365
References 366
1. NJR. NJR of England and Wales: 9th Annual Report. In: Wales NEa, ed. 2012 367 2. Australian. Australian Orthopaedic Association: National Joint Replacement Registry Hip and Knee 368 Arthroplasty Annual Report 2012. In. 2012 369 3. Swedish. The Swedish Knee Arthroplasty Register Annual Report 2011. In. 2011 370

15
4. Baker PN, Petheram T, Avery PJ, Gregg PJ, Deehan DJ. Revision for unexplained pain following 371 unicompartmental and total knee replacement. The Journal of bone and joint surgery American 372 volume 94(17): e126, 2012 373 5. Baker PN, Jameson SS, Deehan DJ, Gregg PJ, Porter M, Tucker K. Mid-term equivalent survival of 374 medial and lateral unicondylar knee replacement: an analysis of data from a National Joint Registry. 375 The Journal of bone and joint surgery British volume 94(12): 1641, 2012 376 6. Simpson DJ, Price AJ, Gulati A, Murray DW, Gill HS. Elevated proximal tibial strains following 377 unicompartmental knee replacement--a possible cause of pain. Medical engineering & physics 31(7): 378 752, 2009 379 7. Scott CE, Eaton MJ, Nutton RW, Wade FA, Pankaj P, Evans SL. Proximal tibial strain in medial 380 unicompartmental knee replacements: A biomechanical study of implant design. The bone & joint 381 journal 95-B(10): 1339, 2013 382 8. Bartel DL, Burstein AH, Santavicca EA, Insall JN. Performance of the tibial component in total knee 383 replacement. The Journal of bone and joint surgery American volume 64(7): 1026, 1982 384 9. Bettinson KA, Pinder IM, Moran CG, Weir DJ, Lingard EA. All-polyethylene compared with metal-385 backed tibial components in total knee arthroplasty at ten years. A prospective, randomized 386 controlled trial. The Journal of bone and joint surgery American volume 91(7): 1587, 2009 387 10. Hernandez-Vaquero D, Garcia-Sandoval MA, Fernandez-Carreira JM, Suarez-Vazquez A, Perez-388 Hernandez D. Measurement of bone mineral density is possible with standard radiographs: a study 389 involving total knee replacement. Acta orthopaedica 76(6): 791, 2005 390 11. Small SR, Ritter MA, Merchun JG, Davis KE, Rogge RD. Changes in tibial bone density measured 391 from standard radiographs in cemented and uncemented total knee replacements after ten years’ 392 follow-up. Bone & Joint Journal 95-B(7): 911, 2013 393 12. Ritter MA, Davis KE, Small SR, Merchun JG, Farris A. Trabecular bone density of the proximal tibia 394 as it relates to failure of a total knee replacement. Bone & Joint Journal 96-B(11): 1503, 2014 395 13. ImageJ. In. http://imagej.nih.gov/ij/downlod.html: 396 14. Sarmah SS, Patel S, Hossain FS, Haddad FS. The radiological assessment of total and 397 unicompartmental knee replacements. The Journal of bone and joint surgery British volume 94-398 B(10): 1321, 2012 399 15. Dunbar MJ, Robertsson O, Ryd L, Lidgren L. Appropriate questionnaires for knee arthroplasty. 400 Results of a survey of 3600 patients from the Swedish Knee Arthroplasty Register. JBJS Br 83(3): 339, 401 2001 402 16. Dawson J, Fitzpatrick R, Murray D, Carr A. Questionnaire on the perceptions of patients about 403 total knee replacement. Journal of Bone & Joint Surgery, British Volume 80-B(1): 63, 1998 404 17. Scott CEH, Howie CR, MacDonald D, Biant LC. Predicting dissatisfaction following total knee 405 replacement: a prospective study of 1217 patients. The Journal of bone and joint surgery British 406 volume 92-B(9): 1253, 2010 407 18. Petrie A. Statistics in orthopaedic papers. The Journal of bone and joint surgery British volume 408 88-B(9): 1121, 2006 409 19. Soininvaara TA, Harju KA, Miettinen HJ, Kroger HP. Periprosthetic bone mineral density changes 410 after unicondylar knee arthroplasty. The Knee 20(2): 120, 2013 411 20. Li MG, Nilsson KG. The effect of the preoperative bone quality on the fixation of the tibial 412 component in total knee arthroplasty. The Journal of arthroplasty 15(6): 744, 2000 413 21. Richmond BI, Hadlow SV, Lynskey TG, Walker CG, Munro JT. Proximal Tibial Bone Density Is 414 Preserved After Unicompartmental Knee Arthroplasty. Clinical orthopaedics and related research, 415 2013 416 22. Kerens B, Boonen B, Schotanus MG, Lacroix H, Emans PJ, Kort NP. Revision from 417 unicompartmental to total knee replacement: the clinical outcome depends on reason for revision. 418 The bone & joint journal 95-B(9): 1204, 2013 419

16
23. Hooper GJ, Gilchrist N, Maxwell R, March R, Heard A, Frampton C. The effect of the Oxford 420 uncemented medial compartment arthroplasty on the bone mineral density and content of the 421 proximal tibia. The bone & joint journal 95-B(11): 1480, 2013 422
423
424

Figure 1a-c. Delineating the regions of interest (ROIs).
Figure 1d. ROIs for analysis with exclusion of fibular head, cortical condensation and cement
(magnified).
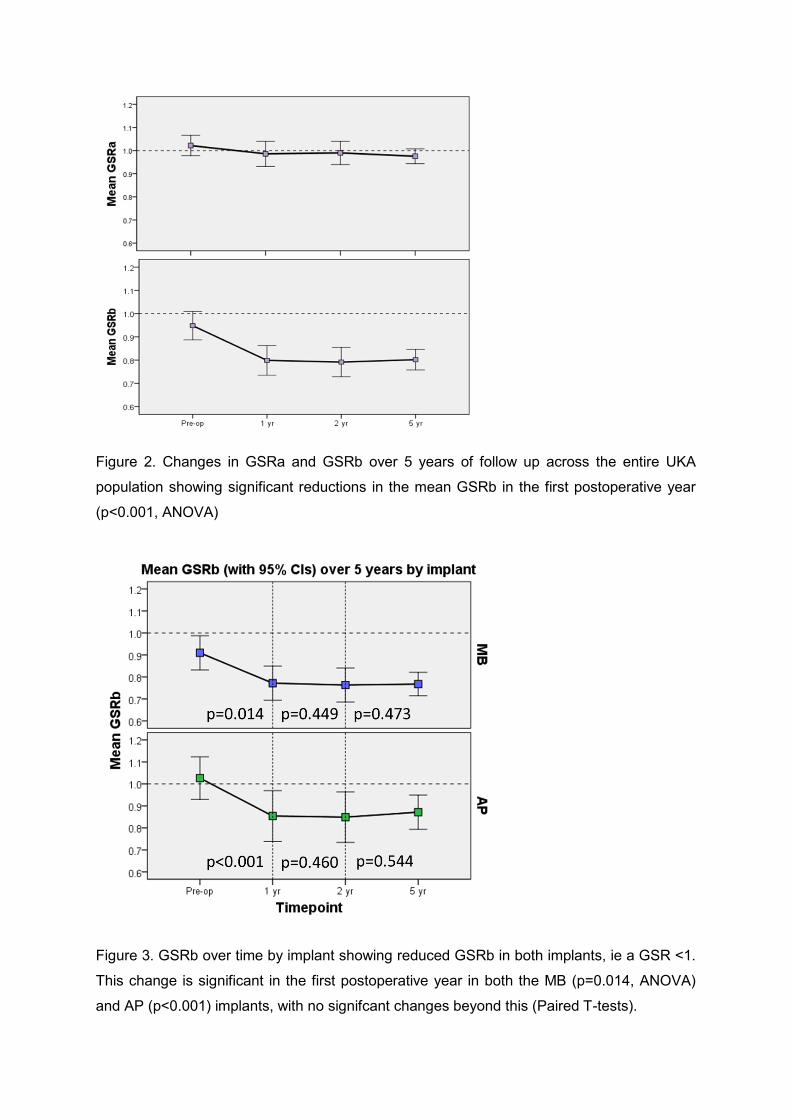
Figure 2. Changes in GSRa and GSRb over 5 years of follow up across the entire UKA
population showing significant reductions in the mean GSRb in the first postoperative year
(p<0.001, ANOVA)
Figure 3. GSRb over time by implant showing reduced GSRb in both implants, ie a GSR <1.
This change is significant in the first postoperative year in both the MB (p=0.014, ANOVA)
and AP (p<0.001) implants, with no signifcant changes beyond this (Paired T-tests).
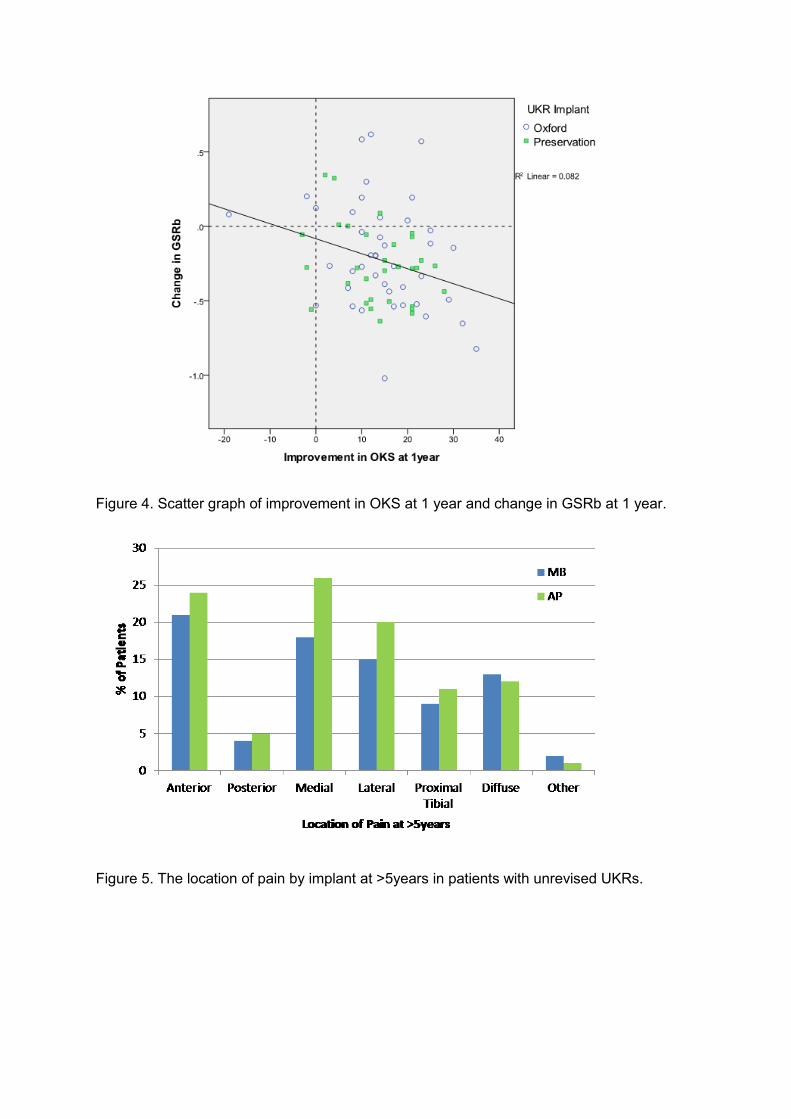
Figure 4. Scatter graph of improvement in OKS at 1 year and change in GSRb at 1 year.
Figure 5. The location of pain by implant at >5years in patients with unrevised UKRs.

Figure 6. Modes of UKA failure by implant with mean survival times for each mode in
months.
Figure 7. GSRb in patients with and without painful UKAs (both AP and MB implants).