edinburgh research explorer · 6geriatric unit, azienda sanitaria firenze (asf), florence, italy 7...
TRANSCRIPT

Edinburgh Research Explorer
Integration of GWAS SNPs and tissue specific expressionprofiling reveal discrete eQTLs for human traits in blood andbrainCitation for published version:Hernandez, DG, Nalls, MA, Moore, M, Chong, S, Dillman, A, Trabzuni, D, Gibbs, JR, Ryten, M, Arepalli, S,Weale, ME, Zonderman, AB, Troncoso, J, O'Brien, R, Walker, R, Smith, C, Bandinelli, S, Traynor, BJ,Hardy, J, Singleton, AB & Cookson, MR 2012, 'Integration of GWAS SNPs and tissue specific expressionprofiling reveal discrete eQTLs for human traits in blood and brain' Neurobiology of disease, vol. 47, no. 1,pp. 20-28. DOI: 10.1016/j.nbd.2012.03.020
Digital Object Identifier (DOI):10.1016/j.nbd.2012.03.020
Link:Link to publication record in Edinburgh Research Explorer
Document Version:Peer reviewed version
Published In:Neurobiology of disease
Publisher Rights Statement:NIH Public Access Author Manuscript
General rightsCopyright for the publications made accessible via the Edinburgh Research Explorer is retained by the author(s)and / or other copyright owners and it is a condition of accessing these publications that users recognise andabide by the legal requirements associated with these rights.
Take down policyThe University of Edinburgh has made every reasonable effort to ensure that Edinburgh Research Explorercontent complies with UK legislation. If you believe that the public display of this file breaches copyright pleasecontact [email protected] providing details, and we will remove access to the work immediately andinvestigate your claim.
Download date: 15. Feb. 2019

Integration of GWAS SNPs and tissue specific expressionprofiling reveal discrete eQTLs for human traits in blood andbrain
Dena G. Hernandez, MS1,2, Mike A. Nalls, PhD1, Matthew Moore, BS1, Sean Chong, BA1,Allissa Dillman, BS1,8, Daniah Trabzuni, MSc2, J. Raphael Gibbs, BS1,2, Mina Ryten, PhD2,Sampath Arepalli, MS1, Michael E. Weale, PhD3, Alan B. Zonderman, PhD4, Juan Troncoso,MD5, Richard O’Brien, MD, PhD5, Robert Walker, MD7, Colin Smith, MD7, StefaniaBandinelli, MD6, Bryan J. Traynor, MD1, John Hardy, PhD2, Andrew B. Singleton, PhD1, andMark R Cookson, PhD1,CA
1Laboratory of Neurogenetics, National Institute on Aging, National Institutes of Health, Bethesda,MD, USA2Department of Molecular Neuroscience, UCL Institute of Neurology, London, UK3Department of Medical & Molecular Genetics, King’s College, London, UK4Research Resources Branch, National Institute on Aging, National Institutes of Health,Bethesda, MD, USA5Brain Resource Center, Johns Hopkins University, Baltimore, MD, USA6Geriatric Unit, Azienda Sanitaria Firenze (ASF), Florence, Italy7Department of Pathology, The University of Edinburgh, Wilkie Building, Teviot Place, Edinburgh,UK8Department of Neuroscience, Karolinska Institute, 171 77 Stockholm, Sweden
AbstractGenome wide association studies have nominated many genetic variants for common human traits,including diseases, but in many cases the underlying biological reason for a trait association isunknown. Subsets of genetic polymorphisms show a statistical association with transcriptexpression levels, and have therefore been nominated as expression quantitative trait loci (eQTL).However, many tissue and cell types have specific gene expression patterns and so it is not clearhow frequently eQTLs found in one tissue type will be replicated in others. In the present studywe used two appropriately powered sample series to examine the genetic control of geneexpression in blood and brain. We find that while many eQTLs associated with human traits areshared between these two tissues, there are also examples where blood and brain differ, either byrestricted gene expression patterns in one tissue or because of differences in how genetic variants
CACorrespondence to: Mark R. Cookson, Cell Biology and Gene Expression Unit, Laboratory of Neurogenetics, National Institute onAging, 35 Convent Drive, Bethesda MD 20892-3707, USA. Phone : +1 301 451 3870. Fax : +1 301 451 [email protected].
There is no conflict of interest to disclose.
DatasetsDatasets have been submitted to GEO: accession # GSE36192
Publisher's Disclaimer: This is a PDF file of an unedited manuscript that has been accepted for publication. As a service to ourcustomers we are providing this early version of the manuscript. The manuscript will undergo copyediting, typesetting, and review ofthe resulting proof before it is published in its final citable form. Please note that during the production process errors may bediscovered which could affect the content, and all legal disclaimers that apply to the journal pertain.
NIH Public AccessAuthor ManuscriptNeurobiol Dis. Author manuscript; available in PMC 2013 July 01.
Published in final edited form as:Neurobiol Dis. 2012 July ; 47(1): 20–28. doi:10.1016/j.nbd.2012.03.020.
NIH
-PA Author Manuscript
NIH
-PA Author Manuscript
NIH
-PA Author Manuscript
are associated with transcript levels. These observations suggest that design of eQTL mappingexperiments should consider tissue of interest for the disease or other trait studied.
IntroductionGenome-wide association (GWA) studies have provided novel insights into human traits byidentifying single nucleotide polymorphisms (SNPs) associated with disease, including type1 diabetes, coronary artery disease, HIV-1 infection and type 2 diabetes (Fellay et al., 2007;Preuss et al., 2010; Scott et al., 2007; Sladek et al., 2007; Steinthorsdottir et al., 2007; Toddet al., 2007a; Yang et al., 2010; Zeggini et al., 2008), or other phenotypes. Because GWASidentify loci rather than functional variants, most GWAS have provided limited insights intounderlying mechanisms (Hindorff et al., 2009). Therefore, annotating the possible functionaleffects of genetic risk variants is important in understanding genomic data.
Mapping of expression quantitative trait loci (eQTL) is one way to demonstrate that a riskvariant within a locus has a functional effect on gene expression (Cheung et al., 2005;Morley et al., 2004; Myers et al., 2007; Stranger et al., 2007). eQTL analysis is performedby examining the association of each SNP with expression of mRNA transcripts. In general,eQTL effects are stronger for SNPs and transcripts that are physically close to each other(Gibbs et al., 2010). Trait associated SNPs from GWAS have been proposed to be morelikely associated with expression differences than other SNPs (Nicolae et al., 2010). Suchstudies have generally been performed with transformed cell lines but eQTLs can also beidentified in liver (Schadt et al., 2008), kidney (Wheeler et al., 2009), cell lines from asthmapatients (Dixon et al., 2007; Moffatt et al., 2007) blood (Nalls et al., 2011a), subcutaneousadipose tissue (Emilsson et al., 2008) and brain (Gibbs et al., 2010; Heinzen et al., 2008; Liuet al., 2010a; Myers et al., 2007; Webster et al., 2009). For at least some loci, eQTLs arefound consistently in both transformed cells and in primary tissues (Bullaughey K, 2009).Overall, this data might suggest that functional annotation of GWAS loci can be performedin any convenient tissue.
Studying brain tissue is particularly challenging because these tissue samples have to becollected post mortem and there is a high degree of cellular heterogeneity. Although someeQTLs have been nominated for brain diseases, such as MAPT in Parkinson’s disease (PD)and progressive supranuclear palsy (PSP) (Hoglinger et al., 2011; Nalls et al., 2011b; Tobinet al., 2008; Vandrovcova et al., 2010), many nominated loci for brain phenotypes are notfunctionally annotated.
To explore the tissue specificity of eQTLs, we analyzed expression in brain and blood usingSNPs abstracted from the NHGRI catalog of GWAS. We specifically wanted to addresswhether it is necessary to examine brain tissue to detect eQTLs for brain traits, includingneurological diseases and psychiatric events, or whether the same information could beobtained from a more accessible tissue such as blood. We find that while many eQTLs areshared between blood and brain, there are specific instances, not always simply related totissue specific gene expression levels, where the tissue studied limits detection of eQTLs.
Material and MethodsSamples
Fresh, frozen tissue samples from the frontal lobe of the cerebral cortex and from thecerebellum were obtained from neurologically normal Caucasian subjects. Genomic DNAwas extracted using phenol-chloroform and RNA using Trizol from subdissected samples(100–200mg). Peripheral blood specimens were collected using PAXgene tubes. RNA was
Hernandez et al. Page 2
Neurobiol Dis. Author manuscript; available in PMC 2013 July 01.
NIH
-PA Author Manuscript
NIH
-PA Author Manuscript
NIH
-PA Author Manuscript
extracted from peripheral blood samples using the PAXgene Blood mRNA kit (Qiagen,Crawley, UK) according to the manufacturer’s instructions.
Genotyping and ImputationGenotyping was performed using the Illumina Infinium HumanHap550 v3, Human610-Quad v1 or Human660W-Quad v1 Infinium Beadchip and common SNPs across allplatforms were identified for each sample. SNPs were excluded if they showed < 95%genotyping success rate per SNP, minor allele frequency (MAF) < 0.01 or Hardy-Weinbergequilibrium (HWE) p-value < 1E-7. Quality control was carried out using PLINK v1.07 foreach cohort separately prior to imputation and was determined by comparing the subjectsreported gender with the genotypic gender determined using PLINK’s check sex algorithm.
Ethnicity and cryptic relatedness was determined using Identity-by-State (IBS) clusteringand multidimensional scaling analyses within PLINK using genotypes that had been mergedwith data from HapMap Phase III, ASW, TSI, CEU, JPT, CHB and YRI populations[http://hapmap.ncbi.nlm.nih.gov/]. The subset of SNPs used were shared across studies,using only common SNPs that are not correlated within a 50 SNP sliding window at an r2 >0.20, with each window overlapping by 5 SNPs. Samples were clustered using multi-dimensional scaling, removing outliers > 3 standard deviations from the mean componentvector estimates for C1 or C2 for the combined CEU and TSI samples. Cryptically relatedsamples were excluded after pairwise identical by descent estimates were calculated,excluding any samples sharing greater than a 0.15 proportion of alleles.
Markov Chain based haplotyper (MACH 1.0.16) was used to impute non-assayed genotypesfor blood and brain datasets independently using the June 2010 release of the 1000 GenomesProject build-36 reference panel, using default settings for MACH. Imputed SNPs wereexcluded from the analysis if their minor allele frequency (MAF) was <0.01 and if their r2
was <0.3
GWAS SNPsTrait and disease associated SNPs were extracted from the NHGRI catalog of publishedGWAS at http://www.genome.gov/gwastudies/ on July 30th 2011. Analyses was restricted tothe following criteria: discovery p-value < 5E-08, initial sample size >1000 (or 1000 casesin binomial analyses), replication sample size >500 (or 500 cases in binomial analyses),number of SNPs >100,000, samples of European ancestry and risk allele frequency ofSNP(s) greater or equal to 0.01.
Expression ProfilingExpression profiling was performed largely as previously described (Gibbs et al., 2010).RNA was biotinylated and amplified using the Illumina® TotalPrep-96 RNA AmplificationKit and directly hybridized onto HumanHT-12_v3 Expression BeadChips. Where possible,the same RNA samples were used from our previous study that used HumanRef8 ExpressionBeadChips. Raw intensity values for each probe were normalized using cubic spline inBeadStudio (Illumina) then log2 transformed. Individual probes were included in analysis ifthey were detected (P<0.01) in more than 95% of samples in the series.
To define probes within +/− 1MB of SNPs, probes were re-annotated using ReMOAT(http://www.compbio.group.cam.ac.uk/Resources/Annotation/). Ambiguous probes thatmapped to multiple positions, or were identified as having design problems in ReMOAT,were excluded from subsequent analyses. To remove potential bias resulting frompolymorphisms, all probes that included an analyzed SNP within the 50mer probe wereremoved.
Hernandez et al. Page 3
Neurobiol Dis. Author manuscript; available in PMC 2013 July 01.
NIH
-PA Author Manuscript
NIH
-PA Author Manuscript
NIH
-PA Author Manuscript
Expression QTL AnalysesStarting with 447 subjects in the brain series, after data normalization and quality control,the brain mRNA dataset included 399 samples and ~9000 mRNA probes that were detectedin >95% of all samples. The blood dataset started with 712 samples, of which 501 passed allour QC steps; 5094 mRNA probes were detected in >95% of samples. In each brain region,mRNA probes within 500kb of the chromosomal location of each SNP were incorporatedinto linear regression modeling using MACH2QTLv1.08. Estimates of the associationbetween the allelic dose of each SNP as a predictor of proximal gene expression levels weregenerated. These linear regression models were adjusted for biological covariates of age atdeath and gender, the first 2 component vectors from multi-dimensional scaling, as well asmethodological covariates including post mortem interval (PMI), tissue bank andhybridization batch. SNPs with fewer than 3 minor homozygotes detected (based on eithergenotyped SNPs or maximum likelihood genotypes from imputation) were excluded fromanalyses. A consensus set of results was extracted from the frontal cortex, cerebellum andblood eQTL datasets with identical overlapping combinations of GWAS SNPs and proximalcis mRNA probes. Significant associations were determined within each tissue type using a5% FDR adjustment for multiple testing. Proportions of tested associations were calculatedper tissue based on this subset of the eQTL results, and were compared using simple chi-squared tests.
Case studies of specific lociIdentical statistical models were utilized to test our ability to detect known-associatedeQTLs in previously published reports in tissues not previously investigated in GWAS.Results for these loci were mined for all associations within each +/− 500kb region aroundtop SNPs within each locus from the published GWAS within each tissue.
ResultsPower to detect eQTLs in large blood or brain datasets
Directly comparing expression datasets derived from brain and whole blood in humansamples is difficult because brain samples are taken post mortem whereas blood samples areroutinely taken during life. Therefore, we used two large, well-powered series from differentsets of individuals to maximize our ability to find eQTLs in each tissue type. For brain, weexpanded our previous dataset (Gibbs et al., 2010) in frontal cortex and cerebellum andobtained whole blood from 712 individuals from the InCHIANTI study (Wood et al., 2011).For consistency, we used the same expression array platform (Illumina HT-12 beadchipscontaining 48,000 probes) for all samples. After quality control, the brain mRNA datasetincluded 399 samples with data at 9000 probes. The blood dataset included 501 samplescontaining expression data from 5094 probes. Following imputation and quality control,~2.2 million SNPs were available for analysis in all sample sets.
Because the final number of samples within the blood and brain groups differed, weperformed post-hoc power calculations to compare ability to detect eQTLs (Fig. 1). Basedon our previous work in brain (Gibbs et al., 2010), the strength of the association variessubstantially for different eQTLs. Therefore, we estimated power over a range of minorallele frequencies and of effect sizes for the eQTLs, using Z as a measure of effect sizestandard deviations of difference for each minor allele under an additive model. As anexample of power in the two datasets at a realistic pair of these parameters, the blood datasethad 98.8% power to detect eQTLs at an effect allele frequency of 0.2 and an additive effectsize of Z=0.5 whereas the brain dataset had 93.9% power to detect the same magnitude ofeffect. This analysis demonstrates that the difference in power in the two datasets isminimized as the fraction of true eQTL effect sizes rises. For eQTLs with moderate effect
Hernandez et al. Page 4
Neurobiol Dis. Author manuscript; available in PMC 2013 July 01.
NIH
-PA Author Manuscript
NIH
-PA Author Manuscript
NIH
-PA Author Manuscript

sizes (Z>0.2) we were reasonably powered in both series; therefore, we proceeded tocompare the ability to detect eQTLs in both datasets.
Gene expression in blood versus brain in human populationsIt is expected that gene expression profiles would be divergent between blood and braintissues but similar for two brain regions. To test this, we ranked as percentiles thenormalized gene expression values averaged for all subjects, setting non-detected probes tozero. Gene expression values were shown to be highly divergent between blood and eitherfrontal cortex or cerebellum tissue for a large number of genes that were only detectedreliably in one tissue or the other (Fig. 2A,B). In contrast, gene expression was more similarbetween frontal cortex and cerebellum and there were fewer uniquely expressed genes (Fig.2C). Analysis using percentile ranked variance rather than mean values for each probeyielded similar results (Fig. 2D–F), showing that mean expression and variance inexpression were closer in the two brain regions than in blood.
eQTL discovery for genes expressed in blood and brainWe next examined the relative ability of the three datasets to detect eQTLs from regionsnominated in GWAS. We abstracted SNPs associated with human traits based on theNHGRI catalog of GWA, yielding 1366 loci. Of these, 783 SNPs passed the criteria ofhaving a replicated association with traits or diseases and being within 0.5MB of thechromosomal position of a probe for gene expression. We chose the threshold of 0.5MBbased on previous data (Gibbs et al., 2010) where we saw the average distance between aSNP and significant eQTL was 121Kb and >90% of significant eQTLs were detected within0.5MB.
We manually annotated the traits studied in each GWAS as related to blood (176 SNPs),brain (61 SNPs) or other (546 SNPs) phenotypes (Supplementary file 1). For example, weannotated traits associated with neurological or psychiatric conditions as “brain” andmarkers of subtypes of blood cell markers as “blood”. We then used this list of SNPs toperform eQTL analysis. We first performed the eQTL analysis in a uniform way by onlyconsidering the subset of probes and SNPs detected in all tissue types, or 2929 SNP:probepairs. This analysis identified eQTLs that were highly significant in all three tissues andadditional eQTLs distinctly significant in either blood or brain tissues (Fig. 3). Of the sharedeQTLs, three stood out as highly significant in all three tissues for three SNPs including asingle mRNA probe, ILMN_1695585 that maps to the RPS26 gene on chromosome12q13.2, within 500KB of three GWAS SNPs associated with Type 1 diabetes (Falsediscovery rate (FDR) corrected P<1.45×10−38 for association with rs11171739 in the frontalcortex, P<6.72 ×10−51 in cerebellum and P<9.46 ×10−67 in blood) (Barrett et al., 2009,2007; Cooper et al., 2008; Hakonarson et al., 2008; Todd et al., 2007b). Additionalsignificant SNP:probe pairs found in both datasets included SNPs associated with traits suchas mean corpuscular volume (Ganesh et al., 2009), smoking behavior (2010), eye color (Liuet al., 2010b), plasma levels of liver enzymes(Yuan et al., 2008) and inflammatory boweldisease (Kugathasan et al., 2008) (Supplementary Table 1). For fifteen SNP:probeassociations that were significant in brain and blood, the direction of effect was consistentacross all three tissues.
A divergent set of eQTLs were found in the blood dataset when compared with cerebellumand frontal cortex (Fig. 3A,B). Several of these eQTLs were for probe ILMN_1666206,which maps to the GSDML gene on Chr17q12. These correlations are linked with fiveseparate GWA studies associating Type 1 diabetes (2007; Barrett et al., 2009; Cooper et al.,2008; Hakonarson et al., 2008; Todd et al., 2007b), Crohn’s disease (Barrett et al., 2008) andUlcerative colitis (McGovern et al., 2010) to the same locus (Supplementary Table 1).
Hernandez et al. Page 5
Neurobiol Dis. Author manuscript; available in PMC 2013 July 01.
NIH
-PA Author Manuscript
NIH
-PA Author Manuscript
NIH
-PA Author Manuscript
Additionally, the ILMN_1666206 probe has been nominated as underlying an eQTL instudies of asthma and white blood cell traits associated with a pro-inflammatory state(Moffatt et al., 2007; Nalls et al., 2011a). The FDR corrected P value for the mostsignificantly associated SNP, rs2290400, with this probe was 6.41×10⁻³² in blood but 0.924and 0.896 in the cerebellum and frontal cortex respectively.
To examine this phenomenon further, we compared all SNPs within the GSDML/ORMDL3region to expression of ILMN_1666206 in all tissues. Although expression was detected, wedid not find significant associations with any SNPs in the brain, but found strongassociations between probe expression and proximal SNPs in blood tissue (Fig. 4B). Thislocus therefore represents an example of a blood-specific eQTL.
Conversely, a subset of SNP:probe pairs reached significance in the brain samples but not inblood (Fig. 3A,B and Supplementary Table 1). For example, rs713586, which wasnominated for association with body mass index (PMID: 20935630), was significantlyassociated with expression of ILMN_1676893 in cerebellum (FDR corrected P=6.09×10⁻⁵)and frontal cortex (FDR corrected P=1.53×10⁻⁸) but showed no association in blood (FDRcorrected P=0.89). This probe maps to the adenylate cyclase gene ADCY3 on chromosome2 (Fig. 4A). Interestingly, variation in ADCY3 has been nominated in a number of GWASincluding for alcohol dependence (Edenberg et al., 2010) and major depression (Wray et al.,2010).
Overall this data suggests that while some eQTLs are consistent between tissues, there is asubset where a genetic effect on gene expression exists in one tissue context but not theother, despite probe detection in both instances.
eQTL discovery for genes with expression restricted to blood or brainGiven that there were differences in gene expression between tissues (Fig. 2), we nextanalyzed eQTLs unique to each tissue by examining the association of GWAS SNPs withexpression of probes detected in either blood or brain but not in both (Supplementary Table2).
In blood, there was a highly significant (FDR corrected P=1.27×10−131) association betweenrs2549794 at a Crohn’s disease locus (Franke et al., 2010) and expression ofILMN_1743145, which maps to the LRAP/ERAP2 gene (Fig. 5A). Other associationsmeasurable only in the blood datasets include rs2304130 and ILMN_2134224, andrs6120849 and ILMN_2402805. These SNPs were nominated as associated withmeasurements of total cholesterol and protein C respectively in plasma (Tang et al., 2010;Waterworth et al., 2010).
We also found a series of significant associations in brain and not blood. Several of theseassociations were probes on chromosome 12 associated with rs11171739 or rs1701704, twoSNPs nominated for Type-I diabetes. Additional associations included a series of SNPs onchromosome 17. Previous studies have noted an effect of chromosome17 SNPs onexpression of the MAPT gene that is associated with risk of PD and PSP (2011; Hoglinger etal., 2011). We therefore examined expression of ILM_1710903, which maps within thecoding sequence of MAPT, with association of SNPs across Chr17 and saw robust signals inboth the frontal cortex and cerebellum (Fig. 5B). This effect was driven by the H1/H2haplotype across the MAPT locus as conditioning the analysis on a proxy SNP decreased theapparent eQTL signal.
Hernandez et al. Page 6
Neurobiol Dis. Author manuscript; available in PMC 2013 July 01.
NIH
-PA Author Manuscript
NIH
-PA Author Manuscript
NIH
-PA Author Manuscript
Collectively, these results show that while some eQTLs are shared across tissues, there areexamples where restricted expression levels in one tissue limit the ability to detectsignificant associations.
Overall ability to detect eQTLs depends on tissue type and gene expressionWe next compared the proportions of eQTLs found in the three sample series andconsidered whether these were associated with brain, blood or other phenotypes (Table 1).In the analysis restricted to probes detected in both blood and brain tissues, 125 eQTLs werefound within 500 KB of any GWA SNP in blood, versus 40 eQTLs found in the braindataset. Of these, 21 significant eQTLs were found in the blood dataset for blood traits,while 16 eQTLs were found in blood for brain traits. Six significant eQTLs were found inbrain, counting either cerebellum or frontal cortex, for brain traits and an additional sixeQTLs were found in brain for blood traits out of 40 total significant associations. Theproportions of blood and brain traits with detected eQTLs were similar in blood and brainsamples (two tailed Z-test, P=0.18, 1.0 respectively).
We performed independent analyses of probes that were only detected in one tissue as moreprobes were tested in brain (1877 in frontal cortex and 1853 in cerebellum) than in blood(413). There were 107 significant associations in cerebellum and 90 in frontal cortexcompared to 21 in blood but we did not find over-representation of traits annotated as brainrelated in the brain datasets (Table 2).
DiscussionWe have performed an eQTL analysis using SNPs from the NHGRI catalog of GWAS intwo tissue types, blood and brain (frontal cortex and cerebellum). The nominated SNPs areassociated with a variety of human traits, including diseases, physiological markers such asblood cell numbers and continuous traits such as height. We specifically addressed whetherit is necessary to examine brain tissue to detect eQTLs for brain phenotypes or whether thesame information could be obtained from blood. We find that while many eQTLs are sharedbetween blood and brain tissues, there are specific instances, not always simply related togene expression levels, where the detection of eQTLs is limited by the tissue studied.
A small number of eQTLs are detectable in all three datasets tested. A proportion of thesecommon eQTLs demonstrated strong effects sizes, such as SNPs associated with Type 1diabetes on chromosome 12 (Barrett et al., 2009; Burton et al., 2007; Cooper et al., 2008;Hakonarson et al., 2008; Todd et al., 2007b) or associated with smoking behavior onchromosome 19 (Furberg H, 2010). We have therefore demonstrated that coincident eQTLsexist between blood and brain tissues and therefore discrete eQTLs are found in more thanone human primary tissue as previously suggested (Bullaughey K, 2009; Ding et al., 2010;Greenawalt et al., 2011).
There were eQTLs that could be detected only in one tissue type and in some cases these aredue to differences in gene expression. This is true for genes such as MAPT, which encodesfor the tau protein that is expressed largely in post-mitotic neurons. Therefore, there will becases where, when interrogating GWAS data it will be important to examine the target tissueof interest, thus affirming the need to look at brain for studies related to neurological orpsychiatric phenotypes.
Of greater interest is that we also found a subset of eQTLs that appear to be tissue specific,despite the probes being reliably detected in all samples series. It is possible that geneticvariants can affect expression levels exclusively in a subset of tissues. For example, geneexpression may be altered in a tissue- and timing-specific manner by cis- regulatory
Hernandez et al. Page 7
Neurobiol Dis. Author manuscript; available in PMC 2013 July 01.
NIH
-PA Author Manuscript
NIH
-PA Author Manuscript
NIH
-PA Author Manuscript
elements (Cooper et al., 2008). In this case, although multiple tissues may be permissive forexpression, different −cis regulatory elements are being employed in each tissue and lead toquantitatively different expression levels. Understanding why there are examples wheredifferences in expression do not explain eQTL detection in a simple way will be animportant question for future studies.
One caveat to these studies is that direct comparison of datasets derived from separate tissuetypes with differential ascertainment methods is difficult. Specifically, the brain sampleswere taken from deceased subjects whereas blood samples were drawn in life. However,post mortem interval has been shown not to be a major confound within brain expressiondata (Gibbs et al., 2010; Trabzuni et al., 2011) and we corrected for this and other knownmethodological variables in the statistical model. However, because the samples used herewere from different individuals, we cannot exclude that we are detecting rare alleles and/orgenetic variants on a background of common SNPs. As demonstrated by power analysis, thecurrent dataset is not powered to directly detect rare alleles but has good power to detectrelatively large eQTL effect sizes. Therefore, this analysis performs best for loci that aretagged by common variants and where the effect of the minor allele on expression isrelatively large. It is also important to note that in the present study, we limited our analysisto transcripts within a relatively narrow (0.5MB) window around each SNP. This is largerthan the average distance between SNP and associated transcript of 121Kb (Gibbs et al.,2010) but may inadvertently omit true eQTLs at larger distances while maintaining power.Larger series would be needed to expand the analyses to more distal effects.
Further dissection of such loci will likely require deep sequencing of the genome for manyindividuals and additional large-scale studies. One general limitation of hybridization basedarrays is that detection of low expression genes is difficult, which may be overcome byRNA sequencing in the future. In addition to both of these technological developments,eQTL surveys such as the one presented here will need to be repeated as the numbers ofSNPs nominated by GWAS studies increases. This is perhaps particularly true for brainrelated phenotypes. Although we did not find that there were significantly more eQTLs forbrain phenotypes using brain expression data, the number of replicated GWAS ‘hits’ forneurological and psychiatric conditions is still quite small and we might expect brain to bemore sensitive as the number of replicated loci increases. We have not tested all possibleSNPs in the current analysis to maintain power to detect significant associations, but suchanalyses could be performed on an ad hoc basis for nominated SNPs in future GWASwithout the loss of power caused by testing the whole genome.
Overall, we demonstrate a number of clear and key examples where brain tissue is requiredfor eQTL discovery. We conclude that functional studies in one tissue have the capacity toinform our understanding of regulatory variation in general, but that there are sufficientnumbers of counter-examples to suggest that for neurological and psychiatric traits weshould continue to examine gene expression in the brain.
Supplementary MaterialRefer to Web version on PubMed Central for supplementary material.
AcknowledgmentsThis research was supported in part by the Intramural Research Program of the NIH, National Institute on Aging(ZO1-AG000947 and Z01-AG000185) and in part by the UK Medical Research Council. The InCHIANTI studybaseline (1998–2000) was supported as a “targeted project” (ICS110.1/RF97.71) by the Italian Ministry of Healthand in part by the U.S. National Institute on Aging (Contracts: 263 MD 9164 and 263 MD 821336).
Hernandez et al. Page 8
Neurobiol Dis. Author manuscript; available in PMC 2013 July 01.
NIH
-PA Author Manuscript
NIH
-PA Author Manuscript
NIH
-PA Author Manuscript

ReferencesBarrett JC, et al. Genome-wide association study and meta-analysis find that over 40 loci affect risk of
type 1 diabetes. Nat Genet. 2009; 41:703–7. [PubMed: 19430480]
Barrett JC, et al. Genome-wide association defines more than 30 distinct susceptibility loci for Crohn’sdisease. Nat Genet. 2008; 40:955–62. [PubMed: 18587394]
Bullaughey KCC, Coop G, Gilad Y. Expression quantitative trait loci detected in cell lines are oftenpresent in primary tissues. Hum Mol Genet. 2009; 18:4296–4303. [PubMed: 19671653]
Burton PR, et al. Genome-wide association study of 14,000 cases of seven common diseases and 3,000shared controls. Nature. 2007; 447:661–78. [PubMed: 17554300]
Cheung VG, et al. Mapping determinants of human gene expression by regional and genome-wideassociation. Nature. 2005; 437:1365–9. [PubMed: 16251966]
Cooper JD, et al. Meta-analysis of genome-wide association study data identifies additional type 1diabetes risk loci. Nat Genet. 2008; 40:1399–401. [PubMed: 18978792]
Ding J, et al. Gene expression in skin and lymphoblastoid cells: Refined statistical method revealsextensive overlap in cis-eQTL signals. Am J Hum Genet. 2010; 87:779–89. [PubMed: 21129726]
Dixon AL, et al. A genome-wide association study of global gene expression. Nat Genet. 2007;39:1202–7. [PubMed: 17873877]
Edenberg HJ, et al. Genome-wide association study of alcohol dependence implicates a region onchromosome 11. Alcohol Clin Exp Res. 2010; 34:840–52. [PubMed: 20201924]
Emilsson V, et al. Genetics of gene expression and its effect on disease. Nature. 2008; 452:423–8.[PubMed: 18344981]
Fellay J, et al. A whole-genome association study of major determinants for host control of HIV-1.Science. 2007; 317:944–7. [PubMed: 17641165]
Franke A, et al. Genome-wide meta-analysis increases to 71 the number of confirmed Crohn’s diseasesusceptibility loci. Nat Genet. 2010; 42:1118–25. [PubMed: 21102463]
Furberg H, et al. Genome-wide meta-analyses identify multiple loci associated with smoking behavior.Nat Genet. 2010; 42:441–7. [PubMed: 20418890]
Ganesh SK, et al. Multiple loci influence erythrocyte phenotypes in the CHARGE Consortium. NatGenet. 2009; 41:1191–8. [PubMed: 19862010]
Gibbs JR, et al. Abundant quantitative trait loci exist for DNA methylation and gene expression inhuman brain. PLoS Genet. 2010; 6:e1000952. [PubMed: 20485568]
Greenawalt DM, et al. A survey of the genetics of stomach, liver, and adipose gene expression from amorbidly obese cohort. Genome Res. 2011; 21:1008–16. [PubMed: 21602305]
Hakonarson H, et al. A novel susceptibility locus for type 1 diabetes on Chr12q13 identified by agenome-wide association study. Diabetes. 2008; 57:1143–6. [PubMed: 18198356]
Heinzen EL, et al. Tissue-specific genetic control of splicing: implications for the study of complextraits. PLoS Biol. 2008; 6:e1. [PubMed: 19222302]
Hindorff LA, et al. Potential etiologic and functional implications of genome-wide association loci forhuman diseases and traits. Proc Natl Acad Sci U S A. 2009; 106:9362–7. [PubMed: 19474294]
Hoglinger GU, et al. Identification of common variants influencing risk of the tauopathy progressivesupranuclear palsy. Nat Genet. 2011; 43:699–705. [PubMed: 21685912]
Kugathasan S, et al. Loci on 20q13 and 21q22 are associated with pediatric-onset inflammatory boweldisease. Nat Genet. 2008; 40:1211–5. [PubMed: 18758464]
Liu C, et al. Whole-genome association mapping of gene expression in the human prefrontal cortex.Mol Psychiatry. 2010a; 15:779–84. [PubMed: 20351726]
Liu F, et al. Digital quantification of human eye color highlights genetic association of three new loci.PLoS Genet. 2010b; 6:e1000934. [PubMed: 20463881]
McGovern DP, et al. Genome-wide association identifies multiple ulcerative colitis susceptibility loci.Nat Genet. 2010; 42:332–7. [PubMed: 20228799]
Moffatt MF, et al. Genetic variants regulating ORMDL3 expression contribute to the risk of childhoodasthma. Nature. 2007; 448:470–3. [PubMed: 17611496]
Hernandez et al. Page 9
Neurobiol Dis. Author manuscript; available in PMC 2013 July 01.
NIH
-PA Author Manuscript
NIH
-PA Author Manuscript
NIH
-PA Author Manuscript

Morley M, et al. Genetic analysis of genome-wide variation in human gene expression. Nature. 2004;430:743–7. [PubMed: 15269782]
Myers AJ, et al. A survey of genetic human cortical gene expression. Nat Genet. 2007; 39:1494–9.[PubMed: 17982457]
Nalls MA, et al. Multiple loci are associated with white blood cell phenotypes. PLoS Genet. 2011a;7:e1002113. [PubMed: 21738480]
Nalls MA, et al. Imputation of sequence variants for identification of genetic risks for Parkinson’sdisease: a meta-analysis of genome-wide association studies. Lancet. 2011b; 377:641–9. [PubMed:21292315]
Nicolae DL, et al. Trait-associated SNPs are more likely to be eQTLs: annotation to enhance discoveryfrom GWAS. PLoS Genet. 2010; 6:e1000888. [PubMed: 20369019]
Preuss M, et al. Design of the Coronary ARtery DIsease Genome-Wide Replication And Meta-Analysis (CARDIoGRAM) Study: A Genome-wide association meta-analysis involving more than22 000 cases and 60 000 controls. Circ Cardiovasc Genet. 2010; 3:475–83. [PubMed: 20923989]
Schadt EE, et al. Mapping the genetic architecture of gene expression in human liver. PLoS Biol.2008; 6:e107. [PubMed: 18462017]
Scott LJ, et al. A genome-wide association study of type 2 diabetes in Finns detects multiplesusceptibility variants. Science. 2007; 316:1341–5. [PubMed: 17463248]
Sladek R, et al. A genome-wide association study identifies novel risk loci for type 2 diabetes. Nature.2007; 445:881–5. [PubMed: 17293876]
Steinthorsdottir V, et al. A variant in CDKAL1 influences insulin response and risk of type 2 diabetes.Nat Genet. 2007; 39:770–5. [PubMed: 17460697]
Stranger BE, et al. Population genomics of human gene expression. Nat Genet. 2007; 39:1217–24.[PubMed: 17873874]
Tang W, et al. Genome-wide association study identifies novel loci for plasma levels of protein C: theARIC study. Blood. 2010; 116:5032–6. [PubMed: 20802025]
Tobin JE, et al. Haplotypes and gene expression implicate the MAPT region for Parkinson disease: theGenePD Study. Neurology. 2008; 71:28–34. [PubMed: 18509094]
Todd JA, et al. Robust associations of four new chromosome regions from genome-wide analyses oftype 1 diabetes. Nat Genet. 2007a; 39:857–64. [PubMed: 17554260]
Todd JA, et al. Robust associations of four new chromosome regions from genome-wide analyses oftype 1 diabetes. Nat Genet. 2007b; 39:857–64. [PubMed: 17554260]
Trabzuni D, et al. Quality control parameters on a large dataset of regionally dissected human controlbrains for whole genome expression studies. J Neurochem. 2011
Vandrovcova J, et al. Disentangling the role of the tau gene locus in sporadic tauopathies. CurrAlzheimer Res. 2010; 7:726–34. [PubMed: 20704554]
Waterworth DM, et al. Genetic variants influencing circulating lipid levels and risk of coronary arterydisease. Arterioscler Thromb Vasc Biol. 2010; 30:2264–76. [PubMed: 20864672]
Webster JA, et al. Genetic control of human brain transcript expression in Alzheimer disease. Am JHum Genet. 2009; 84:445–58. [PubMed: 19361613]
Wheeler HE, et al. Sequential use of transcriptional profiling, expression quantitative trait mapping,and gene association implicates MMP20 in human kidney aging. PLoS Genet. 2009; 5:e1000685.[PubMed: 19834535]
Wood AR, et al. Allelic heterogeneity and more detailed analyses of known loci explain additionalphenotypic variation and reveal complex patterns of association. Hum Mol Genet. 2011
Wray NR, et al. Genome-wide association study of major depressive disorder: new results, meta-analysis, and lessons learned. Mol Psychiatry. 2010
Yang Q, et al. Multiple genetic loci influence serum urate levels and their relationship with gout andcardiovascular disease risk factors. Circ Cardiovasc Genet. 2010; 3:523–30. [PubMed: 20884846]
Yuan X, et al. Population-based genome-wide association studies reveal six loci influencing plasmalevels of liver enzymes. Am J Hum Genet. 2008; 83:520–8. [PubMed: 18940312]
Hernandez et al. Page 10
Neurobiol Dis. Author manuscript; available in PMC 2013 July 01.
NIH
-PA Author Manuscript
NIH
-PA Author Manuscript
NIH
-PA Author Manuscript
Zeggini E, et al. Meta-analysis of genome-wide association data and large-scale replication identifiesadditional susceptibility loci for type 2 diabetes. Nat Genet. 2008; 40:638–45. [PubMed:18372903]
Hernandez et al. Page 11
Neurobiol Dis. Author manuscript; available in PMC 2013 July 01.
NIH
-PA Author Manuscript
NIH
-PA Author Manuscript
NIH
-PA Author Manuscript
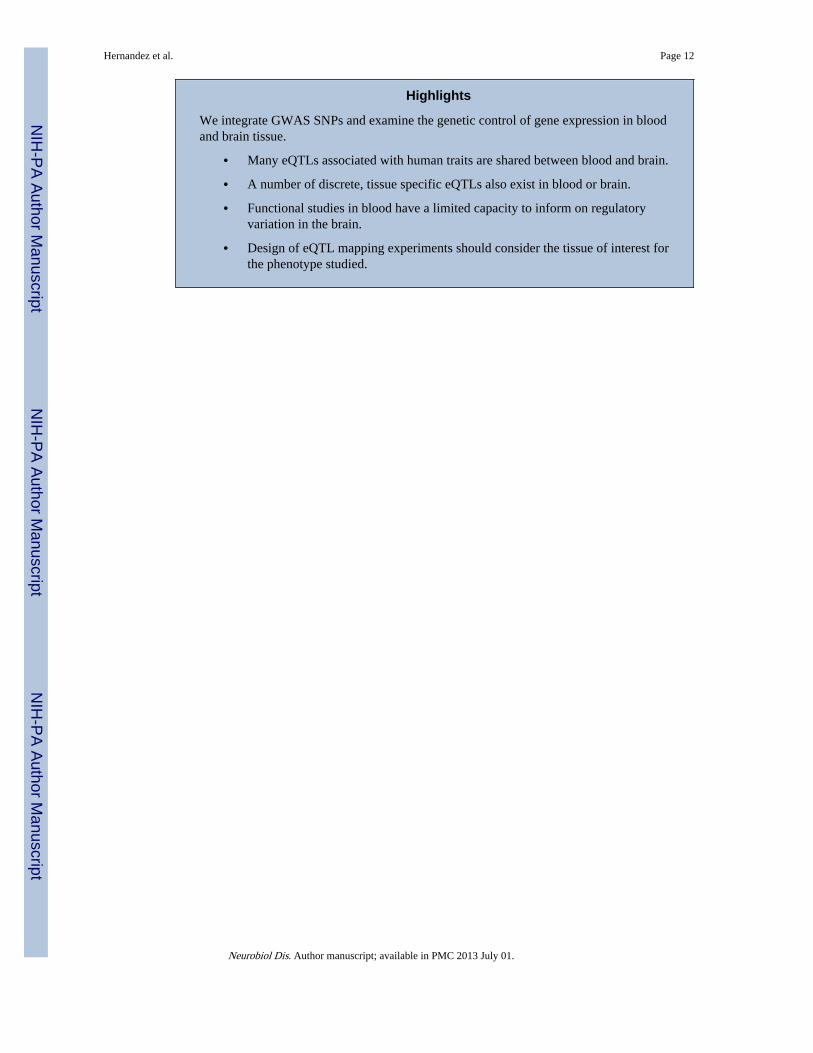
Highlights
We integrate GWAS SNPs and examine the genetic control of gene expression in bloodand brain tissue.
• Many eQTLs associated with human traits are shared between blood and brain.
• A number of discrete, tissue specific eQTLs also exist in blood or brain.
• Functional studies in blood have a limited capacity to inform on regulatoryvariation in the brain.
• Design of eQTL mapping experiments should consider the tissue of interest forthe phenotype studied.
Hernandez et al. Page 12
Neurobiol Dis. Author manuscript; available in PMC 2013 July 01.
NIH
-PA Author Manuscript
NIH
-PA Author Manuscript
NIH
-PA Author Manuscript
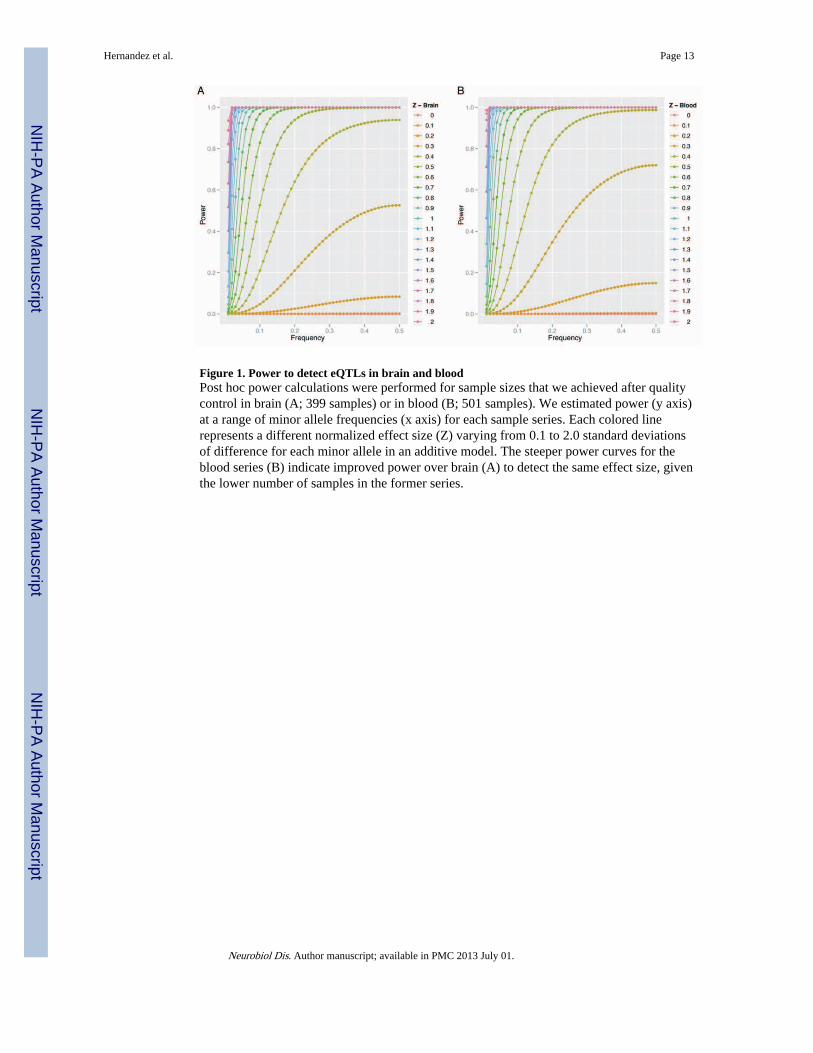
Figure 1. Power to detect eQTLs in brain and bloodPost hoc power calculations were performed for sample sizes that we achieved after qualitycontrol in brain (A; 399 samples) or in blood (B; 501 samples). We estimated power (y axis)at a range of minor allele frequencies (x axis) for each sample series. Each colored linerepresents a different normalized effect size (Z) varying from 0.1 to 2.0 standard deviationsof difference for each minor allele in an additive model. The steeper power curves for theblood series (B) indicate improved power over brain (A) to detect the same effect size, giventhe lower number of samples in the former series.
Hernandez et al. Page 13
Neurobiol Dis. Author manuscript; available in PMC 2013 July 01.
NIH
-PA Author Manuscript
NIH
-PA Author Manuscript
NIH
-PA Author Manuscript

Figure 2. Comparative gene expression in blood and in brain(A–C) Normalized gene expression values for each probe on the microarrays were convertedto mean values across the population and ranked such that 1.0 is the highest expressed gene.Where genes were detected in <95% of samples in the population, we set the percentile to 0.We plotted these to compare expression in blood versus frontal cortex (A) or cerebellum(B), or to compare frontal cortex and cerebellum (C). Each probe is color coded by thedifference in rank between the pairs of tissue. (D–F) Similar plot but for percentile rank ofthe variance in expression across the population of samples for blood versus frontal cortex(D) or cerebellum (E), or frontal cortex and cerebellum (F).
Hernandez et al. Page 14
Neurobiol Dis. Author manuscript; available in PMC 2013 July 01.
NIH
-PA Author Manuscript
NIH
-PA Author Manuscript
NIH
-PA Author Manuscript
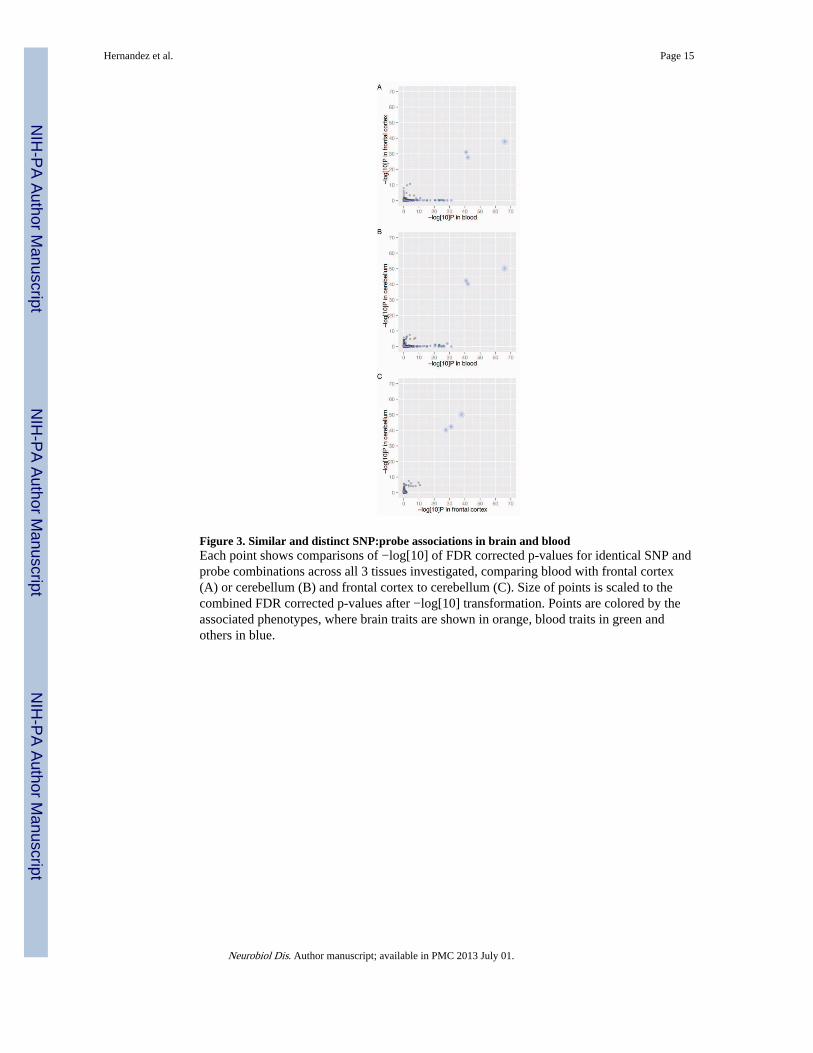
Figure 3. Similar and distinct SNP:probe associations in brain and bloodEach point shows comparisons of −log[10] of FDR corrected p-values for identical SNP andprobe combinations across all 3 tissues investigated, comparing blood with frontal cortex(A) or cerebellum (B) and frontal cortex to cerebellum (C). Size of points is scaled to thecombined FDR corrected p-values after −log[10] transformation. Points are colored by theassociated phenotypes, where brain traits are shown in orange, blood traits in green andothers in blue.
Hernandez et al. Page 15
Neurobiol Dis. Author manuscript; available in PMC 2013 July 01.
NIH
-PA Author Manuscript
NIH
-PA Author Manuscript
NIH
-PA Author Manuscript

Figure 4. Blood and brain specific eQTLS in probes that are detected in all tissues(A) Similar locus plot for ILMN_167893, which maps to ADCY3 and reveals a highlysignificant signal in the brain samples but no significant p values in blood, despite adequatedetection of the probe in all tissues. (B) Plot of SNPs along the Chr17 region that includesthe GSDML and ORMDL3 genes showing −log[10]P values for association of each SNPwith expression of Illumina probe ILMN_1666206, which maps to the GSDML gene.Despite having significant detection in all three tissues, there was a strong signal for blood(red) but not in either of cerebellum (blue) or frontal cortex (green).
Hernandez et al. Page 16
Neurobiol Dis. Author manuscript; available in PMC 2013 July 01.
NIH
-PA Author Manuscript
NIH
-PA Author Manuscript
NIH
-PA Author Manuscript

Figure 5. eQTLs in probes detected only in brain or blood(A) SNPs along the region of Chr5 that contains the LRAP gene showing −log[10]P valuesfor association of each SNP with expression of Illumina probe ILMN_1743143. (B) Plot ofSNPs along the Chr17 region that includes the MAPT gene for ILMN_ 1710903 in frontalcortex (upper panel) or cerebellum (lower panel). For each tissue, we repeated the originaleQTL analysis (green) but made the analysis conditional on a proxy SNP for the H1/H2inversion haplotype (orange). The decrease in P values after conditioning on a proxy SNPsuggests that most of the signal arises from the H1/H2 haplotype.
Hernandez et al. Page 17
Neurobiol Dis. Author manuscript; available in PMC 2013 July 01.
NIH
-PA Author Manuscript
NIH
-PA Author Manuscript
NIH
-PA Author Manuscript

NIH
-PA Author Manuscript
NIH
-PA Author Manuscript
NIH
-PA Author Manuscript
Hernandez et al. Page 18
Table 1
Counts of SNPs and SNP:probe pairs tested and significant associations per tissue and trait for probes thatwere detected in all tissues
Counts of all SNPs and probes used and their annotations as blood vs brain
All GWAS Blood Brain Other
SNPs 783 176 (22.5%) 61 (7.8%) 546 (69.7%)
SNP:probe pairs 2929 683 (23.3%) 227 (7.6%) 2019 (68.9%)
Count (% of all) of significant associations within 500kb of SNP
Blood 125 21 (16.8%) 16 (12.8%) 88 (70.4%)
Cerebellum 33 5 (15.15%) 5 (15.15%) 23 (69.7%)
Frontal Cortex 21 3 (14.3%) 2 (9.5%) 16 (76.2%)
Neurobiol Dis. Author manuscript; available in PMC 2013 July 01.

NIH
-PA Author Manuscript
NIH
-PA Author Manuscript
NIH
-PA Author Manuscript
Hernandez et al. Page 19
Tabl
e 2
Cou
nts
of S
NPs
and
SN
P:pr
obe
pair
s te
sted
and
sig
nifi
cant
ass
ocia
tions
per
tiss
ue a
nd tr
ait f
or p
robe
s th
at w
ere
dete
cted
in e
ither
blo
od o
r in
bra
in.
Tis
sue
SNP
sP
robe
sA
ssoc
iati
ons
test
ed
Cou
nt (
% o
f al
l) o
f si
gnif
ican
t as
soci
atio
ns w
ithi
n 50
0kb
of S
NP
All
GW
AS
Blo
odB
rain
Oth
er
Blo
od64
841
365
821
5 (2
3.8%
)2
(9.5
%)
14 (
66.7
%)
Cer
ebel
lum
943
1853
3924
107
21 (
19.6
%)
13 (
12.1
%)
73 (
68.2
%)
Fron
tal C
orte
x97
818
7739
6890
21 (
23.3
%)
7 (7
.8%
)62
(68
.9%
)
Neurobiol Dis. Author manuscript; available in PMC 2013 July 01.