edge effects and their influence on habitat suitability calculations: a continuous approach applied...
TRANSCRIPT
Edge effects and their influence on habitat suitability
calculations: a continuous approach applied to birds
of the Atlantic forest
Gustavo Zurita1*, Guy Pe’er2,3,4, M. Isabel Bellocq5 and Miriam M. Hansbauer6
1Instituto de Biologıa Subtropical, Facultad de Ciencias Forestales, Universidad Nacional de Misiones – CONICET,
Andresito 21, Puerto Iguazu, Misiones 3370, Argentina; 2Department of Ecological Modelling, UFZ – Helmholtz Centre
for Environmental Research, Permoserstr. 15, 04318 Leipzig, Germany; 3Department of Conservation Biology, UFZ –
Helmholtz Centre for Environmental Research, Permoserstr. 15, 04318 Leipzig, Germany; 4Department of Environment,
Biodiversity Conservation Lab, University of the Aegean, GR-81100 Mytilini, Greece; 5Departamento de Ecologıa,
Genetica y Evolucion, Facultad de Ciencias Exactas y Naturales, Universidad de Buenos Aires – CONICET, Ciudad
Universitaria, Pab 2, Piso 4, Buenos Aires 1428, Argentina; and 6Department of Wildlife Ecology and Management,
University of Freiburg, Tennenbacher Str. 4, D-79106 Freiburg, Germany
Summary
1. The suitability of human-modified habitats for native species and the response of species to habi-
tat edges are two important ecological processes that affect species and communities in fragmented
landscapes. However, field studies generally analyse these two processes separately. We extended a
recently proposed continuous approach to link these two processes, using empirical data from birds
of the Atlantic forest in Argentina, Paraguay and Brazil.
2. We tested different models for describing the responses of birds (both forest and open-habitat
species) to the interior–exterior gradient within different edge types (ecotones). We used two types
of data: the first originated from a large data set collected at regional scale using the point-count
method and the second originated from a detailed local telemetry study of three bird species.
3. For both data sets, these models successfully described the responses to edges of the majority of
species and assemblages and significantly influenced the calculated habitat suitability in both native
and anthropogenic habitats. Edge effects were seen in the majority of species; however, the magni-
tude of these effects was influenced by the ecotone type. At the assemblage level, more species
avoided edges in the ecotone with tree plantations compared with open habitats.
4. The effect of edges on the calculated habitat suitability was either positive or negative, depending
on the function that best described the response of the species to edges and whether they avoided
edges or penetrated into the less-preferred habitat. In general, forest species penetrated deeper into
tree plantations butmoved only short distances into open habitats.
5. Synthesis and applications. Our results demonstrate the impact of edge effects on bird species and
communities in fragmented landscapes. Furthermore, the differential penetration capacity of the
native forest birds into anthropogenic habitats shows the importance of using a continuous
approach to calculate habitat suitability; classic calculation (without considering the distance to the
preferred habitat) is likely to bias the calculated suitability and permeability of the hostile matrix
and affect our estimations of connectivity.
Key-words: Atlantic forest, birds, distance gradients, ecotone, edge effect, habitat suitability
Introduction
Changes in species abundance and community structure in the
ecotone between two contrasting habitats are often termed
‘edge effects’ (Murcia 1995; Ewers & Didham 2006). Edge
effects result from alterations in environmental conditions,
vegetation structure and composition (Ries & Sisk 2004;
Santos et al. 2008) and altered biotic interactions such as pre-
dation and parasitism (Batary & Baldi 2004; deMelo, Dirzo &
Tabarelli 2006). Recent studies have highlighted the impact of*Correspondence author. E-mail: [email protected]
Journal of Applied Ecology 2012, 49, 503–512 doi: 10.1111/j.1365-2664.2011.02104.x
� 2012 The Authors. Journal of Applied Ecology � 2012 British Ecological Society

edge effects on population dynamics and species persistence in
fragmented landscapes, demonstrating that edge effects reduce
habitat quality within the remaining patches and the functional
connectivity between them (Murcia 1995; Laurence 2000;Han-
sbauer et al. 2008; Banks-Leite, Ewers &Metzger 2010; Gillies
& St. Clair 2010).
The capacity of native species to use anthropogenic habi-
tats or to move through them is one of the main determi-
nants of landscape functional connectivity (Tischendorf &
Fahrig 2000; Antongiovanni & Metzger 2005; Hansbauer
et al. 2010; Watling et al. 2010; Zurita & Bellocq 2010).
Some species may be completely restricted to native habitat
cores (often called habitat specialists) and perceive anthro-
pogenic habitats as impermeable for dispersal, whereas
other species may use a variety of habitats, including
anthropogenic habitats, and correspondingly perceive them
as highly permeable for dispersal (habitat generalist species)
(Gillies & St. Clair 2010). Habitat suitability studies often
assume that the changes in suitability between different
anthropogenic habitats are discrete (e.g. Zurita et al. 2006;
Watling et al. 2010; Zurita & Bellocq in press). However,
the suitability of anthropogenic habitats could be influenced
by the distance to native habitats (Antongiovanni &
Metzger 2005), that is, in landscape mosaics, native species
may be observed in human matrices merely as a result of
the proximity to the native habitat. In such cases, treating
suitability separately from distance would bias both the
calculated suitability of the matrix and our estimates of
functional connectivity.
Edge effects and the suitability of anthropogenic habitats
for forest animals have usually been examined in separate stud-
ies in different contexts. Ewers & Didham (2006) have shown
that most edge-related studies either do not consider distance
as a continuous factor or concentrate on one side of the inte-
rior–exterior gradient only (usually from the native habitat
edge into its interior). However, the responses of species to
ecotones and correspondingly to edge effects occur on both
sides of an edge. This study uses an adaptation of the approach
proposed by Ewers &Didham (2006) for delineating the extent
and magnitude of edge effects for species and assemblages.
We extend its application by testing its power and compre-
hensiveness at simultaneously analysing both edge effect and
habitat suitability.
We focus our analyses on data from the Atlantic forest of
Brazil, Argentina and Paraguay, which is one of the most
diverse and one of themost threatened ecosystems in the world
(12Æ7% of the original distribution) (Ribeiro et al. 2009).More
than 80% of the remaining patches are smaller than 50 ha and
are separated by more than 1 km (Ribeiro et al. 2009); thus,
edge effects are probably among the most important factors
affecting native species and communities in the Atlantic forest
(Banks-Leite, Ewers & Metzger 2010). An analysis that com-
bines edge effects with the calculation of habitat suitability for
different land types can improve our ability to understand the
distribution of forest species in fragmented landscapes. The
same approach can be extended into analyses of species
assemblages.
Materials and methods
GENERAL DESIGN
We used two data sets on birds from three different locations in the
Atlantic forest. The first data set was derived from point-count sur-
veys in the Atlantic forest of Argentina and Paraguay. This data set
was used to examine the response of forest and open-habitat species
to the ecotone between forest and two anthropogenic habitats (tree
plantations and open habitats). We extended the results to the assem-
bly level. The second data set, from telemetry surveys of three forest
species in Brazil, was used to examine individual responses to a larger
number of ecotones. These data indicated activity–density, which is
mechanistically an important determinant of density or abundance.
Our study combines different mechanisms (behavioural mechanisms
vs. relative abundance patterns), ecological levels (individuals, species
relative abundances and assemblages) and spatial scales (local vs.
regional).
POINT-COUNT SURVEYS
Species abundance data were collected using the point-count tech-
nique with a 50 m fixed radius (Bibby, Jones & Marsden 1998). Bird
surveys were conducted between 06Æ00 and 10Æ00 during the breedingseason (September–January) in 2004, 2005 and 2006. The same obser-
ver performed all bird counts, recording all birds heard and seen dur-
ing a 5-min period within a 50 m radius. Only individuals inside the
sampled habitat were recorded. The geographical location of each
point count was recorded using a global positioning system.
The point counts were separated by a minimum distance of 500 m
and distributed over three extensive regions: NWandNEofMisiones
province in Argentina (20 000 and 10 000 km2, respectively, Fig. 1a)
and in SW Paraguay (5000 km2, Fig. 1b), encompassing a large pro-
portion of the remaining Atlantic forest in Argentina and Paraguay.
Commercial tree plantations dominate NW Misiones; annual and
perennial crops and cattle pastures are abundant in NE Misiones;
and in Paraguay annual crops and cattle pastures account for 91% of
the economically productive areas (Zurita & Bellocq 2010). Native
forest covers 45% of both regions of Argentina and 17% in Paraguay
(for more details, see Zurita & Bellocq 2010). Point counts were ran-
domly distributed within a given land use, but the sampling effort was
similar between land uses; 55% of the bird point counts were located
within an open-habitat ecotone and 45% within the tree plantation
ecotone.
TELEMETRY SURVEYS
At the individual level and the local scale, we used telemetry data on
the Atlantic Plateau of Ibiuna in south-eastern Brazil (23�35–50¢S;46�45¢–47�15¢W, Fig. 1c). The study area was a rural landscape cov-
ering 10 000 ha, comprising 37% forest cover (31% older and 6%
young secondary forest), 60% open areas (mainly agricultural fields),
17% tree plantations (mainly eucalyptus and pine) and 11% human
settlements. Fragment sizes in the study area ranged from <1 to
280 ha (for more details, see Metzger et al. 2006 and Uezu, Metzger
&Vielliard 2005).
Mist-nets 100–120 m in length were located within five target
patches, ranging from 4 to 53 ha in area. In the largest patch, the dis-
tance to the nearest edge was c. 300 m. From February 2003 to Janu-
ary 2005, three forest species were captured and radio-tagged at five
different sites within the fragmented landscape: Chiroxiphia caudata
(Shaw & Nodder) (15 cm, 25 gr); Pyriglena leucoptera (Vieillot)
504 G. Zurita et al.
� 2012 The Authors. Journal of Applied Ecology � 2012 British Ecological Society, Journal of Applied Ecology, 49, 503–512
(18 cm, 30 gr); and Sclerurus scansor (Menetries) (18Æ5 cm, 39 gr).
Transmitters (0Æ43–0Æ64 gr; BiotrackLtd,Wareham., UK) were back-
or tail-mounted (Kenward 2001). For each individual, we recorded at
least one location per day by triangulation from three or more fixed
points. For the analyses, we considered home ranges based on ‡25locations and monitored for 10–47 days (depending on the battery
life of the transmitter; Hansbauer et al. 2008) to assess their maximal
observable home range extensions. Thus, we included data for 24
C. caudata, sevenP. leucoptera and eight S. scansor.
AL IGNING THE DATA ALONG THE DISTANCE GRADIENT
All geo-referenced sampling points (point counts and telemetry
records) were included in a geographic information system with
detailed information on landscape composition and configuration
(Hansbauer et al. 2008, 2010; Zurita & Bellocq 2010). Euclidian dis-
tance was estimated from each sampling point (both inside and out-
side the native forest) to the nearest edge between forest and
anthropogenic habitat. In the point-count survey, edges were clus-
tered into two categories: (i) between native forest and tree planta-
tions (mainly Pinus spp.) and (ii) between native forest and open
areas (clear-cuts, annual crops and cattle pastures). In the telemetry
surveys, we considered five edge types between secondary old forest
and either (i) secondary young forest, (ii) tree plantations (Eucalyptus
spp.), (iii) shrubs, (iv) annual crops or (v) rural settlements (for more
details, see Uezu et al. 2005; Hansbauer et al. 2008).
To align the data across a distance gradient, the sampling points
were grouped into categories according to the distance to the nearest
edge. Point-count records were grouped into 14 distance categories
(both inside and outside forest): 0–50, 50–100, 100–200, 200–400,
400–700, 700–1000 and>1000 m.We then calculated the proportion
of points in which each species was recorded within each distance cat-
egory. Although abundance data were available (number of records
per sampling point count), we simplified them into presence ⁄ absenceof species at each sampling point (hereafter, ‘relative abundance’) to
avoid biases because of the potential counting of similar individuals
more than once. Such an approach, which can be considered to be a
‘reporting rate’, could have its own biases of over-estimating the
abundance of widely distributed species. This bias could eventually
affect the comparison among species (which was not the objective of
this study) but not the analysis of the edge response along the distance
gradient for individual species.
Activity–density based on the telemetry data represented the num-
ber of observation points within a given distance-belt. Here, a larger
number of points represented either the increased activity of a given
bird in a preferred locality or an area where more individuals were
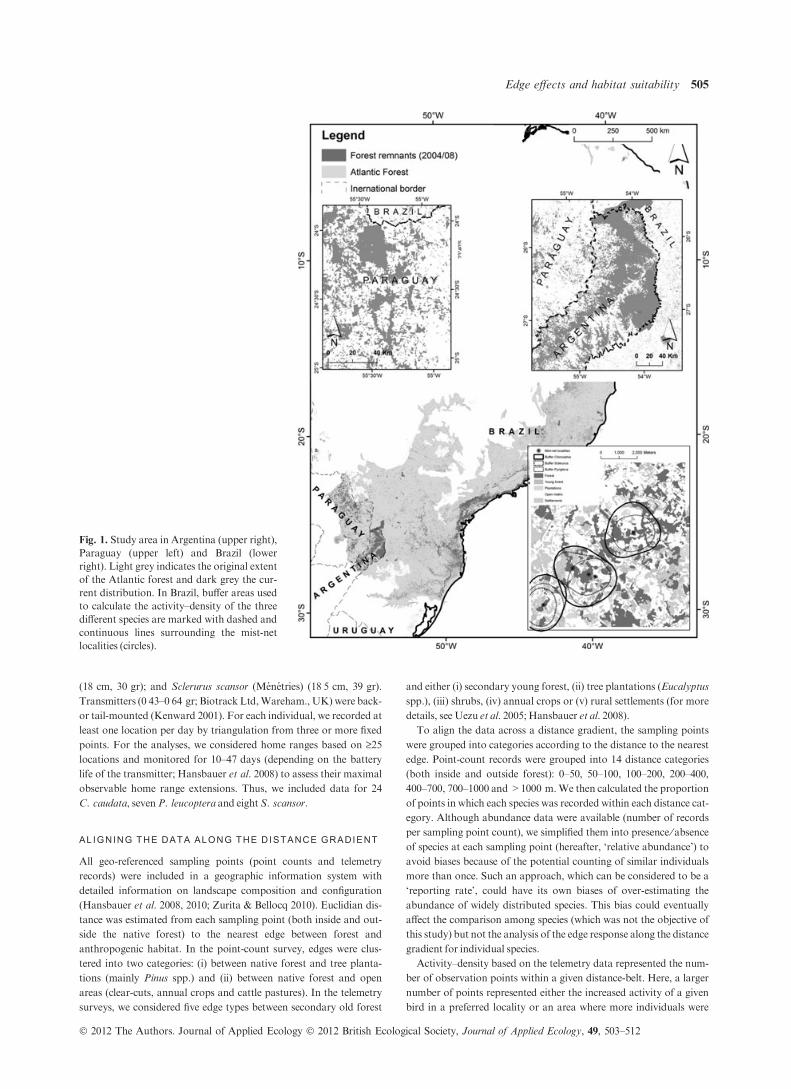
Fig. 1. Study area in Argentina (upper right),
Paraguay (upper left) and Brazil (lower
right). Light grey indicates the original extent
of the Atlantic forest and dark grey the cur-
rent distribution. In Brazil, buffer areas used
to calculate the activity–density of the three
different species are marked with dashed and
continuous lines surrounding the mist-net
localities (circles).
Edge effects and habitat suitability 505
� 2012 The Authors. Journal of Applied Ecology � 2012 British Ecological Society, Journal of Applied Ecology, 49, 503–512

observed. This approach is typically applied when the number of indi-
viduals is small or if the identity of individuals is unknown (e.g. foot-
print-based studies). The available habitat area was centred on the
mist-net locations and defined as two times the observed mean home
range diameter of the tracked birds. This criterion was adopted
because the relevant area depended on the mist-net locations and the
species in question (Hansbauer et al. 2008). Thus, we ensured that the
density of observation points in each land-use type was analysed
within an area that could be considered to be relevant from the
perspective of the individuals. This area was divided into 20-m dis-
tance clusters from 0 to 100 m (i.e. 0–20, 20–40, etc.), then 100–150,
150–200 and 200–500 m.
In both point-count and telemetry data, we assigned negative signs
to distance values inside native forests and positive signs to distances
within anthropogenic habitats. We standardized activity–density
from the telemetry data using the maximum value for each species
within each type of ecotone so that themaximum value was always 1.
DATA ANALYSIS
Following Ewers & Didham (2006), we used five different models to
explore the response of species and assemblages to edges. Addition-
ally, we calculated the suitability of the preferred and the non-
preferred habitats using asymptotes resulting from those models. We
performed regression analyses for these five models, in which the
relative abundance or the activity–density of each species was the
dependent variable, and the distance to the nearest edge type was
the independent variable. In cases where more than one function sig-
nificantly fitted the data, we used the Akaike’s information criteria
with a correction for small sample size (AICc; Burnham & Anderson
2002) to select among the different models. The models used were the
following:
1. Abundance ⁄ activity = Mean
Mean: This model describes species that utilize natural and
anthropogenic habitats equally and therefore exhibit no
response to edges (generalist species).
2. Abundance ⁄ activity = b0 + Distance · b1Linear model: This model would best describe circumstances
where the response of species to edges extends beyond the
sampled range on both sides of the ecotone.
3. Abundance ⁄ activity = b0 · eb1 · Distance + Ymin
Power model: The power function may be useful for describ-
ing the incomplete coverage of the edge response of species in
which an asymptote is reached on one side of the ecotone
(Ymin).
4. Abundance ⁄ activity = Ymin + ((Ymax)Ymin) ⁄(1 +e(b0)Distance) · b1))
Sigmoid model: This model describes circumstances in which
species respond to edges either gradually or abruptly, and
there is thus a discrete change in habitat suitability. Here, the
complete range of edge responses of a species is covered by
data (i.e. asymptotes are reached on both sides of the eco-
tone). Ymax and Ymin represent the recalculated suitability of
the species in both habitat types beyond the edge effect.
5. Abundance ⁄ activity = Ymin + ((b0)Ymin) ⁄(1 +e(b1)Distance + b2 · Distance2) · b3))
Unimodal model: This model describes circumstances in
which species prefer edges. In the case in which one habitat is
preferred over another, the function will underestimate suit-
ability on one side and overestimate it on the other because
the function assigns equal values to the asymptotes on both
sides of the ecotone (Ymin). To overcome this limitation, we
conducted two separate power regression analyses to find the
correct parameters of the asymptotes.
We used the first and second derivatives of the sigmoid and unimo-
dal functions to calculate the extent and magnitude of the edge effect
(see Fig. S1, Supporting information). We calculated the magnitude
of the edge effect as the difference in the relative suitability (per cent)
between the lower and upper asymptotes (100 Æ (Ymax)Ymin ⁄Ymax)).
In the case of the sigmoid function, Ymax and Ymin were obtained
directly from the function; in the case of a unimodal function, Ymax
was calculated from the inflection point of the first derivative.We cal-
culated the extent of the edge effect as the distance between both
inflection points in the sigmoid and unimodal functions: in the case of
the sigmoid function, this was the distance between the maximum
and the minimum of the second derivative (i.e. the two inflection
points of the function); in the case of the unimodal function, it was
the distance between the twomaxima of the second derivative.
We defined penetration as the potential of species to enter into the
non-preferred habitat, calculated as the distance from the edge to the
inflection point of the sigmoid or unimodal models (see Fig. S1,
Supporting information). If the lower asymptote (Ymin) was found to
be higher than 0, we conservatively set the penetration distance at
500 m (i.e. beyond the range of our analysis but assuming infinity was
not necessarily a suitable limit). We defined edge avoidance as decay
in abundance or activity prior to the edge. Quantitatively, a species
was considered to exhibit edge avoidance if it showed a sigmoid
response and if the distance between the edge (0 m) and the inflection
point of the function was >50 m. We compared the magnitude and
extent of the edge effect and the penetration distance between the
different ecotone types (open habitat vs. tree plantations) using a
t-test. In this analysis, each species inside each gradient was
considered a replicate.
At the assemblage level, we used a 2 · 3 chi-square independence
analysis to compare the proportion of species that exhibited each of
the response functions (mean, sigmoid and unimodal model) with
either tree plantations or open habitats. The same analysis was used
to compare the proportion of species exhibiting edge avoidance, edge
preference and a neutral response to edges between both edge types.
To account for proportions equal to zero, we used the G statistic
instead of the standard chi-square. In a second step, we examined the
influence of edge effects on species assembly based on the proportion
of forest species that remain unaffected by the edge at each distance
point along the interior–exterior gradient for both types of ecotone.
The area in which a species was defined to be influenced by edges was
calculated from the inflection points of the sigmoid and unimodal
models. Species that exhibited no response to edge (mean model) or
where the best model was the power or linear one (indicating the
incomplete coverage of the edge response by the field data) were
excluded from this analysis.
Finally, we compared the capacity of the continuous and the ‘clas-
sic’ approaches to estimate the suitability of anthropogenic habitat
for native forest species. In the first case, suitability in the core habitat
(beyond the area affected by edges) was calculated from the asymp-
tote of either the sigmoid function or the power function (in cases
where the unimodal function produced the best fit); in the second case
(classic approach), the abundance was directly calculated as the pro-
portion of records for each species within a given habitat type without
considering the distance to the native forest. Then, we fitted a linear
function to identify whether one of the approaches tends to under- or
506 G. Zurita et al.
� 2012 The Authors. Journal of Applied Ecology � 2012 British Ecological Society, Journal of Applied Ecology, 49, 503–512

overestimate suitability. Here, we separated the comparison accord-
ing to the type of response identified by the continuous approach (i.e.
what type of model fitted best) because the different response curves
should be associatedwith different areas in which the classic approach
may over- or underestimate suitability (see Fig. S1, Supporting infor-
mation). Finally, we used a linear regression to assess whether the
magnitude and extent of the edge effect influenced the magnitude of
divergence between the classic estimation of abundance and the one
calculated based on a continuous approach.
Results
POINT-COUNT SURVEYS
A total of 1124 bird point counts were surveyed in the study
area. From these, 655 point counts were located inside native
forest, 338 were located on tree plantations and 221 were
located in open habitats. A total of 215 species and 8356 indi-
viduals were recorded. After excluding species with <30
records per ecotone type (i.e. insufficient data for the regression
analysis), we had sufficient data from 46 species and 5112 indi-
viduals available for analysis. Exceptions to the 30-record rule
were C. caudata and P. leucoptera, which were included in the
analyses (with more than 20 records in both cases) to allow a
comparison between the results obtained from the point-count
data and those obtained from the telemetry data (see Appen-
dix S1 in Supporting Information).
The majority of species showed a significant response to the
interior–exterior gradient within the ecotone with open habi-
tats and tree plantations (see Appendix S1, Supporting infor-
mation; Figs 2 and 3). The response of a higher proportion of
species was best described by the sigmoid function within the
ecotone with tree plantations compared with the ecotone with
open habitats (2 · 3 v2, 0Æ74 vs. 0Æ53), whereas the proportionof species best described by the unimodal function showed the
opposite pattern (0Æ16 within the ecotone with open habitats
vs. 0Æ00 with tree plantations) (v2, G2 = 7Æ1, P = 0Æ02). Theproportion of species having a neutral response was similar
between ecotone types (0Æ31 vs. 0Æ26 for the open and tree plan-tations, respectively). The proportion of species avoiding edges
was marginally higher within the ecotone with tree plantations
compared with open habitats, whereas the proportion of spe-
cies preferring forest showed the opposite pattern (0Æ52 vs. 0Æ22and 0Æ00 vs. 0Æ16, respectively, 2 · 3 v2,G = 5Æ2,P = 0Æ07).Although the extent of the edge effect was similar for tree
plantations and open habitats (334 vs. 247 m, t42 = 0Æ8,P = 0Æ40), the magnitude was higher in ecotones with open
habitats compared with tree plantations (96% vs. 80%,
t31 = 2Æ6, P = 0Æ01). In contrast, the penetration distance of
forest species into tree plantations was markedly greater than
into open habitat (305 vs. 33 m, respectively, t39 = )5Æ6,P < 0Æ01). The proportion of forest species that remains unaf-
fected by edges (beyond the inflection points on the sigmoid
and unimodal functions) along the interior–exterior gradient
was best fitted by a sigmoid function, within both the ecotone
with tree plantations and with open habitats (R2 = 0Æ99,P < 0Æ001) (Fig. 4). Edge effects inside the forests were more
pronouncedwithin the ecotonewith tree plantations compared
with open habitat, but themagnitude of the effect was far lower
when penetrating into the plantations as a consequence of the
larger numbers of species occurring far deeper within the tree
plantations but not in open habitats.
When comparing the suitability of habitats between the con-
tinuous (Ymin) and the classic approach (i.e. with and without
consideration of distance), we found that the classic approach
underestimated the suitability of the preferred habitat com-
pared with the values calculated from the sigmoid function
(R2 = 0Æ86, P < 0Æ001, Slope = 1Æ1). However, the classic
approach overestimated the suitability of the non-preferred
habitat compared with the suitability calculated from both the
sigmoid and the unimodal functions, in both land-use types
(R2 = 0Æ48, P < 0Æ001, Slope = 0Æ49) (Fig. 5a). Finally, wefound that the divergence in the calculated suitability between
the continuous and the classic approaches was correlated with
the magnitude of the edge effect (log transformed; R2 = 0Æ37,P < 0Æ001) but not with the extent of effect (R2 = 0Æ04,P = 0Æ8; Fig. 5b).
TELEMETRY SURVEYS
The three target species showed a significant response to all
ecotone types, with the exception of P. leucoptera, which did
not exhibit an edge response or a perceptible difference in suit-
ability between old growth forest and young forests (Fig. 6, see
Appendix S2, Supporting information). The response of the
species to the edges was highly variable, but some general pat-
terns can be described. First, among the three species, the
response of C. caudata was the most variable between the eco-
tone types. In some ecotones, the species tended to avoid edges
(scrubs, urban areas and young forest) but in others, it showed
a preference for edges (plantations and agriculture). The mag-
nitude of the edge response for this species was consistent
between the point-count and telemetry data; the species was
only present in some anthropogenic habitats and only near
edges. However, the extent of the edge effect calculated from
the point-count data (233 m) was larger than the extent calcu-
lated from the telemetry data (ranging from 64 to 142 m; see
Appendix S2, Supporting information).
Pyriglena leucoptera was the only species showing a com-
plete edge response in all of the gradients, indicating that the
response of this species to edges occurs only at short distances.
In general, this species exhibited a preference for edges (i.e.
behaving as an edge species), except within the ecotones with
young forest, where it showed no response to the edge and
merely penetrated into the young forest. This response to
young growth forest (i.e. perceived as equally suitable to the
native habitat) was similar to the response identified from our
analysis of the point-count data for plantations (see Appendi-
ces S1 and S2, Supporting information).
In contrast with P. leucoptera, S. scansor showed an incom-
plete edge response within the majority of the ecotones. This
result indicates that the species is sensitive to edges but that the
response occurs across larger distances than sampled in this
Edge effects and habitat suitability 507
� 2012 The Authors. Journal of Applied Ecology � 2012 British Ecological Society, Journal of Applied Ecology, 49, 503–512

study.However, in the ecotones between forest and settlements
and between forest and young forest, the species was found to
behave as an edge species (see Appendix S2, Supporting infor-
mation).
Discussion
EDGE EFFECT: THE CONTINUOUS APPROACH
The continuous analysis methodology presented by Ewers &
Didham (2006) allows the identification of a different pattern
of response to edges and the quantification of the extent and
magnitude of the edge effect in a standardized and objective
form. Our study demonstrates that this approach can be
extended (i) to provide a standardized tool for calculating a
corrected estimate of habitat suitability for a species; (ii) to
improve understanding of the impacts of edges on species and
assemblages; and (iii) to analyse field data across different
methodologies for data collection, study areas and geographic
scales. A slight adjustment of the methodology was necessary
to calculate the habitat suitability when edge preference was
identified. The symmetrical nature of a unimodal function
(a) (b)
(c) (d)
(e) (f)
Fig. 2. Examples of the responses of bird species to different ecotones in the Atlantic forest of Argentina and Paraguay based on point-count
data. Relative abundances were calculated as the proportion of sampled point counts with the presence of each species. (a) generalist species
[Vireo olivaceus (Linnaeus)], (b) edge preference [Troglodytes aedon (Vieillot)], (c) edge avoidance for a forest species [Bayiphtengus ruficapillus
(Vieillot)] and (d) non-forest species [Zonotrichia capensis (Muller)], and two different edge responses and penetration capacities of the same spe-
cies [Basileuterus culicivorus (Deppe)] on the ecotone with (e) open habitat and (f) tree plantations.
508 G. Zurita et al.
� 2012 The Authors. Journal of Applied Ecology � 2012 British Ecological Society, Journal of Applied Ecology, 49, 503–512

forces the underestimation of the species abundancewith a pre-
ferred habitat and overestimation within a less-preferred habi-
tat. This limitation is particularly important for species like
P. leucoptera: although this species commonly occurs along
edges in fragmented landscapes, it also clearly occurs within
core areas of the forest and should therefore still be considered
a forest species (Hansbauer et al. 2008).
The analyses performed within this study assume that all
forest patches are equally suitable habitat. However, forest
patches may differ in quality not only because of edges but also
as a result of their overall area and history (Banks-Leite, Ewers
&Metzger 2010). Thismay be of particular importance in frag-
mented landscapes. However, Argentina and some parts of
Paraguay still maintain relatively pristine forests with high
connectivity (including many corridors); therefore, the effects
of patch area and history can be considered to be substantially
reduced (Zurita & Bellocq 2010). In addition, because many
fragments of different sizes were sampled in Argentina and
Paraguay, the variability arising from the area effect may occur
without introducing a directional bias. The Ibiuna landscape
in Brazil, in contrast, experienced both clear-cutting and forest
recovery and is far more heterogeneous (Hansbauer et al.
2010). This effect was reduced by selecting study sites in
patches of equal size and quality, but it still suggests that
greater caution should be taken when preparing, analysing and
interpreting data originating from local scale studies, and
especially data from fragmented landscapes and the influence
of the edge effect magnitude.
Fig. 4. Proportion of forest species remaining within a distance-belt
(without showing an edge effect) within the ecotone between native
forest and either tree plantations (filled circles) or open habitats (open
circles).
(a)
(b)
Fig. 5. Influence of edge effects on the calculated habitat suitability:
continuous vs. classic approach (with and without considering the
distance to the preferred habitat). Symbols in the upper figure repre-
sent the different response types to edges: (i) circles indicate habitat
suitability calculated from the sigmoid function for the preferred hab-
itat (black circles) and non-preferred habitat (grey circles); (ii) trian-
gles indicate species having a unimodal response (edge preference);
and (iii) empty squares indicate species that are insensitive to edges.
Fig. 3. Separation of a single unimodal function (upper figure) (e.g.
Leptotila verreauxi) into two power functions (lower figure) to esti-
mate different asymptotes on both sides of the ecotone.
Edge effects and habitat suitability 509
� 2012 The Authors. Journal of Applied Ecology � 2012 British Ecological Society, Journal of Applied Ecology, 49, 503–512
Having corrected for some of these effects, it is likely that
the differences in the edge effect between the point-count and
the telemetry data did not result from an inconsistency in
our methodology but reflect a real effect of the differences in
landscape structure and habitat quality. The tendency of spe-
cies to exhibit edge preference (46% in Brazil compared with
10% in Argentina and Paraguay) may result from these dif-
ferences in habitat quality and fragmentation pattern. Spe-
cies in the fragmented landscape in Brazil may be forced to
use suboptimal habitats and move closer to edges or even
into anthropogenic environments to fulfil their needs,
whereas in Argentina and Paraguay, larger fragments and
higher habitat quality may allow species to behave as forest-
interior species (Zurita & Bellocq 2010). This interpretation
is also supported by the higher magnitude of the edge effect
in Brazil compared with Argentina and Paraguay (89% vs.
65% on average).
EDGE RESPONSE
In accordance with previous studies, we found that a signifi-
cant proportion of birds (37% on average) avoid edges (Lau-
rence 2000; Banks-Leite, Ewers & Metzger 2010), with a large
range of edge-avoidance values of up to several hundreds of
metres into the forest (Laurence 2000). Overall, this represents
a high proportion of species, because we only included ‘com-
mon’ species with a sufficient number of records. Despite this
general pattern, the response of the forest species to the edges
was strongly influenced by the contrast between the natural
and anthropogenic habitats. Several species have been shown
to avoid edges in response to one edge type but not another;
moreover, species such as C. caudata behave as edge species in
some situations and as forest-interior species in others.
The result at the assemblage level may appear to contradict
the conclusions that tree plantations are more suitable for
(a)
(b)
(c)
(d)
(e)
(f)
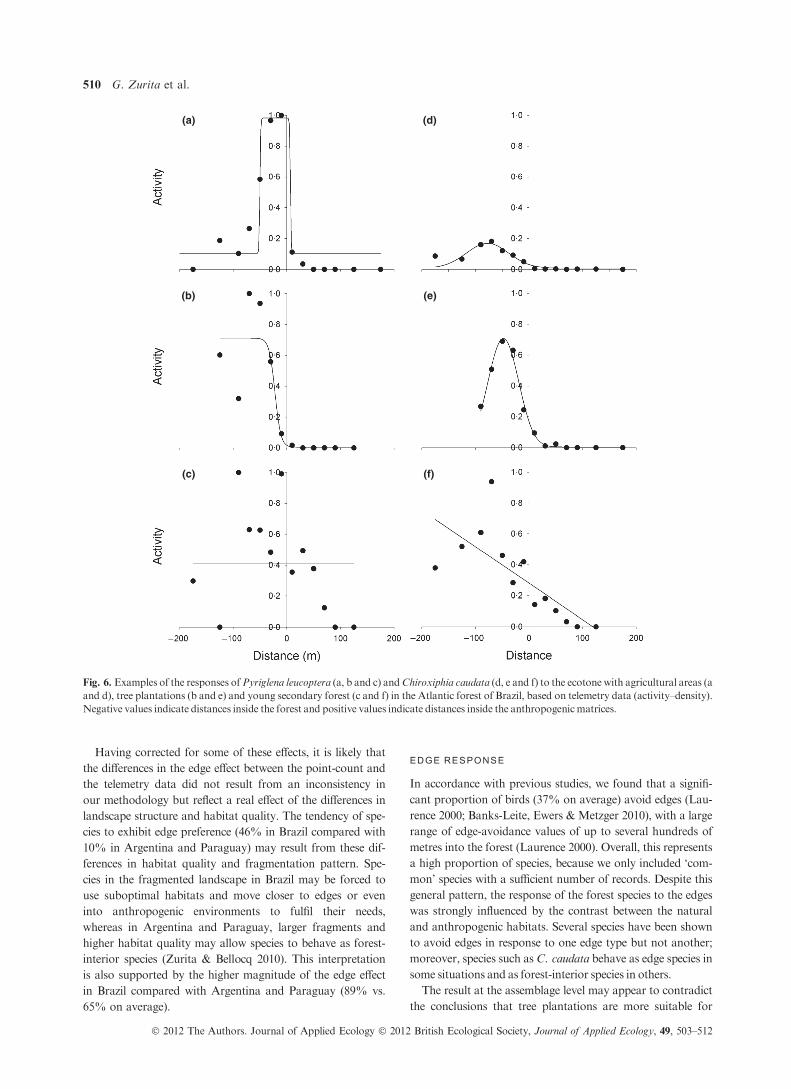
Fig. 6. Examples of the responses ofPyriglena leucoptera (a, b and c) andChiroxiphia caudata (d, e and f) to the ecotone with agricultural areas (a
and d), tree plantations (b and e) and young secondary forest (c and f) in the Atlantic forest of Brazil, based on telemetry data (activity–density).
Negative values indicate distances inside the forest and positive values indicate distances inside the anthropogenicmatrices.
510 G. Zurita et al.
� 2012 The Authors. Journal of Applied Ecology � 2012 British Ecological Society, Journal of Applied Ecology, 49, 503–512

native forest species in the Atlantic forest than open habitats
(Zurita et al. 2006; Zurita & Bellocq in press and our results
forYmin) and that the contrast in the environmental conditions
between the preferred and non-preferred habitats determine
the degree of edge effect (Prevedello & Vieira 2010). However,
this may be related to the mechanism behind the edge effect in
forest habitats. First, predation risks, which are known to
cause strong edge avoidance, may be more important in
ecotones with tree plantations because they allow access to
potential predators (Batary & Baldi 2004). Secondly, the
ecotone between the forest and open habitat is usually domi-
nated by light-demanding vegetation species (such as shrubs
and pioneer trees), which provide a diversity of flowers and
fleshy fruits, usually consumed by forest birds (Oosterhoorn &
Kappelle 2000). Finally, landscapes dominated by agriculture
and open pasture are often also more fragmented; conse-
quently, species in such landscapes are forced to utilize subop-
timal habitats and move closer to edges (Zurita & Bellocq
2010). Depending on the biology of the species, the underlying
mechanisms and the confining effects of the landscape, the
same ecotone could actually result in a strong edge response
for some species and a neutral edge response for others (Reino
et al. 2009; Prevedello &Vieira 2010; Pe’er et al. 2011a).
FUNCTIONAL CONNECTIV ITY : THE IMPORTANCE OF
USING A CONTINUOUS APPROACH
Both edge effects and ease ofmovement in anthropogenic habi-
tats will influence functional connectivity (Laurence 2000;
Antongiovanni & Metzger 2005; Hansbauer et al. 2010; Pe’er
et al. 2011b). Measures of connectivity based exclusively on
suitability are likely to underestimate forest fragmentation
effects (Tischendorf & Fahrig 2000). Individuals may carry out
exploratory visits, disperse through the matrix or even utilize
resources within anthropogenic habitats, but often such move-
ments extend only a limited distance into the ‘matrix’ and do
not indicate that the habitat is ‘suitable’ at greater distances
(Hansbauer et al. 2008; Reino et al. 2009).
Our results emphasize that the classic approach for estimat-
ing the suitability of habitats tends to bias the estimated use of
the habitats by species. However, whether the bias is positive
or negative depends on the nature of response of the species to
the edges and whether the habitat is preferred or non-pre-
ferred. More importantly, because overestimation is likely to
occur for the non-preferred habitat, this may yield an over-
optimistic perception of the conservation value of the human
matrices. Both the classic and continuous approaches have
their merits and limitations because positive and negative
biases occur under different circumstances. Therefore, an
important outcome of our study is the identification of situa-
tions where the use of a classic approach is most likely to yield
biases: namely in hyper-fragmented landscapes and among
species that exhibit a sigmoid function of edge avoidance; that
is, those situations that demandmost attention from conserva-
tionmanagers.
Patches of native habitat separated by more than 300 m of
tree plantations or 50 m of open habitat are essentially isolated
for themajority of forest birds included in this study. If we con-
sider that the average distance between fragments is more than
1000 m (Ribeiro et al. 2009), then functional connectivity
between the fragments is close to zero in the majority of the
Atlantic forest. Argentina is an exception because of the large
area of native forest still remaining (45%) (Galindo-Leal &
Camara 2003) and the low average distance between frag-
ments: only 110 m (calculated from Zurita & Bellocq 2010).
Moreover, in many cases, the matrix separating the patches is
primarily tree plantations (Zurita & Bellocq 2010). Overall, it
appears that forest fragments in the Atlantic forest of Argen-
tina are, in general, functionally well connected. This may
explain, at least in part, the maintenance of the native bird
community in this region even in fragmented landscapes of
only 40% forest cover (Zurita &Bellocq 2010).
In the longer term, better estimation of both edge effects and
habitat suitability will improve our understanding of both
functional connectivity and themechanisms that affect popula-
tions and communities in fragmented landscapes. Consider-
ation of edge effects and matrix permeability is particularly
important when using simulation models to predict connectiv-
ity in fragmented landscapes, as otherwise connectivity can be
easily over- or underestimated (Pe’er et al. 2011b). Our
approach offers a simple way of parameterizing such models,
to strengthen their capacity to inform decision-makers and
landscape planners on potential threats and solutions in terms
of landscape connectivity and permeability.
Acknowledgements
We thank C. Dislich for mathematical assistance, C. De Angelo for the study
area map and K. Frank, K. Henle and A. Carney for valuables comments on
the manuscript. National and provincial government agencies (MERNyT of
Misiones and the National Parks Administration) and many landowners
allowed GZ to sample in protected areas and on private lands. Fieldwork of
GZ was funded by the Universidad de Buenos Aires, CONICET and the
WWF’s ‘Education for Nature’ programme. GP and MMH, and further field-
work conducted by GZ, were funded by the German Federal Ministry of Edu-
cation and Research (BMBF) through the project ‘Biodiversity Conservation
in Fragmented Landscapes at the Atlantic Plateau of Sao Paulo’ (BioCAPSP;
project number 01LB 0202A1). GZ obtained a ‘VisitingResearcher’ fellowship
from the Department of Ecological Modelling, Helmholtz Centre for Environ-
mental Research –UFZ in the year 2009.
References
Antongiovanni, M. & Metzger, J.P. (2005) Influence of matrix habitats on the
occurrence of insectivorous bird species in Amazonian forest fragments.
Biological Conservation, 122, 441–451.
Banks-Leite, C., Ewers, R.M. &Metzger, J.P. (2010) Edge effects as the princi-
pal cause of area effects on birds in fragmented secondary forest.Oikos, 119,
918–926.
Batary, P. & Baldi, A. (2004) Evidence of an edge effect on avian nest success.
Conservation Biology, 18, 389–400.
Bibby, C., Jones, M. & Marsden, S.J. (1998) Expedition Field Techniques. Bird
Surveys. ExpeditionAdvisory Center, London, UK.
Burnham, K.P. & Anderson, D.R. (2002) Model Selection and Multimodel
Inference: A Practical Information-Theoretic Approach, 2nd edn. Springer-
Verlag, NewYork, USA.
Ewers, R.M. & Didham, R.K. (2006) Continuous response functions for
quantifying the strength of edge effects. Journal of Applied Ecology, 43, 527–
536.
Galindo-Leal, C. & Camara, I.G. (2003) The Atlantic Forest of South America:
Biodiversity Status, Threats and Outlook. Island Press, Washington, D.C,
USA.
Edge effects and habitat suitability 511
� 2012 The Authors. Journal of Applied Ecology � 2012 British Ecological Society, Journal of Applied Ecology, 49, 503–512
Gillies, C.S. & St. Clair, C.C. (2010) Functional responses in habitat selection
by tropical birds moving through fragmented forest. Journal of Applied Ecol-
ogy, 47, 182–190.
Hansbauer, M.M., Storch, I., Leu, S., Nieto-Holguin, J.P., Pimentel, R.G.,
Knauer, F. & Metzger, J.P. (2008) Movements of Neotropical understory
passerines affected by anthropogenic forest edges in the Brazilian Atlantic
rainforest.Biological Conservation, 141, 782–791.
Hansbauer,M.M., Storch, I., Knauer, F., Pilz, S., Kuchenhoff, H., Vegvari, Z.,
Pimentel, R.G. & Metzger, J.P. (2010) Landscape perception by forest
understory birds in the Atlantic Rainforest: black-and-white versus shades
of grey.Landscape Ecology, 25, 407–417.
Kenward, R. (2001) A Manual for Wildlife Radio Tagging. Academic Press,
London.
Laurence, W.F. (2000) Do edge effects occur over large spatial scales? Trends in
Ecology and Evolution, 15, 134–135.
de Melo, F.P.L., Dirzo, R. & Tabarelli, M. (2006) Biased seed rain in forest
edges: evidence from the Brazilian Atlantic forest. Biological Conservation,
132, 50–60.
Metzger, J.P., Alves, L.F., Pardini, R., Dixo, M., do Amaral Nogueira, A.,
Negrao, M.F.F., Martensen, A.C. & Catharino, E.L.M. (2006) Caracterısti-
cas ecologicas e implicacoes para a conservacao da Reserva Florestal do
MorroGrande.Biota Neotropica, 6, 1–13.
Murcia, C. (1995) Edge effects in fragmented forests: implications for conserva-
tion.Trends in Ecology and Evolution, 10, 58–62.
Oosterhoorn, M. & Kappelle, M. (2000) Vegetation structure and composition
along an interior-edge-exterior gradient in a Costa Ricanmontane cloud for-
est.Forest Ecology andManagement, 126, 291–307.
Pe’er, G., van Maanen, C., Turbe, A., Matsinos, Y.G. & Kark, S. (2011a) But-
terfly diversity at the ecotone between agricultural and semi-natural habitats
across a climatic gradient.Diversity and Distributions, 17, 1186–1197.
Pe’er, G., Henle, K., Dislich, C. & Frank, K. (2011b) Breaking functional con-
nectivity into components: a novel approach using an individual-based
model, and first outcomes.PLoSONE, 8, e22355.
Prevedello, J.A. & Vieira,M.V. (2010) Does the type of matrix matter? A quan-
titative review of the evidence.Biodiversity and Conservation, 19, 1205–1223.
Reino, L., Beja, P., Osborne, P.E., Morgado, R., Fabipo, A. & Rotenberry,
J.T. (2009) Distance to edges, edge contrast and landscape fragmentation:
interactions affecting farmland birds around forest plantations. Biological
Conservation, 142, 824–838.
Ribeiro, M.C., Metzger, J.P., Martensen, A.C., Ponzoni, F.J. & Hirota, M.M.
(2009) The BrazilianAtlantic forest: howmuch is left, and how is the remain-
ing forest distributed? Implications for conservation. Biological Conserva-
tion, 142, 1141–1153.
Ries, L. & Sisk, T.D. (2004) A predictive model of edge effects. Ecology, 85,
2917–2926.
Santos, B.A., Peres, C.A., Oliveira, M.A., Grillo, A., Alves-Costa, C.P. &
Tabarelli, M. (2008) Drastic erosion in functional attributes of tree
assemblages in Atlantic forest fragments of northeastern Brazil. Biological
Conservation, 141, 249–260.
Tischendorf, L. & Fahrig, L. (2000) On the usage and measurement of land-
scape connectivity.Oikos, 90, 7–19.
Uezu, A., Metzger, J.P. & Vielliard, J.M.E. (2005) Effects of structural and
functional connectivity and patch size on the abundance of seven Atlantic
Forest bird species.Biological Conservation, 123, 507–519.
Watling, J.I., Nowakowski, A.J., Donnelly, M.A. & Orrock, J.L. (2010) Meta-
analysis reveals the importance of matrix composition for animals in frag-
mented habitats.Global Ecology and Biogeography, 20, 209–217.
Zurita,G.A. &Bellocq,M.I. (2010) Spatial patterns of bird community similar-
ity: bird responses to landscape composition and configuration in the Atlan-
tic forest.Landscape Ecology, 25, 147–158.
Zurita, G.A. & Bellocq, M.M. (2011) Bird Assemblages in anthropogenic habi-
tats: identifying a suitability gradient for native species in the Atlantic Forest.
Biotropica, doi: 10.1111/j.1744-7429.2011.00821.x.
Zurita, G.A., Rey, N., Varela, D.M., Villagra, M. & Bellocq, M.I. (2006) Con-
version of the Atlantic forest into native and exotic tree plantations: effects
on bird communities from the local and regional perspectives.Forest Ecology
andManagement, 235, 164–173.
Received 3 June 2011; accepted 1 November 2011
Handling Editor:MarkWhittingham
Supporting Information
Additional Supporting Information may be found in the online ver-
sion of this article:
Fig. S1.Definition of the edge effect.
Appendix S1.Edge effect response based on point count data.
Appendix S2.Edge effect response based on telemetry data.
As a service to our authors and readers, this journal provides support-
ing information supplied by the authors. Such materials may be
re-organized for online delivery, but are not copy-edited or typeset.
Technical support issues arising from supporting information (other
thanmissing files) should be addressed to the authors.
512 G. Zurita et al.
� 2012 The Authors. Journal of Applied Ecology � 2012 British Ecological Society, Journal of Applied Ecology, 49, 503–512