edgar variable data 1d yyyy - harvard university
TRANSCRIPT

The International Satellite Land Surface Climatology Project (ISLSCP)Initiative II Data Collection
EDGAR 3: Gridded Greenhouse and Ozone Precursor Gas Emissions (1970-1995)
1
1. TITLE2. INVESTIGATOR(S)3. INTRODUCTION4. THEORY OF ALGORITHM/MEASUREMENTS5. EQUIPMENT6. PROCEDURE7. OBSERVATIONS8. DATA DESCRIPTION9. DATA MANIPULATIONS10. ERRORS11. NOTES12. REFERENCES13. DATA ACCESS14. OUTPUT PRODUCTS AND AVAILABILITY15. GLOSSARY OF ACRONYMS
1. TITLE
1.1 Data Set IdentificationEmission Database for Global Atmospheric Research (EDGAR 3): Gridded Greenhouse
Gas Emissions (1970-1995) and Tropospheric Ozone Precursor Gas Emissions (1990-1995).
1.2 Database Table Name(s)Not applicable to this data set.
1.3 File Name(s)The EDGAR database project is a comprehensive task carried out jointly by the National
Institute for Public Health (RIVM) and the Netherlands Organization for Applied ScientificResearch (TNO) and stores global emission inventories of direct and indirect greenhouse gasesfrom anthropogenic sources including halocarbons and aerosols both on a per country and regionbasis as well as on a grid (see http://www.rivm.nl/edgar/). For the International Satellite LandSurface Climatology (ISLSCP) Initiative II data collection, gridded global annual anthropogenicemissions for the greenhouse gases CO2, CH4 and N2O are provided on a 1ox1o grid for the years1970, 1980, 1990, and 1995 and for the tropospheric ozone precursor gases CO, NOx, NMVOC(Non-Methane Volatile Organic Compounds) and SO2 for the years 1990 and 1995.
The original data files submitted to the ISLSCP II staff were ASCII data tables, containingthe total anthropogenic emissions of the various gases shown above. These original data filescontain a 12-13 line header and 3 columns of data: Longitude, Latitude, and the emissions data forthat cell. All original data can also be obtained at http://www.rivm.nl/edgar/. The original fileshave been named using the following naming convention:
edgar_variable_data_1d_YYYY.csv

The International Satellite Land Surface Climatology Project (ISLSCP)Initiative II Data Collection
EDGAR 3: Gridded Greenhouse and Ozone Precursor Gas Emissions (1970-1995)
2
where:edgar identifies the data set.variable identifies the particular gas emissions contained in the file:
ch4 = CH4, methaneco = CO, carbon monoxideco2 = CO2, carbon dioxiden2o = N2O, nitrous oxidenmv = NMVOC (Non-Methane Volatile Organic Compounds)nox = NO2, nitrogen dioxideso2 = SO2, sulphur dioxide
data identifies that this is tabular data (as opposed to the “map” files below).1d identifies the spatial resolution of the data set: 1d is "1 degree".YYYY is the four-digit year: 1970, 1980, 1990, or 1995..csv is the extension, indicating the format of the tables as "comma-separated values".
The ISLSCP II staff also used the coordinates given in the original tabular data to create two-dimensional ASCII map files for each gas on a 1ox1o Earth grid. These files are named in a similarfashion as the table names given above except that they contain the word “map” as opposed tothe word “data” and the file extension is “.asc” indicating that this is an ASCII map. As anexample, the file named edgar_co2_map_1d_1980.asc contains the CO2 anthropogenic emissionsfor 1980 mapped onto a 1ox1o grid and is based on data from the original data table namededgar_co2_data_1d_1980.csv.
1.4 Revision Date of this DocumentDecember 14, 2004.
2. INVESTIGATOR(S)
2.1 Investigator(s) Name and TitleDr. Jos G.J. OlivierEDGAR Project LeaderNetherlands Environmental Assessment Agency of the National Institute for PublicHealth (RIVM-MNP)Netherlands Organization for Applied Scientific Research (TNO), andInstitute for Environmental and Sustainability of theJoint Research Centre of the EC (JRC-IES),Max Planck Institute for Chemistry (MPIC)
2.2 Title of InvestigationEDGAR Emission Database for Global Atmospheric Research
The International Satellite Land Surface Climatology Project (ISLSCP)Initiative II Data Collection
EDGAR 3: Gridded Greenhouse and Ozone Precursor Gas Emissions (1970-1995)
3
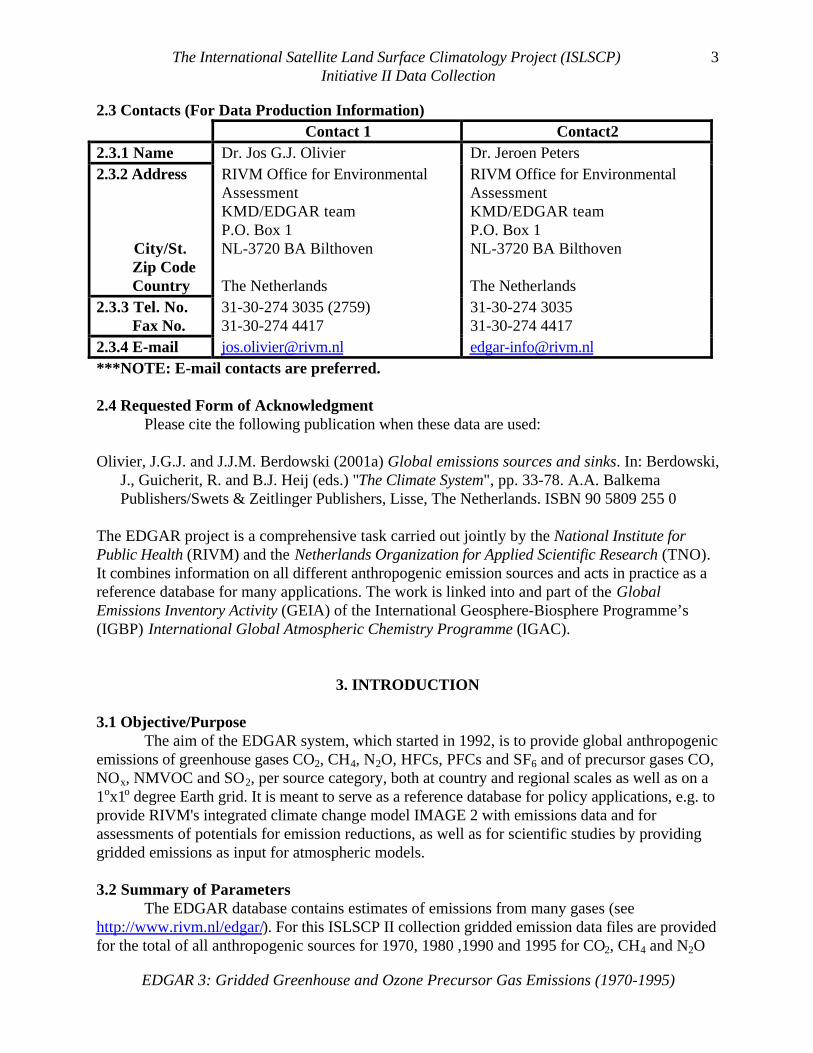
2.3 Contacts (For Data Production Information)Contact 1 Contact2
2.3.1 Name Dr. Jos G.J. Olivier Dr. Jeroen Peters2.3.2 Address
City/St. Zip Code Country
RIVM Office for EnvironmentalAssessmentKMD/EDGAR teamP.O. Box 1NL-3720 BA Bilthoven
The Netherlands
RIVM Office for EnvironmentalAssessmentKMD/EDGAR teamP.O. Box 1NL-3720 BA Bilthoven
The Netherlands2.3.3 Tel. No. Fax No.
31-30-274 3035 (2759)31-30-274 4417
31-30-274 303531-30-274 4417
2.3.4 E-mail [email protected] [email protected]***NOTE: E-mail contacts are preferred.
2.4 Requested Form of AcknowledgmentPlease cite the following publication when these data are used:
Olivier, J.G.J. and J.J.M. Berdowski (2001a) Global emissions sources and sinks. In: Berdowski,J., Guicherit, R. and B.J. Heij (eds.) "The Climate System", pp. 33-78. A.A. BalkemaPublishers/Swets & Zeitlinger Publishers, Lisse, The Netherlands. ISBN 90 5809 255 0
The EDGAR project is a comprehensive task carried out jointly by the National Institute forPublic Health (RIVM) and the Netherlands Organization for Applied Scientific Research (TNO).It combines information on all different anthropogenic emission sources and acts in practice as areference database for many applications. The work is linked into and part of the GlobalEmissions Inventory Activity (GEIA) of the International Geosphere-Biosphere Programme’s(IGBP) International Global Atmospheric Chemistry Programme (IGAC).
3. INTRODUCTION
3.1 Objective/PurposeThe aim of the EDGAR system, which started in 1992, is to provide global anthropogenic
emissions of greenhouse gases CO2, CH4, N2O, HFCs, PFCs and SF6 and of precursor gases CO,NOx, NMVOC and SO2, per source category, both at country and regional scales as well as on a1ox1o degree Earth grid. It is meant to serve as a reference database for policy applications, e.g. toprovide RIVM's integrated climate change model IMAGE 2 with emissions data and forassessments of potentials for emission reductions, as well as for scientific studies by providinggridded emissions as input for atmospheric models.
3.2 Summary of ParametersThe EDGAR database contains estimates of emissions from many gases (see
http://www.rivm.nl/edgar/). For this ISLSCP II collection gridded emission data files are providedfor the total of all anthropogenic sources for 1970, 1980 ,1990 and 1995 for CO2, CH4 and N2O
The International Satellite Land Surface Climatology Project (ISLSCP)Initiative II Data Collection
EDGAR 3: Gridded Greenhouse and Ozone Precursor Gas Emissions (1970-1995)
4
and for the precursor gases CO, NOx, NMVOC and SO2 for 1990 and 1995. The files areprovided in their original tabular format as well as two-dimensional Earth grids. EDGAR datacomprise all anthropogenic sources, including international air traffic and international shipping:
(a) Fossil-fuel production, transmission, transformation (e.g. coke production, oil refineries)and combustion (F category)
(b) Biofuel production, transformation (charcoal production) and combustion (B category)(c) Industrial production and consumption processes (including solvent use) (I category)(d) Agricultural activities (L category)(e) Biomass burning (L category)(f) Waste handling (W category).
Fossil fuel fires are included (coal fires, oil fires in Kuwait in 1992).
PARAMETER DEFINITIONSFor carbon dioxide (CO2):
• Fuel combustion refers to fossil fuel combustion and non-energy/feedstock use(Intergovernmental Panel on Climate Change (IPCC) category 1A) estimated using theIPCC Sectoral Approach;
• Fugitive refers to flaring of associated gas in oil and gas production (IPCC category 1B);• Industry refers to cement production (IPCC category 2); and• Other refers direct emissions from tropical forest fires plus 10% of biofuel combustion
emissions, which is the fraction assumed to be produced unsustainably (IPCC category5).
For methane (CH4):• Energy comprises production, handling, transmission and combustion of fossil fuels and
biofuels (IPCC category 1A and 1B);• Agriculture comprises animals, animal waste, rice production, agricultural waste burning
(non-energy, on-site) and savannah burning (IPCC category 4);• Waste comprises landfills, wastewater treatment, human wastewater disposal and waste
incineration (non-energy) (IPCC category 6);• Others include industrial process emissions and tropical and temperate forest fires (IPCC
categories 2 and 5).For nitrous oxide (NO):
• Energy comprises combustion of fossil fuels and biofuels (IPCC category 1A and 1B);• Agriculture comprises fertilizer use (synthetic and animal manure), animal waste
management, agricultural waste burning (non-energy, on-site) and savannah burning (IPCCcategory 4);
• Industrial Processes comprises non-combustion emissions from manufacturing of adipicacid and nitric acid (IPCC Source Category 2); and
• Others include N2O usage, tropical and temperate forest fires, and human sewagedischarge and waste incineration (non-energy) (IPCC Source Categories 3, 5 and 6).
3.3 DiscussionThe ISLSCP II version of EDGAR is a combination of an earlier RIVM data set EDGAR
2.0 updated to EDGAR 3.2: EDGAR 2.0 provided global annual emissions for 1990 ofgreenhouse gases CO2, CH4 and N2O and precursor gases CO, NOx, NMVOC and SO2, both per
The International Satellite Land Surface Climatology Project (ISLSCP)Initiative II Data Collection
EDGAR 3: Gridded Greenhouse and Ozone Precursor Gas Emissions (1970-1995)
5
region and on a 1ox1o grid for all anthropogenic sources. Similar inventories were compiled for anumber of CFCs, halons and methyl bromide, methyl chloroform. In the follow-up project thedatabase was extensively validated and an uncertainty analysis was carried out (Olivier et al.,2001a,b). Most of the applications of EDGAR 2.0 over the last couple of years are modelstudies, but EDGAR data are also extensively used for policy applications for which emissionsdata on country level were calculated with the EDGAR information system. Over 700 users havedownloaded EDGAR 2.0 data. EDGAR datasets have also been used in IPCC Assessments, bothon source strengths and on spatial distribution of emissions in emission scenarios (IPCC, 2000a,2001).
Because there are emissions over water, the EDGAR data provided here have not beenmade consistent with the ISLSCP II land/water mask as most other data sets in the collectionhave. Therefore, we expect that users will find areas, particularly near coastlines or on smallislands, where there will be emissions yet where the ISLSCP II mask will show water. Users maywish to use the ISLSCP II land/water mask to adapt the current data set to match up with theland/water boundaries of the other data sets in this collection.
4. THEORY OF ALGORITHM/MEASUREMENTS
Not available at this revision.
5. EQUIPMENT
Emissions data were mostly taken from international statistical data sources. Emission factorswere selected mostly from international publications to ensure a consistent approach acrosscountries. Sources for the emissions data depend on the type of data and are documented in thereferences in Section 12. No satellites or other instruments were used.
5.1 Instrument Description5.1.1 Platform (Satellite, Aircraft, Ground, Person)
Not applicable to this data set.
5.1.2 Mission ObjectivesNot applicable to this data set.
5.1.3 Key VariablesNot applicable to this data set.
5.1.4 Principles of OperationNot applicable to this data set.
5.1.5 Instrument Measurement GeometryNot applicable to this data set.
The International Satellite Land Surface Climatology Project (ISLSCP)Initiative II Data Collection
EDGAR 3: Gridded Greenhouse and Ozone Precursor Gas Emissions (1970-1995)
6
5.1.6 Manufacturer of InstrumentNot applicable to this data set.
5.2 Calibration5.2.1 Specifications
5.2.1.1 ToleranceNot applicable to this data set.
5.2.2 Frequency of CalibrationNot applicable to this data set.
5.2.3 Other Calibration InformationNone.
6. PROCEDURE
6.1 Data Acquisition Methods
Energy/Fugitive/BiofuelData for fossil fuel production and use for 112 countries are taken from the International
Energy Agency (IEA) energy statistics for OECD (Organization for Economic Co-operation andDevelopment) and non-OECD countries 1970-1995 (extended energy balances, in ktoe units)(IEA, 1997). For the countries of the former Soviet Union (SU) a modified dataset was used toachieve a complete time series for the new countries for 1970-1995 of which the sum convergesto the older dataset for the total former SU. For another 71 countries, the aggregated IEA data forthe regions ‘Other America’, ‘Other Africa’ and ‘Other Asia’ have been split using the sectoralIEA data per region and total production and consumption figures per country of hard coal,brown coal, gas and oil from UN energy statistics (UN, 1998). Note that the EDGAR 3.0 dataare based on IEA statistics published in 1997 and thus may differ somewhat from more recentIEA datasets; in particular for countries of the former Soviet Union the IEA data have beenupdated considerably. Moreover, for estimating CH4 emissions, hard coal and brown coalproduction data have been split into surface and underground mining based on various nationalreports.
Biofuel data for developing countries in 1990 have been based on Hall et al. (1994), withbiofuel type splits from EDGAR 2.0 (Olivier et al., 1996, 1999), which includes vegetal wasteused as fuel. Data for the time series 1970-1995 were based on the trend per country in urban andrural population. However, for Latin American countries biofuel statistics from OLADE(Organización Latinoamericana de Energía) were used (OLADE, 1999, pers. comm). Fuel woodand charcoal consumption (also production) in OECD’90 and EIT countries (Economies-In-Transition, i.e. Eastern Europe and former Soviet Union countries) were based on FAO (1998b),thereby replacing any IEA data for biofuel combustion in the ‘Other sector’ in these countries.For biofuel combustion in industry and power generation in OECD’90 countries, the data comefrom the IEA dataset (IEA, 1997). However these data were often not provided for all years andall countries.
The International Satellite Land Surface Climatology Project (ISLSCP)Initiative II Data Collection
EDGAR 3: Gridded Greenhouse and Ozone Precursor Gas Emissions (1970-1995)
7
Emission factors for CO2, CH4 and N2O from fossil fuel production and use are describedin Olivier et al. (1999), except for CO2 from gas flaring/venting, which were based on datacompiled by the Carbon Dioxide Information Analysis Center (CDIAC) (Marland, 1998, pers.comm.) from data collected by the U.S. Geological Survey. For N2O from gasoline cars in roadtransport, the fraction of cars equipped with a catalytic converter was taken into account (basedon data from Eurostat and others). The factors for biofuel combustion and charcoal productionare based on a review made for the Revised 1996 IPCC Guidelines (IPCC, 1997). For CO2 frombiofuels, it was tentatively assumed that 10% was produced unsustainably. For methaneemissions from coal mining the methane recovery for ten countries amounted to about 1 Tg in1990 (of which about half was allocated to the USA and Germany). Recovery in 1995 wasestimated at 2 Tg (Thakur et al., 1996; Bibler et al., 1998; and national reports to ClimateConvention).
Industrial ProcessesProduction data of cement, nitric acid, iron and steel, and various chemicals were based on
UN Industrial Commodity Statistics (UN, 1998). However, for many countries interpolationsand extrapolations were necessary to arrive at complete time series per country for 1970-1995.Special attention had to be given to new EIT countries, in particular to former USSR countries, tomatch the older totals for the former countries. Cement production data were supplemented withdata from the USGS. For adipic acid production data were taken from SRI (1998) (smoothed andaveraged); steel production was split into different technologies using data from IISI (1997),supplemented with UN data. For nitric acid (NA) production data are primary based on UNstatistics. However, since industry estimates of global total production are substantially higher,the data set has been expanded, first by adding countries not included in the UN NA statistics,for which the amount of N in the production of nitrogen fertilizers according to FAO statisticswas used as an estimate for NA production, secondly by increasing the official UN productionstatistics of nitric acid by 40% to arrive at the estimated global industry total of about 55 MtonHNO3.
Global annual total production of HCFC-22 and consumption of HFC-134a are based onAFEAS (1997). Primary aluminium production statistics per country from UN (1998) werecombined with smelters types characterized by one of five process types according toAluminium Verlag (1998). Global consumption data of PFCs for semiconductors are taken fromMocella (1993) and for SF6 per application from S&PS (1997) and Smythe (2000). These globaltotals were distribution over individual countries using related variables and statistics such asCFC consumption per country, per country semiconductor production and electricity use.
Emission factors for CO2, CH4 and N2O are described in Olivier et al. (1999). Note thatemissions of CO2 from cement production are only a proxy for cement clinker production. Theemission factors for NA production are based on IPCC (2000), assuming that in 1990 20% ofglobal total production is equipped with Non-Selective Catalytic Reduction (NSCR) technology,all in OECD'90 countries, and that for other plants the emission factor in 1990 is the average ofthe IPC default for non-NSCR plants, whereas the emission factors for 1975 and before havebeen assumed to be equal to the IPCC defaults for 'old plants'. The emission factors for the F-gases were taken from various sources (Olivier and Bakker, 2000). We note that both thevariables for distributing global total consumption and the emission factor may vary widelybetween different plants. This means the emissions at country level of the F-gases should moreor less be considered as an order of magnitude estimate.
The International Satellite Land Surface Climatology Project (ISLSCP)Initiative II Data Collection
EDGAR 3: Gridded Greenhouse and Ozone Precursor Gas Emissions (1970-1995)
8
Solvent and other product useFor N2O from the use of anesthesia in hospitals, a fixed amount of N2O per capita in
OECD’90 countries was used, tentatively set at 25 g/cap/year, based on Kroeze (1994).
AgricultureActivity data for livestock number were taken from FAO (2000), which were combined
with information on animal waste generated per head in IPCC (1997) to estimate the total amountof animal waste. Net crop production was also taken from FAO (2000), with harvested areas ofrice production split over different ecology types (rainfed, irrigated, deep water and upland)using the draft version of March 1977 the RICE-ECO database of FAO (Van Gnuu, 1997, pers.comm.). In addition, the total harvested area of rice production in China was increased by 40%,due to recognition that official harvested rice area statistics of China are largely underestimatingthe actual area (Denier van der Gon, pers. comm., 2000).
The fraction of agricultural waste associated with net crop production was based on arecent study be Smill (1999), whereas the fraction of agricultural residues burned on-site havebeen based on an analysis made by Bouwman (1997) and data reported in the Second NationalCommunications. For OECD’90 countries 5% was assumed, for EIT countries 20% and fordeveloping regions 30% - including amounts used as biofuel in developing countries, except forOECD’90 Europe, where a decreasing trend from 40% in 1970 to 5% in 1995 was assumed.
Emission factors for CH4 and N2O for enteric fermentation, animal waste (confined andoutside), N-fixing crops were taken from the Revised 1996 IPCC Guidelines (IPCC, 1997), wherea 1x1 degree grid map for non-dairy cattle from Lerner et al. (1988) and the annual averagetemperature per grid cell from New et al. (1999) was used to calculate the fraction of thecountries in the three climate zones (cold, temperate, warm). Other additional information, suchas factors for indirect emissions of N2O from agriculture, were taken from IPCC (1997) but werereplacing values updated in IPCC (2000). However, the emission factors for CH4 from riceproduction in 1990 were taken from a review by Neue (1997); for the period 1970-1990 anemission factor improvement based on data of Van der Gon (1999, 2000) was assumed. Foragricultural biomass burning the emission factors for CH4 and N2O were based on IPCC (1997).
Large-scale Biomass BurningBiomass burning data (large-scale vegetation fires) were based on FAO reports providing
ten year or five year averaged estimates per country of the change in forested areas for the 1970s,1980s and the first half of the 1990s (FAO, 1993, 1995, 1998). Following the methodologydescribed in the Revised 1996 IPCC Guidelines, these data were used as a proxy for estimatingthe amount of biomass being burned in tropical countries. Since there is no time-series data percountry on this subject readily available, a smoothing function to construct a continuous timeseries per country for the 1970-1995 period was used. Tentatively, it was assumed that 50% ofthe biomass removed is burned. Given the uncertainty in this figure, the fraction oxidized isassumed to be 1. For OECD'90 and EIT countries, forest fire statistics for 1986-1997 have beenincluded based on UN/ECE statistics of annual area burned (UN-ECE/FAO, 1996) combinedwith forest biomass densities per hectare from FAO (1995). There is a large uncertainty in theassumption for the carbon density of 0.5 and the fraction of carbon that is actually being burnedof 0.5, and thus in the amount of burned carbon. The data selected, although often criticized fortheir limited accuracy are, however, well known and relatively well-documented.
The International Satellite Land Surface Climatology Project (ISLSCP)Initiative II Data Collection
EDGAR 3: Gridded Greenhouse and Ozone Precursor Gas Emissions (1970-1995)
9
Emissions CO2 from deforestation and temperate vegetation fires are calculated accordingto IPCC (1997) and include only direct burning effects (thus no emissions due to decay ofbiomass). For large-scale biomass burning the emission factors for CH4 and N2O were also basedon IPCC (1997), except for CH4 from deforestation fires, where the GEIA value proposed byVeldt and Berdowski (1995) was used, and N2O where post-burn emissions (Bouwman et al.,1997) were used. The emission factors of CH4 and N2O used for temperate vegetation fires arethe same that are used for other large-scale biomass burning activities. For accounting purposes,net CO2 emissions from temperate vegetation fires and savannah fires have been assumed to bezero (organic carbon in a short cycle).
Waste HandlingFor solid waste generation, the 1970-1995 trend in activity data per country has been
based on a fit with international waste generation figures per capita for 1990 - as recentlypublished by IPCC and EPA and references mentioned therein - with per capita income percountry. This fit was also used to estimate the activity data for 1990, for countries notmentioned in IPCC (1997) and in an EPA report by Adler (1994). Country-specific fractions oftotal MSW generated that is disposed of in landfills were based on IPCC (1997). For mostcountries it was assumed that this fraction has remained constant over time. Many otherparameters, such as the fraction of Degradable Organic Carbon (DOC) were also based on theRevised 1996 IPCC Guidelines; in addition, many others were estimated through consultation ofexperts (Olivier et al., 2001). The methodology used for the calculation of CH4 emissions fromlandfills in EDGAR 3.0 is a first order decay model resembling the description in the Revised1996 IPCC Guidelines of the more complex Tier 2 method, taking into account that thegeneration of methane from landfills is not an instantaneous process. Thus, the methodologycalculates emissions in a specific year as the sum of delayed emissions from all MSW depositedin past years. A 40-year integration period was used, assuming emissions from MSW depositedmore than 40 years ago are negligible. Based on national reports submitted to the ClimateConvention methane recovery amounts for eight OECD countries were included, amounting toabout 2 Tg in 1990 and 4 Tg in 1995, about half of which was allocated to the United States.
For domestic and industrial wastewater discharged in city sewers and subsequentlytreated by municipal Waste Water Treatment Plants (WWTP), the approach based on per capitaorganics loading and industrial waste water generation selected by Doorn et al. (1997) was usedas information on domestic wastewater generation rates is very sparse and because it isessentially the same as the default IPCC methodology (IPCC, 1997). Estimates are based onpopulation data from the UN (1999), whereas wastewater generation was based on industrialproduction statistics of the UN (1998) combined with wastewater generation rates of Doorn etal. (1997). It is well known that in OECD countries, which cover about 60% of this source, alarge fraction of the methane generated in municipal WWTPs is generally recovered. Thereforemethane recovery for municipal WWTPs in OECD'90 countries was tentatively assumed to be75%, effectively reducing the total emissions of OECD countries in 1990 by 0.6 Tg.
For untreated domestic wastewater handling, treatment and disposal emission factors andother factors were based on Doorn et al. (1999), who distinguished disposal in septic tanks,latrines and sewers. The later was divided into sewage with municipal wastewater treatment andopen sewers. Emission factors for CH4 from domestic wastewater in latrines or open pits andseptic tanks and from stagnant open sewers (untreated wastewater) were based on Doorn et al.(1999). Here the same approach as for domestic WWTPs was followed, but distinguishing
The International Satellite Land Surface Climatology Project (ISLSCP)Initiative II Data Collection
EDGAR 3: Gridded Greenhouse and Ozone Precursor Gas Emissions (1970-1995)
10
national population into three population groups: rural and urban, with urban population furthersplit into high and low income groups. For the each of four municipal wastewater disposal types,region-specific and country-specific utilization fractions were estimated for each of these threepopulation categories. Emissions from open sewers were increased by 25% to account for theglobal amount of industrial wastewater annually discharged in municipal sewers. Globally,according to the assumptions of Doorn et al. (1999), this source of CH4 appears to be as large asemissions from landfills.
For N2O from human sewage the default IPCC methodology was used, with proteinintake per country for various years from FAO (2000); for the small emissions of N2O fromDOC in wastewater from the meat processing industry the emission factor provided by Doorn etal. (1997) was applied.
In addition, for domestic waste burning (i.e. by households for non-energetic purposes) afixed amount per urban capita burned per year by urban households in less developed countrieswas used. In rural areas of LDC it was assumed that there is no uncontrolled burning in additionto the agricultural residue burning and biofuel use that has already been accounted for in othersource categories. In contrast, for industrialized countries, it was assumed that domestic wasteburning only occurs in rural areas, where waste incineration regulation is less well controlled.
6.2 Spatial Characteristics6.2.1 Spatial Coverage
The data provide global land coverage with selected ocean grid pointscorresponding to aviation and shipping routes.
6.2.2 Spatial ResolutionThe data are given in an equal-angle lat/long Earth grid that has a spatial resolution
of 1° by 1° in both latitude and longitude.
6.3 Temporal Characteristics6.3.1 Temporal Coverage
The data are decadal (1970, 1980, 1990, and 1995). The precursor gas data onlycover the years 1990 and 1995
6.3.2 Temporal ResolutionEmissions per year.
7. OBSERVATIONS
7.1 Field NotesNot applicable to this data set/
8. DATA DESCRIPTION
8.1 Table Definition with CommentsNot applicable to this data set.

The International Satellite Land Surface Climatology Project (ISLSCP)Initiative II Data Collection
EDGAR 3: Gridded Greenhouse and Ozone Precursor Gas Emissions (1970-1995)
11
8.2 Type of Data8.2.1 Parameter/Variable Name
8.2.2 Parameter/ VariableDescription
8.2.3 DataRange
8.2.4 Units ofMeasurement
8.2.5 DataSource
1) EDGAR Data Files ("edgar_variable_data_1d_YYYY.csv")Longitude Longitude for the lower left
corner of each cell. Westlongitudes are negative.
-180o to179o
Degrees EDGAR 3
Latitude Latitude for the lower leftcorner of each cell. Southlatitudes are negative.
79 o to–73 o
Degrees
ch4 CH4, methane emissionsestimates per cell
0 to1.62E+09
kg CH4
(FMM*)/yrCo CO, carbon monoxide
emissions estimates per cell0 to5.46E+09
kg CO(FMM*)/yr
Co2 CO2, carbon dioxideemissions estimates per cell
0 to2.75E+11
kg CO2
(FMM*)/yrn2o N2O, nitrous oxide
emissions estimates per cell0 to1.03E+08
kg N2O(FMM*)/yr
nmv NMVOC emissionsestimates per cell
0 to1.32E+09
kg NMVOC(FMM*)/yr
nox NO2, nitrogen dioxideemissions estimates per cell
0 to8.45E+08
kg NO2
(FMM*)/yrSo2 SO2, sulphur dioxide
emissions estimates per cell0 to1.71E+09
kg SO2
(FMM*)/yr2) EDGAR Map Files ("edgar_variable_map_1d_YYYY.asc")
Ch4 CH4, methane emissionsestimates per cell
0 to1.62E+09
kg CH4
(FMM)/yrEDGAR 3Data files
Co CO, carbon monoxideemissions estimates per cell
0 to5.46E+09
kg CO(FMM)/yr
Co2 CO2, carbon dioxideemissions estimates per cell
0 to2.75E+11
kg CO2
(FMM)/yrn2o N2O, nitrous oxide
emissions estimates per cell0 to1.03E+08
kg N2O(FMM)/yr
nmv NMVOC emissionsestimates per cell
0 to1.32E+09
kg NMVOC(FMM)/yr
nox NO2, nitrogen dioxideemissions estimates per cell
0 to8.45E+08
kg NO2
(FMM)/yrSo2 SO2, sulphur dioxide
emissions estimates per cell0 to1.71E+09
kg SO2
(FMM)/yr***FMM = Full Molecular Mass

The International Satellite Land Surface Climatology Project (ISLSCP)Initiative II Data Collection
EDGAR 3: Gridded Greenhouse and Ozone Precursor Gas Emissions (1970-1995)
12
8.3 Sample Data RecordThe original data tables with the filename extension .csv have 12-13 lines with general file
information, and then the individual data points. Sample data records for the original data filenamed edgar_ch4_data_1d_1970.csv are given below:
-------------------------------------------------------EMISSIONS ON GRID FOR METHANE IN 1970
Calculated by EDGAR on 24/07/02 by laeedgcalculation name : G: EDGV32 CH4: 70 ALL (EXCL AIR) G: EDGV32 CH4: 71 ALL (EXCL AIR)(this file created on 24/07/02 14:28:01)-------------------------------------------------------EDGAR Inventory 1x1 ALL PROCESSGROUPSMETHANE 1970 annual # cells: 12729 (<>0)Values: min: 5.04E+01 max: 1.59E+09 sum: 2.41E+11Units : kg CH4 (FMM)/yr For cells <> 0: avg: 1.89E+07--------------------------------------------------------180,47,7.73E+03-180,66,1.87E+05-180,68,1.87E+05-179,47,7.73E+03-179,67,2.18E+05-178,47,7.73E+03-177,-14,6.99E+04-177,47,7.73E+03-176,-19,1.77E+06-176,47,7.73E+03-176,65,3.11E+04-176,67,6.22E+04-175,47,7.73E+03-174,47,7.73E+03
8.4 Data FormatAll of the files in the ISLSCP Initiative II data collection are in the ASCII, or text format.
The original data files submitted to the ISLSCP II staff contain the emissions of the various gasesin tabular form. The data files contain a 12-13 line header (see above) and 3 columns of data(Longitude, Latitude, and the emissions for that cell), delimited by a single comma: The data areall in scientific E-notation (i.e. 0.0111E-04).
The file format for the “mapped” files consists of numerical fields of varying length,which are delimited by a single space and arranged in columns and rows. The files each contain360 columns by 180 rows. All values in these files are written as real numbers. No distinction ismade for cells with no emissions over water or land (i.e. value=0).
The map files are all gridded to a common equal-angle lat/long grid, where the coordinatesof the upper left corner of the files are located at 180oW, 90oN and the lower right cornercoordinates are located at 180oE, 90oS. Data in the files are ordered from North to South and fromWest to East beginning at 180 degrees West and 90 degrees North.
The data files are PKZip compressed. On UNIX, they can be decompressed using the"unzip -a" command. On Windows, they can be decompressed using WinZip or other PKZipsoftware. On the Macintosh, they can be decompressed using Stuffit Expander.

The International Satellite Land Surface Climatology Project (ISLSCP)Initiative II Data Collection
EDGAR 3: Gridded Greenhouse and Ozone Precursor Gas Emissions (1970-1995)
13
8.5 Related Data SetsSee http://www.rivm.nl/edgar for other available RIVM/EDGAR global data sets and
products. In this ISLSCP II data collection, users may also wish to examine the GeographicPatterns of Carbon Dioxide Emissions from Fossil-Fuel Burning, Hydraulic Cement Production,and Gas Flaring on a One Degree by One Degree Grid Cell (1950-1995) data set from CDIAC.
9. DATA MANIPULATIONS
Emissions data were mostly taken from international statistical data sources. Emission factorswere selected mostly from international publications to ensure a consistent approach acrosscountries. Sources for the emissions data depend on the type of data and are documented tovarying degrees in the references of Section 6.1.
9.1 Formulas9.1.1 Derivation Techniques/Algorithms
See Olivier et al. (2001a).
9.2 Data Processing Sequence9.2.1 Processing Steps and Data Sets
See Olivier et al. (2001a).
9.2.2 Processing ChangesEDGAR 2.0 has been updated to EDGAR 3.2: an update and extension from 1990
to 1995 for all gases and extended time series for direct greenhouse gases CO2, CH4 andN2O to 1970-1995; and inclusion of 1970-1995 emissions of the new ‘Kyoto’ greenhousegases HFCs, PFCs, SF6 (Olivier et al., 2001a,b). Also see http://www.rivm.nl/edgar
9.2.3 Additional Processing by the ISLSCP2 StaffThe ISLSCP II staff used the coordinates given in the original tabular data (.csv) to
create two-dimensional ASCII map files for each gas on a 1ox1o Earth grid. Areas with noemissions over either land or water were assigned the value of 0 (zero).These files arenamed in a similar
9.3 Calculations9.3.1 Special Corrections/Adjustments
See Olivier et al. (2001a).
9.4 Graphs and PlotsSee Figure 1 on the following page. Other graphics are available at
http://www.rivm.nl/edgar

The International Satellite Land Surface Climatology Project (ISLSCP)Initiative II Data Collection
EDGAR 3: Gridded Greenhouse and Ozone Precursor Gas Emissions (1970-1995)
14
Figure 1. Gridded Carbon Dioxide Emissions for 1995.
10. ERRORS
10.1 Sources of ErrorIt has been acknowledged that providing improved uncertainty estimates is an urgent need
for models and policy applications, but also that it is difficult to achieve on the short term otherthan through collective expert judgment. Within the IPCC Inventory Programme a special activityhas recently been started aiming at providing default values and a better framework for estimatingand reporting of uncertainties. A similar activity has started within GEIA, aiming at the sameresults at country level as well as on grid level, but for a more extended group of compounds andin a more scientific setting. Comparisons of different datasets, e.g. as done with the EDGARdata, may be an important input to this process.
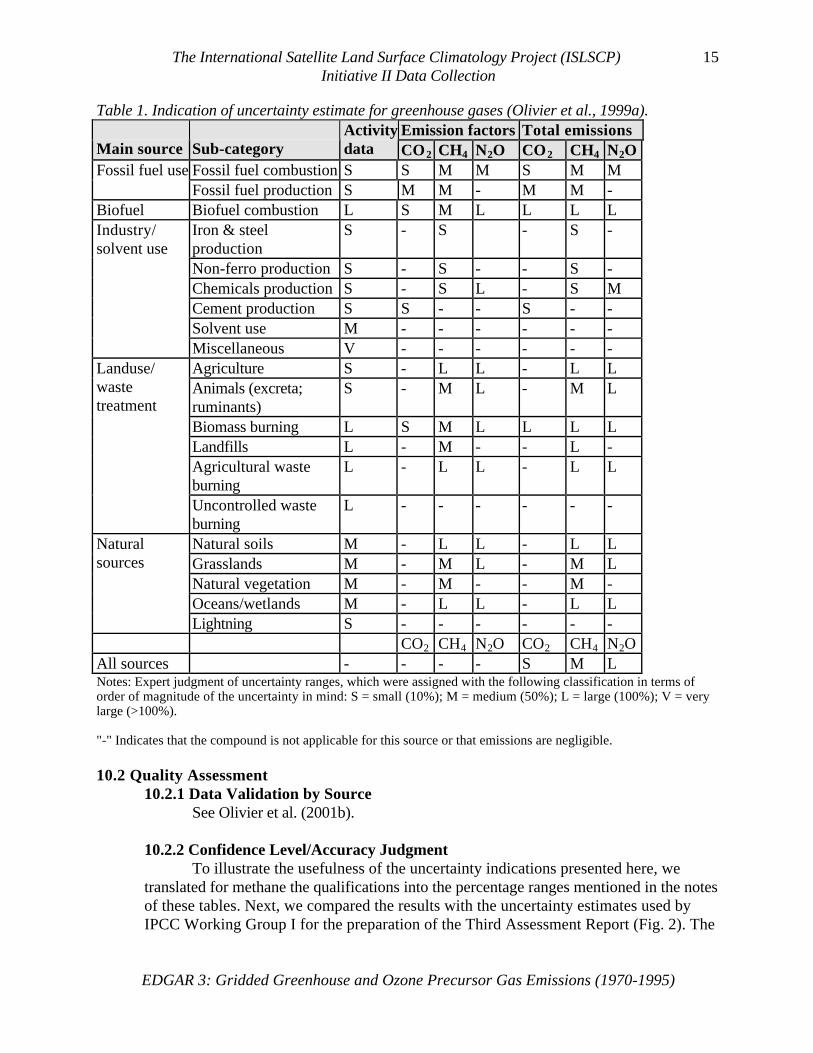
Therefore, it was decided by the EDGAR team that it was at present not feasible to gobeyond the uncertainty tables compiled for Version 2.0 (see Table 1 and 2). However, in additionsome apparent conclusions on uncertainty can be drawn from the comparison of V2.0 with otherdatasets as part of the validation and check for urgent adaptations. For more detailed info onuncertainty in specific inventories we refer to the papers on N2O, NH3 and CO (Bouwman et al.1995, 1997; Olivier et al, 1999) and conclusions on validation in Olivier et al. (2001b).
The International Satellite Land Surface Climatology Project (ISLSCP)Initiative II Data Collection
EDGAR 3: Gridded Greenhouse and Ozone Precursor Gas Emissions (1970-1995)
15
Table 1. Indication of uncertainty estimate for greenhouse gases (Olivier et al., 1999a).Emission factors Total emissions
Main source Sub-categoryActivitydata CO2 CH4 N2O CO2 CH4 N2O
Fossil fuel combustion S S M M S M MFossil fuel useFossil fuel production S M M - M M -
Biofuel Biofuel combustion L S M L L L LIron & steelproduction
S - S - S -
Non-ferro production S - S - - S -Chemicals production S - S L - S MCement production S S - - S - -Solvent use M - - - - - -
Industry/solvent use
Miscellaneous V - - - - - -Agriculture S - L L - L LAnimals (excreta;ruminants)
S - M L - M L
Biomass burning L S M L L L LLandfills L - M - - L -Agricultural wasteburning
L - L L - L L
Landuse/wastetreatment
Uncontrolled wasteburning
L - - - - - -
Natural soils M - L L - L LGrasslands M - M L - M LNatural vegetation M - M - - M -Oceans/wetlands M - L L - L L
Naturalsources
Lightning S - - - - - -CO2 CH4 N2O CO2 CH4 N2O
All sources - - - - S M LNotes: Expert judgment of uncertainty ranges, which were assigned with the following classification in terms oforder of magnitude of the uncertainty in mind: S = small (10%); M = medium (50%); L = large (100%); V = verylarge (>100%).
"-" Indicates that the compound is not applicable for this source or that emissions are negligible.
10.2 Quality Assessment10.2.1 Data Validation by Source
See Olivier et al. (2001b).
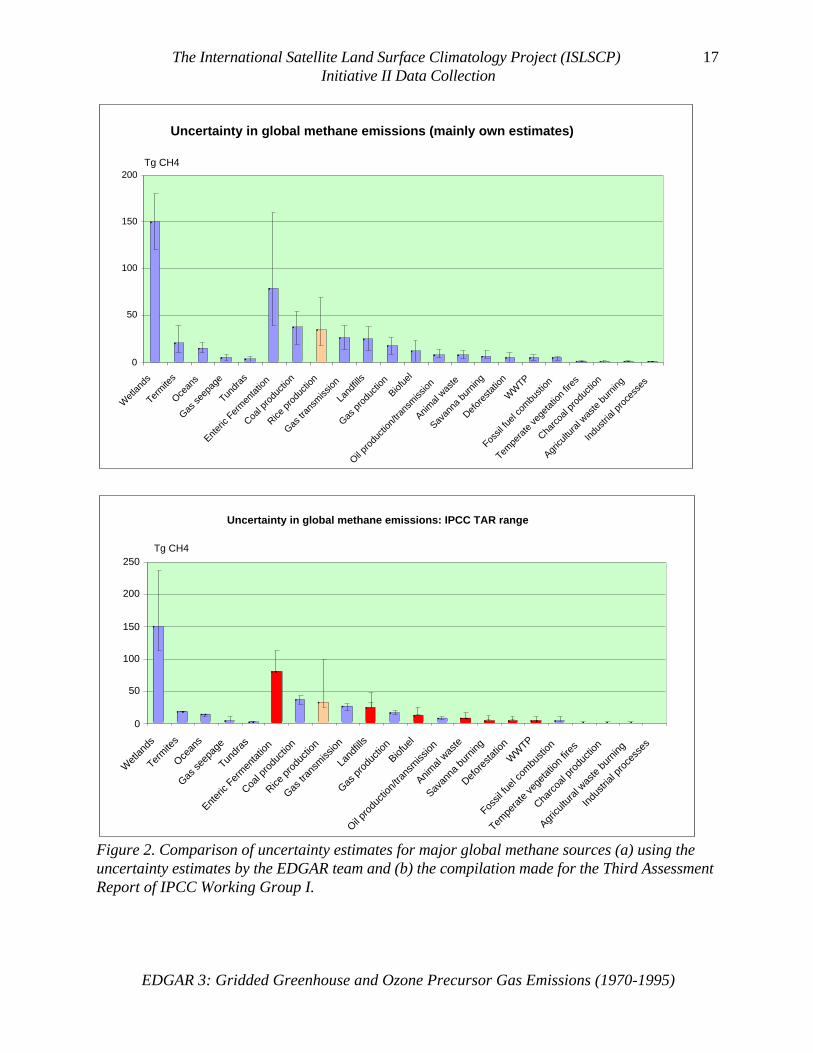
10.2.2 Confidence Level/Accuracy JudgmentTo illustrate the usefulness of the uncertainty indications presented here, we
translated for methane the qualifications into the percentage ranges mentioned in the notesof these tables. Next, we compared the results with the uncertainty estimates used byIPCC Working Group I for the preparation of the Third Assessment Report (Fig. 2). The

The International Satellite Land Surface Climatology Project (ISLSCP)Initiative II Data Collection
EDGAR 3: Gridded Greenhouse and Ozone Precursor Gas Emissions (1970-1995)
16
Table 2. Indication of uncertainty estimate for ozone and aerosol precursors (Olivier et al.,1999b).
Emission factors Total emissionsMainsource Sub-category
Activitydata CO NOx SO2 NMVOC CO NOx SO2 NMVOC
Fossil fuelcombustion
S M M S M M M S MFossil fueluse
Fossil fuelproduction
S - - - M - - - M
Biofuel Biofuel combustion L M M M M L L L LIron & steelproduction
S M M M L M M M L
Non-ferroproduction
S M M L L M M L L
Chemicalsproduction
S M M L L M M L L
Cement production S - - - - - M - -Solvent use M - - - M - - - M
Industry/solvent use
Miscellaneous V V VAgriculture S - - - - - - - -Animals (excreta;ruminants)
S - - - - - - - -
Biomass burning L M L M L L L L LLandfills L - - - - - - - -Agricultural wasteburning
L L L L L L L L L
Landuse/wastetreatment
Uncontrolled wasteburning
L - - - L - - - V
Natural soils M - L - - - L - -Grasslands M - - - - - - - -Natural vegetation M M - - L M - - LOceans/wetlands M L - - - L - - -
NaturalSources
Lightning S - L - - - L - -CO NOx SO
2
NMVOC
CO NOx SO2 NMVOC
All sources - - - - - M M M LNotes: Expert judgment of uncertainty ranges, which were assigned with the following classification in terms oforder of magnitude of the uncertainty in mind: S = small (10%); M = medium (50%); L = large (100%); V = verylarge (>100%)."-" Indicates that the compound is not applicable for this source or that emissions are negligible.
overall picture is rather similar, which shows that this simple approach and interpretationof uncertainty ranges is still quite useful for application at global levels.
10.2.3 Measurement Error for Parameters and VariablesSee Figure 2 and Olivier et al. (2001a,b).
The International Satellite Land Surface Climatology Project (ISLSCP)Initiative II Data Collection
EDGAR 3: Gridded Greenhouse and Ozone Precursor Gas Emissions (1970-1995)
17
Uncertainty in global methane emissions (mainly own estimates)
0
50
100
150
200
Wet
lands
Term
ites
Ocean
s
Gas se
epag
e
Tundr
as
Enter
ic Fer
men
tatio
n
Coal p
rodu
ction
Rice p
rodu
ction
Gas tr
ansm
ission
Land
fills
Gas p
rodu
ction
Biofue
l
Oil pro
ducti
on/tr
ansm
ission
Animal
waste
Savan
na b
urnin
g
Defor
esta
tion
WW
TP
Fossil
fuel
com
busti
on
Tempe
rate
vege
tatio
n fir
es
Charc
oal p
rodu
ction
Agricu
ltura
l was
te b
urnin
g
Indu
strial
pro
cess
es
Tg CH4
Uncertainty in global methane emissions: IPCC TAR ranges
0
50
100
150
200
250
Wet
lands
Term
ites
Ocean
s
Gas se
epag
e
Tundr
as
Enter
ic Fer
men
tatio
n
Coal p
rodu
ction
Rice p
rodu
ction
Gas tr
ansm
ission
Land
fills
Gas p
rodu
ction
Biofue
l
Oil pro
ducti
on/tr
ansm
ission
Animal
waste
Savan
na b
urnin
g
Defor
esta
tion
WW
TP
Fossil
fuel
com
busti
on
Tempe
rate
vege
tatio
n fir
es
Charc
oal p
rodu
ction
Agricu
ltura
l was
te b
urnin
g
Indu
strial
pro
cess
es
Tg CH4
Figure 2. Comparison of uncertainty estimates for major global methane sources (a) using theuncertainty estimates by the EDGAR team and (b) the compilation made for the Third AssessmentReport of IPCC Working Group I.

The International Satellite Land Surface Climatology Project (ISLSCP)Initiative II Data Collection
EDGAR 3: Gridded Greenhouse and Ozone Precursor Gas Emissions (1970-1995)
18
10.2.4 Additional Quality Assessment AppliedNone.
11. NOTES
11.1 Known Problems with the DataIt is stressed that the uncertainty in the resulting dataset at national level may be
substantial, especially for methane and nitrous oxide, and even more so for the F-gases. Theuncertainty is caused by the limited accuracy of international activity data used and in particularof emission factors selected for calculating emissions on a country level (Olivier et al., 1999,2001).
11.2 Usage GuidanceMethods used are comparable with IPCC methodologies and global totals comply with
budgets used in atmospheric studies and the data were based on international informationsources; hence, this dataset should provide a sound basis for comparability.
11.3 Other Relevant InformationRIVM and TNO have made all reasonable efforts to ensure that the publicly available
information at this homepage is accurate. However, there may be inadvertent and occasionalerrors for which we apologies. Although this database has been constructed with great care,RIVM and TNO do not accept any liability from using the data. Any decisions based oninformation contained in the EDGAR datasets are the sole responsibility of the user. RIVMaccepts no liability for any direct or indirect damages resulting from whatever cause through theuse of any information obtained directly or indirectly from EDGAR data.
Mention of any company, association or product is for information purposes only and doesnot constitute any recommendation of any such company, association or product, either expressor implied by RIVM. In particular, countries and country names mentioned are only used tospecify geographical entities and do not constitute any recommendation whatsoever with respectto political boundaries etc.
12. REFERENCES
12.1 Satellite/Instrument/Data Processing DocumentationSee http://www.rivm.nl/edgar and http://www.rivm.nl/edgar/documentation/
12.2 Journal Articles and Study ReportsAdler, M.J. (1994) International anthropogenic methane emissions: estimates for 1990. EPA,
Washington, DC (USA), EPA report no. 230-R-93-010, January 1994.AFEAS (1997) Production, sales and atmospheric release of fluorocarbons through 1995.
Alternative Fluorocarbons Environmental Acceptability Study (AFEAS) Program Office,Washington DC, USA. Also see: http://www.afeas.org/production_and_sales.html
Aluminium Verlag (1998) Primary Aluminium Smelters and Producers of the World, Vol. 2,Compiled by R. Pawlek. Aluminium Verlag, Düsseldorf, Germany.

The International Satellite Land Surface Climatology Project (ISLSCP)Initiative II Data Collection
EDGAR 3: Gridded Greenhouse and Ozone Precursor Gas Emissions (1970-1995)
19
Bibler, C.J., Marshall, J.S. and R.C. Pilcher (1998) Status of worldwide coal mine methaneemissions and use. Int. J. of Coal Geology, 35, 283-310.
Bouwman, A.F., Lee, D.S., Asman, W.A.H., Dentener, F.J., Van Der Hoek, K.W. and J.G.J.Olivier (1997) A Global High-Resolution Emission Inventory for Ammonia, GlobalBiogeochemical Cycles, 11:4, 561-587.
Bouwman, A.F., Van der Hoek, K.W. and J.G.J. Olivier (1995). Uncertainties in the global sourcedistribution of nitrous oxide. Journal of Geophysical Research, 100:D2, 2785-2800.
Denier van der Gon, H. (1999) Changes in CH4 emission from rice fields from 1960 to 1990s 2.The declining use of organic inputs in rice farming. Global Biogeochemical Cycles, 13, 1053-1062.
Denier van der Gon, H. (2000) Changes in CH4 emission from rice fields from 1960 to 1990s 1.Impacts of modern rice technology. Global Biogeochemical Cycles, 14, 61-72.
Doorn, M.R.J., Strait, R.P., Barnard, W.R. and B. Eklund (1997). Estimates of global greenhousegas emissions from industrial and domestic waste water treatment. Report no. NRMRL-RTP-086. R 8/18/97. Pechan & Ass., Durham.
Doorn, M.J. and D.S. Liles (1999) Quantification of methane emissions and discussion of nitrousoxide, and ammonia emissions from septic tanks, latrines, and stagnant open sewers in theworld. EPA, Washington DC, USA. EPA report EPA-600/R-99-089, October 1999.
FAO (1993) Forest resources assessment 1990; Tropical countries. FAO, Rome. Report FP-112.
FAO (1995) Forest resources assessment 1990; Global analysis. FAO, Rome. Report FP 124.FAO (1998) State of the Worlds Forests 1997. FAO, Rome.FAO (1998b) FAOSTAT Forestry Data. Data downloaded from www.apps.fao.org on 12-3-
1998.FAO (2000) FAOSTAT Agricultural Data.Hall D.O., Rosillo-Calle F. and Woods J. (1994) Biomass utilization in households and industry:
energy use and development, Chemosphere 29, 1099-1119.IEA/OECD (1997) Beyond 20/20, Release 4.1, Energy Balances of OECD Countries, Energy
Balances of Non-OECD Countries. Ivation DatasystemsInc. 1997.IISI (1997) 1996 Steel Statistical Yearbook, International Iron and Steel Institute, Brussels.IPCC (1997) Revised 1996 IPCC Guidelines for National Greenhouse Gas Inventories.
IPCC/OECD/IEA, Paris.IPCC (2000) Good Practice Guidance and Uncertainty Management in National Greenhouse Gas
Inventories, IPCC-TSU NGGIP, Japan.Kroeze, C. (1994) Nitrous oxide (N2O). Emission inventory and options for control in the
Netherlands. RIVM, Bilthoven. Report no. 773001 004.Lerner, J., Matthews, E. and Fung,I. (1988) Methane emission from animals: a global high
resolution database, Global Biogeochemical Cycles 2, 139-156.Mocella, M.T. (1993) Production and Uses of C2F6. Proceedings of the Workshop on
Atmospheric effects, origins, and options for control of two potent greenhouse gases: CF4and C2F6. US EPA, Global Change Division, April 21-22, Washington, D.C.
New, M.G., Hulme, M. and P.D. Jones (1999) Representing 20th century space-time climatevariability. I: Development of a 1961-1990 mean monthly terrestrial climatology. J. Climate,12, 829-856.
Neue, H.U. (1997) Fluxes of methane from rice fields and potential for mitigation. Soil Use andManagement, 13, 258-267.
The International Satellite Land Surface Climatology Project (ISLSCP)Initiative II Data Collection
EDGAR 3: Gridded Greenhouse and Ozone Precursor Gas Emissions (1970-1995)
20
Olivier, J.G.J. (2002) Part III: Greenhouse gas emissions: 1. Shares and trends in greenhousegas emissions; 2. Sources and Methods; Greenhouse gas emissions for 1990 and 1995. In:"CO2 emissions from fuel combustion 1971-2000", 2002 Edition, pp. III.1-III.31.International Energy Agency (IEA), Paris. ISBN 92-64-09794-5.
Olivier, J.G.J. and J. Bakker (2000) Historical global emission trends of the Kyoto gases HFCs,PFCs and SF6. Proceedings of "Conference on SF6 and the Environment: Emission ReductionStrategies", November 2-3, San Diego. EPA, Washington DC, USA. Conference Proceedingspublished at http://www.epa.gov/highgwp1/sf6/partner_resources/proceedings.html
Olivier, J.G.J. and J.J.M. Berdowski (2001a) Global emissions sources and sinks. In: Berdowski,J., Guicherit, R. and B.J. Heij (eds.) "The Climate System", pp. 33-78. A.A. BalkemaPublishers/Swets & Zeitlinger Publishers, Lisse, The Netherlands. ISBN 90 5809 255 0.
Olivier, J.G.J., J.J.M. Berdowski, J.A.H.W. Peters, J. Bakker, A.J.H. Visschedijk en J.-P.J.Bloos (2001b) Applications of EDGAR. Including a description of EDGAR 3.0: referencedatabase with trend data for 1970-1995. RIVM, Bilthoven. RIVM report no. 773301 001/NOP report no. 410200 051.
Olivier, J.G.J. et al. (2001c) CO2, CH4 and N2O emissions for 1990 and 1995; Sources andMethods. In: "CO2 emissions from fuel combustion 1971-1999", 2001 Edition, pp. III.9-III.29. International Energy Agency (IEA), Paris. ISBN 92-64-08745-1.
Olivier, J.G.J., Bouwman, A.F., Van der Maas, C.W.M., Berdowski, J.J.M., Veldt, C., Bloos,J.P.J., Visschedijk, A.J.H., Zandveld, P.Y.J. and Haverlag, J.L. (1996). Description ofEDGAR Version 2.0: A set of global emission inventories of greenhous gases and ozone-depleting substances for all anthropogenic and most natural sources on a per country basisand on 1ox1o grid. National Institute of Public Health and the Environment (RIVM) reportno. 771060 002 / TNO-MEP report no. R96/119.
Olivier, J.G.J, A.F. Bouwman, J.J.M. Berdowski, C. Veldt, J.P.J. Bloos, A.J.H. Visschedijk,C.W.M. van der Maas and P.Y.J. Zandveld (1999) Sectoral emission inventories ofgreenhouse gases for 1990 on a per country basis as well as on 1x1 degree. EnvironmentalScience & Policy, 2, 241-264.
S&PS (1997) Sales of sulphur hexafluoride (SF6) by end-use applications. Annual sales for 1961through 1996. Sales projections for 1997 through 2000. Washington, USA, March 1997.Science & Policy Services (S&PS), now RAND.
Smill, V. (1999) Nitrogen in crop production: an account of global flows. Global BiogeochemicalCycles, 13, 647-662.
Smythe, K. D. (2000) Production and Distribution of SF6 by End-Use Application. Proceedingsof "Conference on SF6 and the Environment: Emission Reduction Strategies", November 2-3,San Diego. EPA, Washington DC, USA. Conference Proceedings published at:
SRI (1998) Adipic acid production data 1974-1997. SRI Consulting, Menlo Park, USA. Tabledated January-1998, received 30-1-1998.
Thakur, P. C., H. G. Little and W. G. Karis (1996) Global Coalbed Methane Recovery and Use,in: Riemer, P. and A. Smith (eds.) (1996) Proceedings of the International Energy AgencyGreenhouse Gases Mitigation Options Conference, Pergamon-Elsevier, 789-794
UN (1998) Industrial commodity production statistics 1970-1995. UN Statistical Division, NewYork. Data file received 30-3-1998.
UN/ECE-FAO [United Nations Economic Commission for Europe & Food and AgricultureOrganisation of the United Nations] (1996) Forest Fire Statistics 1993-1995, Timber Bulletin,Vol. XLIX, No. 4, ECE/TIM/BULL/49/4, United Nations, 1996.

The International Satellite Land Surface Climatology Project (ISLSCP)Initiative II Data Collection
EDGAR 3: Gridded Greenhouse and Ozone Precursor Gas Emissions (1970-1995)
21
UN (1999) UN World Population Prospects, 1996 Revision. UN Population Division, NewYork.
13. DATA ACCESS
13.1 Contacts for Archive/Data Access InformationAt this revision, the ISLSCP Initiative II data are available from World Wide Web site
http://islscp2.sesda.com. This web site will be phased out in the coming months as the ISLSCPInitiative II data collection will be provided operationally through the GSFC DAAC World WideWeb site at http://daac.gsfc.nasa.gov/www/islscp/, where the data will also be archived anddistributed on other media. The data collection is also to be released on Digital Video Disc (DVD)in May 2005 after a community-wide evaluation of the entire collection. More information on theISLSCP Initiative II Archive is available directly from the GSFC DAAC user services at:
GSFC DAAC User ServicesNASA/Goddard Space Flight CenterCode 902Greenbelt, MD 20771U.S.A.Phone: (301) 614-5224Toll-Free (U.S.) (877) 422-1222FAX: (301) 614-5268E-mail: [email protected]: http://daac.gsfc.nasa.gov/www/islscp/
13.2 Archive IdentificationGoddard Earth Sciences (GES)Data and Information Service Center (DISC)Distributed Active Archive Center (DAAC)NASA Goddard Space Flight CenterCode 902Greenbelt, MD 20771 U.S.A.
13.3 Procedures for Obtaining DataUsers should access the ISLSCP Initiative II data through the GSFC DAAC World Wide
Web site http://daac.gsfc.nasa.gov/www/islscp/. While details on ordering the ISLSCP Initiative IIdata collection on DVD have not been yet finalized, we anticipate that these would be orderedfrom the GSFC DAAC user services at the address above. ***NOTE: as of January 2005,DVDs are not currently available for ordering.
13.4 Archive/Status/PlansThe ISLSCP Initiative II data are archived at the GSFC DAAC. Please check the ISLSCP
Initiative II Web site at the GSFC DAAC (http://daac.gsfc.nasa.gov/www/islscp/) for anychanges in the status of these data and for the latest information regarding the evaluation phase ofthe data collection.
The International Satellite Land Surface Climatology Project (ISLSCP)Initiative II Data Collection
EDGAR 3: Gridded Greenhouse and Ozone Precursor Gas Emissions (1970-1995)
22
14. OUTPUT PRODUCTS AND AVAILABILITY
14.1 Tape ProductsThere are no products available on tape.
14.2 Film ProductsThere are no products available on film.
14.3 Other ProductsAll data products are available through Web access at the GSFC DAAC. The data
collection is to be released on DVD in May 2005 after a community-wide evaluation of the entirecollection.
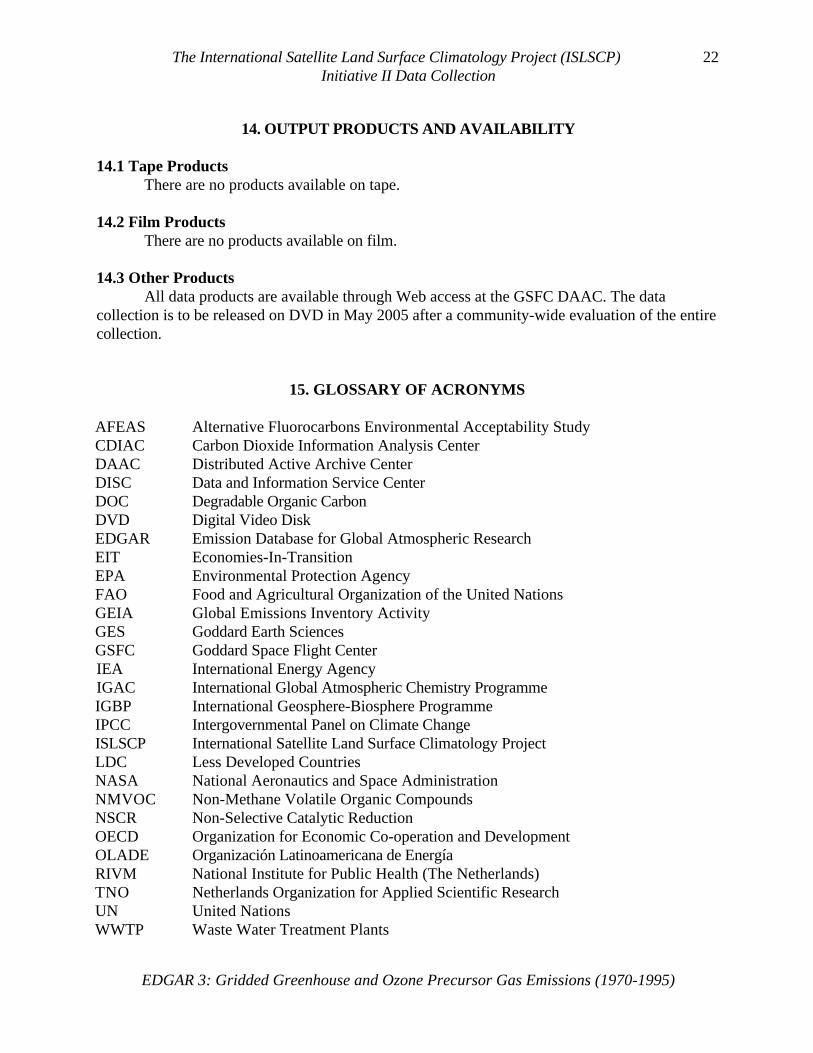
15. GLOSSARY OF ACRONYMS
AFEAS Alternative Fluorocarbons Environmental Acceptability StudyCDIAC Carbon Dioxide Information Analysis CenterDAAC Distributed Active Archive CenterDISC Data and Information Service CenterDOC Degradable Organic CarbonDVD Digital Video DiskEDGAR Emission Database for Global Atmospheric ResearchEIT Economies-In-TransitionEPA Environmental Protection AgencyFAO Food and Agricultural Organization of the United NationsGEIA Global Emissions Inventory ActivityGES Goddard Earth SciencesGSFC Goddard Space Flight CenterIEA International Energy AgencyIGAC International Global Atmospheric Chemistry ProgrammeIGBP International Geosphere-Biosphere ProgrammeIPCC Intergovernmental Panel on Climate ChangeISLSCP International Satellite Land Surface Climatology ProjectLDC Less Developed CountriesNASA National Aeronautics and Space AdministrationNMVOC Non-Methane Volatile Organic CompoundsNSCR Non-Selective Catalytic ReductionOECD Organization for Economic Co-operation and DevelopmentOLADE Organización Latinoamericana de EnergíaRIVM National Institute for Public Health (The Netherlands)TNO Netherlands Organization for Applied Scientific ResearchUN United NationsWWTP Waste Water Treatment Plants