edelweiss financial services limited
TRANSCRIPT

Edelweiss Financial Services Limited
Q2FY21 Earnings Update

Contents
2
Q2FY21 Highlights1 3
Balance Sheet Highlights3 40
Business Update2 21
Organization. Governance. Sustainability4 45

Q2FY21 Highlights
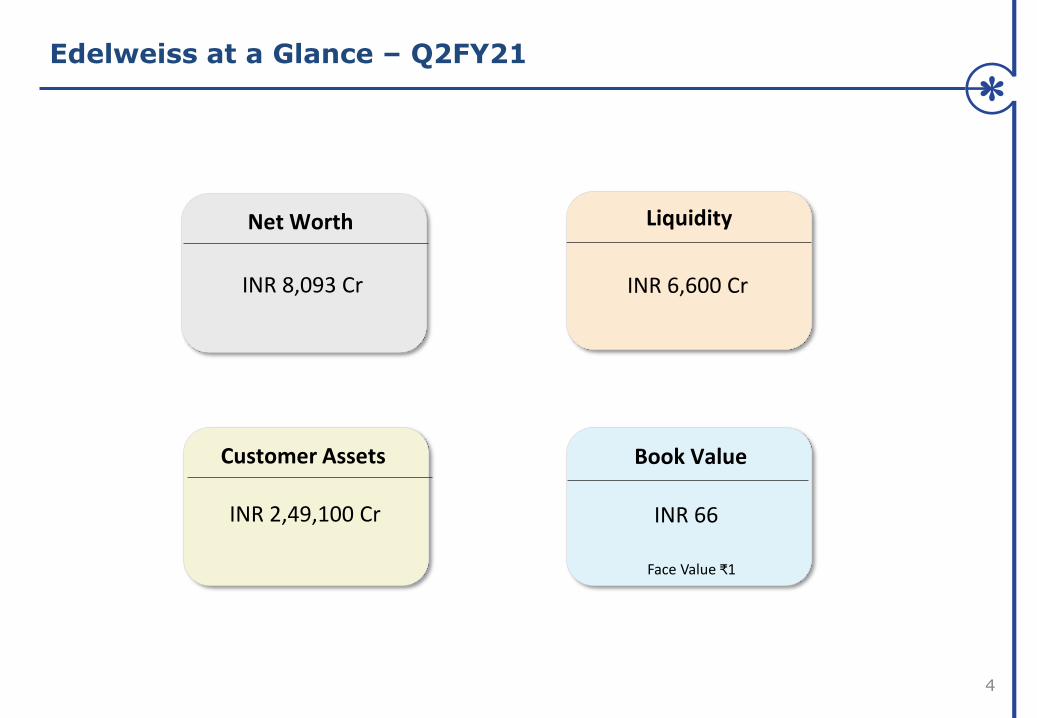
Edelweiss at a Glance – Q2FY21
4
LiquidityNet Worth
Book Value
INR 8,093 Cr
INR 66
Customer Assets
INR 2,49,100 Cr
INR 6,600 Cr
Face Value ₹1

5
Corporate Credit
Retail CreditWealth
ManagementLife
InsuranceAsset
ManagementGeneral
Insurance
• Edelweiss Asset Management Ltd (EAMC)
• Edelweiss Alternate Asset Advisors Ltd (EAAA)
Equity INR 2,123 Cr
• Edelweiss Asset Reconstruction Company Ltd (EARC)
Equity INR 625 Cr
• Edelweiss General Insurance Company Ltd (EGIC)
Equity INR 109 Cr
• Edelweiss Securities Ltd (ESL)
Equity INR 181 Cr
• Edelweiss Retail Finance Ltd (ERFL)
• Edelweiss Housing Finance Ltd (EHFL)
EquityINR 1,263 Cr
• ECL Finance Ltd
EquityINR 3,210 Cr
Diversified Businesses Across 9 Key Entities
25-year track record of creating businesses benefitting from the India growth story
• Edelweiss Tokio Life Insurance Company Ltd (ETLI)
ARC
EquityINR 1,348 Cr
Edelweiss Financial Services Ltd (EFSL)

Well-Capitalised Businesses And Robust Customer
Franchise..
6
Entity Equity
(INR Cr)Metric Value
ECL Finance Ltd 3,210
CAPAD
23.5%
Edelweiss Retail Finance Ltd 481 29.5%
Edelweiss Housing Finance Ltd 782 28.2%
Edelweiss Securities Ltd & Others 1,348 AUA ~INR 1,33,200 Cr
EAMC, EAAA & Others 181 AUM ~INR 73,500 Cr
Edelweiss Asset Reconstruction Company Ltd 2,123 CAPAD 34.0%
Edelweiss Tokio Life Insurance Ltd 625Solvency Ratio
216%
Edelweiss General Insurance Company Ltd 109 202%

7
..Resulting In Strong Fee Income
480 467 489
464
385 411
Q1FY20 Q2FY20 Q3FY20 Q4FY20 Q1FY21 Q2FY21
Management Fee Income (INR Cr)
Robust annuity income from Wealth Management, Asset Management and Asset Reconstruction businesses

8
Edelweiss Approach
• Our mission is to build successful and dominant businesses that create long-term value for shareholders
• EFSL contributes capital, brand, risk management and governance for sustainable growth
• Our partners are global entities with impeccable credentials who contribute domain expertise and capital
• Inflection point in growth journey : Our businesses are now moving from dependence to independence
• For the next phase of growth, we will ensure that we have the best management team and sufficient resources for each of our businesses
• Continue to scale these businesses with more partnerships as required
• Aim to unlock value in these businesses for shareholders
• Format of unlocking can take the most appropriate form that helps business growth
Primacy to creating and unlocking value for shareholders

9
Scalable Opportunity For Alternatives in India
Market share ceded by Banks and Mutual Funds has further accentuated need for
longer term flexible debt capital
Globally, investors are seeking yield in a low interest rate world, and Private Credit is
becoming mainstream
Close-ended Asset Management vehicles as preferred option for long term credit
investments as they are unlevered patient vehicles

10
Largest Fund Raise In The Year In Indian Private Credit
• Successfully closed ESOF III at $900 Mn (INR 6,600 Cr)
• This is the third in the Edelweiss Special Opportunities Fund (ESOF) series, focused on providingstructured credit to Indian companies
• Strong validation of our capabilities and trust placed in our platform
• Expanding partnerships with global institutional investors
• Florida’s State Board of Administration
• Canada’s Ontario Teachers Pension Plan
• Swedish Pension Fund (AP4)
• Large European Insurance Company
• Structured Credit fund:
• Edelweiss Asset Management pioneered private debt in India with the launch of the $230 Mn (˜INR1,000 Cr) ESOF I in 2010
• Currently ~76% of ESOF II is deployed which was closed in March’17 at $345 Mn (~INR 2,250 Cr)
• Opportunity for clients to participate in high quality yielding assets with average tenor ~3-4 years

11
Asset Management AUM Grew 105% YoY
35,900
51,000 50,800 52,800
73,500
Q2FY20 Q3FY20 Q4FY20 Q1FY21 Q2FY21
Mutual Fund and Alternatives AUM (INR Cr)

Continued Execution Of FY21 Plan in Q2FY21 (1/2)
12
Corporate Credit • Reduced corporate credit book to INR 8,613 Cr in H1FY21
Retail Credit• Assigned INR 560 Cr mortgages portfolio as part of asset- light business approach
• Retail collections improving as economy emerges from lockdown
Wealth Management
• Strong traction in business; AUA grew 24% YoY
Asset Reconstruction
• ARC recoveries have returned to normalcy despite current market environment
Asset Management
• Closed ESOF III successfully at $900 Mn (~INR 6,600 Cr)
• Closed 2nd series of Bharat Bond ETF
Life Insurance• ETLI is one of only two life insurance companies that registered Individual APE
growth every month in H1FY21

Continued Execution Of FY21 Plan in Q2FY21 (2/2)
13
• Overall Liquidity stood at ~INR 6,600 Cr which is 21% of borrowings
• Raised INR 2,500 Cr in Q2FY21 and INR 4,350 Cr in H1FY21 across PCG & TLTROschemes, bank loans and other sources
• Bought back bonds worth ~INR 500 Cr during the quarter
Comfortable Liquidity position
• Collection efficiency in ECLF, ERFL and EHFL for Sept’20 is returning to normalcy at94%, 92% and 91% respectively
Maintained Asset Quality
• Achieved cost reduction of 23% in Q2FY21 against average FY20 fixed cost
• Leveraging Covid situation to accelerate newer operating model on the back oftechnology
Cost optimization
measures
General Insurance
• Edelweiss General Insurance is the fastest growing GI player in H1FY21

Businesses (INR Cr) Key Entities Q1FY21 Q2FY21
Corporate Credit ECL Finance (156) 22
Retail Credit ERFL & EHFL 11 20
Wealth Management ESL & Others 59 83
Asset Management EAMC, EAAA 5 3
Asset Reconstruction EARC 40 46
BMU & Corporate EFSL & others (139) (146)
Total Ex-Insurance Pre MI PAT (180) 28
Life Insurance ETLI (68) (58)
General Insurance EGIC (16) (26)
Total Consolidated Pre MI PAT (264) (56)
14
Distribution of Earnings Across Businesses

Consolidated (INR Cr) Q1FY21 Q2FY21
1,808 2,047
1,002 949
806 1,098
904 1,043
(98) 55
145 87
(243) (31)
(264) (56)
(245) (49)
Gross Revenue
Interest Cost
Net Revenue
Expenses
Impairment
PBT
PAT Pre MI
PAT Post MI
Q2FY21 Financial Snapshot
15
PPoP

16
Key Focus Areas
Cost rationalization under way
D/E comes down further
Reduction in Corporate Credit Exposure1
2
3
Progress on EWM demerger & listing process4

17
21,100
18,055
16,178
10,130 8,613
H1FY19 H2FY19 H1FY20 H2FY20 H1FY21
Corporate Credit Assets (INR Cr)
Corporate credit assets will decline by another INR 2,000 - 3,000 Cr by end FY21
1 Corporate Credit Exposure Continues To Scale Down

18
50,323
43,201
38,695
33,754 30,845
H1FY19 H2FY19 H1FY20 H2FY20 H1FY21
5.2x 4.4x 3.4x 3.5x 3.1x
Borrowings (INR Cr) D/E (Excl Treasury Assets)
Borrowings reduced by ~40% over H1FY19 levels
2 Debt Equity Ratio Declined Further

19
Cost Rationalisation Measures Under Way3
• Achieved cost reduction of 23% in Q2FY21 againstaverage FY20 fixed cost
• Targeted reduction of ~20-25% in FY21
• Multiple vectors applied to enhance cost disciplineand cost control measures
• Key expense heads:
• People Cost : Decrease of 17% in Q2 vs FY20Avg.
• Premises Expenses : Lower by 40% in Q2 vsFY20 Avg.
• External fees : Trending lower by 30% in Q2 vsFY20 Avg.
550
439 425
Avg FY20 Q1FY21 Q2FY21
Q2FY21 Fixed Cost comparison (INR Cr)
20
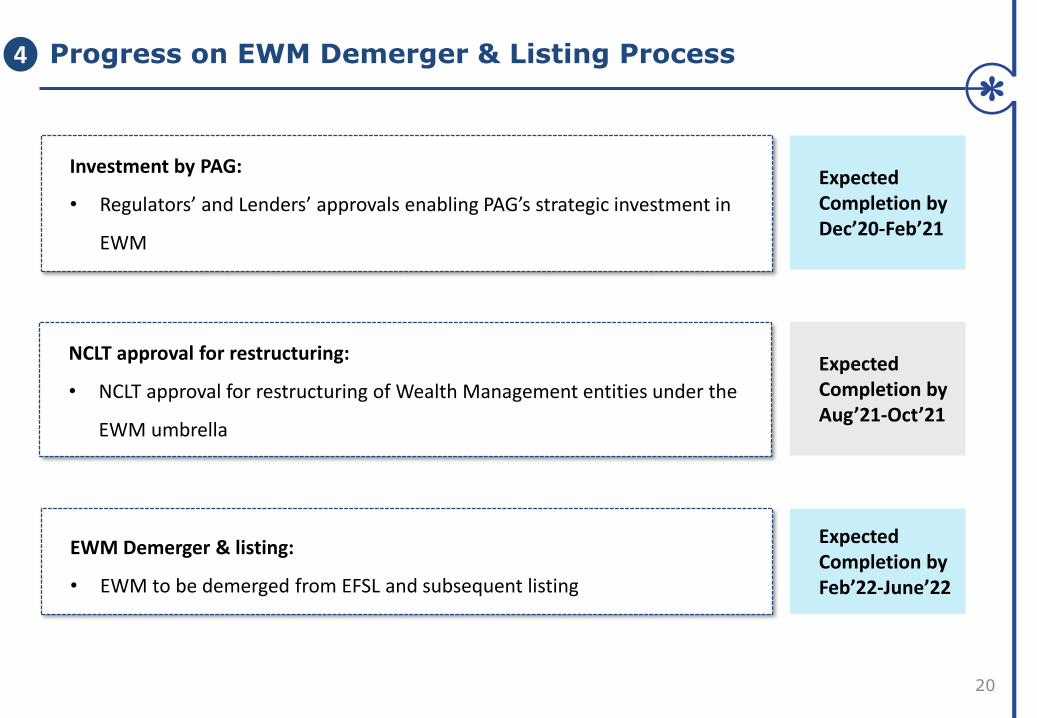
Progress on EWM Demerger & Listing Process4
Investment by PAG:
• Regulators’ and Lenders’ approvals enabling PAG’s strategic investment in
EWM
Expected Completion byDec’20-Feb’21
NCLT approval for restructuring:
• NCLT approval for restructuring of Wealth Management entities under the
EWM umbrella
Expected Completion byAug’21-Oct’21
EWM Demerger & listing:
• EWM to be demerged from EFSL and subsequent listing
Expected Completion byFeb’22-June’22

Business Update

Equity (INR Cr) 3,210
CAPAD 23.5%
Net D/E 4.1x
Liquidity (INR Cr) ~2,400
Corporate Credit : ECL Finance Limited
22
Q2FY21 Key Metrics Business Update
• Focused on resource raising to generate liquidity
• Raised INR 1,900 Cr across PCG and TLTRO schemes in
H1FY21
• Additionally, raised ~INR 400 Cr from banks and other
sources in H1FY21
• Pipeline for H2FY21 includes INR 1,000 Cr of fresh
borrowings and ~INR 500 Cr through securitization of
assets
• Collections are returning to normalcy and was at ~INR 400
Cr in Q2FY21 against ~INR 550 Cr in Q4FY20
• Bought back bonds worth ~INR 500 Cr during the quarter
ECL Finance
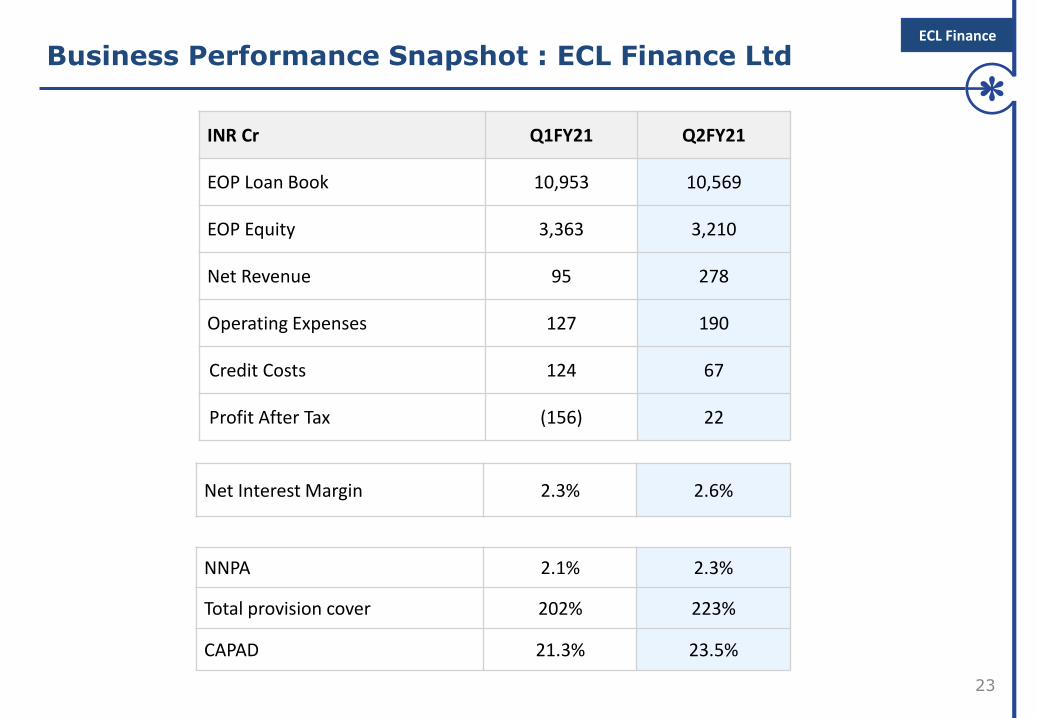
Business Performance Snapshot : ECL Finance Ltd
23
INR Cr Q1FY21 Q2FY21
EOP Loan Book 10,953 10,569
EOP Equity 3,363 3,210
Net Revenue 95 278
Operating Expenses 127 190
Credit Costs 124 67
Profit After Tax (156) 22
Net Interest Margin 2.3% 2.6%
NNPA 2.1% 2.3%
Total provision cover 202% 223%
CAPAD 21.3% 23.5%
ECL Finance

ERFL EHFL
Equity (INR Cr) 481 782
CAPAD 29.5% 28.2%
Net D/E 2.5x 3.6x
Liquidity (INR Cr) ~100 ~1,000
No of clients ~85,000
Retail Credit: Edelweiss Retail Finance Ltd and
Edelweiss Housing Finance Ltd
24
Q2FY21 Key Metrics Business Update
• Steady improvement in overall collections
• Overall collections during the quarter was at~INR 500 Cr
• Collection efficiency at 91% in Sept’20, similarto March’20 levels
• Raised ~INR 350 Cr across PCG and TLTROschemes, banks & other sources in H1FY21
• In line with our asset light business model,
assigned mortgages portfolio of INR 560 Cr during
the current quarter
• Achieved branch network optimization by
consolidating geographical footprint
ERFL/EHFL

Business Performance Snapshot : ERFL
25
INR Cr Q1FY21 Q2FY21
EOP Loan Book 1,312 1,362
EOP Equity 474 481
Net Revenue 20 20
Operating Expenses 8 7
Credit Costs (2) 3
Profit After Tax 11 8
Net Interest Margin 5.6% 5.7%
NNPA 2.0% 1.7%
Total provision cover 120% 147%
CAPAD 29.3% 29.5%
ERFL/EHFL

Business Performance Snapshot : EHFL
26
INR Cr Q1FY21 Q2FY21
EOP Loan Book 4,490 3,815
EOP Equity 769 782
Net Revenue 37 59
Operating Expenses 27 33
Credit Costs 11 8
Profit After Tax - 13
Net Interest Margin 3.3% 3.6%
NNPA 1.4% 1.4%
Total provision cover 69% 88%
CAPAD 23.2% 28.2%
ERFL/EHFL

27
107 115
231
267250
341
Apr'20 May'20 Jun'20 July'20 Aug'20 Sept'20
Increased customer engagement has helped greatly with collections
Retail Credit Collections (INR Cr)
Sharp Pick-Up in Retail Collections ERFL/EHFL
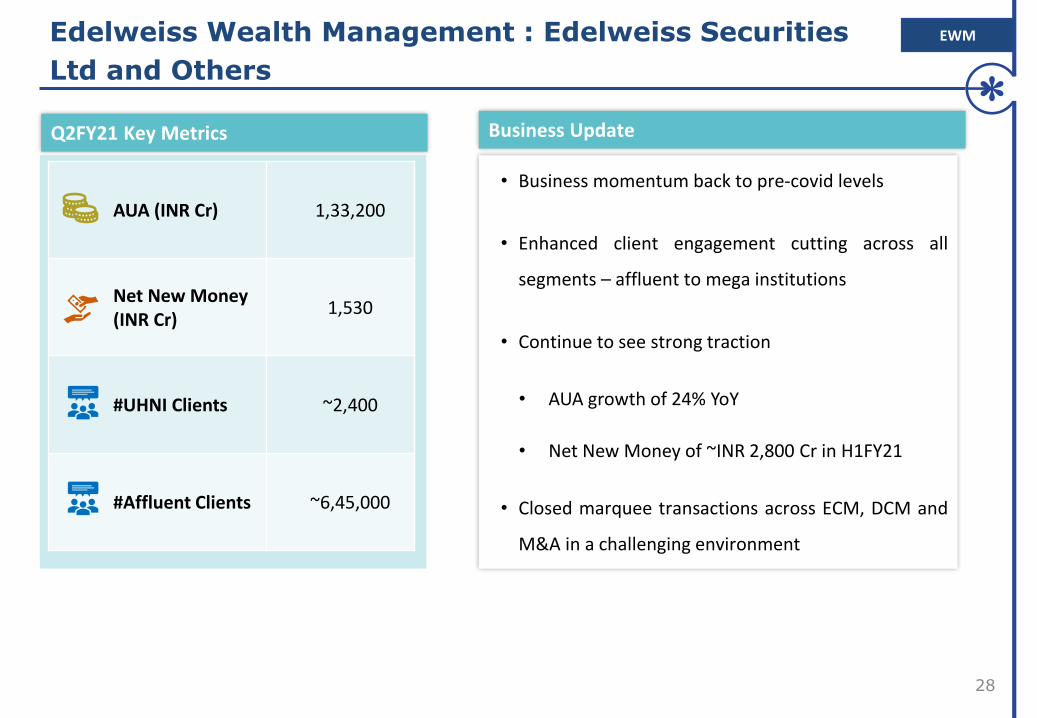
AUA (INR Cr) 1,33,200
Net New Money(INR Cr)
1,530
#UHNI Clients ~2,400
#Affluent Clients ~6,45,000
Edelweiss Wealth Management : Edelweiss Securities
Ltd and Others
28
Q2FY21 Key Metrics Business Update
• Business momentum back to pre-covid levels
• Enhanced client engagement cutting across all
segments – affluent to mega institutions
• Continue to see strong traction
• AUA growth of 24% YoY
• Net New Money of ~INR 2,800 Cr in H1FY21
• Closed marquee transactions across ECM, DCM and
M&A in a challenging environment
EWM

29
Wealth Assets Grew 24% YoY
1,07,8001,11,200
1,13,700
1,27,300
1,33,200
Q2FY20 Q3FY20 Q4FY20 Q1FY21 Q2FY21
Wealth Management AUA (INR Cr)
EWM

Business Performance Snapshot : Edelweiss Wealth
Management
30
ESL & Others (INR Cr) Q1FY21 Q2FY21
AUA 1,27,300 1,33,200
EOP Equity 1,260 1,348
Gross Revenues 264 310
Net Revenues 215 256
Operating costs 141 155
Profit before tax 72 101
Profit after tax 59 83
EWM

EAAA(Alternatives)
EAMC(Mutual Fund)
Equity (INR Cr)
21 160
AUM (INR Cr)
29,500 44,000
Net New Money (INR Cr)
6,300 14,350
#Retail Folios/Clients
~1,100 ~3.3 Lacs
31
Q2FY21 Key Metrics Business Update
• Mutual Fund :
• Equity YTD Inflows of ~INR 600 Cr againstindustry outflows of ~INR 9,000 Cr
• Launched an equity passive fund inpartnership with MSCI, the world’s largestindex provider
• Alternative Asset Management:
• Marquee offshore and onshore investors aspartners
• Closed ESOF III, our flagship performing creditfund at ~ INR 6,600 Cr ($ 900 Mn)
• Received investment commitment of ~INR2,650 Cr ($ 350 Mn) from Canada’s largestpension plan – Ontario Teachers in Q2FY21
EAM
Edelweiss Asset Management : EAAA and EAMC

32
EAM
Business Performance Snapshot : EAAA and EAMC
(INR Cr)
EAMC (Mutual Fund) EAAA (Alternatives)
Q1FY21 Q2FY21 Q1FY21 Q2FY21
AUM 29,400 44,000 23,400 29,500
EOP Equity 159 160 20 21
Net Revenues 25 27 36 35
Operating costs 23 25 33 34
Profit before tax 2 1 3 2
Profit after tax 2 1 3 2

Equity (INR Cr) 2,123
AUM (INR Cr) 42,400
Recoveries (INR Cr) 965
Net D/E 1.7x
CAPAD 34.0%
Asset Reconstruction : Edelweiss Asset Reconstruction
Company Ltd
33
Q2FY21 Key Metrics Business Update
• Strong recoveries despite current market
environment
• Recoveries at INR 965 Cr in Q2FY21 against INR 827Cr in Q2FY20
• Minimal impact of non-operational NCLT asrestructuring accounts formed 36% of theresolution strategy mix
• Fee income remains robust
• Comfortable liquidity position of ~INR 670 Cr as on
Sept’20
• Well matched ALM across all durations
EARC

Business Performance Snapshot : Edelweiss Asset
Reconstruction
34
EARC (INR Cr) Q1FY21 Q2FY21
AUM 43,100 42,400
EOP Capital Employed 5,439 5,262
EOP Equity 2,007 2,123
Gross Revenues 213 215
Net Revenues 77 84
Operating costs 17 22
Profit before tax 54 63
Profit after tax 40 46
EARC

Equity (INR Cr) 625
Individual APE (INR Cr) 93
Policyholder’s AUM (INR Cr)
3,162
Solvency Ratio 216%
13th Month Overall Persistency
75%
Life Insurance : Edelweiss Tokio Life Insurance
Company Ltd
35
Q2FY21 Key Metrics Business Update
• Amongst only 2 companies to have registeredIndividual APE growth every month in H1FY21
• Dominant share of Traditional Par and Non-Par at~84%
• Strong channel mix: 75% is contributed by channelslike agency, direct to client and through Edelweissentities
• Launched new product "Active Income Plan“ inQ2FY21
• Focused efforts have resulted in healthy claimssettlement at 90% in H1FY21
• Edelweiss Tokio Life Wealth Secure Plus:
• Ranked No. 1 in CRISIL Online ULIP rankings
• Product Innovation Company of the Year by IndiaInsurance Summit 2020
• Embedded Value as on 30th Sept’20 at INR 1,253 Cr
ETLI

Business Performance Snapshot : Edelweiss Tokio Life
Insurance Company Ltd
36
ETLI (INR Cr) Q1FY21 Q2FY21
Net Premium Income 154 276
Investment Income & Other Income 195 121
Total Business 349 397
Profit After Tax (68) (58)
Minority (33) (29)
Edelweiss’ Share in PAT (35) (30)
ETLI

37
Individual APE CAGR Since FY16 vs Industry Outpaced Industry growth YoY during the quarter
29%
9%
13%
Edelweiss TokioLife Insurance
Peer Set Industry
10%
-19%
0%
Edelweiss TokioLife Insurance
Peer Set Industry
ETLI
Among The Fastest Growing In The Industry

Equity (INR Cr) 109
GWP (INR Cr) 59
Solvency Ratio 202%
#Policies Issued in Q2FY21
54,494
General Insurance : Edelweiss General Insurance
Company Ltd
38
Q2FY21 Key Metrics Business Update
• Fastest growing player in the industry in H1FY21
• Serviced 59% motor claims through the BOLT app in
H1FY21
• First Insurer to open its stack to partners and developers
realizing aspiration of Open API gateway
• Enhanced focus on building technology capabilities
• Development of innovative products through Sandbox 2.0
• Accelerated pace of buildout of digital motor and health
platforms
EGIC

Fastest Growing Player In The Industry Enabled By
Digital Model
39
Robust growth in GDPI in H1FY21
83%
2%
Edelweiss GeneralInsurance
Industry
Strong performance in Retail Lines compared to the Industry in H1FY21
187%
398%
-13%
28%
Motor Retail Health
Edelweiss General Insurance Industry
EGIC

Balance Sheet Highlights

41
8,800 8,400
10,300
8,150
4,700
6,600
Q1FY20 Q2FY20 Q3FY20 Q4FY20 Q1FY21 Q2FY21
Liquidity Position Has Improved
Available Liquidity (INR Cr) % of Borrowings
22% 22% 28% 24% 15% 21%

42
Particulars (INR Cr) Oct’20-Mar’21 Apr’21-Sep’21
Opening Available Liquidity (A) 6,600 6,100
Inflows
Contractual Inflows 3,600 3,300
Covid-related impact (600) -
Fresh Borrowings 2,500 2,500
Asset Sell downs 1,500 1,000
Total Inflows (B) 7,000 6,800
Outflows
Repayments 5,700 5,300
Disbursements 1,800 2,100
Total Outflows (C) 7,500 7,400
Closing Available Liquidity (A+B-C) 6,100 5,500
Liquidity & Cash Flow Plan

43%
27%
8%
22%
Banks Retail MF PF, Insurance & FIs
63%35%
2%
Loans & OD NCDs CPs
Borrowing Profile Is Well Diversified
43
Borrowing Profile by SourceBorrowing Profile by Instruments
INR 30,845 Cr INR 30,845 Cr
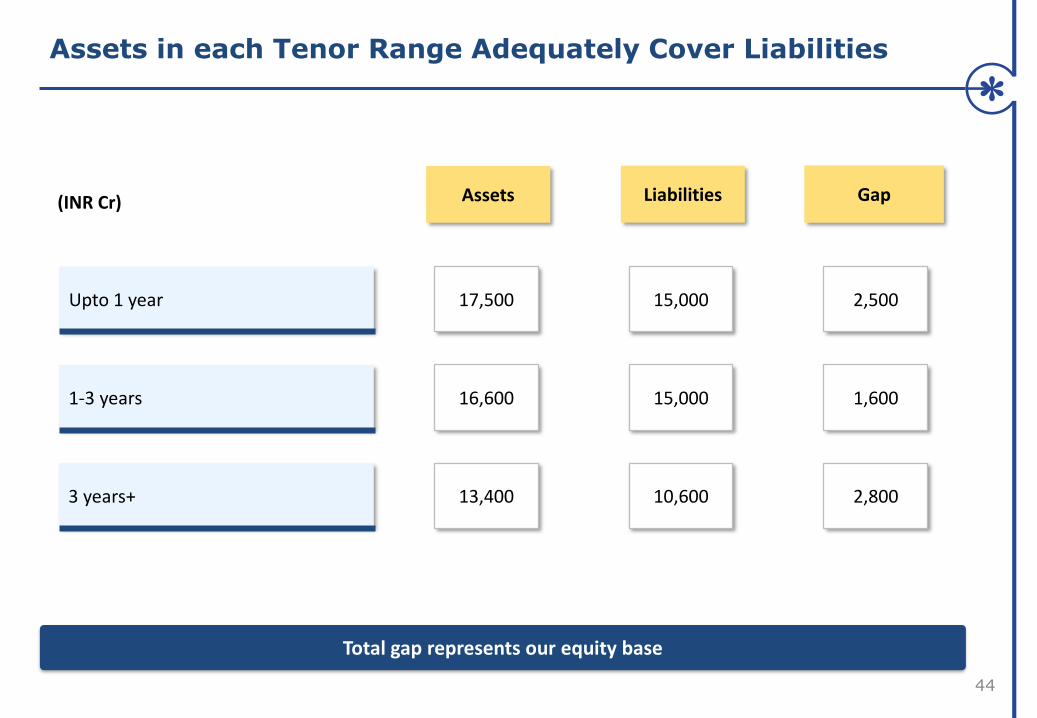
Assets in each Tenor Range Adequately Cover Liabilities
44
Upto 1 year 17,500
1-3 years 16,600
3 years+ 13,400
Assets Liabilities
15,000
15,000
10,600
Gap
2,500
1,600
2,800
Total gap represents our equity base
(INR Cr)

Organisation. Governance. Sustainability

Prudent Risk Management and Responsible Growth
46
Technology Risk
Operational & Process Risk
People Risk Fraud RiskPhysical
Infrastructure Risk
Credit Risk Liquidity Risk Market Risk Regulatory Risk
Business RiskReputational
Risk
Enterprise risk management approach: 11 Risk Framework

12 Member Board Comprises Majority of Independent Directors
47
Dr. Ashima GoyalIndependent Director
• Professor at Indira Gandhi Institute of Development Research• Specialist in open economy macroeconomics, international
finance, institutional and development economics• Serves as a Part-time member of Economic Advisory Council to the
Prime Minister
Mr. K ChinniahIndependent Director
• Served as Managing Director & Global Head Infrastructure, Portfolio, Strategy & Risk Group with GIC Special Investments
Mr. P N VenkatachalamIndependent Director
• Banking sector expert and former member of the Interim Pension Fund Regulatory Authority of India
• Former MD, State Bank of India
Mr. Navtej S. Nandra Independent Director
• Served as President of E*TRADE Financial Corporation.
• Prior to this he served as CEO for Morgan Stanley Investment Mgmt Inc. and COO for Wealth Management at Merrill Lynch
Mr. Berjis DesaiIndependent Director
• An independent legal counsel engaged in private client practice.
• Retired as Managing Partner at J. Sagar & Associates
Mr. Biswamohan MahapatraIndependent Director
• Former RBI Executive Director, chaired various committees of RBI
• Handled varied areas of banking regulations, policy and supervision
Mr. Ashok KiniIndependent Director
• Former Managing Director (National Banking Group) State Bank of India
• Served as an advisor to the Thorat Committee on Financial Inclusion at RBI
• 35 years of banking experience
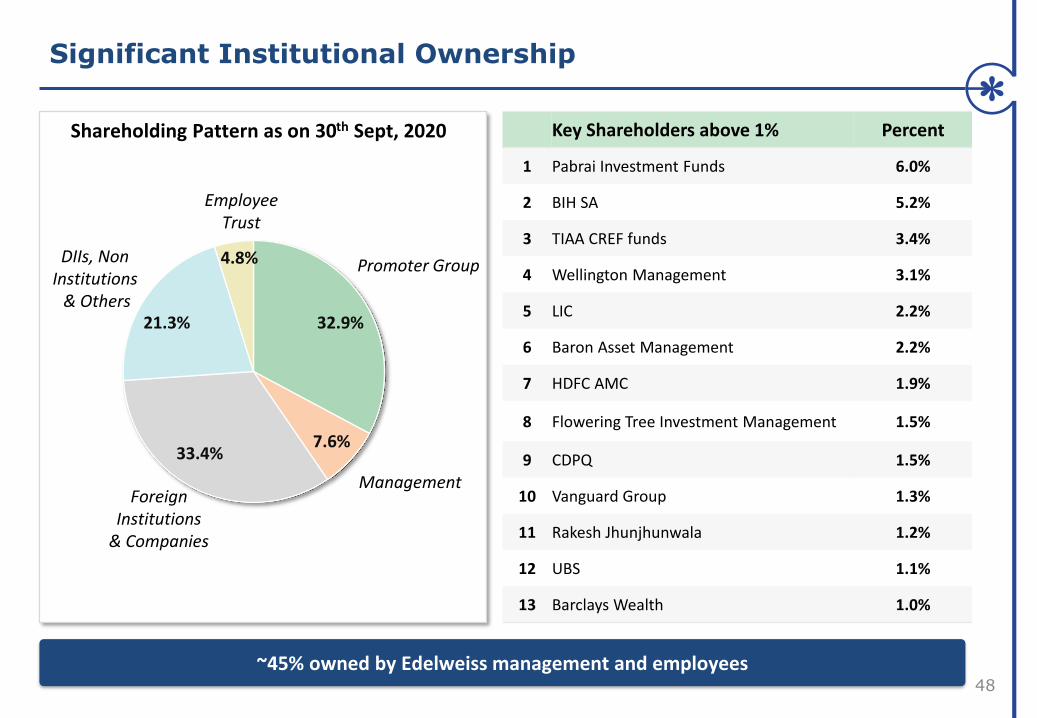
Significant Institutional Ownership
48
32.9%
7.6%33.4%
21.3%
4.8%
Foreign Institutions
& Companies
Promoter Group DIIs, Non Institutions
& Others
Employee Trust
Shareholding Pattern as on 30th Sept, 2020 Key Shareholders above 1% Percent
1 Pabrai Investment Funds 6.0%
2 BIH SA 5.2%
3 TIAA CREF funds 3.4%
4 Wellington Management 3.1%
5 LIC 2.2%
6 Baron Asset Management 2.2%
7 HDFC AMC 1.9%
8 Flowering Tree Investment Management 1.5%
9 CDPQ 1.5%
10 Vanguard Group 1.3%
11 Rakesh Jhunjhunwala 1.2%
12 UBS 1.1%
13 Barclays Wealth 1.0%
Management
~45% owned by Edelweiss management and employees

Our Sustainability Efforts
4949
111 Districts across 14 States
INR 54.74 Cr *committed
44NGO Partners
71Active Grants
51Co-funded Grants
EdelGive Foundation’s commitment to Achieving the SDGs (Cumulative till date)
Quality EducationSustainable Livelihoods
Women Empowerment
INR 8.6 Cr* INR 23.69 Cr* INR 63 lakhs*
18.41 lakh Children supported
More than 69,000 Teaching professionals trained
18,482 Schools
1,248 acres of irrigated land
12,063 Individuals trained
241 Watershed Structures Repaired/Built
8 FPO/FPC Strengthened
More than 1.70 lakh women supported
5,825 Grassroot leaders developed
Employee Engagement
(Cumulative till date)
• ~ 80% Edelweiss Employees Engaged
• ~ 40,400 Man-hours of volunteering
• 78 skilled volunteering projects
* H1FY21 Commitments

EdelGive Funding Partners & Networks
50
We have partnered with some of the largest Foundations, Corporates and HNIs through our innovative models focused on collaboration

Safe Harbour
51
DISCLAIMER :This presentation and the discussion may contain certain words or phrases that are forward - looking statements, which aretentative, based on current expectations of the management of Edelweiss Financial Services Ltd. or any of its subsidiaries andassociate companies (“Edelweiss”). Actual results may vary from the forward-looking statements contained in this presentationsdue to various risks and uncertainties. These risks and uncertainties include the effect of economic and political conditions in Indiaand outside India, volatility in interest rates and in the securities market, new regulations and Government policies that mayimpact the businesses of Edelweiss as well as the ability to implement its strategy. The information contained herein is as of thedate referenced and Edelweiss does not undertake any obligation to update these statements. Edelweiss has obtained all marketdata and other information from sources believed to be reliable or are its internal estimates unless otherwise stated, although itsaccuracy or completeness can not be guaranteed. Some part of the presentation relating to business wise financial performance,ex-insurance numbers, balance sheet, asset books of Edelweiss and industry data herein is reclassified/regrouped based onManagement estimates and may not directly correspond to published data. The numbers have also been rounded off in theinterest of easier understanding. Numbers have been re-casted, wherever required. Prior period figures have beenregrouped/reclassified wherever necessary. FY18, FY19, FY20 and FY21 Numbers are as per IndAS whereas the rest are as perIGAAP. All information in this presentation has been prepared solely by the company and has not been independently verified byanyone else.This presentation is for information purposes only and does not constitute an offer or recommendation to buy or sell anysecurities of Edelweiss. This presentation also does not constitute an offer or recommendation to buy or sell any financialproducts offered by Edelweiss. Any action taken by you on the basis of the information contained herein is your responsibilityalone and Edelweiss or its directors or employees will not be liable in any manner for the consequences of such action taken byyou. Edelweiss and/or its directors and/or its employees may have interests or positions, financial or otherwise, in the securitiesmentioned in this presentation.
Edelweiss Financial Services Limited Corporate Identity Number: L99999MH1995PLC094641For more information, please visit www.edelweissfin.com

Safe Harbour
52
NOTES:
Slide 4,5 & 6 : Net worth is including MI and includes investment in equity convertible instrument by CDPQ of INR 1,040 Cr, Kora Management of INR 177 Cr and Sanaka Capital of INR 117 Cr
Slide 4,6,11, 28,29,30 : Customer Assets, AUM and AUA are rounded off to nearest 100
Slide 5 & 6 : Business Equity numbers are after inter company eliminations within respective businesses
Slide 10 : ESOF II deployment is calculated as gross drawn down as a % of committed capital
Slide 14 & 32 : EAAA numbers represent consolidated numbers of Edelweiss Alternative Assets Advisors Limited, EAAA LLC, Edelweiss Alternative Assets Advisors Pte.Limited
Slide 14 : PAT numbers are after inter company eliminations within respective businesses
Slide 18,41 & 43 : Borrowings are excluding CBLO & CCDs & excludes accrued interest
Slide 22 & 23 : Equity includes CDPQ investment of INR 1,040 Cr in CCD
Slide 23,25&26 : NNPA is calculated as per Honorable SC order of NPA classification
Slide 23 & 26 : Calculated NIM is normalized after excluding one-offs for the quarter
Slide 28 & 30 : Equity includes Kora Management and Sanaka Capital investment of INR 294 Cr in equity convertible instrument
Slide 31 & 32 : AUA are rounded off to nearest 100
Slide 35 & 37 : Source for growth calculation is Life Insurance Council
Slide 35: 13th Month Overall Persistency (on Premium Basis) includes policies issued from Apr to Aug 2019; EV is calculated on market consistent basis; Policyholder’s AUM is calculated in accordance with Ind AS
Slide 39 : Source: General Insurance Council and Market Information
Slide 41 & 42 : Available Liquidity is calculated as on balance sheet liquidity, liquid able assets and undrawn bank lines
Slide 42 : Numbers are based on management estimates and rounded off to nearest 100
Slide 44 : Numbers are based on management estimates & 3 years+ liabilities exclude Equity; Assets and Liabilities do not include insurance and client funds in broking
Slide 48 : Key institutional shareholders: Holding of known affiliates have been clubbed together for the purpose of this information