edc company presentation january 2015 - … leyte-samar. •the island sub-grids are interconnected...
TRANSCRIPT

EDC COMPANY PRESENTATIONJANUARY 2015


This presentation contains certain “forward looking statements.” These forward looking statements include words or phrases such as EDCor its management “believes”, “expects”, “anticipates”, “intends”, “plans”, “foresees”, or other words or phrases of similar import. Similarly,statements that describe EDC’s objectives, plans or goals also are forward-looking statements. All such forward looking statements aresubject to certain risks and uncertainties that could cause actual results to differ materially from those contemplated by the relevantforward-looking statement. Such forward looking statements are made based on management’s current expectations or beliefs as well asassumptions made by, and information currently available to, management. EDC does not make expressed or implied representations orwarranties as to the accuracy and completeness of the information contained herein and shall not accept any responsibility or liability(including any third party liability) for any loss or damage, whether or not arising from any error or omission in compiling such information oras a result of any party’s reliance or use of such information. The information and opinions in this presentation are subject to change withoutnotice.
This presentation does not constitute a prospectus or other offering memorandum in whole or in part. Information contained in thispresentation is a summary only and is prepared for discussion purposes and is not a complete record of the discussions. This presentationshall not constitute an offer to sell or the solicitation of an offer to buy any security. There shall be no sale of these securities in any state orjurisdiction in which such offer, solicitation or sale would be unlawful prior to qualification under securities laws of such state or jurisdiction.By receiving this presentation, each investor is deemed to represent that it is a sophisticated investor and possesses sufficient investmentexpertise to understand the risks involved. Prospective investors should undertake their own assessment with regard to their investmentand they should obtain independent advice on any such investment’s suitability, inherent risks and merits and any tax, legal and accountingimplications which it may have for them.
DISCLAIMER


TABLE OF CONTENTS
Key Investment Highlights
Review of YTD 9M 2014 Financial Results
Growth Projects
Power Industry Overview8 Power Industry Restructuring, 9 Grid Profile
12 Investment Summary, 13 Domaine Expertise, 14 Cornerstone investors, 15 Contract-based
Cash Flows, 16 Track Record for Growth, 17 Favorable Industry Dynamics, 18 Financial and
Operating Results, 19 Credit Profile
22 2014 Strategic Objectives, 23 Growth Agenda, 24 Domestic Expansion, 25 Indonesia
Expansion, 26 Latin America Expansion, 27Mariposa Prospect
30 9M 2014 Significant Events, 31 Consolidated Recurring Net Income


POWER INDUSTRY OVERVIEW

8 Power Industry Overview
INDUSTRY RESTRUCTURING USHERED IN COMPETITION, AS IT ALSO MOBILIZED PRIVATE SECTOR INVESTMENTS
Customers
NPC
Distributors
Pre-EPIRA
Customers
GENCO
TRANSCO
DUs
Suppliers
Post-EPIRA
• Prior to the EPIRA, the industry was composed of NPC and the distribution utilities, e.g., Meralco, VECO, Davao Light and Power Company.
• NPC, at that time, controlled approximately 90% of the country‘s installed generating capacity and performed generation and transmission functions.
• Today, the industry has transitioned into four sectors — the deregulated generation and supply sectors and the regulated transmission and distribution sectors.

9 Power Industry Overview
Luzon54,820 73%
Visayas11,100 15%
Mindanao9,347 12%
Geothermal9,605 13%
Coal32,081 43%
Natural Gas18,791 25%
Hydro10,019 13%
Oil Based4,491 6%
New Re279 0%
2013 GROSS POWER GENERATION, BY PLANT TYPE
EDC IS STRATEGICALLY POSITIONED WITH 64% OF ITS CAPACITY SITUATED IN THE VISAYAS
In Luzon
• Bulk of generation sources are located in the northern and southern parts ofthe Island while the load center is in the Metro Manila area.
• Posted an AACGR of 3.29% for the period 2001-2013.
• Grid is divided into five island sub-grids: Panay, Negros, Cebu, Boholand Leyte-Samar.
• The island sub-grids are interconnected by submarine cables: Leyte-Cebu (2x185 MW), Cebu-Negros (2x90 MW), Negros-Panay (1x85MW) and Leyte-Bohol (1x90 MW). These cables also provide thecapability of sharing excess generation between islands toaccommodate the Visayas’ growing demand.
• Posted an AACGR of 5.90% for 2001-2013, the highest among thethree Grids. The fastest demand expansion has been recorded in DUsin Panay, Cebu and Bohol.
• In 2010, Visayas registered its highest single year increase in demandlevels equivalent to 15.3% growth).
In Visayas
• Grid is composed of six districts with bulk of power generated in thenorthern part of the island and the load centers situated in the southeast(Davao provinces) and southwest (SOCKSARGEN) regions. Power demandfrom these areas account for ~50% of island’s total.
• Posted an AACGR of 3.28% for 2001-2013.
2013 GROSS POWER GENERATION, BY GRID
In Mindanao
VISAYAS GRID REGISTERED THE HIGHEST GROWTH RATE IN DEMAND FOLLOWED BY LUZON AND MINDANAO


KEY INVESTMENT HIGHLIGHTS

12 Key Investment Highlights
TOP REASONS FOR BUYING INTO EDC -- A DIVERSIFIED RENEWABLE ENERGY POWER COMPANY, NOW GOING GLOBAL
100%Successfullyacquired power plants inside its geothermal concessions
1 of 11 light bulbs
EDC accounts for 9% of country’s electricity production
Largest vertically integrated geothermal company globally
DomaineExpertise
Contract-based Cash Flows
Track Record of Growth
Favorable Industry Dynamics
Strong Credit & Investment Profile
Into geothermal, hydro & wind and now diversifying into solar energy
YEAR
2031Concession agreements
start expiring
13
RE Act of 2008Provides
regulatory support
10% Income Tax 7-year ITH Feed-in-Tariff (FIT)
Geothermal is
11% of Installed capacity
YTD 3Q’14 Highlights
RevenuesPhp23.0 billon
RNIPhp8.0 billion
EBITDA (TTM)
Php17.2 billion
Revenue derived
from contract tenors of greater than 6 years
64%
92%Revenue derived from
long-term contract agreements
Concessions acquired in Chile & Peru
Managing Financial Risks
Interest rate on
81% of loans are
fixed
44% of revenues
are US$ indexed
4.9 yrs. loan life
6.6% Interest cost
Geothermal provides
13%of electricity production

13 Key Investment Highlights
Domaine Expertise
1
1
1
1
2
3
3
TECHNOLOGY & GEOGRAPHICALLY DIVERSE
125.0MW232.5MW180.0MW
50.9MW
Upper MahiaoMalitbogMahanagdongOptimization
2
3 112.5MW60.0MW
Palinpinon IPalinpinon II*
112.5MW Tongonan
52.0MW54.0MW
Mindanao IMindanao II
110.0MW20.0MW
Bacman IBacman II
120.0MW12.0MW
PantabanganMasiway
150.0MW Burgos
1
1
1
1
3
Note: *20 MW Nasuji Power Plant placed on preservation
1,441 MW1,159MWGeothermal
150MWWind132MWHydro
% share7% of Installed Capacity9% of Electricity Produced
EDCAT A
GLANCE
49.4MW Nasulo22
COMPANYCAPACITY (in MW)
STEAM PLANT
1 EDC 1,159 1,159
2 Comision Federal de Electricidad 958 958
3 Enel Green Power 915 915
4 Chevron 1,329 887 *
5 Ormat 689 749
Source: Bertani, Ruggero, 2010: Geothermal Power Generation in the World 2005-2010 Update Report
Note: * Not included is the 442 MW operated by the Indonesian Government through PLN
TOP 5 GEOTHERMAL COMPANIES
LARGEST VERTICALLY INTEGRATED GEOTHERMAL COMPANY GLOBALLY
Wind
Hydro
Geothermal (EDC Subsidiary)
Geothermal (Integrated)

14 Key Investment Highlights
Contract-based Cash Flows
GENERATES CASHFLOWS AT BOTH PARENT AND SUBSIDIARY LEVELS
First Gen Hydro Power Corporation (FGHPC)
120.0 MW Pantabangan12.0 MW Masiway
60%
EDC Wind Energy Holdings Inc.
100%
EDC Hong Kong Limited
100%
EDC Geothermal Corporation (EGC)
100%
172.5 MW Palinpinon (2)
112.5 MW Tongonan
Green Core Geothermal Inc. (GCGI)
100%
110.0 MW Bac-Man I20.0 MW Bac-Man II
Bac-Man Geothermal Inc. (BGI)
100%
(1)
• 743.8 MW Power Plants 588.4 MW Unified Leyte
Power Project 106.0 MW Mindanao Power
Project 49.4 MW Nasulo Power
Project
(1) Formerly First Luzon Geothermal Energy Corporation (FLGEC)(2) 20 MW Nasuji Power Plant to be placed in preservation
Lopez Group IFC GIC Public
E: 50.18 % V: 50.59%E: 1.69 % V: 1.12 % V: 3.33 %E: 4.99 % V: 44.96 %E: 43.14 %
EDC Burgos Wind Power Corp. (EBWPC)
150.0 MW Burgos(Under Development)
International Expansion
• Chile• Peru• Indonesia
100% 95/100%EDC
Parent(3)
3,290 31%
EGC6,640 63%
FGHPC614 6%
EDC Parent (3)
5,801 59%EGC
7,391 75%
FGHPC1,084 11%
EDC Parent (3)
6,646 44%
EGC 7,294 48%
FGHPC1,465 6%
(2) All figures in PHP millions as of Sept. 30, 2014(3) EDC Parent figures include the Company’s other subsidiaries
22,982
EBITDA (2) as of Sept. 2014
14,275
Net Income (2) as of Sept. 2014
10,544
Revenues (2) as of Sept. 2014

15 Key Investment Highlights
Contract-based Cash Flows
WESM, 1,909
NGCP, 593
DU, 10,370
NPC, 10,111
SPOT8%
1-2 YRS21%
3-5 YRS7%
>6 YRS64%
22,983
LIMITED EXPOSURE TO VOLATILE SPOT MARKET
LONG-TERM CONTRACTUAL AGREEMENTS
(1) Consolidated revenues as of Sept. 30, 2014
TERM STRUCTURE OF CONTRACTS(1)
In PHP Millions
2031Geothermal Renewable Energy Service Contract
CO
NC
ESSI
ON
Power Purchase Agreements (sovereign)
Power Supply Agreements (commercial)ELEC
TRIC
ITY 2022/24
2022
SPOT 1-2 YRS 3-5 YRS >6 YRS
WESM 8% - - -NGCP - 3% - -DU - 18% 7% 20%NPC - - - 44%
2031year concession agreements start expiring
92%revenue from long-term contracts 64%
revenue from contract tenors of >6 yrs 45%
expanded revenue base from non-NPC clients

16 Key Investment Highlights
Track Record of Growth
• Limited to steam field operations
19,007
25,656
10,324 15,641
8,768
5,633
(+) 125.0 MW
Upper Mahiao
(+) 49.4 MW
N. Negros
(+) 463.4 MW
Mahanagdong,Malitbog, and Optimization
(+) 132.0 MW
Pantabangan– Masiway
• Acquired geothermal concessions overseas
(-) 49.4 MW
N. Negros
(-) 20.0 MW
Botong
(+) 150.0 MW
Bac-Man I & II
(+) 106.0 MW
Mindanao I & II
(+) 305.0 MW
Palinpinon & Tongonan
SIGNIFICANT PORTFOLIO EXPANSION SINCE PRIVATIZATION
STEAMFIELD OPERATOR STEAMFIELD AND POWER PLANT OPERATOR
2007 2008 2009 2010 2011 201220061976 - 2005
current (MW) 0 125 512.8 132 411 150 (69.4) 0 0 20
cum. (MW) 0 125 637.8 769.8 1,180.8 1,330.8 1,261.4 1,261.4 1,261.4 1,281.4
2007-2013 (CAGR)
Revenues 5.1%EBITDA 7.2%Net Income 7.1%
2013 2014
(+) 49.4 MW
Nasulo
(-) 20.0 MW
Nasuji

17 Key Investment Highlights
Favorable Industry Dynamics
2013 POWER STATISTICS OF THE PHILIPPINES
Source: DOE
Geothermal11%
Coal32%
Natural Gas17%
Hydro20%
Oil Based19%
New Re1%
Geothermal9,605 13%
Coal32,081 43%
Natural Gas18,791 25%
Hydro10,019 13%
Oil Based4,491 6%
New Re279 0%
11%Geothermalas a % of Installed Capacity 13%
Geothermal as a % of Electricity Production
Fuel TypeInstalled
Capacity (MW)
Coal 5,568
Hydro 3,521
Oil-based 3,353
Geothermal 1,868
Natural Gas 2,862
New RE 153
Total 17,325
GEOTHERMAL ENERGY IS A STRATEGIC ENERGY RESOURCE FOR THE PHILIPPINES
PRINCIPAL TAX BENEFITS
PRIMARY REVENUE & COST INCENTIVES
o Income Tax Holiday (“ITH”)─ 7-year ITH from
start of commercial operation
o 10% - Corporate income tax rateNote: Subject to guidelines on pass-on savings for existing operations
o Carbon credits tax exemption
o Income Tax Holiday (“ITH”)─ 6 years under
Pioneer Status─ Plus one year bonus
o 30% - Corporate income tax rate
o Tax on carbon credits─ 30% income tax and
0% VAT
PR
EVIO
US
NO
W
o Royalties─ Steam:
Government share is 1.5% of gross margins
o 0% duties for Imported materials & equipment
o Net operating loss carryover (“NOLCO”): 3 years
o Royalties─ Steam: Government
share is 60% of net proceeds
o 0% duties for Imported materials & equipment
o Net operating loss carryover (“NOLCO”): 3 years
OTHER KEY INCENTIVES
o Feed-in tariff(1)
o Renewable Portfolio Standard(2)
o Green Energy Option(3)
(1) Feed-in Tariff - A policy designed to accelerate investment in renewable energy technologies by offering long-term contracts to renewable energy producers.
(2) Renewable Portfolio Standard - A market-based policy which requires electricity suppliers to source an agreed portion of their energy supply from eligible renewable energy resources.
(3) Green Energy Option - A mechanism that empowers end-users to choose renewable energy in meeting their energy requirements.
RENEWABLE ENERGY ACT OF 2008
18 Key Investment Highlights
Strong Credit & Investment Profile
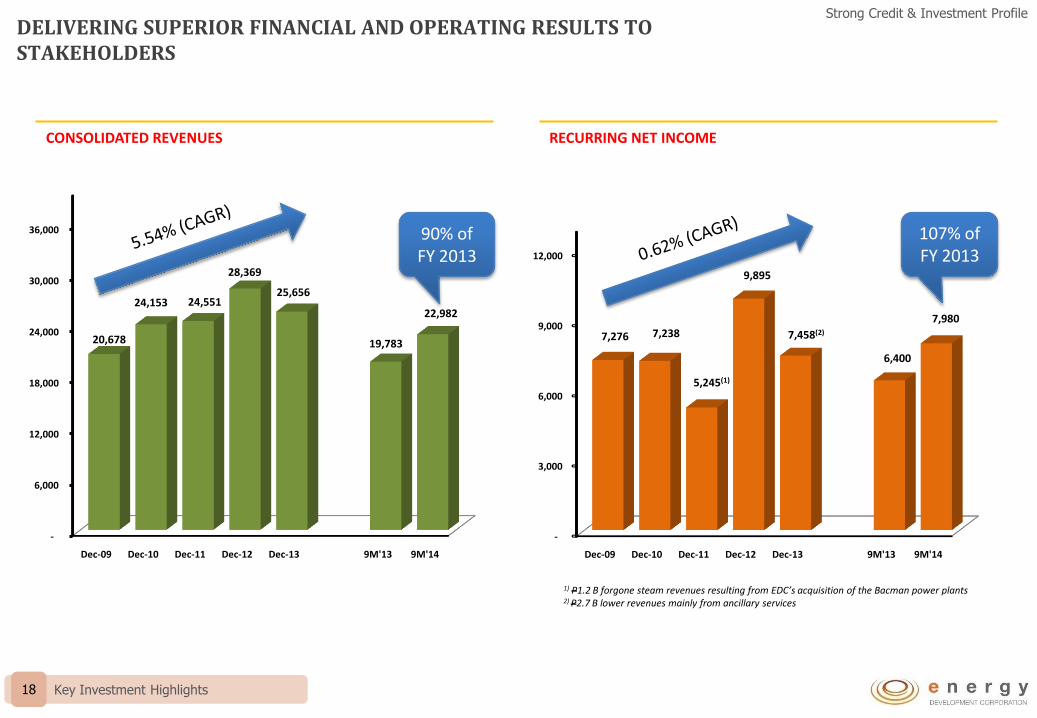
DELIVERING SUPERIOR FINANCIAL AND OPERATING RESULTS TO STAKEHOLDERS
-
3,000
6,000
9,000
12,000
Dec-09 Dec-10 Dec-11 Dec-12 Dec-13 9M'13 9M'14
7,276 7,238
5,245(1)
9,895
7,458(2)
6,400
7,980
RECURRING NET INCOME
-
6,000
12,000
18,000
24,000
30,000
36,000
Dec-09 Dec-10 Dec-11 Dec-12 Dec-13 9M'13 9M'14
20,678
24,153 24,551
28,369
25,656
19,783
22,982
CONSOLIDATED REVENUES
1) P1.2 B forgone steam revenues resulting from EDC’s acquisition of the Bacman power plants2) P2.7 B lower revenues mainly from ancillary services
90% of FY 2013
107% of FY 2013

19 Key Investment Highlights
Strong Credit & Investment Profile
MAINTAINING A ROBUST CREDIT PROFILE (1)
9M '14
9M '13
Dec-13
Dec-12
Dec-11
Dec-10
2.95x 2.26x
2.72x 2.17x
2.95x
2.56x
9M' 14
9M' 13
Dec-13
Dec-12
Dec-11
Dec-10
2.20x
1.58x
2.06x
3.24x
2.14x
2.51x
9M' 14
9M' 13
Dec-13
Dec-12
Dec-11
Dec-10
PHP 34.57
PHP 29.82
PHP 33.71
PHP 29.84
PHP 29.30
PHP 26.47
9M' 14
9M' 13
Dec-13
Dec-12
Dec-11
Dec-10
0.98x
1.03x
1.17x
1.06x
1.32x
1.09x
9M' 14
9M' 13
Dec-13
Dec-12
Dec-11
Dec-10
0.29x
0.37x
0.43x
0.30x
0.33x
0.32x
Notes:(1) Figures computed on a consolidated basis ending Sept. 30, 2014(2) EBITDA = Earnings Before Interest, Taxes, Depreciation, and Amortization,
Trailing 12 months(3) Debt Service Coverage Ratio = Net Cashflow from Operating Activities / (Short
Term Debt + Long Term Debt + Projected Interest Service for the next 12months)
(4) PHP Million per MW
NET DEBT TO MARKET CAPITALIZATION
Deteriorated with increase in price per share
NET DEBT TO EQUITY
Allows for additional fund raising
NET DEBT TO EBITDA (2)
Well within our targeted 3.6x
NET DEBT PER MW POWER (4)
Increased with the pre-funding of Burgos Project
DEBT SERVICE COVERAGE RATIO (3)
Higher than the minimum covenanted 1.2x
1.2x
3.6x


GROWTH PROJECTS

22 Growth Projects
Bacman
EDC SUCCESSFULLY DELIVERED ON ITS 2014 STRATEGIC OBJECTIVES
Nasulo Burgos
OUTPUT 968 GWH
REVENUES Php4.8 B
130.0 MW Bacman geothermal plants have returned to service
OUTPUT 382 GWH
REVENUES Php2.0 B
OUTPUT 326 GWH
REVENUES Php2.8 B
49.4 MW Nasulo geothermal plant declares commercial operations on July 2014
150.0 MW Burgos wind obtains DOE’s Certificate of Endorsement (COE) for FIT Eligibility

23 Growth Projects
EDC’S GROWTH AGENDA
305 MW Palinpinon-Tongonan acquired in 2009
130 MW Bacmanacquired in 2010
• Bid for Unified Leyte IPPA in 2014
Bid for Mindanao 1 & 2 IPPA in 2014
150 MW Burgos Wind commissioned in 4Q’14
• Wind measurement studies is on-going in 9 other concessions
• Potential 4MW solar
Granted 13 concessions & 19 pending applications in Chile & Peru
Established local offices in LatAm and Indonesia
• Drill wells in Mariposa, Chile by 2015
• Continue to prospect prime geo sites
1 2
3 4
ACQUIRE DEVELOP
CONQUERDIVERSIFY
Win key government geothermal privatization projects
Install 261MW of local geothermal capacity to address
new demand
Establish viable operations in
Asia, Latin America, and Africa
Build 200MW of wind capacity, while expandingRE portfolio
49.37 MW Nasulocommissioned in Sept. 2014
• 6 MW NNGP Plant development is on-going
• 100 MW for commissioning by 2018
2014 STATUS

24 Growth Projects
LOCAL GEOTHERMAL PROJECTS WILL BE THE MAIN SOURCE OF GROWTH IN THE MEDIUM TERM
DONE EXECUTIONADVANCED EXPLORATION
RESOURCECONFIRMATION
POWER PLANTRETROFIT
1
1
3
1
1
2 5
4
6
73
PROJECT CAPACITY 2014 2015 2016 2017Beyond
2018
Nasulo* 49 MW X
Burgos Wind 150 MW X
No. Negros 6 MW X
Burgos Solar 4 MW X
Bacman 3** up to 30 MW X
Nasuji up to 20 MW X
Botong-Rangas** up to 40 MW X
Mindanao 3 50 MW X
Pagudpod Wind X
Bacman 10 MW X
Tongonan ~12 MW X
Palinpinon ~12 MW X
Kayabon 50 MW X
Dauin 40 MW X
2
3
4
5
6
7
FRONTIER AREAS (GEOTHERMAL)
Mandalangan, Negros Occidental
Lakewood, Zamboanga del Sur
Ampiro, Misamis Occidental
Balingasag, Misamis Oriental
Mt. Zion, North Cotabato
Note: *20 MW Nasuji Power Plant placed on preservation**Resource sustainability assessment is on-going
2
2
2
1
1
1
2
3
1
4
4
FRONTIER AREAS (WIND)
Bayog I (Burgos I)
Pagali (Burgos II)
Iloilo 1
Iloilo 2
Matnog 1
Matnog 2
Matnog 3
Negros
1
2
21

25 Growth Projects
OVERSEAS EXPANSION - INDONESIA
GRAHO NYABU GEOTHERMAL PROSPECT
Results from EDC’s completed survey activities for Graho Nyabu in Sumatra shall be used by IndonesianMinistry of Energy and Mineral Resources for its upcoming tender of the Graho Nyabu concession
Currently, in partnership discussions with a geothermal concession holder for a JV in one of their geothermalsites (~ 220 MW at an ~ US 1.0 billion development cost)

26 Growth Projects
Company(Entry into LatAm)
Granted Sites Applications
Peru Chile Peru Chile
Alterra Power Corp (2008)
2 2 16 0
Hot Rock Ltd (2008)
5 1 3 12
EDC Applied/Bid Sites (2009)
0 3 4 4
TOTAL 7 6 23 16
EDC SEIZED THE OPPORTUNITY AND NOW HOLDS STAKES IN UP TO 13 CONCESSIONS AND 39 APPLICATIONS

27 Growth Projects
WE ARE NOW EXECUTING AN EXPLORATION DRILLING PROGRAM IN MARIPOSA, ONE OF THE MOST ADVANCED GEOTHERMAL PROJECTS IN CHILE
Exploration DrillingEstimate: USD 30 MM
Target COD
MAP OF THE REGIONGEOTHERMAL RESERVOIR AND
DRILLING TARGETSCIVIL WORKS
Q4 ‘15 Q2 ‘20
Site DevelopmentBudget: USD 15 MM
Q1 ‘14
Base Camp 9 Road Rehab
Drilling Materials
Santiago
Mariposa
ESTIMATES FOR MARIPOSA PUT THE POTENTIAL SIZE OF THE RESERVOIR BETWEEN 50 TO 300 MW


REVIEW OF YTD 9M 2014 FINANCIAL RESULTS

30 Review of YTD 9M 2014 Financial Results
FG Hydro Adjusted FG Hydro revenues using the ERC mandated re-computation of
Nov. and Dec. 2013 billings (P250M)
UL and Palinpinon
Received insurance proceeds for property damage due to Typhoon Yolanda (P379 M) and Typhoon Sendong (P150 M)
NNGP NNGP’s impairment recovery, net of 10% tax (P1,847 million)
Bacman Reported revenues generated by Units 1, 2 &3 (P2,146 million)
Nasulo Reported revenues following declaration of commerciality (P502 M)
Palinpinon Nasuji’s foregone NI due to Nasulo’s operation (P263M)
SIGNIFICANT EVENTS THAT AFFECTED YTD 9M 2014 FINANCIAL RESULTS

31 Review of YTD 9M 2014 Financial Results
6.40
1.49 0.41 0.24 0.10 (0.47) (0.20) (0.17)
RNI, Sept. 2013
BGBUrevenues
partly offset by higher opex
NIGBUNasulo's
commercial operation
LGBUhigher revenues
MAGBUhigher revenues
partly offset by higher opex
FG hydrolower sales,
2013 revenue adj. & higher opex
Othersint'l subs &
Burgos' opex
RNI, Sept. 2014
NCI RNI Attributable
to EDC
CONSOLIDATED RECURRING NET INCOME ATTRIBUTABLE TO EDC UP BY PHP1.6 BILLION
6.4B2013
8.0B2014
In PHP Billions
Consolidated Recurring Net Income (RNI) increased mainly dueto Bacman and Nasulo revenues, partially offset by higheroperating expenses
• BGBU’s revenues increased by P2.1 B, with the commercial operations of Bacman Units 1, 2 and 3 which was partially offset by higher power plant expenses (previously capitalized).
• NIGBU’s (Palinpinon and Nasulo) higher revenues by P0.5 B due to commercial operations of Nasulo.
• MAGBU’s revenues increased due to higher recorded energy sales and theabsence of short fall adjustments partially offset by higher expensesrelated to steamfield workover drilling.
• Partially off-setting the increase are lower revenues from FG Hydro due tothe 2013 WESM adjustment and higher operating expenses.
RNI COMPUTATION 9M 2014 9M 2013
NET INCOME (LOSS) 10,544 5,925
ADD (DEDUCT) NON-RECURRING ITEMS:
Foreign Exchange (gain)/loss 180 901
Reversal of impairment loss (2,053) 0
Capitalized borrowing cost 0 (192)
Capitalized BGI’s cost of testing 0 (401)
Insurance proceeds on property damage due to typhoon Yolanda (529) 0
Gain on sale of PPE (362) 0
Gain on sale of inventory items (120) 0
Write-off of 2006 input VAT claims denied by the Court 0 219
Income tax provision for (benefits from) non-recurring items 254 (70)
Others 66 19
RECURRING NET INCOME 7,980 6,401
RNI+25.0%
7.898.30 8.54 8.64
8.17 7.98
7.987.81

END OF PRESENTATIONwww.energy.com.ph

BACK-UP SLIDES


TABLE OF CONTENTS (Back-up)
Macroeconomics
Philippine Power Industry
Key Investment Highlights
Typhoon Proofing Cooling Tower Units
Growth Projects
Review of YTD 9M 2014 Financial Results
36 Philippines Macro Section, 37 Asean Macro Section
38 Government Issued Regulations, 39 DOE Energy Forecast (Mar-Jun 2015), 40 Luzon-Visayas
Supply-Demand Forecast (2013-2014), 41Mindanao Supply-Demand Forecast (2013-2014)
42 Ranking of Geothermal Companies, 43 Business Model, 44 Operational Statistics, 45Manpower
and Management Team, 46 CSR, 47 Loans Profile, 48 Financial Highlights, 49 Dividend Policy
50 Phases of Implementation, 51 Engineering Solutions, 52 Install Hurricane Grade CTs,
53 Design & Implement 300 kph Solution
54 Burgos Wind Project, 55 Latin America Expansion
56 Revenues, 57 Cash Balance, 58 Financial Ratios

36 Macroeconomics
PHILIPPINES MACRO SECTION
Capital Manila
Population (2Q’14) 99.7 Million
GDP per capita (2013) USD 1,581
GDP Growth (2Q’14) 6.4%
Inflation Rate, Headline(Oct. 2014)
4.3%
Unemployment Rate (July 2014)
6.7%
Credit Ratings BBB - S&PBaa3 - Moody’s
37 Macroeconomics
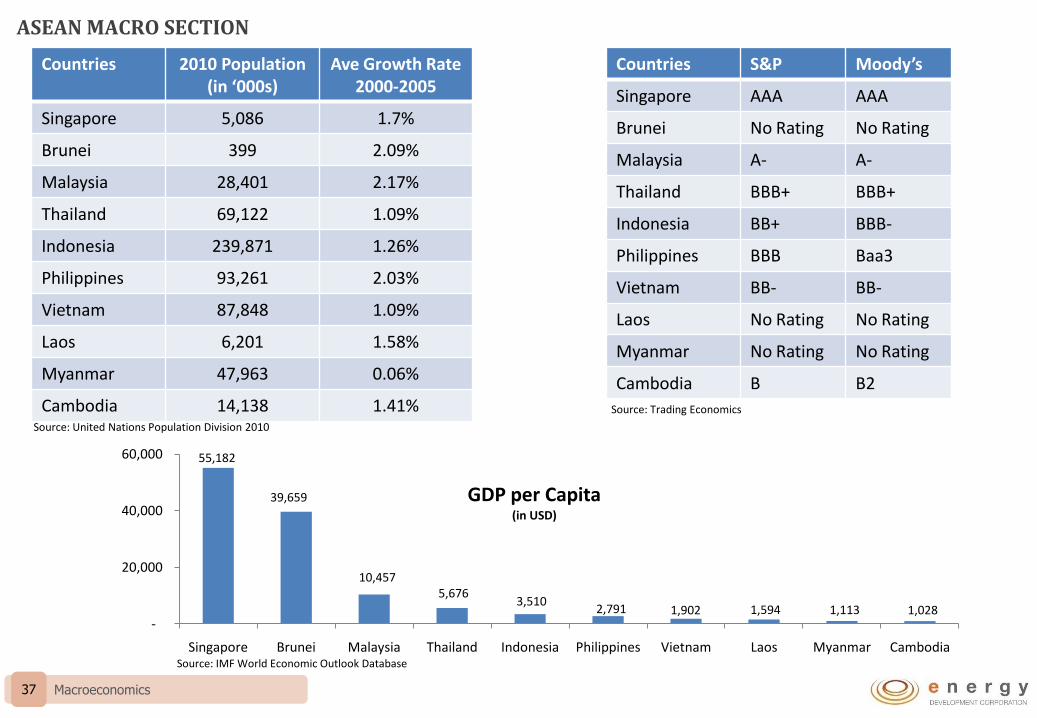
ASEAN MACRO SECTION
55,182
39,659
10,457 5,676
3,510 2,791 1,902 1,594 1,113 1,028
-
20,000
40,000
60,000
Singapore Brunei Malaysia Thailand Indonesia Philippines Vietnam Laos Myanmar Cambodia
GDP per Capita(in USD)
Source: IMF World Economic Outlook Database
Countries S&P Moody’s
Singapore AAA AAA
Brunei No Rating No Rating
Malaysia A- A-
Thailand BBB+ BBB+
Indonesia BB+ BBB-
Philippines BBB Baa3
Vietnam BB- BB-
Laos No Rating No Rating
Myanmar No Rating No Rating
Cambodia B B2
Countries 2010 Population(in ‘000s)
Ave Growth Rate 2000-2005
Singapore 5,086 1.7%
Brunei 399 2.09%
Malaysia 28,401 2.17%
Thailand 69,122 1.09%
Indonesia 239,871 1.26%
Philippines 93,261 2.03%
Vietnam 87,848 1.09%
Laos 6,201 1.58%
Myanmar 47,963 0.06%
Cambodia 14,138 1.41%Source: United Nations Population Division 2010
Source: Trading Economics

38 Philippine Power Industry
SINCE NOVEMBER 2013, THE GOVERNMENT ISSUED NEW REGULATIONS THAT AFFECT EDC PROJECTS
Secondary WESM Price Cap
• SECONDARY OFFER PRICE CAP OF PHP 6.245/KWH WHEN THE 72-HOUR AVERAGE WESM PRICE EXCEEDS PHP8.186/KWH
Revised RCOA1 Rules• LIMITS BUY-SELL OF ELECTRICITY BETWEEN AFFLIATED GENERATIO
COMPANIES, RETAIL ELECTRICITY SUPPLIERS AND END-USER CUSTOMERS AT 50%;• RESTRICTED ISSUANCE OF RES LICENSE
FIT-ALL Provisional Approval
• FIT TARIFFS FOR SELECTED RENEWABLE ENERGY SOURCES• FIT-ALL PROVISIONAL APPROVAL OF PHP 0.04057 PER KWH
(1) Retail Competition and Open Access (RCOA)

39 Philippine Power Industry
DEPARTMENT OF ENERGY FORECASTS ELECTRICITY SHORTAGE BY SUMMER OF 2015
6,000
6,500
7,000
7,500
8,000
8,500
9,000
9,500
10,000
10,500
W-9 Mar
W-10 Mar
W-11 Mar
W-12 Mar
W-13 Mar
W-14 Apr
W-15 Apr
W-16 Apr
W-17 Apr
W-18 May
W-19 May
W-20 May
W-21 May
W-22 Jun
W-23 Jun
W-24 Jun
W-25 Jun
DOE SUPPLY-DEMAND FORECAST MAR-JUN 2015
Available Capacity less FO Average FO
Projeted Demand Regulating Reserve Req't
MW
NOTE: Data sourced from DOE Presentation
W-9 Mar
W-10 Mar
W-11 Mar
W-12 Mar
W-13 Mar
W-14 Apr
W-15 Apr
W-16 Apr
W-17 Apr
W-18 May
W-19 May
W-20 May
W-21 May
W-22 Jun
W-23 Jun
W-24 Jun
W-25 Jun
INTERRUPTIBLE LOAD PROGRAM (ILP)
300 MW PLANT/CONTRACT
FIT
• Mandatory operation of end consumer gensets to unload the grid;
• Additional cost of running gensets will be spread across electricity consumers;
• Total of 438 MW of intending ILP participants as of 9/25/2014.
• Plant purchase/lease of from PHP700 M to PHP2.8 B per 100 MW;
• CAPEX to be subsidized by Malampayafunds.
• Increased FIT allocation for easy- to-set-up power plants like solar.
DOE PROPOSED SEVERAL PLANS TO ADDRESS SHORTAGE

40 Key Investment Highlights
2013 - actual 2014 2015 2016 2017 2018 2019 2020
Reqd Additional Capacity - 236 328 585 1,207 453 1,081 1,177
Committed Capacity 854 1,004 1,834 2,643 2,643 4,047 4,461 4,711
Existing Capacity 11,244 11,244 10,881 10,594 10,594 10,594 10,231 10,594
Peak Demand 9,853 10,216 10,674 11,311 11,820 12,351 12,907 13,488
Peak Demand + Req'd Reserve Margin 12,040 12,484 13,044 13,822 14,444 15,093 15,772 16,482
2,000
4,000
6,000
8,000
10,000
12,000
14,000
16,000
18,000
20,000
22,000
COMMITTED CAPACITIES WILL NOT BE SUFFICIENT TO MEET THE REQUIRED RESERVE MARGIN FOR THE COMBINED LUZON-VISAYAS GRID
Oil-fired plants… 2,691MW, or 18%, of
country’s capacity Php12.52/kwh(est’d
ave tariff)
Sources:1. First Gen’s internal estimates based on
actual data submitted to DOE2. DOE’s list of Existing Power Plants 2013
MW
62% OF THE COUNTRY’S POWER GENERATION CAPACITY IS 15 YEARS OR OLDER. UNEXPECTED OUTAGES IN THE AGING PLANTS COULD LEAD TO HIGH ELECTRICITY PRICES2
Luzon-Visayas Supply-Demand Forecast (2013-2020)1
Peak Demand growth: ~4.8%
110MW Bacman49MW Nasulo
150MW Burgos
194MW Avion196 MW300 MW
5MW135MW
RECalacaNNGPAyala
414MW135MW
76MW
San GabrielAyalaPasuquin
135MW41MW
8MW
PCPCAklanVillasiga
40MW364MW400MW300MW300MW
BacmanPagbilaoQPPLGN PowerToledo
414MW San Gabriel 80
250MW Green Mountain

41 Key Investment Highlights
2013 - actual 2014 2015 2016 2017 2018 2019 2020
Reqd Additional Capacity 346 365 79 - - - - -
Committed Capacity - 43 393 823 886 886 935 935
Existing Capacity 1,282 1,282 1,282 1,282 1,282 1,282 1,282 1,282
Peak Demand 1,332 1,383 1,435 1,490 1,546 1,605 1,666 1,729
Peak Demand + Req'd Reserve Margin 1,628 1,690 1,754 1,821 1,889 1,961 2,036 2,113
700
1,000
1,300
1,600
1,900
2,200
2,500
2,800
3,100
3,400
WITH UNRELIABLE HYDRO CAPACITY, THE MINDANAO GRID IS EXPECTED TO EXPERIENCE TIGHT SUPPLY UNTIL THE COAL CAPACITIES COME IN
Mindanao Supply-Demand Forecast (2013-2020)1
Source:1. First Gen’s internal estimates based on actual data submitted to DOE
Peak Demand growth: 3.8%
MW
35MW Green Power
8MW Minery Cabuhog300MW
50MWTherma SouthMindanao 3
225MW Lanao Hydro
200MW Conal Coal
5MW Camiguin Wind
30MW Puyo
23MW Bubunauan
9.75MW Cabadbaran
40.5MW9MW
TagoloanTumalaong

42 Key Investment Highlights
Domaine Expertise
LARGEST VERTICALLY INTEGRATED GEOTHERMAL COMPANY GLOBALLY
COMPANY COUNTRYSTEAM
CAPACITY (in MW)
PLANT CAPACITY
(in MW)
1 EDC Philippines 1,159 1,159
2 Comision Federal de Electricidad Mexico 958 958
3 Enel Green Power Italy 915 915
4 Chevron USA 1,329 887 *
5 Ormat Israel 689 749
6 Calpine USA 725 ** 725 **
7 Mighty River Power New Zealand 385 385
8 Terra Gen USA 337 337
9 Contact Energy New Zealand 335 335
10 Orkuveita Reykjavikur Iceland 333 333
11 CalEnergy Generation USA 329 329
12 Star Energy Ltd. Indonesia 227 227
13 Northern California Power Agency USA 220 220
Source: Bertani, Ruggero, 2010: Geothermal Power Generation in the World 2005-2010 Update ReportNote: * Not included is the 442 MW operated by the Indonesian Government through PLN
** Calpine Operating Power Plants 1Q 2014 Investor Update Conference Call May 2014

43 Key Investment Highlights
Contract-based Cash Flows
NGCP
Electric Cooperatives/Third party customers
POSSESSES STABLE AND PREDICTABLE CASH FLOWS
Subsidiaries of EDC
National Power
Corporation
Power Supply Agreements (PSAs)
Power Purchase Agreements
Electricity
Cashflow
Steam Sales Agreements (SSA)
Bac-ManGeothermal
Geothermal Resources Sales Contracts (GRSC)
Green Core Geothermal
FG Hydro
Electricity
Cashflow
Electricity
Cashflow
Electricity & Ancillary Svcs.
Cashflow
Steam
Cashflow orDividends
Steam
Cashflow orDividends
Dividends
Burgos WindElectricity
CashflowDividends
Power Supply Agreements
Power Purchase Agreements (PPAs)
Percentage of Consolidated Revenues (1)
USDLinkage
Electricity44% 73%
Sovereign off-take
Electricity56% 0%
Commercial off-take
(1) As of Sept.30, 2014
Electricity0% 0%
Feed-in-Tariff

44 Key Investment Highlights
Track Record of Growth
MAINTAINS A TRACK RECORD OF OPERATIONAL EXCELLENCE
Ava
ilab
ility
Fac
tor
(1)
(%)
Rel
iab
ility
Fac
tor(2
)
(%)
Unified Leyte Palinpinon I
Palinpinon IITongonanVisayas
Mindanao I
Mindanao IIMindanao
YTD 9M 2013
YTD 9M 2013
YTD 9M 2014
0%
20%
40%
60%
80%
100% 85%93% 99%
83%
99% 96%
47%
82%
YTD 9M 2014
0%
20%
40%
60%
80%
100% 90%99% 99% 99% 99% 99%
71%
98%
Source: Company data as of the end of September 30, 2014
(1) Availability Factor - Fraction of time a unit is capable of providing service, considering both planned and unplanned outages. (2) Reliability Factor - Measure of ability of generating units to perform their intended function, considering unplanned outages only.
Bacman I
Bacman IILuzon
0%
20%
40%
60%
80%
100%98% 96%
83%
99% 99% 99%
35%43%
0%
20%
40%
60%
80%
100%98% 99% 99% 99% 99%
94%
41% 44%

45 Key Investment Highlights
Favorable Industry Dynamics
BOARD OF DIRECTORS
LED BY AN EXPERIENCED BOARD OF DIRECTORS AND MANAGEMENT TEAM THAT IS COMMITTED TO BEST IN CLASS CORPORATE GOVERNANCE PRACTICES
• Key authorities in the power industry
• Long-standing relationships with key industry stakeholders
• Advocates of good corporate governance
• Sustainability Business Award, organized by Global Initiatives Singapore, PBE, Eco-Business, and Price Waterhouse Coopers
• Platinum Award for Corporate Governance from the Institute of Corporate Directors and Securities and Exchange Commission.
• 8th Placer in Finance Asia’s Best in Corporate Social Responsibility
• Four Philippine Quill Awards for HELEN, CAREERS & BINHI from the International Association of Business Communicators
• Three Seals of Approval for MGPF, LGPF & GCGI under DENR’s Philippine Environment Partnership Program for voluntary self-regulation & improved environmental performance
• Five Anvil Awards for Corporate Sustainability Communications Program, annual report, BINHI and calendar & planner from Public Relations Society of the Philippines
TECHNICAL EXPERTISE (1)
CORPORATE GOVERNANCE
RECENT AWARDS
• Board works directly with President to determine strategy
• EDC’s independent directors are active members of committees.
• Board Strategic Planning sessions are regularly conducted
Operations & Maintenance
Others(2)
Geosciences & Reservoir Engineering
Engineering & Construction
Drilling
56%
25%
14%
4%
1%
Average Years of Management
Experience
14+ Average Years of Engineering
Experience
13+
(1) As of July 31, 2014(2) Includes Office of the President, Finance, HR, Business Development, Supply Chain, Corporate Affairs, Business Development, Health, Environment & Safety, Information Technology, Legal & Regulatory, Marketing & Sales

46 Key Investment Highlights
Favorable Industry Dynamics
EDC HAS VARIOUS CORPORATE SOCIAL RESPONSIBILITY PARTNERSHIPS AND PROGRAMS
Health
Education
Livelihood
ENvironment
OUR SOCIAL AND ENVIRONMENTAL COMMITMENTS
• We believe that education is the most dependable way out of poverty
- 140 new trainees admitted to Kananga – EDC institute of Technology (KEITECH), with 95% employed
- 741 students enrolled at the Leyte Schools for Excellence (SFE) project
- Scholarships program: 21,875 (elementary), 1,154 (high school), 69(college, with 41 in University of the Phils.)
• We believe in being a partner in progress of the communities in which we operate
- 12,353 individuals served during medical, dental, surgical outreach activities across 5 project sites
- Assisted in 16 major livelihood projects earning a total gross income of PHP14M
- Numerous small scale contracts worth PHP224M awarded to local farmer cooperatives benefitting 3,565 members
• We believe in protecting and nurturing our environment because failing this - our resources will suffer
- BINHI Project – 833,799 trees planted for specific modules (Tree for the Future, Tree for Life and Tree for Food)P342M
Total CSR investment in 2013

47 Key Investment Highlights
Strong Credit & Investment Profile
USD596 41%PHP
841 59%
USD Revenues
16432%
PHPRevenues
34968%
DELIBERATELY MANAGING FINANCIAL RISKS
LOANS BY CURRENCY
US$ indexed revenues provide natural hedge
DEBT MATURITY PROFILE1
Sculpted to support EDC’s growth trajectoryLOANS BY STRUCTURE
Predominantly fixed debt matches nature of energy projects
Average Loan Life (Years)5.4 yrs
Average Interest Cost6.0%
LOANS
USD1,437
USD1,437
Type CurrencyOutstanding
(MM)Repayment Interest
Tenor(Years)
Maturity
175MM Club2 USD 131.0 Amortizing LIBOR+1.75% 6 2017
80MM Club USD 77.0 Amortizing LIBOR+1.80% 5.25 2018
Reg S Bonds USD 300.0 Bullet 6.50% 10 2021
PF – ECA USD 109.0 Amortizing LIBOR+0.90% 15 2029
PF – USD Com USD 28.0 Amortizing LIBOR+0.90% 15 2029
IFC Loan 1 PHP 3,074.0 Amortizing 6.07%3 15 2023
IFC Loan 2 PHP 2,886.0 Amortizing 6.66% 15 2025
PHP FXCN PHP 6,880.0 Amortizing 6.62% 10 2022
PHP Bonds PHP 12,000.0 Bullet 8.64%, 9.33% 5.5, 7.0 2015, 2016
PHP Bonds PHP 7,000.0 Bullet 4.16%, 4.73% 7.0, 10.0 2020, 2023
PF - PHP Com PHP 4,050.0 Amortizing PDST – R1 +Margin4 15 2029(1) In USD Millions as of October 31, 2014 (4) Margin: 200 bps + (PDST-F minus RDST-R1). Re-pricing on the 10th year(2) USD65 MM converted to PHP via Cross Currency Swap(3) Subject to re-pricing
Fixed1,141 79%
Floating296 21%
-
50
100
150
200
250
300
350
20
14
20
15
20
16
20
17
20
18
20
19
20
20
20
21
20
22
20
23
20
24
20
25
20
26
20
27
20
28
20
29
USD Debt
PHP Debt

48 Key Investment Highlights
Strong Credit & Investment Profile
DELIVERING SUPERIOR FINANCIAL AND OPERATING RESULTS TO STAKEHOLDERS
10,712
13,748 13,238
17,330 15,641
16,532 17,248
50%57% 54%
61% 61% 62% 60%
0%
20%
40%
60%
80%
100%
0
3,000
6,000
9,000
12,000
15,000
18,000
Dec-09 Dec-10 Dec-11 Dec-12 Dec-13 9M'13(12 mos)
9M'14(12 mos)
-
3,000
6,000
9,000
12,000
Dec-09 Dec-10 Dec-11 Dec-12 Dec-13 9M'13 9M'14
7,276 7,238
5,245(1)
9,895
7,458(2)
6,400
7,980
400
2,400
4,400
6,400
8,400
10,400
Dec-09 Dec-10 Dec-11 Dec-12 Dec-13 9M'13 9M'14
3,357 4,395
615(1)
10,376
5,633 5,925
10,544
CONSOLIDATED NET INCOME RECURRING NET INCOME
-
6,000
12,000
18,000
24,000
30,000
36,000
Dec-09 Dec-10 Dec-11 Dec-12 Dec-13 9M'13 9M'14
20,678 24,153
24,551 28,369
25,656
19,783 22,982
EBITDA MARGIN CONSOLIDATED REVENUES
1) Full provisioning for NNGP write-off amounting to P 5B in 2011 1) P1.2 B forgone steam revenues resulting from EDC’s acquisition of the Bacmanpower plants
2) P2.7 B lower revenues mainly from ancillary services

49 Key Investment Highlights
Strong Credit & Investment Profile
DIVIDEND POLICY IS TO DECLARE 30% OF PRIOR YEAR’S RNI
Dividend Policy Statement
At or about 30% of previous year’s Recurring Net Income subject to i) debt service requirements and loan covenants, andii) the implementation of business plans, operating expenses, budgets, funding for
new investments and acquisitions, appropriate reserves and working capital.
1,485 1,875 1,863
2,250
3,000
1,875 1,500
1,875
2,175 750
1,500
1,87530%
65%
33% 31%
45%
58%
36%
58%
0%
10%
20%
30%
40%
50%
60%
70%
0
500
1,000
1,500
2,000
2,500
3,000
3,500
4,000
4,500
2007 2008 2009 2010 2011 2012 2013 2014
PHP MillionDividends on Common Shares
Special Regular
Payout Ratio
PHP/share 0.099 0.27 0.125 0.120 0.160 0.140 0.160 0.200
Yield 1.7% 4.4% 3.3% 2.4% 2.7% 2.4% 2.6% 3.1%

50 Typhoon Proofing Cooling Tower Units
RETROFITTING OF COOLING TOWERS TO BE IMPLEMENTED IN 3 PHASES ON PRIORITY 1 AND 2 COOLING TOWERS
TRIAGE THE SITUATION*
PHASE 1
PROCURE & INSTALL HURRICANE GRADE CTs AVAILABLE IN THE MARKET
PHASE 2
DESIGN & IMPLEMENT A 300 KPH SOLUTION
PHASE 3
OB
JEC
TIV
E
TO RESTORE AFFECTED CTs AS QUICKLY AS POSSIBLE
TO TYPHOON PROOF CTs UP TO 232 KPH USING SPX MARLEY RTM STACKS AND SS316 ANCHORAGE RING
TO DESIGN AND IMPLEMENT AN EXTERNAL STRUCTURE TO RAISE CT TYPHOON SURVIVABILITY TO 300 KPH
• Repair Bacman Units 1 and 2 cooling towers using in-country strategic spares, i.e., parts stocked precisely for contingencies of this nature
• Fan Stacks• Replacement of wooden
decks with FRP decks• Replacement of 12 oz casings
with 16 oz casings
TASK
S
• First 7-30’ RTM Fan Stacks available @ Houston Gateway for transport to Manila by mid-November 2014 ;
• 2nd 6-28’ Fan Stacks available @ Houston Gateway mid-December 2014
• Fleet wide progressive replacement of Priority 1 Cooling Tower fan stacks using either the flexibility of N+1 feature or as opportunity shutdown works for units on scheduled major outage
• EDC and Marley are collaborating on options to increase to 300 kph or more a CT’s design wind speed through an external structure
• Initial designs have been put forward by EDC for Marley’s comments
* Ranking an issue in order of importance
AT LEAST ONE COOLING TOWER WILL BE FITTED WITH RTM FAN STACK BY END-2014

51 Typhoon Proofing Cooling Tower Units
1
2
3
4
5
6
ENGINEERING SOLUTIONS WILL PROGRESSIVELY BE IMPLEMENTED TO TYPHOON PROOF OUR COOLING TOWERS
PHILIPPINE WIND ZONE MAP
2
1
43
5
6
ZONE I B (V=250 KPH)
Bacman Geothermal
ZONE II (V=200 KPH)
Burgos Wind
Leyte Geothermal
ZONE III A (V=150 KPH)
Mindanao Geothermal
No. Negros Geothermal
So. Negros Geothermal
PRIORITY Location # of Units
OEM Cell x Fan Stack Dia.
# of Cells
1 Malitbog 3 SPX Marley 8 x 28’ 24
Mahanagdong 3 SPX Marley 7 x 30’ 21
Tongonan 3 SPX Marley 3 x 28’ 9
Malitbog Bottoming 1 SPX Marley 3 x 28’ 3
Upper Mahiao 1 SPX Marley 4 x 22’ 4
Bacman 2 Research Cottrell 6 x 28’ 12
1 ICS 2 X 30’ 2
PRIORITY 1 Sub-total 73
Total Cost, Priority 1 @ USD 100,00 PER CELL USD 7,300,000
2 Mt Apo 2 GEA 5 x 32.8’ 10
Palinpinon 1 2 Hamon 3 x 28’ 6
Palinpinon 1 1 ICS 3 X 28’ 3
Palinpinon 2 4 Shinko 2 x 28’ 8
Nasulo 1 SPX Marley 6 x 26’ 6
PRIORITY 2 Sub-total 33
TOTAL 106
PRIORITY 1: ALL BACMAN AND LEYTE COOLING TOWERS .PRIORITY 2: ALL PALINPINON & MINDANAO COOLING TOWERS .

52 Typhoon Proofing Cooling Tower Units
68 HURRICANE TOWER SETS ON ORDER TO RETROFIT EXISTING FLEET OF COOLING TOWERS
• Fan stack is the nozzle through which the fan blade draws air through the cooling tower.
• SPX Marley USA is OEM for 76/108 or 70%
• The RTM (Resin Transfer Moulding ) cold molding process increases durability, ensures laminate thickness & weight consistency, allows no porosity for delamination or structural fracture, thereby enhancing the cylinder load capacity
• RTM fan stack is designed for 233 kph winds
• Anchorage ring is cold-rolled for increased tensile strength/stiffness and is made of SS 316 to be compatible with corrosive environment
• Marley has confirmed that the incremental weight of the RTM fan stack and anchorage ring is within the existing cooling tower’s design weight limit
• To go beyond the 233 kph design of an additional structure is under evaluation.
KNOWN AS “HURRICANE TOWER” THAT WAS DEVELOPED BY SPX MARLEY
FOR CHEVRON’S USE IN US GULF COAST
SPX Marley Reflex RTM Fan Cylinder Anchorage Ring
RTM SEGMENTS ARE BOLTED TO THE ANCHORAGE RING WHICH IN TURN IS DIRECTLY BOLTED ONTO
THE COOLING TOWER’S PURLINS & JOISTS
PHASE 2: Install Hurricane Grade CTs

53 Typhoon Proofing Cooling Tower Units
SPX MARLEY AND EDC ENGINEERING DESIGN GROUP ARE COLLABORATING ON OPTIONS THAT WILL RAISE CT TYPHOON SURVIVABILITY TO 300 KPH
PHASE 3: Design & Implement 300 KPH Solution
Concept 2 (“Spider Support System”)
• The structure will include an SS support ring at the top of the fan stack & a lower ring spread out from the base of the fan cylinder
• Intermediate tubes (2x2 FRP square tubes) will connect the 2 rings
• SS pins to attach tubes to belly band and anchorage rings
• RTM fanstacks and spider support system to be installed one by one using N+1 flexibility
• Priority is 1. Malitbog, 2. Bacman, 3. Mahanagdong, 4. Tongonan
• Design review meeting completed at Marley in Missouri & Kansas October 2-3, 2014
CONCEPT AGREED; MARLEY PLANS TO COMPLETE DETAILED STRUCTURAL DESIGN BYEND OF OCTOBER AND SUBMIT DETAILED PROPOSAL TO EDC BY NOVEMBER 5
54 Growth Projects
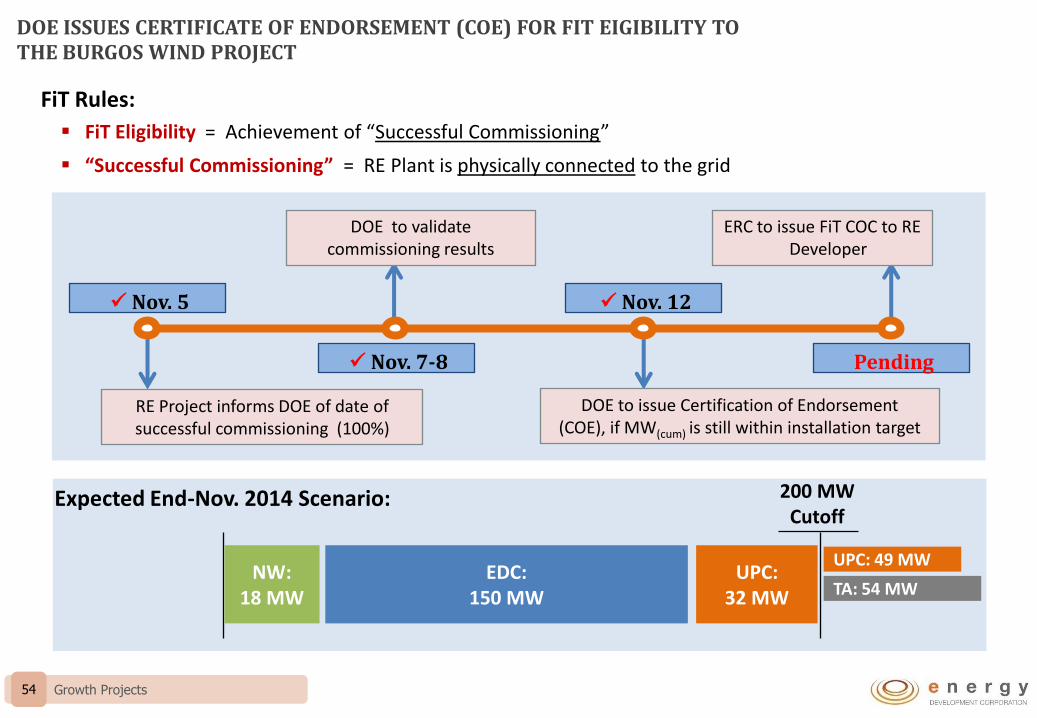
FiT Eligibility = Achievement of “Successful Commissioning”
“Successful Commissioning” = RE Plant is physically connected to the grid
FiT Rules:
RE Project informs DOE of date of successful commissioning (100%)
DOE to validate commissioning results
DOE to issue Certification of Endorsement (COE), if MW(cum) is still within installation target
ERC to issue FiT COC to RE Developer
Nov. 5
Nov. 7-8
Nov. 12
Pending
DOE ISSUES CERTIFICATE OF ENDORSEMENT (COE) FOR FIT EIGIBILITY TO THE BURGOS WIND PROJECT
Expected End-Nov. 2014 Scenario: 200 MW Cutoff
NW:18 MW
EDC: 150 MW
UPC:32 MW
UPC: 49 MW
TA: 54 MW

55 Growth Projects
LATIN AMERICA WILL BE A DRIVER OF LONG-TERM GROWTH FOR EDC
• Large portfolio of early-stage assets
• Development team with significant experience in both geothermal and Latin America
• Long-term commitment to bring projects to completion
• Presence in Latin America provides window to other RE opportunities

56 Review of YTD 9M 2014 Financial Results
REVENUES INCREASED BY PHP3.1 B DUE TO HIGHER CONTRIBUTIONS FROM THE COMMISSIONING OF BACMAN AND NASULO PLANTS
In PHP Billions
• Bacman’s revenues increased by P2.1 B, due to the commercial operations of Bacman Units 1, 2and 3 starting January 2014, June 2014 and October 2013, respectively.
• Fresh revenue contribution by P0.5 B from Nasulo power plant
• Higher revenue contribution by P0.4 M each from Mindanao and Palinpinon-Tongonan due tohigher energy sales and the absence of adjustments covering prior year’s shortfall in Mindanao.
• Revenues from FG Hydro decreased by P0.4 B, due to lower sales volume and the re-computation of electricity spot prices for Nov. and Dec. 2013 billings as ordered by the ERC(P250).
Leyte8,245
Mindanao1,373
Tongonan I3,112
Palinpinon 5,227
Bacman19*
Pantabangan-Masiway
1,826
YTD 9M 2013 REVENUES(P millions)
Leyte8,374
Mindanao1,737
Tongonan I3,431
Palinpinon 5,327
Bacman2,146*
Nasulo502
Pantabangan-Masiway
1,465
YTD 9M 2014 REVENUES(P millions)
Notes: * - Includes trading revenues amounting to P81 Million
REVENUES+15.6%19.8B2013
22.9B2014
2.1 0.5 0.4 0.4 0.1 (0.4)
Revenues,YTD Sept. 2013
BGI Nasulo Mindanao Pal-Tong Leyte FG Hydro Revenues,YTD Sept. 2014
19.8
22.421.9
22.8 23.2 23.3
22.9
22.9

57 Review of YTD 9M 2014 Financial Results
PROJECT FINANCING WILL PRETERMINATE THE BRIDGE LOAN AND REPLENISH CASH RESOURCES ADVANCED FOR BURGOS WIND PROJECT
In PHP Billions
For the first nine months of 2014, cash generated from operations reached P12.3 B and was used to service thefollowing:
P15.3 B property, plant and equipment acquisition, of which:
P9.1 B was spent to Burgos Wind P2.5 B on capitalized cost of wells P1.0 B for Nasulo Project (N2N) P0.9 B for Bacman power plants rehab P0.7 B rehab due to typhoon Yolanda
P3.6 B interest, financing charges paid and payment of long term debts
P2.5 B payment for cash dividend
CASH BALANCE-15.6%16.0B2013
13.5B2014
16.0 13.5
12.3
6.6 ( 3.6)
(2.5)
(15.3)
Cash Balance,Dec. 2013
Cash generated from operations
Proceeds from bridge loans
Debt Servicing Cash Dividends PPE Acquisition, Input VAT and Others
Cash Balance,Sept. 2014
28.3
34.9
31.328.8
13.5

58 Review of YTD 9M 2014 Financial Results
Decreased due to lower cash balance coupled with higher current liabilities due to the reclass of the P8.5B Peso Bonds which will mature on June 2015.
Improved mainly due to equity from higher net income for the period.
Increased mainly due to higher net debt.
Sept. 2013
Sept. 2014
2.48
1.40
Current Ratio
Sept. 2013
Sept. 2014
1.53
1.45
Debt-to-Equity
Sept. 2013
Sept. 2014
2.26
2.95
Net Debt-to-EBITDA*
DEBT-TO EQUITY IMPROVED WHILE BOTH CURRENT RATIO AND NET DEBT-TO-EBITDA WEAKENED
*Trailing 12 months