edb information disclosure templates draft 16 jan · final 2018 id schedules 1 to 10...
TRANSCRIPT

Commerce Commission Information Disclosure Template
EDB Information Disclosure Requirements
Information Templates
forSchedules 1–10
Company Name Eastland Network Limited
Disclosure Date 31 August 2018
Disclosure Year (year ended) 31 March 2018
Templates for Schedules 1–10 excluding 5f–5gTemplate Version 4.1. Prepared 24 March 2015
FINAL 2018 ID schedules 1 to 10 (Hardcoded).XLSX 1 CoverSheet

Commerce Commission Information Disclosure Template
Table of Contents
Schedule Schedule name1 ANALYTICAL RATIOS2 REPORT ON RETURN ON INVESTMENT3 REPORT ON REGULATORY PROFIT4 REPORT ON VALUE OF THE REGULATORY ASSET BASE (ROLLED FORWARD)5a REPORT ON REGULATORY TAX ALLOWANCE5b REPORT ON RELATED PARTY TRANSACTIONS5c REPORT ON TERM CREDIT SPREAD DIFFERENTIAL ALLOWANCE5d REPORT ON COST ALLOCATIONS5e REPORT ON ASSET ALLOCATIONS6a REPORT ON CAPITAL EXPENDITURE FOR THE DISCLOSURE YEAR6b REPORT ON OPERATIONAL EXPENDITURE FOR THE DISCLOSURE YEAR7 COMPARISON OF FORECASTS TO ACTUAL EXPENDITURE8 REPORT ON BILLED QUANTITIES AND LINE CHARGE REVENUES9a ASSET REGISTER9b ASSET AGE PROFILE9c REPORT ON OVERHEAD LINES AND UNDERGROUND CABLES9d REPORT ON EMBEDDED NETWORKS9e REPORT ON NETWORK DEMAND10 REPORT ON NETWORK RELIABILITY
FINAL 2018 ID schedules 1 to 10 (Hardcoded).XLSX 2 TOC
Commerce Commission Information Disclosure Template
Disclosure Template InstructionsThese templates have been prepared for use by EDBs when making disclosures under clauses 2.3.1, 2.4.21, 2.4.22, 2.5.1, and 2.5.2 of the Electricity Distribution Information Disclosure Determination 2012.
Company Name and DatesTo prepare the templates for disclosure, the supplier's company name should be entered in cell C8, the date of the last day of the current (disclosure) year should be entered in cell C12, and the date on which the information is disclosed should be entered in cell C10 of the CoverSheet worksheet.The cell C12 entry (current year) is used to calculate disclosure years in the column headings that show above some of the tables and in labels adjacent to some entry cells. It is also used to calculate the ‘For year ended’ date in the template title blocks (the title blocks are the light green shaded areas at the top of each template).The cell C8 entry (company name) is used in the template title blocks.Dates should be entered in day/month/year order (Example -"1 April 2013").
Data Entry Cells and Calculated CellsData entered into this workbook may be entered only into the data entry cells. Data entry cells are the bordered, unshaded areas (white cells) in each template. Under no circumstances should data be entered into the workbook outside a data entry cell.In some cases, where the information for disclosure is able to be ascertained from disclosures elsewhere in the workbook, such information is disclosed in a calculated cell.
Validation Settings on Data Entry CellsTo maintain a consistency of format and to help guard against errors in data entry, some data entry cells test keyboard entries for validity and accept only a limited range of values. For example, entries may be limited to a list of category names, to values between 0% and 100%, or either a numeric entry or the text entry “N/A”. Where this occurs, a validation message will appear when data is being entered. These checks are applied to keyboard entries only and not, for example, to entries made using Excel’s copy and paste facility.
Conditional Formatting Settings on Data Entry CellsSchedule 2 cells G79 and I79:L79 will change colour if the total cashflows do not equal the corresponding values in table 2(ii).Schedule 4 cells P99:P105 and P107 will change colour if the RAB values do not equal the corresponding values in table 4(ii).Schedule 9b columns AA to AE (2013 to 2017) contain conditional formatting. The data entry cells for future years are hidden (are changed from white to yellow).Schedule 9b cells AG10 to AG60 will change colour if the total assets at year end for each asset class does not equal the corresponding values in column I in Schedule 9a.Schedule 9c cell G30 will change colour if G30 (overhead circuit length by terrain) does not equal G18 (overhead circuit length by operating voltage).
Inserting Additional Rows and ColumnsThe templates for schedules 4, 5b, 5c, 5d, 5e, 6a, 8, 9d, and 9e may require additional rows to be inserted in tables marked 'include additional rows if needed' or similar. Column A schedule references should not be entered in additional rows, and should be deleted from additional rows that are created by copying and pasting rows that have schedule references. Additional rows in schedules 5c, 6a, and 9e must not be inserted directly above the first row or below the last row of a table. This is to ensure that entries made in the new row are included in the totals.Schedules 5d and 5e may require new cost or asset category rows to be inserted in allocation change tables 5d(iii) and 5e(ii). Accordingly, cell protection has been removed from rows 77 and 78 of the respective templates to allow blocks of rows to be copied. The four steps to add new cost category rows to table 5d(iii) are: Select Excel rows 69:77, copy, select Excel row 78, insert copied cells. Similarly, for table 5e(ii): Select Excel rows 70:78, copy, select Excel row 79, then insert copied cells.The template for schedule 8 may require additional columns to be inserted between column P and U. To avoid interfering with the title block entries, these should be inserted to the left of column S. If inserting additional columns, the formulas for standard consumers total, non-standard consumers totals and total for all consumers will need to be copied into the cells of the added columns. The formulas can be found in the equivalent cells of the existing columns.
FINAL 2018 ID schedules 1 to 10 (Hardcoded).XLSX 3 Instructions
Commerce Commission Information Disclosure Template
Disclosures by Sub-NetworkIf the supplier has sub-networks, schedules 8, 9a, 9b, 9c, 9e, and 10 must be completed for the network and for each sub-network. A copy of the schedule worksheet(s) must be made for each sub-network and named accordingly.
Schedule ReferencesThe references labelled 'sch ref' in the leftmost column of each template are consistent with the row references in the Electricity Distribution ID Determination 2012 (as issued on 24 March 2015). They provide a common reference between the rows in the determination and the template.
Description of Calculation ReferencesCalculation cell formulas contain links to other cells within the same template or elsewhere in the workbook. Key cell references are described in a column to the right of each template. These descriptions are provided to assist data entry. Cell references refer to the row of the template and not the schedule reference.
Worksheet Completion SequenceCalculation cells may show an incorrect value until precedent cell entries have been completed. Data entry may be assisted by completing the schedules in the following order: 1. Coversheet2. Schedules 5a–5e3. Schedules 6a–6b4. Schedule 85. Schedule 36. Schedule 47. Schedule 28. Schedule 79. Schedules 9a–9e10. Schedule 10
FINAL 2018 ID schedules 1 to 10 (Hardcoded).XLSX 4 Instructions

Commerce Commission Information Disclosure Template
Company Name
For Year Ended
SCHEDULE 1: ANALYTICAL RATIOS
sch ref
7 1(i): Expenditure metrics
8
Expenditure per GWh energy
delivered to ICPs($/GWh)
Expenditure per average no. of
ICPs($/ICP)
Expenditure per MW maximum
coincident system demand($/MW)
Expenditure per km circuit length
($/km)
Expenditure per MVA of capacity from EDB-
owned distribution transformers
($/MVA)
9 Operational expenditure 35,502 389 168,995 2,512 46,14910 Network 17,221 189 81,976 1,218 22,38611 Non-network 18,280 200 87,019 1,293 23,7631213 Expenditure on assets 28,721 315 136,719 2,032 37,33514 Network 25,981 285 123,677 1,838 33,77415 Non-network 2,740 30 13,042 194 3,5621617 1(ii): Revenue metrics
18
Revenue per GWh energy delivered
to ICPs($/GWh)
Revenue per average no. of
ICPs($/ICP)
19 Total consumer line charge revenue 131,849 1,44420 Standard consumer line charge revenue 131,849 1,44421 Non-standard consumer line charge revenue – –2223 1(iii): Service intensity measures2425 Demand density 15 Maximum coincident system demand per km of circuit length (for supply) (kW/km)26 Volume density 71 Total energy delivered to ICPs per km of circuit length (for supply) (MWh/km)27 Connection point density 6 Average number of ICPs per km of circuit length (for supply) (ICPs/km)28 Energy intensity 10,955 Total energy delivered to ICPs per average number of ICPs (kWh/ICP)2930 1(iv): Composition of regulatory income31 ($000) % of revenue
32 Operational expenditure 9,922 26.72%33 Pass-through and recoverable costs excluding financial incentives and wash-ups 7,002 18.86%34 Total depreciation 5,692 15.33%35 Total revaluations 1,665 4.48%36 Regulatory tax allowance 3,820 10.29%37 Regulatory profit/(loss) including financial incentives and wash-ups 12,362 33.29%38 Total regulatory income 37,1333940 1(v): Reliability41
42 Interruption rate 11.92 Interruptions per 100 circuit km
This schedule calculates expenditure, revenue and service ratios from the information disclosed. The disclosed ratios may vary for reasons that are company specific and, as a result, must be interpreted with care. The Commerce Commission will publish a summary and analysis of information disclosed in accordance with the ID determination. This will include information disclosed in accordance with this and other schedules, and information disclosed under the other requirements of the determination. This information is part of audited disclosure information (as defined in section 1.4 of the ID determination), and so is subject to the assurance report required by section 2.8.
Eastland Network Limited31 March 2018
FINAL 2018 ID schedules 1 to 10 (Hardcoded).XLSX 5 S1.Analytical Ratios

Commerce Commission Information Disclosure Template
Company Name
For Year EndedSCHEDULE 2: REPORT ON RETURN ON INVESTMENT
sch ref
7 2(i): Return on Investment CY-2 CY-1 Current Year CY
8 31 Mar 16 31 Mar 17 31 Mar 189 ROI – comparable to a post tax WACC % % %
10 Reflecting all revenue earned 6.34% 8.39% 8.02%11 Excluding revenue earned from financial incentives 4.29% 6.34% 5.98%12 Excluding revenue earned from financial incentives and wash-ups 4.29% 6.43% 6.07%1314 Mid-point estimate of post tax WACC 5.37% 4.77% 5.04%15 25th percentile estimate 4.66% 4.05% 4.36%16 75th percentile estimate 6.09% 5.48% 5.72%
171819 ROI – comparable to a vanilla WACC 20 Reflecting all revenue earned 6.99% 8.94% 8.61%21 Excluding revenue earned from financial incentives 4.94% 6.88% 6.57%22 Excluding revenue earned from financial incentives and wash-ups 4.94% 6.97% 6.66%2324 WACC rate used to set regulatory price path 7.19% 7.19% 7.19%2526 Mid-point estimate of vanilla WACC 6.02% 5.31% 5.60%27 25th percentile estimate 5.30% 4.59% 4.92%28 75th percentile estimate 6.74% 6.03% 6.29%29
30 2(ii): Information Supporting the ROI ($000)
3132 Total opening RAB value 151,86733 plus Opening deferred tax (6,671)34 Opening RIV 145,1963536 Line charge revenue 36,850
3738 Expenses cash outflow 16,92439 add Assets commissioned 7,06140 less Asset disposals 28941 add Tax payments 3,12742 less Other regulated income 28343 Mid-year net cash outflows 26,5414445 Term credit spread differential allowance –
4647 Total closing RAB value 154,61348 less Adjustment resulting from asset allocation (0)49 less Lost and found assets adjustment –50 plus Closing deferred tax (7,364)51 Closing RIV 147,2505253 ROI – comparable to a vanilla WACC 8.61%
5455 Leverage (%) 44%56 Cost of debt assumption (%) 4.80%57 Corporate tax rate (%) 28%5859 ROI – comparable to a post tax WACC 8.02%
60
This schedule requires information on the Return on Investment (ROI) for the EDB relative to the Commerce Commission's estimates of post tax WACC and vanilla WACC. EDBs must calculate their ROI based on a monthly basis if required by clause 2.3.3 of the ID Determination or if they elect to. If an EDB makes this election, information supporting this calculation must be provided in 2(iii). EDBs must provide explanatory comment on their ROI in Schedule 14 (Mandatory Explanatory Notes).This information is part of audited disclosure information (as defined in section 1.4 of the ID determination), and so is subject to the assurance report required by section 2.8.
Eastland Network Limited31 March 2018
FINAL 2018 ID schedules 1 to 10 (Hardcoded).XLSX 6 S2.Return on Investment

Commerce Commission Information Disclosure Template
Company Name
For Year EndedSCHEDULE 2: REPORT ON RETURN ON INVESTMENT
sch ref
This schedule requires information on the Return on Investment (ROI) for the EDB relative to the Commerce Commission's estimates of post tax WACC and vanilla WACC. EDBs must calculate their ROI based on a monthly basis if required by clause 2.3.3 of the ID Determination or if they elect to. If an EDB makes this election, information supporting this calculation must be provided in 2(iii). EDBs must provide explanatory comment on their ROI in Schedule 14 (Mandatory Explanatory Notes).This information is part of audited disclosure information (as defined in section 1.4 of the ID determination), and so is subject to the assurance report required by section 2.8.
Eastland Network Limited31 March 2018
61 2(iii): Information Supporting the Monthly ROI6263 Opening RIV N/A
6465
66Line charge
revenueExpenses cash
outflowAssets
commissionedAsset
disposalsOther regulated
incomeMonthly net cash
outflows67 April –68 May –69 June –70 July –71 August –72 September –73 October –74 November –75 December –76 January –77 February –78 March –79 Total – – – – – –80
81 Tax payments N/A8283 Term credit spread differential allowance N/A8485 Closing RIV N/A
868788 Monthly ROI – comparable to a vanilla WACC N/A8990 Monthly ROI – comparable to a post tax WACC N/A
9192 2(iv): Year-End ROI Rates for Comparison Purposes9394 Year-end ROI – comparable to a vanilla WACC 5.76%9596 Year-end ROI – comparable to a post tax WACC 5.16%97
98 * these year-end ROI values are comparable to the ROI reported in pre 2012 disclosures by EDBs and do not represent the Commission's current view on ROI.99
100 2(v): Financial Incentives and Wash-Ups101
102 Net recoverable costs allowed under incremental rolling incentive scheme –103 Purchased assets – avoided transmission charge 3,746104 Energy efficiency and demand incentive allowance –105 Quality incentive adjustment 233
106 Other financial incentives –107 Financial incentives 3,979108109 Impact of financial incentives on ROI 2.04%
110111 Input methodology claw-back112 Recoverable customised price-quality path costs113 Catastrophic event allowance
114 Capex wash-up adjustment (177)115 Transmission asset wash-up adjustment116 2013–2015 NPV wash-up allowance117 Reconsideration event allowance118 Other wash-ups119 Wash-up costs (177)120121 Impact of wash-up costs on ROI –0.09%
FINAL 2018 ID schedules 1 to 10 (Hardcoded).XLSX 7 S2.Return on Investment

Commerce Commission Information Disclosure Template
Company Name
For Year EndedSCHEDULE 3: REPORT ON REGULATORY PROFIT
sch ref
7 3(i): Regulatory Profit ($000)
8 Income9 Line charge revenue 36,850
10 plus Gains / (losses) on asset disposals (264)11 plus Other regulated income (other than gains / (losses) on asset disposals) 5471213 Total regulatory income 37,133
14 Expenses15 less Operational expenditure 9,922
1617 less Pass-through and recoverable costs excluding financial incentives and wash-ups 7,0021819 Operating surplus / (deficit) 20,209
2021 less Total depreciation 5,6922223 plus Total revaluations 1,6652425 Regulatory profit / (loss) before tax 16,182
2627 less Term credit spread differential allowance –2829 less Regulatory tax allowance 3,8203031 Regulatory profit/(loss) including financial incentives and wash-ups 12,36232
33 3(ii): Pass-through and Recoverable Costs excluding Financial Incentives and Wash-Ups ($000)
34 Pass through costs35 Rates 26636 Commerce Act levies 5337 Industry levies 6938 CPP specified pass through costs39 Recoverable costs excluding financial incentives and wash-ups40 Electricity lines service charge payable to Transpower 6,24641 Transpower new investment contract charges 8942 System operator services –43 Distributed generation allowance 27744 Extended reserves allowance –45 Other recoverable costs excluding financial incentives and wash-ups –46 Pass-through and recoverable costs excluding financial incentives and wash-ups 7,00247
This schedule requires information on the calculation of regulatory profit for the EDB for the disclosure year. All EDBs must complete all sections and provide explanatory comment on their regulatory profit in Schedule 14 (Mandatory Explanatory Notes). This information is part of audited disclosure information (as defined in section 1.4 of the ID determination), and so is subject to the assurance report required by section 2.8.
Eastland Network Limited31 March 2018
FINAL 2018 ID schedules 1 to 10 (Hardcoded).XLSX 8 S3.Regulatory Profit

Commerce Commission Information Disclosure Template
Company Name
For Year EndedSCHEDULE 3: REPORT ON REGULATORY PROFIT
sch ref
This schedule requires information on the calculation of regulatory profit for the EDB for the disclosure year. All EDBs must complete all sections and provide explanatory comment on their regulatory profit in Schedule 14 (Mandatory Explanatory Notes). This information is part of audited disclosure information (as defined in section 1.4 of the ID determination), and so is subject to the assurance report required by section 2.8.
Eastland Network Limited31 March 2018
48 3(iii): Incremental Rolling Incentive Scheme ($000)
49 CY-1 CY50 31 Mar 17 31 Mar 1851 Allowed controllable opex52 Actual controllable opex5354 Incremental change in year55
56
Previous years' incremental
change
Previous years' incremental
change adjusted for inflation
57 CY-5 31 Mar 1358 CY-4 31 Mar 1459 CY-3 31 Mar 1560 CY-2 31 Mar 1661 CY-1 31 Mar 1762 Net incremental rolling incentive scheme –6364 Net recoverable costs allowed under incremental rolling incentive scheme –
65 3(iv): Merger and Acquisition Expenditure70 ($000)66 Merger and acquisition expenditure67
68
69 3(v): Other Disclosures70 ($000)71 Self-insurance allowance
Provide commentary on the benefits of merger and acquisition expenditure to the electricity distribution business, including required disclosures in accordance with section 2.7, in Schedule 14 (Mandatory Explanatory Notes)
FINAL 2018 ID schedules 1 to 10 (Hardcoded).XLSX 9 S3.Regulatory Profit
Commerce Commission Information Disclosure Template
Company Name
For Year Ended
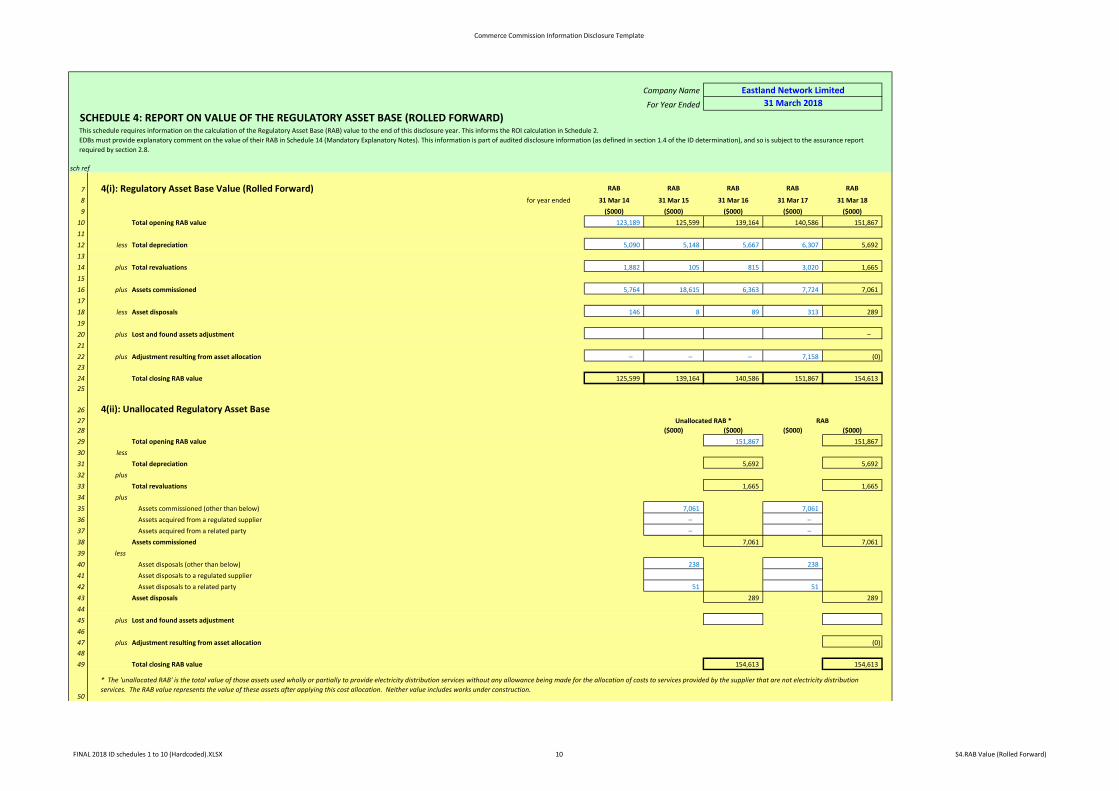
SCHEDULE 4: REPORT ON VALUE OF THE REGULATORY ASSET BASE (ROLLED FORWARD)
sch ref
7 4(i): Regulatory Asset Base Value (Rolled Forward) RAB RAB RAB RAB RAB
8 for year ended 31 Mar 14 31 Mar 15 31 Mar 16 31 Mar 17 31 Mar 189 ($000) ($000) ($000) ($000) ($000)
10 Total opening RAB value 123,189 125,599 139,164 140,586 151,8671112 less Total depreciation 5,090 5,148 5,667 6,307 5,6921314 plus Total revaluations 1,882 105 815 3,020 1,6651516 plus Assets commissioned 5,764 18,615 6,363 7,724 7,0611718 less Asset disposals 146 8 89 313 2891920 plus Lost and found assets adjustment –2122 plus Adjustment resulting from asset allocation – – – 7,158 (0)2324 Total closing RAB value 125,599 139,164 140,586 151,867 154,61325
26 4(ii): Unallocated Regulatory Asset Base2728 ($000) ($000) ($000) ($000)29 Total opening RAB value 151,867 151,86730 less31 Total depreciation 5,692 5,69232 plus33 Total revaluations 1,665 1,66534 plus35 Assets commissioned (other than below) 7,061 7,06136 Assets acquired from a regulated supplier – –37 Assets acquired from a related party – –38 Assets commissioned 7,061 7,06139 less 40 Asset disposals (other than below) 238 23841 Asset disposals to a regulated supplier42 Asset disposals to a related party 51 5143 Asset disposals 289 2894445 plus Lost and found assets adjustment4647 plus Adjustment resulting from asset allocation (0)4849 Total closing RAB value 154,613 154,613
50
Eastland Network Limited31 March 2018
This schedule requires information on the calculation of the Regulatory Asset Base (RAB) value to the end of this disclosure year. This informs the ROI calculation in Schedule 2. EDBs must provide explanatory comment on the value of their RAB in Schedule 14 (Mandatory Explanatory Notes). This information is part of audited disclosure information (as defined in section 1.4 of the ID determination), and so is subject to the assurance report required by section 2.8.
* The 'unallocated RAB' is the total value of those assets used wholly or partially to provide electricity distribution services without any allowance being made for the allocation of costs to services provided by the supplier that are not electricity distribution services. The RAB value represents the value of these assets after applying this cost allocation. Neither value includes works under construction.
Unallocated RAB * RAB
FINAL 2018 ID schedules 1 to 10 (Hardcoded).XLSX 10 S4.RAB Value (Rolled Forward)

Commerce Commission Information Disclosure Template
Company Name
For Year Ended
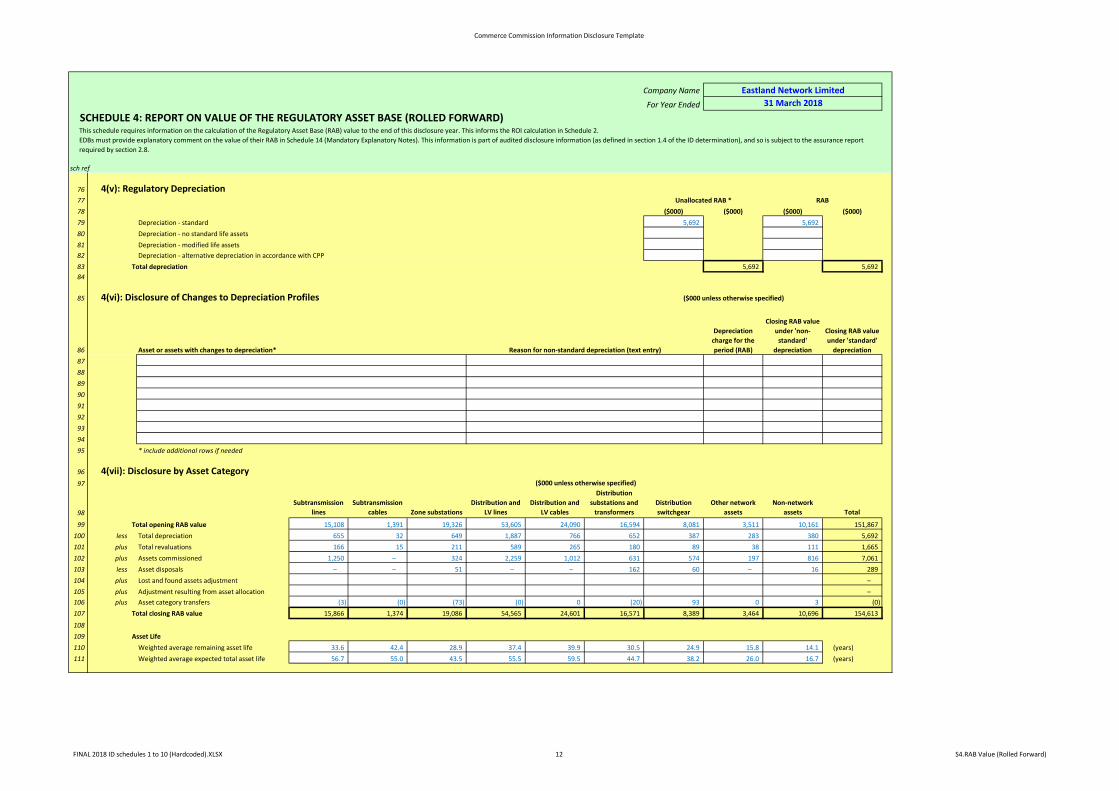
SCHEDULE 4: REPORT ON VALUE OF THE REGULATORY ASSET BASE (ROLLED FORWARD)
sch ref
Eastland Network Limited31 March 2018
This schedule requires information on the calculation of the Regulatory Asset Base (RAB) value to the end of this disclosure year. This informs the ROI calculation in Schedule 2. EDBs must provide explanatory comment on the value of their RAB in Schedule 14 (Mandatory Explanatory Notes). This information is part of audited disclosure information (as defined in section 1.4 of the ID determination), and so is subject to the assurance report required by section 2.8.
51
52 4(iii): Calculation of Revaluation Rate and Revaluation of Assets5354 CPI4 1,01155 CPI4
-4 1,000
56 Revaluation rate (%) 1.10%575859 ($000) ($000) ($000) ($000)
60 Total opening RAB value 151,867 151,86761 less Opening value of fully depreciated, disposed and lost assets 477 4776263 Total opening RAB value subject to revaluation 151,390 151,39064 Total revaluations 1,665 1,66565
66 4(iv): Roll Forward of Works Under Construction
6768 Works under construction—preceding disclosure year 213 21369 plus Capital expenditure 8,027 8,02770 less Assets commissioned 7,061 7,06171 plus Adjustment resulting from asset allocation72 Works under construction - current disclosure year 1,179 1,179
7374 Highest rate of capitalised finance applied75
Allocated works under construction
Unallocated RAB *
Unallocated works under construction
RAB
FINAL 2018 ID schedules 1 to 10 (Hardcoded).XLSX 11 S4.RAB Value (Rolled Forward)
Commerce Commission Information Disclosure Template
Company Name
For Year Ended
SCHEDULE 4: REPORT ON VALUE OF THE REGULATORY ASSET BASE (ROLLED FORWARD)
sch ref
Eastland Network Limited31 March 2018
This schedule requires information on the calculation of the Regulatory Asset Base (RAB) value to the end of this disclosure year. This informs the ROI calculation in Schedule 2. EDBs must provide explanatory comment on the value of their RAB in Schedule 14 (Mandatory Explanatory Notes). This information is part of audited disclosure information (as defined in section 1.4 of the ID determination), and so is subject to the assurance report required by section 2.8.
76 4(v): Regulatory Depreciation7778 ($000) ($000) ($000) ($000)79 Depreciation - standard 5,692 5,69280 Depreciation - no standard life assets81 Depreciation - modified life assets82 Depreciation - alternative depreciation in accordance with CPP83 Total depreciation 5,692 5,69284
85 4(vi): Disclosure of Changes to Depreciation Profiles
86 Asset or assets with changes to depreciation* Reason for non-standard depreciation (text entry)
Depreciation charge for the period (RAB)
Closing RAB value under 'non-
standard' depreciation
Closing RAB value under 'standard'
depreciation 878889909192939495 * include additional rows if needed
96 4(vii): Disclosure by Asset Category97 ($000 unless otherwise specified)
98Subtransmission
linesSubtransmission
cables Zone substationsDistribution and
LV linesDistribution and
LV cables
Distribution substations and
transformersDistribution switchgear
Other network assets
Non-network assets Total
99 Total opening RAB value 15,108 1,391 19,326 53,605 24,090 16,594 8,081 3,511 10,161 151,867100 less Total depreciation 655 32 649 1,887 766 652 387 283 380 5,692101 plus Total revaluations 166 15 211 589 265 180 89 38 111 1,665102 plus Assets commissioned 1,250 – 324 2,259 1,012 631 574 197 816 7,061103 less Asset disposals – – 51 – – 162 60 – 16 289104 plus Lost and found assets adjustment –105 plus Adjustment resulting from asset allocation –106 plus Asset category transfers (3) (0) (73) (0) 0 (20) 93 0 3 (0)107 Total closing RAB value 15,866 1,374 19,086 54,565 24,601 16,571 8,389 3,464 10,696 154,613
108109 Asset Life110 Weighted average remaining asset life 33.6 42.4 28.9 37.4 39.9 30.5 24.9 15.8 14.1 (years)111 Weighted average expected total asset life 56.7 55.0 43.5 55.5 59.5 44.7 38.2 26.0 16.7 (years)
Unallocated RAB * RAB
($000 unless otherwise specified)
FINAL 2018 ID schedules 1 to 10 (Hardcoded).XLSX 12 S4.RAB Value (Rolled Forward)
Commerce Commission Information Disclosure Template
Company NameFor Year Ended
SCHEDULE 5a: REPORT ON REGULATORY TAX ALLOWANCE
sch ref
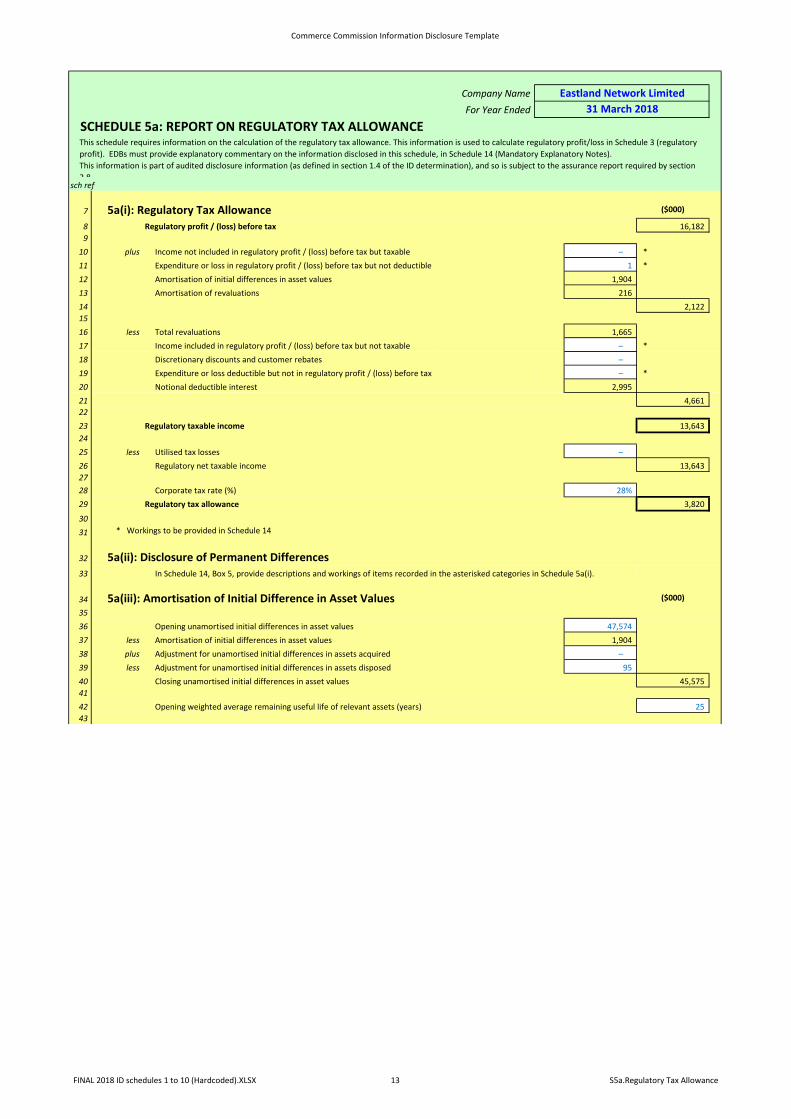
7 5a(i): Regulatory Tax Allowance ($000)
8 Regulatory profit / (loss) before tax 16,1829
10 plus Income not included in regulatory profit / (loss) before tax but taxable – *11 Expenditure or loss in regulatory profit / (loss) before tax but not deductible 1 *12 Amortisation of initial differences in asset values 1,90413 Amortisation of revaluations 21614 2,1221516 less Total revaluations 1,66517 Income included in regulatory profit / (loss) before tax but not taxable – *18 Discretionary discounts and customer rebates –19 Expenditure or loss deductible but not in regulatory profit / (loss) before tax – *20 Notional deductible interest 2,99521 4,6612223 Regulatory taxable income 13,6432425 less Utilised tax losses – 26 Regulatory net taxable income 13,643 2728 Corporate tax rate (%) 28%29 Regulatory tax allowance 3,820
3031 * Workings to be provided in Schedule 14
32 5a(ii): Disclosure of Permanent Differences33 In Schedule 14, Box 5, provide descriptions and workings of items recorded in the asterisked categories in Schedule 5a(i).
34 5a(iii): Amortisation of Initial Difference in Asset Values ($000)
3536 Opening unamortised initial differences in asset values 47,57437 less Amortisation of initial differences in asset values 1,90438 plus Adjustment for unamortised initial differences in assets acquired –39 less Adjustment for unamortised initial differences in assets disposed 9540 Closing unamortised initial differences in asset values 45,5754142 Opening weighted average remaining useful life of relevant assets (years) 2543
This schedule requires information on the calculation of the regulatory tax allowance. This information is used to calculate regulatory profit/loss in Schedule 3 (regulatory profit). EDBs must provide explanatory commentary on the information disclosed in this schedule, in Schedule 14 (Mandatory Explanatory Notes).This information is part of audited disclosure information (as defined in section 1.4 of the ID determination), and so is subject to the assurance report required by section 2.8.
Eastland Network Limited31 March 2018
FINAL 2018 ID schedules 1 to 10 (Hardcoded).XLSX 13 S5a.Regulatory Tax Allowance

Commerce Commission Information Disclosure Template
Company NameFor Year Ended
SCHEDULE 5a: REPORT ON REGULATORY TAX ALLOWANCE
sch ref
This schedule requires information on the calculation of the regulatory tax allowance. This information is used to calculate regulatory profit/loss in Schedule 3 (regulatory profit). EDBs must provide explanatory commentary on the information disclosed in this schedule, in Schedule 14 (Mandatory Explanatory Notes).This information is part of audited disclosure information (as defined in section 1.4 of the ID determination), and so is subject to the assurance report required by section 2.8.
Eastland Network Limited31 March 2018
44 5a(iv): Amortisation of Revaluations ($000)
4546 Opening sum of RAB values without revaluations 140,36547
48 Adjusted depreciation 5,47649 Total depreciation 5,69250 Amortisation of revaluations 21651
52 5a(v): Reconciliation of Tax Losses ($000)
5354 Opening tax losses –55 plus Current period tax losses –56 less Utilised tax losses –57 Closing tax losses –
58 5a(vi): Calculation of Deferred Tax Balance ($000)
5960 Opening deferred tax (6,671)6162 plus Tax effect of adjusted depreciation 1,5336364 less Tax effect of tax depreciation 1,7176566 plus Tax effect of other temporary differences* (9)6768 less Tax effect of amortisation of initial differences in asset values 5336970 plus Deferred tax balance relating to assets acquired in the disclosure year –7172 less Deferred tax balance relating to assets disposed in the disclosure year (34)7374 plus Deferred tax cost allocation adjustment 07576 Closing deferred tax (7,364)
77
78 5a(vii): Disclosure of Temporary Differences
7980
81 5a(viii): Regulatory Tax Asset Base Roll-Forward82 ($000)83 Opening sum of regulatory tax asset values 69,492
84 less Tax depreciation 6,13385 plus Regulatory tax asset value of assets commissioned 7,06186 less Regulatory tax asset value of asset disposals 17087 plus Lost and found assets adjustment –88 plus Adjustment resulting from asset allocation –89 plus Other adjustments to the RAB tax value –90 Closing sum of regulatory tax asset values 70,251
In Schedule 14, Box 6, provide descriptions and workings of items recorded in the asterisked category in Schedule 5a(vi) (Tax effect of other temporary differences).
FINAL 2018 ID schedules 1 to 10 (Hardcoded).XLSX 14 S5a.Regulatory Tax Allowance

Commerce Commission Information Disclosure Template
Company Name
For Year Ended
SCHEDULE 5b: REPORT ON RELATED PARTY TRANSACTIONS
sch ref
7 5b(i): Summary—Related Party Transactions ($000)
8 Total regulatory income 6029 Operational expenditure 4,902
10 Capital expenditure 65611 Market value of asset disposals 5412 Other related party transactions
13 5b(ii): Entities Involved in Related Party Transactions
14 Name of related party 15 Eastech Limited16 Eastland Generation Limited17 Eastland Investment Properties Limited18 Eastland Group Limited
Eastland Energy Solutions Limited
19 Flick Energy Ltd20 * include additional rows if needed
21 5b(iii): Related Party Transactions
22 Name of related party Related party
transaction type
Value of transaction
($000) Basis for determining value23 Eastech Limited Opex 995 ID clause 2.3.6(1)(b)24 Eastech Limited Capex 497 IM clause 2.2.11(5)(b)(ii)25 Eastech Limited Sales 13 ID clause 2.3.7(2)(c)26 Eastech Limited Sales 8 ID clause 2.3.7(2)(c)27 Eastland Energy Solutions Limited Sales 46 ID clause 2.3.7(2)(c)28 Eastland Generation Limited Sales 275 ID clause 2.3.7(2)(c)29 Eastland Generation Limited Sales 102 ID clause 2.3.7(2)(a)30 Eastland Generation Limited Opex 194 ID clause 2.3.6(1)(f)31 Eastland Generation Limited Opex 1,353 ID clause 2.3.6(1)(f)32 Eastland Group Limited Opex 2,361 ID clause 2.3.6(1)(f)33 Flick Energy Ltd Sales 212 ID clause 2.3.7(2)(a)34 Eastland Investment Properties Ltd Capex 159 IM clause 2.2.11(5)(a)(i)35 [Select one] [Select one]36 [Select one] [Select one]37 [Select one] [Select one]38 * include additional rows if needed
Eastland Group Ltd is the 100% shareholder of Eastland Network Ltd
Eastland Network Limited31 March 2018
A subsidiary of the Eastland Group Ltd who is the 100% shareholder of Eastland Network LtdA subsidiary of the Eastland Group Ltd who is the 100% shareholder of Eastland Network LtdA subsidiary of the Eastland Group Ltd who is the 100% shareholder of Eastland Network Ltd
Related party relationship
This schedule provides information on the valuation of related party transactions, in accordance with section 2.3.6 and 2.3.7 of the ID determination. This information is part of audited disclosure information (as defined in section 1.4 of the ID determination), and so is subject to the assurance report required by section 2.8.
Management Fees/Shared Services
Description of transaction
Eastland Energy Solutions Ltd owned 22.6% of Flick Energy Ltd as at 31 March 2017. Eastland Energy Solutions is a wholly owned subsidiary of our parent Eastland Group Ltd.
Fault & Maintenance ServicesElectrical Contract Services that are capital in nature
Sale of transformersMaintenance ServicesConnection ChargesAvoided Cost of TransmissionAvoided Cost of Distribution
A subsidiary of the Eastland Group Ltd who is the 100% shareholder of Eastland Network Ltd
Miscellaneous IncomeSale of transformers
Line ChargesPurchase of Properties
FINAL 2018 ID schedules 1 to 10 (Hardcoded).XLSX 15 S5b.Related Party Transactions

Commerce Commission Information Disclosure Template
Company Name
For Year Ended
SCHEDULE 5b: REPORT ON RELATED PARTY TRANSACTIONS
sch ref
Eastland Network Limited31 March 2018
This schedule provides information on the valuation of related party transactions, in accordance with section 2.3.6 and 2.3.7 of the ID determination. This information is part of audited disclosure information (as defined in section 1.4 of the ID determination), and so is subject to the assurance report required by section 2.8.
FINAL 2018 ID schedules 1 to 10 (Hardcoded).XLSX 16 S5b.Related Party Transactions

Commerce Commission Information Disclosure Template
Company Name
For Year Ended
SCHEDULE 5c: REPORT ON TERM CREDIT SPREAD DIFFERENTIAL ALLOWANCE
sch ref7
8 5c(i): Qualifying Debt (may be Commission only)9
10 Issuing party Issue date Pricing dateOriginal tenor (in
years) Coupon rate (%)Book value at
issue date (NZD)
Book value at date of financial
statements (NZD)Term Credit
Spread Difference
Cost of executing an interest rate
swapDebt issue cost readjustment
111213141516 * include additional rows if needed – – – –17
18 5c(ii): Attribution of Term Credit Spread Differential1920 Gross term credit spread differential –
2122 Total book value of interest bearing debt23 Leverage 44%24 Average opening and closing RAB values25 Attribution Rate (%) –2627 Term credit spread differential allowance –
Eastland Network Limited31 March 2018
This schedule is only to be completed if, as at the date of the most recently published financial statements, the weighted average original tenor of the debt portfolio (both qualifying debt and non-qualifying debt) is greater than five years.This information is part of audited disclosure information (as defined in section 1.4 of the ID determination), and so is subject to the assurance report required by section 2.8.
FINAL 2018 ID schedules 1 to 10 (Hardcoded).XLSX 17 S5c.TCSD Allowance

Commerce Commission Information Disclosure Template
Company NameFor Year Ended
SCHEDULE 5d: REPORT ON COST ALLOCATIONS
sch ref
7 5d(i): Operating Cost Allocations8 Value allocated ($000s)
9Arm's length
deduction
Electricity distribution
services
Non-electricity distribution
services TotalOVABAA allocation
increase ($000s)
10 Service interruptions and emergencies11 Directly attributable 1,27012 Not directly attributable –13 Total attributable to regulated service 1,270
14 Vegetation management15 Directly attributable 1,06816 Not directly attributable –17 Total attributable to regulated service 1,068
18 Routine and corrective maintenance and inspection19 Directly attributable 91820 Not directly attributable –21 Total attributable to regulated service 918
22 Asset replacement and renewal23 Directly attributable 1,55624 Not directly attributable –25 Total attributable to regulated service 1,556
26 System operations and network support27 Directly attributable 1,52728 Not directly attributable 183 183
29 Total attributable to regulated service 1,71030 Business support31 Directly attributable 3,30632 Not directly attributable – 92 – 9233 Total attributable to regulated service 3,3993435 Operating costs directly attributable 9,64736 Operating costs not directly attributable – 275 – 275 –37 Operational expenditure 9,922
38
Eastland Network Limited31 March 2018
This schedule provides information on the allocation of operational costs. EDBs must provide explanatory comment on their cost allocation in Schedule 14 (Mandatory Explanatory Notes), including on the impact of any reclassifications.This information is part of audited disclosure information (as defined in section 1.4 of the ID determination), and so is subject to the assurance report required by section 2.8.
FINAL 2018 ID schedules 1 to 10 (Hardcoded).XLSX 18 S5d.Cost Allocations

Commerce Commission Information Disclosure Template
Company NameFor Year Ended
SCHEDULE 5d: REPORT ON COST ALLOCATIONS
sch ref
Eastland Network Limited31 March 2018
This schedule provides information on the allocation of operational costs. EDBs must provide explanatory comment on their cost allocation in Schedule 14 (Mandatory Explanatory Notes), including on the impact of any reclassifications.This information is part of audited disclosure information (as defined in section 1.4 of the ID determination), and so is subject to the assurance report required by section 2.8.
39 5d(ii): Other Cost Allocations
40 Pass through and recoverable costs ($000)
41 Pass through costs42 Directly attributable 38943 Not directly attributable 44 Total attributable to regulated service 389
45 Recoverable costs46 Directly attributable 6,61347 Not directly attributable 48 Total attributable to regulated service 6,61349
50 5d(iii): Changes in Cost Allocations* †5152 Change in cost allocation 1 CY-1 Current Year (CY)53 Cost category Original allocation54 Original allocator or line items New allocation55 New allocator or line items Difference – –
5657 Rationale for change58596061 Change in cost allocation 2 CY-1 Current Year (CY)62 Cost category Original allocation63 Original allocator or line items New allocation64 New allocator or line items Difference – –
6566 Rationale for change676869 ($000)70 Change in cost allocation 3 CY-1 Current Year (CY)71 Cost category Original allocation72 Original allocator or line items New allocation73 New allocator or line items Difference – –
7475 Rationale for change76777879 † include additional rows if needed
* a change in cost allocation must be completed for each cost allocator change that has occurred in the disclosure year. A movement in an allocator metric is not a change in allocator or component.
($000)
($000)
FINAL 2018 ID schedules 1 to 10 (Hardcoded).XLSX 19 S5d.Cost Allocations

Commerce Commission Information Disclosure Template
Company NameFor Year Ended
SCHEDULE 5e: REPORT ON ASSET ALLOCATIONS
sch ref
7 5e(i): Regulated Service Asset Values
8Value allocated
($000s)
9Electricity distribution
services
10 Subtransmission lines11 Directly attributable 15,86612 Not directly attributable 13 Total attributable to regulated service 15,866
14 Subtransmission cables15 Directly attributable 1,37416 Not directly attributable 17 Total attributable to regulated service 1,374
18 Zone substations19 Directly attributable 19,08620 Not directly attributable 21 Total attributable to regulated service 19,086
22 Distribution and LV lines23 Directly attributable 54,56524 Not directly attributable 25 Total attributable to regulated service 54,565
26 Distribution and LV cables27 Directly attributable 24,60128 Not directly attributable 29 Total attributable to regulated service 24,601
30 Distribution substations and transformers31 Directly attributable 16,57132 Not directly attributable 33 Total attributable to regulated service 16,571
34 Distribution switchgear35 Directly attributable 8,38936 Not directly attributable 37 Total attributable to regulated service 8,389
38 Other network assets39 Directly attributable 3,46440 Not directly attributable 41 Total attributable to regulated service 3,464
42 Non-network assets43 Directly attributable 7,55844 Not directly attributable 3,13845 Total attributable to regulated service 10,6964647 Regulated service asset value directly attributable 151,47548 Regulated service asset value not directly attributable 3,13849 Total closing RAB value 154,613
50
51 5e(ii): Changes in Asset Allocations* †52 ($000)53 Change in asset value allocation 1 CY-1 Current Year (CY)54 Asset category Original allocation55 Original allocator or line items New allocation56 New allocator or line items Difference – –5758 Rationale for change596061 ($000)62 Change in asset value allocation 2 CY-1 Current Year (CY)63 Asset category Original allocation64 Original allocator or line items New allocation65 New allocator or line items Difference – –6667 Rationale for change686970 ($000)71 Change in asset value allocation 3 CY-1 Current Year (CY)72 Asset category Original allocation73 Original allocator or line items New allocation74 New allocator or line items Difference – –7576 Rationale for change77787980 † include additional rows if needed
Eastland Network Limited31 March 2018
* a change in asset allocation must be completed for each allocator or component change that has occurred in the disclosure year. A movement in an allocator metric is not a change in allocator or component.
This schedule requires information on the allocation of asset values. This information supports the calculation of the RAB value in Schedule 4.EDBs must provide explanatory comment on their cost allocation in Schedule 14 (Mandatory Explanatory Notes), including on the impact of any changes in asset allocations. This information is part of audited disclosure information (as defined in section 1.4 of the ID determination), and so is subject to the assurance report required by section 2.8.
FINAL 2018 ID schedules 1 to 10 (Hardcoded).XLSX 20 S5e.Asset Allocations
Commerce Commission Information Disclosure Template
Company Name
For Year Ended
SCHEDULE 6a: REPORT ON CAPITAL EXPENDITURE FOR THE DISCLOSURE YEAR
sch ref
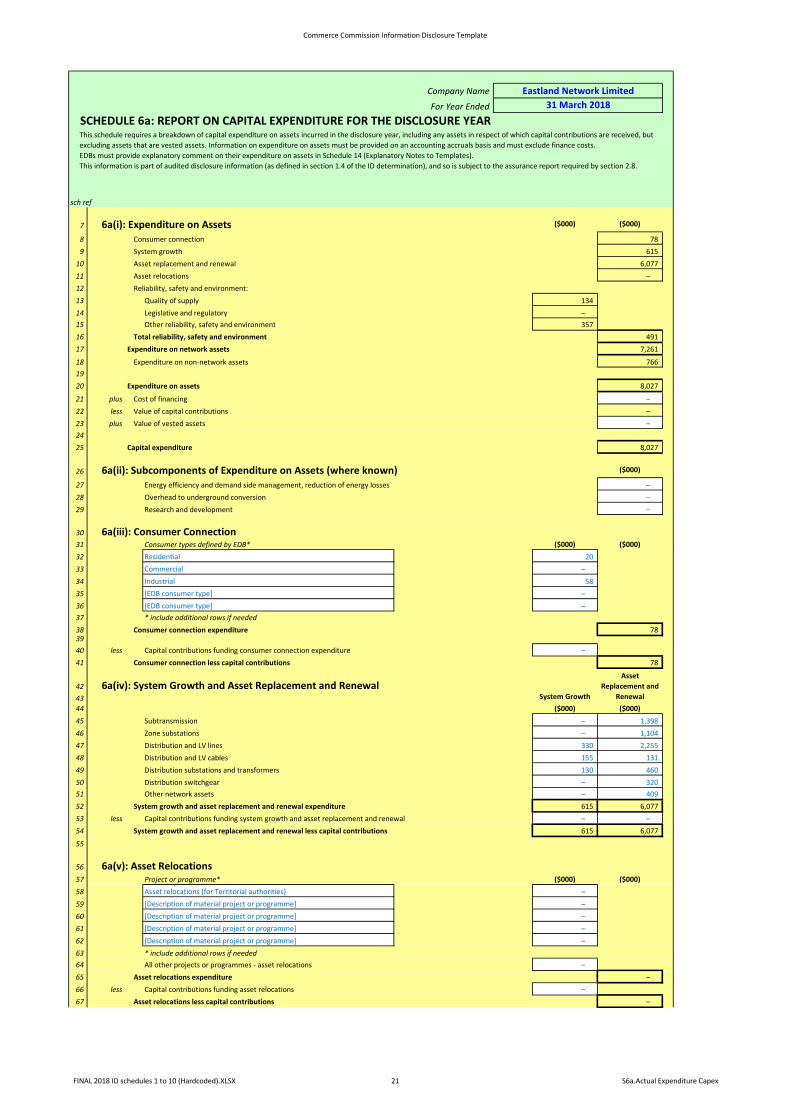
7 6a(i): Expenditure on Assets ($000) ($000)
8 Consumer connection 789 System growth 615
10 Asset replacement and renewal 6,07711 Asset relocations –12 Reliability, safety and environment:13 Quality of supply 13414 Legislative and regulatory –15 Other reliability, safety and environment 35716 Total reliability, safety and environment 49117 Expenditure on network assets 7,261
18 Expenditure on non-network assets 7661920 Expenditure on assets 8,027
21 plus Cost of financing –22 less Value of capital contributions –23 plus Value of vested assets –2425 Capital expenditure 8,027
26 6a(ii): Subcomponents of Expenditure on Assets (where known) ($000)
27 Energy efficiency and demand side management, reduction of energy losses –28 Overhead to underground conversion –29 Research and development –
30 6a(iii): Consumer Connection31 Consumer types defined by EDB* ($000) ($000)32 Residential 2033 Commercial –34 Industrial 5835 [EDB consumer type] –36 [EDB consumer type] –37 * include additional rows if needed38 Consumer connection expenditure 783940 less Capital contributions funding consumer connection expenditure –41 Consumer connection less capital contributions 78
42 6a(iv): System Growth and Asset Replacement and Renewal4344 ($000) ($000)45 Subtransmission – 1,39846 Zone substations – 1,10447 Distribution and LV lines 330 2,25548 Distribution and LV cables 155 13149 Distribution substations and transformers 130 46050 Distribution switchgear – 32051 Other network assets – 40952 System growth and asset replacement and renewal expenditure 615 6,07753 less Capital contributions funding system growth and asset replacement and renewal – –54 System growth and asset replacement and renewal less capital contributions 615 6,077
55
56 6a(v): Asset Relocations57 Project or programme* ($000) ($000)58 Asset relocations (for Territorial authorities) –59 [Description of material project or programme] –60 [Description of material project or programme] –61 [Description of material project or programme] –62 [Description of material project or programme] –63 * include additional rows if needed64 All other projects or programmes - asset relocations –65 Asset relocations expenditure –66 less Capital contributions funding asset relocations –67 Asset relocations less capital contributions –
System Growth
Asset Replacement and
Renewal
Eastland Network Limited31 March 2018
This schedule requires a breakdown of capital expenditure on assets incurred in the disclosure year, including any assets in respect of which capital contributions are received, but excluding assets that are vested assets. Information on expenditure on assets must be provided on an accounting accruals basis and must exclude finance costs. EDBs must provide explanatory comment on their expenditure on assets in Schedule 14 (Explanatory Notes to Templates).This information is part of audited disclosure information (as defined in section 1.4 of the ID determination), and so is subject to the assurance report required by section 2.8.
FINAL 2018 ID schedules 1 to 10 (Hardcoded).XLSX 21 S6a.Actual Expenditure Capex

Commerce Commission Information Disclosure Template
Company Name
For Year Ended
SCHEDULE 6a: REPORT ON CAPITAL EXPENDITURE FOR THE DISCLOSURE YEAR
sch ref
Eastland Network Limited31 March 2018
This schedule requires a breakdown of capital expenditure on assets incurred in the disclosure year, including any assets in respect of which capital contributions are received, but excluding assets that are vested assets. Information on expenditure on assets must be provided on an accounting accruals basis and must exclude finance costs. EDBs must provide explanatory comment on their expenditure on assets in Schedule 14 (Explanatory Notes to Templates).This information is part of audited disclosure information (as defined in section 1.4 of the ID determination), and so is subject to the assurance report required by section 2.8.
68
69 6a(vi): Quality of Supply70 Project or programme* ($000) ($000)71 Building/Switchyard Security Upgrade (2016/17 defer Kaiti) 6072 11kV Field Recloser Automation Plan - additions 3173 SCADA Master Station Development 1574 Alternate Massey Rd Control Room –75 Establish 2x Genset sites (Raupunga & Ruakituri)(defer 2016/17) 2976 * include additional rows if needed77 All other projects programmes - quality of supply78 Quality of supply expenditure 13479 less Capital contributions funding quality of supply80 Quality of supply less capital contributions 134
81 6a(vii): Legislative and Regulatory82 Project or programme* ($000) ($000)83 [Description of material project or programme] –84 [Description of material project or programme] –85 [Description of material project or programme] –86 [Description of material project or programme] –87 [Description of material project or programme] –88 * include additional rows if needed89 All other projects or programmes - legislative and regulatory –90 Legislative and regulatory expenditure –91 less Capital contributions funding legislative and regulatory –92 Legislative and regulatory less capital contributions –
93 6a(viii): Other Reliability, Safety and Environment94 Project or programme* ($000) ($000)95
Wairoa GXP 11kV Feeder Rationalisation/Reinstatement (defer fron 2016/17) 308
96Service Fuse Boxes & Meter Bds to Replace Galv Meter Box (Asbestos), 100pa from 2017- Safety 50
97 [Description of material project or programme] –98 [Description of material project or programme] –99 [Description of material project or programme] –
100 * include additional rows if needed101 All other projects or programmes - other reliability, safety and environment102 Other reliability, safety and environment expenditure 357103 less Capital contributions funding other reliability, safety and environment104 Other reliability, safety and environment less capital contributions 357
105
106 6a(ix): Non-Network Assets107 Routine expenditure108 Project or programme* ($000) ($000)109
Test Instrument & Safety Equipment,(inc Lone worker 17/18) Additional/Upgrade 19
110 Vehicle Replacement @ $60k each (Ntk) 82111 General asset replacement (Ntk) 112112 * include additional rows if needed –113 All other projects or programmes - routine expenditure –114 * include additional rows if needed115 All other projects or programmes - routine expenditure116 Routine expenditure 214
117 Atypical expenditure118 Project or programme* ($000) ($000)119 Property Capital Projects (Eastech Carnarvon St office refurb) 15120 Solar PV Trial (Carnarvon & 2x Wairoa defer from 2016/17) 2121 Property Capital Projects (ENL Carnarvon St earthquake strengthening) 1
Purchase of 168 Carnarvon Street 375Purchase of Properties from Eastland Properties Ltd 159
124 * include additional rows if needed125 All other projects or programmes - atypical expenditure –126 Atypical expenditure 552127128 Expenditure on non-network assets 766
FINAL 2018 ID schedules 1 to 10 (Hardcoded).XLSX 22 S6a.Actual Expenditure Capex
Commerce Commission Information Disclosure Template
Company Name
For Year EndedSCHEDULE 6b: REPORT ON OPERATIONAL EXPENDITURE FOR THE DISCLOSURE YEAR
sch ref
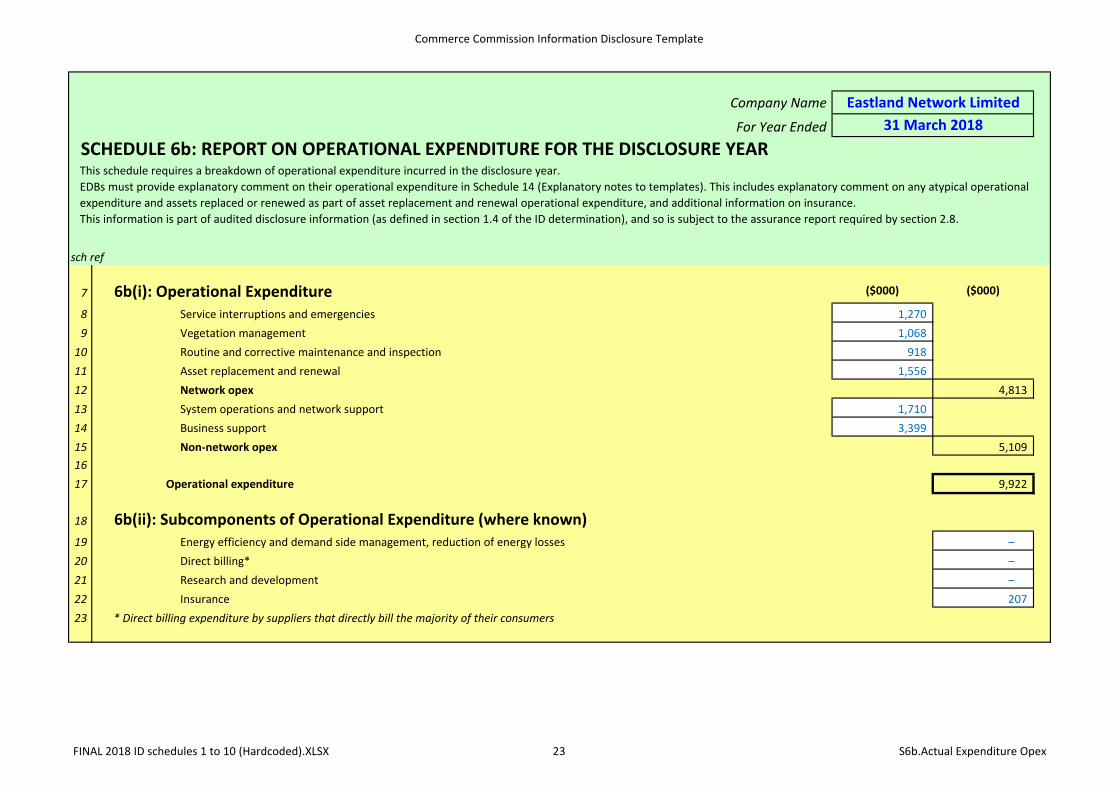
7 6b(i): Operational Expenditure ($000) ($000)
8 Service interruptions and emergencies 1,2709 Vegetation management 1,068
10 Routine and corrective maintenance and inspection 91811 Asset replacement and renewal 1,55612 Network opex 4,81313 System operations and network support 1,71014 Business support 3,39915 Non-network opex 5,1091617 Operational expenditure 9,922
18 6b(ii): Subcomponents of Operational Expenditure (where known)19 Energy efficiency and demand side management, reduction of energy losses –20 Direct billing* –21 Research and development –22 Insurance 20723 * Direct billing expenditure by suppliers that directly bill the majority of their consumers
This schedule requires a breakdown of operational expenditure incurred in the disclosure year. EDBs must provide explanatory comment on their operational expenditure in Schedule 14 (Explanatory notes to templates). This includes explanatory comment on any atypical operational expenditure and assets replaced or renewed as part of asset replacement and renewal operational expenditure, and additional information on insurance.This information is part of audited disclosure information (as defined in section 1.4 of the ID determination), and so is subject to the assurance report required by section 2.8.
Eastland Network Limited31 March 2018
FINAL 2018 ID schedules 1 to 10 (Hardcoded).XLSX 23 S6b.Actual Expenditure Opex

Commerce Commission Information Disclosure Template
Company Name
For Year Ended
SCHEDULE 7: COMPARISON OF FORECASTS TO ACTUAL EXPENDITURE
sch ref
7 7(i): Revenue Target ($000) ¹ Actual ($000) % variance
8 Line charge revenue 36,451 36,850 1%
9 7(ii): Expenditure on Assets Forecast ($000) ² Actual ($000) % variance
10 Consumer connection 112 78 (30%)11 System growth 1,104 615 (44%)12 Asset replacement and renewal 9,199 6,077 (34%)13 Asset relocations 50 – (100%)14 Reliability, safety and environment:15 Quality of supply 206 134 (35%)16 Legislative and regulatory – – –17 Other reliability, safety and environment 541 357 (34%)18 Total reliability, safety and environment 747 491 (34%)19 Expenditure on network assets 11,212 7,261 (35%)20 Expenditure on non-network assets 1,400 766 (45%)21 Expenditure on assets 12,612 8,027 (36%)
22 7(iii): Operational Expenditure 23 Service interruptions and emergencies 1,270 1,270 (0%)24 Vegetation management 1,015 1,068 5%25 Routine and corrective maintenance and inspection 1,614 918 (43%)26 Asset replacement and renewal 2,010 1,556 (23%)27 Network opex 5,909 4,813 (19%)
28 System operations and network support 1,549 1,710 10%29 Business support 3,677 3,399 (8%)30 Non-network opex 5,227 5,109 (2%)31 Operational expenditure 11,136 9,922 (11%)
32 7(iv): Subcomponents of Expenditure on Assets (where known)33 Energy efficiency and demand side management, reduction of energy losses – – –34 Overhead to underground conversion – – –35 Research and development – – –36
37 7(v): Subcomponents of Operational Expenditure (where known) 38 Energy efficiency and demand side management, reduction of energy losses – – –39 Direct billing – – –40 Research and development – – –41 Insurance 177 207 17%4243 1 From the nominal dollar target revenue for the disclosure year disclosed under clause 2.4.3(3) of this determination
44
This schedule compares actual revenue and expenditure to the previous forecasts that were made for the disclosure year. Accordingly, this schedule requires the forecast revenue and expenditure information from previous disclosures to be inserted. EDBs must provide explanatory comment on the variance between actual and target revenue and forecast expenditure in Schedule 14 (Mandatory Explanatory Notes). This information is part of the audited disclosure information (as defined in section 1.4 of the ID determination), and so is subject to the assurance report required by section 2.8. For the purpose of this audit, target revenue and forecast expenditures only need to be verified back to previous disclosures.
Eastland Network Limited31 March 2018
2 From the CY+1 nominal dollar expenditure forecasts disclosed in accordance with clause 2.6.6 for the forecast period starting at the beginning of the disclosure year (the second to last disclosure of Schedules 11a and 11b)
FINAL 2018 ID schedules 1 to 10 (Hardcoded).XLSX 24 S7.Actual vs Forecast

Commerce Commission Information Disclosure Template
Company NameFor Year Ended
Network / Sub-Network Name
SCHEDULE 8: REPORT ON BILLED QUANTITIES AND LINE CHARGE REVENUES
sch ref
8 8(i): Billed Quantities by Price Component9
1011 Billed quantities by price component
12
FixedVariable
UncontrolledVariable
ControlledVariable Night (Mass Market)
Variable Evening Peak (TOU)
Variable Morning Peak (TOU)
Variable Off Peak (TOU)
Variable Night (TOU)
13Consumer group name or price
category codeConsumer type or types (eg, residential, commercial etc.)
Standard or non-standard consumer group (specify)
Average no. of ICPs in disclosure year
Energy delivered to ICPs in disclosure year (MWh)
Days kWh kWh kWh kWh kWh kWh kWh
1415 PDH0030 Domestic Standard 13,821 83,426 5,044,665 60,646,178 22,766,764 12,72016 PDL0030 Domestic Standard 5,687 36,240 2,075,755 27,379,752 8,827,818 32,52017 PNH0003 Non-Domestic, High density Standard 134 651 48,910 650,588 10418 PNH0030 Non-Domestic, High density Standard 1,668 21,742 608,820 20,609,674 1,098,891 33,082
PNH0100 Non-Domestic, High density Standard 282 20,286 102,930 19,750,305 322,624 213,151PNH0300 Non-Domestic, High density Standard 69 14,548 25,185 14,544,902 3,395 –PTH0300 Non-Domestic, High density Standard 7 2,600 2,555 457,211 669,847 859,664 613,005PNH0500 Non-Domestic, High density Standard 17 8,231 6,205 1,257,395 2,128,851 2,674,901 2,170,296PNH1000 Non-Domestic, High density Standard 22 25,671 8,030 4,355,835 6,080,299 8,041,163 7,193,469PNH4500 Non-Domestic, High density Standard 2 11,555 730 1,915,166 2,523,326 3,409,823 3,706,636PNH6500 Non-Domestic, High density Standard 1 15,244 365 2,322,507 3,853,119 4,618,811 4,449,823PNL0003 Non-Domestic, Low density Standard 122 228 44,530 228,178PNL0030 Non-Domestic, Low density Standard 3,545 18,347 1,293,925 16,835,487 1,464,106 47,199PNL0100 Non-Domestic, Low density Standard 100 4,636 36,500 4,475,504 154,020 6,469PNL0300 Non-Domestic, Low density Standard 20 2,126 7,300 2,126,241PTL0300 Non-Domestic, Low density Standard 1 97 365 935 49,797 44,696 1,380PNL0500 Non-Domestic, Low density Standard 4 643 1,460 112,430 151,183 208,791 170,379PNL1000 Non-Domestic, Low density Standard 1 1,011 365 161,299 281,036 345,223 223,426PNL4500 Non-Domestic, Low density Standard 1 12,201 365 1,974,958 3,029,429 3,910,307 3,286,367PNL6500 Non-Domestic, Low density Standard – – –
19 PNG0500 Generation Standard – – –20 PNG1000 Generation (Gensets) Standard 6 – 2,19021 PNG4500 Generation Standard 1 – 36522 PNG6500 Generation (Waihi) Standard 1 – 36523 Power Factor Charges All Customers (If Required) Standard – – –24 [Select one]25 Add extra rows for additional consumer groups or price category codes as necessary26 Standard consumer totals 25,512 279,482 9,311,880 167,246,809 34,637,722 345,141 12,557,736 18,766,887 24,113,379 21,814,78127 Non-standard consumer totals – – – – – – – – – –28 Total for all consumers 25,512 279,482 9,311,880 167,246,809 34,637,722 345,141 12,557,736 18,766,887 24,113,379 21,814,781
29
30
Eastland Network Limited31 March 2018
Add extra columns for additional
billed quantities by price
component as necessary
This schedule requires the billed quantities and associated line charge revenues for each price category code used by the EDB in its pricing schedules. Information is also required on the number of ICPs that are included in each consumer group or price category code, and the energy delivered to these ICPs.
Unit charging basis (eg, days, kW of demand, kVA of capacity, etc.)
Price component
FINAL 2018 ID schedules 1 to 10 (Hardcoded).XLSX 25 S8.Billed Quantities+Revenues

Commerce Commission Information Disclosure Template
Company NameFor Year Ended
Network / Sub-Network Name
SCHEDULE 8: REPORT ON BILLED QUANTITIES AND LINE CHARGE REVENUES
Eastland Network Limited31 March 2018
This schedule requires the billed quantities and associated line charge revenues for each price category code used by the EDB in its pricing schedules. Information is also required on the number of ICPs that are included in each consumer group or price category code, and the energy delivered to these ICPs.
31 8(ii): Line Charge Revenues ($000) by Price Component3233 Line charge revenues ($000) by price component
34
Price component Fixed Component Only
Variable Uncontrolled
(Mass Market)
Variable Controlled (Mass
Market)
Variable Night (Mass Market)
Variable Evening Peak (TOU)
Variable Morning Peak (TOU)
Variable Off Peak (TOU)
Variable Night (TOU)
35Consumer group name or price
category codeConsumer type or types (eg, residential, commercial etc.)
Standard or non-standard consumer group (specify)
Total line charge revenue in disclosure year
Notional revenue foregone from posted
discounts (if applicable)
Total distribution line charge
revenue
Rate (eg, $ per day, $ per kWh, etc.)
$ per day $ per kWh $ per kWh $ per kWh $ per kWh $ per kWh $ per kWh $ per kWh
3637 PDH0030 Domestic Standard $12,722 $9,112 $3,610 $782 $9,989 $1,951 $0 – – – –38 PDL0030 Domestic Standard $6,525 $4,657 $1,868 $336 $5,271 $918 $1 – – – –39 PNH0003 Non-Domestic, High density Standard $120 $77 $44 $22 $99 $0 – – – – –
PNH0030 Non-Domestic, High density Standard $3,773 $2,469 $1,304 $1,447 $2,247 $78 $1 – – – –PNH0100 Non-Domestic, High density Standard $2,234 $1,427 $808 $741 $1,474 $16 $4 – – – –PNH0300 Non-Domestic, High density Standard $1,252 $807 $445 $369 $883 $0 – – – – –PTH0300 Non-Domestic, High density Standard $171 $112 $59 $62 – – – $26 $35 $35 $13PNH0500 Non-Domestic, High density Standard $508 $333 $175 $169 – – – $71 $112 $110 $46PNH1000 Non-Domestic, High density Standard $1,391 $907 $484 $342 – – – $245 $320 $331 $153PNH4500 Non-Domestic, High density Standard $537 $348 $189 $77 – – – $108 $133 $140 $79PNH6500 Non-Domestic, High density Standard $677 $438 $239 $59 – – – $131 $203 $190 $95PNL0003 Non-Domestic, Low density Standard $60 $38 $21 $20 $40 – – – – – –PNL0030 Non-Domestic, Low density Standard $5,131 $3,435 $1,696 $3,100 $1,921 $109 $1 – – – –PNL0100 Non-Domestic, Low density Standard $660 $423 $237 $264 $387 $9 $0 – – – –PNL0300 Non-Domestic, Low density Standard $253 $164 $89 $106 $147 – – – – – –PTL0300 Non-Domestic, Low density Standard $14 $9 $5 $9 – – – $0 $3 $2 $0PNL0500 Non-Domestic, Low density Standard $68 $45 $23 $40 – – – $7 $8 $9 $4PNL1000 Non-Domestic, Low density Standard $60 $39 $21 $15 – – – $9 $15 $15 $5PNL4500 Non-Domestic, Low density Standard $566 $364 $202 $39 – – – $116 $167 $169 $75
40 PNL6500 Non-Domestic, Low density Standard – – – – – – – – – – –41 PNG0500 Generation Standard – – – – – – – – – – –42 PNG1000 Generation (Gensets) Standard $63 $63 – $63 – – – – – – –43 PNG4500 Generation Standard $26 $26 – $26 – – – – – – –44 PNG6500 Generation (Waihi) Standard $39 $39 – $39 – – – – – – –45 Power Factor Charges All Customers (If Required) Standard – – – – – – – – – – –46 [Select one] –47 Add extra rows for additional consumer groups or price category codes as necessary48 Standard consumer totals $36,850 – $25,331 $11,519 $8,125 $22,458 $3,080 $7 $711 $996 $1,003 $47149 Non-standard consumer totals – – – – – – – – – – – –50 Total for all consumers $36,850 – $25,331 $11,519 $8,125 $22,458 $3,080 $7 $711 $996 $1,003 $471
51
52 8(iii): Number of ICPs directly billed Check Error
53 Number of directly billed ICPs at year end 7
Total transmission line charge revenue (if available)
Add extra columns for additional line charge revenues
by price component as
necessary
FINAL 2018 ID schedules 1 to 10 (Hardcoded).XLSX 26 S8.Billed Quantities+Revenues

Commerce Commission Information Disclosure Template
Company Name
For Year EndedNetwork / Sub-network Name
SCHEDULE 9a: ASSET REGISTER
sch ref
8 Voltage Asset category Asset class UnitsItems at start of year (quantity)
Items at end of year (quantity) Net change
Data accuracy(1–4)
9 All Overhead Line Concrete poles / steel structure No. 15752 16003 251 1 10 All Overhead Line Wood poles No. 18564 18284 (280) 1 11 All Overhead Line Other pole types No. – – – 4 12 HV Subtransmission Line Subtransmission OH up to 66kV conductor km 335.961343319042 336.169967102776 0 1 13 HV Subtransmission Line Subtransmission OH 110kV+ conductor km 307.069025185724 307.069125185724 0 1 14 HV Subtransmission Cable Subtransmission UG up to 66kV (XLPE) km 1.409861 1.409861 – 1 15 HV Subtransmission Cable Subtransmission UG up to 66kV (Oil pressurised) km – – – 4 16 HV Subtransmission Cable Subtransmission UG up to 66kV (Gas pressurised) km – – – 4 17 HV Subtransmission Cable Subtransmission UG up to 66kV (PILC) km – – – 4 18 HV Subtransmission Cable Subtransmission UG 110kV+ (XLPE) km – – – 4 19 HV Subtransmission Cable Subtransmission UG 110kV+ (Oil pressurised) km – – – 4 20 HV Subtransmission Cable Subtransmission UG 110kV+ (Gas Pressurised) km – – – 4 21 HV Subtransmission Cable Subtransmission UG 110kV+ (PILC) km – – – 4 22 HV Subtransmission Cable Subtransmission submarine cable km – – – 4 23 HV Zone substation Buildings Zone substations up to 66kV No. 26 26 – 1 24 HV Zone substation Buildings Zone substations 110kV+ No. 3 3 – 1 25 HV Zone substation switchgear 50/66/110kV CB (Indoor) No. – – – 4 26 HV Zone substation switchgear 50/66/110kV CB (Outdoor) No. 45 49 4 1 27 HV Zone substation switchgear 33kV Switch (Ground Mounted) No. – – – 4 28 HV Zone substation switchgear 33kV Switch (Pole Mounted) No. 4 4 – 1 29 HV Zone substation switchgear 33kV RMU No. – – – 4 30 HV Zone substation switchgear 22/33kV CB (Indoor) No. – – – 4 31 HV Zone substation switchgear 22/33kV CB (Outdoor) No. 1 1 – 1 32 HV Zone substation switchgear 3.3/6.6/11/22kV CB (ground mounted) No. 100 98 (2) 1 33 HV Zone substation switchgear 3.3/6.6/11/22kV CB (pole mounted) No. 7 6 (1) 1 34 HV Zone Substation Transformer Zone Substation Transformers No. 51 51 – 1 35 HV Distribution Line Distribution OH Open Wire Conductor km 2396.44900967977 2393.17683199843 (3) 1 36 HV Distribution Line Distribution OH Aerial Cable Conductor km – – – 4 37 HV Distribution Line SWER conductor km 0.7193 0.7193 – 1 38 HV Distribution Cable Distribution UG XLPE or PVC km 30.835571 32.967079 2 1 39 HV Distribution Cable Distribution UG PILC km 103.775183 103.290225 (0) 1 40 HV Distribution Cable Distribution Submarine Cable km – – – 4 41 HV Distribution switchgear 3.3/6.6/11/22kV CB (pole mounted) - reclosers and sectionalisers No. 49 48 (1) 1 42 HV Distribution switchgear 3.3/6.6/11/22kV CB (Indoor) No. 22 24 2 1 43 HV Distribution switchgear 3.3/6.6/11/22kV Switches and fuses (pole mounted) No. 4318 4367 49 1 44 HV Distribution switchgear 3.3/6.6/11/22kV Switch (ground mounted) - except RMU No. 80 75 (5) 1 45 HV Distribution switchgear 3.3/6.6/11/22kV RMU No. 259 259 – 1 46 HV Distribution Transformer Pole Mounted Transformer No. 3032 3018 (14) 1 47 HV Distribution Transformer Ground Mounted Transformer No. 574 576 2 1 48 HV Distribution Transformer Voltage regulators No. 9 9 – 1 49 HV Distribution Substations Ground Mounted Substation Housing No. – – – 4 50 LV LV Line LV OH Conductor km 514.494116420727 511.146821028121 (3) 1 51 LV LV Cable LV UG Cable km 262.614634 266.177008 4 1 52 LV LV Street lighting LV OH/UG Streetlight circuit km 21.234367 21.728603 0 1 53 LV Connections OH/UG consumer service connections No. 31370 31675 305 1 54 All Protection Protection relays (electromechanical, solid state and numeric) No. 203 225 22 1 55 All SCADA and communications SCADA and communications equipment operating as a single system Lot 792 791 (1) 1 56 All Capacitor Banks Capacitors including controls No 1 1 – 3 57 All Load Control Centralised plant Lot 8 8 – 1 58 All Load Control Relays No 15632 15669 37 1 59 All Civils Cable Tunnels km – – – 4
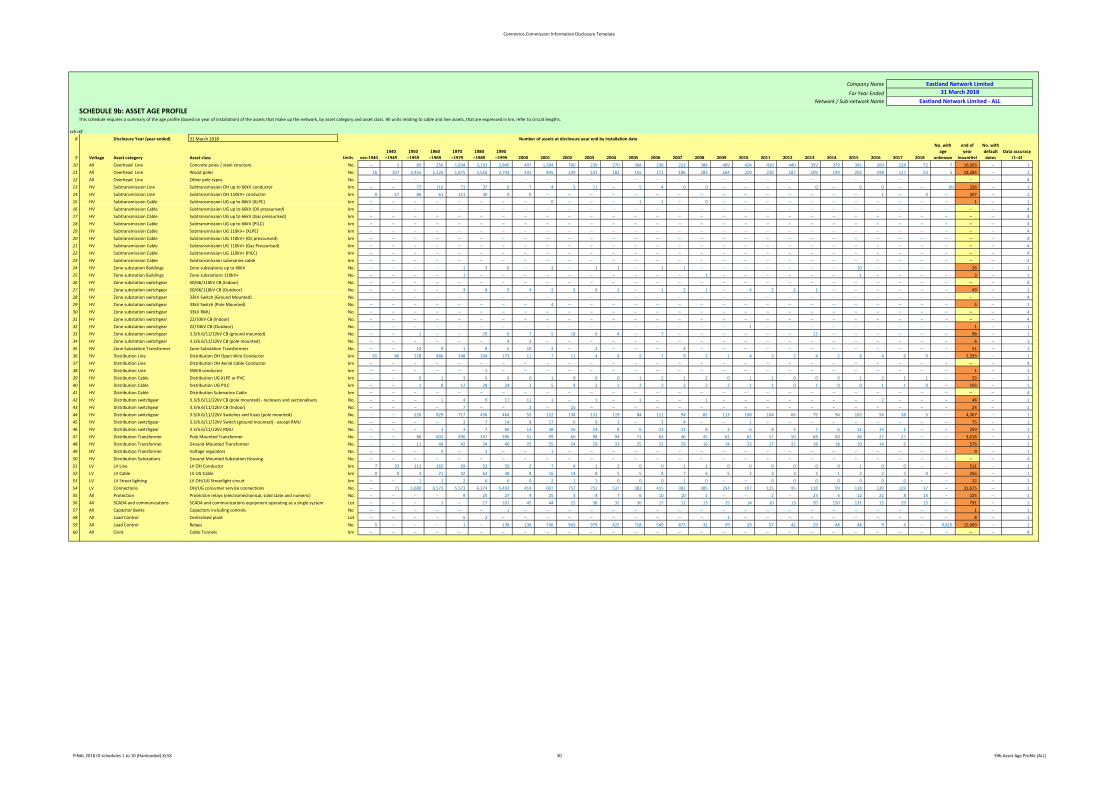
This schedule requires a summary of the quantity of assets that make up the network, by asset category and asset class. All units relating to cable and line assets, that are expressed in km, refer to circuit lengths.
Eastland Network Limited31 March 2018
Eastland Network Ltd - All
FINAL 2018 ID schedules 1 to 10 (Hardcoded).XLSX 27 S9a.Asset Register (ALL)

Commerce Commission Information Disclosure Template
Company Name
For Year EndedNetwork / Sub-network Name
SCHEDULE 9a: ASSET REGISTER
sch ref
8 Voltage Asset category Asset class UnitsItems at start of year (quantity)
Items at end of year (quantity) Net change
Data accuracy(1–4)
9 All Overhead Line Concrete poles / steel structure No. 12610 12727 117 1 10 All Overhead Line Wood poles No. 14153 14003 (150) 1 11 All Overhead Line Other pole types No. – – – 4 12 HV Subtransmission Line Subtransmission OH up to 66kV conductor km 269.300732319042 269.486756102775 0 1 13 HV Subtransmission Line Subtransmission OH 110kV+ conductor km 180.381466569 180.381566569 0 1 14 HV Subtransmission Cable Subtransmission UG up to 66kV (XLPE) km 1.344625 1.344625 – 1 15 HV Subtransmission Cable Subtransmission UG up to 66kV (Oil pressurised) km – – – 4 16 HV Subtransmission Cable Subtransmission UG up to 66kV (Gas pressurised) km – – – 4 17 HV Subtransmission Cable Subtransmission UG up to 66kV (PILC) km – – – 4 18 HV Subtransmission Cable Subtransmission UG 110kV+ (XLPE) km – – – 4 19 HV Subtransmission Cable Subtransmission UG 110kV+ (Oil pressurised) km – – – 4 20 HV Subtransmission Cable Subtransmission UG 110kV+ (Gas Pressurised) km – – – 4 21 HV Subtransmission Cable Subtransmission UG 110kV+ (PILC) km – – – 4 22 HV Subtransmission Cable Subtransmission submarine cable km – – – 4 23 HV Zone substation Buildings Zone substations up to 66kV No. 14 14 – 1 24 HV Zone substation Buildings Zone substations 110kV+ No. 3 3 – 1 25 HV Zone substation switchgear 50/66/110kV CB (Indoor) No. – – – 4 26 HV Zone substation switchgear 50/66/110kV CB (Outdoor) No. 43 44 1 1 27 HV Zone substation switchgear 33kV Switch (Ground Mounted) No. – – – 4 28 HV Zone substation switchgear 33kV Switch (Pole Mounted) No. – – – 1 29 HV Zone substation switchgear 33kV RMU No. – – – 4 30 HV Zone substation switchgear 22/33kV CB (Indoor) No. – – – 4 31 HV Zone substation switchgear 22/33kV CB (Outdoor) No. – – – 1 32 HV Zone substation switchgear 3.3/6.6/11/22kV CB (ground mounted) No. 86 84 (2) 1 33 HV Zone substation switchgear 3.3/6.6/11/22kV CB (pole mounted) No. 5 4 (1) 1 34 HV Zone Substation Transformer Zone Substation Transformers No. 32 32 – 1 35 HV Distribution Line Distribution OH Open Wire Conductor km 1714.70402467977 1713.11234099844 (2) 1 36 HV Distribution Line Distribution OH Aerial Cable Conductor km – – – 4 37 HV Distribution Line SWER conductor km – – – 1 38 HV Distribution Cable Distribution UG XLPE or PVC km 27.576373 28.327613 1 1 39 HV Distribution Cable Distribution UG PILC km 88.246229 – (88) 1 40 HV Distribution Cable Distribution Submarine Cable km – – – 4 41 HV Distribution switchgear 3.3/6.6/11/22kV CB (pole mounted) - reclosers and sectionalisers No. 22 22 – 1 42 HV Distribution switchgear 3.3/6.6/11/22kV CB (Indoor) No. 22 24 2 1 43 HV Distribution switchgear 3.3/6.6/11/22kV Switches and fuses (pole mounted) No. 2991 3025 34 1 44 HV Distribution switchgear 3.3/6.6/11/22kV Switch (ground mounted) - except RMU No. 62 59 (3) 1 45 HV Distribution switchgear 3.3/6.6/11/22kV RMU No. 213 218 5 1 46 HV Distribution Transformer Pole Mounted Transformer No. 2086 2067 (19) 1 47 HV Distribution Transformer Ground Mounted Transformer No. 454 457 3 1 48 HV Distribution Transformer Voltage regulators No. 7 7 – 1 49 HV Distribution Substations Ground Mounted Substation Housing No. – – – 4 50 LV LV Line LV OH Conductor km 380.045518420727 377.065923028121 (3) 1 51 LV LV Cable LV UG Cable km 213.063602 216.0966 3 1 52 LV LV Street lighting LV OH/UG Streetlight circuit km 20.562847 20.902973 0 1 53 LV Connections OH/UG consumer service connections No. 25014 24934 (80) 1 54 All Protection Protection relays (electromechanical, solid state and numeric) No. 166 181 15 1 55 All SCADA and communications SCADA and communications equipment operating as a single system Lot 637 625 (12) 1 56 All Capacitor Banks Capacitors including controls No 1 – (1) 3 57 All Load Control Centralised plant Lot 5 5 – 1 58 All Load Control Relays No 15455 15484 29 1 59 All Civils Cable Tunnels km – – – 4
Eastland Network Limited31 March 2018
Eastland Network Ltd - Gisborne
This schedule requires a summary of the quantity of assets that make up the network, by asset category and asset class. All units relating to cable and line assets, that are expressed in km, refer to circuit lengths.
FINAL 2018 ID schedules 1 to 10 (Hardcoded).XLSX 28 S9a.Asset Register (GIS)

Commerce Commission Information Disclosure Template
Company Name
For Year EndedNetwork / Sub-network Name
SCHEDULE 9a: ASSET REGISTER
sch ref
8 Voltage Asset category Asset class UnitsItems at start of year (quantity)
Items at end of year (quantity) Net change
Data accuracy(1–4)
9 All Overhead Line Concrete poles / steel structure No. 2,833 3,276 443 1 10 All Overhead Line Wood poles No. 4,222 4,281 59 1 11 All Overhead Line Other pole types No. – – – 4 12 HV Subtransmission Line Subtransmission OH up to 66kV conductor km 67 67 0 1 13 HV Subtransmission Line Subtransmission OH 110kV+ conductor km 127 127 – 1 14 HV Subtransmission Cable Subtransmission UG up to 66kV (XLPE) km 0 0 – 1 15 HV Subtransmission Cable Subtransmission UG up to 66kV (Oil pressurised) km – – – 4 16 HV Subtransmission Cable Subtransmission UG up to 66kV (Gas pressurised) km – – – 4 17 HV Subtransmission Cable Subtransmission UG up to 66kV (PILC) km – – – 4 18 HV Subtransmission Cable Subtransmission UG 110kV+ (XLPE) km – – – 4 19 HV Subtransmission Cable Subtransmission UG 110kV+ (Oil pressurised) km – – – 4 20 HV Subtransmission Cable Subtransmission UG 110kV+ (Gas Pressurised) km – – – 4 21 HV Subtransmission Cable Subtransmission UG 110kV+ (PILC) km – – – 4 22 HV Subtransmission Cable Subtransmission submarine cable km – – – 4 23 HV Zone substation Buildings Zone substations up to 66kV No. 12 12 – 1 24 HV Zone substation Buildings Zone substations 110kV+ No. – – – 1 25 HV Zone substation switchgear 50/66/110kV CB (Indoor) No. – – – 4 26 HV Zone substation switchgear 50/66/110kV CB (Outdoor) No. 1 5 4 1 27 HV Zone substation switchgear 33kV Switch (Ground Mounted) No. – – – 4 28 HV Zone substation switchgear 33kV Switch (Pole Mounted) No. 4 4 – 1 29 HV Zone substation switchgear 33kV RMU No. – – – 4 30 HV Zone substation switchgear 22/33kV CB (Indoor) No. – – – 4 31 HV Zone substation switchgear 22/33kV CB (Outdoor) No. 1 1 – 1 32 HV Zone substation switchgear 3.3/6.6/11/22kV CB (ground mounted) No. 14 14 – 1 33 HV Zone substation switchgear 3.3/6.6/11/22kV CB (pole mounted) No. 2 2 – 1 34 HV Zone Substation Transformer Zone Substation Transformers No. 19 19 – 1 35 HV Distribution Line Distribution OH Open Wire Conductor km 680 680 0 1 36 HV Distribution Line Distribution OH Aerial Cable Conductor km – – – 4 37 HV Distribution Line SWER conductor km 1 1 – 1 38 HV Distribution Cable Distribution UG XLPE or PVC km 5 5 (1) 1 39 HV Distribution Cable Distribution UG PILC km 16 103 88 1 40 HV Distribution Cable Distribution Submarine Cable km – – – 4 41 HV Distribution switchgear 3.3/6.6/11/22kV CB (pole mounted) - reclosers and sectionalisers No. 27 26 (1) 1 42 HV Distribution switchgear 3.3/6.6/11/22kV CB (Indoor) No. – – – 1 43 HV Distribution switchgear 3.3/6.6/11/22kV Switches and fuses (pole mounted) No. 1,325 1,342 17 1 44 HV Distribution switchgear 3.3/6.6/11/22kV Switch (ground mounted) - except RMU No. 10 16 6 1 45 HV Distribution switchgear 3.3/6.6/11/22kV RMU No. 47 41 (6) 1 46 HV Distribution Transformer Pole Mounted Transformer No. 940 951 11 1 47 HV Distribution Transformer Ground Mounted Transformer No. 116 119 3 1 48 HV Distribution Transformer Voltage regulators No. 2 2 – 1 49 HV Distribution Substations Ground Mounted Substation Housing No. – – – 4 50 LV LV Line LV OH Conductor km 132 134 2 1 51 LV LV Cable LV UG Cable km 51 50 (1) 1 52 LV LV Street lighting LV OH/UG Streetlight circuit km 1 1 0 1 53 LV Connections OH/UG consumer service connections No. 6,242 6,741 499 1 54 All Protection Protection relays (electromechanical, solid state and numeric) No. 37 44 7 1 55 All SCADA and communications SCADA and communications equipment operating as a single system Lot 198 166 (32) 1 56 All Capacitor Banks Capacitors including controls No – 1 1 3 57 All Load Control Centralised plant Lot 3 3 – 1 58 All Load Control Relays No 196 185 (11) 1 59 All Civils Cable Tunnels km – – – 4
Eastland Network Limited31 March 2018
Eastland Network Ltd - Wairoa
This schedule requires a summary of the quantity of assets that make up the network, by asset category and asset class. All units relating to cable and line assets, that are expressed in km, refer to circuit lengths.
FINAL 2018 ID schedules 1 to 10 (Hardcoded).XLSX 29 S9a.Asset Register (WRA)
Commerce Commission Information Disclosure Template
Company Name
For Year EndedNetwork / Sub-network Name
SCHEDULE 9b: ASSET AGE PROFILE
sch ref8 Disclosure Year (year ended) 31 March 2018
9 Voltage Asset category Asset class Units pre-19401940
–19491950
–19591960
–19691970
–19791980
–19891990
–1999 2000 2001 2002 2003 2004 2005 2006 2007 2008 2009 2010 2011 2012 2013 2014 2015 2016 2017 2018
No. with age
unknown
Items at end of year
(quantity)
No. withdefaultdates
Data accuracy(1–4)
10 All Overhead Line Concrete poles / steel structure No. – 1 85 250 1,834 3,193 2,845 497 1,394 780 239 270 368 238 223 388 409 424 420 440 359 379 391 269 228 72 7 16,003 – 111 All Overhead Line Wood poles No. 16 107 2,455 5,126 1,875 1,516 2,743 431 845 239 131 182 155 171 186 283 264 229 210 187 209 149 202 198 117 53 5 18,284 – 112 All Overhead Line Other pole types No. – – – – – – – – – – – – – – – – – – – – – – – – – – – – – 413 HV Subtransmission Line Subtransmission OH up to 66kV conductor km – – 72 116 71 37 6 7 4 3 11 – 5 4 0 0 – – – – 0 – 0 0 – – (0) 336 – 114 HV Subtransmission Line Subtransmission OH 110kV+ conductor km 0 17 86 61 111 30 0 0 – – – – – – – – – – – – – – – 1 – 0 – 307 – 115 HV Subtransmission Cable Subtransmission UG up to 66kV (XLPE) km – – – – – – – – 0 – – – 1 1 – 0 – – – – – – – – – – – 1 – 116 HV Subtransmission Cable Subtransmission UG up to 66kV (Oil pressurised) km – – – – – – – – – – – – – – – – – – – – – – – – – – – – – 417 HV Subtransmission Cable Subtransmission UG up to 66kV (Gas pressurised) km – – – – – – – – – – – – – – – – – – – – – – – – – – – – – 418 HV Subtransmission Cable Subtransmission UG up to 66kV (PILC) km – – – – – – – – – – – – – – – – – – – – – – – – – – – – – 419 HV Subtransmission Cable Subtransmission UG 110kV+ (XLPE) km – – – – – – – – – – – – – – – – – – – – – – – – – – – – – 420 HV Subtransmission Cable Subtransmission UG 110kV+ (Oil pressurised) km – – – – – – – – – – – – – – – – – – – – – – – – – – – – – 421 HV Subtransmission Cable Subtransmission UG 110kV+ (Gas Pressurised) km – – – – – – – – – – – – – – – – – – – – – – – – – – – – – 422 HV Subtransmission Cable Subtransmission UG 110kV+ (PILC) km – – – – – – – – – – – – – – – – – – – – – – – – – – – – – 423 HV Subtransmission Cable Subtransmission submarine cable km – – – – – – – – – – – – – – – – – – – – – – – – – – – – – 424 HV Zone substation Buildings Zone substations up to 66kV No. – – – – 1 3 6 – 2 – 1 1 – 1 1 – – – – – – – 10 – – – – 26 – 125 HV Zone substation Buildings Zone substations 110kV+ No. – – – – 1 – – – – – – – – – – 1 – – – – – – 1 – – – – 3 – 126 HV Zone substation switchgear 50/66/110kV CB (Indoor) No. – – – – – – – – – – – – – – – – – – – – – – – – – – – – – 427 HV Zone substation switchgear 50/66/110kV CB (Outdoor) No. – – – – 3 8 9 4 2 3 6 1 – 1 2 1 – 4 2 2 1 – – – – – – 49 – 128 HV Zone substation switchgear 33kV Switch (Ground Mounted) No. – – – – – – – – – – – – – – – – – – – – – – – – – – – – – 429 HV Zone substation switchgear 33kV Switch (Pole Mounted) No. – – – – – – – – 4 – – – – – – – – – – – – – – – – – – 4 – 130 HV Zone substation switchgear 33kV RMU No. – – – – – – – – – – – – – – – – – – – – – – – – – – – – – 431 HV Zone substation switchgear 22/33kV CB (Indoor) No. – – – – – – – – – – – – – – – – – – – – – – – – – – – – – 432 HV Zone substation switchgear 22/33kV CB (Outdoor) No. – – – – – – – – – – – – – – – – – 1 – – – – – – – – – 1 – 133 HV Zone substation switchgear 3.3/6.6/11/22kV CB (ground mounted) No. – – 1 – – 29 9 7 5 18 6 4 – 7 – – – – – – 12 – – – – – – 98 – 134 HV Zone substation switchgear 3.3/6.6/11/22kV CB (pole mounted) No. – – – – – – 4 2 – – – – – – – – – – – – – – – – – – – 6 – 135 HV Zone Substation Transformer Zone Substation Transformers No. – – 10 9 1 8 5 10 2 – 2 – – – 4 – – – – – – – – – – – – 51 – 136 HV Distribution Line Distribution OH Open Wire Conductor km 65 86 528 886 348 204 173 11 7 11 4 8 9 7 9 3 1 4 3 2 4 2 8 4 6 0 – 2,393 – 137 HV Distribution Line Distribution OH Aerial Cable Conductor km – – – – – – – – – – – – – – – – – – – – – – – – – – – – – 438 HV Distribution Line SWER conductor km – – – – – 1 – – – – – – – – – – – – – – – – – – – – – 1 – 139 HV Distribution Cable Distribution UG XLPE or PVC km – – 0 1 3 6 6 0 1 0 0 0 1 2 1 2 0 1 1 0 0 0 1 2 1 1 – 33 – 140 HV Distribution Cable Distribution UG PILC km – – 1 8 12 28 24 2 5 4 2 1 2 2 3 2 2 1 1 0 1 0 0 1 1 0 – 103 – 141 HV Distribution Cable Distribution Submarine Cable km – – – – – – – – – – – – – – – – – – – – – – – – – – – – – 442 HV Distribution switchgear 3.3/6.6/11/22kV CB (pole mounted) - reclosers and sectionalisers No. – – – 1 4 9 17 11 1 – 1 – 1 – – 1 – – – – – – – 2 – – – 48 – 143 HV Distribution switchgear 3.3/6.6/11/22kV CB (Indoor) No. – – – – 7 – – 2 – 15 – – – – – – – – – – – – – – – – – 24 – 144 HV Distribution switchgear 3.3/6.6/11/22kV Switches and fuses (pole mounted) No. – – 226 829 717 436 464 55 122 138 131 119 84 111 94 82 113 108 104 66 75 94 102 54 38 5 – 4,367 – 145 HV Distribution switchgear 3.3/6.6/11/22kV Switch (ground mounted) - except RMU No. – – – – 3 7 14 8 17 6 9 1 – 5 4 – – 1 – – – – – – – – – 75 – 146 HV Distribution switchgear 3.3/6.6/11/22kV RMU No. – – – 1 3 7 60 13 38 16 14 8 6 13 11 8 3 6 8 5 7 6 11 14 1 – – 259 – 147 HV Distribution Transformer Pole Mounted Transformer No. – – 88 602 490 347 396 51 99 60 98 94 71 83 46 45 62 61 57 50 68 50 46 27 27 – – 3,018 – 148 HV Distribution Transformer Ground Mounted Transformer No. – – 11 49 42 34 40 25 55 24 29 33 25 22 29 16 14 23 17 22 18 18 10 14 6 – – 576 – 149 HV Distribution Transformer Voltage regulators No. – – – 5 – 3 – – 1 – – – – – – – – – – – – – – – – – – 9 – 150 HV Distribution Substations Ground Mounted Substation Housing No. – – – – – – – – – – – – – – – – – – – – – – – – – – – – – 451 LV LV Line LV OH Conductor km 7 33 112 165 69 53 50 2 7 4 1 2 0 0 1 1 0 0 0 0 0 0 1 0 0 – – 511 – 152 LV LV Cable LV UG Cable km 0 0 3 21 42 63 38 8 16 14 8 5 5 4 7 6 5 2 3 3 3 1 2 2 3 0 – 266 – 153 LV LV Street lighting LV OH/UG Streetlight circuit km – – 1 1 2 6 6 0 2 1 1 0 0 0 1 0 – – 0 0 0 0 0 0 0 – – 22 – 154 LV Connections OH/UG consumer service connections No. – 71 1,680 6,573 5,573 6,374 5,492 414 697 757 751 537 382 415 382 385 254 107 115 95 118 99 118 120 129 37 – 31,675 – 155 All Protection Protection relays (electromechanical, solid state and numeric) No. – – – – 9 25 27 9 25 3 8 7 6 10 10 2 – – 2 – 23 4 12 22 8 13 – 225 – 156 All SCADA and communications SCADA and communications equipment operating as a single system Lot – – – 1 – 17 101 45 44 25 38 31 36 17 11 13 15 14 10 13 20 150 131 15 29 15 – 791 – 157 All Capacitor Banks Capacitors including controls No – – – – – – 1 – – – – – – – – – – – – – – – – – – – – 1 – 158 All Load Control Centralised plant Lot – – – – 5 2 – – – – – – – – – – 1 – – – – – – – – – – 8 – 159 All Load Control Relays No 5 – – – 1 – 138 136 736 943 979 425 718 549 873 31 59 29 57 42 29 48 48 9 4 – 9,810 15,669 – 160 All Civils Cable Tunnels km – – – – – – – – – – – – – – – – – – – – – – – – – – – – – 4
This schedule requires a summary of the age profile (based on year of installation) of the assets that make up the network, by asset category and asset class. All units relating to cable and line assets, that are expressed in km, refer to circuit lengths.
Eastland Network Limited31 March 2018
Eastland Network Limited - ALL
Number of assets at disclosure year end by installation date
FINAL 2018 ID schedules 1 to 10 (Hardcoded).XLSX 30 S9b.Asset Age Profile (ALL)

Commerce Commission Information Disclosure Template
Company Name
For Year EndedNetwork / Sub-network Name
SCHEDULE 9b: ASSET AGE PROFILE
sch ref8 Disclosure Year (year ended) 31 March 2018
9 Voltage Asset category Asset class Units pre-19401940
–19491950
–19591960
–19691970
–19791980
–19891990
–1999 2000 2001 2002 2003 2004 2005 2006 2007 2008 2009 2010 2011 2012 2013 2014 2015 2016 2017 2018
No. with age
unknown
Items at end of year
(quantity)
No. withdefaultdates
Data accuracy(1–4)
10 All Overhead Line Concrete poles / steel structure No. – 1 22 41 1,414 2,270 2,662 350 1,020 573 155 192 300 185 193 330 358 411 410 432 330 357 345 237 115 23 1 12,727 – 111 All Overhead Line Wood poles No. 1 26 1,510 4,534 1,420 1,157 2,144 134 594 176 88 121 101 100 125 266 172 218 189 161 167 133 185 190 76 10 5 14,003 – 112 All Overhead Line Other pole types No. – – – – – – – – – – – – – – – – – – – – – – – – – – – – – 413 HV Subtransmission Line Subtransmission OH up to 66kV conductor km – – 72 116 37 5 6 7 4 3 11 – 5 4 0 0 – – – – 0 – 0 0 – 0 – 269 – 114 HV Subtransmission Line Subtransmission OH 110kV+ conductor km 0 17 29 61 49 23 0 – – – – – – – – – – – – – – – – 1 – 0 0 180 – 115 HV Subtransmission Cable Subtransmission UG up to 66kV (XLPE) km – – – – – – – – – – – – 1 1 – 0 – – – – – – – – – – – 1 – 116 HV Subtransmission Cable Subtransmission UG up to 66kV (Oil pressurised) km – – – – – – – – – – – – – – – – – – – – – – – – – – – – – 417 HV Subtransmission Cable Subtransmission UG up to 66kV (Gas pressurised) km – – – – – – – – – – – – – – – – – – – – – – – – – – – – – 418 HV Subtransmission Cable Subtransmission UG up to 66kV (PILC) km – – – – – – – – – – – – – – – – – – – – – – – – – – – – – 419 HV Subtransmission Cable Subtransmission UG 110kV+ (XLPE) km – – – – – – – – – – – – – – – – – – – – – – – – – – – – – 420 HV Subtransmission Cable Subtransmission UG 110kV+ (Oil pressurised) km – – – – – – – – – – – – – – – – – – – – – – – – – – – – – 421 HV Subtransmission Cable Subtransmission UG 110kV+ (Gas Pressurised) km – – – – – – – – – – – – – – – – – – – – – – – – – – – – – 422 HV Subtransmission Cable Subtransmission UG 110kV+ (PILC) km – – – – – – – – – – – – – – – – – – – – – – – – – – – – – 423 HV Subtransmission Cable Subtransmission submarine cable km – – – – – – – – – – – – – – – – – – – – – – – – – – – – – 424 HV Zone substation Buildings Zone substations up to 66kV No. – – – – 1 3 4 – 2 – 1 1 – 1 1 – – – – – – – – – – – – 14 – 125 HV Zone substation Buildings Zone substations 110kV+ No. – – – – 1 – – – – – – – – – – 1 – – – – – – 1 – – – – 3 – 126 HV Zone substation switchgear 50/66/110kV CB (Indoor) No. – – – – – – – – – – – – – – – – – – – – – – – – – – – – – 427 HV Zone substation switchgear 50/66/110kV CB (Outdoor) No. – – – – 3 5 9 2 2 3 6 1 – 1 2 1 – 4 2 2 1 – – – – – – 44 – 128 HV Zone substation switchgear 33kV Switch (Ground Mounted) No. – – – – – – – – – – – – – – – – – – – – – – – – – – – – – 429 HV Zone substation switchgear 33kV Switch (Pole Mounted) No. – – – – – – – – – – – – – – – – – – – – – – – – – – – – – 130 HV Zone substation switchgear 33kV RMU No. – – – – – – – – – – – – – – – – – – – – – – – – – – – – – 431 HV Zone substation switchgear 22/33kV CB (Indoor) No. – – – – – – – – – – – – – – – – – – – – – – – – – – – – – 432 HV Zone substation switchgear 22/33kV CB (Outdoor) No. – – – – – – – – – – – – – – – – – – – – – – – – – – – – – 133 HV Zone substation switchgear 3.3/6.6/11/22kV CB (ground mounted) No. – – – – – 19 9 7 5 18 6 4 – 4 – – – – – – 12 – – – – – – 84 – 134 HV Zone substation switchgear 3.3/6.6/11/22kV CB (pole mounted) No. – – – – – – 4 – – – – – – – – – – – – – – – – – – – – 4 – 135 HV Zone Substation Transformer Zone Substation Transformers No. – – 8 7 1 2 5 2 2 – 2 – – – 3 – – – – – – – – – – – – 32 – 136 HV Distribution Line Distribution OH Open Wire Conductor km – 6 322 700 305 141 168 11 5 7 2 2 6 4 3 2 1 4 3 2 3 1 7 3 5 0 – 1,713 – 137 HV Distribution Line Distribution OH Aerial Cable Conductor km – – – – – – – – – – – – – – – – – – – – – – – – – – – – – 438 HV Distribution Line SWER conductor km – – – – – – – – – – – – – – – – – – – – – – – – – – – – – 139 HV Distribution Cable Distribution UG XLPE or PVC km – – 0 0 3 6 4 0 1 0 0 0 1 2 1 2 0 1 1 0 0 0 1 2 1 0 0 28 – 140 HV Distribution Cable Distribution UG PILC km – – – – – – – – – – – – – – – – – – – – – – – – – – – – – 141 HV Distribution Cable Distribution Submarine Cable km – – – – – – – – – – – – – – – – – – – – – – – – – – – – – 442 HV Distribution switchgear 3.3/6.6/11/22kV CB (pole mounted) - reclosers and sectionalisers No. – – – 1 – 1 8 10 – – 1 – – – – – – – – – – – – 1 – – – 22 – 143 HV Distribution switchgear 3.3/6.6/11/22kV CB (Indoor) No. – – – – 7 – – 2 – 15 – – – – – – – – – – – – – – – – – 24 – 144 HV Distribution switchgear 3.3/6.6/11/22kV Switches and fuses (pole mounted) No. – – 204 495 476 265 315 41 96 95 81 71 63 80 72 63 90 94 77 50 50 83 86 48 27 3 – 3,025 – 145 HV Distribution switchgear 3.3/6.6/11/22kV Switch (ground mounted) - except RMU No. – – – – 3 3 14 8 13 6 7 1 – 1 2 – – 1 – – – – – – – – – 59 – 146 HV Distribution switchgear 3.3/6.6/11/22kV RMU No. – – – 1 2 1 53 13 31 16 9 6 6 9 8 8 3 5 8 3 6 6 11 12 1 – – 218 – 147 HV Distribution Transformer Pole Mounted Transformer No. – – 80 335 337 231 276 40 79 42 63 56 52 64 40 35 56 49 44 38 45 42 34 15 14 – – 2,067 – 148 HV Distribution Transformer Ground Mounted Transformer No. – – 11 32 34 24 31 23 50 21 22 26 16 16 20 14 13 20 17 16 11 13 9 14 4 – – 457 – 149 HV Distribution Transformer Voltage regulators No. – – – 4 – 3 – – – – – – – – – – – – – – – – – – – – – 7 – 150 HV Distribution Substations Ground Mounted Substation Housing No. – – – – – – – – – – – – – – – – – – – – – – – – – – – – – 451 LV LV Line LV OH Conductor km 0 2 70 135 60 44 48 1 7 4 1 1 0 0 1 1 0 0 0 0 0 0 0 0 0 – 0 377 – 152 LV LV Cable LV UG Cable km – – 1 17 31 47 31 7 16 14 7 4 4 3 5 5 5 2 3 3 3 1 2 2 3 0 0 216 – 153 LV LV Street lighting LV OH/UG Streetlight circuit km – – 1 1 2 5 6 0 2 1 0 0 0 0 1 0 – – 0 0 0 0 0 0 – – 0 21 – 154 LV Connections OH/UG consumer service connections No. – 71 1,664 4,812 4,483 4,908 4,675 342 614 590 383 358 302 356 321 327 228 102 111 84 112 91 – – – – – 24,934 – 155 All Protection Protection relays (electromechanical, solid state and numeric) No. – – – – 9 15 26 9 18 3 7 7 3 10 9 2 – – 1 – 23 4 2 19 8 6 – 181 – 156 All SCADA and communications SCADA and communications equipment operating as a single system Lot – – – 1 – 17 82 32 20 21 30 30 16 17 10 10 13 14 8 9 18 133 106 15 17 6 – 625 – 157 All Capacitor Banks Capacitors including controls No – – – – – – – – – – – – – – – – – – – – – – – – – – – – – 158 All Load Control Centralised plant Lot – – – – 5 – – – – – – – – – – – – – – – – – – – – – – 5 – 159 All Load Control Relays No 5 – – – 1 – 136 136 731 939 965 412 710 540 869 31 59 29 56 42 28 48 47 9 4 – 9,687 15,484 – 160 All Civils Cable Tunnels km – – – – – – – – – – – – – – – – – – – – – – – – – – – – – 4
Eastland Network Limited31 March 2018
Eastland Network Limited - Gisborne
This schedule requires a summary of the age profile (based on year of installation) of the assets that make up the network, by asset category and asset class. All units relating to cable and line assets, that are expressed in km, refer to circuit lengths.
Number of assets at disclosure year end by installation date
FINAL 2018 ID schedules 1 to 10 (Hardcoded).XLSX 31 S9b.Asset Age Profile (GIS)

Commerce Commission Information Disclosure Template
Company Name
For Year EndedNetwork / Sub-network Name
SCHEDULE 9b: ASSET AGE PROFILE
sch ref8 Disclosure Year (year ended) 31 March 2018
9 Voltage Asset category Asset class Units pre-19401940
–19491950
–19591960
–19691970
–19791980
–19891990
–1999 2000 2001 2002 2003 2004 2005 2006 2007 2008 2009 2010 2011 2012 2013 2014 2015 2016 2017 2018
No. with age
unknown
Items at end of year
(quantity)
No. withdefaultdates
Data accuracy(1–4)
10 All Overhead Line Concrete poles / steel structure No. – – 63 209 420 923 183 147 374 207 84 78 68 53 30 58 51 13 10 8 29 22 46 32 113 49 6 3,276 – 111 All Overhead Line Wood poles No. 15 81 945 592 455 359 599 297 251 63 43 61 54 71 61 17 92 11 21 26 42 16 17 8 41 43 – 4,281 – 112 All Overhead Line Other pole types No. – – – – – – – – – – – – – – – – – – – – – – – – – – – – – 413 HV Subtransmission Line Subtransmission OH up to 66kV conductor km – – – – 34 32 – – 0 – – – – – – – – – – – – – – – – (0) (0) 67 – 114 HV Subtransmission Line Subtransmission OH 110kV+ conductor km – 0 57 – 63 7 – 0 – – – – – – – – – – – – – – – – – – (0) 127 – 115 HV Subtransmission Cable Subtransmission UG up to 66kV (XLPE) km – – – – – – – – 0 – – – – – – – – – – – – – – – – – – 0 – 116 HV Subtransmission Cable Subtransmission UG up to 66kV (Oil pressurised) km – – – – – – – – – – – – – – – – – – – – – – – – – – – – – 417 HV Subtransmission Cable Subtransmission UG up to 66kV (Gas pressurised) km – – – – – – – – – – – – – – – – – – – – – – – – – – – – – 418 HV Subtransmission Cable Subtransmission UG up to 66kV (PILC) km – – – – – – – – – – – – – – – – – – – – – – – – – – – – – 419 HV Subtransmission Cable Subtransmission UG 110kV+ (XLPE) km – – – – – – – – – – – – – – – – – – – – – – – – – – – – – 420 HV Subtransmission Cable Subtransmission UG 110kV+ (Oil pressurised) km – – – – – – – – – – – – – – – – – – – – – – – – – – – – – 421 HV Subtransmission Cable Subtransmission UG 110kV+ (Gas Pressurised) km – – – – – – – – – – – – – – – – – – – – – – – – – – – – – 422 HV Subtransmission Cable Subtransmission UG 110kV+ (PILC) km – – – – – – – – – – – – – – – – – – – – – – – – – – – – – 423 HV Subtransmission Cable Subtransmission submarine cable km – – – – – – – – – – – – – – – – – – – – – – – – – – – – – 424 HV Zone substation Buildings Zone substations up to 66kV No. – – – – – – 2 – – – – – – – – – – – – – – – 10 – – – – 12 – 125 HV Zone substation Buildings Zone substations 110kV+ No. – – – – – – – – – – – – – – – – – – – – – – – – – – – – – 126 HV Zone substation switchgear 50/66/110kV CB (Indoor) No. – – – – – – – – – – – – – – – – – – – – – – – – – – – – – 427 HV Zone substation switchgear 50/66/110kV CB (Outdoor) No. – – – – – 3 – 2 – – – – – – – – – – – – – – – – – – – 5 – 128 HV Zone substation switchgear 33kV Switch (Ground Mounted) No. – – – – – – – – – – – – – – – – – – – – – – – – – – – – – 429 HV Zone substation switchgear 33kV Switch (Pole Mounted) No. – – – – – – – – 4 – – – – – – – – – – – – – – – – – – 4 – 130 HV Zone substation switchgear 33kV RMU No. – – – – – – – – – – – – – – – – – – – – – – – – – – – – – 431 HV Zone substation switchgear 22/33kV CB (Indoor) No. – – – – – – – – – – – – – – – – – – – – – – – – – – – – – 432 HV Zone substation switchgear 22/33kV CB (Outdoor) No. – – – – – – – – – – – – – – – – – 1 – – – – – – – – – 1 – 133 HV Zone substation switchgear 3.3/6.6/11/22kV CB (ground mounted) No. – – 1 – – 10 – – – – – – – 3 – – – – – – – – – – – – – 14 – 134 HV Zone substation switchgear 3.3/6.6/11/22kV CB (pole mounted) No. – – – – – – – 2 – – – – – – – – – – – – – – – – – – – 2 – 135 HV Zone Substation Transformer Zone Substation Transformers No. – – 2 2 – 6 – 8 – – – – – – 1 – – – – – – – – – – – – 19 – 136 HV Distribution Line Distribution OH Open Wire Conductor km 65 80 206 186 43 62 5 (0) 3 3 2 6 3 2 6 1 – 1 (0) 0 1 0 1 1 1 0 – 680 – 137 HV Distribution Line Distribution OH Aerial Cable Conductor km – – – – – – – – – – – – – – – – – – – – – – – – – – – – – 438 HV Distribution Line SWER conductor km – – – – – 1 – – – – – – – – – – – – – – – – – – – – – 1 – 139 HV Distribution Cable Distribution UG XLPE or PVC km – – – 0 – 0 1 0 0 0 0 0 0 0 0 1 – 0 – 0 0 0 0 – 0 1 (0) 5 – 140 HV Distribution Cable Distribution UG PILC km – – 1 8 12 28 24 2 5 4 2 1 2 2 3 2 2 1 1 0 1 0 0 1 1 0 – 103 – 141 HV Distribution Cable Distribution Submarine Cable km – – – – – – – – – – – – – – – – – – – – – – – – – – – – – 442 HV Distribution switchgear 3.3/6.6/11/22kV CB (pole mounted) - reclosers and sectionalisers No. – – – – 4 8 9 1 1 – – – 1 – – 1 – – – – – – – 1 – – – 26 – 143 HV Distribution switchgear 3.3/6.6/11/22kV CB (Indoor) No. – – – – – – – – – – – – – – – – – – – – – – – – – – – – – 144 HV Distribution switchgear 3.3/6.6/11/22kV Switches and fuses (pole mounted) No. – – 22 334 241 171 149 14 26 43 50 48 21 31 22 19 23 14 27 16 25 11 16 6 11 2 – 1,342 – 145 HV Distribution switchgear 3.3/6.6/11/22kV Switch (ground mounted) - except RMU No. – – – – – 4 – – 4 – 2 – – 4 2 – – – – – – – – – – – – 16 – 146 HV Distribution switchgear 3.3/6.6/11/22kV RMU No. – – – – 1 6 7 – 7 – 5 2 – 4 3 – – 1 – 2 1 – – 2 – – – 41 – 147 HV Distribution Transformer Pole Mounted Transformer No. – – 8 267 153 116 120 11 20 18 35 38 19 19 6 10 6 12 13 12 23 8 12 12 13 – – 951 – 148 HV Distribution Transformer Ground Mounted Transformer No. – – – 17 8 10 9 2 5 3 7 7 9 6 9 2 1 3 – 6 7 5 1 – 2 – – 119 – 149 HV Distribution Transformer Voltage regulators No. – – – 1 – – – – 1 – – – – – – – – – – – – – – – – – – 2 – 150 HV Distribution Substations Ground Mounted Substation Housing No. – – – – – – – – – – – – – – – – – – – – – – – – – – – – – 451 LV LV Line LV OH Conductor km 7 31 42 30 9 9 2 1 0 0 0 1 0 0 0 – – 0 – – – 0 1 0 0 – (0) 134 – 152 LV LV Cable LV UG Cable km 0 0 1 4 11 17 7 0 0 0 1 1 1 1 2 1 0 0 0 0 0 0 0 0 0 0 (0) 50 – 153 LV LV Street lighting LV OH/UG Streetlight circuit km – – – 0 0 0 – – 0 – 0 – 0 0 – 0 – – – – – – – – 0 – (0) 1 – 154 LV Connections OH/UG consumer service connections No. – – 16 1,761 1,090 1,466 817 72 83 167 368 179 80 59 61 58 26 5 4 11 6 8 118 120 129 37 – 6,741 – 155 All Protection Protection relays (electromechanical, solid state and numeric) No. – – – – – 10 1 – 7 – 1 – 3 – 1 – – – 1 – – – 10 3 – 7 – 44 – 156 All SCADA and communications SCADA and communications equipment operating as a single system Lot – – – – – – 19 13 24 4 8 1 20 – 1 3 2 – 2 4 2 17 25 – 12 9 – 166 – 157 All Capacitor Banks Capacitors including controls No – – – – – – 1 – – – – – – – – – – – – – – – – – – – – 1 – 158 All Load Control Centralised plant Lot – – – – – 2 – – – – – – – – – – 1 – – – – – – – – – – 3 – 159 All Load Control Relays No – – – – – – 2 – 5 4 14 13 8 9 4 – – – 1 – 1 – 1 – – – 123 185 – 160 All Civils Cable Tunnels km – – – – – – – – – – – – – – – – – – – – – – – – – – – – – 4
Eastland Network Limited31 March 2018
Eastland Network Limited - Wairoa
This schedule requires a summary of the age profile (based on year of installation) of the assets that make up the network, by asset category and asset class. All units relating to cable and line assets, that are expressed in km, refer to circuit lengths.
Number of assets at disclosure year end by installation date
FINAL 2018 ID schedules 1 to 10 (Hardcoded).XLSX 32 S9b.Asset Age Profile (WRA)

Commerce Commission Information Disclosure Template
Company Name
For Year EndedNetwork / Sub-network Name
SCHEDULE 9c: REPORT ON OVERHEAD LINES AND UNDERGROUND CABLES
sch ref
9
10 Circuit length by operating voltage (at year end) Overhead (km) Underground (km)Total circuit length (km)
11 > 66kV 307 – 30712 50kV & 66kV 301 1 30213 33kV 34 0 3414 SWER (all SWER voltages) 1 – 115 22kV (other than SWER) – – –16 6.6kV to 11kV (inclusive—other than SWER) 2,393 136 2,53017 Low voltage (< 1kV) 511 266 77718 Total circuit length (for supply) 3,547 404 3,9511920 Dedicated street lighting circuit length (km) 13 9 2221 Circuit in sensitive areas (conservation areas, iwi territory etc) (km) 1,00022
23 Overhead circuit length by terrain (at year end)Circuit length
(km)(% of total
overhead length)24 Urban 189 5%25 Rural 1,712 48%26 Remote only 375 11%27 Rugged only 990 28%28 Remote and rugged 280 8%29 Unallocated overhead lines – –30 Total overhead length 3,547 100%31
32Circuit length
(km)(% of total circuit
length)33 Length of circuit within 10km of coastline or geothermal areas (where known) –
34Circuit length
(km)(% of total
overhead length)35 Overhead circuit requiring vegetation management 3,547 100%
This schedule requires a summary of the key characteristics of the overhead line and underground cable network. All units relating to cable and line assets, that are expressed in km, refer to circuit lengths.
Eastland Network Limited31 March 2018
Eastland Network Limited - ALL
FINAL 2018 ID schedules 1 to 10 (Hardcoded).XLSX 33 S9c.Overhead Lines (ALL)

Commerce Commission Information Disclosure Template
Company Name
For Year EndedNetwork / Sub-network Name
SCHEDULE 9c: REPORT ON OVERHEAD LINES AND UNDERGROUND CABLES
sch ref
9
10 Circuit length by operating voltage (at year end) Overhead (km) Underground (km)Total circuit length (km)
11 > 66kV 180 – 18012 50kV & 66kV 268 1 27013 33kV – – –14 SWER (all SWER voltages) – – –15 22kV (other than SWER) – – –16 6.6kV to 11kV (inclusive—other than SWER) 1,713 116 1,82917 Low voltage (< 1kV) 377 216 59318 Total circuit length (for supply) 2,539 333 2,8721920 Dedicated street lighting circuit length (km) 13 8 2121 Circuit in sensitive areas (conservation areas, iwi territory etc) (km) 70022
23 Overhead circuit length by terrain (at year end)Circuit length
(km)(% of total
overhead length)24 Urban 166 7%25 Rural 1,349 53%26 Remote only 292 11%27 Rugged only 616 24%28 Remote and rugged 116 5%29 Unallocated overhead lines – –30 Total overhead length 2,539 100%31
32Circuit length
(km)(% of total circuit
length)33 Length of circuit within 10km of coastline or geothermal areas (where known) –
34Circuit length
(km)(% of total
overhead length)35 Overhead circuit requiring vegetation management 2,539 100%
Eastland Network Limited31 March 2018
Eastland Network Limited - GIS
This schedule requires a summary of the key characteristics of the overhead line and underground cable network. All units relating to cable and line assets, that are expressed in km, refer to circuit lengths.
FINAL 2018 ID schedules 1 to 10 (Hardcoded).XLSX 34 S9c.Overhead Lines (GIS)

Commerce Commission Information Disclosure Template
Company Name
For Year EndedNetwork / Sub-network Name
SCHEDULE 9c: REPORT ON OVERHEAD LINES AND UNDERGROUND CABLES
sch ref
9
10 Circuit length by operating voltage (at year end) Overhead (km) Underground (km)Total circuit length (km)
11 > 66kV 126 – 12612 50kV & 66kV 32 – 3213 33kV 34 0 3414 SWER (all SWER voltages) 1 – 115 22kV (other than SWER) – – –16 6.6kV to 11kV (inclusive—other than SWER) 680 20 70017 Low voltage (< 1kV) 134 50 18418 Total circuit length (for supply) 1,008 70 1,0781920 Dedicated street lighting circuit length (km) 0 0 121 Circuit in sensitive areas (conservation areas, iwi territory etc) (km) 30022
23 Overhead circuit length by terrain (at year end)Circuit length
(km)(% of total
overhead length)24 Urban 23 2%25 Rural 363 36%26 Remote only 84 8%27 Rugged only 374 37%28 Remote and rugged 164 16%29 Unallocated overhead lines – –30 Total overhead length 1,008 100%31
32Circuit length
(km)(% of total circuit
length)33 Length of circuit within 10km of coastline or geothermal areas (where known) –
34Circuit length
(km)(% of total
overhead length)35 Overhead circuit requiring vegetation management 1,008 100%
Eastland Network Limited31 March 2018
Eastland Network Limited - WRA
This schedule requires a summary of the key characteristics of the overhead line and underground cable network. All units relating to cable and line assets, that are expressed in km, refer to circuit lengths.
FINAL 2018 ID schedules 1 to 10 (Hardcoded).XLSX 35 S9c.Overhead Lines (WRA)
Commerce Commission Information Disclosure Template
Company Name
For Year Ended
sch ref
8 Location *Number of ICPs
servedLine charge revenue
($000)9
10111213141516171819202122232425
26
Eastland Network Limited31 March 2018
* Extend embedded distribution networks table as necessary to disclose each embedded network owned by the EDB which is embedded in another EDB’s network or in another embedded network
SCHEDULE 9d: REPORT ON EMBEDDED NETWORKSThis schedule requires information concerning embedded networks owned by an EDB that are embedded in another EDB’s network or in another embedded network.
FINAL 2018 ID schedules 1 to 10 (Hardcoded).XLSX 36 S9d.Embedded Networks
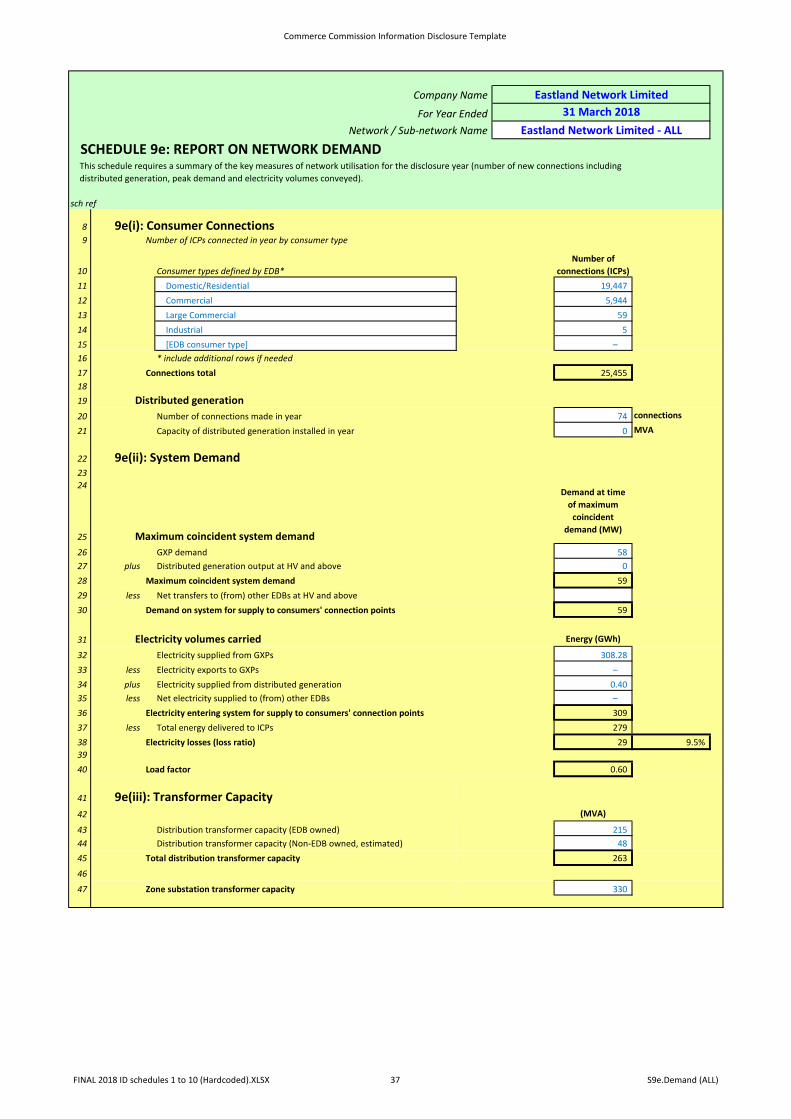
Commerce Commission Information Disclosure Template
Company Name
For Year EndedNetwork / Sub-network Name
SCHEDULE 9e: REPORT ON NETWORK DEMAND
sch ref
8 9e(i): Consumer Connections9 Number of ICPs connected in year by consumer type
10 Consumer types defined by EDB*Number of
connections (ICPs)11 Domestic/Residential 19,44712 Commercial 5,94413 Large Commercial 5914 Industrial 515 [EDB consumer type] –16 * include additional rows if needed17 Connections total 25,4551819 Distributed generation20 Number of connections made in year 74 connections
21 Capacity of distributed generation installed in year 0 MVA
22 9e(ii): System Demand2324
25 Maximum coincident system demand26 GXP demand 5827 plus Distributed generation output at HV and above 028 Maximum coincident system demand 5929 less Net transfers to (from) other EDBs at HV and above30 Demand on system for supply to consumers' connection points 59
31 Electricity volumes carried Energy (GWh)
32 Electricity supplied from GXPs 308.2833 less Electricity exports to GXPs –34 plus Electricity supplied from distributed generation 0.4035 less Net electricity supplied to (from) other EDBs –36 Electricity entering system for supply to consumers' connection points 30937 less Total energy delivered to ICPs 27938 Electricity losses (loss ratio) 29 9.5%3940 Load factor 0.60
41 9e(iii): Transformer Capacity42 (MVA)
43 Distribution transformer capacity (EDB owned) 21544 Distribution transformer capacity (Non-EDB owned, estimated) 4845 Total distribution transformer capacity 263
46
47 Zone substation transformer capacity 330
Demand at time of maximum
coincident demand (MW)
Eastland Network Limited31 March 2018
Eastland Network Limited - ALL
This schedule requires a summary of the key measures of network utilisation for the disclosure year (number of new connections including distributed generation, peak demand and electricity volumes conveyed).
FINAL 2018 ID schedules 1 to 10 (Hardcoded).XLSX 37 S9e.Demand (ALL)

Commerce Commission Information Disclosure Template
Company Name
For Year EndedNetwork / Sub-network Name
SCHEDULE 9e: REPORT ON NETWORK DEMAND
sch ref
8 9e(i): Consumer Connections9 Number of ICPs connected in year by consumer type
10 Consumer types defined by EDB*Number of
connections (ICPs)11 Domestic/Residential 16,28612 Commercial 4,32013 Large Commercial 4714 Industrial 415 [EDB consumer type] –16 * include additional rows if needed17 Connections total 20,6571819 Distributed generation20 Number of connections made in year 70 connections
21 Capacity of distributed generation installed in year 0 MVA
22 9e(ii): System Demand2324
25 Maximum coincident system demand26 GXP demand 5027 plus Distributed generation output at HV and above –28 Maximum coincident system demand 5029 less Net transfers to (from) other EDBs at HV and above30 Demand on system for supply to consumers' connection points 50
31 Electricity volumes carried Energy (GWh)
32 Electricity supplied from GXPs 25633 less Electricity exports to GXPs –34 plus Electricity supplied from distributed generation –35 less Net electricity supplied to (from) other EDBs –36 Electricity entering system for supply to consumers' connection points 25637 less Total energy delivered to ICPs 23338 Electricity losses (loss ratio) 23 9.0%3940 Load factor 0.58
41 9e(iii): Transformer Capacity42 (MVA)
43 Distribution transformer capacity (EDB owned) 17544 Distribution transformer capacity (Non-EDB owned, estimated) 3945 Total distribution transformer capacity 214
46
47 Zone substation transformer capacity 272
Demand at time of maximum
coincident demand (MW)
Eastland Network Limited31 March 2018
Eastland Network Limited - Gisborne
This schedule requires a summary of the key measures of network utilisation for the disclosure year (number of new connections including distributed generation, peak demand and electricity volumes conveyed).
FINAL 2018 ID schedules 1 to 10 (Hardcoded).XLSX 38 S9e.Demand (GIS)

Commerce Commission Information Disclosure Template
Company Name
For Year EndedNetwork / Sub-network Name
SCHEDULE 9e: REPORT ON NETWORK DEMAND
sch ref
8 9e(i): Consumer Connections9 Number of ICPs connected in year by consumer type
10 Consumer types defined by EDB*Number of
connections (ICPs)11 Domestic/Residential 3,16112 Commercial 1,62413 Large Commercial 1214 Industrial 115 [EDB consumer type] –16 * include additional rows if needed17 Connections total 4,7981819 Distributed generation20 Number of connections made in year 4 connections
21 Capacity of distributed generation installed in year 0 MVA
22 9e(ii): System Demand2324
25 Maximum coincident system demand26 GXP demand 827 plus Distributed generation output at HV and above –28 Maximum coincident system demand 829 less Net transfers to (from) other EDBs at HV and above30 Demand on system for supply to consumers' connection points 8
31 Electricity volumes carried Energy (GWh)
32 Electricity supplied from GXPs 5233 less Electricity exports to GXPs –34 plus Electricity supplied from distributed generation35 less Net electricity supplied to (from) other EDBs –36 Electricity entering system for supply to consumers' connection points 5237 less Total energy delivered to ICPs 4738 Electricity losses (loss ratio) 5 10.4%3940 Load factor 0.77
41 9e(iii): Transformer Capacity42 (MVA)
43 Distribution transformer capacity (EDB owned) 4044 Distribution transformer capacity (Non-EDB owned, estimated) 945 Total distribution transformer capacity 49
46
47 Zone substation transformer capacity 58
Demand at time of maximum
coincident demand (MW)
Eastland Network Limited31 March 2018
Eastland Network Limited - Wairoa
This schedule requires a summary of the key measures of network utilisation for the disclosure year (number of new connections including distributed generation, peak demand and electricity volumes conveyed).
FINAL 2018 ID schedules 1 to 10 (Hardcoded).XLSX 39 S9e.Demand (WRA)

Commerce Commission Information Disclosure Template
Company Name
For Year EndedNetwork / Sub-network Name
SCHEDULE 10: REPORT ON NETWORK RELIABILITY
sch ref
8 10(i): Interruptions
9 Interruptions by classNumber of
interruptions
10 Class A (planned interruptions by Transpower) –11 Class B (planned interruptions on the network) 14812 Class C (unplanned interruptions on the network) 32113 Class D (unplanned interruptions by Transpower) –14 Class E (unplanned interruptions of EDB owned generation) –15 Class F (unplanned interruptions of generation owned by others) –16 Class G (unplanned interruptions caused by another disclosing entity) –17 Class H (planned interruptions caused by another disclosing entity) –18 Class I (interruptions caused by parties not included above) 219 Total 4712021 Interruption restoration ≤3Hrs >3hrs
22 Class C interruptions restored within 197 12423
24 SAIFI and SAIDI by class SAIFI SAIDI
25 Class A (planned interruptions by Transpower) – –26 Class B (planned interruptions on the network) 0.31 41.7827 Class C (unplanned interruptions on the network) 3.18 370.1328 Class D (unplanned interruptions by Transpower) – –29 Class E (unplanned interruptions of EDB owned generation) – –30 Class F (unplanned interruptions of generation owned by others) – –31 Class G (unplanned interruptions caused by another disclosing entity) – –32 Class H (planned interruptions caused by another disclosing entity) – –33 Class I (interruptions caused by parties not included above) 0.00 0.0434 Total 3.49 411.935
36 Normalised SAIFI and SAIDI Normalised SAIFI Normalised SAIDI
37 Classes B & C (interruptions on the network) 3.02 239.77
38
39 Quality path normalised reliability limitSAIFI reliability
limitSAIDI reliability
limit
40 SAIFI and SAIDI limits applicable to disclosure year* 3.77 285.7841 * not applicable to exempt EDBs
Eastland Network Limited31 March 2018
Eastland Network Limited/ALL
This schedule requires a summary of the key measures of network reliability (interruptions, SAIDI, SAIFI and fault rate) for the disclosure year. EDBs must provide explanatory comment on their network reliability for the disclosure year in Schedule 14 (Explanatory notes to templates). The SAIFI and SAIDI information is part of audited disclosure information (as defined in section 1.4 of the ID determination), and so is subject to the assurance report required by section 2.8.
FINAL 2018 ID schedules 1 to 10 (Hardcoded).XLSX 40 S10.Reliability_ALL

Commerce Commission Information Disclosure Template
Company Name
For Year EndedNetwork / Sub-network Name
SCHEDULE 10: REPORT ON NETWORK RELIABILITY
Eastland Network Limited31 March 2018
Eastland Network Limited/ALL
This schedule requires a summary of the key measures of network reliability (interruptions, SAIDI, SAIFI and fault rate) for the disclosure year. EDBs must provide explanatory comment on their network reliability for the disclosure year in Schedule 14 (Explanatory notes to templates). The SAIFI and SAIDI information is part of audited disclosure information (as defined in section 1.4 of the ID determination), and so is subject to the assurance report required by section 2.8.
42 10(ii): Class C Interruptions and Duration by Cause43
44 Cause SAIFI SAIDI
45 Lightning 0.29 6.4746 Vegetation 0.56 107.7047 Adverse weather 0.41 155.6048 Adverse environment 0.00 0.8449 Third party interference 0.43 23.9550 Wildlife 0.43 12.5451 Human error 0.01 0.3952 Defective equipment 0.58 46.8153 Cause unknown 0.46 15.8354
55 10(iii): Class B Interruptions and Duration by Main Equipment Involved56
57 Main equipment involved SAIFI SAIDI
58 Subtransmission lines 0.01 1.2259 Subtransmission cables – –60 Subtransmission other – –61 Distribution lines (excluding LV) 0.27 37.6662 Distribution cables (excluding LV) 0.03 2.8963 Distribution other (excluding LV) – –
64 10(iv): Class C Interruptions and Duration by Main Equipment Involved65
66 Main equipment involved SAIFI SAIDI
67 Subtransmission lines 0.67 49.8468 Subtransmission cables 0.17 2.0769 Subtransmission other – –70 Distribution lines (excluding LV) 2.18 311.1271 Distribution cables (excluding LV) 0.16 7.1072 Distribution other (excluding LV) – –
73 10(v): Fault Rate
74 Main equipment involved Number of FaultsCircuit length
(km)Fault rate (faults
per 100km)
75 Subtransmission lines 8 641 1.2576 Subtransmission cables 1 1 70.9377 Subtransmission other –78 Distribution lines (excluding LV) 299 2,395 12.4979 Distribution cables (excluding LV) 13 135 9.6180 Distribution other (excluding LV) –81 Total 321
FINAL 2018 ID schedules 1 to 10 (Hardcoded).XLSX 41 S10.Reliability_ALL

Company Name
For Year EndedNetwork / Sub-network Name
SCHEDULE 10: REPORT ON NETWORK RELIABILITY
sch ref
8 10(i): Interruptions
9 Interruptions by classNumber of
interruptions
10 Class A (planned interruptions by Transpower) –11 Class B (planned interruptions on the network) 10512 Class C (unplanned interruptions on the network) 24013 Class D (unplanned interruptions by Transpower) –14 Class E (unplanned interruptions of EDB owned generation) –15 Class F (unplanned interruptions of generation owned by others) –16 Class G (unplanned interruptions caused by another disclosing entity) –17 Class H (planned interruptions caused by another disclosing entity) –18 Class I (interruptions caused by parties not included above) 119 Total 3462021 Interruption restoration ≤3Hrs >3hrs
22 Class C interruptions restored within 146 9423
24 SAIFI and SAIDI by class SAIFI SAIDI
25 Class A (planned interruptions by Transpower) – –26 Class B (planned interruptions on the network) 0.27 34.8227 Class C (unplanned interruptions on the network) 3.25 321.4528 Class D (unplanned interruptions by Transpower) – –29 Class E (unplanned interruptions of EDB owned generation) – –30 Class F (unplanned interruptions of generation owned by others) – –31 Class G (unplanned interruptions caused by another disclosing entity) – –32 Class H (planned interruptions caused by another disclosing entity) – –33 Class I (interruptions caused by parties not included above) 0.00 –34 Total 3.53 356.335
36 Normalised SAIFI and SAIDI Normalised SAIFI Normalised SAIDI
37 Classes B & C (interruptions on the network) 2.68 203.95
38
39 Quality path normalised reliability limitSAIFI reliability
limitSAIDI reliability
limit
40 SAIFI and SAIDI limits applicable to disclosure year* N/A N/A41 * not applicable to exempt EDBs
42 10(ii): Class C Interruptions and Duration by Cause43
44 Cause SAIFI SAIDI
45 Lightning 0.32 4.2946 Vegetation 0.53 70.7847 Adverse weather 0.35 163.5448 Adverse environment – –49 Third party interference 0.50 27.4550 Wildlife 0.52 13.2051 Human error 0.01 0.4852 Defective equipment 0.53 25.1753 Cause unknown 0.50 16.5454
55 10(iii): Class B Interruptions and Duration by Main Equipment Involved56
57 Main equipment involved SAIFI SAIDI
58 Subtransmission lines 0.01 1.5059 Subtransmission cables – –60 Subtransmission other – –61 Distribution lines (excluding LV) 0.23 29.8862 Distribution cables (excluding LV) 0.03 3.4563 Distribution other (excluding LV) – –
64 10(iv): Class C Interruptions and Duration by Main Equipment Involved65
Eastland Network Limited31 March 2018
Eastland Network Limited/GIS
This schedule requires a summary of the key measures of network reliability (interruptions, SAIDI, SAIFI and fault rate) for the disclosure year. EDBs must provide explanatory comment on their network reliability for the disclosure year in Schedule 14 (Explanatory notes to templates). The SAIFI and SAIDI information is part of audited disclosure information (as defined in section 1.4 of the ID determination), and so is subject to the assurance report required by section 2.8.

66 Main equipment involved SAIFI SAIDI
67 Subtransmission lines 0.82 61.4168 Subtransmission cables 0.21 2.5569 Subtransmission other – –70 Distribution lines (excluding LV) 2.04 250.8671 Distribution cables (excluding LV) 0.18 6.6372 Distribution other (excluding LV) – –
73 10(v): Fault Rate
74 Main equipment involved Number of FaultsCircuit length
(km)Fault rate (faults
per 100km)
75 Subtransmission lines 7 448 1.5676 Subtransmission cables 1 1 74.3777 Subtransmission other –78 Distribution lines (excluding LV) 220 1,714 12.8479 Distribution cables (excluding LV) 12 116 10.3680 Distribution other (excluding LV) –81 Total 240

Company Name
For Year EndedNetwork / Sub-network Name
SCHEDULE 10: REPORT ON NETWORK RELIABILITY
sch ref
8 10(i): Interruptions
9 Interruptions by classNumber of
interruptions
10 Class A (planned interruptions by Transpower) –11 Class B (planned interruptions on the network) 4312 Class C (unplanned interruptions on the network) 8113 Class D (unplanned interruptions by Transpower) –14 Class E (unplanned interruptions of EDB owned generation) –15 Class F (unplanned interruptions of generation owned by others) –16 Class G (unplanned interruptions caused by another disclosing entity) –17 Class H (planned interruptions caused by another disclosing entity) –18 Class I (interruptions caused by parties not included above) 119 Total 1252021 Interruption restoration ≤3Hrs >3hrs
22 Class C interruptions restored within 51 3023
24 SAIFI and SAIDI by class SAIFI SAIDI
25 Class A (planned interruptions by Transpower) – –26 Class B (planned interruptions on the network) 0.47 71.7327 Class C (unplanned interruptions on the network) 2.83 579.8928 Class D (unplanned interruptions by Transpower) – –29 Class E (unplanned interruptions of EDB owned generation) – –30 Class F (unplanned interruptions of generation owned by others) – –31 Class G (unplanned interruptions caused by another disclosing entity) – –32 Class H (planned interruptions caused by another disclosing entity) – –33 Class I (interruptions caused by parties not included above) 0.00 0.2234 Total 3.30 651.835
36 Normalised SAIFI and SAIDI Normalised SAIFI Normalised SAIDI
37 Classes B & C (interruptions on the network) 2.99 301.74
38
39 Quality path normalised reliability limitSAIFI reliability
limitSAIDI reliability
limit
40 SAIFI and SAIDI limits applicable to disclosure year* N/A N/A41 * not applicable to exempt EDBs
42 10(ii): Class C Interruptions and Duration by Cause43
44 Cause SAIFI SAIDI
45 Lightning 0.16 15.8746 Vegetation 0.71 266.7947 Adverse weather 0.69 121.3548 Adverse environment 0.03 4.4649 Third party interference 0.10 8.8850 Wildlife 0.06 9.7051 Human error – –52 Defective equipment 0.78 140.0553 Cause unknown 0.30 12.8054
55 10(iii): Class B Interruptions and Duration by Main Equipment Involved56
57 Main equipment involved SAIFI SAIDI
58 Subtransmission lines – –59 Subtransmission cables – –60 Subtransmission other – –61 Distribution lines (excluding LV) 0.46 71.2262 Distribution cables (excluding LV) 0.00 0.5263 Distribution other (excluding LV) – –
64 10(iv): Class C Interruptions and Duration by Main Equipment Involved65
Eastland Network Limited31 March 2018
Eastland Network Limited/WRA
This schedule requires a summary of the key measures of network reliability (interruptions, SAIDI, SAIFI and fault rate) for the disclosure year. EDBs must provide explanatory comment on their network reliability for the disclosure year in Schedule 14 (Explanatory notes to templates). The SAIFI and SAIDI information is part of audited disclosure information (as defined in section 1.4 of the ID determination), and so is subject to the assurance report required by section 2.8.

66 Main equipment involved SAIFI SAIDI
67 Subtransmission lines – –68 Subtransmission cables – –69 Subtransmission other – –70 Distribution lines (excluding LV) 2.76 570.7971 Distribution cables (excluding LV) 0.07 9.1072 Distribution other (excluding LV) – –
73 10(v): Fault Rate
74 Main equipment involved Number of FaultsCircuit length
(km)Fault rate (faults
per 100km)
75 Subtransmission lines 1 193 0.5276 Subtransmission cables – 0 –77 Subtransmission other –78 Distribution lines (excluding LV) 79 681 11.6079 Distribution cables (excluding LV) 1 19 5.1480 Distribution other (excluding LV) –81 Total 81
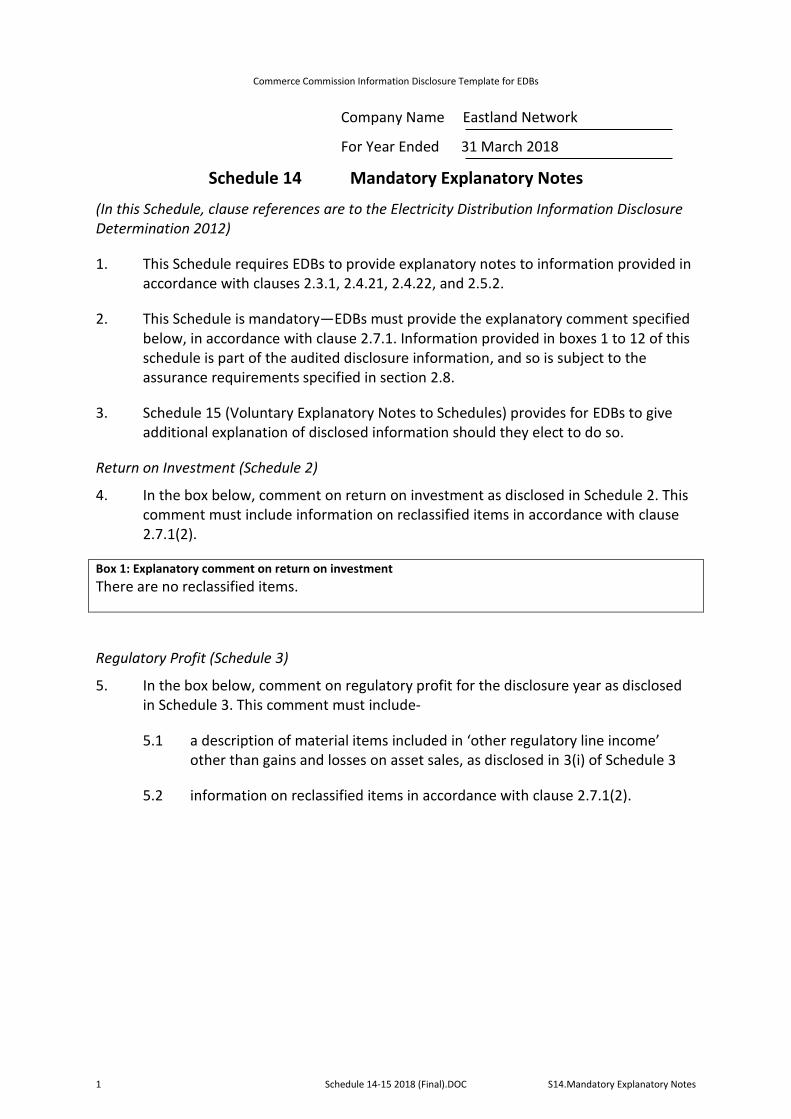
Commerce Commission Information Disclosure Template for EDBs
1 Schedule 14-15 2018 (Final).DOC S14.Mandatory Explanatory Notes
Company Name Eastland Network
For Year Ended 31 March 2018
Schedule 14 Mandatory Explanatory Notes
(In this Schedule, clause references are to the Electricity Distribution Information Disclosure Determination 2012)
1. This Schedule requires EDBs to provide explanatory notes to information provided in accordance with clauses 2.3.1, 2.4.21, 2.4.22, and 2.5.2.
2. This Schedule is mandatory—EDBs must provide the explanatory comment specified below, in accordance with clause 2.7.1. Information provided in boxes 1 to 12 of this schedule is part of the audited disclosure information, and so is subject to the assurance requirements specified in section 2.8.
3. Schedule 15 (Voluntary Explanatory Notes to Schedules) provides for EDBs to give additional explanation of disclosed information should they elect to do so.
Return on Investment (Schedule 2)
4. In the box below, comment on return on investment as disclosed in Schedule 2. This comment must include information on reclassified items in accordance with clause 2.7.1(2).
Box 1: Explanatory comment on return on investment There are no reclassified items.
Regulatory Profit (Schedule 3)
5. In the box below, comment on regulatory profit for the disclosure year as disclosed in Schedule 3. This comment must include-
5.1 a description of material items included in ‘other regulatory line income’ other than gains and losses on asset sales, as disclosed in 3(i) of Schedule 3
5.2 information on reclassified items in accordance with clause 2.7.1(2).

Commerce Commission Information Disclosure Template for EDBs
2 Schedule 14-15 2018 (Final).DOC S14.Mandatory Explanatory Notes
Box 2: Explanatory comment on regulatory profit Other Income consists of
x An administration fee for loss rental rebates $55k x Pole rental from chorus $39k x New connection fees $19k x Compensation receipts for debt being paid over time for damage to network assets
$13k x Rental Income $124K x Recovery of costs from Eastland Generation for services provided by Eastland
Network staff $275k x The remaining $22k relates to various minor items.
Merger and acquisition expenses (3(iv) of Schedule 3)
6. If the EDB incurred merger and acquisitions expenditure during the disclosure year, provide the following information in the box below-
6.1 information on reclassified items in accordance with clause 2.7.1(2)
6.2 any other commentary on the benefits of the merger and acquisition expenditure to the EDB.
Box 3: Explanatory comment on merger and acquisition expenditure There was no merger or acquisition expenditure during the year.
Value of the Regulatory Asset Base (Schedule 4)
7. In the box below, comment on the value of the regulatory asset base (rolled forward) in Schedule 4. This comment must include information on reclassified items in accordance with clause 2.7.1(2).

Commerce Commission Information Disclosure Template for EDBs
3 Schedule 14-15 2018 (Final).DOC S14.Mandatory Explanatory Notes
Box 4: Explanatory comment on the value of the regulatory asset based (rolled forward) Depreciation is lower than last year as a result of
a) Depreciation being high last year. In 2017 the RAB asset register was rebuilt and many asset lives changed which caused an blip in depreciation as end of life assets were fully depreciated. Consequently, in 2018, the level of depreciation is a result of the more accurate life data now in the RAB.
b) Reversal of an error in the remaining useful lives of two assets in 2017. During 2017 when determining the remaining useful life of the newly rebuilt RAB dataset, the installation date was incorrect for two larger value assets. These assets were therefore determined to be at the end of their useful lives but in fact had 36 years of useful life. The net effect of this for the current year is a write-back of depreciation of -$260K and a corresponding increase in the closing RAB.
As a result of on-going data quality checks, there have been a number of asset category transfers. The net result of this is included in schedule 4(vii) and repeated below:
Subtransmission lines (3k) Zone substations (73k) Distribution substations & transformers (20) Distribution switchgear 93K Non-network assets 3k There have been no further reclassifications of assets. Regulatory tax allowance: disclosure of permanent differences (5a(i) of Schedule 5a)
8. In the box below, provide descriptions and workings of the following items, as recorded in the asterisked categories in 5a(i) of Schedule 5a-
8.1 income not included in regulatory profit / (loss) before tax but taxable;
8.2 expenditure or loss in regulatory profit / (loss) before tax but not deductible;
8.3 income included in regulatory profit / (loss) before tax but not taxable;
8.4 expenditure or loss deductible but not in regulatory profit / (loss) before tax.
Box 5: Regulatory tax allowance: permanent differences Permanent difference relate to Non-deductible entertainment expenses.
Regulatory tax allowance: disclosure of temporary differences (5a(vi) of Schedule 5a)
9. In the box below, provide descriptions and workings of items recorded in the asterisked category ‘Tax effect of other temporary differences’ in 5a(vi) of Schedule 5a.

Commerce Commission Information Disclosure Template for EDBs
4 Schedule 14-15 2018 (Final).DOC S14.Mandatory Explanatory Notes
Box 6: Temporary differences / Tax effect of other temporary differences (current disclosure year) Temporary Differences total ($34k) and equate to a ($9k) tax effect. Net employee provisions ($11k) Doubtful debt provisions ($23k)
Related party transactions: disclosure of related party transactions (Schedule 5b)
10. In the box below, provide descriptions of related party transactions beyond those disclosed on schedule 5b including identification and descriptions as to the nature of directly attributable costs disclosed under clause 2.3.6(1)(b).

Commerce Commission Information Disclosure Template for EDBs
5 Schedule 14-15 2018 (Final).DOC S14.Mandatory Explanatory Notes
Box 7: Related party transactions Eastech Ltd provides fault and maintenance services to Eastland Network Ltd. Eastland Network has contracts with a number of providers who all work to an agreed price schedule. This schedule applies to all electrical services providers. The operational and capital expenditure incurred by Eastland Network from Eastech made up only 8.31% of total operational and capital expenditure spend.
Eastland Network provides technical support such as engineering and project management services to Eastland Generation Ltd for generation assets used to provide network support. Costs incurred by the network in the provision of such services have been allocated to Eastland Generation under the Cost Allocation rules using ACAM.
Revenue of $275k received from Eastland generation for the provision of these services has been included in Other Revenue.
Avoided costs of transmission are paid to Eastland Generation for reducing the RCPD charges from Transpower in accordance with the requirements under the Distributed Generation Pricing Principles in Part 6 of the Electricity Industry Participation Code.
Avoided costs of distribution are also paid to Eastland Generation for network support provided in key parts of the network. These payments are also made in accordance with the Distributed Generation Pricing Principles in Part 6 of the Electricity Industry Participation Code.
In 2018, Eastland Network acquired 2 properties from Eastland Investment Properties Limited for $159k.
As required the Directors have certified in schedule 18, the related party transactions that have been valued under clause 2.3.6(1)(f) of the Information Disclosure Determination 2012 – (consolidated in 2015).
There are no other related party transactions beyond those disclosed in schedule 5b.
Cost allocation (Schedule 5d)
11. In the box below, comment on cost allocation as disclosed in Schedule 5d. This comment must include information on reclassified items in accordance with clause 2.7.1(2).

Commerce Commission Information Disclosure Template for EDBs
6 Schedule 14-15 2018 (Final).DOC S14.Mandatory Explanatory Notes
Box 8: Cost allocation In previous years, Eastland has disclosed costs allocated from Eastland Group Ltd to Eastland Network for shared services. Eastland Network no longer considers that disclosure of these costs is required under the current determination as the costs are a payment for services received rather than an allocation of costs away from the regulated business.
Eastland Network Limited provides engineering, asset management and administration services to Eastland Generation Limited for distributed generation assets in the Eastland Network region. Costs for these services from Eastland Network are allocated to Eastland Generation using ACAM.
Asset allocation (Schedule 5e)
12. In the box below, comment on asset allocation as disclosed in Schedule 5e. This comment must include information on reclassified items in accordance with clause 2.7.1(2).
Box 9: Commentary on asset allocation Eastland has applied ACAM to allocate not directly attributable assets. These assets include land, buildings and Solar PV assets.
Capital Expenditure for the Disclosure Year (Schedule 6a)
13. In the box below, comment on capital expenditure for the disclosure year, as disclosed in Schedule 6a. This comment must include-
13.1 a description of the materiality threshold applied to identify material projects and programmes described in Schedule 6a;
13.2 information on reclassified items in accordance with clause 2.7.1(2),

Commerce Commission Information Disclosure Template for EDBs
7 Schedule 14-15 2018 (Final).DOC S14.Mandatory Explanatory Notes
Box 10: Explanation of capital expenditure for the disclosure year The majority of capex expenditure is spent on Asset replacement and renewal which is to be expected of a low growth region.
Major expenditure projects for asset replacement and renewal were for:- 110KV assets: Interphase spacers to reduce the incidence and risk of line clashes, Pole Replacement, Insulator Replacement and Grillage/Foundation replacement. The Tuai 110/11kv transformer replacement project also commenced during the year. Distribution assets: Expenditure in this category is mostly on pole replacements across the network. System Growth The small amount spent on system growth relates to either upgrades or extensions as requested by customers. There is no materiality threshold applied to the schedule.
There are no items reclassified during the year.
Operational Expenditure for the Disclosure Year (Schedule 6b)
14. In the box below, comment on operational expenditure for the disclosure year, as disclosed in Schedule 6b. This comment must include-
14.1 commentary on assets replaced or renewed with asset replacement and renewal operating expenditure, as reported in 6b(i) of Schedule 6b;
14.2 information on reclassified items in accordance with clause 2.7.1(2);
14.3 commentary on any material atypical expenditure included in operational expenditure disclosed in Schedule 6b, a including the value of the expenditure the purpose of the expenditure, and the operational expenditure categories the expenditure relates to.
Box 11: Explanation of operational expenditure for the disclosure year Asset replacement and renewal expenditure relates to replacement of components on poles/lines that are not capital in nature eg replace a cross arm or arm brace and also includes maintenance items such as transformer painting, oil changes of equipment etc.
There have been no reclassified items during the year.
Commerce Commission Information Disclosure Template for EDBs
8 Schedule 14-15 2018 (Final).DOC S14.Mandatory Explanatory Notes
Variance between forecast and actual expenditure (Schedule 7)
15. In the box below, comment on variance in actual to forecast expenditure for the disclosure year, as reported in Schedule 7. This comment must include information on reclassified items in accordance with clause 2.7.1(2).
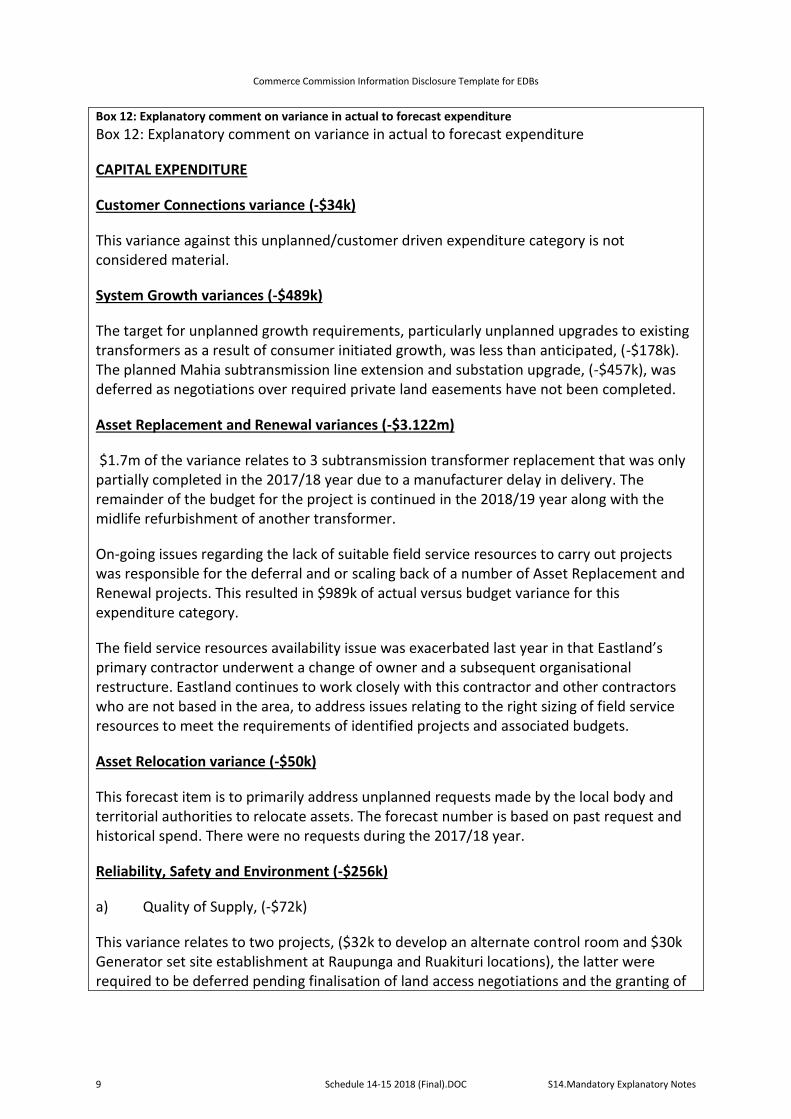
Commerce Commission Information Disclosure Template for EDBs
9 Schedule 14-15 2018 (Final).DOC S14.Mandatory Explanatory Notes
Box 12: Explanatory comment on variance in actual to forecast expenditure Box 12: Explanatory comment on variance in actual to forecast expenditure
CAPITAL EXPENDITURE
Customer Connections variance (-$34k)
This variance against this unplanned/customer driven expenditure category is not considered material.
System Growth variances (-$489k)
The target for unplanned growth requirements, particularly unplanned upgrades to existing transformers as a result of consumer initiated growth, was less than anticipated, (-$178k). The planned Mahia subtransmission line extension and substation upgrade, (-$457k), was deferred as negotiations over required private land easements have not been completed.
Asset Replacement and Renewal variances (-$3.122m)
$1.7m of the variance relates to 3 subtransmission transformer replacement that was only partially completed in the 2017/18 year due to a manufacturer delay in delivery. The remainder of the budget for the project is continued in the 2018/19 year along with the midlife refurbishment of another transformer.
On-going issues regarding the lack of suitable field service resources to carry out projects was responsible for the deferral and or scaling back of a number of Asset Replacement and Renewal projects. This resulted in $989k of actual versus budget variance for this expenditure category.
The field service resources availability issue was exacerbated last year in that Eastland’s primary contractor underwent a change of owner and a subsequent organisational restructure. Eastland continues to work closely with this contractor and other contractors who are not based in the area, to address issues relating to the right sizing of field service resources to meet the requirements of identified projects and associated budgets.
Asset Relocation variance (-$50k)
This forecast item is to primarily address unplanned requests made by the local body and territorial authorities to relocate assets. The forecast number is based on past request and historical spend. There were no requests during the 2017/18 year.
Reliability, Safety and Environment (-$256k)
a) Quality of Supply, (-$72k)
This variance relates to two projects, ($32k to develop an alternate control room and $30k Generator set site establishment at Raupunga and Ruakituri locations), the latter were required to be deferred pending finalisation of land access negotiations and the granting of

Commerce Commission Information Disclosure Template for EDBs
10 Schedule 14-15 2018 (Final).DOC S14.Mandatory Explanatory Notes
resource consents.
b) Other (-$184k)
As with part of the variance associated with Asset Replacement and Renewal projects and budget, this variance is a direct result of projects having to be deferred because of a lack of suitable field service resources.
Non- network Assets (-$634k)
a) Typical, (-$162k)
This variance relates to budget/provision in relation to replacement of vehicles and general asset replacement.
b) Atypical, (-$472k)
This variance relates to the deferral of various non-network building projects in Carnarvon Street including the interior refurbishment. The remainder of the variance relates savings associated with a Solar DG trial.
OPERATIONAL EXPENDITURE
Routine and Corrective Maintenance and Inspection (-$696k)
-$423k of variance is in relation to ex-Transpower assets where budgeted activity forecasts were based on information provided by Transpower which Eastland have amended after consideration of our own condition assessments.
-$245k variance in relation to the routine patrolling and maintenance of 11kV overhead lines was a result of the deficit of suitable field service resources/contractors.
Asset Replacement and Renewal (-$454k)
-$317k relates to ACOD being less than forecast. The remainder relates to small variances in planned maintenance on assets.
Vegetation Management ($53k)
This variance is due to more 11kV tree cutting in both Gisborne and Wairoa however is not considered material.
Information relating to revenue and quantities for the disclosure year
16. In the box below provide-

Commerce Commission Information Disclosure Template for EDBs
11 Schedule 14-15 2018 (Final).DOC S14.Mandatory Explanatory Notes
16.1 a comparison of the target revenue disclosed before the start of the disclosure year, in accordance with clauses 2.4.1 and 2.4.3(3) to total billed line charge revenue for the disclosure year, as disclosed in Schedule 8; and
16.2 explanatory comment on reasons for any material differences between target revenue and total billed line charge revenue.
Box 13: Explanatory comment relating to revenue for the disclosure year There is no material difference between target and actual revenue.
Network Reliability for the Disclosure Year (Schedule 10)
17. In the box below, comment on network reliability for the disclosure year, as disclosed in Schedule 10.
Box 14: Commentary on network reliability for the disclosure year In the 2018 period there were less interruptions than the previous period.
Normalised SAIDI and SAIFI were both well below reliability limits. Normalised SAIDI and SAIFI have been calculated based on the Information Disclosures Determination 2012. This is different to the normalisation calculation for the Annual Compliance Statement under the Default Price Quality Path Determination 2015.
There is a noticeable decrease in third party interference SAIDI and SAIFI numbers due to the effect of the plane crash last period.
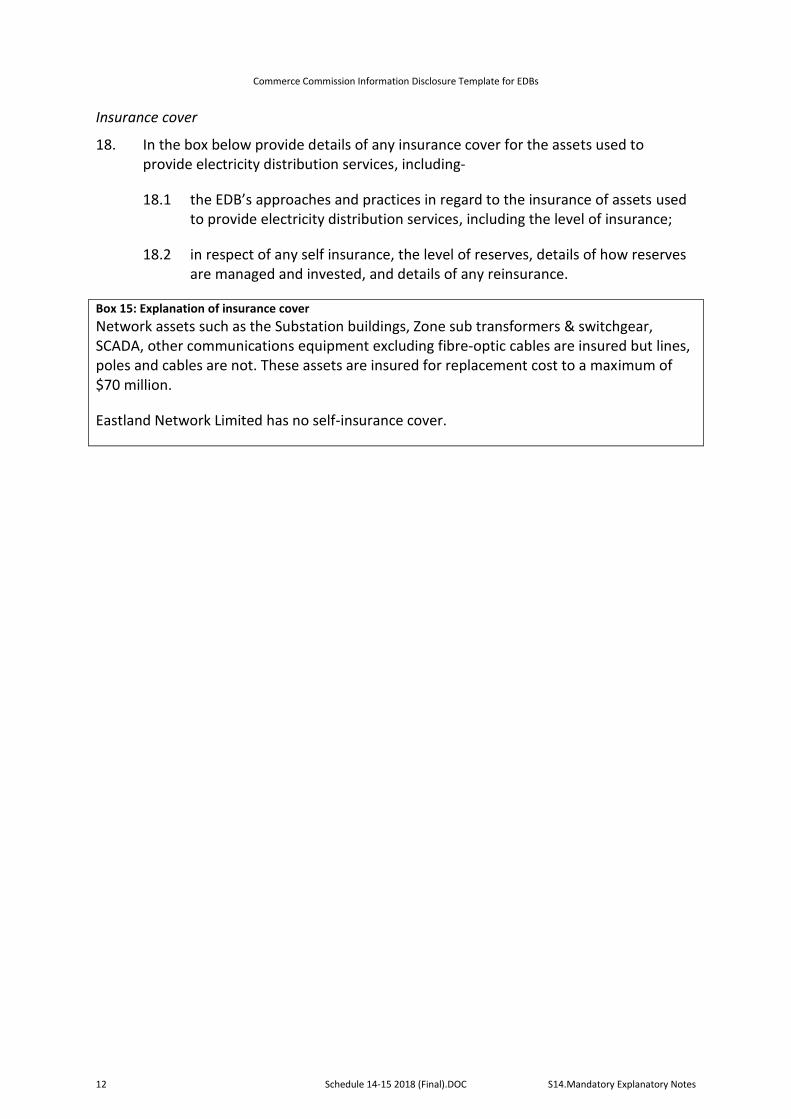
Commerce Commission Information Disclosure Template for EDBs
12 Schedule 14-15 2018 (Final).DOC S14.Mandatory Explanatory Notes
Insurance cover
18. In the box below provide details of any insurance cover for the assets used to provide electricity distribution services, including-
18.1 the EDB’s approaches and practices in regard to the insurance of assets used to provide electricity distribution services, including the level of insurance;
18.2 in respect of any self insurance, the level of reserves, details of how reserves are managed and invested, and details of any reinsurance.
Box 15: Explanation of insurance cover Network assets such as the Substation buildings, Zone sub transformers & switchgear, SCADA, other communications equipment excluding fibre-optic cables are insured but lines, poles and cables are not. These assets are insured for replacement cost to a maximum of $70 million.
Eastland Network Limited has no self-insurance cover.

Commerce Commission Information Disclosure Template for EDBs
13 S14a.Mandatory Explanatory Forecast
Company Name Eastland Network Limited
For Year Ended 31 March 2018
Schedule 14a Mandatory Explanatory Notes on Forecast Information
(In this Schedule, clause references are to the Electricity Distribution Information Disclosure Determination 2012)
1. This Schedule provides for EDBs to provide explanatory notes to reports prepared in accordance with clause 2.6.5.
2. This Schedule is mandatory—EDBs must provide the explanatory comment specified below, in accordance with clause 2.7.2. This information is not part of the audited disclosure information, and so is not subject to the assurance requirements specified in section 2.8.
Commentary on difference between nominal and constant price capital expenditure forecasts (Schedule 11a)
3. In the box below, comment on the difference between nominal and constant price capital expenditure for the disclosure year, as disclosed in Schedule 11a.
Box 1: Commentary on difference between nominal and constant price capital expenditure forecasts This was previously disclosed with the Asset Management Plan in March.
Commentary on difference between nominal and constant price operational expenditure forecasts (Schedule 11b)
4. In the box below, comment on the difference between nominal and constant price operational expenditure for the disclosure year, as disclosed in Schedule 11b.
Box 2: Commentary on difference between nominal and constant price operational expenditure forecasts This was previously disclosed with the Asset Management Plan in March.
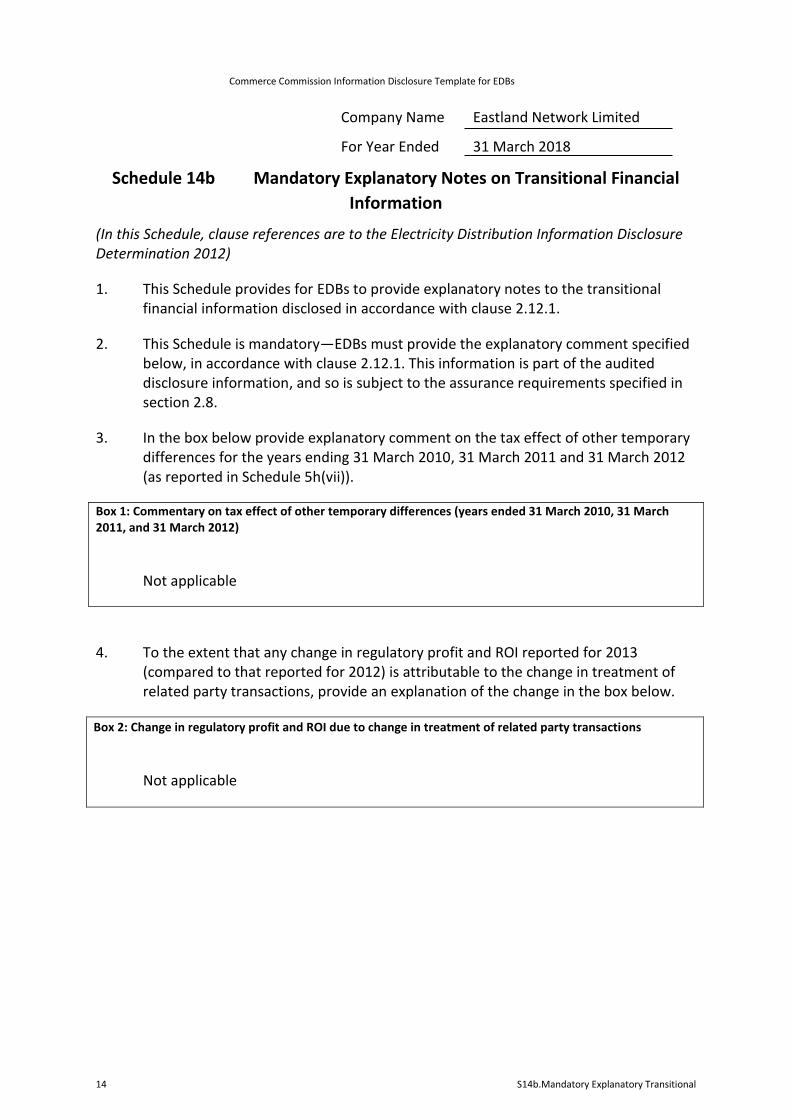
Commerce Commission Information Disclosure Template for EDBs
14 S14b.Mandatory Explanatory Transitional
Company Name Eastland Network Limited
For Year Ended 31 March 2018
Schedule 14b Mandatory Explanatory Notes on Transitional Financial Information
(In this Schedule, clause references are to the Electricity Distribution Information Disclosure Determination 2012)
1. This Schedule provides for EDBs to provide explanatory notes to the transitional financial information disclosed in accordance with clause 2.12.1.
2. This Schedule is mandatory—EDBs must provide the explanatory comment specified below, in accordance with clause 2.12.1. This information is part of the audited disclosure information, and so is subject to the assurance requirements specified in section 2.8.
3. In the box below provide explanatory comment on the tax effect of other temporary differences for the years ending 31 March 2010, 31 March 2011 and 31 March 2012 (as reported in Schedule 5h(vii)).
Box 1: Commentary on tax effect of other temporary differences (years ended 31 March 2010, 31 March 2011, and 31 March 2012)
Not applicable
4. To the extent that any change in regulatory profit and ROI reported for 2013 (compared to that reported for 2012) is attributable to the change in treatment of related party transactions, provide an explanation of the change in the box below.
Box 2: Change in regulatory profit and ROI due to change in treatment of related party transactions
Not applicable

Commerce Commission Information Disclosure Template for EDBs
15 S14b.Mandatory Explanatory Transitional
5. In the box below, comment on asset allocation as disclosed in Schedule 5e. This comment must include information on reclassified items in accordance with clause 2.7.1(2) for disclosure years 2011 and 2012.
Box 3: Commentary on asset allocation
Not applicable

Commerce Commission Information Disclosure Template for EDBs
16 Schedule 14-15 2018 (Final).DOC S15.Voluntary Explanatory Notes
Company Name Eastland Network Limited
For Year Ended 31 March 2018
Schedule 15 Voluntary Explanatory Notes
(In this Schedule, clause references are to the Electricity Distribution Information Disclosure Determination 2012)
1. This Schedule enable EDBs to provide, should they wish to-
1.1 additional explanatory comment to reports prepared in accordance with clauses 2.3.1, 2.4.21, 2.4.22, 2.5.1, 2.5.2, and 2.6.5;
1.2 information on any substantial changes to information disclosed in relation to a prior disclosure year, as a result of final wash-ups.
2. Information in this Schedule is not part of the audited disclosure information, and so is not subject to the assurance requirements specified in section 2.8.
3. Provide additional explanatory comment in the box below.
Box 1: Voluntary explanatory comment on disclosed information
Not applicable


INDEPENDENT ASSURANCE REPORT TO THE DIRECTORS OF EASTLAND NETWORK LIMITED AND THE COMMERCE COMMISSION
The Auditor-General is the auditor of Eastland Network Limited (the company). The Auditor-General has appointed me, Trevor Deed, using the staff and resources of Deloitte Limited, to provide an opinion, on his behalf, on whether the information disclosed in schedules 1 to 4, 5a to 5g, 6a and 6b, 7, the system average interruption duration index (‘SAIDI’) and system average interruption frequency index (‘SAIFI’) information disclosed in Schedule 10 and the explanatory notes in boxes 1 to 12 in Schedule 14 (‘the Disclosure Information’) for the disclosure year ended 31 March 2018, have been prepared, in all material respects, in accordance with the Electricity Distribution Information Disclosure Determination 2012 (the ‘Determination’). Directors’ responsibility for the Disclosure Information The directors of the company are responsible for preparation of the Disclosure Information in accordance with the Determination, and for such internal control as the directors determine is necessary to enable the preparation of the Disclosure Information that is free from material misstatement. Our responsibility for the Disclosure Information Our responsibility is to express an opinion on whether the Disclosure Information has been prepared, in all material respects, in accordance with the Determination. Basis of opinion We conducted our engagement in accordance with the International Standard on Assurance Engagements (New Zealand) 3000 (Revised) Assurance Engagements Other Than Audits or Reviews of Historical Financial Information and the Standard on Assurance Engagements 3100: Compliance Engagements issued by the External Reporting Board. Copies of these standards are available on the External Reporting Board’s website. These standards require that we comply with ethical requirements and plan and perform our assurance engagement to provide reasonable assurance about whether the Disclosure Information has been prepared in all material respects in accordance with the Determination. We have performed procedures to obtain evidence about the amounts and disclosures in the Disclosure Information. The procedures selected depend on our judgement, including the assessment of the risks of material misstatement of the Disclosure Information, whether due to fraud or error or non-compliance with the Determination. In making those risk assessments, we considered internal control relevant to the company’s preparation of the Disclosure Information in order to design procedures that are appropriate in the circumstances, but not for the purpose of expressing an opinion on the effectiveness of the company’s internal control. Use of this report This independent assurance report has been prepared solely for the directors of the company and for the Commerce Commission for the purpose of providing those parties with reasonable assurance about whether the Disclosure Information has been prepared, in all material respects, in accordance with the Determination. We disclaim any assumption of responsibility for any reliance on this report to any person other than the directors of the company or the Commerce Commission, or for any other purpose than that for which it was prepared.
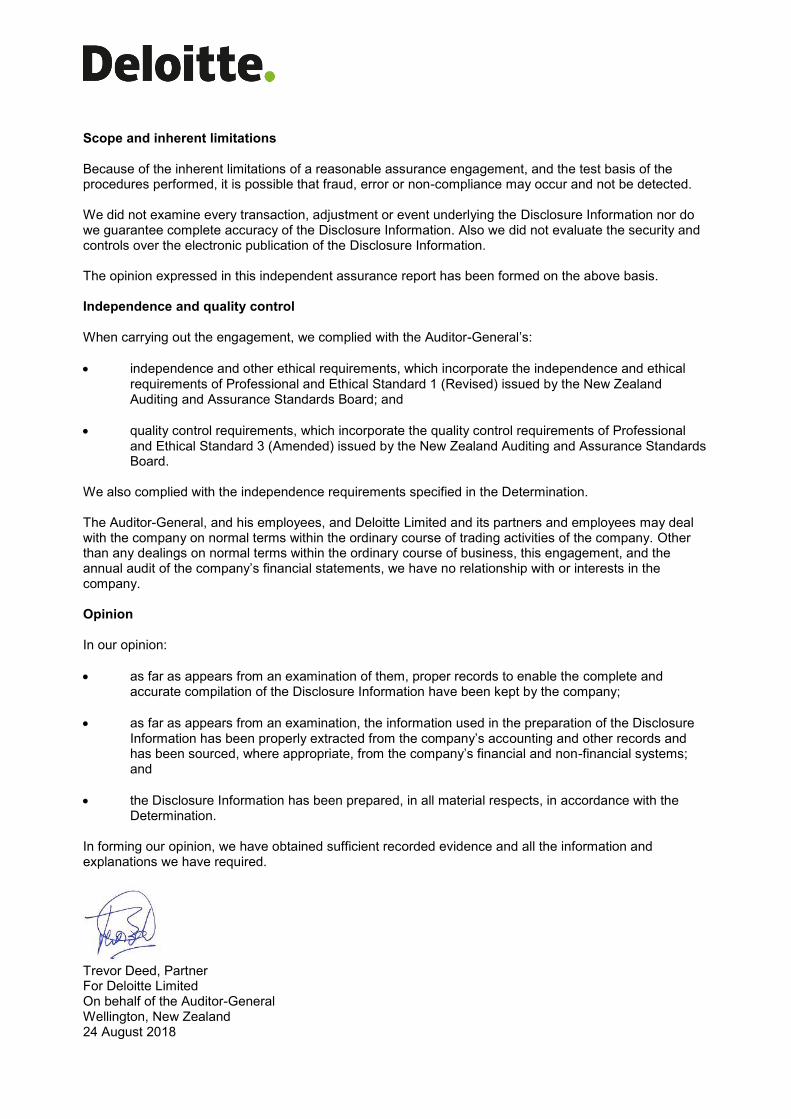
Scope and inherent limitations Because of the inherent limitations of a reasonable assurance engagement, and the test basis of the procedures performed, it is possible that fraud, error or non-compliance may occur and not be detected. We did not examine every transaction, adjustment or event underlying the Disclosure Information nor do we guarantee complete accuracy of the Disclosure Information. Also we did not evaluate the security and controls over the electronic publication of the Disclosure Information. The opinion expressed in this independent assurance report has been formed on the above basis. Independence and quality control When carrying out the engagement, we complied with the Auditor-General’s: x independence and other ethical requirements, which incorporate the independence and ethical
requirements of Professional and Ethical Standard 1 (Revised) issued by the New Zealand Auditing and Assurance Standards Board; and
x quality control requirements, which incorporate the quality control requirements of Professional
and Ethical Standard 3 (Amended) issued by the New Zealand Auditing and Assurance Standards Board.
We also complied with the independence requirements specified in the Determination. The Auditor-General, and his employees, and Deloitte Limited and its partners and employees may deal with the company on normal terms within the ordinary course of trading activities of the company. Other than any dealings on normal terms within the ordinary course of business, this engagement, and the annual audit of the company’s financial statements, we have no relationship with or interests in the company. Opinion In our opinion: x as far as appears from an examination of them, proper records to enable the complete and
accurate compilation of the Disclosure Information have been kept by the company; x as far as appears from an examination, the information used in the preparation of the Disclosure
Information has been properly extracted from the company’s accounting and other records and has been sourced, where appropriate, from the company’s financial and non-financial systems; and
x the Disclosure Information has been prepared, in all material respects, in accordance with the
Determination. In forming our opinion, we have obtained sufficient recorded evidence and all the information and explanations we have required.
Trevor Deed, Partner For Deloitte Limited On behalf of the Auditor-General Wellington, New Zealand 24 August 2018