ed213 027 cs 206 743 - eric kinds of logical or syntactic difficulties in prose processing does an...
TRANSCRIPT

DOCUMENT RESUME
ED213 027 CS 206 743
AUTHOR Holland, V. Melissa; Rose, AndrewTITLE A Comparison of Prose and Algorithms for Presenting
Complex Instructions. Document Design Project,Technical Report No. 17.
INSTITUTION American Institutes for Research, Washington, D.C.;Carnegie-Mellon Univ., Pittsburgh, Pa.; Siegel &Gale, Inc., New York, N.Y.
SPONS AGENCY National Inst. of Education (ED), Washington, DC.Teaching and Learning Program.
REPORT NO AIR-75003-11/81-TRPUB DATE Nov 81CONTRACT 400-78-0043NOTE 90p.
EDRS PRICE MF01/PC04 Plus Postage.DESCRIPTORS *Algorithms; College Students; *Comparative Analysis;
*Government Publications; *Layout (Publications);Problem Solving; *Prose; Reading Difficulties;*Reading Research Sentence Structure
IDENTIFIERS Direction Following
ABSTRACTComplex conditional instructions ( "if X, then do Y")
are prevalent in public documents, where they typically appear inprose form. Results of two previous studies have shown thatconditional instrt-tiont become very difficult to process as thestructure brcome- more complex. A study was designed to investigatewhether this difficulty can be alleviated by presenting conditionalinstructions in formats other than prose. It was hypothesized thatthe major Sources of difficulty--disjunction, negation, hierarchicalstructure, and ambiguous punctuation--would be eliminated by the useof algorithms. Subjects were presented with a sample of complexconditional instructions in three formats - -prose and two forms ofalgorithms, lists and flow charts. Results showed that conditionalinstructions were easier to follow vhen presented as algorithms thanas prose when subjects were prepared to follow algorithms by practicewith feedback. In general, the algorithm helped performance when thecondition in the instruction was logically complex. The overallsuperiority of algorithms was qualified, however, by threecomplications: (1) the difference between flowcharts and listschanged the speed relationships between prose and algorithms, (2) theeffect of partial processing changed the speech relationships, and(3) the difficulty with the first exposure to the instructiondrastically reversed the algorithm advantage in both speed andaccuracy. (HOD)
************************************************************************ , Reproductions supplied by EDRS aLe the best that can be made *
* from the original document. *
***********************************************************************

IN- U.S. DEPARTMENT Of EDUCATIONNATIONAL INSTITUTE OF EDUCATION
CV EDUCATIONAL RESOURCES INFCRMATIONCENTER (ERIC)C:5 TMs document has been reproduced as
received from the parson or organization141 originating it
fr""4 f Minor changes have bean made to improvereproduction quality
CZCV Points of view or opinions stated in this document do not nec ,:zianhr represent official NIE
Lael position or policy
AIR-75003-11/81-TR
RR, :.-,,(yrfil ENT
ro&ECT
Technical Report No. 17
A Comparisonof Prose and Algorithms for
Presenting Complex Instructions
V, Melissa Hollari
Andrew Rose
A product of the Document Design Project fl,nded b,'the National Institute of Education, Washinc ton, D.0
Contract No. NIE-400-78-0043
November 1981
AMERICAN INSTITUTES FOR RESEARCH/1055 Thomas Jefferson Street, NW, Washington, DC 20007 207/342 5000wi,h Carnegie Mellon University and Siegel & Gale Inc

ACKNOWLEDGEMENTS
We are indebted to several people at AIR who hql.ped us with
this paper and with the research reported here. Don McLaughlin,Laurie Wise, and Paul Fingerman wrote the computer program we
used to randomize and present the experimental stimuli and to
score the responses. Laura Malakoff and Debbie Leinbachassisted as experimenters for the study. Don McLaughlin andRon Harnar helped with the computer analyses of the data.George Wheaton advised us in interpreting the results of the
analyses. Ginny Redish provided editorial comments on thewritten report, and Mary Medved oversaw the typing and formattingof the report.
This xeport is part of the work done under contract #400-78=-0,043 of the National Institute of Education. The projectofficer is Dr. Candace Miyamura of the Teaching and Learning/
Reading and Language Group. This report does not necessarilyreflect the views of the funding ageficy.

ABOUT THE DOCUMENT DESIGN PROJECT
In September 1978, the American Institutes for Research(AIR) began the Document Design Project to foster clear andsimple writing and design of public documents. The purposeof the Document Design Project (DDP) .was to help make forms,regulations, brochures, and other written materials easierfor people to read, to understand, and to use. Carnegie-Mellon University and Siegel & Gale, Inc. worked with AIRon this project. The project was funded by the Teaching andLearning/Reading and Language group at the National Instituteof Education-;
The Project's goal was to increase the knowledge andskills of people who produce public documents. To accomplishthis goal, the Document Design Project had three tasks:
Task 1: To conduct theoretical and appliedresearch studies on language comprehension,on the ways in which skilled and unskilledwriters work, on problems associated w.,.thdifferent document features;
Task 2s To bring research into-practice byworking with government agencies as theyproduce materials for public use;
Task 3: To bring research and practice intoeducation by developing'courses on writingand design for graduate students and under-graduates.
If you have questions or comments on this report or onother work of the Document Design Project, contact Dr. JaniceC. Redish, Director, The Document Design Center, AIR, 202/342-5071.

TABLE OF CONTENTS
Page
Chapter I - Introduction 1
Chapter II Stimuius Description 15
Chapter III - Method 27
Chapter IV - Results 31
Chapter V - Summary and Conclusions 61
References 71
Appendix A - ANOVA Tables for Each of the Three Typesof Organization
Appendix B - Summary of Meal! Response Times (Sec.)
Figures
1 - Flowchart algorithm for the instruction, "If you area parent or a homeowner, and not both under 26 or aveteran, mark Box A."
2 - List algorithm version of instruction, "If you area parent or a homeowner, and not both under 26 or aveteran, mark Box A." 3
3 - Order of difficulty of structures from Holland andRose, 1980 (based on accuracy and response timedata combined) 6
4 - Partial truth tables for three sample sentences . 8
5 - Selected Flowchart Templates 22-24
6 - List Template for Four Categories 26
7 - Mean response time as a function of format for eachorganizational type 32
8 - Mean number correct as a function of format foreach organizational type 33
9 - Estimated regression lines for predicting responsetime from exit position for lists and flowcharts.(Mean response times for organizational types areplotted around each line.) 37
Page
Figures (cont'd.)
10 - Mean response time for prose as a function of 39
"and-or" for each organizational type
11 - Mean number correct for prose as a function of"and-or" for each organizational type 40
12 - Response time for each format in unpracticedcondition as a function of trial order ineach block 51
13 - Percent correct for each format in theunpracticed condition as a function of trialorder 53
Tables
1 - Truth Table for "X is male or married."
2 - The Stimulus Set
16
18
3 - Fixed Exit Positions and Truth Patterns for theUnpracticed Condition by Trial Order andBlock Order ..
4 - Response Times for Exit Positions in Lists andFlowlparts 36
5 - Response Times for Exit Positions by OrganizationalType for Lists and Flowcharts 47
6 - Distribution of Formats by Subjects' PrefernceRankings 57
7 ..- First Format Preference by Nature of Subjects'Academic or Professional Field . . 58

A Comparison of prose and Algorithmsfor Presenting Complex Instructions
I. INTRODUCTION
This paper reports on the third in a series of experiments onhow people follow instructions with complex conditions. Theseinstructions are conditional sentences of the form: "If x, [then]do Y," in which the antecedent ("if") clause includes severalcategories linked coordinately.* An example is:
"If you are a parent or a homeowner, and not bothunder 26 and a veteran, mark Box A."
In this example, "parent," "homeowner," "under 26," and "veteran,"are the categories of the antecedent. The coordinate structurelinking the categories is specified by various combinations of theconnectives "and," "or," and "not." These are the basicconnectives that link propositions in truth-functional logic.
Complex conditional instructions are prevalent in publicdocuments, where they typically appear in prose form, like thesentence above. In the two previous experiments (Rose & Cox,1980; Holland & Rose, 1980), we investigated the speed andaccuracy of subjects' responses to these instructions when wemanipulated the logical structure of the antecedent. In thoseexperiments; the goa was to identify structural determinants ofprocegsing difficulty. The variables of interest lay in thelogical connectives between the content categories rather than inthe categories themselves.
The results of these experiments showed that conditionalinstructions become very difficult to process as the structure ofthe antecedent becomes more complex. The current study wasdesigned to investigate whether this difficulty can be alleviatedby presenting conditional instructions in formats other thanprose. Specifically, the study addressed five questions:
Given the coordinate structures identified esdifficult in the previous experiments, could wefacilitate performance by presenting theconditional instruction as an algorithm?
*A sentence in "if-then" form with an imperative clause "do Y" inplace of the consequent ("then Y") does not fall into the taxonomyof true conditional sentences defined by logicians (Quire, 1972).Failing to find an a priori niche, we have decided to call theseexpressions "conditional instructions."
1

What kinds of logical or syntactic difficultiesin prose processing does an algorithm alleviate?
How does performance compare between two forms ofalgorithms: (1) flowcharts and (2) lists ofsteps ("jump" questions)?
How does a reader's performance on first exposureto algorithms compare to performance on proseinstructions?
What format does the average reader prefer forcomplex conditional instructions?
Our goal is a practical one: We want to know what to tell awriter to do when the material includes complex conditionalinstructions. But we also want to understand what readers aredoing. Therefore, the preceding studies, in addition toidentifying structural correlates of processing difficulty,explored the theoretical questions of the nature and causes ofthis difficulty. We explained observed performance by relatinglogical and syntactic description to inferred cognitive operationsin a set of processing models. These models were essentially taskanalyses that took into account both comprehension (decoding andrepresenting the structure of the antecedent) and use (evaluatingthe truth of the antecedent to decide on a response to theinstruction).
We built out hypotheses for the current study on ourtheoretical explanation of the difficulties found in the earlierexperiments. According to our task analyses, the density of theinternal cognitive operations required to represent and use theantecedent in an instructional task determines the level ofdifficulty of the conditional instruction. Simply on analyticalgrounds, the algorithm can be predicted to facilitate processing,because it breaks problem-solving into a set of discrete, linear,and external steps. Figure 1 on page 3 illustrates how thisbreak-down occurs in a flowchart algorithm applied to the prosesentence presented on page 1. Figure 2 on page 3 shows a listalgorithm for the same sentence.
Beyond analytical grounds, we lacked empirical bases forderiving predictions about the effects of algorithms on processingcoordinate logic. In a review of the empirical literature onhuman performance with algorithms (Holland, 1981), we observedthat the accumulated research is largely ad hoc andungeneralizable. Although a few recent studies haveexperimentally compared human performance with algorithms toperformance with prose (for example, Wason, 1968; Jones, 1968;Davies, /970; Wright & Reid, 1973; Blaiwes, 1974; Wright, 1975;Kammann, 1975; Landa, 1976; Follettie, 1979), many of them aresimply demonstrations of the advantage: of using an algorithm.
2

Are you aparent? /\
Yes f2)
Not Applicable
Ye,
\ under
No
I 26?i
........ Mark Box A
YesN
a
veteran?
No
Yes
....... Mark Box A
a
veteran?
Mark Box ANoNe '.......
"'..-........Yes
<Yes
Mark Box ANo*".......
" Not Applicable
FIGURE 1. Flowchart algorithm for the instruction, "If you are a parent or a homeowner,and not both under 26 or a veteran, mark Box A."
(1) Are you a parent? If yes, go to 3.
If no, go to 2.
(2) Are you a homeowner? If yes, go to 3.
(3) Are you under 26?
If no, go to 5.
aIf yes, go to 4.If no, go to 5.
(4) Are you a veteran? If yes, go to 6.
If no, go to 5.
(5) Mark Box A.
(6) Not applicable.
***". Not Applicable
FIGURE 2. List algorithm version of instruction, "If you are a parent or a homeowner,and not both under 26 or a veteran, mark Box A."

These studies characteristically fail to define (or lack asystematic approach to defining) the variables that are criticalto performance--the functional features of the task, the graphicfeatures of the format, and the structural features of theinstruction.* The present study is the first attempt we know ofto compare prose with alternative instructional formats whilevarying the logical structure of the instruction in precise andsystematic ways.
We will begin our description of this -study by reviewing theresults from the previous study of prose instructions. We willthen analyze the cognitive tasks required by prose ano comparethem with the tasks required by algorithm formats for theseinstructions. Based on these anal'ses, we will describe theexpected results for each of the ive questions posed at thebeginning of this section. ./
Difficulties with Prose: Previous Results /The prose sentences used in the previous experiment (Holland
& Rose, 1980) selectively sampled the universe of compoundcoordinate structures. We can think of this universe as generatedby the propositional calculus of truth-functional logic, in whichpropositions may be conjoined by the operations of conjunction("and"), disjunction ("or"), and negation. To construct the /sample, we varied the stimuli on four dimensions. These were:
the number of categories in the compound -four,five, six, or seven;
the connective between categories--"and" vs."or";
affirmative vs. negative categories (simplenegation)--no "nots" vs. two "nots" ("not A andnot B");
The external organization of the categories- -(1) strings ("A, B, C, and D"), that is, linearstructures;(2) simple groupings ("A or B, and C or D"), thatis, hierarchical structures;
*See Follettie (1978) for a critical analysis of the methodologyof several of these studies.
4I 0

(3) groupings ("A, B, and neither C nor D") builtaround compound negation.*
The structures created by the factorial combination of thesedimensions were placed in sentence frames of the form: "If youare , press button A(B)." The example,
"If you are male and employed, or single andover 25, press button A,"
is a structure of the type "four-category, 'or,' affirmative,simple-grouping." We classify this fs an "or" sentence becausethe connective between the/two major groups is "or." (Ah "and"grouping would have the foArt "A or-B, and C or D.")
We used high-frequency words and phrases, like "male" and"over 25," to fill the category slots in the coordinatestructures. Subj4cts were told to apply these categories tothemselves following the underlying structure of the "if" clause,and to then respond on the basis of the overall truth or falsityof the clause. We measured the logical difficulty of a structureinterms of both the speed and, the accuracy of ,*ubjects' responsesto the instructions.
From the results, we were able to'identify,sig ficantaspects of logical difficulty in terms of the four imensionsmanipulated in the stimulus sentences:**
Groupings were, on the whole, harder thanstrings.
Negative groupings were the hardestorganizational type. We attributed this to thedifficulty of joint and alternative denial ("notboth /and," "not either/or," respectively).
*Note that the third dimensidn (affirmative vs. negativecategory) refers to simple negation ("not A")--modifying a singlecategory rathei, than a group. But under the fourth dimension(organization,, compound negation ("neither A nor B") refers tonegating groups.. Linguistically, this Is a difference in scope ofthe negative term'. Logically, compound negation is referred to asjoint denial and-alternative denial. Previous research hasdemonstrated the difficulty of tif-Og two logical operations (e.g,Haygood & Bourne, 1965).**Various of the significant factors identified in this experimentwere found in Rose and Cox (1980), using two-category conditionalinstructions, and have also been isolated in other contexts--suchas in psycholinguistic studies of syntactic effects andconcept-learning studies of logical rules. These studies arereviewed in Holland and Rose (1980).
51
Structures with negative categories were harderthan structures with no negatives.
"Or" strings ("1., 13, C, or D") were harder than"and" strings ("A, B, C, and D.").
Simple groupings in which "end" links the majorgroups ("A or B, and C or D") were harder thanthe reverse ("A and B, or C and D"). Weattributed this result to the fact that the "and"structure has more "ors" (as subordinateconnectives) than does the "or" structure.
Any structure with "ors" in a series of three ormore ("A, B, or C; and D, E, or F") was harderthan paired "ors" ("A or B, and C or D, and E orF"). We attributed this result to the potentialambiguity of "ors" expressed implicitly incommas.
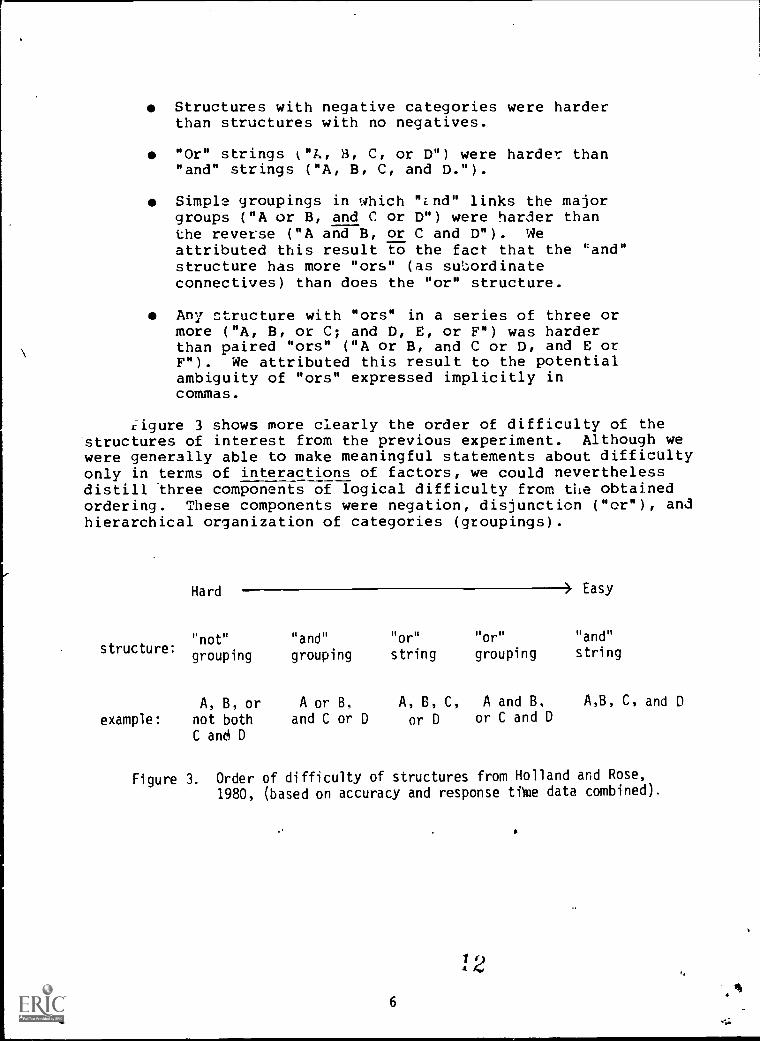
Ligure 3 shows more clearly the order of difficulty of thestructures of interest from the previous experiment. Although wewere generally able to make meaningful statements about difficultyonly in terms of interactions of factors, we could neverthelessdistill three components of logical difficulty from the obtainedordering. These components were negation, disjunction ("or"), andhierarchical organization of categories (groupings).
Hard 1 Easy
"not" "and" "or" "or" "and"structure:
grouping grouping string grouping string
A, B, or A or B, A, B, C, A and B, A,B, C, and D
example: not both and C or D or D or C and D
C and D
Figure 3. Order of difficulty of structures from Holland and Rose,
1980, (based on accuracy and response time data combined).
12
6

The number of categories by itself did not affect errors.Number did, on the other hand, add a constant time increment,since subjects consistently processed the full instruction insteadof selecting the relevant parts of it. Partial processing waspossible for most instructions. For example, someone reading theinstruction, "If you are A or B or C, press X" can skip to theimperative clause after reading the first category ("A") if it istrue.
In addition to the structural variables already mentioned,the previous experiment also varied the surface expression of theconnective in the conditional clause. Signifying "or" implicitlywith commas ("A, B, 'C, or D") was found to be harder thanrepeating it ("A or B or C or D"). Commas apparently createambiguity in the "or" structure because they tend to be read as"ands."
The current study follows directly from the previousexperiment in two ways. The stimuli here were modeled on theprose sentences used in the previous experiment. T ! currenthypotheses about how and where algorithms will improve performancewere based on t'e patterns of difficulty observed in the prosesentences.
4111 Task Analyses for Prose and Algorithms
Our broad hypothesis is that the major sources of difficultyin complex conditional instructions--disjunction, negation,hierarchical structure, and ambiguous punctuation--will beeliminated by the use of algorithms. This hypothesis comes fromunderstanding how the prose instructions are processed, and fromcomparing how the same instructions are processed as algorithms.Let us-analyze the prose task first and then the algorithm task.
How we process complex conditional instructions as prose
Subjects in the previous study were required to read andfollow instructions of the form, "If you are [coordinatecompound], press button X (otherwise, press Z)." We analyzed thistask into three theoretical steps:
(1) Interpreting the coordinate compound in the"if" clause--i.e., extracting the logical rule.(This step might be divided into "reading" and"rule extraction/construction," with readingtaking the smaller amount of effort.)
(2) Applying the compound condition, onceinterpreted, to oneself--i.e., verifying theclause.
7

(3) Using the verification decision (was thecondition true or false?) to determine aresponse to the imperative clause (whether to"press X" or not).
It is steps (1) and (2)--extracting and applying the logicalrule--that created most of the problems' in the previousexperiment. What is required in these processes?
First, extracting the rule requires recovering the logicalstructure of the compound in the conditional clause. Thisstructure is defined by the connective'-( "and," "or," "not") andthe way they are grouped. Recovering the logical.structureentails mentally constructing a psychological "truth table" (ordecision table). This table shows how the truth values of theindividual categories constituting the compound must be combinedto yield an overall "true" or "false" outcome. There may beseveral different sets of values which yield a true or a falseoutcome. Figure 4 illustrates truth tables for three samplesentences. A partial truth table, as in Figure 4, gives only the"true" or only the "false" outcomes.
A and B and C A or B or C
A A F
B T B
C C F
A
C
A and B, or C
TITITTIF F T
T T F T
T F T T T,
Figure 4. Partial truth tables for three sample sentences.
The next step, applying the rule, entails two tasks: onetask is making the successive binary decisions--true orfalse--about th individual categories; another is assessing theoverall truth value of the condition. Making this assessmentrequires comparing the pattern of one's own truth values for theindividual categories against the patterns in the psychologicaltruth table to determine a match.
Given this general explanation of how conditionalinstructions in prose are processed, how do we explain theparticular patterns of errors obtained? We can infer that theeasier sentences are easier because the decision rule is simpler.For example, for "and" strings the rule is: "at least one 'no'
8

means false, all 'yesses' means true." The simplicity of thisrule is reflected in the truth table. In the table for "and"strings, only one column--a single combination of categoryvalues--is necessary to specify the set of "true" outcomes. Onthe other hand, groupings of any sort, which are more difficult toprocess, require at least two columns in the truth table (as inFigure 4). Thus, the number of columns required in a partialtruth table to specify all possible "true" combinations ofcategories (or, alternatively, all possible "false" combinations)appears to be a metric of the underlying logical complexity ofcoordinate structures.*
How we process conditional instructions as algorithms
To compare the cognitive requirements of prose to those ofalgorithms for presenting complex conditional instructions, let usanalyze the task of using the algorithm in general, extractingthose properties with consequences for processing coordinatelogic. We will focus on that core of properties that is common toflowchart and list algorithms.**
Algorithms are procedures for solving a problem that breakthe process into its simplest steps and arrange them in a sequenceleading automatically to the right outcome. Figures 1 and 2(p. 3) illustrate tow the algorithm breaks a continuous proseinstruction into a sequence of simple "yes-no" questions andconnects them with final outcomes (e.g., "Mark Box A") in waysthat reflect the underlying logical contingencies. Note that onlythe minimum number of relevant categories for a given contingencyis connected to an outcome. For example for two combinations oftruth values ("not a parent, not a home-ner," and "a parent, notunder 2t"), readers exit after reading only two of the fourcategories of the instruction shown in Figure 1. The minimumnumber of relevant categories varies with the nature of thelogical structure and the configuration of truth values for agiven reader.
*According to this criterion, however, "and" and "or" should beequivalent in complexity. There is no formal correlate of the"and-or" asymmetry so prevalent in our results, since therespective truth tables are mirror images of each other. That is,a partial truth table for "or" could be constructed as in Figure4, containing a single colUmn: all "noes" producing a "false"outcome. There is no basis in formal reasoning for why "noes" and"faises" should count differently from "yesses" and "trues." Wemust rely instead on psychological criteria, such as negativesigns being more complex, to explain why "or" sentences are harderthan "and."**Some of these properties have been dir-:ussed elsewhere (e.g.,Gane, Horabin, & Lewis, 1966; Wheatly & unwin, 1972; Wason &Johnson-Laird, 1972) and have some empirical support.
9

To use the algorithm, readers must read the first question,select the appropriate answer, then read the question or commandimmediately connected to that answer. The path is indicated byarrows (the flowchart) or "go to" commands (the list). Thusreaders follow only one path through the algorithm, contingent ontheir answe-s at each previous step. The memory operationsrequired to move through the sequence span a single step:performance does not require rule extraction or construction of apsychological truth table.
Given this analysis of the task, there are four propertiesthat suggest an advantage for algorithms over prose instructions:
Algorithms reduce syntactic and logical structureto a series of binary decisions. In this way,algorithms eliminate the words ("if,""otherwise," "but," "not," "and") and thegrammatical devices (coordination, embedding)required to express relationships and to connectthem with contingent decisions.
Algorithms clarify ambiguous punctuation andsyntax.
Algorithms relieve the burden of remembering atrain of antecedent decisions or of back-trackingto recover them.
Algorithms build in partial processing: theylead you to read only what is necessary to reachan outcome.
These four nroperties should eliminate the main sources ofprocessing difficulty we have isolated for prose. Specifically,algorithms should:
relieve readers from extracting and applying thelogical rule underlying the conditional clause,
eliminate the possibility of misinterpretingambiguous commas in "or" strings,
relieve readers from keeping track of previoustruth values, and
prevent processing of categories irrelevant to agiven outcome.
Togther, these inherent simplificatioas of the instructional tasklead us to predict that algorithms will alleViate the difficultyof p.ocessing coordinate logic that we observed with proseinstructions.
10
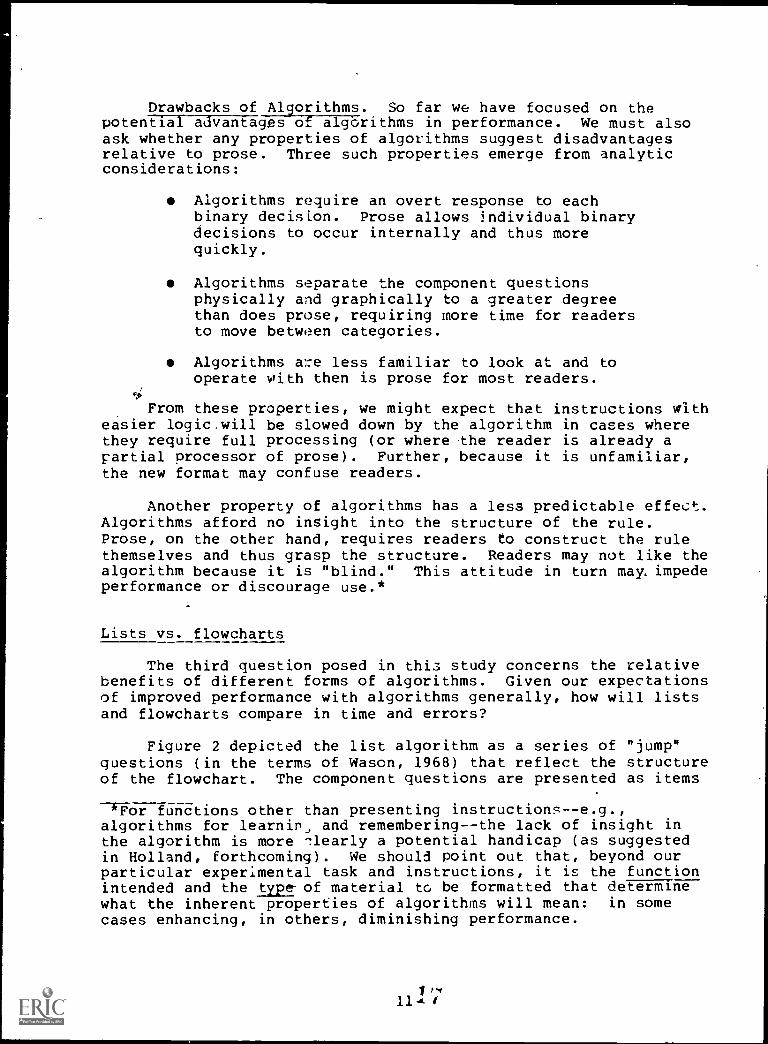
Drawbacks of Algorithms. So far we have focused on thepotential advantages of algorithms in performance. We must alsoask whether any properties of algorithms suggest disadvantagesrelative to prose. Three such properties emerge from analyticconsiderations:
Algorithms require an overt response to eachbinary decision. Prose allows individual binarydecisions to occur internally and thus morequickly.
Algorithms separate the component questionsphysically and graphically to a greater degreethan does prose, requiring more time for readersto move between categories.
Algorithms are less familiar to look at and tooperate with then is prose for most readers.
(5,1.
From these properties, we might expect that instructions witheasier logic,will be slowed down by the algorithm in cases wherethey require full processing (or where-the reader is already apartial processor of prose). Further, because it is unfamiliar,the new format may confuse readers.
Another property of algorithms has a less predictable effect.Algorithms afford no insight into the structure of the rule.Prose, on the other hand, requires readers to construct the rulethemselves and thus grasp the structure. Readers may not like thealgorithm because it is "blind." This attitude in turn may. impedeperformance or discourage use.*
Lists vs. flowcharts
The third question posed in thi3 study concerns the relativebenefits of different forms of algorithms. Given our expectationsof improved performance with algorithms generally, how will listsand flowcharts compare in time and errors?
Figure 2 depicted the list algorithm as a series of "jump"questions (in the terms of Wason, 1968) that reflect the structureof the flowchart. The component questions are presented as items
*For functions other than presenting instructions--e.g.,algorithms for learnir, and remembering--the lack of insight inthe algorithm is more 71early a potential handicap (as suggestedin Holland, forthcoming). We should point out that, beyond ourparticular experimental task and instructions, it is the functionintended and the type of material to be formatted that deiTnewhat the inherent properties of algorithms will mean: in somecases enhancing, in others, diminishing performance.
1 rel11-AL 1
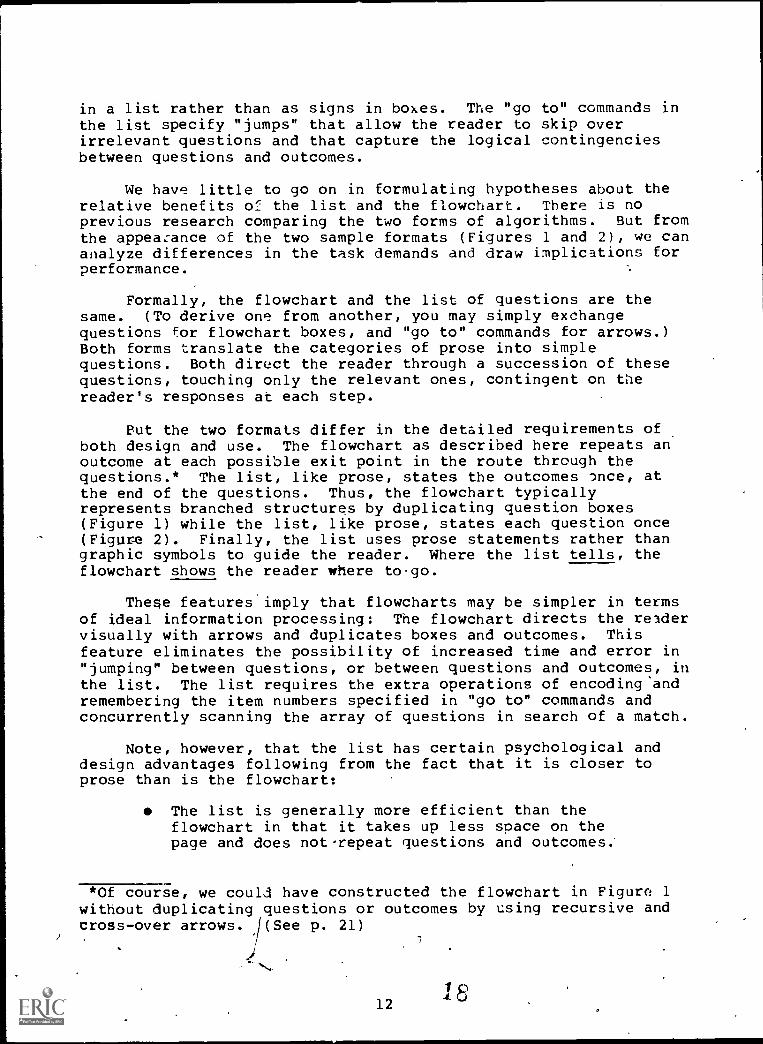
in a list rather than as signs in boxes. The "go to" commands inthe list specify "jumps" that allow the reader to skip overirrelevant questions and that capture the logical contingenciesbetween questions and outcomes.
We have little to go on in formulating hypotheses about therelative benefits of the list and the flowchart. There is noprevious research comparing the two forms of algorithms. But fromthe appearance of the two sample formats (Figures 1 and 2), we cananalyze differences in the task demands and draw implications forperformance.
Formally, the flowchart and the list of questions are thesame. (To derive one from another, you may simply exchangequestions for flowchart boxes, and "go to" commands for arrows.)Both forms translate the categories of prose into simplequestions. Both direct the reader through a succession of thesequestions, touching only the relevant ones, contingent on thereader's responses at each step.
Put the two formats differ in the detailed requirements ofboth design and use. The flowchart as described here repeats anoutcome at each possible exit point in the route through thequestions.* The list, like prose, states the outcomes once, atthe end of the questions. Thus, the flowchart typicallyrepresents branched structures by duplicating question boxes(Figure 1) while the list, like prose, states each question once(Figure 2). Finally, the list uses prose statements rather thangraphic symbols to guide the reader. Where the list tells, theflowchart shows the reader where togo.
These features imply that flowcharts may be simpler in termsof ideal information processing: The flowchart directs the readervisually with arrows and duplicates boxes and outcomes. Thisfeature eliminates the possibility of increased time and error in"jumping" between questions, or between questions and outcomes, inthe list. The list requires the extra operations of encoding andremembering the item numbers specified in "go to" commands andconcurrently scanning the array of questions in search of a match.
Note, however, that the list has certain psychological anddesign advantages following from the fact that it is closer toprose than is the flowchart:
The list is generally more efficient than theflowchart in that it takes up less space on thepage and does not repeat questions and outcomes.
*Of course, we could have constructed the flowchart in Figure 1without duplicating questions or outcomes by using recursive and
)
cross-over arrows. '(See p. 21)
1218

The list may be momore familiar and 1flowchart.
re acceptable in that it isess technical looking than the
The list is easier toreader who does not knmean.
interpret for the naiveow what arrows and boxes
Nevertheless, our basic expecwill be somewhat more difficult thaexperimental setting because of theoperations involved.
tation is that the list formatn the flowchart in anextra scanning and memory
First exposures
Another of our motivating questionsrespond the first time they see an algoriThe question is crucial to the practical aReaders who encounter a flowchart on a taxcocument are not going to receive operatingpractice trials before having to deal with tdocument designers to whom we would make formcare about the effect of first exposures.
was how readers willhm in a given context.ims of this study.form or other publicdirections andhe flowchart. Theat recommendations
Our observation that algorithms are less fto the average reader suggests that readers maythe algorithm than with prose in their first expoinstructions.
amiliar than proseperform worse withsure to a set of
Format ereferences
Another consideration in making recommendations ais how readily people will accept algorithms in real-wodocuments. Thus the final question in this study concereaders' format preferences. Our earlier description ofalgorithms as unfamiliar and automatic is relevant here.characteristics suggest that people may not like algorithmwell as prose.
bout formatsrldned
Theses as
Prior evidence about attitudes toward and acceptance offormats is scant and often limited to special populations (e.Kammann's survey of Bell Labs engineers, 1975). Inhibitingattitudes are likely to be tied to levels of education andexperience in the population at latge. That is, people who raruse flowcharts or lists may not readily accept them.
newg.,
1319
ely

General Experimental Approach
To test the questions discussed aboVe, we used the followingapproach: In the main condition, we presented subjects with asample of complex conditional instructions in three formats--proseand the two forms of algorithms. We measured response time anderrors after providing practice and feedback in each format, andended the session with questions about preference and expe nce.We prefaced the main experiment with a set of "cold" trialpresented before practice and feedback. The set consisted of fourtrials in each format. This "unpracticed condition" servedprimarily to test the effect of first exposures on performance.It also allowed us to look at an important structural variationthat would have over-burdened the main design--simple affirmativevs. negative relations. We followed the test session withquestions about subjects' format preferences and prior experiencewith algorithms.
14
II. STIMULUS DESCRIPTION
All stimuli were conditional instructions of the basic form
If you are X, press [key]Y
where X was a coordinate compound of several categories (e.g., "Acr B, and C or D"), and "press Y" was a simple instructionalcommand contingent on the truth value of the compound.
Stimuli varied on six dimensions. These were:
(1) The format of instructional presentation:prose;flowchart algorithm;list algorithm
(2) The number of categories contained in thecoordinate comnound:
four categoriessix categories
(3) The type of connective between categories:conjunctive'(, "and")disjunctive ("or") ,
('4) The organization of categories -- whether thewere grouped, and, if so, how:
strings ("A, B, C, and D")simple groupings ("A or B,and C or D")"not" groupings ("A, B, andnot either C or 0")
(5) Truth value of the instruction:truefalse
(6) "Exit position": the point in the instructionwhere an ideal reader could correctly make a keypress response:
early exitmiddle exitlate exit
,_Another possible dimension, "affirmative-negative,'w4s used
in the previous experiment. In the present case, we decided toinclude two negated categories in each instruction in the mainexperiment.*
*We chose the negative value of this dimension because ourinterest was in comparir3 formats for the instructions whichproved most difficult in the previous experiment.

The last two dimensions--truth value and exit position--require some further elaboration. They served primarily ascontrol variables on processing time and difficulty. They are notstrictly structural since both depend on the content of thecategories in the compound (the words themselves)--or, moreprecisely, on the interaction of content with the characteristicsof the reader. We will illustrate these two dimensions using thetwo-category conditional instruction, "If you are male or married,press button Y; if not, press Z."
The overall truth value of the condition, "you are male ormarried," is "false" for a single female, "true" for any male aswell as for any married person. Thus there is more than onepattErn of individual truth values that yields a "true" outcome.The patterns are illustrated in truth table fashion, in Table 1.
Truth Values for Overall TruthIndividual Categories Values
male marriedT FF TT T
F
male or married
True
F False
Table 1. Truth Table for "X is male or married."
The pattern of truth,values for the individual categoriesdetermines the possible exit points in processing. Assuming aleft-to-right order in processing ,categories, the TF and the TTpatterns allow an "ideal" male reader to decide the overall truthvalue of the condition after evaluating only the first category("male")--given that the read r has observed the "or" coordinatestructure. The reader may then "exit" and go to the imperativeclause--that is, press Y. This would count as an early exit orpartial processing. On the other hand, the FF and FT patternsrequire full processing, or "late" exits.
As in this example, there is for any logical compound alwaysmore than one way to combine and sequence the individual values toyield at least one of the overall truth outcomes (True or False).The location of the individual trues or falses in. the sequence ofcategories in a structure determines when a particular reader candecide the overall outcome and exit from a structure; or, moreprecisely, how many categories the reader must process beforeexiting. That the distribution of truth Values to yield a givenexit position is structurally dependent can be illustrated bycomparing a linear organization with a grouping. The earliestexit from an "A, B, C, and D" string is a pattern with a falsevalue for the first category: In the shortest case, reading
16 22

terminates after a single category is processed. By contrast, theearliest exit for the "A or E, and C or D" grouping is a patternwith "false" values for. A and B or with "true" values for A and C:In the shortest cases, reading terminates after two categories areprocessed.
For any four- or six-category structure, there are severalchoices of when (after how many categories are read) an exit canoccur. And for each exit position specified, there are usuallyseveral determining distributions of "true" and "false"categories. We chose three levels for the exit position variable,which we called early, middle, and late exits. The meaning ofthese levels depends in part on the organizational structure ofthe compound, as demonstrated above; in part on the length of thecompound; and in part on arbitrary definition.
Table 2 on the next page defines the early-middle-latevariable for each cf the 12 truth-functional structures, crossedwith the two possible truth values for each structure. Thedefinition of each level of the variable is in terms of the numberof minimally relevant categories in the condition (the number thatmust be evaluated before a verification decision can be made onthe condition as a whole). The "early" exits were always definedas the least possible processing allowed by the structure andtruth value in question. The "late" exits were defined as fullprocessing--i.e., requiring evaluation of all categories in thesequence. There was more freedom in defining the "middle" exits,and we somewhat arbitrarily set these at three categories to beevaluated in four-category structures, and four categories in thesix-category structures.*
For some structures, it is inherently impossible todistinguish three exit pogitions for both "true" and "false"outcomes. This is clear from the string structures in Table 2.For "and" strings, the only way to construct a "true" condition isby making all categories false (with reverse transformations toaccount for the two negated categories taat characterize eachstructure in our sample). Thus full processing is logicallynecessary to recognize false conjunctions. In cases such as this,we simply replicated the earliest level (or, levels) of exitposition that was available and used those replications for theexit-position variable.
# Since the average number of categories to be processed infour- and six-category instructions varies across organizationaltype, the "early-middle-late" dimension does not have equalintervals, as shown in Table 2. Table 2 also shows, beside eachspecification of the number of categories to be processed, theparticular pattern of truth values selected to generate that exitlevel. Each pattern was selected at random from the set of all
*There was one exception, for the "not" grouping, as indicated inTable 2.
17

4.1
TABLE 2.The Stimulus Set
STRUCTURE , TRUTH VALUES
g.,...- og .o
True False
0 0
aEt I 8LI
1Ed
2--E
6 28 cg (Example) a LLI G. '7LU Z Truth Pattern tax1 Truth Pattern d
E 4 TTFF 1 FTFFAnd (A, B, 5, &El) M 4 TIFF 3 FFFT
4L 4 TTFF 4 FFTF
E 1 TFTT 4 FFTTOr (A, B, or15) M 3 TTTF 4 FFTT
L 4 TTFT 4 FFTTStrings
E 6 TTTTFF 1 FTTTTTAnd 'A, B, C, 0,-E, 8/7.1 M 6 ITrTFF 4 TTTFFF
L 6 TTTTFF 6 TTTTFT6
E 1 TFFFFF 6 FFFFTTOr (A, B, C, 0,E, orF) M 4 FFFFTT 6 FFFFTT
L 6 FFFFTF 6 FFFFTT
E 2 TFFT 2 FFFFAnd (A or B, & Z- or 5) M 3 TFTF 3 TTTT
L 4 FTTF 4 FTTT4
M 2 TTTT 2 FTTFOr (A & B, or Et 5) M 3 FFFF 3 FTFT
Single L 4 TFFF 4 TFFTGroupings E 2 TFFTTT 4 TTTFTT
And (A, B, or C; & D, FT, or T M 4 FTFFFT 4 TTTFTTL 6 FFTFTF 6 FFFFTT
6E 4 FFFTFF 2 FT'TFFF
Or (A, B, & C, or D, E, 8,F) M 4 FFFTF1- 4 TFTTTFL 6 TTTTFF 6 TTFTFT
E 4 FFFF 1 TFFFAnd (A, B. & not either C or DI M 4 FFFF 3 FFTF
L 4 FFFF 4 TTTF4
E 1 FTTT 4 TFFFOr (71/4,11, or not both C & DI M 3 TTFT 4 FFTF
"Not" L 4 FFFT 4 TTTFGroupings
E 4 TFFFFT 2 TTTFFFAid (A or B,& not either C or D,
& Eor F)M 4 TFFFFT 4 FTTFTTL 6 FTFFTF 6 FTFFTT
6E 2 FFFTTT 4 FTTTTF
Or(A & B, or not both C & D,or f &n M
L
3
6
TFFTFFTFTTFF
4
6
FTTTTFTF'TTFT
b
d
"X" refers to "not A," "&"Jefers to "and."
E, M, L Early, Middle, Late exits
Given as the number of minimally relevant categories in a particular structure-truth value combination
Given as the seq .once of truth values corresponding to the individual categories in the condition
18 `)4

possible patterns determining a specific exit position for aparticular structure-truth value combination.
In summary, the complete stimulus set for the main conditionconsisted of all combinations of three "formats," two "numbers,"two "connectives," and three "organizations," yielding 36 uniquestimuli. Each of these 36 could be either true or false, and eachcould have an ea fly, middle, or late exit. Thus, a total of 216(i.e., 36 x 2 x 3) stimuli were needed.
The fillers for the categories in the logical structures ofthe instructions were a set of 15 highly familiar, one-word (or intwo -cases, two-word) descriptors. Ten of the descriptors weresemantically opposed, creating five pairs of complementaryantonyms. The total set of 15 descriptors, with antonym pairsgiven first, was: "male-female"; "married-single"; "white-black";"righthanded-lefthanded";."over l5-unaer 26"; "employed";"homeowner"; "student"; "parent"; and "veteran".
The rationale for choosing these descriptors was (1) tosimplify categories as much as possible to minimize the processingof content in relation to the processing of logical structure, and(2) to enable subsets of,ten descriptdrs to be drawn such thathalf were true and half-false for any particular subject.
v
Since the "trut) value" and "exit position" dimensionsdepended upon the individual subjects' category values, it wasnecessary t9 obtain these'values prior to constructing thestimuli. Ten descriptors were selected from the set of 15 filler'ssuch that hilf were'true and.half false when applied to thesubject. This was accomplisied by asking the subject his or hertruth values for the five non-paired descriptors ("homeowner,""parent," "veteran," "student," "employed") as well as the valuesfor One member of each of the 5 antonym pairs. Based on the
.values obtained for the first five descriptors, the appropriateterm was selecteo from each of the five pairs, such that therewere.five true and five false'descriptors for each subject. Theselected descriptors were then randomly "inserted" in the stimulusset with the restrictions implied by the truth values and.exitposition dimensions: half true and half false instructions: andequal members of early, middleloand late exit positions. Theserestrictions were applied to all levels of the other dimensions aswell (e.g., half of the four-category instructions were true,etc.). Of cqurse, no category was repeated within a giveninstruction.. ,,,
\. Unpracticedondition. For the first set of stimuli
J(presented with o practice). a single logical structure wasselected: the ffirmative version of the four-category "and"string (Type 1,,Y used in the main condition: "A, B, C, and D."The three formats were crossed with the two truth values tocomplete the preliminary stimulus set. Two replications for eachtruth' value-format combination yielded a total of 12 stimuli forthis condition.

Exit position could not be systematically varied. Thepattern of individual truth values for "true" structures was fixedby the logic of conjunctive strings: "TTTT," with the exit on thelast category. For "false" structures, two patterns were used:"TFTT," with an exit after two categories, and "TTTF," with anexit after four categories. Thus each block consisted of onetwo-category exit and three four-category exits. The fourcombinations of exit position and truth value were presented inefixed rather than random order within a block. Table 3 shows thepatterns for the four trials in each block.
Table 3. Fixed Exit Positions and Truth Patterns for the Unpracticed Conditionby Trial Order and Block Order
Block
orderTrial
orderExit
sos.
Individual
truth
'atterns
Overall
truthvalues
Block 1 1 4 TTTT T
2 4 TTTT T
3 2 TFTT F
4 4 TTTF F
Block 2 1 4 TTTT T
2 2 TFTT F
3 4 TTTF F
4 4 TTTT T
Block 3 1 4 TTTF F
2 2 TFTT F
3 4 TTTT T
4 4 TTTT T
PRESENTATION OF STIMULI
The experiment was conducted on a 2640B display terminalconnected to an HP3000 computer system. This particular terminalimposed some technical constraints on the graphic presentation ofthe stimuli, primarily in terms of the possible layouts of theflowchart algorithms. However, the greater constiaint onalternative presentations of the instructions was the need tooptimize the layout of each format for ease of processing. Onlyin this way could we achieve a fair comparison of prose,floWcharts, and lists. Yet little is known about what constitutesoptimal design in each format. That design appears to depend on a
20 2 1;

at
intetactiOn of the task, the user, and the structure ofthe instruction. Our choices for layout were therefore intuitive,based 3n observing a pilot sample of altznative layouts in eachformat, and judging what appeared to us to be the clearestarrangement within the space and feature constraints of CRTpresentation.
For prose the most obvious simplification was to trim words,clauses, and sentences to the shortest units possible.* Fdrther,for graphic simplicity, we decided to display prose with thesentence centered in the screen and the first word located nearthe screen margin to the left of center. Longer sentences werecontinued on two lines (gt most), with the second line beginningat the left margin immediately beneath the first line. Uppercaseletters appeared at the beginning of the first word of each proseinstruction, following normal sentence form. Underlying thedifferent prose, stimuli, there was one basic sentence template.Manipulating the number and type of connective words in thistemplate generated the twelve structural frames required for thisexperiment, into which categor: fillers were inserted to make acomplete instruction.
The flowchart design presented a wider range of choicesMany of these variables have never been specified; few have beentested for-whether and how they affect human-performance. Formalvariab... I include multiple vs. binary branches (arrows), andquestion plus "yes-no" branches (as -in Figure 1) vs. branchescaptioned with category choices. Visual-graphic variables includeleft-right vs. top-bottom flow ditection, open vs. boxed (framed)questions, arrows vs. "rivers", and a number of other size,plicement, orientation, and color choices.**
The display medium plays a more critical role with flowchartsthan with prose in determining what options are possible ondimensions such as these. With little information available onthe optimal design of flowcharts, we based our decisions onviewing several possible layouts on the computez screen. Thefinal choices can be seen in the sample of templa*ps qhman inFigure 5. Though reduced in scale, these templates a,-e identicaltn proportion, in distribution of upper and lower case letters,and in other features to the templates displayed on the CRTscreen.
Another possible simplification was to break the proseinstruction into two or more short sentences. Without testingthis option, we speculated it would do little to simplify theprocessing task: short sentences still require truth-functionalconnectives between them to capture the undetlying truth table.**Kammann (1975) described and tested some of these formal andgraphic options.
2l0"'
_...XX Press
XX
x
xx. Press X
XX
XV°.XX...
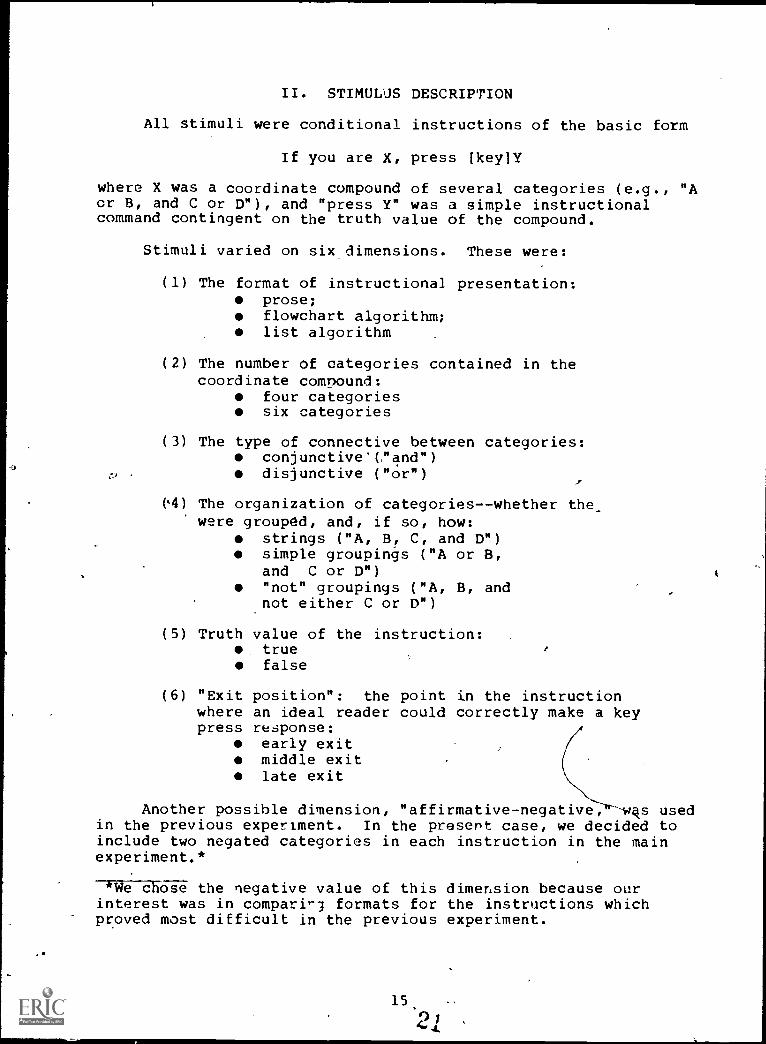
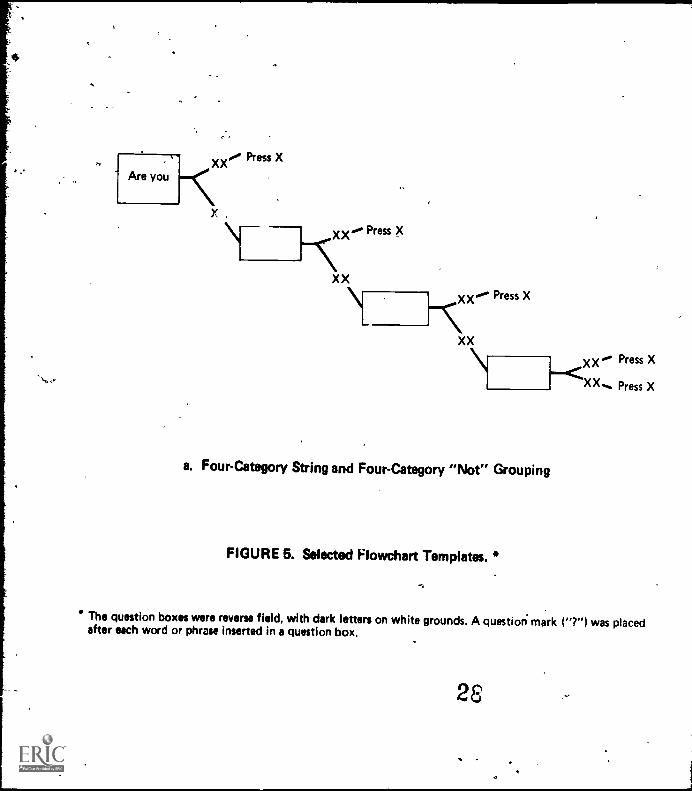
a. Four-Category String and Four-Category "Not" Grouping
FIGURE 5. Selected Flowchart Templates. *
Press X
Press X
The question boxes were reverse field, with dark letters on white grounds. A question mark ("7") was placedafter each word or phrase inserted in a question box.
28

Are you
r
XX°'Press X
XX.HPress X
XX,--<XX,..
Press X
XX0. Press X
Press X
b. Six-Category Single Grouping
FIGURE 5. Selected Flowchart Templates. (continued)
XX,..Press X
XXPress X
30_'

Press X
XX
Nsst.
xx... Press X
XX
XX
...XX
XX
XX... Press X
XX
Press X
\i-) Fsxx .0 Press X
XX
. 31
c. Six-Category "Not" Grouping
xx... Press X
XXxx. Press X
XX.... Press X
FIGURE 5. Selected Flowchart Templates. * (continued)
0. Press X
XX _-- Press X
32

Six templates were required in the flowchart format torepresent the 12 structures of the stimulus set.* Figure 5 showsthree of these templates. Organizational complexity can be seento affect, directly the complexity of the template's shape. Ingeneral, flowcharts for strings are linear; those for groupingsare branched. Note, however, that the flowchart for four-category"not" groupings duplicates the linear flowchart for four-categorystrings. This is because the "not A, not B, and not either C orD" structure is the logical equivalent of "not A, not B, not C,and not D." The latter, linear organization is the more basic anddetermines the shape of the flowchart.
Flowchart templates were constant for variations in logicalstructure other than organizationt.e., "and" vs. "or" andnegative vs. affirmative. The flowchart reflects the two latterdimensions in the assignment of labels to arrows or commandsrather than in spatial characteristics. The labels that markedarrows were either "yes" or "no" (indicated as "xx" in Figure 5).The labels marking command outcomes were "press *" or "press $"(indicated as "press x" in Figure 5). The "and-or" distinctionwas mapped onto the flowchart by both (1) interchanging the"yes-no" la-els on the arrows; and (2) interchanging the labeledoutcomes "Press $" and "Press *."
Lists offered fewer formal and gra hic choices thanflowcharts--these choices were lar in how to space lines anditems. Again, for those variab; that seemed significant toprocessing,,we made decisions fntuitively by observing the choiceson the CRT screen.
There were two templates for the "jump" list format,depending on the number of categories: a list of four "Are you
?" questions for four-category structures; a list of sixquestions for six-category structures. The four-category templateis shown in reduced form in Figure 6. The proportions and otherfeatures are identical to those of the template that appeared onthe CRT screen.
*Each flowchart template was a set of boxes and arrowsdistinguished by shape--that is, by the number and theconfiguration of boxes. Defined on these criteria, templatesvaried with (1) the number of categories in the conditional clauseand (2) the organization of the categories--string vs. grouping,and number of branches in the grouping.
)t_I
25

1. Are you If no, go to X.If yes, go to X.
2. Are you If no, go to X.If yes, go to X.
3. Are you If yes, go to X.If no, go to X.
4. Are you If yes, go to X.If no, go to X.
5. Press X
6. Press X
FIGURE 6. List Template for Four Categories.*
A-question mark ("?") appeared at the end of each word or phraseinserted in the blanks in a template. The spacing between the end ofthe inserted word or phrase and the beginning of the "If" commandwas always three characters.
.Although organizational type does not have the overt effecton spatial structure that it did with the flowchart,'it affectsthe "-jump patterns" involved in following "go to commands. Jumppattern refers to the number and the size of skips between itemsin.a route through the list. These two variables are determinedby the combination of organization, length, and exit position.
The 12 frames necessary for the list conditipn were generatedfrom the two list templates by inserting and manipulating the"yes" and "no" responses, the item numbers specified in "go to"commands, and the key specifications in "Press"' commands.
Finally, for all three types of formats, most graphiccharacters appeared. in white on the dark field of the CRT screen.However, the boxes of the flowchart were presented inreverse-field: the area of each box was white while the wordswithin boxes were in dark letters.
3426

III. METHOD
Subjects. Fifty-four adults, 20 males and 34 females, servedas subjects. All were fluent English speakers. Half wereundergraduate and graduate students from three universities in theWashington, D.C. area, and were paid $5.00 for theirparticipation. The rest were employees of the American Institutesfor Research, who donated their time. The employees were fromboth clerical and research positions, and all had completed atleast a bachelor's degree.
Ex?erimental Deskgn. To recapitulate, the experiment used amixed within-between factorial design to assess response time andaccuracy. The within-subject factors were: (1) format (3levels), (2) number of categories (2 levels), (3) type ofconnective (2 levels), (4) truth value (2 levels), and (5) exitposition (3 levels). These were combined factorially to produce3 x 2 x 2 x 2 x 3 = 72 instructions. There were no replications.The between-subject variables were (1) organizational type (3levels) and (2) order of format blocks (3 levels). With respectto the latter, subjects were randomly assigned to one of threeorders, determined by the identity of the first block: prosefirst, flowchart first, or list first.
The unpracticed condition used a 3 x 3 x 2 factorial design,retaining format and truth value as the within-subjects factorsand order of format blocks as the between-subjects factor. (Exitposition was treated as a random variable.)
17Finally, the content of categories (fille 5) and the order ofpresenting instructions within a block were treated as randomvariables, in both the unpracticed and main,conditions.
Implementation. A computer program generated the conditionalinstructions in an interactive session with each subject. Theprogram was designed to:
assign subjects randomly to the ninebetween-subjects cells created by the combinationof organizational type and order of formatblocks;
select the 10 words representing half true andhalf false descriptors for each subject;
place fillers in the instructional framesaccording to the stimulus generation procedures-described above;
30'727

carder the presentation of stimuli randomly withinformat bl cks, subject to the restriction thatinstructions of the same length or same
- organizational type could occur no more thanthree times in succession;
record and score response time and accuracy.
The selection and sequencing of fillers in.frames wasrandomized independently between trials (the presentation of aninstruction), and between subjects. The order of presenting theinstruc,_ons was randomized independently between subjects andbetween format blocks.
Procedure. Subjects were tested individually in a singlesession lasting 50-60 minutes. Each subject responded to 72instructions, all'of a single organizational type, presented oneat a time on the screen of the HP display terminal,- Svbjects satat the keyboard of the terminal, where they indicated theirresponses by pressing one of two keys, labelled "*" and "$".These keys were about 1.5 inches apart. The rest of the keyboardwas coveiad. Subjects were instructed to respond with the indexfinger of each hand throughout the trials. The subject's handsrested on the keyboard panel between trials, while subject's tworesponse fingers were poised above the response keys.
Subjects were read introductory instructions explaining that"this was a study to see what is the best way to presentinstructions to make them easier to follow." They were asked toread and respond to each instruction by pressing the appropriatelylabelled key--either "*" or "$". Subjects were told thatsometimes they would see a sentence teat said only what key topress if the condition were true for them. (This was the case forall prose formats.) If the condition were false, subjects were topress the remaining key. Two short, one-category sentences werepresented to illustrate this procedure.
lubjects were told they would see instructions "in differentforms, some of which might be unfamiliar," but they were not toldwhat forms they would see, nor given any directions on how trhandle the different formats. They were told that someinstructions might be hard, but to do their best--that the pointwas to try to read and answer as quickly as possible while stillbeing as accurate as possible.
Before the trials began, subjects saw 10 questions on thescreen representing the 15 categories ("Are you male?" etc.).They were asked to answer "yes" or "no" while the experimentertyped in the answers. The program then selected 10 descriptors(out of the 15 possible) yielding an equal number of "yesses" and"noes" and presented these 10 to the subject while theexperimenter explained, "These, are the words you will see in the
3628

sentences to come." The subject was asked to confirm that thedesignation -of these descriptors as true or false was correctbefore the experimenter proceeded.
The subject was then presented the 12 "cold" trials in theunpracticed condition. The instructions in these trials werepresented in_sets of four, blocked by format.
After these 12 trials, subjects were given a chance to askquestions. The.experiMenter answered questions about responseprocedure and purpose, but not specifically about how to interpretthe prose logic or how.to follow the algorithms.
Subjects were then told they would see instructions likethose they had just responded to but somewhat more complicated.They were informed that these instructions would be presented ingroups based on the form of the instruc'ziOn, as with'the groupsthey had just seen; but that there would be many more instructionsin each group 9 that each group would be preceded by eightinstructions i practice.
Subjects were then presented the three blocks of 24experimental trials each. Eight practice trials (with feedback)in the appropriate format prefaced each block, producing 32 trialsin each format. The program signalled "end of practice" betweenthe practice and the experimental trials. Subjects cou'i askquestions at this point, but the experimenter's answers stayedwithin the limits set.for the unpracticed condition.
The practice instructions sampled each of the four logicalstructures (four vs. six categories, "and" vs. "or") included inthe organizational type assigned to that subject. Structure wascounterbalanced with truth value to yield the eight practiceframes. The placement of fillers in these frames was randomizedby the same procedure used in the experimental trials.
Subjects received feedback on the practice trials in the formof a programmed "incorrect" signal that flashed on the screenimmediately after an incorrect response. The misperformedinstruction then reappeared. This procedure served to stress theaccuracy constraint.
Each trial began with the signal "READY" flashed on thecenter of the display screen for about two seconds. From one totwo seconds after the offset of the signal, a conditionalinstruction appeared and remained on the screen until the subjectpressed a response key, terminating the trial. If the subject hadnot responded after 60 seconds, the sentence disappeared and thesubject was forced to select a response.*
'fThere were no cases of latencies this long during theexperimental trials.
293

t
A variable interval of 5 to 16 seconds separated the trials.The variable interval was necessitated by the software requirementof writing' each instruction on-line before it appeared on thescreen. The writing procedure took 10 seconds for thefour-category flowcharts, 16 seconds-for the six-categoryflowcharts, 5 seconds and 8 seconds for the four- and six-categorylists (respectively). Thege durations determined the length ofthe respective intertrial intervals for the flowchart and listformats. For prose, the writing duration 'gas mach shorter.Therefore, a 5 second interval was imposecrto make these trialsmore consistent with those of the other two'formats. Subjectswere told simply to expect a variable wait, which would sometimesbe rather long, between trials.
A rest period of approximately 30 seconds separated the threetrial blocks, longer if the subject desired. The experimenterremained in the room with the subject throughout the session.
Subjects were timed in hundredths of a second from the onsetof an instruction to the first push of a response button.Response accuracy was scored by an algorithm which verified eachantecedent statement according to its coordinate structure inconjunction with a subject's truth values on the individual words.
At the end of the session, subjects were asked to rank thethree formats according to which they liked the best. Subjectswere also asked background information: level of education,professional or academic field, and experience with a logic and/orprogramming course.
S
38
30

IV. RESULTS
1. Main Condition
We analyzed the data from the main condition ( test trials)in two steps. First, we conducted ANOVAS on the e .ire3x3x2x2 data set (organization x format ' th x and -or),collapsing over truth value and exit positiu. sdae ANOVA was'performed on mean response time, one on mean number correct.**Bothanalyses shoi/ed significant three-way and four-way interactions.The major implication of an interactive pattern of results is thatconclusions of t'he sort "format X is better than format Y" cannotbe drawn; instead, statements about format differences must beanchored to the logical structure of the instruction.J
The second step, then, was an attempt to untangle the complexiffitleractions by conducting separate ANOVAs for each of the threeorganizational types--strings, simple groupings, and "not"routoings--since organizational type was a between-subjects factorin this design. Thus six new ANOVAs were conducted, each a3 x,2 x 2 design (format x length x and-or), three each forresponse time and for number correct. These ANOVAs are shown inAppendix A.***
-1-t is clear that the pattern of results was stillinteractive. Rather than overload this presentation with adiscussion of each significant interaction, we will present thosedata that'yield the clearest answers to the first three motivatingquestions of this study: Are algorithms better than prose? Whatare the limits on this conclusion? How do lists and flowchartscompare? We will link the relevant data to a model of now peopleprocess complex conditional instructions in each format.
The firdt question posed in this study was: For instructionswith truth - functional conditions, doalgorithms improveperformance over prose? The clearest answer to this question isprovided by the -graphs showing lists, flowcharts, and prose foreach of the three organizational types, collapsing over theremaining stimulus dimensions. Figures 7a-c present these plotsfor response time; Figures 8a-c present the plots for number
. correct. There are separate graphs for strings, simple groupings,
*Order of format blocks was controlled by counterbalancing in thedesign.**Two ANOVAs for response times were conducted using both raw dataand logarithmic transformations to normalize the positively skeweddistributions of time scores.-***Since clearer interretations wtre possihle off of thetransformed data, the appendix shows only the ANOVAs for thosedata. The transformed and untransformed dai-a yielded similarpatterns.
313

13
12
11
7
6
5
PROSE LIST FLOW
a. Strings
13 13
12 12
11 11
10 10
9
8
7
6
5 I I I I 1 I
PROSE LIST FLOW PROSE LIST FLOW
b. Simple Groupings t. "Not" Groupings
FIGURE 7. Mean response time as a function of format for each organizational type.
40

4 1 1 I I I IPROSE LIST FLOW PROSE LIST FLOW
a. Stringi-..,
b. Simple Gro-pinps
1 1 ___JPROSE LIST FLOW
....
c. "Not" Groupings
FIGURE 8. Mean number correct as a function of format for each organizational type.
41

and "not" groupings. These graphs show that processing of listsand flowCharts is generally both faster and more accurate thanprocessing of prose.
The second question posed in this study--where rand how muchdo algorithms improve performance over prose--requires afiner-grained analysis. From the graphs, we can see that thereare exceptions to the su?eriority of algorithms, as well asvariations in degree, depending on a combination of factors: theorganizational type, the measure, and the form of the algorithm.Foi-axample, when tha structure is a string, list algorithms haveslower response times than prose. Furthermore, we can infer thatprose is sensitive to logico-structural changes in the stimulusinstructions while algorithms are not. Prose becomes slower andmore error-prone as the organization goes from easiest (strings)to hardest t"not" groupings), while algorithms maintain relativelyuniform speed and accuracy across organizations. Indeed,algorithms appear uniformly nearly error-free.
To understand these 'variations in the relations amongformats, we must look at what underlies performance. Our bestexplanation of performance is in terms of an informal theoreticalmodel of what readers do in each format. This model also providesthe grounds for answering our third question--how do lists andflowcharts compare with each other?
We describe this model below. Our presentation omits severalasszmptions necessary to qualify the model as formal: it isintended more as an organizing heuristic for the complexexperimental results than as a tool to generate precisequantitative predictions.
Algorithms
:The model. Our best explanation of performance withalgorithms Is a linear processing model that predicts responsetime in terms of the exit position in the stimulus instruction:that is, the minimum number of categories that must be processedto verify the condition and determine a response to theinstruction. Exit position is the dimension hypothesized to beuniquely pertinent to performance with the algorithms, basal onthe obligatory partial processing that characterizes that format.We can represent the effects of this dimensibn with threeparameters, signifying three basic kinds of operations required toprocess an algorithmic instruction. We assume that each operationtakes a fixed amount of time, identified by that parameter. .
42
34

The first parameter, which we will call "r," represents thereading time for a given step in the algorithm.* This is the timeneeded to encode and answer a given question, and to match theanswer to the appropriate "yes" or "no" symbol (which indicatesthe way to the next question or outcome in the sequence). Thesecond parameter, which we will refer to as "m," represents themoving time for a given step in the algorithm. This is the timeneeded to make the physical transition between one question andanother or between a question and final response (outcome). Thethird parameter, "e," represents the time needed to select andexecute the final response to the instruction.
By these definitions, the values of "r," "m," and "e" shouldchange with the type of algorithm, since all parameters aredetermined by the nature of the physical and symbolic connectionsbetween steps. We will postpone consideration of these parametricvariatipns until we discuss the flowchart-list comparison.
To complete the model, we assume that subjects process onlythe questions (categories) presented in that route through thealgorithm that is relevant to their particular combination oftruth values. Assuming the relations of a linear processingmodel, it follows that the operations of reading and moving occuronce, additively and independently, for each category representedit a given route. The execution parameter "e" occurs only onceder Instruction. To produce the final response time for aninstruction, the parameters "r" and "m" would be multiplied by thenumber of categories in the route and added to "e." Since thetotal number of categories in a route is identified by the exitposition variable, this model predicts a constant, linear rise inresponse time with increasing exit position. Response time shouldnot vary over changes in the logical structure and the length ofthe instruction.
The response time data. The data germane to this model arethe breakdowns by exit position of the response time results.Appendix B displays these breakdowns, showing respoi:se time foreach combination of format x organization x and-or x length x exitin the data set. Since exit possibilities depend on truth valueas well as length and logical structure, the truth valuebreakdowns are also given in Appendix B.
To test the moe.el against these data, we performed regressionanalyses on the response time data in each format.** That is, we
4-17e't us consider a "step" the operation of going from the startof one question in the algorithm to the start of the next relevantquestion.**As mentioned prEviously, it was impossible to include "exitposition" as An experimental factor (i.e., factorially cross itwith all other variables). Thus, the "tests" discussed here areall post-hoc.
4J

calculated the best-fit regression equations for the exit positionby response time functions and tested for the significance of thelinear component. Results for the overall analyses appear inTable 4. It is clear that exit position is a potent predictor ofresponse time in algorithms: The overall correlation betweenresponse time and exit position was r = .937 for lists, r = .796for flowcharts. This means that response time in each formatincreased as a relatively uniform, linear function of exitposition, irrelevant of length or structure. This relationshipconforms to the predictions of the model. By contrast, thecorrelation between exit position and response time for prose wasr = .006, demonstrating the model's assumption that the partialprocessing effec is unique to algorithms.
TABLE 4.Response Times for Exit Positions in Lists and Flowcharts
Exit aPos.
(n) b List Flowchart
( 7) 5.03 ( .73) c 3.79 ( .30) c
2 (10) 7.39 (1.05) 5.11( .98)
3 ( 9) 8.35 ( .65) 5.57 ( .73)
4 (32) 10.23 ( .81) 6.77 (1.21)
6 (14) 14.29 (1.51) 9.10 (1.73)
Mean 9.89 (7.88) 6.55 (1.96)
Correlation .94 .80
Slope 1.79 1.04
Intercept 3.27 2.72
NOTES:
a mean exit position = 3.694
b ,iumber of instructions per format with given exit position
c standard deviations in parentheses
To clarify these analyses, we have plotted the estimatedregression lines for predicting response time from exit position.The regression lines for lists and flowcharts are displayed inFigures 9a and b (respectively). These lines show how eachadditional relevant category in the instruction adds a constantprocessing load, given by the slope of the line. The lines
4,136

16
15
14
13
12
11
10
9
8
4
3
2
1
1 2 3 4 5
Exit Position
a. List
6
16
15
14
13
12
11
10
9
8
7
6
5
4
3
2
1
2 3 4 5
Exit Position
b. Flowchart
KEY: el "Not" Grouping
Simple Groupings
Strings
FIGURE 9. Estimated regression lines for predicting response time from exit position for lists and flowcharts.(Mean response times for organizational types are plotted around each line.)
V'0
further clarify the list-flowchart differences in slope andintercept indicated in Table 4. We will return to thesedifferences in considering the question of lists vs. flowcharts.
The data points plotted around the regression lines in Figure9 show the obtai.led mean response times for each of the exitpositions broken down by organizational type. These pointscluster closely around the two lines, reflecting the strong linearassociation between time and exits overall and supporting themodel's prediction that logical variables will not affectperformance and algorithms. Nevertheless, there is a certainamount of response variability attributable to logicalorganization, and we will look at the breakdown of the time-exitcorrelations by organizational type at a later point in thispresentation.
The number correct data. The accuracy results presented inFigure 8a-c are self-explanatory. There appear to be nosignificant errors with algorithms. Supported by the responsetime data, these results demonstrate that algorithms virtuallyeliminate the logical asymmetries prevalent in performance withprose. There was a slight drop in number correct for "not"groupings in both lists and flowcharts (Figure (,c). Separatingthe number correct data by four vs. six categories showed thatthis drop is attributable to the six-category, branching template.We will return to this issue later in this presentation.
The absence of errors allows several inferences about howpeople performed with algorithms in this experiment. Earlier wehypothesized that category-level operations (reading and answeringindividual categoried) would not create errors since thecategories are simple and overlearned. The data support thishypothesis and also allow us to infer that the other operationsinvolved in the algorithm task--encoding, matching yes-no answers,foliowin arrows, scanning, searching and responding--are
itnegligib sources of error. Although these operations can betime-cons ming, as in the list, they are nevertheless simple andexplicit and unlikely to produce mistakes.
Prose
The model. The results for prose are more complex than thosefor algorithms. Figures 7 and 8 demonstrated the uniquesensitivity of prose to organizational structure. A furtherbreakdown of the prose data by "and-or" and by four vs. sixcategories, Figures 10 and 11, reveals the unique influence oflogical connectives and length. These results are consistent withour hypotheses about the effects of truth-functional variables onperformance with prose.
38

And
a. Strings
14
13
12
11
10
9
8
7
e
AP
6 Categories
44NN)1114Categories
And Or
15
14
12
11
10
9
8
7
6 Categories
."'"..........
4 Categories
6 1 IAnd Or
b. Simple Grouping c. "Not" Groupings
FIGURE 10. Moen response time for prose as a function of "and-or" for each organizational type.
47


Our best explanation for the interactive relationshipsobtained in the ANOVA and shown in these figures is in terms of aprocessing model built on parameters of logic and length ratherthan exit position. This model is based on.the task analysis forprose instructions described earlier, and serves both to organizethe hypotheses drawn from that analysis and to give a generalaccount of the kinds of logical variables that make prose more orless difficult and more or less subject to improvement byalgorithms.*
We will sketch the model with respect to response-time.Extending the linear relationships assumed by the algorithmsmodel, the prose model conceives the instructional task as aseries of cognitive operations combining additively to produce thefinal response time. This model makes a basic processingassumption: subjects exhaustively process the prose instruction,reading all categories presented in the antecedent clause.
The "e," "m," and "r" parameters retain their conceptualmeaning, although they presumably have different values for prose.The other components of response time in this model derive fromlogical operations, unique to prose. In our original processingmodel (Holland and Rose, 1980), we captured the effects oftruth-functional complexity on performance with three parameters,representing the additional mental operations required (1) for"or" connectives over "and," (2) for comma-implied (e.g., "A, B,or C") over explicit "or" (e.g., "A or B or C"), and (3) forgrouping over linear structures. Here, we add a fourth parameter,representing the operation required to deal with negation.
These predictions follow: Response time should be unaffectedby the exit position of an instruction but should increase as afunction of increasing length and the additive combination of anyof the four logic parameters just described. For predictionsabout accuracy, we assume that category-level errors do not occurin performance with these instructions. but should instead be afunction of the logical parameters. The model thus predicts thaterrors in prose will be unaffected by length per se; rather,errors will increase with increased logical processing demands.Thus, error effects will be identical to those in response time,disregarding length.
Let us compare these predictions with the observed responsetime and errors.
The response time data. The first observation concerningresponse time, from the regression analyses, is thevirtual lack of correlation between response time and exit
*A full description of this model is given in our previous report(Holland and Rose, 1980).
41 4D

position for prose (r = .006). On the other hand, the correlationbetween response time and length is moderate, at r = .433. Theseobservations support the assumption of exhaustive processingposited in the performance model.
Returning to the functions relating fotmat to organization(Figure 8), we find that response time for prose increases overorganizational types, with strings (Figure 8a) taking the leastamount of time and "not" groupings (Figure 8c) taking the longest.This ordering is explained by the addition of the groupingparameter between strings and simple groupings, and the additionof the negation parameter between simple and "not" groupings.
Looking within organizational types, we find furthervariations in prose response time as a function of the number ofcategories and ..he pattern of connectives. These variations canbe seen in Figures 10a-c, which show the prose functions relatinglength to the "and-or" variable for each organizational type.
The first salient feature in these graphs is thatsix-category structures are consistently slower than four-categorystructures at each organizational level. This delay reflects theaddition of the reading parameter ("r") with added categories.The second notable feature is the "and-or" asymmetry displayed ateach organizational level. These asymmetries reflect the constanteffect of the "or" parameter: In general, the presence of "or" inan instruction increases response time incrementally for eachgroup in which the "or" occurs.
There are two apparent anomalies in the shape of the"and"-"or" and four vs. six functions that we will addressbriefly. First, the slope of the "and-or" function is positivefor strings, negative for simple groupings. This reversal isexplained by how we have defined "and" and "or" structures. Forgroupings, "and" structures are those with the major groupsconnected conjunctively: "A or B, and C or D." Thus, "ors"outnumber "ands" in "and" groupings The second peculiarity ofthe "and-or" functions in Figure 10 is the failure of thesix-category "not"-grouping to show the predicjed "and-or"asymmetry (Figure 10c). The predicted asymmetry did, however,emerge strongly in response errors, as we will see in examiningthe accuracy data. The simplest explanation is that subjects weresacrificing accuracy for speed in this, the most difficultcondition. Subjects may have imposed a ceiling of around 14 and ahalf seconds on response latencies.
*In the third organizational type, the six-category instructionis a grouping, with the "and" structure predicted hardest, whilethe four-category instruction is more linear, with the "or"structure predicted hardest.
;)
42

There a, further complexities in the graphs in Figure 10.For example, the slope of the "and-or" function in both types of
groupings (except for the six-category "not" grouping) are steeperthan the slope of that function in strings. Similarly, thedifference between four and six categories in both types ofgroupings is far greater than that difference in strings. We willnot attempt to explain these variations fully here; suffice it tosay that they are in large part predicted by the logicalprocessing parameters.
However, there are some additional effects not attributablesolely to truth-functional complexity. For example, in the thirdorganizational type, the difference between "and" and "or" at fourcategories is nearly three seconds--greater than any other"and-or" difference in the stimulus set. What underlies theunprecedented difficulty of the "or" instruction here? We willoffer a speculative account.
The instruction= in question have these schematic structures:for or--"not A, not B, or not both C and D;" for and---"not A, not
B, and not either C or D." The former structure incorporates twoof the parameters hypothesized to complicate processing: the "or"operation as the major connective, and the presence of an implied
"or" in a comma series.* Furthermore, the four-category "not"grouping is the only structure in the entire set in which all
categories are negated. It may to that the difficulty of "or"series with commas is exacerbated by (or interacts with) negation.
Thus an explanation for the difficulty of the "not A, not B,or not both C and D" instructions may start with a combination ofthese factors: the difficulty of the implicit "or" series, andthe enhancement of this difficulty by "nots."
In conclusion, the shape of the prose data can be understoodlargely in terms of the processing model we have sketched, whichpredicts the difficulty of prose instructions in terms of a linearcombination of logic and length parameters. Thus the fastestresponse in the stimulus set occurs with four-category "and"strings, as shown in Figure 10, because these stimuli containneither the logic parameters, nor the extra category readingoperations, hypothesized to add increments of response time.
*The explanation posited in the processing model in Holland and
Rose (1980) wag that subjects represent implicit series (A, B, C,or D) as if the commas were "ands." This appears to be afundamental encoding bias. Subjects must then transform thesentence or group into a di,junction when the "or" is discovered.This transformation time is over and above the original incrementrequired to verify disjuncti%e as opposed to conjunctive
structures.
5143
The number correct data. Looking briefly at the accuracyresults in Figures lla-c, we find that the number correctfunctions across organizations and connectives are as predicted inthe model: The "and" string is virtually errorless; accuracydeclines with added components of logical difficulty.
With respect to logical factors, then, the accuracyrelationships correspond at most points to the time relationships.The "and-or" asymmetries in errors directly reflect theasymmetries in time, as seen in comparing Figure 11 with Figure10. It appears that subjects in this study handled logicaldifficulty by both slowing down and committing errors.
Figure 11 also suggests that length per se does not affectaccuracy, further supporting the modeling assumption of nocategory-level mistakes. This suggestion is particularly clearfor the strings in Figure 11. The exceptions are those structureswhere added categories entail new components of logicaldifficulty. For example, the simple "and" grouping accrued moreerrors at six than at,four categories. Briefly, the distinctionbetween the four-category structure (A or B, and C or D) and thesix-category structure (A, B, or C; and D, E, or F) is thereorganization of binary "or" branches (A or B) as trinary "or"branches (A, B, or C). As posited in the model, the trinarybranches are more difficult (beyond the fact that they containmore categories) because they contain an initial comma expressing"or" implicitly.
Summary: Prose vs. Algorithms
Time.the
the prose model with that for algorithmsshows why the advantage of algorithms for response time varieswith the logical structure and length of the instruction, as wellas with exit position. The model for algorithms posits that theprocessing of algorithms stays constant with changes in logicalstructure.* It follows that the harder the structure of-the proseinstruction, the more algorithms should improve performance.Also, exit position affects the processing time of algorithms butnot of prose. It follows that the advantage of algorithms shalldiminish with later exit positions.
*Note that algorithms do reflect logical structure in terms ofthe minimum number of categories involved in different partialprocessing routes through the algorithm. The exit possibilitiesin an instruction are an inherent function of structure and truthvalue. For example, in our description of the stimulus set, weshowed how the minimum exit is earlier for strings (exit = 1) than,for hierarchies (exit = 2 for 2-branch hierarchies).
445:2

The models do not predict whicn of these effects (logicalvariables or exit position) is "stronger"--or, more simply put,when algorithms become superior. In general, for most of theinstructions examined in this study, algorithms were faster thanprose regardless of exit. An interesting_,comparison, however,arises in the relativeljr easy "and" strings. If the exit positionwas one, then the flowchart was a little over three seconds fasterthan prose. If the exit was four, then the two formats wereequally fast. Moreover, the list was about two and a half secondsfaster than the prose "and" string at the early exit, but abouttwo and a half seconds slower at the late exit. The obviousimplication is that there are some conditions where proseinstructions are nsworse than flowcharts, and are preferable tolist algorithms. In terms'of our models, these conditions occurwhen "encoding and moving" time take longer for the algorithms andlogical difficulties are negligible. We will explore this generalissue as part of the discussion of the "unpracticed" condition ina later section of this report.
Errors. Comparing the accuracy data for prose andalgorithms, we can see that all instructions except "and" stringsare improved by algorithmic translation. Again, the processingmodel which predicts virtually errorless performance withalgorithms, and the model which predicts prose errors as afunction of logical parameters, account substantially for theaccuracy data in this study.
Together, the models we have described explain thesignificant interactions in the ANOVAs on response time on numbercorrect, and the relative ordering of prose and algorithmsobserved in the plotted data.
Lists vs. Flowcharts
The third question addressed in this study--how flowchartsand lists compare--has to some extent been answered in thepreceding presentation. It is clear from the graphs in Figures 7and 8 that lists are slower than flowcharts, while both areequally accurate. We will attempt to formalize and explain thisrelationship in terms of the processing model for algorithmicinstructions.
In our original characterization of this model, we assumedthat the values of both the "e," "m," and "r" parameters wereformat-specific. How do these values vary between lists andflowcharts?
The reading parameter "r" represents a cluster of operationswhich in the flowchart includes reading the question, deciding theresponse, reading the "yes" and "no" answers, and matching theinternal response with the appropriate written answer. The listparameter "r" includes not only thete operations but also the
5345

operation of reading the "go to X" command, preceding thetransition between items. Thus the value of "r" for lists shouldexceed that of "r" for flowcharts.*
The moving parameter "m" in the flowchart represents the timerequired to follow the arrow from the "yes" or "no" signal to thenext question or outcome. In the list, "m" represents the timerequired to scan the qertical list Of questions in search of anitem number matching the number specified'in the "go to" command.The specified number must be retained in memory during the search.Clearly, given the extent of both
shememory operations and the
physical eye movements required, Ithe value of "m" should begreater for lists than for flowcharts. Finally, the "e"parameter, since it requires discriminating a separate "line" forthe lists, should be greater there than for flowcharts.
To see how these parametric differences are reflected inresponse time, let us return to the regression analyses presentedin Table 4 and Figures 9a and b. The regression lines plotted inFigure 9 clarify the differences in slope and intercept obtained-between lists and flowcharts in these analyses. With estimatedslope parameters,of 1.79 seconds and 1.04 seconds for lists andflowcharts respectively,,lists take longer to process by about 3/4seconds for each relevant category in the instruction (given bythe exit position). The estimated intercept parameters vary inthe same direction as slope: 3.27 seconds and 2.75 seconds forlists and flowcharts respectively. This difference isattributable to the "e" parameter.
In our first presentation of the regression analyses, wenoted that the.predictiveness of the overall correlations could beimproved when broken clown by organizational type. These'breakdowns are shown in Table 5. For.lists the new correlationsare .970, .951, and .949 for strings, groupings, and "not"groupings respectively (compared with .937 overall). Forflowcharts the improvement is more dramatic: .960, .879. and .838respectively (compared with .796 overall). These breakdownsexpose several systematic variations in the predicted linearrelationships which have important processing implications forlists and flowcharts.
An explanation for the variations from linearity is that theflowchart uniquely reflects changes in logical organization bychanging shape: strings take linear flowcharts; hierarchies takebranching. This distinction was seen in Figure 5. The branchingflowchart is a potentially complicating factor in performancebecause it entails inconsistent reading direction. This effect
*In addition, in the particular templates used in this study, thelist repeats the "Are you . . ." before each question, furtherinflating the value of'"r." The flowchart states "Are you . . . "
once.
4654

TABLE 6.
Ransoms Times for Exit Positions by Organizational- Typo for Lists and flowcharts.
Exit
Strings Single Groupings "Not" Groupings
Pos. (n). List , Flow (n)1 List Flow In la List Flow
1 (4) 5.20,( .97)b 3.80 ( .28)13 - - (3) 4 , .281b 3.78 ( .39)b2 - . - (8) 7.20 (1.061b 4.86 1 .911b 12) 8.18 ( 70) 6.101 .71)3 (2) 8.23 (1.1 ) 5.51 ( .03) (' : 8.13 ( .29) 5.181 .89) 13) 8.75 ( .77) 6.151 .78)4 (10) 9.50( .41) .5.93( .49) (10) 10.82 ( .45) ' 7.13 ( .71) (1 10.35 ( .85) 7.1911.59)0 (8) 13.24 (- .78) 7.77 ( .34) (2) 15.25 ( .60) 10.47 (1.48) ( i' 15.72 (1.12) 11.08 ( .95)
14.081C . 13.331C (3.F .:
Mean 9.93 (2.91) 6.14 (1.44) 9.53 12.50) 6.32 (1.83) 10.21 (3.27) 7.19 (2.41)
Correlation .971 .960 .951 .879 .943 .838
SOP* 1.82 .80 2.00 1.34 2.08 1.35
intercept 3.31 2.90 2.95 1.36 2.58 '2.24
NOTES:
(n) number of instructions per format with given exit position
b stanciarci deviations 41 p.1111111,
c mean exit position for instructions in each organizational type
5r

was sufficient to increase the variablility in response timedisproportionately for flowcharts. Lists do not havecorresponding variations in shape or reading direction, but ratherreflect organizacion in terms of the number and size of skipsrequired across items. These factors appear not to havenoticeable effects on performance.
Support for the suggestion that branching shape complicatesflowchart performance comes from comparing the slope valuesbetween organizational types. The slopes for flowcharts in thetwo branching categories--simple groupings and "not"groupings--are, respectively, 1.34 and 1.35 seconds. These slopesare considerably steeper than the slope for strings--.80 seconds.Thus the branching flowcharts take longer to negotiate percategory than the linear. The list, on the other hand, shows onlyminor differences in slope between organizational type:. Theimplication for the performance model is that the "m" or "r"parameters vary not only with the type of algorithm but alto withthe shape of the flowchart algorithm.
There is a final variation in the breakdown correlations inTable 5 that is systematically explainable: the correlations inthe flowchart are higher for strings (r = .960) than for the twotypes of groupings. The correlations in the list are virtuallythe same across organizational types. A plausible explanation forthis phenomenon lies again in the shape of the flowchart.Specifically, there are shape differences within organizationaltypes as well as between them, and the sharpest differences arelocated in the two types of groupings. The exit position datapresented in Tables 4 and 5 are collapsed over four- vs.six-category instructions. This distinction governs differentalgorithm templates, however. In strings the difference betweentemplates is relatively minimal. The six-category template issimply an extension down the screen of the four-category template(See Fire 5). On the other hand, in both types of groupings,the six-category template is qualitatively different in shape fromthe four-category.
In "not" groupings the six-category template is branchedwhile the four-category is linear (Figure 5).* Based on thepreviously suggested effects of branching in flowcharts, we caninfer an increase in difficulty between four-category andsix-category instructions that is unparalleled in the otherorganizational types. This increase could have produced thegreater variablity observed in the response times for "not"groupings (r = .838) than in those for the other organizationaltypes.
*The radical shift in shape is unique to this organizationaltype: The linearity of the shorter template reflects the logicalconsequences of organizing four categories into three groupsaround a negated compound.
5t,48

In simple groupings, while the four- and six-categoryflowcharts are both branched, the six-category has a crossoverarrow, peculiar to this template (see Figure 6). The crossoverarrow runs vertically, unlike the rest of the arrows in thistemplate (and the arrows in the other templates in the stimulusset), which run horizontally or diagonally. The crossover arrowcould elicit confusion or a shift in processing, addingunpredicted increments of processing time to the six-categoryinstructions. These increments would account for the increasedvariability in response time for simple groupings (r = .879)relative to strings.
We have seen that hierachical complexity affects taskcomplexity in the flowchart. However, this effect is much smallerthan the effect of hierarchy in prose. Furthermore, it surfacesprimarily in response time and not errors. It is safe to say thatwhile algorithms do not entirely eliminate organizationalcomplexities, they reduce them to straightforward departures fromlinearity in the user's path. This spatial complexity is far lesstaxing than complexity in the logical computations required byprose.
Finally, we can infer that algorithms dissolve thecomplexities of disjunction and negation, reducing these variablesto differences in the assignment of labels to route contingencies.Labeling variables in the algorithm do not appear to change thetask demands.
Summary
We can recapitulate the results as follows: The model thatpredicts performance time with algorithms as a linear function ofthe number of categories in a reader-relevant route through aninstruction, underlies most of the observed results with lists andflowcharts. The model that predicts performance time with proseas a function of length and logic parameters, and errors as afunction of logic, underlies most of the variations in the proseresults. Together, these models explain the principal formatrelations found in tnis study: the superiority of algorithms toprose on selected combinations of exit position, logicalstructure, and performance measures.
2. Unpracticed Condition
The fourth question addressed in this study was how prose vs.algorithm formats affect performance at first exposures. Theresults from the main condition indicated how format influencesperformance after warm-up and practice. On practical grounds, theeffects of first-exposures are equally important. The aim of theunpracticed condition was to assess these effects.
49

All structures in this condition were logically simple, fourcategory "and" strings with no negation. The variables wereformat type, trial order, and format order. Trial order was awithin-subjects factor with four levels, correspo iing to the fourtrial positions in a block; format order was a been-subjectsfactor with three levels, based on which format occupied the firstblock. Format order is important here since first-blockpresentation constitutes the severest test of a format. The firstblock in the short condition was the subject's first exposure tofour-category instructions and to the particular mode ofpresentation.* The trial order dimension tested the effect ofdegree of exposure to a particular format independently of blockorder.
The response time data are displayed in Figure 12. Thefunctions plotted relate type of format to the trial ordervariable for each of th4 three format orders--prose first, listfirst, and flowchart first. (There is one graph for each order.)Inspection of the three graphs shows a striking difference betweenprose and algorithms. Response times for prose remain relativelyuniform over trials from the first to the fourth exposure.-Flowcharts and lists, however, have unprecedentedly highfirst-exposure times, followed by rapidly decreasing responsetimes toward the fourth trial. By comparison with the maincondition, the first-exposure time for flowcharts and lists rangebetween 15 and 24 seconds, or three and four times the norms forthose formats in the main condition. Response times for prose onall four trials are very close to those found for four-category"and" strings in the main condition.
The response time curves for algorithms have essentially thesame shape in all three format orders. This implies that it wasnot a general lack of warm-up or familiarity-with the task thatled to the high early latencies for algorithms. Nor didexperience with one kind of algorithm serve to level the curve forthe next one. Rather, the delays appear to have arisen from thenature of the individual algorithm formats. We can infer thateach algorithm format was unfamiliar, unexpected, or both,requiring a short warm-up of two or three trials to elicit normalspeeds.** Prose, on the other hand, was the expected and familiarmedium for instructions and appeared to require little warm-up.
*Recall that during the introductory instructions to theexperiment, subjects were shown the response buttons, were allowedto try them out, and were presented two one-category prosesentences to illustrate the response procedures**Looking at distinctions among the three graphs in Figure 12reveals a possible global warm-up effect for list algorithms. Thelist format elicited considerably longer first and second trialswhen it was the first format to be encountered (Figure 12b vs. 12aand 12c). When preceded by prose and/or flowcharts, however, thefirst-trial delay was reduced by several seconds.
50
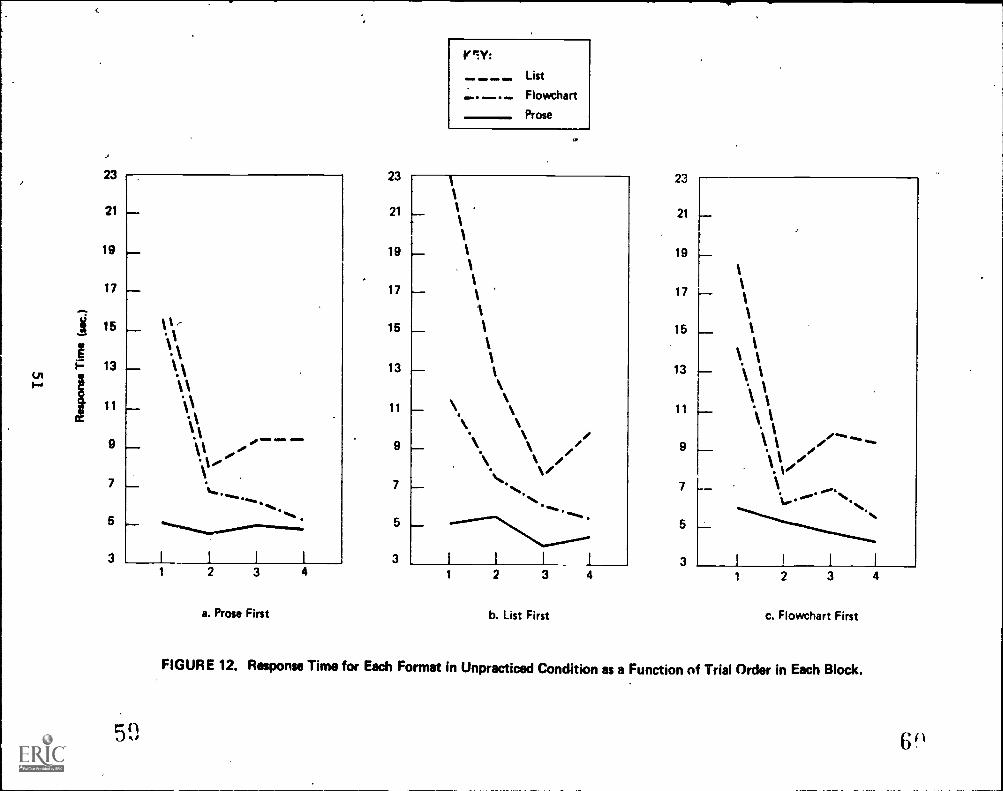
cnI,
23
21
19
17
i 15
13
1 11cc
9
7
5
3
,
\I
. .I
A- .............. ......"
I I I
50
1 2 3
a. Prose First
4
23
21
19
17
15
13
11
9
7
5
3
rlY:IMP
MOM ,Immt
List
Flowchart
Prose
N..
'..............
1 2 3
b. List First
4
23
21
19
17
15
13
11
9
7
5
3
\ %_
. %
1 % ."--. ly/\,........ N...%
I 1 I 1
1 2 3
c. Flowchart First
FIGURE 12. Response Time for Each Format in Unpracticed Condition as a Function of Trial Order in Each Block.
4
62

The shapes of the response time curves provide other clues towhat went on in the processing of algorithms "cold." We predictedthat the differences in exit position built into each block wouldaffect performance with algorithms but not with prose. (Eachblock had a different distribution of one two-category and threefour-category exits, as shown in Table 3.) Our predictions heldfor lists and prose but not for flowcharts:
Lists. The response time functions for lists (Figure 12a-c)have dips perfectly matched to the location of the two-categoryexit in each block. In Figure 12b, the dip corresponds to thethird trial. In Figures 12a and c, the dips correspond to thesecond trial. The data imply that subjects were performing thelist algorithm according to design, following the partialprocessing route specified in those instructions with early exits.
Prose. As we further expected, performance with prose didnot vary with exit position. The gradual descent in response timeover trials suggests that subjects were fully processing allstructures.
Flowcharts. For the flowchart algorithm, however, the shapeof the response time functions are not what exit position wouldpredict. Instead of drops in response time parallel to thoseobserved with lists, we find the gradual "learning curve"associated with prose. This result suggests that subjects in theunpracticed condition systematically misinterpreted the flowchartinstructions. They may not have followed the partial processingroutes specified in the design. This inference agrees with sosubjects' early comments that they did not know what to do withthe flowchart.
The error data further support the inference that subjectssystematically misinterpreted the flowchart, but did so only inthe condition where flowcharts were presented first. These dataare plotted in Figure 13, relating forma* to trial number in termsof percent correct responses. It is clear that the systematicerrors occurred in the flowchart-first condition (Figure 13c).The accuracy function for flowcharts in that condition declinesdramatically on the last two trials in the block. The decline isfrom an average of 90% correct on the first two trials to only 20%correct on the last two. No other format in any of the threeblock orders shows accuracy rates below 70%.
On carefully analyzing the flowchart task, and reviewingsubjects' comments and questions during the unpracticed condition,we were able to reconstruct a plausiole processing strategy whichappropriately violates the rules for following flowcharts andyields the error pattern in Figure 13c.
52 6 1

100
80
60
40
20 I I I
Trial Order1 2 3 4
0/4
a. Prose First
KEY:
MO. 41111.1111111
List
Flowchart
Prose
I I I I
2 3
b. List First
1 4
100
80
60
0
20i1 F
1 2 3 4 .
c. Flowchart First
FIGURE 13. Percent Correct for each Format in the Unpracticed Condition as a Function of Trial Order.
61)

Suppose that subjects decide;, to stop after the firstquestion box in the flowchart and respond on the basis of theiranswer to that question. This strategy specifies: If your answerto the first question, in the first box of the flowchart, is "no,"press the key specified (e.g., *); if it is "yes," press the otherkey, not specified (e.g., $). This strategy would have producedcorrect responses to all the "true" structures (since true "and"strings have "yes" for each category), and incorrect responses toany "false" structure that has "no" at some category after thefirst. In the truth value patterns governing Block 1, the lasttwo trials were false: one trial had a "no" at the secondcategory, one had "no" at the fourth (Table 3). Thus theexit-after-one strategy predicts that the last two trials in thisblock will receive apparently incorrect responses, while the firsttwo trials are apparently correct. The error data for Block 1flowcharts conform precisely to this prediction (Figure 13c).
What happened when flowcharts were presented in Block 2 orBlock 3? There the error data do not imply systematicmisprocessing while the time data do.
Let us suppose that subjects who received flowcharts firsttended to seize on the first method of response that occurred tothem, since the flowchart itself does not tell the user what todo. In this case, subjects may have been influenced by the samplesentences with one-category conditions, used to demonstrate theresponse procedure in the introduction to the experiment.Subjects therefore tried to respond on the basis of the firstcategory in the flowchart.
Subjects who got flowcharts later were learning the correctuse of this format as they went. Having to deal with full,four-category instructions in list form or prose form or both ledsubjects to expect to have to deal with the whole instruction mostof the time. These subjects processed flowcharts according todesign, fully processing late-exit instructions. Because thesesubject were learning as they went, they took longer on thetwo-category exit in trial 2 (where it fell in Blocks 2 and 3),but they handled it correctly. Building up to speed, they handledthe remaining two trials, with four-category exits, relativelymore quickly.
Why are flowcharts subject to misinterpretation while listsare not? Lists are verbally explicit. The commands fortraversing a particular list algorithm are the commands for how tofollow the list generally. Flowcharts are verbally inexplicit,substituting arrows for written directions. This may confuse
54
readers who expect to be told rather than shown what to do.*
A final aspect of the data in Figures 12 and 13 concerns thenature of the logical structure tested in the short condition:How do prose and algorithms compare for the easiest logic, asrepresented in the all-affirmative "and" strings?
First, the prose strings in the unpracticed condition werefound to be highly accurate and nearly equivalent on the whole toalgorithms (with the exception of the flowChart-first condition).It appears that when the logic is at the simplest levels,flowcharts do not save the user any errors.
The results for response time are somewhat more complicated.We will use the last, most practiced trial in each block as thepoint of comparison. This trial had the exit position at thefourth and last category. The critical comparison is betweenprose and flowcharts (lists were considerably slower thanlate-exit prose "and" strings in the main condition). On the lasttrial we find that prose is consistently between 0.5 and 1.0seconds faster than flowcharts. Thus it appears that when thelogic is straightforward and full processing is necessary, proseworks quickest.
This result is consistent with our hypothesis that theflowchart may slow the reader down if rule extraction is easy. Itdoes this by making extra physical demands: requiring separateconsideration of individual categories, extra encoding operations(the "yesses" and "noes"), and longer eye movements betweencategories. The only circumstances in which we would expect thealgorithm to save time for simple logic is when the structure tobe formatted has a high partial-processing potential.
Conclusion. The unpracticed condition showed that subjects'format-specific expectations 'nd experience interact powerfullywith the performance demands of each format isolated in a taskanalysis. The analysis that predicts a performance advantage foralgorithms considers an ideal user. For real users, algorithmsdid not fate so well next to prose when presented "cold." Onfirst- and second-exposures, algorithms took several times as longas prose and were no more accurate. They also took several timesas long as the algorithms for corresponding structures in the maincondition, where practice preceded measured performance.
*There is a further, ad hoc factor which may add to theexplanation. The flowcharts in this experiment may have been lessthan optimally presented because the computer display constraintsprohibited our expanding the layout or using tips on arrows. Bothchanges would have perhaps clarified directional links betweenboxes.
6555

On the other hand, prose presented cold gave no problems.Prose was almost equally fast and accurate across trials in theunpracticed condition. Furthermore, the scores on those trialswere representative of the post-practice scores on similarstructures.
We can infer that algorithms are unexpected or unfamilar,creating initial delay and strong warm-up effects. Proseinstructions, on the other hand, are expected and familiar, andneeded little warm-up for users to reach optimal levels ofaccuracy and speed. We can also infer that the effect of thenovel formats is early and temporary, reduced ay experience overtrials.
Flowchart algorithms were lot just unfamiliar. They alsoappeared to be inscrutablL to subjects at first glance.Flowcharts were systematically misinterpreted when they werepresented first. The procedure for lists, on the other hand, wasmuch easier to figure out acid lists were highly accurate from thebeginning.
For the designer who is considering algorithm formats, theresults of the short condition suggest several caveats. First,the typical reader presented with flowcharts may need briefdirections on how to use them. Second, the reader presented witheither lists or flowcharts may need some sort of introductorystatement to prepare the reader for a novel format. (This mayhelp reduce the reader's initial surprise and delay.) Third, forthe easiest logic (affirmative nand" strings) algorithms in eitherlist or flowchart form probably won't help performance. On thecontrary, they may slow it down; this will depend on the length of vibthe conditional clause and the likelihood of early exits.
3. Preference Data
Our final question concerned how well readers would like each.format. At the end of the experiment, we asked sub jPrts to rankthe three formats in order of preference. As shown in Table 6,the preference for algorithms was overwhelming. Flowcharts wereranked first two and a half times as often as lists; and lists,three times as often as prose. Thus preference followed measureddifficulty.
56

Table 6. Distribution of Formats by Subjects' Preference Rankings.
RANKFORMAT
ORDER Flowchart List Prose Total
1 35 14 5 54
2 16 35 3 54
3 3 5 46 54
What independent variables or subject characteristicscorrelate with order of preferred formats? First, consider somepotentially influential variables: For subject characteristics,some likely correlates of preference are sex of subject, degree ofexpwrience with programming or logic, and level of education.
For experimental variables, likely correlates are the orderof presentation of the three formats and the difficulty of thethree organizational types (the between-subjects factor).Conceivably, Subjects receiving the harder structures would tendmore than other subjects to prefer algorithms over prose.
To look at the relationship between these variables andformat preference, we constructed tables showing the distributionof each variable by first-ranked format. Because the datadisplayed in each table were reasonably clear, we did not performstatistical tests of the relationships. In brief, the levels of agiven variable appeared nearly equivalent in their distributionswith respect to highest-ranked format. Thus, the five variablesdeem to have little to do with format preference.* Indeed, thetact that neithet easy vs. hard prose nor order of formatpresentation affected format preference, attests to the durabilityof the obtained ordering.
*Although our attempt to tap prior experience with algoritwith complex logic failed to reveal a reliable relationshippreference, there were problems with our probe questions ("Haveyou had a programming of logic course?"): (1) We conflatedexperience in using 6iagrams (which should favor flowcharts) withpractice in truth-functional logic (which should help prose). (2)We did not specify the kind and amount of this experience. Moreappropriately _probed, this kind of experience may demonstratelinks to format preferences.
57 6 ;

The only apparently significant factor in first formatpreference was a final variable: the nature of subjects' academicor professional field (for students and AIR employeesrespectively). This factor distinguished flowchart from listpreferences particularly. The distribution of subject's field byfirst format preference is shown in Table 7.
Table 7. First Format Preference by Nature of Subject's Academic orProfessional Field.
FIRST-RANKED FORMAT
FIELD Flowchart List Prose
Liberal Arts/Ed. 9 8 1
Sciences 17 3 4
Public 9 3
KEY Liberal Arts/Ed.: English, French, music, art, education
Sciences: linguistics, economics, psychology, politicalscience, mathematics, sociology
Public: law, public administration, internationalrelations, business
The table also shows how specific fields were classified intothree general areas: liberal arts (e.g. English, music), science(e.g., economics, linguistics, math), and public areas (e.g., law,business). It is clear that most people in science fieldspreferred flowcharts to lists, while people in liberal arts andeducation were split between preferring lists and preferrngflowcharts. The difference makes sense if we consider thethinking style typical of people in sciences vs. liberal arts:the former tend to have a spatial/math orientation, the latter averbal orientation.
Conclusion
There are two important limitations on conclusions drawn fromthe preference data. First, if attitudes had been queried at thebeginning of the experiment, before subjects had experienced howalgorithms helped performance in the long run, subjects might have
58

preferred prose. Second, the laboratory context may have createdacceptable formats artificially. That possibility suggests aproblem with using experimental performance data as the basis forformat recommendations. More realistically, some algorithmadvocates (e.g., Wason & Johnson-Laird, 1972) have warned thatreade,-3 in everyday contexts may initially balk at the algorithmdespite its being cognitively simpler. This may be becausealgorithms are new or formidable looking. Or it may be becausethey deny the context, choice, and rationale that some readersdesire.
Considering these limitations, our data allow thisconclusion: when readers realize how algorithms facilitatelogically difficult decision-making, they like algorithms betterthan prose. When given algorithms, teaders prefer flowcharts tolists.
6059

V. SUMMARY AND CONCLUSION
Conditional instructions were easier as algorithms than asprose when subjects were prepared for algorithms by practice withfeedback. In general, the algorithm helped performance when thecondition in the instruction was logically complex. The morecomplex the condition, the more algorithms helped. We explainedthis result in terms of a processing model in which performancewith algorithms stays relatively constant across changes inlogical structure, while prose performance declines as the logicbecomes more difficult.
Prose
The components of logical difficulty inLfhe proseinstructions included disjunction ("or"), negation (simple andcompound), and hierarchical grouping of categories. Proseperformance declined as the organization of categories in thecondition went from linear to simple groupings and from simplegroupings to grouping through compound negation. Similarly,within organizational types, performance declined from "and"connectives to "or" connectives. The inherent difficulty of "or"was exacerbated by commas in an implicit "or" series. Negation ofsingle categories seemed to cause somewhat slighter decrementsthan the other variables.
The decrements appearrl in both speed and accuracy. Thedifference between the ea3t:!st and the hardest prose structures(averaged over foLr and six categories) was between five and sixseconds in respoise time and about 33% in errors.
Algorithms
By contrast, algorithms were highly accurate, and their speedvaried little, across organizational types, across "and" and "or"structures, and across affirmative and negative structures.Except for a slight increase in difficulty created by branchingflowcharts (representing hierarchical organization), algorithmsvirtually eliminated the logical processing asymmetries in prose.
Predictably, the maximum improvement with algorithms was atthe hardest level of prose. The flowchart gained a six-secondsavings in time, and a 33% savings in errors for ti."' mostdifficult prose structures (collapsing over length). For otherdifficult structures, the savings were a little over four secondsand 12% for the average grouping, two seconds and 12% for the "or"
strings. There were no appreciable savings for "and" strings.
61 7()

Reinforcing the advantage of algorithms in performance, anoverwhelming majority of subjects indicated at the end of thestudy that they liked algorithms better than prose.
The overall superiority of algorithiAs was qualified, however,by three complications revealed in the performance data:
The difference between flowcharts and lists,which changed the speed relationships betweenprose and algorithms.
The effect of partial processing, which alsochanged the speed relationships.
The effect of first exposure to the instructions,which drastically reversed the algorithmadvantage iniJoth speed and accuracy.
Let us briefly review each of these complications.
Flowcharts vs. lists. Both forms of algorithms were equallyaccurate. Lists, however, were consistently slower thanflowcharts, by about three-quarters of a second for each relevantcategory in the condition. This means that for six-categorylate-exit conditions, the difference in response time between thetwo formats was about 4.5 seconds.
We explained this difference using a model of the physicaltask entailed by each format. Li this model, lists require extraencoding, scanning, and matching operations to follow the "go to"commands. Flowcharts eliminate these operations by marking theroute visually with arrows and by repeating sequences ofcontingent questions and placing them near each other.
Because lists are slow, averaging lists and flowchartsnarrows the difference in speed between algorithms and prose forthe difficult structures. For the easier; string structures,lists were actually slower than prose for both "and" and "or"connectives.
Supporting the performance data, we found that subjectspreferred flowcharts to lists by a ratio of about five to two.
Partial processing. The second significant complicationconceiTijathe exit position variable, which governs the partialprocessing potential of the instructions. The data we havesummarized to this point were collapsed over exits. When weexamined the exit breakdowns, we found the response time relationsaltered between prose and algorithms. Specifically, while exitposition made no systematic difference for prose, it exerteddramatic effects on the speed of responding to algorithms:
627
Response time was a linear function of the exit position in theinstruction.
. These effects were explained in the model we developed of theprocessing task required in each format. To capture the exitdata, the model (1) assumed exhaustive processing for prose and(2) posited constant increments of response time for the list andthe flowchart, added for each reader-relevant category in thebasic instruction.
The implications for the prose-algorithm comparison areobvious. Exit position makes no difference for the relativeaccuracy of the formats. But for response time, the advantage ofalgorithms decreases the more there is to be processed in aninstruction (late exits); it increases the more irrelevant contentoccurs (early exits).
The consequences of this variation were most significant inthe case 6f the easy "and" strings. The collapsed data suggestedthat these strings should not benefit from flowchart translation,since flowcharts appeared to save neitlier errors nor time.However, flowcharts turned out to be distinctly better than prosewhen the exit was early--gaining 3.5 seconds in response time(averaged over four and six categories).
First exposure: The third source of complications in thedata was the degree of the subject's task-specific experience withalgorithms. That variable was operationalized as experience overthe course of the experiment and tested by practiced vs.unpracticed performance. The data summarized so far were based onperformance after practice. When we looked at unpracticedperformance, we found that algorithms were no longer faster andmore accurate than prose. Lists and flowcharts took from three tofive times as long as prose on the first and second trials of theunpracticed condition--subjects' first exposures to theinstructions. Latencies for both forms of the algorithm thendeclined dramatically over trials, while prose was uniformly fast(with a slight learning curve) from the beginning. Furthermore,subjects who saw flowcharts first in the short conditionsystematically misused them. Accuracy levels reached lows of f0%,while lists and prose were consistently above 80%.
Implications for the processing of formats are fairly clear.Prose is the expected and traditional mode of presentinginstructions and requires little explanation or warm-up. Listsand flowcharts, on the other hand, are unexpected and unfamiliarand require two or three practice readings before they can be usedefficiently. Moreover, while flowcharts elicit the bestperformance after rractice, they appear the least explicit intelling the user what to do. The list algorithm, more like prose,is much more transparent in directing the user.
63
72

* * * * * * * * * *
In conclusion, this study confirmed our basic expectationsabout the relative efficiency and effectiveness of prose andalgorithms. The results thus validate our task analyses andsupport the theoretical models developed for processing complexconditional instructions in prose and algorithm formats.
Recommendations
The results of this study translate into recommendations todocument designers about where in the set of conditionalinstructions to apply algorithms and under what circumstances.The recommendations below pertain to the structures used in thecurrent stimulus set.
In general, we would recommend using the flowchart algorithmto reduce the time and errors involved in complex conditionalinstructions. If the audience for the instructions consists ofaverage readers with non-technical backgrounds, then the flowchartshould be prefaced with brief directions on how to use it.Effective directions might be quite simple, for example: "You aregoing to see a set of boxes and arrows. Read the questions in theboxes and, depending on your answer, follow the arrow to the nextbox or the next command." (We did not test the effectiveness ofinstructions like this on unpracticed readers.)
The list algorithm is also a good way to simplifyinstructions, although it is somewhat slower than the flowchart.Because it is less confusing, the list needs less preface than theflowchart for the average reader. A simple preparatory statement(e.g., "You are going to see instructions in a new form.") mayhelp curb the surprise and delay that comes with first exposures.
More specifically, the place to use algorithms in a set ofcomplex conditional instructions is where the condition on theinstruction has a difficult structure. A difficult structure inour stimulus set means:
any grGuping of categories
any string with "ors"
any structure with compound negation ("notboth/and" and "neither/nor").
One the other hand, it is usually not necessary to use analgorithm if the structure is easy. Easy in our stimulus setmeans
73
64

"and" strings with all affirmative categories
"and" strings with two negated categories.
In one circumstance, however, algorithms can improve thespeed of responding to conditions with easy structures. This iswhen the condition does not require full processing. The partialprocessing potential of the condition depends on the structure ofthe condition and the distribution of truth value characteristicsin the audience (for reader-referenced instructions such as usedin this experiment). When information about the relevant truthcharacteristics is available, then designers can determine whetherearly exits are likely to occur and decide on that basis whetherto use algorithms to reduce response time.
Practical Considerations
These recommendations have stayed close to the experimentaldata. Looking toward real-world applications, we find a varietyof situational and stimulus factors that limit the generality ofour recommendations. Let us consider the more salient of thesefactors and how they might qualify our evaluation of algorithmformats.
The nature of the stimulus instructions. Given the domain oftruth-functional conditions on instructions, we have notconsidered how algorithms will affect conditions longer than thosewe investigated, or conditions with more internally involvedcategories--such as "if you are male and have a yearly incomegreater than one-third the amount of your annual housing costs,"rather than "if you are male and married." Nor have we consideredconditions in which the categories are external tests that requirephysica:1 actions--i.e., procedures. All these variables couldpotentially influence how algorithms work. We will focus on howour findings extend to longer instructions, since the lengthvariable allows some straightforward predictions.
For instructions longer than six categories, algorithmsshould have an even stronger advantage than found in this study,for two reasons: (1) When the condition or an instruction growslonger than six or seven categories, it is beyond the span ofworking memory. Prose processing should break down, as may bemanifested in errors, back-referencing, starting over, orresorting to outside aids. The processing of algorithms, on theother hand, should stay uniformly easy since algorithms placenegligible memory demands on the user. (2) Longer conditions
65 74

should profit more from the partial processing imposed by thealgorithm, given a high probability of early exits.*
The nature of the task. Two primary functions of practicalreading are learning and doing. The conclusions from this studyare probably limited to doing. If the task is, for example,learning a rule, algorithms probably preclude understanding andremembering. (The interaction of format with function 4.sdiscussed more fully in Holland, forthcoming.)
In what contexts is doing the primary function? It appearscentral in public documents such as forms. For example, abenefits applicant need not understand the structure and rationalebehind a sequence of contingent questions in order to answercorrectly and bring about a fair determination of eligibility.**Doing is also primary in one-shot instructions and procedures,intended for immediate performance rather than for transmissionand retention of information.
Variations in the visual and presentational form of eachformat. We discussed this issue earlier, noting that theconstraints of computer display in this study imposed a flowchartlayout which may have been unnecessarily confusing. Similarly,the display medium may have prevented the list format from beingused as efficiently as possible. Being able to point to and tracethe specified route with a finger, as on paper, might havemitigated the demands of visual leaps in the computerized list.
Though it is clear that visual layout and presentationalmedium affect performance generally, very little is knownspecifically about the effects of graphical and displaycharacteristics on processing, or about which characteristics arerelevant for deciding the optimal form of a given format.However, if we assume that the algorithm formats in thisexperiment were less than optimally presented, then we can inferthat better, less constrained presentations would not merelyenhance the algorithm advantage but might also reduce theprocedural ambiguity of the flowchart evident at first exposures.
--FUTIIike the flowchart, the list algorithm should increase inresponse time with increasing length, despite a fixed exitposition. This is because the list requires scanning from theexit question to the end of the entire set of questions to reachthe outcome commands.**However, for noncategorical questions (e.g., "Why do you wantthis job?" vs. "Are you male?"), indications are that readers needto understand the rationale to successfully complete the form(Holland & Redish, 1981).
66 ''',1,-
e.)

Functional criteria for evaluating differences amon formats.We have reported time and error differences without judging Eifeirpractical significance. How critical are effects of the magnitudeobserved here in deciding among alternative formats? This willdepend on the function and context of the instructions.
For example, we f-lund time savings of two to six secondsgained by flowcharts. such savings are frequently of littlepractical significance users and designers of instructions.Seconds may make a difference, however, for emergency proceduresunder time-limited conditions. Also, for forms with very largeaudiences, seconds translate into enormous amounts of time. Justconsider how many person-hours are saved if 20 million peoplecould save 10 seconds each when filling out the IRS Form 1040.
Savings in errors are more clearly important across contexts.Errc- savings ranged from 10% to 33% on the instructions for whichwe have recommended algorithms. Errors of this magnitude on formsand other public documents have been reported to have costlyconsequences for users and institutions (Redish, 1979; Battison,1980; Charrow, Holland, Peck & Shelton, 1980).
Effects on response time should become similarly decisiveacross contexts when they begin to approach magnitudes of aminute. Users experiencing such delays might be reluctant tocomplete an instruction or to approach other instructions, giventhat users' motivation to finish is not intrinsically high.Delays of up to 25 seconds occurred in our data at the point offirst exposures to algorithms.
Another functional criterion in evaluating performance datais design constraints. Final choices about what format to userequire weighing the expected gains in time and accuracy againstthe costs of designing and producing algorithms. Algorithmsusually need more space on the page and require more preparationtime. Not only does prose take up less space, but writing outinstructions in prose is generally just the first step inconstructing the algorithm.
Differences in attitudes and acceptance. As we observedearlier, people's attitudes toward novel formats may vary betweenexperimental and real-world settings, and among differentindividuals and populations of readers. Attitude in turn affectswhether readers will try out and continue to use novel formats, aswell as how quick and accurate readers will be. Our experimentalfinding that people prefer algorithms to prose may becontext-bound. The scant evidence on attitudes toward andacceptance of algorithms in non-experimental settings isequivocal.
:7 G67

Some observations suggest that even practiced algorithm usersmay prefer prose because it allows them to control the readingprocess and to understand the rule underlying the instruction(Wason & Johnson-Laird, 1972). It has also been observed thatwhen algorithms are applied to the automatic translation ofspecialized skills, the specialists sometimes resent it.Professionals may perceive such applications as an attempt toreduce and publicize what they consider complex and privilegedknowledge. (See the review of algorithms in medical and legalpractice in Holland, forthcoming.) Finally, some audiences,particularly those without education or experience in using chartsand graphs, seem to be afraid of technical-looking formats andsimply omit the instructions or avoid the document when suchoptions are possible (Holland, 1980; Charrow, Holland, Peck, &Shelton, 1980).
However, two studies of documents that were revised toinclude algorithms or aspects of algorithms (Kammann, 1975;Charrow, Holland, Peck & Shelton, 1980) found that the intendedaudience accepted, used, and preferred the revised material.These audiences included people without a technical background.
Field testing of new formats with target audiences may be theonly way to predict performance and utilization at this point inour knowledge.
Degree of experience and ability. The results of this studysuggest that flowchart procedures can be confusing, if notinscrutable, at first encounter. The novice needsassistance--practice with feedback or explicit instruction. Wesuggest that extremely short-term assistance can be effective.Most of our subjects, professionals or graduate and undergraduatecollege students, were puzzled only initially and grasped thecorrect procedure early on. We can assume that most were goodreaders and had had some experience with charts and graphs, andthat these factors contributed to their quick understanding. Itis worth noting, however, that a few individuals continued tomisuse the flowchart throughout the experiment. Their accuracylevels with flowcharts were only a little above chance and farbelow lists and prose. Only five of the 54 subjects fell intothis category, and nothing in the data we gathered on subjectss/stematically distinguished them. But we can infer that theremay be some populations in which readers will have a grtat deal ofdifficulty with the flowchart form of the algorithm.
We do not know what factors are critical to predicting theindividual's ability to follow graphical formats: How muchprevious education or experience and of what specificity areprerequisite to interpreting the symbols in flowcharts? Whatindividual differer -'es in spatial abilities or cognitive styleaffect the capacity to handle flowcharts or lists with ease?
68 °*7b

* * * * * * * * * *
Clearly there are a range of stimulus, audience, and taskvariables to consider in applying the recommendations of thisstudy to particular problems in presenting instructions. We havecovered only some of the relevant variables. Even if we couldspecify all the relevant influences in a particular case, we haveno theory which would allow us to predict from that specificationthe effectiveness of competing formats. The gaps in empirical andtheoretical knowledge suggest that when the designer consideringalgorithms is uncertain of the impact of contextual factors, thatdesigner would do well to pilot test algorithms in the intendedcontext. The pilot results could then be judged within the largercontext of the relative costs and gains of adopting innovativeformats.
7869

REFERENCES
Battison, R.B. Document design: Language planning for paperwork.Language Planning Newsletter (Honolulu, Hawaii), November, 1980.
Blaiwes, A. Formats for presenting procedural instructions.Journal of Applied Psycholou, 1974, 59, 683-697.
Braine, M.D.S. On the relation between the natural logic ofreasoning and standard logic. Psychological Review, 1978, 85,1-21.
Charrow, V.R., Holland, V.M., Peck. D.G., & Shelton, L.V.Revising a Medicaid recertification form: A case study in thedocument design process. Washington, D.C.: American Institutesfor Research, 1980.
Davies, I. K. Get immediate relief with an algorithm. psychologyToday, 1970, 3, 53.
Follettie, J.F. Numerical display research: Review anddiscussion. (Technical Report 2-78-01). Los Alamitos, Calif.:SWRL Educational Research and Development, 1978.
Follettie, J.F. Graph-using profiencies of upper elementaryschoolers. (Technical Report 63). Los Alamitos, Calif.: SWRLEducational Research and Development, 1979.
Gane, G. P., Horabin, I.S. & Lewis, B. N. The simplification andavoidance of instruction. Industrial Training International, I.No. 4, 160-6, 1966.
Holland, V.M. Revising a government document: The case of theMedicaid recertification form. Paper presented at the Symposiumon Writing and Designing Documents: Research and PracticalSolutions. Carnegie-Mellon University, October, 1980.
Holland, V.M. Algorithms for presenting instructions: A reviewof the literature. Washington, D.C.: American Institutes forResearch, forthcoming.
71.
Holland, V.M. & Redish, J.C. Strategies for understanding formsand other public documents. To be published in D. Tannen (Ed.),Proceedings of the Georgetown Round Table on Discourse: Textand Talk.
Holland, V.M. & Rose, A.M. Understanding instructions withcomplex conditions. (Technical Report No. 5). Washington,D.C.: American Institutes for Research, 1980.
Jones, S. Design of instruction. London: Her Majesty'sStationery Office, 1968.
Kammann, R. The comprehensibility of printed instructions and theflowchart alternative. Human'Factors, 1975, 17, 90-113.
Landa, L. Instructional regulation and control: Cybernetics,alprithmization, and heuristics in education. EnglewoodCliffs, N.J.: Educational Technology, 1976.
Osherson, D.N. Logic and models of logical thinking. In R.J.Flamagne (Ed.), Reasonin : Re resentation and rocessinchildren and adults. Hillsdale, N.J.: Erlbaum, 1975.
Quine, W.V.O. Methods of logic. New York, N.Y.: Holt, Rinehart,& Winston, 1972.
Redish, J.C. The Language of the Bureaucracy. (Technical ReportNo. 15). Washington, D.C.: American Institutes Apr Research,1980.
Rose, A.M. & Cox, A. Following instructions. (Technical report).Washington, D.C.: American Institutes for Research, 1980.
Wason, P.C. The drafting of rules. The New Law Journal, 1968,118, 548-549.
Wason, P.C. & Johnson-Laird, P.N. Psychology of reasoning:Structure and content. Cambridge, Mass.: Harvard UniversityPress, 1975.
Wheatley, P. & Unwin, D. The alqcrithm writer's guide. London:Longman's, 1972.
72 Oil
N_

Wright, P. Decision-making as a factor in the ease of usingnumerical tables. Ergonomics, 1977, 20, 91-96.
Wright, P. & Reid, F. Written Liformation: Some alternatives toprose for expressing the outcomes of complex contingencies.Journal of Applied Psychology, 1973, 57, 160-166.
8j73
Appendix A
ANOVA Tables for Each
of the Three_ TIpes of Organization
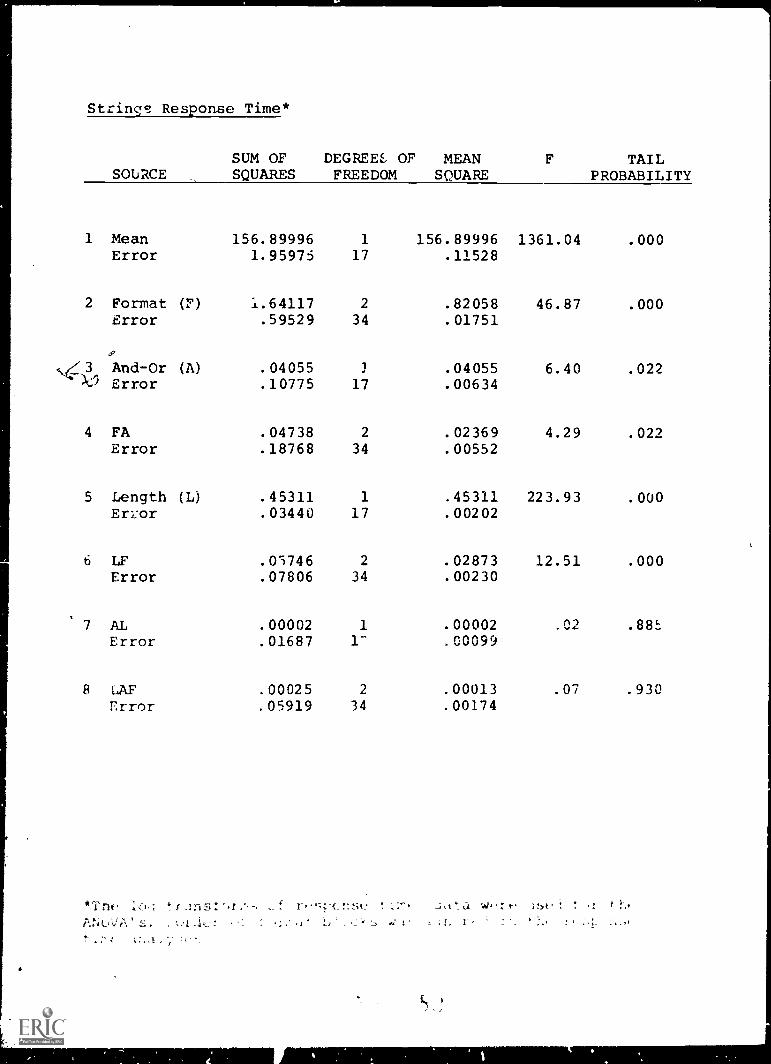
Stings Response Time*
SOLRCESUM OFSQUARES
DEGREES OFFREEDOM
MEANSQUARE
F TAILPROBABILITY
1 Mean 156.89996 1 156.89996 1361.04 .000Error 1.95975 17 .11528
2 Format (F) 1.64117 2 .82058 46.87 .000Error .59529 34 .01751
,
And-Or (A) .04055 3 .04055 6.40 .022Error .10775 17 .00634
4 FA .04738 2 .02369 4.29 .022E rror .18768 34 .00552
5 be ngth (L) .45311 1 .45311 223.93 .000Er- or .03440 17 .00202
LF .0S746 2 .02873 12.51 .000Erro r .07806 34 .00230
AL .00002 1 .00002 .02 .88:Error .01687 1- .00099
8 LAF .00025 2 .00013 .07 .930Error .05919 34 .00174
*Tric fANOVA'

p
Strings Number Correct
SOURCESUM OFSQUARES
DEGREES OFFREEDOM
MEANSQUARE
F TAILPROBABILITY
1 Mean 7004.16699 1 7004.16699 2980.50 .000
Order (0) .25000 2 .11500 .05 .948
Error 35.24998 15 2.35000
2 Format (F) 7.19444 2 3.59722 4.25 .024
FO 5.22222 4 1.30555 1.54 .216
Error 25.41666 30 .84722
3 And-Or (A) .66667 1 .66667 2.08 170AO 2.19445 2 1.09722 3.42 .060
Error 4.80556 15 .32037
4 FA 3.52778 2 1.76389 5.65 .008
FAO 4.94444 4 1.23611 3.9t, .011
Error 9.36111 30 .31204
5 Length (L) .00000 1 .00000 .00 1.000LO .02778 2 .01389 .08 .924
Error 2 63889 15 .17593
6 LF .J8333 2 .04167 .29 .753
LFO .38889 4 .09722 .67 .619
Error 4.36111 30 .14537
7 AL .16667 1 .16667 2.57 .130
ALO .19?44 2 .09722 1.50 .255
Error .97222 15 .06481
8 LAF .08333 2 .04167 .17 .848
LAFO .55556 4 .13889 .5S .098
Error 7.52778 30 .25093

Simple Groupings Response Time
SOURCESUM OFSQUARES
DEGREES OFFREEDOM
MEANSQUARE
F TAILPROBABILITY
1 Mean 173.75748 1 173.75748 1312.02 .000Error 2.25140 17 .13244
2 Format (F) 2.16048 2 1.08024 46.79 .000Error .78496 34 .02309
3 And-Or (A) .03689 1 .03689 16.43 .001Error .03817 17 .00225
4 FA .0c490 2 .n9745 16.54 .000Error .05641 ,,
-: .00166
5 Length (L) .67835 1 .67835 221.35 .000Error .05210 17 .00306
6 LF .00864 2 .00432 1.97 .155Error .07446 34 .00219
7 AL .00554 1 .00554 5.21 .036Error .01808 17 .00106
8 LAF .00891 2 .00446 2.36 .110Error .06431 34 .00189

Simple Groupings Number Correct
SOURCESUM OFSQUARES
DEGREES OFFREEDOM
MEANSQUARE
F TAILPROBABILITY
1 Mean 7015.55859 1 7015.55859 5951.93 .000Order (0) .84259 2 .42130 .36 .705Error 17.68056 15 1.17870
2 Format (F) 15.59258 2 7.79629 7.06 .003FO 5.46296 4 1.36574 1.24 .316Error 33.11108 30 1.10370
3 And-Or (A) 1.04167 1 1.04167 4.06 .062AO 1.19444 2 .59722 2.33 .132Error 3.84722 15 .25648
4 FA 4.33333 2 2.16667 6.03 .006FAO 2.05556 4 .51389 1.43 .248Error 10.77777 30 .35926
5 Length (L) .56019 1 .56019 3.34 .087LO .34259 2 .17130 1.02 .384Errol 2.51389 15 .16759
6 LF .59259 2 .29630 1.58 .222LFO 1.62963 4 .40741 2.18 .096Error 5.61111 30 .18704
7 AL .37500 1 .37500 1.53 .235
ALO .02778 2 .01389 .06 .945Error 3.68056 15 .24537
8 LAF .33333 2 .16667 .66 .526
LAFO .22222 4 .05556 .22 .926Error 7.61112 30 .25370

"Not" Groupings Response Time
SOURCESUM OFSQUARES
DEGRRES OFFREEDOM
MEANSQUARE
F TAILPROBABILITY
1 Mean 188.76895 1 188.76895 1792.42 .000Error 1.79035 17 .10531
2 Format (F) 3.20946 2 1.60473 29.75 .000Error 1.83381 34 .05394
3 And-Or (A) .00684 1 .00684 4.87 .041Error .02387 17 .00140
4 FA .09984 2 .04992 15.26 .000Error .11120 34 .00.327
5 Length (L) 1.40284 1 1.40284 387.43Error .06155 17 .00362
6 LF .12458 2 .01229 4.62 .017Error .09042 34 .00266
7 AL .00035 1 .00035 .14 .709Error .04127 17 .00243
8 LAF .06597 2 .03298 12.69 .000Error .08835 34 .00260
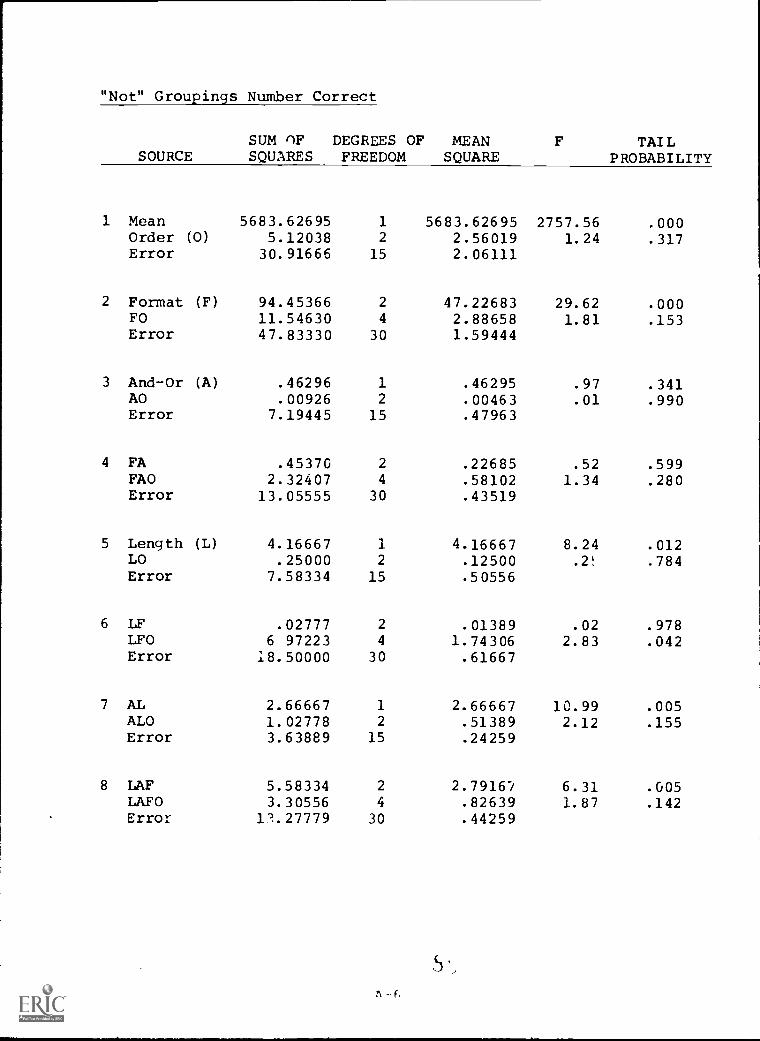
"Not" Groupings Number Correct
SOURCESUM OFSQUARES
DEGREES OFFREEDOM
MEANSQUARE
F TAILPROBABILITY
1 Mean 5683.62695 1 5683.62695 2757.56 .000Order (0) 5.12038 2 2.56019 1.24 .317Error 30.91666 15 2.06111
2 Format (F) 94.45366 2 47.22683 29.62 .000FO 11.54630 4 2.88658 1.81 .153Error 47.83330 30 1.59444
3 And-Or (A) .46296 1 .46295 .97 .341AO .00926 2 .00463 .01 .990Error 7.19445 15 .47963
4 FA .45370 2 .22685 .52 .599FAO 2.32407 4 .58102 1.34 .280Error 13.05555 30 .43519
5 Length (L) 4.16667 1 4.16667 8.24 .012LO .25000 2 .12500 .2! .784Error 7.58334 15 .50556
6 LF .02777 2 .01389 .02 .978LFO 6 97223 4 1.74306 2.83 .042Error 18.50000 30 .61667
7 AL 2.66667 1 2.66667 10.99 .005ALO 1.02778 2 .51389 2.12 .155Error 3.63889 15 .24259
8 LAF 5.58334 2 2.7916"/ 6.31 .005LAFO 3.30556 4 .82639 1.87 .142Error 13.27779 30 .44259
A -4,

Appendix B
Summary of Mean Response Times (Sec.)
S:i

7.6
..5
=..
ORGANIZATIONAL TYPES
Strings Simple Groupings "Not" Groupings
..._ur P (c1) L F P (d) L F Lu P (d) ' L F
4AET 4 6.639 9 578 5 356 2 10 361 7.511 3 994 4 7.817 9 611 6.667
4AEF 1 7 344 4 494 3 867 2 10.894 6.900 5.417 1 12 244 5.022 3.328
4AMT 4 6.833 9 828 5 528 3 10.350 8.522 4.911 4 8 700 9.761 6 250
4AMF 3 7.028 7 444 5.483 3 9 578 8.017 4 311 3 11 622 9.200 5.778
4ALT 4 6.844 8 489 6 594 4 9 094 10.344 6.200 4 8.044 9.90F 5 978
4ALF 4 6 689 9 350 6 200 4 10.367 10.750 6.444 4 11 078 9 678 6.611
40ET 1 7.683 4 533 3 561 2 9 094 6.428 4.528 1 11 767 4 922 3.978
40 E F 4 10.050 9.583 5.367 2 9.522 6 ')2E 4 156 4 12 989 9.233 5.722
40MT 3 6 428 9 006 5.528 3 1 850 7.839 5.606 3 12.922 7.856 5.639
40MF 4 7 522 9 844 6 011 3 8.522 8.122 5.822 4 12 106 10.000 5.789
4OLT 4 19 450 9 433 5 672 4 8.439 11.128 7 083 1 11.717 4.489 4.0221
40L1- 4 7.922 9.361 6.544 4I 8.928 10.08s_
6.728 4 16.000 10.194 5.233
6AET 6 7 128 11.928 8.283 2 14.828 7.039 4.456 4 14.389 10.550 8 217
6AEF 1 8 172 5.217 3.600 4 12.344 10.628 7.206 2 18 328 7.683 5.600
6AMT 6 7.189 13 372 7.456 4 11.744 11.194 8.500 4 14.144 10.550 10.033
6AMF 4 8.128 9 933 6 322 4 15.372 11 328 6.789 4 14.633 11.989 9.444
6ALT 6 6.972 13.772 8 228 6 15.483 15.672 11.511 6 15.656 15.778 11.817
6ALF 6 7 872 13.000 7.611 2 11 311 9.350 6.423 6 14 567 15.850 10.450
60ET 1 8.061 6 561 4.161 4 9.656 10.417 7 256 2 16.167 8.667 6.600
60E7 6 9.383 13.400 7 639 2 15.544 6.200 4.100 4 13.817 11.067 7.606
60MT 4 8 683 9.622 5.42_ 4 9 561 10.917 6 928 3 14.744 9.183 7.022
60MF 6 9 333 12 400 7.600 4 13.733 11.406 8 150 4 14 806 11.661 8.756
6OLT 6 10 083 14 078 7 967 2 12 350 7 922 5.806 6 13.850 17.400 10.089
6OLF 6 8.878 13 956 7.411 6 11 667 14 817 9 422 6 17.739 14.667 11.956
KEY
(a) n = 18 for all entries(b) structures identified by variables in this order
number of categories (4 vs 6)connective (A vs 0 for and vs or)exit level (E-M-L for early-middle-late)truth value (T, F)
(c) exit position is the exact number of categories minimally necessary for a decision(d) P prose, L list, F = flowchart
APPENDIX B. Summary of Mean Response Times (Sec 1(a)
p - 1
:111