ed 129 125 he 007
TRANSCRIPT

ED 129 125
AUTHORTITLE
INSTITUTIONPUB DATILNOTEAVAILA3L2 rFom
DOCUMENT RESUME
HE 007 856
Rosenblatt, Aaron; And OthThe Adelphi Ex -rime?nt: cce1erating Social --rkEducation.Council on Social Work -'ucation, New York, N.Y.76198p.Council on Social Work Education, 345 East 46thStreet, New York, New York 10017 ($4.50)
EDRS _PRICE MF-$0.83 Plus Postage. HO Not Available from EDRS.DESCRIPTORS Academic Achievement; *Advanced Placement Programs;
*Field Experience Programs; Graduate Students;Graduate Surveys; *Higher Education; *MastersDegrees; PrOfessional Education; *Social Welfare;*Social Work; Social Workers; Student Adjustment;Student EvalUation; Summer Programs
TDENTIFTERS *Adelphi University
ABSTRACTeducational program adopted at Adelphi University
School of Social Work provides students interested in obtaining themaster's degree in social work with an opportunity to accelerateheir professional education. As undergraduate students they can
elect to major in social welfare, and if they do, some coursesusually available only to graduate students will be open to them.They can also earn credits for their field work experience. Once theyreceive their baccalaureate degree, a number of them are admitted tothe accelerated graduate program, whiCh initially consists ofenrollment in a summer session at the school of social work:. At thecompletion of this program the students enter the school assecond-year students. The accelerated students were found to catch upto the traditional students after the summer experience. Reports areincluded in this evaluation of changes in students° knowledge, valuesand skill; their educational background and practice skill one yearafter gradilation; coping with their feelings of inferiority; andsocial constraints affecting the interpretation of the findings inevaluative studies. (LEH)
Docum ents acquired by ERIC include many infOrmal unpublished* materials not available from other sources. ERIC makes every effort ** to obtain the best copy available. Nevertheless, items of marginal *
* reproducibility are often encountered and this affects the quality *
* of the microfiche and hardcopy reproductions ERIC makes availablevia the ERIC Document Reproduction Service (EDRS) . EDRS is not
* responsible for the quality of the original document. Reproduction* supplied by EDRS are .the best that can be made from the original.* *******************************************************************

!, PAWYYV OT Al,THI t_)",, A FiC),4 AF( F AWE&,17,0A.Ai NNY:TUTU OF
F.OUt FION
_

THE
ADELPHI
EXPERIMENT:ccelerating Social Work Education
b y
A aron Rosenblatt,MunaPlne Welter,
Sophie WoieuTb(wski
PHILNIFI) IN CoolliR FioN \V1THHi A Ijimpli II r SITY Sf li()Ot Of 'SOCIAL WORK
COUNCIL ON SOCIAL WORK EDUCATION
New York
1110 I I -,;( 'I\ Vt)R. It
i lit l I
I IRK ; )1 ( ;Kt s 1,1 ; ( 17,O
111 1111,011M,V1111111 aft_ A ile,,A2111 Ole !brow., and
de, flirt 11,4,,,,Arth pArk.,:( OAA_A o;;;r0 piN,1110.111 ii !.}1 I n1 iirriiti WorkI ,Ititotnnt .1fitil Ott, tikstk,. 1,,Ncncori IcnuIi1 lXc in[erred
IndrGricd
JNCIL ON SOCI4 WORK EDUCATION345 bAS1 46111 STRIEJ:T, NEW YORK, N.Y. INC
44

Forewordhe ociaI woik lessioll. like JI1V dVIL.11111C profession, responds to
human need 1-rom its tom) partieular frame of reference. Porhaps socialwork. unlike many other professions. has not bad the opphrturntv tostuds, planind develop curricuta responses, whether these be al lhedirect ei \ CL ir :it 111c pohcv level. Part 01 this probably has to doma only with the profession s historical stance as action-oriented bur also101 t 1()),N law\ ii soeiety (research requires money). Part. certainly.has been its relative infancy (like all social sciences) insofar as researchdint des, elopment are not a comlortahle part of the professional arillamen-((mum.
Hie experiment that Is reported liii tt this i,lunie represenr. an excep-tion to the conditions discussed above. With the assistance or the NanonalInstitute ii Meinal Health. durine those more prosperous days of the mid-dle I k )(Ilk, we iti .llelphi undertook al .experimetrit anit gathered objectiVedata about a central issue in social work education, namely the practicalityand Icisibility iii alr acceleration between the graduMe atnd undergraduateles els id education. Subsequent to the beginning ol this project, the term
intinnum has been applied to such arrangements.ss e define colninuum as the oil-,t,Nmig linkagc between under-
graduate arnIgrathiare education. assuming that these have a mutual tn-pact upon each other. Although the program reported here 'involveseducation 'al MO lie hachelors and the master"s levels, subnsequent cx-penences 'have convinced LIti that similar relatomships aRo exist belweetathe ma 2T'S iiiil doLstoril levels. We hope 111 it sit-,itfar eN )2.f11110111
he 1,111(IL:riaken %%11h trespecil to these Iwo levek and event with respectto the rhread it relatyonship that may exist among ati levels of social workeducatiton. I he coutinuom needs inueb more experimentation. It wouldhe gratuitous Ito say that the report presented in this volume is only thebeginning We hope that one yank: of thus work (aside from the intrinsicy.rlue of the tintlingsi will he to Qncourage simil ii nd more relined re-search.
I he historv ot the growth ol this proreLl was simple and hiit ii I he WI-dergmduate pro'. %on in social work \k;Iti already 24 Years old when it
tit

he rule par( olificicsponsilmlo 01 School )1 Social Work at Adelphi1Thiversit in I 962. Lin il then, although lodged in (he Sociology Depart-mom under die jurisdiction of a social worker, it had been remote fromthe gradude program. In 1959 the two programs had hegun to move closer
icr yhen the dean ot the (iraduate School of Social Work began toi c3lilSltllllIon in response to a request from the sociology I acuity.
'A hen, the undergraduate grogram was incorporated as a part of theschool program in I qr)2, the name of die school 11as changed from the(iradaate "School of Social Work to, Me School ot. Social Work. In the twoor h.T01.: ensuing 1e:Jirs the faculty ()I' the school were given the directresnonsibiln rot conducting an uniaergroduate program in,juxtaposition tothe grai)uute program, and began HT rectIgnite Snell questions as: "'Shouldpreparati(m forprolessional practice at the undergraduate level include thesome 'heavy we(ghling in 'methods as at the graduate level (e.g., how
Methods:ci urse. how much Ilicklw nrk Y.' What should be the job en-try l'evel 01 the grAduate of the undergraduate program? Is the schoolwxterMg down; prof essionat education? Is the school creating ,competitionbetween holders of the bachelors degree and holders of the master'sdegree in socilal work? Should undergraduate fieldwork require MSWsupervision? If the undergraduate program is indeed a professional pro-
o in itself, shoutd it be dominatedbv the professi(mal goals of the grad-uate school'!''''
Today o central question lingers: If iire preparing undergraduatestudents for professional practice% how does this differ from the wa),:' inwhteh e ape preparing graduate students?" Our observations of the agen-eics that employed our undergraduate students and the skills that the stu-dents were using suggested that their performance was similar to that ofgraduate qudents. The undograduates were using skills, for the mostpart, that tine faculty were teaching in the first graduate year. Admittedly itwas difficult to differentiate id which level which skills were being used.This, as the social work iAorlid knows, remains an unanswered question, al-though we heilieve that considerable light has been shed (in this during the
live years,We then wondered if the faculty could teach at the undergraduate level
e-!.isentiaily the same content that they were (caching in the first graduate:,;'tr It soi, social workers would be able to obtain the sante skills in a
period ol Itimc by combining undergraduate and graduate pro-g,ams, mu) a hinr-orre arrangement (four undergraduate years and one,gr;ik:ill,AtQ year).
liklicr models were being considered at that time. One of these was theprogram; wherehy undergraduates would be admitted to the graduateschoot after their junior VV:IT. This was identified in the professionalliterature as the "three-two model, just as Adelphi's was the "four-onemodel. It should be made dear that h, t2 recognized that offering the first
iv

graduate )ear (hi: unOeigraduate c el Wit.; not the most cleat L. ap-
prodelv iii do,elopinvt undorgraduate education in social work, anec IttimItti tht2 possthiltticis tor experimentinv v ith the tinderirraduaiic cur-riculum, Hut it was not ()UT Intention to do anything but test the efficacy ofreducine Me total educational time from six to fivc vears. That was the Qx-Ictlt ol our interest and the scope ol our expel-1111CM.
Fatty aware of the seriousness or manipulating the professional cur-riculum, and conscious of our responsibilities to the profession, we under-took to insure control bv objective evaluation of the entire expermlent.Massis.e amounts of time, energy, and federal money wore poured into theealuation process. o the extent possible, we remained in communica-tMn with San Diego State University and the University of Wiscon-sin-Madisonschools where similar experiments were being conducted.
With the publication of the Adelphi study, which extended over a six-year period from 1968 to 1974, and the San Diego and Wisconsin studies,which were pubhshed in 1972 and 1973,1 the lick! now will have thebenefit of extensive and well-documented research in which a total ofabout 351; undergraduate and graduate students participated,: Also, anumber of (cdlow-up studies have been completed, or are in the process ofbeing completed at various schools such as Fordham University, Virginia(ommonwealth University, and the Catholic University of America.'
The accelerated (four-one) program was institutionalized at the AdelphiSchool of Soctal Work in 1972. Since then we have made several changes.The summer internship was considered unnecessary and is no longer re-quired. Modifications in the research requirements at the undergraduate
as well as requirements with respect to ethnic content, have beenmade. In short, we have seen the value of continuing to make changesafter the formal evaluation was completed and the results made availableto the school. We would hope that this process of introducing change willcontinue in the luture.
We believe that we have brought together the best possible professionalfaculty we could obtain to conduct the experiment. Sophie Wojciechowski,chairman of the Adelphi undergraduate social welfare program, has hadmany years of experience in administering undergraduate programs. She isas knowledgeable about undergraduate social work education as anyone inthe country. Marianne Welter, the ,lroject director, and Aaron Rosenblatt,
1 Roil Weinberger. I he t ndergratluale Continuum Protea A 1:inal Report.mimeographed (San Diego: School of Social Work. San Diego State University. 1972): and\ tired Kado,hin and George kelling. tninai Report: An Innostame Program in SncialWork [dot:anon. the 3-2 Program, numeivaphed Marlimm. WIN ini er-dt% 1 WIsetin-s.in School of Social Work, N73).
2 Adelpht-12I Matteotti-98 students. iind San Diego-130 %Indents.3 See Sophie Wojciechowski, -Rethinking the Structure and Quality of Ciroduate and Un-
dergraduate Social Work Education (Paper presented at the Columbia university School ofSocial Work Alumni Conference. November 1, 1975).

the research consultant, have long-establkhed kills in teaching, cur-riculurn management, and research. We nlaintained a I se Ongoing com-munication with Milton Wittman of the National Ins i ute of Mentalllealth, who was able to sustain us both psychologically and fiscally towardthe completion of the project and the preparation and publication of thisvolume. We view this not only as a successful experiment in curriculumbuilding, but as a good example 01 cooperation between education, prac-tice, and government in the expansion or knowledge.
After the experiment was completed, a new controversv arose in socialwork education with the publication of the Council on Social Work liduca-tion's report of the 'Eask Force on Structure and Quality in Social WorkEducation.'This report has led to exacerbation or differences concerningthe social work curriculum. We believe the findings of the Adelphi experi-ment have direct bearing upon the task force report. Although these find-ings do not support the recommendations of the task force in loto, we dobelieve that they support the efficacy, validity, and feasibility of the con-tinuurn in social work education defined as the mutual dependence uponthe various levek of education for their mutual benefit. Simply put: irsocial work education is viewed on a continuum that recognizes and usesthe interface between the various levelS or education as a launching pointfor the improvement of the levels individually and together, it is desirable.Although it was designed to provide specific answers about the validity orthe continuum, the Adelphi experiment nonetheless throws light upon
StiOt'iS about it.)ur colleagues in the academie corridors ol social work, let me end
these observations with what to me is one of the most rewarding outcomesof the experiment. Throughout the entire project, the cooperatim par-ticipation, and supportive interest of the entire faculty of the School ofSocial Work was superb. Also, 121 students in both the experimental andtraditional groups participated. Their cooperation through taking exten-sive tests and responding to follow-up questionnaires made this projectvalid. The vitality with which the experiment was carried out was possible
he faculty was interested, supportive, and encouraging.
vi
Jost NI L. Vicin ANITDoan
Scluml ol Social WorkAdolph! Univers/fa'
4. Remo/ 0/ the task [Me OH S1111(.1111 WO Qua/ui ii Siu u/i It of noSociot Wnr, Lducatiun, Tribcr i974),
8

Acknowledgements200 persons made substantial contributions to this project. The
in.ijorit!.- of theni are members of the Ade lphi community. First of all weacknowledge the xntribution ot the undergraduate and graduate students.
-mated many hours of their time during the before and after phasescollection. They were generous in .their cooperation at a difficult
lime. We are also pleased to acknowledge our indebtedness to theiry.irious fieldwork supervisors, They agreed to attend several trainingmeetings on campus and, in addiion, they carefully followed instructionsin completing the lengthy form that was used to assess the students' field-work skills.
Three secretaries helped us during the life of the projectEvelynGeddes. Mary Lumb, and Helen Slavin. The latter made a major contribu-tion both as secretary and statistical assistant. The completion of this studywould not hitve been possible for many years without the availability andcoopenition of the Computer Center at Adelphi. The Staff processed zimass of data for us with precision and good humor even at times whennone of us felt like smiling.
We want to express deep appreciataon to ail members of the faculty atthe Adelphi University School of Social Work, They agreed to take part inthis educational experiment and that meant adding another demand totheir heavily committed academic schedules. Some of them helped selectthe research instruments used in the study and some served as consultantson many occasions. Gunter Geis, Ruth Kantrow, and Gideon Horowitzread an earlier version of the final report and gave us the benefit of theircomments.
Also, special appreciation is expressed to two key members or theAdelphi community: Joseph L. Vigilante, dean of the School of SocialWork. Lind Beulah Rothman, associate dean, Their wholehearted supportwas unwavering during the length of the project. Without their assistancethe study would never have achived certain of its major goals.
It is appropriate to mention here the cooperation and interest of facultywho were in charge or other similar projectsAlfred KaduiThin or theUniversity of WisconsinMadison, and Irving Tebor, Donald Pilcher, andPaul Weinberger of San Diego State University. Their willingness to share
vii

their material with us and to serve as consultants is greatly appreciated.Financial support for the project was obtained from the National In-
stitute of Mental Health. Social Work Training Branch, Milton Wittmanwas a model of what one prays to tind in a federal administrator. It is withdLep affection and respect that hk many contributions are acknowledged.
We also want to mention support of a different nature that was obtainedfrom the Council on Social Work Fducation. Its Commission on Ac-creditation tppro% ed of our plan for evaluating the experiment. RichardLodge, the executive director, has been a friend for years, The study alsobenefited fro h the exceptionally line editorial skill of Wallace Jalinske,CSWE"s director of publications.
1 0

)rev,ori.
AcknoA lodgements
Chapter I
Chai
hdpter 3
Chap,er 4
Chapter 5
Choler 6
Chipter 7
rich x
Ill
S(
Contents
Page
ill
-r1p0001 I Ow Adclphi A 1 Lduc -1 1
ramHE ( JCH:( HO 11
011141000
kRON ROSVSBLA I I
ttt the S(ridt. 31
ARIANNE WLEFER
ia'i in Students' kin Skill 41
RS TiLA
Educational If um/ and Practice One
)iwr Aller (iraduarion,AARON ROSENBLATT
Coping with Feelings nu) '1 1 Ex-ecs in die Accelerated
.AARON ROSENBLATT
64
Summary and Conclusions 88
AARON ROSENISEATT
.Social Constraints I/ill rprelalionFindings &alit( itches
,AARON ROSLNBLA I I
99
Bibliography 85
ix

Chapter 1
A Description of the Ade lphi
Accelerated Educational Program
by Sophie Wojcierho wski
Do accelerated students learn as much as traditional students? This re-port presents data on test results obtained from an experiment in acceler-ated social work education conducted at the Adelphi University School ofSocial Work, This six-year study, which began with a pilot study in 1968,was completed in 1974..
A significant change in thinking about social work education occurredbetween 1968 and 1975, the time when this report was being prepared.Formerly the MSW degree was the major professional degree in socialwork. Today the profession is moving fast toward granting several profes-sional degrees. It is also developing a multilevel concept of social workeducation and practice. Thus the outcome of this experiment is more im-portant today than it was eight years ago when a small band of leaders firstconceived of the need for such a study.
At the inception of the accelerated educational program at Adelphi itwas officially viewed as an experiment "outSide of curriculum policy andaccreditation standards, and therefore special approval had to be securedfrom the Council on Social Work Education. It was funded by the NationalInstitute of Mental Health as an innovative educational experiment.
In those days many Adelphi faculty members viewed the program withconsiderable scepticism. Only a few years ago it was part of a "daring ex-periment;" today the experimental educational program has become anaccepted model of social work education. It is in operation not only atAdelphi but also at a growing number of other schools.
1 2

In this monograph the final results of the Ade lphi experiment are ullydescribed for the first time. Previous progress reports were shared with theAde lphi faculty and the field at large on various occasions.' Reports fromAde lphi, as well as findings from similar research programs in Madisonand San Diego have provided social work educators with reasonable proofthat a far-reaching reorganization of social work education is very much inorder.
Now for the first time in the history of social work.education the currentdebate on the undergraduate-graduate continuum has the benefit of ex-tensive and well-documented research. All those who took part in theseresearch projects hope that in the current heated discussions when issuesof continuum and educational acceleration are being debated,7 some ofthese objective research findings will be given proper attention.
HISTORICAL BACKGROUND
Most schools of social work do not require a specific sequence of under-graduate courses for admission to graduate study. Some professions suchas law, medicine, and nursing stress the importance of a continuum be-tween undergraduate and graduate training. Not so social work. Studentsfrom any baccalaureate program can apply to graduate schools of socialwork. The profession, however, generally has stressed the importance of abroad liberal arts education as a base for graduate study.
The continuurn issue received widespread attention in 1959 with thepublication of The Social Work Curriculum Study by Werner Boehm. Afterreviewing undergraduate and graduate programs of social work education,Boehm's task force commented: "The project findings reveal that there isa good deal of unprofitable duplication between the undergraduate andgraduate levels of education in social work today, particularly during thefirst year of graduate study,
Most social work educators agreed that there was some duplication.Herbert Bisno offered some specific recommendations for improving thesituation:
it might he desirable to have the first professional social work degree awarded at theConclusion of an integrated undergraduate-graduate live-year program. We believethat the students completing such a program would at least be as well educated, and inill probability considerably better educated, than the products of the present two-yearmaster programs.
Two points concerning this suggestion may need clarification and elaboration. First,v.e are definitely not suggesting a one-year graduate program. Rather we are thinkingin ternls of an integrated live-year program with social work content distributed overat least three or the live years.4
Several prominent social workers immediately challenged Bisno'srecommendations. The major arguments for and against the acceleratedprogram are summarized below.
2

Arguments for Acceleration
Proponents of an accelerated program stressed that:
I. An accelerated program might attract some excellent students whonow choose to enter other professions. In allied professions such aseducation and clinical psychology, the master's degree is conferredafter one year of graduate study. In social work the master's degree re-quires two years. The value of this additional year of study is not ap-parent; salary rewards commensurate with the cost of the added yearof training are lacking. Such lack of visible rewards for an additionalyear of study may discourage some students from selecting social workas a career.
2. An accelerated program would help in some measure to alleviate theshortage of social workers by launching them on their professionalcareers one year earlier. (In 1959 this was a factor because ther., was ashortage of social workers.) Strengthening undergraduate programsalso had other implications for alleviating the then existing shortage ofsocial workers. Undergraduate students who majored in social welfarewould be fully equipped to discharge certain professional respon-sibilities at the point of graduation. This was one of the reasons forstrengthening the undergraduate program at San Diego State College'and Adelphi University.
Arguments Against Acceleration
The opponents of an accelerated progrJm eveled two major c
1 An accelerated program forces students to make premature decisionsabout their vocation. Consequently they are less likely to be commit-ted to social work values than are students who enter graduate schoolwithOut an undergraduate concentratibn in social work. The latter'scommitment to social work becomes more meaningful because it ismade after exposure to many other possible fields of study.
2.Graduates of accelerated programs would learn less than graduates oftraditional programs. At least six years of educationfour years onthe undergraduate and two years on the graduate levelare needed totrain a social worker_ Even six years may not be enough time. Conse-quently this length of time should not be subject to any compression.
Since 1939 Adelphi University has offered social work programs to stu-dents. Undergraduate preprofessional social work training was started inthe Department of Sociology and Anthropology. Ten years later in 1949the Graduate School of Social Work was established.' In 1966 the Univer-sity Curriculum Committee transferred the undergraduate social workcourses to the School of Social Work and established a major in socialwelfare,
3
14

In 1967, under the leadership of l)can Joseph L. Vigilante, the facultybegan to explore several educational alternatives. They were aware of therapid acceleration of knowledge and the capacity of undergraduate stu-dents to acquire knowledge that was once considered advanced. Thereforethe faculty raised these questions: Could not much of what traditionallypassed for graduate education be learned at the undergraduate level? If so,how. much of the present curriculum should remain a part of the graduateprogram? How much of the graduate program more properly belonged atthe undergraduate level? (This kind of redistribution would allow moreadvanced content to be imroduced in the master's curriculum.) Howmight unnecessary duplication be avoided between undergraduate andgraduate programs?
Rather than debate the answers to these questions endlessly, theAdelphi faculty sought permission to engage in an empirical study of theissues_ In June 1968 the Commission on Accreditation of the Council onSocial Work Education issued permission to the Adelphi UniversitySchool of Social Work to develop an educational continuum "outside ofcurriculum policy and accreditation standards- and to measure the resultsagainst the traditional MSW program.
The National Institute of Mental Health granted the school a small grantto engage a researcher to develop a research p_roposal for the project. InMay 1968 Aaron Rosenblatt completed a research,proposal that was subse-quently submitted to NIMH. This organization then made a research grantto the school for a Pilot Experiment in Accelerated Continuum." Theinitial research design called for a flve-year study from the fall of 1968 tothe spring of 1973. Later, each study period was extended for an additionalyear. This extension made possible an investigation of the students' ad-justment to the field of practice one year after graduation. .
THE ACCELERATED CURRICULUM
While the research design was being developed by Rosenblatt (seeChapter 2) the faculty was engaged in building a meaningful curriculumreflecting the continuum between the BSW program and the acceleratedmaster's program. The Adelphi curriculum was built on the assumptionthat social work education must be offered within the context of a broadliberal arts program:After carefully examining the range of undergraduatecourses offered at the university, the faculty selected those that providedstudents with such an educational base.
All students interested in the undergraduate social welfare programwere asked to devote the first two years of their education to a generalliberal arts program. Within this period they completed most requirementsof the four divisions of the liberal arts curriculum, that is, language andliterature, social science, natural science, and the arts (see Table 1-1).,
4
la
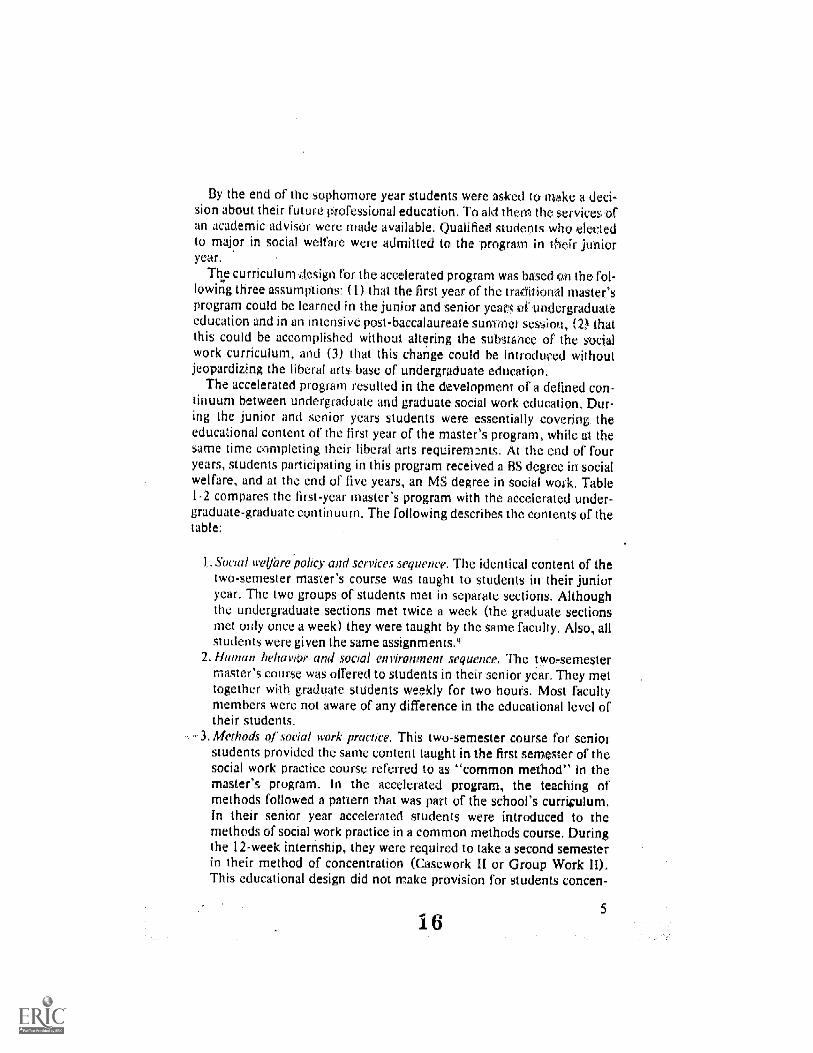
By the end of the sophomore year students were asked to make a deci-sion about their future professional education. To aid them the servicesnfan academic advisor were made available. Qualified students who electedto major in social welfare were admitted to the program in their junioryear.
The curriculum design for the accelerated program was based on the fol-lowing three assumptions: ( I) that the first year of the traditiorral master'sprogram could be learned in the junior and senior yearq of undergraduateeducation and in an intensive post-baccalaureate summer ses.;ion, (2) thatthis could be accomplished without altering the substance of the sncialwork curriculum, and (3) that this change could be introduced withoutjeopardizing the liberal arts base of undergraduate education.
The accelerated program resulted in the development of a defined con-uum between undergraduate and graduate social work education, Dur-
ing the junior and senior years students were essentially covering theeducational content of the first year of the master's program, while at thesame time completing their liberal arts requirements. At the end of fouryears, students participating in this program received a BS degree in socialwelfare, and at the end of five years, an MS degree in social work. Table1-2 compares the first-year master's program with the accelerated under-graduate-graduate continuum. The following describes the contents of thetable:
1. Social R.elfare policy and services sequence. The identical content of thetwo-semester master's course was taught to students in their junioryear. The two groups of students met in separate sections. Althoughthe undergraduate sections met twice a week (the graduate sectionsmet only once a week) they were taught by the same faculty. Also, allstudents were given the same assignments.9
2. Human behavior arid social environment sequence. The Iwo-semestermaster's course was offered to students in their senior year. They mettogether with graduate students weekly for two hours. Most facultymembers were not aware of any difference in the educational level oftheir students.
. Methods of social work practice. This two-semester course for seniorstudents provided the same content taught in the first semester of thesocial work practice course referred to as "common method" in themaster's program. In the accelerated program, the teaching ofmethods followed a pattern that was part of the school's currigulum.In their senior year accelerated students were introduced to themethods of social work practice in a common methods course. Duringthe 12-week internship, they were required to take a second semesterin their method of concentration (Casework II or Group Work II).This educational design did not make provision for students concen-
5
i6
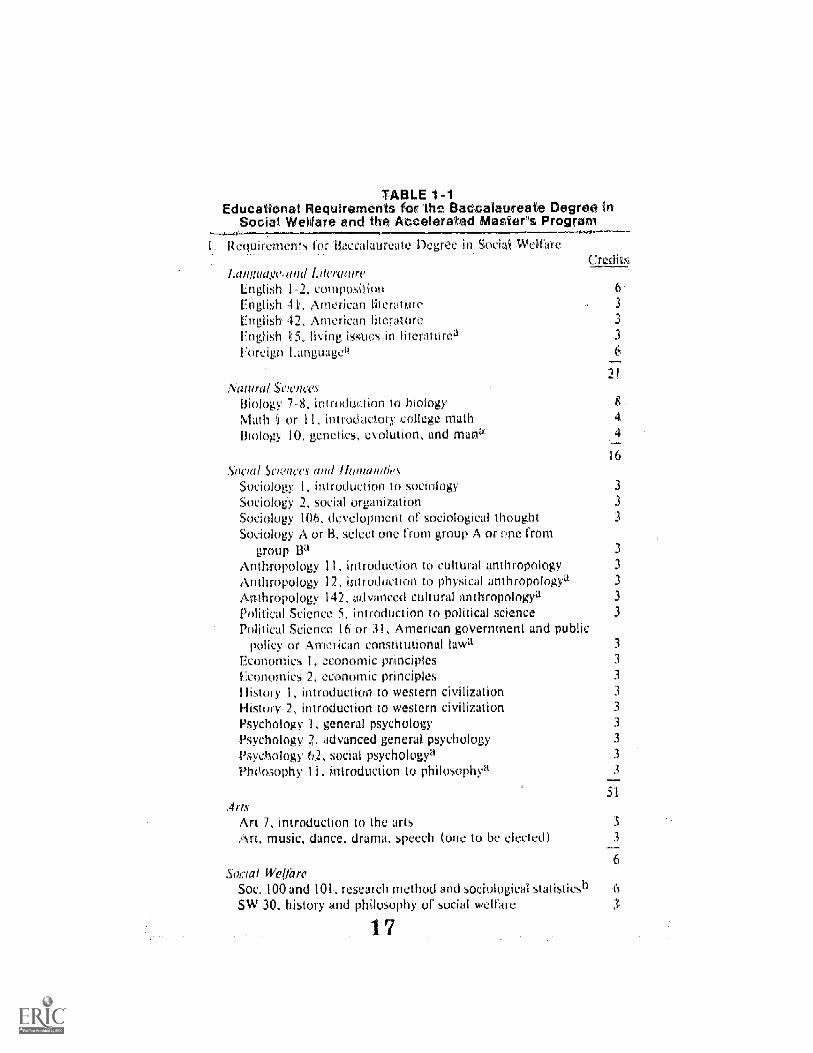
TABLE 1-1Educational Requirements fog the Bacalaureate Degree in
Social Welfare and the Atcelerated Masterns Program
..,equiremews for -BaccalaUreate Degree in Socia1 Welfare
Language.und brerasureEnglish 1-2, compositionEnglish 41American liteEnglish 42, American literatureEnglish .15, living issues in litcratu-Foreign Language"
ural Suer'Biology 7-8, intrducuon to biologyMath or II, introductory college mathBiology 10. genetics, evolution, and man,
/
1, introduction to socio:iology 2, social organization
Sociology 106, development of sociological thoughtSoeiology A or B. select one from group A or one from
group WIAnthropology 1 1. introductiora to cultural anthropologyAnthropology 12, introduction to physical anthropology"Anthropology 142, advanced cultural anthropologyaPohtical Science 5, introduction to political sciencePolitical Science 16 or 31. American government and public
policy or American constitutional limaEconomics 1, economic principles 3
Economics 2, economic principles 3
I listory I. introduction to western civilizt tion 3
History 2. introduction to western civilization 3
Psychology I. general psychology 3
Psychology 2". advanced general ps -11-)logy 3
Psychology 62, social psychology" 3
Ph4osophy Ii. introduction to phil hya 3
Crediv.s
6
3
3
3
21
8
44
16
3
3
3
ArtsArt 7, introduction to the arts
music, dance, drama, speech one to be elected)
Social WelAreSoc. 100 and 101, research method and sociological statisticsbSW 30, history and philosophy of social welfare
17
3
3
6

, organization ot social welfare servicesSW MO, I lunin tkh imr and Social Environment 1SW 101. lluman Behavior and Social Environment IISW 102, sernimir in Common Methods land social went-
boratorv (8 hours of lieklwork a week)SW 103, seminar in Common Meihock Ii Ifld social WLU
laboratory (8 hours (if fieldwork a week)
Votal for BS-120 (21+16+51+6+26)Fos baccalaureate Summer Session-12 weeks
SW 221. Social CaseworkSW 246, Social Group Work IISW 291 field instructi m (28 hours i wek 336 hrs-J 8
Credits
4
4
26
3
3. Students rri.-vam follow the_samesecond-year master program as regular students
1-Year Master's Prograrnfirst Se
tor LaseworA StudewsSW 320. Social Casewor
'roternvor4 StudentsS cial Group Work lIl
For All S it de nSW 112, Human Behavior and Social EhvironmentSW 236, organization of social welfare services (social devel-
opment)SW 357, Social Work RSW 390, Field InstructionElective
ind Semfor Cusework Students
SW 321, seminar in social casework-oupwork Students
SW 248, seminar in social groupw rkAll Students
SW 301, seminar in social welfarL 3
SW 391, tield instruct! n IV 6
Elective 3
14
3
3
21
Total for MSW 76 (26+14+ 21+15) 15
a Fiec:ive may be substituted for this course.
u Fultilk requirements or Socal Work Research I.
1 8
7

TA
BLE
1-2
Com
paris
on o
f Cur
ricul
um fo
r S
tude
nts
in th
e A
ccel
erat
ed a
nd T
radi
tiona
l Pro
gram
Sequ
ence
and
Cou
rse
Titr
eA
ccel
erat
ed P
rogr
ani
Tra
ditio
nal P
rogr
am
Soci
al W
elfa
re P
olic
y an
d Se
rvic
esH
isto
ry &
Phi
loso
phy
of S
ocia
l Wel
fare
Org
aniz
atio
n of
Soc
ial W
elfa
re S
ervi
ces
2.H
uman
Beh
avio
r an
d So
cial
Env
iron
men
tH
uman
Beh
avio
r an
d So
cial
. Env
iron
men
t IH
uman
Beh
avio
r an
d, S
ocia
l Env
iron
men
t H.
3.M
etho
ds n
f So
cial
Wor
k Pr
actic
eC
omm
on M
etho
ds C
ours
e
Soci
ai C
asew
ork
II a
nd/o
rSo
cial
Gro
upw
ork
ii
4.So
cial
Wor
k R
esea
rch
Soci
al W
ork
Res
earc
h I
5.Fi
eld
inst
ruct
ion
Fiel
d In
stru
ctio
n I
SW30
7-is
t Sem
este
r Ju
nior
SW31
:--2
nd S
emes
ter
Juni
or
SWI0
0-1s
t Sem
este
r Se
nior
SW10
1-2n
d Se
mes
ter
Seni
or
SW10
2-1s
t Sem
este
r Se
nior
SW10
3-2n
d Se
mes
ter
Seni
orSW
221
and/
or5W
246S
urnm
er S
essi
ona
(12
wks
.)
S100
Res
earc
h M
etho
dsS1
01. S
ocio
logi
cal S
tatis
tics
SW10
2 is
t Sem
este
r Se
nior
8 hr
s.. a
wee
kSW
103-
2nd
Sem
este
r Se
nior
.8
hrs.
a w
eek
120
SW29
1Sur
iimer
Ses
sion
28 h
rs. a
wee
k..
.336
Tot
al57
6
SW20
0-1s
t Sem
este
rSW
235
2nd
Sem
este
r
SW21
0 is
t Sem
este
rSW
211-
2nd
Sem
este
r
SW22
0EX
Ist S
emes
ter
SW22
1 an
d/or
SW24
6 2n
d Se
mes
ter
SW25
7-2n
d Se
mes
ter
SW29
0 Is
t Sem
este
r24
hrs
. a w
k....
,, 3
00
SW29
1-2n
d Se
mes
ter
24 h
rs. a
wk.
......
. 300
Tot
al60
0
aThi
s sp
ecia
l 12-
wee
k su
mie
r se
ssio
n is
dif
fere
nt f
rom
the
regu
lar
6-w
eek
sum
mer
ses
sion
of
the
Uni
vers
ity C
olle
ge,

trating in community organization.10 In the second year of themaster's program, accelerated students had the same options as tradi-tional students. For exampt4;, they could elect a second method otherthan their method of concentration.
4. Social work research. Only one research course was required of tradi-tional students. The accelerated continuum did not include a specialcourse in social work research. Instead, students were required to taketwo sociology courses TI research methods and statistics, which were,ansidered equivalent to the research course offered in the first year of
te master's program.$.:11-iekl instruction. A similt r number of hours was offered to accelerated
and traditional students. However, the distribution of fieldwork dif-fered. During the senior year, students spent one day a week in thefield for a total of 240 hours. During the summer internship, theywere required to spend 28 hours a week in the field, or a total of 336hours for the term. Thus the total tieldwork time of 576 hours wasclose to the 600 hours required of students in the first year of the tradi-tional program.
In summary, the accelerated curriculum was designed to provide aneducational experience equivalent to but not identical with that obtainedin the two-year graduate curriculum. There were obvious differences be-ween the two programs. Whether or not these affected the performance
of students would be determined by the research study that was a signifi-cant component of the Adelphi experiment.
OUTLINE OF THE MONOGRAPHThis section outlines the plan followed in presenting the data obtained
from the evaluation. Chapter 2 contains a careful statement of the goals ofthe research study and the problems encountered in presenting researchfindings on a controversial subject. In addition, the instruments used inthe study are described and the before and after findings for the entiregroup of students are used as evidence to support the validity of the instru-ments.
Chapter 3 deals with the procedures that were used to select acceleratedand traditional students. After that, selected characteristics of the twogroups a students are compared to determine whether or not any of thedifferences noted are statistically significant. This chapter also contains adetailed statement of the procedures used to ensure the cooperation ofstudents and supervisors. Their cooperation !rad to be earned. Muchthought was given to planning ways first to obtain and then to maintain acommitment to the research component.
The next two chapters, 4 and 5, are primarily devoted to the presenta-tion of quantitative data from the evaluative study. Chapter 4 contains
9
2 0

comparisons of accelerated and traditional students regarding changes inknowledge, value, and skill that occurred from the start to the completionof their training. In Chapter 5 the data are presented comparing the stu-dents' academic characteristics and their practice skill.one year after theyhad graduated. These two chapters complete the presentation of the quan-titative data.
-Chapter 6 contains data from a qualitative study of the students' ex-perience in the accelerated program. The students were interviewed insmall groups at the completion of their training. At that point they wereasked to analyze their experience and report on the positive and negativeaspects of the accelerated program.
Chapter 7 is the final chapter. Here the findings of the entire study arereviewed and some conclusions are set forth for the reader's considera-tion.
NOTES
I. San Francisco, February 25-28, 1973, Madison Wis., June 11-13, 1973; and Atlanta.March 10-13, 1974_
2. !When Bisno, Tbe,Place of the Undergraduate Czirric ulwn in Social Work Education,Curriculum Study, Vol. II (New York: Council on Social Work Education,1959).
3. Werner Boehm, Objectives of tlw Social Work Curriculum of tlw Future. CurriculumStudy, Vol. I (New York: Council on Social Work Education, 1959).
4_ Bisno, op, ca.
5. Thi: School of Social Work ai San Diego State College designed a series of studies toe,raluate the effect of the undergraduate program. The designs are set forth in -A ModelProject,- mimeographed (San Diego: San Diego State College School of Social Work, 1968).
6. Florence Hollis, "The Implications of the Curriculum Study for Social Work," Journalol Coninwnal Service. Vol. 37 (1960), pp. 135L-42, Ruth Smalley, -Reaction to the Cur-riculum Study,- Social Work, Vol. 4 (1959), pp. 105-107: and Charlotte Towle, -Objectivesfor the Social Work Curriculum for the Futtare,-":-Social Service Review, Vol. 33 (1959), pP.362-87.
7. The MSW was accredited by the Council on Social Work Education in 1951.8. During the 1970s, when many university students were demanding more freedom in
structuring their own educational choices, the above requirements were considerably "liber-ated,- giving students more options and more electives, Students interested in the socialwelfare major did not protest against the fairly strict educational requirements. They under-stood that a structured curriculum was a part of professional education and that it providedthem with the knowledge base needed for social work practice.
9. In a brief research study a comparison was made of the ratings or final papers for bothgraduate and undergraduate groups. The results showed no significant differences.
10_ At the time the continuum was developed, the Community Organization Sequencewas in the process 'of reorganization.
2 1
10

Chapter 2
Design of Evaluation
by Aaron Rosenblatt
The purpose of the Ade lphi study was mandated from the date of its in-ception in 1968. It was to compare the amount of learning taking place inaccelerated and traditional programs of social work education. On the basisof the findings a recommendation would be made regarding ri,L! future ofaccelerated programs of education. Before presenting the major elementsof the study design, a few words need to be said about the use of action re-search, of which the Adelphi study is an example.
THE USE OF ACTION RESEARCH
The results of the present study, and those of studies conducted at SanDiego and Wisconsin may not settle the controversy about acceleratededucation.- Some readers may question the validity of the findings onmethodological grounds. They may have strong doubts about the ways inwhich the data were collected. Or they may have serious questions aboutthe researcher's interpretation of the data.]
Some objections are, of course, legitimate. No study design is perfect.Furthermore, compromises and modifications always occur in the conductof an empirical study. For these reasons all studies should be subjected tocritical scrutiny. However, proponents and opponents in a controversialissue often tend to take a different approach. First they read the findingscarefully. If these fail to confirm their beliefs they comb through the sec-tion on methodology looking for soft spots. There they are sure io findsome basis for leveling charges against the validity of the study findings.Essentially they are seeking to discredit the information. Their scholarshipbecomes a weapon used in defense of their beliefs.
ii2

A researcher cannot solve all the problems that arise in conducting anevaluation study to everyone's satisfaction. The problem of measurementis- particularly nettlesomeAll that a researcher can hope- to do is to selectan instrument from the limited stock of those currently available that iseither "better" Or "less bad," Even the best instruments available forevaluating social work education are far from perfect. This should heopenly acknowledged.
In a sense, the researcher asks his readers to enter into a contract withhim. On the one hand he pledges to state his problems and to describe theway he tried to solve them. If the findings are too seriously flawed to beheeded, the researcher should warn his readers. Under these conditions,one may question whether the researcher should bother to publish or dis-tribute the results.
On the other hand, the researcher makes this request of his readers: "Ihave been honest with you. Now I ask you to be fair in evaluating this in-quiry. Decide whether or not you will give credence to the findings on thebasis of the logic or the inquiry. Don't postpone this decision until afteryou have read the findings and you have learned whether or not these sup-port your beliefs."
We ask the readers of this study to enter into such a contract. Read thesection on method carefully. Then decide whether or not you will be ableto accept the findings. Reach this decision befira you read the section onfindings,
METHOD: SCOPE AND RATIONALE
Two preliminary questions need to be addressed in the early stages of anevaluative study: What is it that is to be studied? and How are data of ttlisnature to be obtained? Let us address these questions seriatim:
The first and most important part of this study deals with the evaluationof the accelerated program as compared with the traditional master's pro7gram. At an early point we decided to confine ourselves tO the measure-ment of learning that was taking place in accordance with the objectives ofthe curriculum or the Adelphi University School of Social Work. We didnot question the construction of the two curricula, or the goals of graduateeducation. We were intent on measuring the comparative effect on stu-dents of two similar yet somewhat different educational programs withoutseeking to establish which of the two might produce more effective socialworkers_
In our view, the effectiveness oF students in their practice as socialworkers is to a considerable degree affected by matters other than the in-formation and knowledge they acquire as students. Indeed, we suspectthat their effectiveness as social workers will depend in large measure onthe kind of person they are when they enter the school of social work.Their past experiences, warmth, empathy, and understanding are crucial
1 2 2 3

elements in helping clients.2 These iaalities are not acquired as a result ofattending a school of social work. The school recognizes the importance ofthese attributes, but it does not presume to reshape the personality of thestudent. Instead, it tries to select for admission to the school those appli-cants who have a sufficient store of the needed qualities to performsatisfactorily.
We made a decision to restrict this study to measuring the learning tak-ing place in students. This learning was to be in accord with the formal ob-jectives of the curriculum. The study undoubtedly would have been moreinteresting if we had tried to cast a wider net and also evaluated the infot-mal learning taking place, regardless of whether it was in accord with CUT-riculum objectives. For example, we might have attempted to include astudy of the effectiveness with which students learn to circumvent agencyprocedures, or the way students decide to complete cettain assignmentsand to ignore others. This selectivity in completing reading assignments isa skill all students acquire. They cannot complete all of these and survive,let alone remain healthy.
Also, we might have studied the ways in which students learn to copeonce they encounter difficulties with their supervisors. Unfortunately, wedid not plan to study all of the learning that takes place as students gothrough the process of coming to think of themselves as capable socialworkers,3 and this kind of data was not collected. At the time we weredesigning the present study the prospect of evaluating solely the learningof information and skills in regard to the formal objectives seemed almostoverwhelming.
Now let us consider the second question, which was posed earlier: Howare the data to be obtained? Because of our interest in measuring theamount of learning in the two programs, we were compelled to make useof a "before-and-after" research design. An "after only" study would notprovide information on the amount of learning that occurs during thecourse of study. To make appropriate interpretations about the amount oflearning, before and after measures are needed. (The interpretation ofafter only measures is, of course, extremely hazardous.)
We also favored the before-and-after design for another reason. We didnot wish to assume that the goals of education were being reached simplybecause there were classrooms, teachers, students, textbooks, and othersigns that proclaimed one was in the presence of a flourishing educationalenterprise.
Omar Khayyam, an eleventh century poet and mathematician, warnedus in these words to be wary of educational appearances:
Myself when young did eagerly frequentDoctor and Saint, and heard great argumentAbout it and about: but evermoreCame out by the same door where in I went.
I 3
2 4

Thus we made use of a panel design, which is described in some detaillater in this chapter. Baseline measures were obtained from acceleratedand traditional students at the start of their training. Both groups of stu-dents were then measured two years later.
A second part of the study resulted from the suggestion of a consultantfrom the funding agency. Here we studied the practice of students oneyear after graduation. It was possible that changes in the social work prac-tice of aLcelerated and traditional students might become visible only afterthe passage of time. Therefore the suggestion was made that the practiceof students be assessed one year after they had graduated.
This aspect of the evaluation study was more difficult to control than thefirst part. For example, Adelphi had no control over the quality of theagency at which students chose to work after graduation. AISO, the schoolhad no control over the level of sUpervision students obtained after gradu-ation. In addition, one could anticipate that there would be greater attri-tion in following students once they had left school.
These and other uncontrolled factors may have affected the results ofthe follow-up. Therefore we have less confidence in the results of thisphase of the evaluation. These problems, while significant, were not sogreat that the study results have no value.
The third part of the study was peripheral to our main interest. Underinvestigation here were differences in the background characteristics ofstudents who were attracted to the accelerated and traditional programs.Before the experiment in accelerated education began, a few prominentsocial work educators expressed considerable concern that students at-tracted to such programs would be tainted by a heavily vocational orienta-tion and that a strong liberal arts background was a preferable preparationfor social workers. This concern was first voiced 15 years ago, before theadvent of career ladder programs and the granting of college credit for jobexperiences. Today this concern sounds old-fashioned. Quite apart fromits fashionableness, however, differences in the liberal arts background ofstudents may bear little relationship to achieving the goals of the cur-riculum.' Our present view about the vahle of this thitd part of the studyemerged only after the study was under way. Initially, we believed thequestion had more merit. Some readers may still consider that the matteris important and that the findings bearing upon this issue are valuable.
In summary, this evaluation study of the accelerated program atAdelphi was designed to answer three questions:
14
I. Did accelerated and traditional students differ in the amount of formallearning they acquired during their training?
2_Did accelerated and traditional students differ in their practice oneyear after graduation?
3.Were there differences in the educational background of studeenrolled in the accelerated and traditional programs?
2 5

Most of the resources and instruments in this study were devoted toanSwering the first question. In the next section we shall describe the in-struments selected and then we shall consider the panel design that wasused in collecting data.
MEASURINC INSTRUMENTS
The major purpose of the evaluation was to compare the amount oflearning acquired by students in the accelerated and traditional programs.Thus it was important to decide upon areas in which learning was expectedto take place. As a guide we used the statement of objectives set forth inthe Adelphi Self-Study tar Accreditatim Review:
The curriculum and general climate of the school prr. ide learning experiencesdesigned to develop self-awareness and to ,heighten the student's commitment tosocial work values, his motivation to give service and his recognition of change as adynannc factor in human relations and social institutions. The curriculum brings himknowledge ol people their problems, the programs of social wellare and the applica-tion of technical methods to the solutions of problems or social welfare.
-Fhe educational program prepares the student to translate knowledge, values andskills into disciplined professional social work practice for the purpose of restoration.,maintenance and enhancement of social functioning.
This statement was used to specify the following areas of social workeducation in which learning and commitment were expected to take place:
I . Foundation Knowledge (social welfare policy and services humanbehavior and the social environment).
2. Knowledge of Social Work Practice (social work methods, social workresearch),
3.Social Work Values.4.Practice Skills and Field Performance.
It was important to obtain data in each area, for learning was supposed totake place in all of them. Nor was one area considered preeminent in im-portance, The delineation of areas for study was similar to that made bySamuel Bloom in his evaluation 'of psychiatric teaching: -you have knowl-edge, you have skill, you have attitudes and values, and you havebehavior., you can't use any one index or indicator for all of the
The instruments finally selected for use in this study were the result of acareful search aimed at locating satisfactory tools of measurement.' Part ofthe general strategy was to use instruments containing a large number ofitems. Thus students would have difficulty remembering a number of par-ticular items from the first test to the retest. In addition, a large pool ofitems was likely to be more comprehensive than a small pool.
On the basis of a pilot study, we decided to use tests that could be scored
15

objectively. Before the evaluation began at Ade lphi, as part of the NIMHgrant we had conducted a small study on faculty rating of students' essays.These ratings were made without any extensive discussion with faculty.They were simply asked to rate the essays in their usual manner. Theresults showed such low reliability that we abandoned any further effortsto use essay questions.
As part of our search to locate satisfactory instruments we examined theliterature on measurements and also consulted with colleagues at SanDiego State College. the University of WisconsinMadison, and theUniversity of Michigan. From the stock of instruments available weselected those we believed to be most suited for use at Ade lphi.
At this point the project director met with chairpersons from the varioussequences at the school or their appointed representatives. With one ex-ception they approved of or selected the instrument to be used in thestudy. The chairperson of the Human Behavior and the Social Environ-ment sequence was not fully satisfied with one instrument. To make up forits deficiencies she prepared an additional group of questions. These weresubsequently administered to students taking part in the evaluation.
It would have been preferable to develop a special set of instruments ex-pressly for use in this study. Not enough time, however, was available forsuch an enterprise to be undertaken. Therefore obtaining approval fromthe chairpersons was an important precaution and ensured that the instru-ments were, from their informed perspective, satisfactory and that theyappeared to be suitable for measuring the kind of learning expected to takeplace at Ade lphi.
Information about the reliability and validity of these instruments willbe recounted later. In addition to making use of this information, wesought to validate the instruments for Ade lphi students by examining thecombined results of accelerated and traditional students obtained at thestart and at the completion of the study.
We reasoned that an instrument able to show significant increments inlearning was suitable for use in the study. If we could demonstrate that theinstruments were capable of registering increments in learning, this wouldcontribute substantially to the validity of the evaluation. The Wisconsinstudy devoted to instrumentation had foundered because the students ex-amined had failed to show such change.' When an instrument does notregister change from one period to another, one cannot, of course, assumethat the instrument is defective. Increments in learning may not beregistered simply because no substantial degree of learning is occurringno matter how desirable the goal or how laudable the effort and planningexpended.
Instruments that register increments from the start to the completion ofan educational program have a compelling quality about them. Afterdescribing each instrument, we shall also include the before-and-after
16
27
findings for the 000re group of 108 students who took part in !be evalua-tion study.
Obviously, findings were not known lc us when we undertook the study.Initially we had some question about presenting the findings in thischapter of the report instead of in the next one. We decided to presentthem hert!i for two reasons: first, the evaluation was not designed for thepurpose of validating the instruments used. Therefore the results obtainedfor the total group of students do not belong in the chapters devoted tofindings. Second, the before-and-after data for all students are useful tothe reader at this point in the presentation. These data may help himdecide whether or not to accept the findings that deal with the comparativeeffectiveness of the accelerated and traditional programs.
FOUNDATION KNOWLEDGE
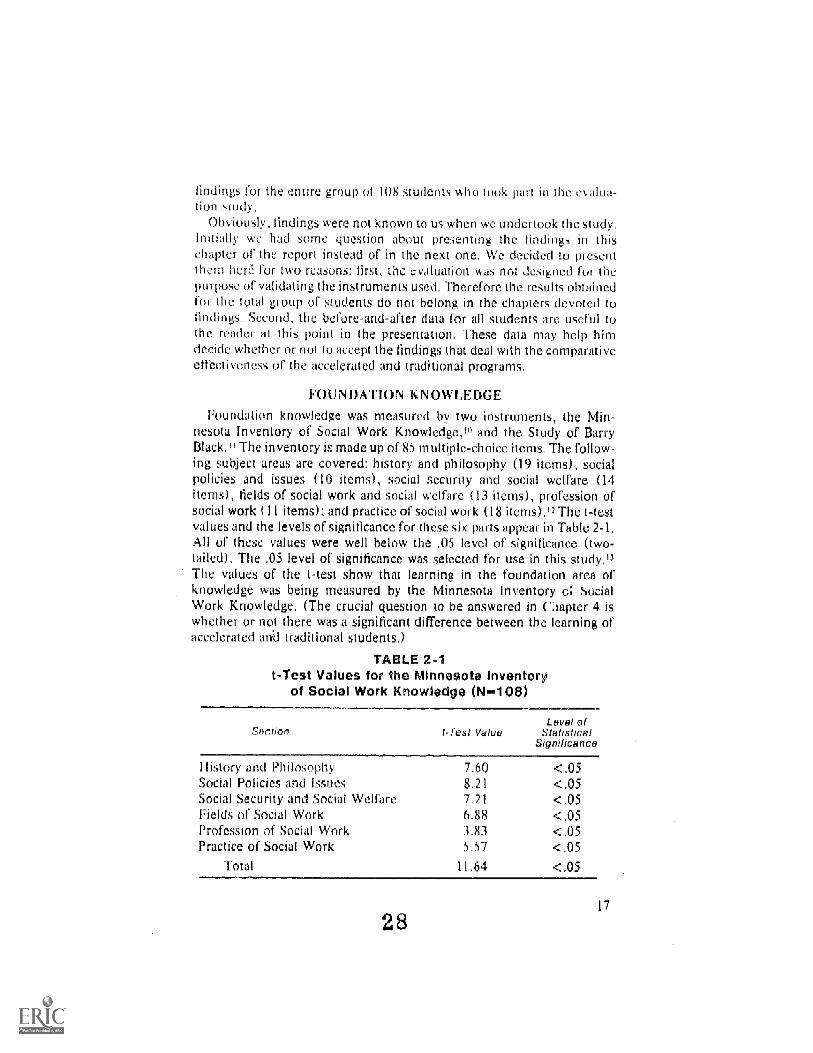
Foundation knowledge was measured by two instruments, the Min-nesota Inventory of Social Work Knowledge,1" and the Study of BarryBlack,11The inventory is made up of 85 multiple-choice items. The follow-ing subject areas are covered: history and philosophy (19 items), socialpolicies and issues (10 items), social security and social welfare (14items), fields of social work and social welfare (13 items), profession ofsocial work (11 items); and practice of social work (18 items).12The t-testvalues and the levels of significance for these six parts appear in Table 2-1.All of these values were well below the .05 level of significance (two-tailed). The .05 level of significance was selected for use in this study,13The values of the t-test show that learning in the foundation area ofknowledge was being measured by the Minnesota Inventory Gi SocialWork Knowledge. (The crucial question to be answered in Ciapter 4 iswhether or not there was a significant difference between the learning ofaccelerated arid traditional students.)
TABLE 2-1t-Test Values for the Minnesota Inventory
of Social Work Knowledge (N=108)
Ion t-Test ValueLevel of
StatisticalSignificance
Ilistory and Philosophy 7.60 C.05Social Policies and Issues 8.21 <_05Social Security and Social Welfare 7.21 C.05Fields of Social Work 6.88 C.05Profession of Social Work 3.83 C.05Practice of Social Work 5.57 C.05
Total 11.64 C.05
17
28

Studems' knowledge of the application of human behavior and thesocial environment was measured by the Study of Barry Black. Barry is aI 5-year old boy who is troubled in several areas of his life. After reading a1,000 word summiry, the student is asked to answer 28 questions dealingwith diagnosis. Ile then answers 17 questions about efforts to improve thesituation. The student receives an additional amount of information basedon a home visit to Barry Black's mother. After reading this summary, thestudent answers an additional 22 questions on diagnosis and 15 on treat-ment. The third and final section contains information obtained fromvisiting Barry's high school and talking to various school personnel. Thestudent then is asked to answer 21 questions on diagnosis and 20 on treat-ment. Altogether the case summary is approximately 3,000 words long.Ninety minutes is suggested as the maximum time necessary for carefulanalysis of the case material.
The chairperson of the Human Behavior and Social Environment se-quence at the school believed that the study of Barry Black needed to besupplemented by additional questions that reflected the objectives of theAde lphi sequence. She prepared an additional 21 items, divided into twoparts, concerned with "psychosocial dynamic mechanisms affectingbehavior." Six of the items are specific for the study of Barry Black and theother 15 of a more general character.14
The t-test values and the levels of significance for the study of BarryBlack appear in Table 2-2.
All of the values with one exception show that learning was taking placefrom the stan to the completion of social work training. The additionalitems prepared by Bertha Gronfein were particularly useful in reflectingthe program of instruction at Adelphi.
TABLE 2-2t-Test Values for the Study of Bar y Black (fl--=.108)
Section I-Test ValueLevel of
StatisticalSignaicance
Diagnosis 3.07 .05Treatment 1.09 ns
Total 3,35 .05Specific Psychosocial items 2.75 .05General Psychosocial items 7.64 .05
2 918

KNOWLEDGE OF SOCIAL WORK RESEARCII
Knowledge of and attitudes toward social work research were measuredby a test devised by I larris K. Goldstein, the Measurement of Attitudesand Research Knowledge (MARK).'' The form used in the Ade lphi studyw, as revised in June 1968. The test is divided into questk)ns dealing withboth knowiedge and attitudes. The 34 multiple-choice questions deal withsuch specific information as "A t requency distribution in research usuallyrefers to and such attitudes as "Do you find research ()1 absorbingand engrossing'? (21 stimulating and informative? (31 tedious and boring?(4) distasteful :ind repelling? The final 12 questions consist or a word orphrase which must be matched with the appropriate definition or descrip-tion of it.
Three factors were identified in this instrument by means of a factoranalysis: (1) knowledge of quantitative concepts and quantitative relation-ships and of precise ditTerences in concepts, (2) knowledge of abstractideas, and (3) the student's confidence in the ability of science to solveproblems, or the preference by the student for a knowledge-based versus apractice-based approach to practice. Studies conducted in 1968 and 1972showed a value oC .40 and .34 for predicting course grades.
The t-test values and the levels of significance for the Goldstein MARKinstrument appear in Table 2-3.
The values in Table 2-3 show that students were registering decrerbentsin attitude toward research. This finding should not he surprising. A pre-vious study of social workers, sonle of whom were students at Adephi,showed their low evaluanon not only of social work research but also ofcourses on social work research. MARK also showed that students were,nonetheless, acquiring knowledge about research.14
TABLE 2-3t-Test Values for the Goldstein MARK Test (N=108)
Section (-Test ValueLevel of
StatisticalSignificance
Attitudes 2,2242 <.05Attitudes and Knowledge 1,2532 nsKnowledge 4,8894 <.05
Total 2.4416 <.05
3 0 19
SOCIAL WORK VALUES
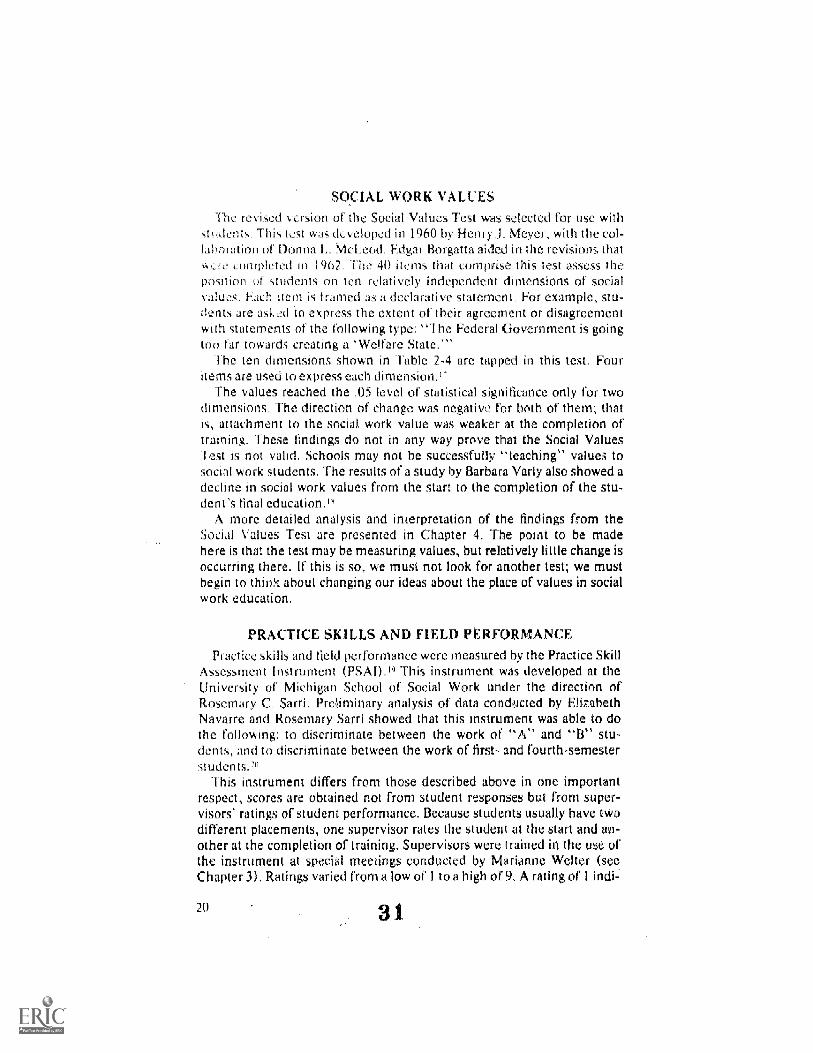
The revised version of the Social Values Test was selected for use witho:idents. This test was developed in 1960 by Henry ]. Meyer, with the col-
lahoration of Donna L. McLeod. Edgar Borgatta aided in the revisions thatN. r e completed in 1962. The 40 items that compfise this test assess theposition of students on ten relatively independent dimensions of socialvalues. Each itern is framed as a declarative statement. For example, stu-dents are asked to express the extent of their agreement or disagreementwi Eh statements of the following type: "The Federal Government is goingtoo far towards creating a Welfare State.
The ten dimensions shown in Table 2-4 are tapped in this test. Fouritems are used to express each dimension.
The values reached the .05 leNel of statistical significance only for twodimensions. The direction of change was negatiwe for both of them; thatis, attachment to the social work value was weaker at the completion oftraining, These findings do not in any way prove that the Social ValuesTest is not valid. Schools may not be successfully "teaching" values tosocial work students. The results of a study by Barbara Varly also showed adecline in social work values from the start to the completion of the stu-dent's final education.1'
A more detailed analysis and interpretation of the findings fTom theSocial Values Test are presented in Chapter 4. The point to be madehere is that the test may be measuring values, but relatively little change isoccurring there. If this is so, we must not look for another test; we mustbegin to thin% about changing our ideas about the place of values in socialwork education.
PRACTICE SKILLS AND FIELD PERFORMANCE
Practice skills and field performance were measured by the Practice SkillAssessment Instrument (PSAI)." This instrument was developed at theUniversity of Michigan School of Social Work under the direction ofRosemary C. Sarri. Prehminary analysis of data cond,acted by ElizabethNavarre and Rosemary Sarri showed that this instrument was able to dothe following: to discrirninate between the work of "A" and "B" stu-dents, and to discriminate between the work of first- and fourth-semesterstudents.,°
This instrument differs from those described above in one importantrespect, scores are obtained not from student responses but from super-visors' ratings of student performance. Because students usually have twodifferent placements, one supervisor rates the student at the start and an-other at the completion of training. Supervisors were trained in the use orthe instrument at special meetings conducted by Marianne Welter (seeChapter 3). Ratings varied from a low of I to a high of 9, A rating of I indi-
20 31

TABLE 2-4t-Test Values for the Meyer Social Values Test (N'l 08)
Dimens! f-Tesf VagueLevel of
StatisticalSignificance
Public aid vs private effort 0,40 nsPcrsonal freedom vs_ societalcontrol 1.26 nsPersonal goals vs. maintenanceof group I .70 nsSocial causation vs. individualautonomy 0,73 nsPluralism vs. homogeneity 2.68 < ,05Secularism vs_ religiosity I .35 nsSelf-determinism vs. fatalism 0.17 ns
8. Positive satisfaction vs. strug-gle-denial 0_92 ns
9. Social protection vs. socialretribution 0.64 ns
10. Innovation-change vs, tradi-tionalism 2.07 <.05
Total 0_40 ns
cated that behavior is not present in situations where the presence of thebehavior is appropriate," while 9 indicated that -behavior is always pres-ent when appropriate." The 77-item instrument covers these areas: com-munity (4 items), agency (7 items), student (9 items), the individualclient (18 items), casework (19 items), and groupwork (20 items).21
The t-test values and the levels of significance for the Practice SkillAssessment Instrument appear in Table 2-5.
The values shown were strong and consistent. They indicated that thePS AI was capable of registering change in fieldwork performance. Onemust, however, consider whether or not the ratings were contaminated bythe supervisor's knowledge of the students' location in the two programsand of the students year of training. Such information was known to allsupervisors. There was no way in which it could have been withheld fromthem.
In the training sessions conducted by Welter, supervisors were asked tolay aside any personal feelings they may have harbored about the value ofaccelerated education. She asked them to be as fair as possible in makingtheir ratings.
Another possibility for obtaining ratings would have been for the re-searchers to have employed raters, to have trained them, and to have
21
32

TA
BLE
2-5
t-T
est V
alue
s fo
r th
e P
ract
ice
Ski
ll A
sses
smen
t Ins
trum
ent (
N=
108)
Rem
Num
ber
!-T
est V
alue
Leve
t a?
Sta
tIsbc
atS
igm
tican
ce
Item
.N
umbe
rt-
Tes
t Val
ueLe
vet
ST
atIS
NC
-rp'
Sog
nvhc
ance
Item
NU
M'b
erV
afe
Sar
r
111
.31
<..0
520
6.41
< .0
5'.3
,,,.
9,97
< .0
52
10.8
9<
.05
2112
.20
< .0
:540
10 2
1<
.05
38.
71<
05
221
1.1
191
< ..
0541
8.53
< .0
54
13.4
3<
.05
2310
.24
< .0
542
9.93
512
.34
< .0
524
'1.7
9<
.05
4301
1<
.05
610
.86
< .0
525
12.3
6<
..115
44.
10,7
13<
:05
Cal
78.
35.
< :0
526
10.6
2.<
.05
45 .
'10.
96<
.05
Cgt
88.
09<
.05
2710
.68
< .0
546
0,20
< A
5
94.
00<
.05
2810
.57
< .0
547
9.59
1,0
5.19
< .0
529
11.4
0<
.05
48,
9.51
I 1
7..2
9<
.05
3010
.40
< .0
549
10.6
312
8.25
.<
.05
3111
11<
.05
509.
11<
.05
13.
8.85
< .0
532
12.8
2<
.05
519.
1314
7.98
< .0
533
9.63
.<
05
578.
99<
105
158.
11<
.05
3410
.32
< .0
553
8.35
<11
516
9.50
< .0
535
igli
70<
.05
548.
40<
.05
1710
.56
<.0
536
8.21
<.0
5.55
8.52
< .0
518
10.9
0<
05
379.
03<
.05
568.
9319
6.47
<..0
538
1.0.
02<
.05
579.
17<
.05

asked them to make ratings without any prior information about students.Although feasible, this approach raises other serious problems. How can asuitable sample of the students' performance be captured? How are theraters to acquire an intimate and extensive knowledge ot the students'tiekl performance? In our judgment, the preferable procedure was to trainsupervisors to rate the performance of their students.
In summary, the before-and-after data show that the instrur ients wereable to measure learning taking place at Adelphi. Learning was more con-sistent in some areas than in others but this kind of variation was to be ex-pected. Social work students were most concerned about their fieldworkperformance and change was most pronounced there. Social work studentshad little interest in research. Thcy showed gains in knowledge but lossesin their attitude toward research. Students social values failed to show im-provement. These findings, however, do not prove that the test is in-
ONE YEAR AFTER INSTRUMENT
Before-and-after data were not collected for other instruments that wereused in the evaluation. A description of these instruments follows: theOne Year After Instrument is similar to the Practice Skill Assessment In-strument. The same 9-point scale is used and the same anchoring descrip-tions are used for each point of the scale. The major difference, of course,is that the person being rated is a graduate social worker rather than a stu-dent. This change in status necessitates a number of changes in the word-ing of individual items. For example, item 4 of the PSAI reads as follows:
[The student] can describe the role of the professional social worker andthe method of service to professional and lay persons in the agency andcommunity." This item was changed to reflect a more demanding role:"[The worker] satisfactorily interprets the role of the professional socialworker to professional and lay persons.
A few items were omitted entirely and new ones were substit. Over-all, these changes were relatively minor. Nonetheless, their importancewas considerable. The shift in wording front student to worker meant thatan entirely different standard was being used to make ratings of skills andperformance. It was appropriate to compare the first and second ratingswhile the student remained a student. The third rating when the studentwas a graduate social worker stands alone. Thai is, the one year after rat-ings were not compared with the earlier one as an indication of progress,but were used solely to compare the practice performance of graduates ofthe accelerated and traditional programs.
INITIAL DIFFERENCES IN STUDENTSSome faculty feared that the liberal arts background of students would
be weakened in an accelerated program. More specifically, they anticipated
23
3+

the undergraduate education ol students might become unduly tech-nical or even worse from their perspectivevocational. Three kinds ofmeasures were used to collect information on initial differences in stu-dents=
I Student undergratluwe transcript. An undergraduate transcript ofgrades was available in the students' admission folder. This informa-lion was used in determining the number of courses in anthropology,economics, government, political science, psychology, social science,and sociology that students had enrolled in as undergraduates. Thetranscript was also used to determine the grade point average of ac-celerated and traditional students.
2_Students' aptaude test scores. The Graduate Record Examination wasused as another indicator of the liberal arts background that studentshad acquired from their undergraduate education. The test isdescribed as follows in the official GRE manual:
The Aptitude Test is a three-hour rest of general scholastic ability at the gradu-,ue level. It measures the basic verbal and mathematical abilities that a studenthas acquired over many years.
The Aptitude Test is basically a measure of ability and ... attempts to mea-sure skilk acquired over a long period of time and not related to a speak heldcif study.°
The validity of the Graduate Record Examination has been underwidespread attack recently. Indeed, this was the only test to which stu-dents voiced strong objections_ With this single exception theircooperation in taking part in the lengthy fesearch battery was morethan expected. In this study the GRE was not used to predict the suc-cess of students in graduate school, but to gain information abouttheir previous acquisition of knowledge and skill.
3. The background mfortnation schedule. Students were asked to completea scheduld providing a few pertinent facts about themselves and theirparents. This schedule was the simplest form used in the study. Stu-dents provided the following information: ( I) age, (2) sex, (3) maritalstatus, (4) number of dependents, (5) ethnicity, (6) father's educa-tion, (7) mother's education, (8) scholarship aid, (9) previous socialwork experience, and (10) other work experience.
Mention should be made of other sources of data that were available butwhich we decided not to make use of. Letter grades of undergraduate stu-dents were available; for graduate students, however, pass/fail gradeswere used. This form of grading was too gross to be used in the evaluation.Few students fail graduate courses at schools of social work. Neither is thebrief statement by faculty about student performance in the classroomlikely to be useful in evi,i-luating difTerences between students. These sum-
243-

manes tend to be overwhelmingly positive. Faculty generally are kind intheir final assessment of students. They know that their remarks are placedon permanent record, and their written statements are extremely favor-able I-ew cralcal comments leaened the sweet rolls they served up at theend of the semester. Approximaiely SO percent of the comments werefavorable.
One way to control the results of an evaluation is to select measures thatone has good reason to believe are insensitive to measuring real differ-ences. We suspect that pass/fail grades and faculty ev,iluations of stu-dents' classroom performance are unsatisfactory measures, If we hadchosen to influence the results of the study in the direction of no differ-ences between accelerated and traditional students, we would have pre-sented results based on these crude measures of student performance.
DETAILS OF THE PANEL DESIGNThe des)gn of any evaluative study should be determined by and must
be closely linked to the educational program being studied. The salientfeatures of this comparative study of accelerated and traditional studentsare discUssed here.
The educational program was cyclical and phased within each cycle. Theprogram began in 1968 and was completed in 1974. The cycles, phases,and time periods are represented in Table 2-6. For Cycle I, which was usedas a pretest, 6 students were admitted to the accelerated program. Thenumber of students for Cycles II, III, and IV was respectively 14, 16, and26. In all, there were 62 students admi tted10 the four cycles. Altogether, 9accelerated students did not complete the program (see Chapter 3). Also,the 6 students in Cycle I were excluded from the study for reasons ex-plained below. In short, a total of 47 accelerated and 61 traditional stu-dents participated in the before-and-after evaluation.
The research was linked with the phases in each cycle and a panel designwas used to study the effects of the formal educational program. In fact,there were four panels in the study, one for each cycle. The panels did notbegin in the same year. Neither were they of equal size. A decision wasmade that the panel of students in the first cycle be dealt with somewhatdifferently from those in later cycles.
There were only six students in the first panel. On two counts, then,these students were different from those in later cycles. These six studentscomprised the first group to participate in the accelerated program. Assuch, they were the objects of special attention from faculty members andother students. There was no practical way to disguise their identity or toprevent their special status.
In addition. the size of the first panel was small. It was only half the sizeof the second panel and about one-third that of the third. Thus studentsfrom the first panel were doubly different. They were the first group of stu-
25

1
TABLE 2-6Cycles and Phases of the Accelerated Program
71rie PP C'd
11 19(17- St
Fall I pci ng 1469
mei
V,111 -Spring 1970
Descrip oh of Phases
146S junto r dmitted to undergradu-ate social welfare major andLi:mph:Le one year of study.
Seniors complete theirLZF1LLUL major ir ocial welfare;ind recei.e the OS degree.
Accelerated students completeblock field placement ind twomethods coursCN.
Accelerated and traditional stu-dents complete the requirementsfor graduatton andmaster's degree.
e ve
Graduates complete their fir!.. eaf ()I Sol..
Wiirk PrActice 7- 71 year of prt1fessional social workpractice.
roll I c_)09 Satriall I 4i9-Spring 1970Summer Session 1970
ii_nii_spring 1971krist Year of Social
Work Practice I 971-72
Ill kW 19119 -Spring 19701970-Spring 1971
Sunimer Session 1971lall 1971-Spring 19721-irsl Year (Ai Social
Work Ikactiee 197
Fii IVO-Spring 19711971-Spring 1972
Summe r S ession 197aLIII 1972-Spring 1973
irst Year of Soda3Work Practice-197, 4
Same as .,1b
Sonic as Above
dems in thc program and they were few in number at a lone when theirpresence was most likely to evoke special attention.
These circumstances made it highly unlikely that they would be repre-sentative of those from later cycles of the program. Furthermore, it hardlyseemed wise to evaluate a program in the first year W.- its operation. Themore sensible procedure was to postpone the formal evaluation of the ac-celerated program thr at least one yearfr' Therefore we decided to use thestudents from the first panel as a pretest group. The results of thia groupIN not included in the formal evaluation. These_studen ts , however, par-
ticl paled in all phases of the evaluation study. Information obtained fromthe pretest was used to improve the format of the final &Naillat
10 summary, students enrolled in the accelerated and traditional pro-grams were examined at the start and completion of their professionaleducation. Accelerated students were observed for the first time at thestart a their senior year as undergraduates, and traditional st udents, at thestart of their first year as graduate students. Both groups were observedagain two years later at the point of their graduation from the school. Athird and final observation was made after the students hadcompleted onevear of practice.
The measure of learning was to be the net difference between the firstd second observations. Thus the effectiveness of the program would be
demonstrated by the total gains made by the students micus any lossesthat might be registered by some. Herbert Hyman has discussed the appro-priateness of this measure:
Disputation might attend such cruci.ii utctsuon on what index is rT1ostI1proprIatc for,-..,duating the etio..liceness il in org,M1/ al1011 _ Clearly, the deikni made is ahatsh one, lor individual gatris are not entered into the ledger unless (bey outweighthe losses [tut this it shoukl he noted, makes the findings on ellects all Ihe morecompelling. As there %ere net gains alter deducting the losses, there would hove beenesen more gains shown d the losses had not been suhtracted.2'
There was no control group in this design. We were not interested indetermining the effectiveness of one educational program compared withno program. The primary consideration was to determine whether or notmore learning occurred in one type of educational plan than la another.Neither was there any special need to tease out the effects resulting fromrepeated testing (practice &Teets) or outside happenings (extraneousevents). It was assumed tha: these would be equivalent since both groupsof students were equally subjected to them.
The validity of the conclusions resulting from the study werest rengthencd by taking into account the findings in the separate cycles. Inother words, the design called for replication of the study. Two replica-tions rather than one were called for in order to allow the experimentalprogram to expand in size. The number of students entering te programwas expected to increase if it proved successful. Therefore lime was pro-
27
3 8

vided in the design for an evaluation of the program as it is likely to oper-ate in the future.
Specific elements of the design appear in Table 2-7. in this representa-. 0 stands for Observation or :%1Qasurement. The subscripts stand for
the time of the first, sccord. and third olNeryations or measurements. Xstands for the start of the stimulusthe educational and training program;Y stands for the completion of one year of professional practice. Theprime () ditTerentiates the various cycles of the project.
TABLE 2-7Si plified Design of the Comparative Evaluation
Pretest
Final EVZ1 lu at ions
(PI 02
0;Of
or
0,
Y
Y
Y
The complete design for all four cycles appears in Tabk 2-8.The elements of the research design have now been presented. In the
next chapter.* e study muves ahead to consider the selection of students,certain of their background characteristics, and the careful efforts thatwere undertaken to obtain their cooperation in the study.
NOTES
1. Aaron Rosenblatt, "Social Constraints Affecting the Interpretation of Finding taEvaluative Studies" (An earlier version or lois paper was delivered at a conference onevaluative research at the School of Social Vitmli, University Of Wisconsin, Madison, Jun11-13, 1973)
2. Charles Tra UK and R. R. Corkhuff, rawaid 1J'cfne Cow,. eting a I Psyckflwapy(Chicago: Aldine, 1967),
3. Some information of this type was obtained from accelerated students when we it ter-viessed them about their experience in the propuni t see Chapter 6). For additional material ofthis type see John E. Mayer and Aaron Rosenblatt, "Encounters with Danger: SocialWorkers in the Ghetto," Sociology oj Work awn' Ocrupations, Vol. 2 (August 1975), pp,227-45, and Aaron Rosenblatt and John E. Mayer, 'Objectionable Supervisory Styles: -TheStudents View," Swial IVwk, Vol, 20 (May 1975)i, pp. 184-89=
4. Florence Hollis, "The Implications of the Curriculum Study for Social Work," Ammo/1,4 CortoramufService, V01.37 (1960) .pp. 13542, Ruth Smalley, "Reaction to the cur.
riculurn Study,- ri:oca Work, Vol= 4 (1959), pp: 1054 07, and Charlotte Towle, "Object vesfor the Social Work Curriculum for the Future," Swat Service Review, Vol. 33 (1959), pp.362-87
5. Accredltarm Rev Vol. 1 (Garden City, N:Y=: Adelphi UniversityScfrocil of Social Work, 1965).
Sam eel l3looni. '' In Evaluation of Undergraduate Psychiatric Teaching," in Coaliweacevecitiots I Wasb ington, D.C=: Association of S4 11 diem Professors of Psychiatry, 193U7. A useful annotated bibliography of instruments prepared by Martin Bloom is also
28
39

TA
BLE
2-8
.S
tude
nts,
, Pha
ses,
and
Cyc
los
for
Com
para
tive
Eva
luat
ion
of A
ccel
erat
ed a
ndT
radi
tiona
l Pro
gram
sS
t-de
nts
Tim
e11
p1=
ella
ima
Tem
0T
orne
Pret
est:
Cle
te 1
0, 1968
June
197
0Ju
ne-O
ct 1
971
Acc
eler
ated
stu
dent
sSe
nior
Soc
ial W
elfa
reG
radu
atio
n fr
omin
e ye
ar a
fter
(cen
sus)
.jO
rA
de lp
hi U
nive
rsi
J pr
ofes
sion
alI
Scho
ol o
f So
cial
empl
oym
ent
Tra
ditio
nal s
tude
nts,
Ent
erin
.g s
tude
nts.
t Wor
kbe
ttins
(ran
dom
sam
plet
Oph
i Sch
ool.
orSo
cial
Wor
k
Sam
e as
Abo
ve
Sam
e as
Abo
ve
Sam
e as
Abo
ve
Eva
luat
ion:
Cyc
le)]
0:0;
Sept
196
9ju
ne 1
971
June
Oct
. 1.9
72Sa
me
as A
tove
Sam
e as
Abo
veSa
me
as A
bove
Eva
luat
ion:
Cyc
le I
IIft
Sept
. 197
0lu
ne 1
972
iunc
-Oct
. 197
3Sa
me
as A
bovc
-Sa
me
us A
bove
Sam
e as
Abo
veE
valu
atio
n: C
ycle
IV
or.
or.
Sep,
197
1Ju
ne 1
973
lutw
-Oet
. 197
4_
Sam
e as
Abo
veSa
me.
as
Abo
ve.
Sam
e as
Abo
ve

adable see martin Bloom. -11.alua1ion ill so, al (irk fklucation l)LltcrFiie A Survey of
Pre-Beh.ts Icr it nd Post-lieh,o mr,i1 Solutions (Paper presented at the Ek attialit iii
Workshop. School nt SoOal Work, rniser,itv ur Wisconsin. Jone 11-13,1973),
8, Aaron Rosenblatt, "A Comparison of Faculty Ratings of Student Es_ivs.
mimeographed (Garden City . Adelphi University School of Social Work, 19681.9 Alfred Kadushm, -Testing the Discriminatory Capahilities or a Series of Evaluation
Measures As Applied to a Program of Social Work Education,- mimeographed (Madison,university of Wisconsin School of Social Work, 196)0.
10 Thomas Walz, -The !Minnesota Inventory or Social Work Knowledge.-nfmeographed (Minneapolis. Minn.: School of Social Work, Unisersity or Minnesota,1972).
1 I. 3 F lIorrocks, W. B. Horrocks, and M. E. Trayer. Study tri. Barry BlucA (Columbus,
Ohio, ('harles E. Merrill, 1960).12. San Diego used both a 60-iteln and a revised and an abbreviated version of the Min-
nesota Inventory of Social Work Knowledge. The scores obtained from both instrumentswere comparable. Indeed. Weinberger notes ih his final report, -For both tests the rank
mder 1 mean scores wits identical.- Paul Weinberger, Fhe Undergraduate ContinuumProtect! A Fioal Reptirt," mimeographed (San Diego: School of Social Work, San DiegoState University, 19721.
13. In all subsequent tables we shall report only whether or not the values are -not signifi-cant- (tls) or at or below the .05 level (.05).
14. We are grateful to Bertha Gronfein for having prepared these items for us.15. I tarns K. (ioldsteinIfoNtnn:ing Reward) Learning ,lbr Three Nies of Social If 'ork %-
deny. (Tallahassee, Fla.: Florida State University, 19721.16. Aaron Rosenblatt, "Practitioners Use and Evaluation of Researcl Socull (Pork.
Vol. 13 (1968), pp. 53-59.17. The Social Values Test was also selected for use at Madison and San Diego. See Henry
3. Meyer and Poona L. McLeod, "A Study of the VOlUeN of Social Workers," in BentroaralSCICtitV lor Sock,/ ITorAerv. ed. Edwin Thomas (New York: Free Press, 1967).
18. Barbara K. Varley. -Social Work Values: Changes in Value Commitments of Studentsfrom Admission to NISW (it-actuation," Journal of blocauan lior Social If 'ork, Vol. 4 (1968) ,
pp. 67-76.19. Rosemary C. Sarri and Robert Vinter, Practice Skill Assevntem Insirument (Ann Arbor,
Mich., Campus Publishers, 19671.20. Elizabeth Navarre and Rosemary C. Sarri, -Report on the Preliminary Analysis of Cri-
teria for Assessing Student Progress in Camp Work Field Instruction," mimeographed(Ann Arbor, Mich.: University' or Michigan School of Social Work, 19671,
21. The preponderant majority of students at Adelphi and other schools of social workspecialized in what was commonly referred to as "casework- at the onto this study wasbegun. During the three cycles, only 20 students received ratings for the groupwork items.Only the ratings for the casework items are analyzed in this report,
22. The interpretation of test results will he pursued further after all or the data from thistest are presented in Chapter 4.
23. Gwde uc the Cie qj the 6RE !_iyireA ccc Groduare Adausvons 1971-72 (Princeton, NJ,:Educational .Testing Service, 19711 .
24. -lo appraise it pmgriiro with anv reasonable hope of aecuracy we should build into thedesign a developmental period in which evaluation is held in abeyance until the program isestablished.... For example, the !lead Start Program, which moved public education intoan entirely new area was nevertheless 'evaluated* in its first summer!" See David J.Fox, "Issues in Evaluating Programs for Disadvantaged Children," The Urban Review, Vol.2 (19671, pp. 6-8.
25. Herbert H. Hyman, Charles R. Wright, and Terence Hopkins, eipplwar, n ofMethods of
Evaluation: Four Studies of the Encontrimenunr rtri:enslop (Berkeley, Calif.; University ofCalifornia Press, 19621.
30
4 1

Chapter 3
Students in the Study
by Marianne We lter
Educational experiments invariably create some disequilibrium and dis-ruption in established academic programs. On the one hand such effectsmay pose a threat to the familiar and accepted way of proceeding; on theother hand they can give rise to a climate of excitement and challenge. De-spite the innovative stance of the Adelphi University School of SocialWork, certain disruptive effects were experienced there when the experi-mental program was introduced in the fall of 1968.
The coordinator of the experiment was keenly aware of these elementsand of their likely impact on the students. Consequently, her primarygoals were first to improve and then to stabilize their morale. Thereforeshe stressed the challenge resulting from participation in an important,pioneering educational adventure. This approach also was designed toserve as an antidote to students' resistance, anxieties, and self-doubts thatbecame manifest during the initial phase of the program. This same posi-tive stance characterized her dealings with traditional students and thefieldwork supervisors who rated both accelerated and traditional students.
In short, from the outset of the project the coordinator's efforts wereprimarily directed toward enlisting optimum participation from bothgroups of students and from their supervisors. Before describing in somedetail the procedures that were used to achieve this goal, a statementabout the selection of the study population is in order.
SELECTION OF STUDENTS
The following procedures were developed for the selection and admis-sion or students to the accelerated program. With some minor modifica-tions these procedures were followed throughout the duration of the proj-ect.
4 2

During the second semester of the junior year, the coordinatordescribed the main features of the accelerated program to all students ma-joring in social welfare. Those interested in the program could request in-dividual consultation with the coordinator. These initial sessions weredesigned to help the students understand each successive step of the pro-gram_ At the same time the coordinator explored the students' motiva-
n, their capacity for self-investment, and their ability to participate in a
program calling for intensive concentration and study. Most students whoelected to explore the program more thoroughly decided to apply for ad-mission. Only a few decided not to apply.
All applicants to the accelerated program were subjected to the same cri-teria and admissions procedures as applicants to the graduate school. Thefollowing criteria were established for both types of students:
I _Students were expected to have a minimal 2.5 or B academic aver-age. (The students' overall average clustered around a B+ score.) Afew exceptions were made when there were deficits in educational op-portunity or other indications suggesting that the student was capable'
of performing al a higher level,2.Three references were required. Whenever the student had some
prior._social work experiencevolunteer work, summer or part-timeemploymentthe admissions officer recommended that at least onereference be related to this experience.
3. An autobiographical statement was required.4. Evidence of a recent medical examination was required.
The application material was read and judged by members of theschool's admissions committee. Committee members selected both types
nf students. They gave special emphasis to the students' motivation,maturity, and academic achievement. Faculty members who carried directresponsibility for the accelerated program were excluded from the admis-
sions committee in order to eliminate a potential source of bias from theselection process.
With only a few exceptions, the applicants to the accelerated programmet the admissions criteria and were accepted. Thus the accelerated stu-dents essentially comprised a self-selected group.
An increasing number of accelerated students were to be admitted ineach of the cycles. The educational design called for 6 students to be ad-
mitted to the pretest cycle and 12 students to the second cycle. It wasdifficult to select 18 accelerated students for the third cycle because there
were not enough candidates.One crucial problem was financial. Aside from the general rise in costs,
including tuition, accelerated students had to pay tuition and fees for asummer program at the graduate level. In addition, the students lost thechance w earn money during the summer. Such earnings often paid for
32
4 3

part of their tuition expenses. Subst ntial financial assistance was neededfor those students who could not afford to enter the program.
As is snown in Table 3-1, the largest increase in the number of acceler-ated students was projected for the fourth cycle. Eighteen students were tohe admitted in the third cycle and 36 in the fourth. Because the school'splans for a new building were not realized, and along with this, a substan-tially enlarged overall student enrollment, the admission of 26 acceleratedstudents seemed an optimal figure for the fourth cycle.
TABLE 3-1Comparison of Projected and
Actual Number of Accelerated StudentsCycle Projected Actual
11 12: 14
Ill 18 16IV 36 26
Total 66 56
For each cycle the traditional students who participated in the evalua-tion were selected from the entering graduate student population. Themethod of selection used was based on scientific, randomized samplingprocedures. The selection took place within two weeks of the students'en ranee.
Table 3-2 shows the number of the accelerated and traditional studentsat the start of Cycles II. III, and IV (Cycle 1 was the pretest1). There were56 accelerated and 67 traditional students in the test group. The largernumber of traditional students was intentional. It was assumed that therate of attrition would be higher among them than among accelerated stu-dents.
TABLE 3-2Initial Number of Accelerated
and Traditional Students in the Study
Cycle AcceleratedStudents
TraditionalStudents
ii 14 16
ill 16 17
IV 26 34
Total 56 67
4 433

WITHDRAWALS AND FAILURES
Accelerated Students
During Cycles II, Ill, and IV a total of 56 accelerated students were ac-
cepted and actually enrolled in the experimental program. Of this number,47 (84 percent) graduated with an MS degree; 9 accelerated students (16
percent) did not complete the program. Three of the students left beforethe end of the first semester of graduate study. The other six studentscompleted the undergraduate social welfare major and received their BSW
degree, but did not continue with graduate study. No students left the pro-.
gram during either the summer internship or the final year of graduatestudy.
There were two main reasons for losses among accelerated tudents:
withdrawals and failures. Six students withdrew from the program because
of compelling personal circumstances. Two tragic examples were two malestudents v, ho contracted cancer that was thought to be terminal. Anothermale student withdrew from the program when he [earned that he was to
be called into the armed forces,Three other students withdrew front the program at the end of their
senior year after having received their BSW degree. They felt the programmade extremely heavy demands on them. Three others were counseled to
leave the program because they failed to meet minimal standards of per-formance either in the field practice or in personal-professional maturity.
Traditional Students
A total of 67 traditional students took part in the three test cycles. Ofthese. 64 completed the graduate program and received an MSW degree.
The three who left discontinued their education within the first graduateyear_ One withdrew because or combined financial and personal pressures.
The other two were counseled to leave because they were failing eitheracademically or in their practice performance, or their personality charac-
teristics interfered with appropriate professional involvement and effec-
tiveness.Table 3-3 compares withdrawals, failures, and completions of both
groups or students for the three test cycles.
DEMOGRAPHIC CHARACTERISTICS OF STUDENTSSelected demographic characteristics of the two student groups were
compared to establish whether or not they showed any significant differ-
ences. Ten characteristics were selected for comparison: (1) sex. (2) age,(3) marital status, (4) number of dependents, (5) ethnicity. (6) father'seducation. (7) mother's education, (8) scholarship aid, (9) previous social
work experience, and (10) other work experience.
34
4

TABLE 3-3Withdrawals, Failures, and Completions
among Accelerated and Traditional StudentsCycle Withdrawals Failures
Accelerated StudentsII 2
III 4IV 2
Total 6 3
illIV
Total
Traditional Students
2
Completions
II12
24
47
15
17
32
64
Table 3-4 presents a comparison of the two student groups for these tencharacteristics. The differences between the two groups were not statis-tically significant for 8 of the 10 characteristics. For age and other work ex-perience, the differences were significant at the .05 level. Clearly, the ac-celerated students were younger. For that reason they probably had lessopportunity to acquire other kinds of work experience. The acceleratedstudents also had less previous social work experience_ Here, however, thedifferences were not statistically significant at the .05 level, In short, thetwo groups of students appeared to be similar to each other in all respectsexcept those related to age.
Having identified the students in the study, let us now turn to theproblem of obtaining their willingness to participate in the evaluation.
SUSTAINING COOPERATION DURING THE STUDY
One crucial aspect of the project was the collection of the research data.A research investigation only can be as valid as the evidence on which it isbased. Thus the cooperation of students and supervisors in the testing pro-cedures was of paramount importance and calls for special recognition.The students were asked to participate in an extensive series of before-and-after tests. Also, their supervisors were asked to provide extensivedata on the students' practice performance at three points in time.
Students who entered the accelerated program were informed that theresearch component was an integral part of the educational project. By andlarge they accepted the testing requirements and procedures withoutreservation. in contrast, those traditional students selected on a randombasis from the total graduate student population were much less accepting
35
46

TABLE 3-4Selected Demographic Characteristics
of Accelerated and Traditional Students
Types ofCriaracteristics
AcceleratedStudents
TraditionalStudents
Chi-Squarearid Level ofProbabilityN /0 -N
SexMale 9 19 23 38 3.54Female 38 81 38 62 ns
AgeLess than 23 15 32 4 7 10.2623-28 years 9 19 22 36 ¶Q529+ 23 49 35 57
Marital StatusSingle 19 40 22 36 0.21Married 23 49 32 52 nsSeparated, Widowed,
Divorced 5 11 7 12
Number of DependeinsaNone 25 54b 33 54 0.92One 7 15 7 11 nsTwo 7 15 12 20Three or more 7 15 9 15
EthnicityWhite 40 85 52 85 0.06Nonwhite 7 15 9 15 ns
Father's Educationa0-9 10 22 18 30 0.0210-11 7 15 13 21 ns12 12 26 12 19
12+ 17 37 18 30
Mother's Educa on0-9 11 23 14 23 0.0210-11 7 15 10 16 ns12 22 47 21 3412+ 7 15 16 27
Scholarship AidYes 21 45 33 54 0.60No 26 55 28 46 ns
Previous SocialWork Experience
Less than 1 year 27 57 21 34 2.73One year or more 20 43 40 66 ns
36
47

Types ofCharacteristics
AcceleratedStudents
TraditionalStudents
Chi-SQuareand Level ofProbability
-xpertenceLess than 3 yearsThree years or more
13
342872
31
30 493.99
< .05
Non:Table includes only those students who participated in all phases ofthe research program.
'I Total accelerated responses equal 46 because one student failed toanswer the question.
b Difference in this category due to rounding off.
of the 61/2 hours of testing. Many of them disliked the tests. Both groupsparticularly disliked the three-hour Graduate Record Examination.
Supervisors used the Practice Skill Assessment Instrument (PSAI) torate students' fieldwork performance. Before they administered the PSAIthe supervisors attended an orientation meeting, which was usually held atthe school. The purpose of the orientation was to explain all facets of theinstrument and to ensure its uniform application. Generally it took thesupervisors l'k-2 hours to complete the PSAI form.
Participation in the research required a substantial investment of timeand effort from students and supervisors. The "before" series of tests had
to he administered within the first few weeks after the traditional studentshad entered graduate school. Consequently, they had little time to build
up a sense of participating in a, significant educational experiment. Also,the after" tests were repeated tlko years later, close to graduation and
final separation when the students were thinking about completing theirschool responsibilities and planning their future careers.
The one year after" collection of data called for certain differences inapproach, strategy, and execution. The investigators were acutely awarethat there might be considerable attrition among students, especially when
they were called upon to participate in two extensive testings with long
time lapses between each test series.A decision was made to invest a considerable amount of time and effort
in securing and retaining the students' cooperation. The wisdom of thisdecision was affirmed when the investigators subsequently learned aboutthe lack of student cooperation encountered at San Diego and Madison,where similar experimental projects were being conducted. For example,Paul Weinberger noted in the final report on the Undergraduate Continu-um Project at the San Diego School of Social Work that "because of thelow questionnaire return rate, the original design could not be followedand students in the two years who differed in extent of work experience
were combined when data analysis was done." He also stated that
37
4 8

'difficulties in obtaining cooperation from MSW students whose help wassolicited on numerous occasions, necessitated dispensing with the originalstudy design."1
Alfred Kadushin, director of the Experimental Program at the School ofSocial Work, University of WisconsinMadison, also encountereddifficulties in maintaining student cooperation. After describing some ofthe steps taken in order to enhance the students' motivation to participatein the research tests, he reported that "despite this preparation only 29students of the total graduating group of 85 showed up on the scheduleddate." Because of the low turnout a second date was arranged, preceded bythe same preparatory procedures. "On this second try we attained thecooperation of an additional 16 students (amounting to 45 out of a total of85)....The same reluctance to participation was evidenced with regard toother evaluation procedures not given on a group basis."3
For example, the Wisconsin study entailed a
tytescrtfl ot a tape recording of an interview conducted by the student which he (thestudent) regarded as representative of his work.
Sohcitation of this data was made only io those students enrolled in the experimen-tal program: Thirteen 3-2 students and 23 matched control 4-2 students. The studentwho submitted an interview was paid $50.00. Those received detailed instructions andhad sonic four months before the material was due. Despite these incentives. only 15of the total of 36 solicited, submitted an interview transcript.4
Since the success of the investigation depended on optimal participationof both student groups, a major effort was made through group and in-dividual meetings with students, and through letters and telephone calls,to kindle, sustain, and reinforce their cooperation. The coordinator soughtto instill in them a sense of the significant contribution they were makingto Adelphi in particular and to professional social work education ingeneral. For both student groups in each of the three cycles the same pro-cedures were followed. Since the investigators were successful in securingthe cooperation of students, the procedures that they followed are setdown in some detail.
each traditional student included in the sample received a personal letter in which thenature and purpose of the experimental project was explained, as w°11 as the student'srandom selection as a participant in the research investigation. In addition, severalalternative dates were suggested for a meeting to be held for the purpose of furtherinterpreting the project. Also stated in the letter was the need to determine a generallyaccepted time for -taking the first test series. The accelerated student groups, whowere already familiar with the project, received a different type or letter, It welcomedthem into the program and informed them of plans for the initial meeting.
Both groups of students attended the orientation meetings. In-most instances, twomeetings had to be arranged to enable all students to take part, In exceptional cases,students were seen individually. Participation in these meetings was of pivotal impor-tance, They provided the coordinator with a major opportunity to generate a genuine
4 9"

interest in the educational oil rolletit (Rho' go;i1S wcre ako sel tor these meetings,Students received positive recognition of their vital role is 'providers of researchdata; and most important, the coordinator sought to establish in them a firm sense ofcommitment to parhopaung m both of the test series.
A similar set of procedures was followed as graduation approached and the secondday of testing neared: Again the main specific steps included sending the students let-ters to attend a meeting, making numerous personal and telephone contacts', andbeing present at the actual test.taking sessions. To recapture the students' interest inthe research at this late hour called for the sante skills that had been effectively usedat the earlier meenngs.
A total of 64 traditional students completed the graduate program andearned their MSW degree. Table 3-5 shows the number who completedthe before-and-after tests. Only 3 of 64 traditional students, or 5 percent,failed to continue in the research investigation. In all, only 3 of the 111students in the study who completed the MSW program dropped Out ofthe research investigation. This represented a high degree of studentcooperation. This becomes even more noteworthy when it is recalled thatthe study took place during the general climate of student unrest that per-vaded the campus in the late 1960s and early 1970s.
TABLE 3-5Test Attrition Among Students
AcceleratedCycle Students at
Time ITest
Attrition AttritionTraditional rest
Students at AttritionTime 1
Attrition
11
IllIV
Total
11
12
24
47 0 0
15
17
32
64
3
5
a This student received a research assistantship during the second year ofhis graduate program and was given a research assignment that includedworking with the test instruments used in the experimental project. Forthis reason he had to be excluded from the after" test series.
The super-visors evaluated the students' performance in field practice bymaking use of the Practice Skill Assessment Instrument. To obtain eachsupervisor's cooperation was as important as securing the continuedcooperation of the students. Similar procedures were used to accomplishthis objective as were used with students. Two meetings with supervisorsconsisted of two main parts: the first was devoted to summarizing the keyfeatures of the experimental program with particular focus on research ob-jectives and design., the second centered around a thorough explanation ofthe PSAI. Sufficient time was allowed for the supervisors to examine theinstrument and to raise questions about all aspects of it.
Each student had three different supervisors who participated in the re-
39
Fcn

search. The edu cat io nal design required that each student have a different
practice experience and hence a different supervisor each year. Thus every
student had one supervisor at the "before" phase and a different super-
visor at the after" phase. At the one-year-after follow-up phase still an-
other set of supervisors rated students performance.
A total of 71 supervisors carried responsibility for the field practicelearning throughout the three cycles. Of these, 22 supervised more than
one student. Th e number of students ranged from two to six, with an aver-
age of about three per supervisor, Thus a sizable group of supervisors was
asked to multiply their investment by completing the PSAI several times
over. Their full and generous cooperation was a highly valued contribution
to the evaluation, to the educational experiment itself, and to the Adelphi
School of Social Work.In summary, this chapter contains information on the way that students
were selected for the stuc13% There were no significant differences between
the two groups for the characteristicsexamined, with two exceptions: ac-
celerated students were younger and had less work experience. Considera-
ble effort was expended in securing the cooperation of the students and
their supervisors. The investigators were generally successful in this re-
gard. Let us now -examine the daN obtained from the students and their
supervisors.
NOTES
I. The six students rolled in Cycle I were eliminated from the statistical analysi in ac
cordance with the research design.2. Paul Weinberger, -The Undergraduate Continuum Project: A Final Report,"
mimeographed (San Diego: School of Social Work, San Diego State University, 1972).
3. Alfred Kaclushin and George Kelling, -Final Report: An Innovative Program in Social
Work Education, the 3-2 Programa, mimeographed (Madison, Wis.:University of Wiscon-
sin School of Social Work, 1973).Ibid.
40

Chapter 4
Changes in Students'
Knowledge, Values, and Skill
by Aaron Rosenblatt
The evaluation of accelerated social work education conducted at theAde lphi University School of Social Work was designed to answer threequestions:
I .Did accelerated and traditional students differ in the arno ant of formallearning they acquired during their training?
2.Did accelerated and traditional students differ in their practice oneyear after graduation?
3. Were there differences in the educ tional background of studentsenrolled in the accelerated program'?
Most of the resources in this study were expended in answering the firstquestion. Data bearing on this question are presented in this chapter. Datapertaining to the second and third questions are presented in The followingchapter.
Let us recall briefly certain important features of the research design. Itcalled for a before-and-after study of accelerated and traditional students. Inthis way we were able to compare changes that occurred in these twogroups. Change scores or learning scores were obtained from each cycleand for all three cycles combined. To obtain these we subtracted the meanscore at the start of the study from the mean score at the end of the study.The difference in means was compared for aixelerated and traditional stu-dents.
52 41

The values resulting from the direrence in scores appear in theright-hand column or the 84 individual tables that are located in the Ap-pendix. The values in this column and the levels or statistical significanceconstituted the core findings of this study. The t-test values permitted usto determine whether or not the di ffererKe in learning between acceler-ated and traditional students was statisticaHy significant, (The t-test valuespreceded by a negative sign indicate that more learning occurred amongtradit io nal students.)
Some additional data presented in this chapter may be of special interestto social work educators and practitioners. The scores of accelerated andtraditional students are presented both at the start and at the completion oftheir social work education. Tests of significance were computed in orderto show whether or not the differences between these scores were statis-tically significant either at the start oral thecomnpletion of their social workeducation.
A large mass of data was generated in the course of completing thisstudy. Witness the 84 tables in the Appendix, each of which contains 12divisions. We have given considerable thought to the best form of present-ing these data. The problem is not easily solved. Someone once comparedthe making or statistical tables to the making of sausages. Once the ma-chinery is set up, the tables, like sausages, can roll out endlessly. The con-tent or the stuffing can vary; nonetheless, they all come out looking alike.Consequently even the most ardent sausage lover soon loses his appetite.
It would have been possible, of course, to present all 84 tables in thebody or the text. This seemed to be too much to ask of any reader. Tablesthat are cast in the same form make for dull reading. Even the specialist iscertain to become bored. Yet a research report is not an entertainment.And it is obvious that we cannot write as well as Graham Green.
We worried the problem for some time and made several false starts.Finally we arrived at the following format: we prepared 9 summary tablesthat appear at appropriate points in the text of this chapter. They are basedon the findings contained in the 84 individual tables in the Appendix. Thedescription and discussion of the findings i n the text are based primarily onthe information contained in the summary tables. There is a certain ironyhere: in order to simplify the presentation we had to prepare 9 additionaltables!
The summary tables include information for each of the three cyclesand for Cycles 11IV combined. The summary tables also contain datdontrends and differences in knowledge, val ues, and skill. This simplified planhas only partially solved the problem. Reading this chapter will still makeconsiderable demands upon the patience of the reader.
42
53

'MIND 7S ENOS_ ;DIGINVENTORY OF SOCIA4 WORK KNOWLEDGE
The data in Tab le 4-A surnmarire findings that appear in Tal,1esthrough 4-7 obtained from the Inventory or sociii Work Knowledge. Theinventory is divided into six section,* which combined wall the three cy,-cles resulted in If comparisons betveen accelerated and traditional stu-dents. The comparisons in Table 4-A provide two kinds of information:which group of students learned more during the study; arid th,er ornot ihis difference in learning was Sttil istically significant.
For 8 of the comparisons the rnetin learning scores of tradi tional stu-dents were higher. I ni other words, tIetrtditioiuI students showed greaterincrement of knowledge on these cornparisons. For I 0 of the comparisonsthe mean learning scores of ai:celerated students were higher. Me meanleinning scores or traditional students were higher for all three cycles in1 I ist ory and Ph ilosop hy, and Social P`olici es ;Ail d I ss ues For the other foursections t hc scores or occeic rated st udents were general ly higher, Daly 4 ofthe 18 differences reached the .05 1Qvel of statistical significance. All ofthese showed lit at he accelerated stu dents learned signiticarizly ni ore thandid the traditional students.
When Cycles 111-1\1 were wnjtiinc d, the learning scores of aceele atedstudents were higher for tour of tb si x comparisons. The difTerenc s inlearning scores for three of the six section s reached the .05 level of statisti-cal significance. The learning scores of traditional students were signifi-cantly higher for the El istory and Philosophy section, The learning of ac-celerated students was significantly higher for the Felds or social Workand the Practice or Social WO'rk.
When the sections of the Inventorr Go- Social Work Knowledge werecombined, the learning of the aceelcmtzd stwlents was higher for Cycles 11and IV. For both of hese cycles, the differences were statistimlly signifi-cant. In addition, when the scores of die combined test and the combinedcycles were compared, the overall learning score of accelerated studentswas both highe r an d 's tatistical ly sign &cant.
The changes that o,ccurred during ithe study period can be su mmarizedas follows: accelerated students possessed less knowledge at the start oftheir education and generally they teamed more. When the cycles and thesections of the inventory were combined, the difference in learning be-tween accelerated and traditional Made nts was statistically significant.
BARRY BLACK TEST
The data in Table .ummarize Ix findings that appear in Tables 4-8through 4-12. The I3arry Black Test is &Tided into two parts: the first loam-prises the standard fo:rn-i of the test and the second comprises the supple-mentary questions designed to reflect Ibe Adelphi curriculum.
4

TA
BLE
4-A
Sum
mar
y of
Cha
nge
in L
earn
ing
Sco
res
for
inve
ntor
y of
Soc
ial W
ork
Kno
wle
dge
His
Wry
&P
hilo
soph
yS
ocia
l Pol
icie
s&
Issu
esS
ocia
l Sec
urity
& S
ocia
l Wel
fare
Fie
lds
ofS
ocia
l Wor
kP
rofe
ssio
n o
Soc
ial W
ork
Pra
ctic
e of
Soc
ial W
ork
Tot
alT
est
Cyc
leG
reat
er L
earn
ing
Tra
ditio
nal
Tra
ditio
nal
Acc
eler
ated
Acc
eler
ated
Acc
eler
ate
.A
ccel
erat
edA
ccel
erat
edL
evel
of
Sign
ifi.c
ance
nsns
nsns
ns<
.05
<.0
5C
ycle
HI
Gre
ater
Lea
rnin
gT
radi
tiona
lT
radi
tiona
lT
radi
tiona
lA
ccel
erat
edA
ccel
erat
edT
radi
tiona
lT
radi
tiona
lL
evel
of
Sign
fica
nce
nsns
nsns
nsns
ns
Cyc
le I
VG
reat
er L
earn
ing
Tra
ditio
nal
Tra
ditio
nal
Acc
eler
ated
Acc
eler
ated
Acc
eler
ated
Acc
eler
ated
Acc
eler
ated
.L
evel
of
Sign
ific
ance
nsns
<.0
5<
.05
ns<
.05
<..0
5
Cyc
les
i 1IV
Com
bine
dG
reat
er L
earn
ing
Tra
ditio
nal
Tra
ditio
nal
.Acc
eler
ated
Acc
eler
ated
.Acc
eler
ated
.Acc
eler
ated
Acc
eler
ated
.
Lev
el o
fSi
gnif
ican
ce<
..05
nsns
<M
I5ns
<.0
5<
.05

TA
BLE
4-B
.S
umm
ary
of C
hang
e in
Lear
ning
Sco
res
for
a S
tudy
of B
arry
Bla
ckD
ragn
ostic
Sec
tron
Tre
atm
ent
Sac
todn
Tot
al T
est
(Sta
ndar
d F
erm
iS
opO
fT0f
inta
ty. h
ems
S;b
ecIfi
c'G
ener
al
Cyc
le 1
1G
reat
er L
earn
ing
Tra
ditio
nal
Acc
eler
ated
Tra
ditio
nal
Acc
eler
ated
Acc
eler
ated
Lev
el o
fSi
gnif
ican
cens
nsus
nsus
Cyc
le I
llG
reat
er L
earn
ing
Acc
eler
ated
Acc
eler
ated
Acc
eler
ated
Tra
ditio
nal
Tra
ditio
nal
Lev
el o
fSi
gnif
ican
cens
nsns
nsns
Cyc
le 1
11G
reat
er. L
earn
ing
Tra
ditio
nal
Tra
ditio
nal
Tra
ditio
nal
Tra
ditio
nal
Acc
eler
ated
Lev
el o
fSi
gnif
ican
ce,
nsns
nsns
us
Cyc
les
11-1
41C
ombi
ned.
Gre
ater
Lea
rnin
gT
radi
tiona
lA
ccel
erat
edT
radi
ti1
-II
Tra
ditio
nal
Acc
eler
ated
Lev
el o
fSi
gnif
ican
cens
usns
nsus

The standard form is divided into two sectionsDiagnostic and Treat-ment. Thus the two sections of the standard form and the three cycles per-miued six comparisons in learning between accelerated and traditionalstudents. None of these differences was statistically significant. For threeof the comparisons the accelerated students showed more learning, andfor the remaining three the traditional students showed more learning.When the diagnostic and treatment learning were combined, there wereno statistically significant differences_ For two of the three cycles the learn-ing scores of the traditional students were higher_
The two sections of the Barry Black supplementary items showed a pat-tern that was quite similar to that resulting from the standard form. Of thesix comparisons in learning none of the differences was statistically signifi-cant, Furthermore, there was no discernible trend favoring either acceler-ned or traditional students. Each group had higher learning scores forthree comparisons.
When the cycles were combined, there were no significant differences inlearning. The scores of accelerated students were slightly higher on thetreatment and general Adelphi items. The traditional students showedhigher learning scores on the diagnostic and specific Adelphi items. In ad-dition, learning scores of traditional students were slightly higher for thetotal Barry Black Test.
There was a slight trend for the absolute scores of accelerated studentsto be higher at the start and at the completion of training on the standardform of the Barry Black Test. However the absolute scores of traditionalstudents were higher on the supplementary items (see Tables 4-8 through4-12 in the Appendix).
In summary, there Were no statistically significant differences in thelearning scores of accelerated and traditional students. Also, there was noconsistent overall trend in favor of either group as evidenced by theirscores on the Barry Black Test.
MEASUREMENT OFATTITUDES AND RESEARCH KNOWLEDGE
Table 4-C deals with changes in research attitudes and research knowl-edge as devised by Harris Goldstein. This instrument is divided into threeparts: attitudes, attitudes and knowledge, and knowledge. The three partsare then added together to yield a total score. A summary of the testresults appears in the table.
Differences in learning were quite small between accelerated and tradi-tional students for each of the three cycles. None of the differences wasstatistically significant at the .05 level and there was no overall trend favor-ing either group of students. The three sections of the test and the threecycles made possible nine comparisons in learning. For four of the nine,the accelerated students showed slightly higher learning scores, and for
46
57

TA
BLE
4-C
Sum
mar
y of
Cha
nge
in L
earn
ing
Sco
res
for
the
Mea
sure
men
t of A
ttitu
des
and
Res
earc
h K
now
ledg
eA
tblu
des
Atti
tude
s &
Kno
wff
idge
Ktie
wie
dge
Tot
al T
est
Cyc
le I
IG
reat
er C
hang
eT
radi
ition
alA
ccel
erat
edA
ccel
erat
ed.
Acc
eler
ated
Lev
el o
fSi
gnif
ican
cens
nsns
nsC
ycle
III
Gre
ater
Cha
nge.
Tra
ditio
nal
Tra
thtio
nal
Tra
ditio
nal
Tra
ditio
rkd
Lev
el o
fC
ASi
gnif
ican
cens
nsns
nsC
CC
ycle
IV
z.:
Gre
ater
Cha
nge
Acc
eler
ated
Acc
eler
ated
Tra
ditio
nal
Acc
eler
ated
Lev
el o
fSi
gnif
ican
ceus
nsus
usC
ycle
s II
-1V
Com
bine
d.G
reat
er C
hang
eA
ccel
erat
edA
ccel
erat
edT
radi
tiona
lA
ccel
erat
edL
evel
of
Sign
ific
ance
usns
usns

the remaining tivc% the traditional students were slightly higher.The scores for the total test revealed essentially the same pattern. For
each of the three cycles there was no statistically significant difference be-
t een accelerated and traditional students. The learning scores of acceler-ated students were higher for two cycles. When the three cycles were com-bined and the learning scores for each part or the test examined, there wasno significant ditlerence between accelerated and traditional students.
The results that appear in Tables 4-13 through 4-16 may be somewhatdiscouraging to researchers. From the start to the completion of theireducation the learning scores of both accelerated and traditional studentsregressed slightly for the first two sections of the test. Accelerated stu-dents showed less and traditional students showed more regression onthese sections. Most or the positive change occurred in the third part ofthe test dealing with knowledge. There, traditional students registeredslightly more learning than accelerated students.
The combined learning scores for the three parts and for the three cyclesshowed no statistically significant difference between accelerated and tra-ditional students. In short, the differences between accelerated and tradi-tional students did not reach statistical significance for any of the cycles,for any of the parts of the test, or for any of the combinations of cycles andparts examined.
SOCIAL WORK VALUES TEST
The Social Work Values Test was the only one of the instruments that
failed to show a statistically significant difference in a positive direction be-tween the scores of all students from the start to the end of their education4nd training.' Before presenting the findings we will speculate on the rea-sons for this lack of change in values. One factor may have resulted fromthe self-selection of students who enter the profession of social work. TheSocial Work Values Test apparently is able to discriminate between thevalues of teachers and social workers,2 11owever it may not be able to dis-criminate between tirst-year and second-year social work students.3 Thismay result from the value commitment already made by students; that is,students entering the profession may have already developed values that
are quite similar to those of second-year students.Another possible factor worth noting is the "ceiling effect." The results
of the test showed that the absolute scores of both first-year graduate stu-dents and undergraduate social welfare majors were extremely high atAdelphi. There are four items for each dimension of the test. Scores ofdefinitely agree" are rated 4 and -probably agree" are rated 3, and soforth. The scores for each dimension may range from a low of 4 to a high
of 16. The overall mean score of accelerated students was 112 for eachdimension at the start of their education. The overall score of the tradi-tional students of 12.8 was also high In other words, a ceiling effect proba-
48
5 9

blv was in operation. At the start of training the scores of students were atsuch a high level that there was comparatively little room for improve-ment.
These high scores also seemed to offer some evidence for the previouspointthat students acquired the desired values before they entered theprofessional school. Faculty at schools of social work may wish to ponderthe meaning of these high scores when developing curriculum goals_
Another possible explanation of the low change in social work values re-quires further exploration. Students' valles may be affected adversely aswell as positively by their education and training. On the one hand, thevalues of certain students may be strengthened as a result of their school-ingl on the other hand, some students may become somewhat jaded asthey witness or are party to certain practices in social work of which theydo not approve. This kind of -practice shock" is common among thosetraining for the professions. It occurs in both education and medicinewhen students enter the classroom and the hospital ward. The net effectmay be that the changes in different directions cancel out each other. Thusthere may have been considerable "turnover in values that did not ap-pear in the summary measure reported in the tables.
The results of the Social Work Values Test appear in Tables 4-17through 4-27 in the Appendix. Tables 4-D and 4-E contain a summary ofthe results. There are 10 dimensions of the test and three cycles, thusthere were 30 comparisons made between accelerated and traditional stu-dents regarding changes in their values. None of these comparisonsresulted in a difference of statistical significance. Generally, there was lit-tle positive change in values. For some dimensions there was a slightdecline in a social work value. Indeed for 3 of the 10 comparisons therewas a decrease in the learning scores of both accelerated and traditionalstudents from the start to the completion of their education.
When all of the dimensions were combined into one learning score foreach cycle, the differences were not statistically significant. For Cycle 11,accele.ated students showed more positive change than did traditional stu-dentc. For Cycle III, the social work values of both accelerated and tradi-tional students showed some regression. Those of accelerated studentswere slightly greater than those of traditional students. For Cycle IV, ac-celerated students once again showed a regression in social work valueswhile traditional students showed a very modest positive change.
The total score for Cycles II-1V combined showed that accelerated stu-dents started their education with higher values than did traditional stu-dents (see Table 4-27). This overall difference was statistically significantat the .05 level. The values of accelerated students declined slightly whilethose of traditional students increased modestly by the end of their educa-tion. At that point, however, accelerated students still possessed slightlyhigher values than did traditional students, but the difference was no
6 049

TA
BLE
4-D
Sum
mar
y of
Cha
nge
In V
alue
s fo
rth
e S
ocia
l Wor
k V
alue
s T
est (
Par
t I: V
alue
s 1-
5)P
ublic
Aid
vs.
Priv
ate
Effo
rt
Per
sona
l Fre
edom
vs ..
Soc
ieta
l Con
trol
Per
sona
l Goa
lsS
ocia
l Cau
satio
nvs
vsM
aint
enan
ce o
f Gro
up ln
divw
fual
Aut
onom
y
Plu
rahs
mvs
Hom
ogen
eity
Cyc
le 1
1G
reat
er C
hang
e.T
radi
iiona
iT
radi
tiona
lA
ccel
erat
ed'T
radi
tiona
l"I
rad
ition
alL
evel
of
Sign
ific
ance
Os
nsO
sns
nsC
ycle
III
Gre
ater
Cha
nge
Acc
eler
ated
Tra
ditio
nal
Acc
eler
ated
Acc
dera
ted.
.fra
ditio
nAL
evel
of
Sign
canc
ens
nsns
nsC
ycle
IV
..G
reat
er C
hang
eT
radi
tiona
lT
radi
liona
lA
ccel
erat
edT
radi
tiona
lT
radi
tiona
lL
evel
of
Sign
ific
ance
.ns
nsns
nsns
Cyc
les
11-1
1VC
ombi
ned
Gre
ater
Cha
nge
Tra
ditio
nal
Tra
ditio
nal
Acc
eler
ated
Tra
ditio
nal
Tra
dit i
onal
Lev
el o
fSi
gnif
ican
cens
nsns
nsns

1LN
:
TA
BL
E 4
-ESu
mm
ary
of C
hang
e In
Val
ues
for
the
Soci
al W
ork
Val
ues
Tes
t (Pa
rt I
I: V
alue
s 6-
10)
Sec
ulao
smvs
.R
elig
iosi
ty
Sel
f-D
eter
mon
osm
vs.
Fa
tahs
m
Pos
t lov
eS
atis
faci
ron
vsS
trug
gle-
Der
vial
Soc
ial P
rote
chon
vs.
Soc
tal
Rem
Oun
on
Irm
ovab
on-
Cha
nge
vs.
Tra
thho
nalo
sm
Tot
alS
core
Cyc
le I
IG
reat
er C
hang
eA
ccel
erat
edA
ccel
erat
edA
ccel
erat
edT
radi
tiona
l.A
ccel
erat
edA
ccel
erat
edL
evel
of
Sign
ific
ance
nsns
nsns
nsns
Cyc
le I
IIG
reat
er C
hang
eT
radi
tiona
lA
ccel
erat
edT
radi
tiona
lT
radi
tiona
lT
radi
tiona
lT
radi
tiona
lL
evel
of
Sign
ific
ance
nsns
nsas
asns
Cyc
le I
VG
reat
er C
hang
eT
radi
tiona
lT
radi
tiona
lT
radi
tiona
lT
radi
tiona
lT
radi
tiona
lT
radi
tiona
lL
evel
of.
Sign
ific
ance
nsns
nsas
nsns
Cyc
les
III-
IVC
ombi
ned
Gre
ater
Cha
nge
Acc
eler
ated
Acc
eler
ated
Acc
eler
ated
Tra
d6on
alT
radi
tiona
lT
radi
tiona
lL
evel
of
Sign
ific
ance
nsns
nsns
nsns

longer z istically significant The decline in values among acceleratedstudents was modest, as was the gain of traditional students. Thus theirvalues became more alike by the end of training and the differences be-tween them at that point were no longer statistically significant.
In summary, we have speculated about but do not know why the valuesof social work students did not show change in the expected direction onthe Social Work Values Test_ Traditional students showed very modestgains in values, and accelerated students, very modest losses. Com-parisons of change in values for each of the three cycles and for all of thecycles combined showed no statistical difference in the values of eithergroup,
PRACTICE SKILL ASSESSMENT INSTRUMENT
The Practice Skill Assessment Instrument (PSAI) is divided into five'sections: community, agency, student, client, and casework. Supervisorsrated students' skills at the start and at the end of the study period. Unlikethe instruments measuring foundation knowledge and values, the PSAIdoes not have any one summary measure for all 57 items. This only can beobtained by averaging all of the scores. Later we will make limited use ofsuch a measure_ Our primary unit of discussion is each section of thePSAI, and changes in practice skill are discussed for each of the five. Abrief overview, which appears below, may be helpful before discussing thefindings in greater detail.
The practice ratings for both accelerated and traditional studentsshowed positive change in all items from the start to the end of their train-ing. Generally, more improvement was shown in the ratings of acceleratedstudents. For individual items in each 7.ycle these differences were rarelystatistically significant. When the cycles were combined and the number ofstudents much larger, the differences in improvement were more likely tobe statistically significant.
At the start of training the ratings of traditional students were generallyhigher than those of accelerated students. As a summary measure, wecomputed an average of the average ratings. At the start of training it was4.95 for traditional and 4.05 for accelerated students, a sizable difference.Furthermore, in 35 of 57 comparisons for Cycles II, III, and IV combined,the difference was statistically significant at the .05 level. Thus acceleratedstudents started fieldwork at a decidedly lower level than did traditionalstudents.
By the end of training the findings were quite different. By then acceler-ated students had caught up with traditional students. Indeed, on someitems they had surpassed them. At the end of training, for the combinedcycles the average of the averages was 6.97 for traditional students and6.95 for accelerated students. The average difference for each item haddecre.ased to only .02. The ratings of traditional students were higher on 27
52

of the 57 items. On 19 items, accelerated students had higher ratings. (Weclassified I I differences as ties, since the means were .05 or less apart fromeach other.) in only 2 of the 57 items was the difference in ratings statis-tically significant. On one item the rating of traditional students was high-er, on the other, the rating of accelerated students was higher.
What happened was obvious. Roth accelerated and traditional studentsimproved their ratings. Accelerated students, however, showed muchmore improvement. This was true for all 57 items. Furthermore, on 24items when the cycles were combined, the change in ratings was statis-tically significant at the .05 level.
In the live summaries presented below, we shall report the findings for
each of the three cycles.
Community Items
The ratings for the three cycles and four community items of the PSA1yielded 12 comparisons between the change scores of accelerated and tra-ditional students. Table 4-F shows that accelerated students registeredgreater positive change for all 12 comparisons, with two of the differencesstatistically significant at the .05 level. When the cycles were combined,accelerated students showed greater positive change for all four com-parisons, three of which were statistically significant.
At the start of training, traditional students received higher ratings onall of the items for each of the cycles (see Tables 4-28 through 4-31). Atthe completion of training, the ratings of accelerated students were higheron 7 of the 12 comparisons. The greater improvement by the acceleratedstudents permitted them to close the gap between themselves and tradi-tional students.
I n short, by the end of the study the accelerated students showed greaterimprovement on all items for all cycles. These improvements had the
effect of cancelling out initial differences that had existed between the twogroups.
Agency Items
Items 5-11 deal with the fieldwork agency. Table 4-G contains a sum-mary of changes in the ratings of these items. The three cycles and sevenagency items of' the PSAI resulted in 21 comparisons between the changescores of accelerated and traditional students. For 17 of the 21, the ac-celerated students showed greater positive change than did the traditionalstudents, with the differences for Items 7 and 8 statistically significant.
When the three cycles were combined, there were 7 comparisons be-tween the change scores of the two groups. For each of the 7, the acceler-ated students showed greater positive change, with Items 7 and 8 again sta-
tistically significant.
53

TA
BLE
4-F
Sum
mar
y of
Cha
nge
in P
ract
ice
Ski
llfo
r C
omm
unity
item
s (1
-4)
item
ttem
2ite
m 3
?tem
4
Cyc
le H
Gre
ater
Cha
nge
Acc
eler
ated
Acc
eler
ated
Acc
eler
ated
Acc
eler
ated
Lev
el o
fSi
gnif
ican
cens
nsns
Cyc
le 1
11.
Gre
ater
Cha
nge
Acc
eler
ated
Acc
eler
ated
Acc
eler
ated
Acc
eler
aied
Lev
el o
fSi
gnif
ican
cens
nsns
nsC
ycle
IV
Gre
ater
Cha
nge
Acc
eler
ated
Acc
eler
ated
.Acc
eler
ated
Acc
eler
ated
.L
evel
of
Sign
ific
ance
<05
ns<
.05
fls
Cyc
les
IIPV
'Com
bine
dG
reat
er C
hang
eA
ccel
erat
edA
ccel
erat
edA
ccel
erat
edA
ccel
erat
edL
evel
, of
Sign
ific
ance
<,0
5ns
<.,.
05<
.05

TA
BLE
4.G
Sum
mar
y of
Cha
nge
in P
ract
ice
Ski
Hto
r A
genc
y 'it
ems
(SA
11.
:4Ia
m, 6
Rem
7/te
rn8
llern
9ite
m1
Cyc
icG
reat
er C
hang
eT
rad.
Tra
il,,
Acc
el.
Tra
d..
Acc
el.
Tra
d.,
'Lev
el o
fSi
gnif
ican
ceus
nsns
Cyc
le I
IIG
reat
er .C
hang
eA
cceL
.A
ccet
Aci
::0.
Acc
el...
Acc
el.
Acc
el.
Acc
eLL
evel
of
Sign
ific
ance
usns
:n.
:4ns
usns
usC
ycle
IV
Gre
ater
Cha
nge.
Acc
el.
Acc
el.
Ace
d.A
ccel
.A
cced
..A
ccel
..A
ccel
.L
evel
of
Sign
ific
ance
nsus
<.0
5<
A3.
5us
ns.n
sC
ycle
s II
IVC
ombi
ned
Gre
ater
Cha
nge
Acc
et.
Acc
eLA
ccel
..A
ccel
.A
ced.
.A
ced.
.A
cceL
.L
evel
of
Sign
ific
ance
usus
<.0
5<
.05
nsns
.15

At tho start of the study, the ratings of traditt nal students were higher
on 19 of 21 comparisons, only 3 of which were statistically significant (see
Tables 4-32 through 4-38). By the completion of the study, differences in
the ratings of accelerated and traditional students were minor. Only the
difference for Item 8 was statistically significant, where the rating of ac-celerated students was higher (see Table 4-35). Thus the ratings of ac-
celerated students showed marked improvement on the agency items. For
all three cycles combined all of the change ratings were higher for acceler-
ated students.In short, accelerated students consistently showed grea er improvement
on agency items than did traditional students. Generally, a comparison ofimprovement in ratings for both groups on each of the three cycles was not
statistically significant. When the cycles were combined, on 2 of the 7items the differences in improvement were statistically significant.Clearly, by the end of training there was little difference of any conse-
quence on the agency items between accelerated and traditional students.
Student Items
items 12-20 deal with the performance ratings of students in fieldwork,The summary of findings for these items appears in Table 4-1-1. The nine
stud,Nit items of the PSA1 for each of the three cycles yielded a total of 27comparisons in the amount of change shown by accelerated and traditionalstudents during the training period. For 23 of the 27 comparisons the ac-
celerated students showed greater increments in skill ratings than did thetraditional students. None of these differences was statistically significant.
Only when the cycles were combined did three of the comparisons reach
the .05 level of statistical significance. In each instance the improvement
in ratings of accelerated students was larger.At the start of the study for the combined cycles, traditi nal students re-
ceived higher ratings for seven of the nine items at the .05 level of statisti-
cal significance (see Tables 4-39 through 4-47). initially their skill in these
fieldwork items was judged as superior to that of accelerated students. At
the end of the study. the ratings of traditional students were still higher on
eight of the nine items. The differences in the ratings for all nine items,
however, were no longer statisti:zally significant.In short, the findings of Items 12-20 showed a distinct trend. Acceler-
ated students improved more than did traditional students in each of the
Accelerated students, however, started from a decidedly lowerbaw Ily the end of their education there was no statistically significant dif-
ferem.e between the groups although the ratings of traditional studentstended to be higher on eight of nine items.
56

TA
BL
E 4
-HSu
mm
ary
of C
hang
e in
Pra
ctic
e Sk
il!fo
r St
uden
t ite
ms
(t 2
-20)
nem
12
item
13
Item
14
item
15
Item
16
Hem
17
Cyc
leG
reat
er C
hang
eA
cceL
AC
Cel
.A
ced.
.A
rca
Acc
el,
Acc
ei.
Acc
el..
Acc
eLT
rad
Lev
el o
fSi
gnif
ican
cens
11.S
nsns
nsns
nsils
MIS
Cyc
le ii
iG
reat
er C
hang
eL
evel
of
Sign
ific
ance
Acc
ei.
ns
Tra
d,
ns
Ace
d..
ns
Acc
O.
ns
,Acc
a.
ns
Ace
d.
ns
Ace
d..
ns
Acc
el..
ns
Acc
ek
ns
Cyc
le I
VG
reat
er C
hang
eT
rad.
.A
cceL
Ace
d.T
raci
,.A
ced,
Ace
d.A
ccel
,.A
ccd,
Acc
el.
Lev
el o
fc
Sign
ific
ance
nsns
nsns
nsT
ISnS
TIS
ns
Cyc
les
llIV
Com
bine
dG
reat
er C
hang
eA
ccel
..A
cceL
Acc
eLA
ced.
Ace
d,A
cteL
Ace
d,.
.Acc
el.
Acc
el,
Lev
el o
fSi
gnif
ican
cens
ns<
.05
"
nsns
<.,0
5<
,05
nsns

Client ItoItems 21-38 deal with client items. The summary of the results for these
items appears in Tables 4-1 and 4-1. For the 18 client items, a total of 52comparisons were possible regarding differences in ratings from the startto the end of training for accelerated and traditional students.4
Of the 52 comparisons, 49 showed higher increments in the ratings ofaccelerated students. Of the 49 higher ratings, only 4 were statistically sig-nificant at the .05 level. Clearly there was a strong trend for the ratings ofaccelerated students to show greater increments than for traditional stu-dents. In most instances, however, the differences were not statisticallysignificant.
When the cycles were combined, accelerated students showed greaterincrements on all 18 items, and 8 of these were statistically significant atthe 05 level. At the start of training, the combined ratings of the cycleswere higher for traditional students on all 18 comparisons, 14 of whichwere statistically significant. (See Tables 4-48 through 4-65.) The ratingsof accelerated students increased more than did those of traditional stu-dents. Thus by the end of the training period the ratings of traditional stu-dents were higher on 11 items, only 1 of which was statistically significant.For the other 7 items, the ratings of accelerated students were higher.
Casework Items
Items 39-57 dealing with casework complete those FSAI items used in(his study. The 19 casework items for the three cycles resulted in 55 com-parisons between accelerated and traditional students. The summary ofthe casework items appears in Tables 4-K and 4-L.
For 51 of the 55 comparisons the change scores of accelerated studentswere higher. Only two of the differences were statistically significant at the.05 level. For both of these, Items 39 and 44 in Cycle IV, the improvementof accelerated students was higher than that of traditional students.
When Cycles 11IV were combined, the improvement in the ratings ofaccelerated students was higher on all 19 comparisons, 7 of which reachedthe .05 level of statistical significance.
At the start of the study, far each of the 19 items'the ratings of tradi-tional students for Cycles IIIV combined were always higher than thoseof accelerated students (see Tables 4-66 through 4-84). On 7 of these 19items, the differences between them were statistically significant at thestart of training. By the end of the training period, the differences betweenaccelerated and traditional students were no longer statistically significant.For 11 of the 19 comparisons at the end of training, the ratings of acceler-ated students were slightly higher.
58
6 9

TA
BLE
4-1
Sum
mar
y at
Cha
nge
in P
ract
ice
Ski
llfo
r C
lient
Item
s (2
1-29
)he
m21
Hem
22
hem
23ire
m 2
4he
m25
Hem
26
hem
27
hem
26he
m29
Cyc
le II
Gre
ater
Cha
nge
Leve
l of
Sig
nific
ance
Acc
el.
Acc
el..
Acc
el.
Acc
el.
Acc
el,
Acc
eLA
ced.
Acc
el.
Ace
d.
nsns
<.0
5ns
nsns
ns-
ns.
ns
Cyc
le il
lG
reat
er C
hang
eA
ced.
Ace
d.A
ced.
Acc
el.
Acc
el.
Acc
eLA
ced.
Acc
el.
Acc
el.
Leve
l of
...1
Sig
nific
ance
.ns
<.0
5ns
nsns
nsns
nsns
CC
ycle
1V
Gre
ater
Cha
nge.
Acc
el,
Ace
d..
Acc
el.
Tra
ctA
ccel
.T
rad
Ace
d.A
ccei
,A
ccel
.Le
vel o
fS
ignf
fican
cens
nsns
nsns
.11S
nsns
ns
Cyc
les
II-11
.11
Com
bine
dG
reat
er C
hang
eA
ccel
.A
ccel
.A
ccel
.A
cceL
Acc
eLA
ced.
Acc
eLA
ced.
Acc
el.
Leve
l of
Sig
nific
ance
.<
.05
<..0
5ns
nsns
ns<
.05
<.0
5ns

TA
BLE
4-J
Sum
mar
y of
Che
in P
ract
ice
Ski
llfo
r C
lient
item
s (3
0-38
)ite
m 3
0'ite
m 3
1ite
m 3
2H
em 3
3fia
m 3
4Ite
m'5
item
36
item
37
item
38
Cyc
le I
IG
reat
er C
hang
eA
ccel
.A
cre!
.A
ced,
Acr
el.
Acr
e!.
Tro
d.A
cre!
.A
ccel
.L
evel
of
Sign
ific
ance
nsns
osns
nsns
nsn.
s
Cyc
le I
IIG
mat
er C
hang
eA
ccel
.A
ced.
Ace
d.A
ccel
.A
ccel
.A
ced.
Acr
e!.
Acc
el.
Lev
el o
fSi
gnif
ican
ce<
.05
<.0
5ns
nsns
nsns
ns
Cyc
le I
VG
reat
er C
hang
eA
ccel
..A
ccel
.A
cre!
.A
ccel
.A
ccel
.A
ccel
.A
cre!
.A
ccel
..A
ccel
.L
evel
of
Sign
ific
ance
nsns
nsns
nsns
nsns
Cyc
les
llIV
Com
bine
dG
reat
er C
hang
eA
ced.
Acr
e!.
Acr
e!.
Acc
el.
Acc
el.
Acc
el.
Acc
el.
Ace
d.A
ced.
Lev
el o
fSi
gnif
ican
ce<
.05
<.0
5<
..05
nsns
nsns
<.0
5ns

TA
BLE
4-K
Sum
mar
y of
Cha
nge
in P
ract
ice
Ski
llfo
r C
asew
ork
item
s (3
9-47
)H
em39
nem
4OH
em 4
1H
em 4
2Ite
m 4
3H
em 4
4H
em 4
5H
em 4
6H
em 4
7
Cyc
le. I
IG
reat
er C
hang
eA
cccl
,A
cceL
Acc
eLA
ced.
Ace
d,.
Acc
el.
Acc
eLA
ccel
.A
ccet
,L
evel
of
Sign
ific
ance
nsns
nsns
TIS
nsns
nsns
Cyc
le 1
11'G
reat
er C
hang
eA
ccel
.A
ced.
Acc
el.
Acc
el..
.Nce
el.
.Acc
el.
Ace
d.A
ced.
Acc
el.
Lev
el o
fSi
gnif
ican
cens
nsns
Ins
ns11
Sns
nsnS
Cyc
le w
Gre
ater
Cha
nge
Ace
d.A
ccel
,A
ced.
Acc
el.
.Acc
el.
Ace
d.A
ced.
Acc
el.
Ace
d..
Lev
el o
fSi
gnitA
canc
e<
.05
nsns
nsns
<..0
5as
nsns
Cyc
les
itIV
Com
bine
dG
reat
er C
hang
eA
ced.
Ace
d..
Ace
d.A
cceL
Ace
d.A
ced.
,A
cceL
Ace
d.A
ced.
,L
evel
of
Sign
ific
ance
.<
;05
<.0
5<
.05
ns<
.05
<..0
5<
..05
ns<
.05

TA
BLE
4-L
Sum
mar
y of
Cha
nge
inP
ract
ice
Ski
llfo
r C
asew
ork
Item
s (4
8-57
)te
m 4
8H
em 4
9H
em 5
0H
em 5
1he
m 5
2ite
m 5
3Ite
m 5
4ite
m 5
5Ite
m 5
6ite
m 5
7
Cyc
le I
lG
reat
er C
hang
eT
rail.
Tra
d.A
ccel
.A
ccel
.A
ccel
.A
ccel
.A
cceL
Acc
eLL
evel
of
Sign
ific
ance
nsns
nsns
nsns
nsns
Cyc
le I
IIG
reat
er C
hang
eA
ced.
Md.
.A
cceL
Acc
eLA
ccel
.A
ccel
.A
ced'
.T
rad.
Acc
eLA
ced.
"
....I
Lev
el o
fC
....;
Sign
ific
ance
nsns
nsns
nsns
nsns
nsns
Cyc
le I
VG
reat
er C
hang
eA
ccel
..A
ced.
Ace
d.A
ced.
Ace
d..
Acc
el.
Acc
ei.
Ace
d..
Acc
el..
Ace
d,L
evel
of
Sign
ific
ance
nsns
nsns
nsns
nsns
nsns
Cyc
les
IIIV
Com
bine
d.
Gre
ater
Cha
nge
Ace
d.A
ced.
Ace
d.A
ced.
Ace
d..
Ace
d,A
ced.
,A
ced.
Ace
d,.
Ace
d.L
evel
of
Sign
ific
ance
nsns
nsns
nsns
nsns
nsns

Once agsin the same pattern already noted in the preceding tables oc-curred. For each of the cycles the accelerated students received lower rat-ings at the start of training. During the course of fieldwork training theircasework ratings rose more than those of traditional students. Conse-quently the differences between both groups were negligible by the end oftraining.
In summary, this chapter contains data on changes in the students'foundation knowledge, values, knowledge of practice, and practice skills.These findings based on before-and-after measures constituted the core ofthe evaluation. The next chapter deals with two other kinds of data:heeducational background of students and their practice skill one year aftergraduation.
NOTES
Therefore th rlts il this test will not be used in evaluating the effect of acceleratededucatwn 1:he findings are presented because ol their genzral interest to social workers.
2, llenry J. Nteyer and Donna L. McLeod, "A Study of the Values of Social Workers, mHelumoral ,Soeuce lot £o,ul Iforkers- ed. Edwin Thomas (New York: Free Press, 1967).
3, Alfred Kadushin, "Testing the Discriminatory Capabilities of a Series of EvaluationMeasures As Applied to a Program of Social Work Valuation, mimeographed (Madison,Wis.: University of Wisvonsin School of Social Work. 1968/.
4. Comparisons for Cycles Hand III of Item 35 were not possible. This item deals with thestudents' preparation of the client for termination. Because the ratings were made so soonafter the start of fieldwork, it was not possible to rate six or more students. Findings basedon less than six students were not reported in this study. Thus only 52 comparisons were re-ported
5, Two tomp irisons had less than six subjects . so that thisc linding.s WLrL not reported,
7 4
63

Chapter 5
Educational Background and
Practice Skill One Year After Graduation
by Aaron Rosenblatt
Some faculty voiced serious doubts about the value of accelerated pro-grams even before any of them were in operation. Primarily they fearedthat such programs might become unduly "vocational." They assumedthat a strong liberal arts background was needed for the successful practiceof social work. They feared undergraduate courses in social work would beunduly technical and that students enrolled in an accelerated programwould be less well-prepared in the liberal arts than were the traditional stu-dents.
They felt that other possible defects of accelerated education might notbecome visibie immediately. At the point of graduation students in bothprograms might appear to be equivalent in their performance. Yet acceler-ated students might be less well-prepared to move ahead in their practice.Or a decay effect might be operating among them. In other words, the lossof a year of education might have a negative effect that would become ap-parent only at some future point. To examine these possibilities, a deci-sion was made to conduct a follow-up study of accelerated and traditionalstudents after they had graduated and entered practice.
In this chapter we present data that bear upon two questions:
I_ Were there differences in the academic and educational background ofstudents enrolled in the accelerated and traditional programs?
2.Did accelerated and traditional students differ in their practice oneyear after graduation?
64
75
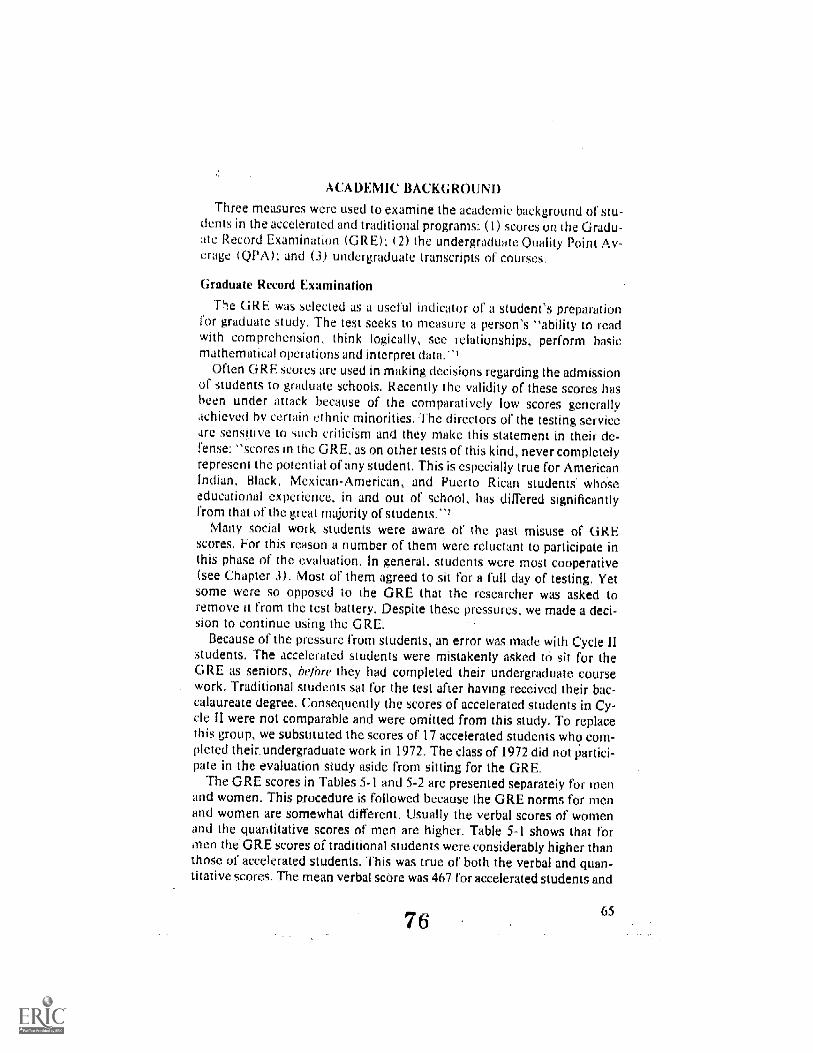
ACADEMIC BACKGROUND
Three measures were used to examine the academic background of stu-dents in the accelerated and traditional programs: (1 ) scores on the Gradu-ate Record Examination (GR E) ; (2) the undergraduate Quality Point Av-erage (QPA); and (3) undergraduate transcripts of courses.
Graduate Record Examination
The GRE was selected as a useful indicator of a student's preparationfor graduate study. The test seeks to measure a person's -ability to readwith comprehension, think logically, see relationships, perform basicmathematical operations and interpret data."'
Often ORE scores are used in making decisions regarding the admissionof students to graduate schools. Recently the validity of these scores hasbeen under attack because of the comparatively low scores generallyachieved by certain ethnic minorities. The directors of the testing serviceare sensitive to such criticism and they make this statement in their de-fense: "scores in the GRE, as on other tests of this kind, never completelyrepresent the potential of any student. This is especially true for AmericanIndian, Black, Mexican-American, and Puerto Rican studentS whoseeducational experience, in and out of school, has differed significantlyfrom that of the great majority of students.",
Many social work students were aware of the past misuse of GREscores, For this reason a number of them were reluctant to participate inthis phase of the evaluation. In general, students were most cooperative(see Chapter 3). Most of them agreed to sit for a full day of testing. Yetsome were so opposed to the GRE that the researcher was asked toremove it from the test battery. Despite these pressures, we made a deci-sion to continue using the GRE.
Because of the pressure from students, an error was made with Cycle IIstudents, The accelerated students were mistakenly asked to sit for theGRE as seniors, kfore they had completed their undergraduate coursework. Traditional students sat for the test after having received their bac-calaureate degree. Consequently the scores of accelerated students in Cy-cle 11 were not comparable and were omitted from this study. To replacethis group, we substituted the scores of 17 accelerated students who com-pleted their.undergraduate work in 1972. The class of 1972 did not partici-pate in the evaluation study aside from sitting for the GRE.
The GRE scores in Tables 5-1 and 5-2 are presented separately for menand women. This procedure is followed because the GRE norms for menand women are somewhat different. Usually the verbal scores of womenand the quantitative scores of men are higher. Table 5-1 shows that formen the GRE scores of traditional students were considerably higher thanthose of accelerated students. This was true of both the verbal and quan-titative scores. The mean verbal score was 467 for accelerated students and
76 65

550 tor traditional students, a dillerence of 83. The standard error of themean was 32. The mean quantitative score was 40'(.. for accelerated stu-dents and 470 for traditional students, a difference of 62.
TABLE 5-1GRE Scores for Males
Students VerbalScore
PercentileRank
QuantitativeScore
PercentileRank
AcceleratedTraditional
Difference
467550
83
3964
408470
62
15
28
.2-; of the women were much closer than those of the men. Ta-ble 5-2 shows that the verbal score was 510 for accelerated students and555 for traditional students, a difference of 45 points, The quantitativescores were much more similar: the average score was 404' foracceleratedstudents and 411 for traditional students, a difference of only 7 points,
TABLE 5-2GRE Scores for Females
Students Verbal Percentile Quantitative PercentileScore Rank Score Rank
Accelerated 41 510 48 404 29
Traditional 35 555 61 411 31
Difference 7
In short. tor both men and women the verbal and quantitative scoreswere higher for traditional students. The differences on the verbal testwere sizable for both males and females, and on the quantitative test, formales only. On the basis of the CiRE_scores, we must conclude that tradi-tional students' preparation for graduate study was superior to that or ac-celerated students_
()unlit!, Point Average
A second measure of the students' academic background was theirQuality Point Average (QPA). The QPA is obtained by assigning a ratingof 4" to a letter grade of a rating of "3 to a letter grade of -B,"and so on_ The number of credits for each course is multiplied by the rat-ing and the scores are then added together. To obtain the QPA, the totalscore is divided by the total number of credits. The results were as follows:
66
7 7

he QPA was 3.41 for accelerated students and 2.73 for traditional stu-lents. Thus the QPA of accelerated students was much higher than that ofraditional students (p < .05). These results were not consistent with thosethtained from the CHU.
There is little point in speculating at length about the reasons for this in-:onsistency even though it is tempting to do so. Usually a researcher has'ew chances to indulge his fancy. Most of the time he is a drudge trying to:lean up a mass of data.
The plain fact is this; data are not available that would enable us to.hoose between several rival explanations whose implications would be:mbarrassing for others. Therefore we will confine ourselves to pointingiut only one obvious explanation: the GRE and the QPA measure differ-:nt abilities.
Students who earn higher grades do not necessarily acquire more infor-nation. In all likelihood they are skilled in the arts of -impression man-gement." Those technically accomplished in these arts may haveiolished their skills because they are less endowed than high GRE scorersvith the -ability to think logically and perform basic mathematical opera-ions and interpret data." In a more perfect world the scores of the GREnd QPA would be highly correlated. In this world, at this time, it is proba-ly sensible to recognize the difference between the two measures andlake use of both.
indergraduate Courses
We anticipated that accelerated students would have enrolled in moreocial and behavioral science courses, since to graduate as a social welfaretajor they had to complete a number of courses in that department. Also,ecause of their interest in social welfare, one would expect them to electdditional courses in the social sciences,The findings in Table 5-3 show little difference between accelerated and
.aditional students in the number of,courses that they had completed inte social and behavioral sciences. The mean number of courses was 11.98)1- accelerated and 12.19 for traditional students. Another way to view theata is to assume that the average student completes 10 courses a year or0 courses in his four years of college. Then the proportion of social andehavioral courses was .30 for accelerated students and .31 for traditionaludents.The major difference between the Students was in the courses in which
ley enrolled, not in the number. Traditional students were much morekely to enroll in psychology courses than accelerated students: a mean of57 to 3.42. Accelerated students, however, were much more likely totroll in sociology and anthropology: a mean of 6.11 to 5.05. This differ-Ice in course selection may have reflected differences in the course re-lirernents needed for graduation among the two groups. In our opinion,
78 67

TABLE 5-3Student Enrollment in Undergraduate
Courses in the Social and Behavioral Sciences
Course
;Accelerated Studon Traditional Studeofs (NNumbef ofCourses
Number ofCourses
Mean
Psychology 161 3.42 279 4_57
Sociology 217 4.62 4.13
.Anthropologv 70 1 49 56 0.92
nomics 1_13 80 1.31
Politics andGovernment 1.32 77 1.26
Total 563 11.98 744 12.19
both accelerated and traditional students were equally well-preparjudged by the number of social and behavioral science courses in whichthey enrolled. No invidious comparisons were warranted about the greatervalue of psychology or sociology coursesboth are valuable.
In summary, accelerated and traditional students were somewhat differ-ent in their academic and educational backgrounds. For males, the GREscores of traditional students were decidedly higher than 1.1ose of acceler-ated students. The differences in the GRE scores for women were less pro-nounced, Nonetheless, the differences ran in the same direction as did thescores for men. Clearly, the OR E scores of traditional students were high-
er. The results of the GRE, however, were not consistent with the QPA,since the QPA of accelerated students was considerably higher than that oftraditional students,, Both groups of students enrolled in approximately the same number ofcourses in the social and behavioral sciences. The average accelerated sw-dent enrolled ir 12,0 courses and the average traditional student in 12.2courses. The major difference was that traditional students were morelikely to enroll in psychology courses and accelerated students in sociologyand anthropology courses.
The findings were clear. The interpretation, however, was not. Since thefindings showed differences in ORE and QPA, different interpretations ofdata were possible. In our view, the differences observed in the students'academic and educational background were of limited importance. Moreimportant than the differences was the marked similarity of the students,which should not be discounted because we were intent on finding differ-ences. Specifically we mention the following: all of the students in bothgroups were college graduates:, all of them were interested in pursuing acourse of graduate study: all of them sought training in the same profes-sion-, and all had similar backgrotaid characteristics (see Chapter 3). Dif-
8
79

ferences in the two groups have been idertilied. The importance of thesedifferences, not their statistical sgnificanee is questioned
PRACTICE SKILL OE YEAR AFTL',.-
The follow-up researn on sludJms° practice followingtheir first year of work experience as full-fler!gett''_,04-,af w`:likers called forcertain strategies. Each aceelerated ano tradif,onui student was informedbeforehand about the nature and purpose of the one-year-after study.They were told that their future supervisors would be asked to complete aslightly different versioh or the PSAI. The students themselves were askedto notify the school of any change in their address. In this way they cou!-.1be reached when the time came to secure their consent in order to contacttheir new field instructors_ Marianne Welter designed the following pro-cedures to obtain optimal results in the data collection:
I. Each fall. shortly before the completion of their first year or full-timework, students were sent a letter reminding them of the importance ofthe follow-up. They were asked to give consent so that their currentsupervisors could be contacted,
2.A follow-up letter was sent to studen s who failed to reply. Also, at-tempts were made to telephone them. If these attempts failed a thirdset or letters was sent out.
3. Additional efforts were made to trace the students whose whereaboutswas unknown. Sometimes this extra detective work- succeeded inreestablishing contact with them.
4. After permission was received, a letter was sent to each supervisor.This letter was designed to enlist the supervisors interest and-o-operation. In addition, detailed instructions were included aboutht.:w to complete the enclosed PSA1 questionnaire.
5.Telephone calls were made for the purpose of further motivating thesupervisors. These calls also served to improve their understanding ofthe PSAI and to answer any questions about it.
Despite these efforts, data on the performance of 17 students were notavailable for this last phase of the study. Table 5-4 shows that 85 percent ofthe students took part in the one-year-after study. The following reasonsaccounted tbr the attrition: the address of 6 students was unknown; threesupervisors failed to return the HAI form; and 8 students worked-withoutany supervision or their supervisors were not sufficiently famiiiar withtheir practice_
The items used to examine practice skill one year after graduation weresomewhat different from those used in the PSAL Changes in the PSAItems were necessary because the students had graduated and become
social workers. Their performance now had to be judged against that of
69

TABLE 5-4Reasons for Attrition in the One-Year-After S udy
Reasons AcceleratedStudents
TraditionalStudents
Total
Address unknow _ 2 4
Supervisor did 1101return I orm 1
Lack of practicesupervision 8
Total 12 17
Participank inone-year-after St
other social workers and the items had to reflect their change of status. Indeveloping this one-year-after instrument it was necessary to drop a fewitems and to add three new ones. In this chapter the items are grouped to-gether for purposes of analysis in the same way as those comprising thePS Al.
Table 5-5 compares the ratings for community items of accelerated andtraditionally trained social workers. Only Item 2 showed a difference be-tween the two groups that was statistically significant. The ratings of tradi-tionally trained social workers however were somewhat higher for three ofthe four items.
TABLE 5-5Community Items One Year After
Students Mean StandardDeviation
1-TestValue
Level ofProbability
em Accelerated 42 6.71 1.52Traditional 43 7.16 1.46 1.6960 ns
Itern 2 Accelerated 42 7.07 1.44Traditional 44 7.52 1.11 --2.2233 .05
Item 3 Accelerated 39 5.87 2.33Traditional 43 5.84 2.03 0.1502 ns
Item 4 Accelerated 41 7_02 1.56Traditional 45 7.09 1.66 0.3727 ns
Table 5-6 compares the ratings for the seven agency items. For five ofthe seven, the ratings of traditionally trained social workers tended to behigher, but the differences were not large enough to be statistically signifi-cant.
70

TABLE 5-6Agency Items One Year After
Students Mean StandardDeviation
t-TestValue
Level ofProbability
Item Accelerawd 42 7.40 1.15Traditional 45 7.69 -1_6299
tem t) celerated 4) TOO I 45Traditional 45 7.40 . 1.40 1.63 68
cm 7 Accelerated 41 6.49 1.66Traditional 45 6.58 1.69 -0.3787 ns
Accelerated 47 6 88 1_74
Traditimial 45 7.18 1.56 -1.2146 nstent 9 Accelerated 42 7.62 1 58
1 radmonal 45 7.44 1.47 0.0715 11S
lem 10 Accelerated 42 7.52 1.25Traditional 45 7.49 1.59 0.3660 us
tem 11 Accelerated 42 6.69 1.60Traditional 45 7.04 1.46 -1.5036 11S
-able 5-7 compares the ratings for the nine social worker items. None ofthe 1ilTerences between the two groups was statistically significant. But thesame trend was evident here s- in the two previous tables. For eight of thenine nems the ratings of traditionally trained social workers were,- higher.
Table 5-8 compares the ratings for the 18 client items. Only owe. of thesewas statistically significant, Item 37. For 16 of the 18 items the ratings oftraditionally trained social workers were higher.
Table 5-9 compares the ratings for the 15 casework items. Only one ofthese was statistically significant, Item 39. Once again, the same generalrend was noted. For 12 of the 15 items the ratings of traditionally trained
wockers were higher.summary the ratings of accelerated and traditionally trained social
workers showed a consistent trend after they had been in practice for oneyear. For most of the items the differences between the two groups weregenerally small_ Rarely were they statistically significant. For example, Ta-bles 5-5 through 5.9 present the findings on 53 separate items. Of these,only 3 (Items 2, 37, 39) were statistically significant at the .05 level. If thelevel of analysis was item-by-item, the difference in ratings of both groupsappeared generally insignificant,
When the overall pattern of the items was examined, however, it waspossible to arrive at a different view. Table 5-10 is a summary table. It con-tains the Average Rating of the Individual Items (ARID that relate to per-
71
B2
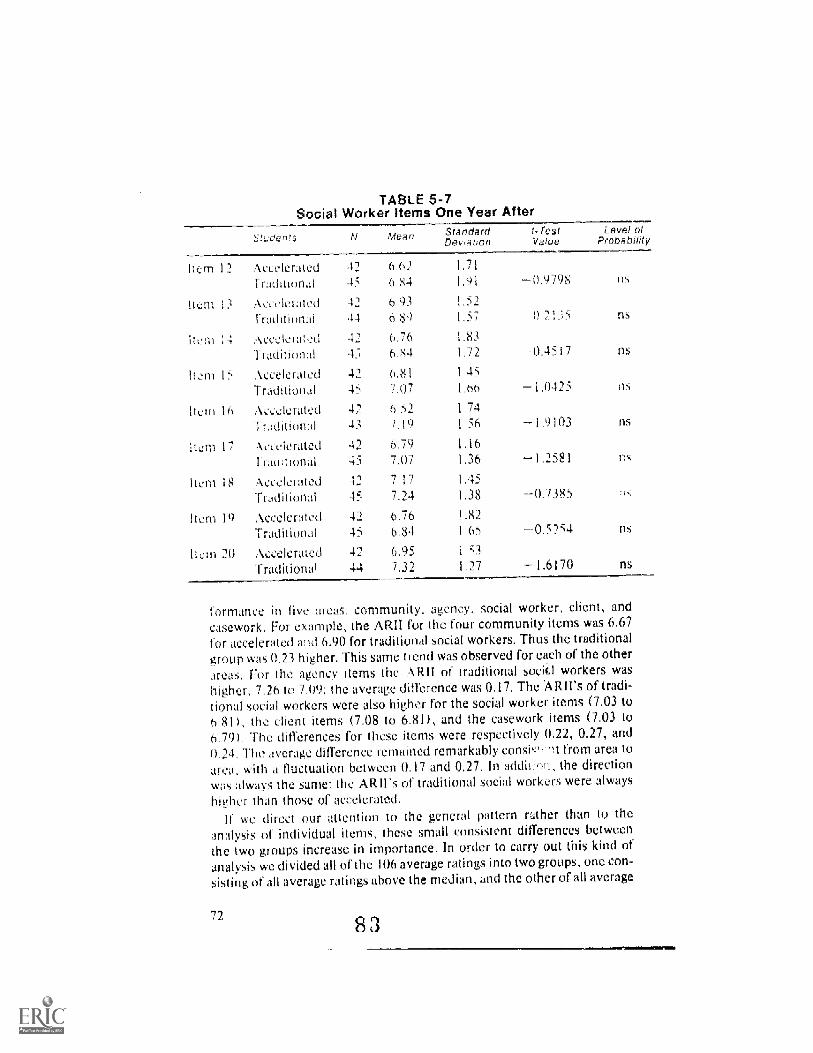
TABLE 5-7Social Worker Items One Year A ter
Students N Aean StandardDe),,a 1,0n
t-restValue
Level ofProbability
kern 12 Accelerated 4/ 6.61 1.71
1 radifional 6.84 9798
hem 1, Acceleraled 41 6 93 1.52
1 raditional 44 6.89 1.57 0 213S rIS
Item ; Acceleraied 42 6.76 1.83
radnum ii 6 84 1.72 =0.4517 [IS
Item 13 Accelerated 41 6.81 1.45
radition..il 45 7.07 1.06 -1.0425
Item 16 AO:Qlerated 42 o 1.74
1 rAnional 43 7.19 1.56 1 ns
tcni 17 Accelerated 42 6.79 1.16
raw11011:11 45 7,07 1.36 -1.2581
Item 18 Accelerated 42 7 17 1,45
Traditional 45 7.24 1.38 -0.7385
Item I Accelerated 42 6.76 1.82
-I raditional 45 6.84 1 65 -0.5154 ns
Item 20 Accelerated 4/ 6.95 1 53
Traditional 44 7.32 1.27 -1.6170 ns
formance in five areas: cornmunity agency, social worker, client, andcasework. For example, the AR11 for the four community items was 6.67
for accelerated ,r9J 6.90 for traditional social workers. Thus the traditional
group was 0.23 higher, This same trend was observed for each of the other
areas. For the agency items the AR11 of traditional socitl workers washigher, 7.26 to 7.09; the average difference was 0.17. The ARII's of tradi-tional social workers were also higher for the social worker items (7,03 to6.81), the client items (7,08 to 6.81), and the casework items (7.03 to6.79). The differences for these items were respectively 0.22, 0.27, and
0.24. The average difference remained remarkably consis!:',u from area to
area, with a fluctuation between 0.17 and 0,27. In addit:on, the directionwas always the same: the ARII's of traditional social workers were always
hivher than those of accelerated.If we direct our attention to the general pattern mther than to the
.inalysis of individual items, these small consistent differences betweenthe two groups increase in importance. In order to carry out this kind ofanalysis we divided all of the 106 average ratings into two groups, one con-
sisting of all average ratings above the median, and the other of all average
728 3

TABLE 5-8Client Items One Year After
Students w Mean .StandardOevot,nn
ISTestVa lo
Level ofProbabildy
fleni 21 Accelerated 42 6_9:( 1 511
!radi, in,11 44 7 32 I I 4 -1.635=; ns
Item 17 .Aecelerated 42 Tos 1.51
Tradon,,t1 44 7.1 I I _22 -14 Wi2 ns
ilL'Ill L; Accelerated 42 0.60 I .8.5
1 rakiitional 42 0.70 144 -( .0016 ns
lien( 24 Aceekrated 42 6.70 1.75
It..idint,ndl 44 7.09 1.44 -1,2700 ns
Item 27; At.:ce lerated 42 6.60 1.50
1 raditional 44 6.00 1.41 -0.5253 na
ltcm 2h Ack.-elertned 42 6.59 1.51
TrAitional 42 7,29 1.22 -1,5313 ns
Item 2' .Acc.(lortited 42 (1,55 1.68
Traditional 44 6.77 129 -1.1918 ns
Item 28 Accelerated 42 6,60 1.74
Traditional 44 7,02 I .28 -1 .1195 ns
Item 29 Accelerated 41 6.74 I .64
Traditional 44 6.75 1.57 -0.4484 ns
Item 30 Accelerated 42 6.60 1.59
-traditional 42 0.88 1.43 -1.0426 us
Item 31 "1 ccelerated 41 6,73 1.86
Traditnal 41 7.05 1,41 -0.9822 ns
item 32 Accelerated 42 7.24 I .45
Traditional 43 7.21 I i 0 0.4199 11S
Item 33 Accelerated 42 7.29 1.29
Traditional 42 7,19 1.52 11II_,:. ns
Item 34 Accelerated 41 6,71 1.75
Traditional 41 7.05 1.48 1..2721 ns
Item 35 AcceleratedTraditional
41
39
6,957,05
.I 8)).7002 ns
Item 36 Accelerated 39 6.54 1.86
't raditional 36 7.19 1.31 -1.1324 us
Item 37 Accelerated 42 7,31 1.75
Tradittonal 42 7.93 0,97 -2.6265 .0511cm 38 Accelerated 41 6.83 1.34
Tr iditional 42 724 1.10 -1.9490 ns
73

TABLE 5-9CTP,ework Items One Year After
Ntudents Mean StandacciDevrafion
t-TestValue
.Level ofPtu:Dability
helli 39 Accelerated1 ra010,00,a1
4048
6_60
7.131 451 .JN 2.0065 <
hem 40 Accelerated 40 6.71 1.88I:Anna-1a! 48 7.18 1.25 -1.7053
Item 41 Accelerated 40 6.88 1.64I radmonat 44 7.14 1,37 -1.0937 ns
Item 42 Acceleraicil 411 6.70 1.57Tr clitional 4_8 7.11 1.3 -1.4
Item 43 Accelerated 40 6.92 1.35
traditional 43 7.05 |2V -0.8076 ns
Item -0, Accelerated 39 6.33 1.5441 6.85 1.51 -1.5848
hem 4, 4,ccelerated 40 6:48Traditional 38 6 68 1_53 -0.4549 ns
Item 46 Accelerated 40 6.85 1.42-.Traditional 43 6.98 1.49 -0.6237 ny
47 Accelerated 40 7 OS 1.66Traditional 41 7.11 1.39 -0.6988 ns
Item 48 Accelerated 40 6.90 1,65Traditional 41 6.85 1.56 0.2967 ns
Item 49 Accei:Jated 39 7.54 1.19raditional 42 7_41 1.19 0.2589 ns
Oen-, 50 Accelerated 40 6.78 1.07Traditional 41 6.76 1.50 0:3737 11S
1tern 51 Accelerated 35 6.97 1,32Traditional 3 7.09 1.53 -0.1685
Iftm 32 Accelerated 35 6.63 1.42radwonal 33 6.94 1.48 -0,6553 115
hem 53 Accelerated 35 6.54 1.27Traditional 33 7 ()0 1.71 1,1265 !Is
ratings below. The median ratmg 1.0v he 106 average ratings was 6.94,The faiinp (int aditional 21-S were consistently higher. 01 the
53 ratings above the. median, 37 or 70 percent were those of traditionalsocial workers, and only 16 or 30 percent were ['lase of accelerated. This
74
8 5

trend was strong and cialsistent mai Ntatktically significant (p <,0)), Itshould not be oNerlooked or ignored hecause tlid not appear in an item-hy-itein analysis of the data,
oroblem interpreuno the L!tiLt becomes one of considering twotrends in regard to one of the questions to be answered by this study: Didacceietiited and traditional students differ in their practice one year aftergradt.;,.tval '1 he ansvici ,learthe students did differ. The supervisoryratings of traditional student,: yere consistently higher than those of ac-celerat,:d, ere id a small magnitude. Supervisors rated both groupson a 9-;!::::it scale and the average difference was only 0.23. ()I the .7,3;1:in.:, ow' 3 were statistically significant,
TABLE 5-10Summary Table, One Year After
AccoloratedMean
Tradli onal_
Oillerence
(I 07 (-) 0)3Ngcncy
,rker Items7 IN
i
2ta 0. 17
0 22Heim,
asev.01-k Itemfl I
0 797.0X
7 3
0 270.24
1 (nal 0.83 7.07 0_23
Once :Irak', -Itc facts are clear; and once again the data can be interpreteddifferently, fn our view thc ditlercni., do not crious doubt aboutthe value ot accelerated eduL dr. average of the averagedillererici2, one year after griadwtL. havc to be greirter than 023
9-point
NOTES
(1"1,11:' I (IN! .it ejthlafr 4(1100011)M. 19 71-
19,1,2
8 6
75

Chapter 6
Copirg with
Feeangs of h, Students'
Ixperiences in the Accelerated Program
Rr Matt
ihe tmuor cviva!uin ut celerated educali I centered around thelearning that students had acquired during thetr course of study. Asidefroni pro\ nimg quantitatixe data, they were also asked to report on theirsnhiective experiences. Riese data wer, qualitative in nature. ihrough
cussinos with decelerated studentti 440 larned allow their marorprohlems and thc xv,p,s in which they coped with them. This chapter is
ed on the personal ,ic,:ounts of studentstheir fears and anxieties thatresulted I rom havmg participated in an experimental program.
I he data tut this chapter were gathera, by talte recording group inter-views with the accelerated stwYnts. From ;971-73 three cohorts were in-ter% towed early in Nlity, the nionth hefore they graduated. Each interviewlasted tine-and-a-hall to two hours L,aaIi. the students were divided intogroups of 7 or 8 to allow each student ample opportunity to participate ac-nxely in the interview the 47 i-cclerated students who graduated, 43participated in the interxiew sessions.
Student- !-eucived assurance that their e aliments would he anonvnir,us .he did in seem worried about any breaeh of confidence, perhaps be-
cause the tii)011 ii graduate. In addition, one must also consider thatsome of them lived through a period kYhe-n prili'ssors and administrativeofficers were openly criticized and c ad h\ militant groups of stu-dents. Regardless of the reasons, the was frank and open. Stu-
7 11
7

dents named rldnIeS. rhe, were honest. Some evaluations of the piOgraflld the faculty were fayorahle others were not. They felt free to en icize
certain aspects ti the Adelphi University School of Social Work and theaccQlerated progranl .
was considerable ban er and laughter during the discussions,1 h., w seemed to ease any feelings or ;inxietv that may have resulted fromthe frank expression of opinion, For example, during the discussion stu-dents might learn for the first lime that they disagreed with one anotherabout sonie part of the program. One liked a particular course; anotherfound it a complete waste of time. In the discussion that ensued, the stu-d.,:ras often reached a consensus about certain experiences. Fhey mightdiffer on particular points, hut in general they expressed considerableagreement,
eroup inter view, students were asked to compare the acceleratedraditional program, They were asked if there was any difference in
t he two uc;tdemmc plop:this or in the two fieldwork programs. They wereilsi ;isked which aspects of the program they liked the most and which theleast, a the course of the interviews they described their relationship withboth :Li ()ups of students, and with classroom and fieldwork faculty. Much
his chapter is based on their feelings about their preparation for becom-ing social workers while they were students. Toward the end of the inter-,. Jew. they were asked to answer these two oae,lions:
I Do you feel better prepared, worse prepaNd, or equally prepared thanmost students in the traditional program?
2.1f you had to do it all over aeain, would you enroll in the accelerated;)rogram?
Flits ch,tpter is divided into three sections. In the first, we will exa inedifferences that became the basis for making invidious distinctions be-tween the iwo groups of students. In the second, we will identify mechan-isms hy which the accelerated students coped with their situation. Thesetwo sections contain primarily stusYents who grac:,:ated in 1971 and 1972.Their experience was remarkably .s.roilar. In the third section, we will re-port on the experience of the 1973 graoluates, which was quite differentfrom that of earlier graduato. We also will suggest explanations that mayA;Lotint tor these differences.
BECOMING OUTSIDERS
Accelerated students used traditional students as a positive referencegroup for making judgments about themselves. Traditional students werethe dominant group. The traditional two-year program was legitimated bypractice, usage, and the Council on Social Work Education. Acceleratedstudents had to arrive at some definition of themselves in reference to the
77
8 8

they differed I rom the dominant group.Accelerated students lacked an objective measure by which to deter-
mine hether or not their performance was equal, inferior, or superior tothat of most traditional students. Since the data in previous chapters of thisstudy were not available to them, they had to form a judgment about theirvrformance.
Generally, the first tvw cuhort of accelerated sudenls telt that tradi-tional students had received a "preferable- type of training. The socialposition of traditional students was more secure, and most accelerated stu-dents viewed themselves as inferior during the earlier phases of the pro-gram.
D lie re nces hetwcn groups in a competitive society rarely remain at a
descriptive level. Interested parties generally transform these into in-vidious comparisons. As accelerated students became aware of differencesin their education and training they quickly developed a perspective thatput them it a disadvantage, They became the "deprived' and the tradi-tional students, the "afflont,"
Accelerated students fe:, zheir "second-elass status most keenly whilethey were seniors in the undergraduate social welfare program. Everyonereferred to them as "experimental students. They thought of themselvesin this way. Consequently, they had reason to doubt that their educationvas equal to that of "regular" students enrolled in the traditional two-year
program.By the end of the program their thinking had changed. Most camr; to
think of themselves as equally competent. Indeed, a few developed a
belief that their education was superior. If granted a second opportunity,all said that they would again choose to enter the accelerated program.
We have examined the process by which accelerated students came toview themselves as outsiders. Below we identify the referents they in-voked in arriving at this perspective,
Class and Field Instruction
Accelerated students spent less time in their field placements as seniorsthan traditional students did as first-year students. The accelerated stu-dents felt deprived. One day a week in the field was "totally inadequate.-There was not "enough continuity- in their cases. Too much happenedduring the rest of the week when they were away I.-rom the agency. Also,accelerated students felt that they "did not ;,,m the placement," since itwas designed for tradidonal students who spent mo,'0 time in the field, andfield instruction was geared to their needs.
Problems in fieldwork carried over into the dassroom. To completesonic classroom assignments students 'ver:" required to report on their cx-perience with clients. A number of accelerated students had difficulty inwriting these papers. Because of their limited fieldwork they lacked suit-
78
8 9
able cases and complained :ihout a "lack o integ n" between class andfield instruction.
Lasil, some accelerated students assumed tt it their instruction in un-dergraduate courses was in some way inferior. The would have preferredto sit in the graduate classes with traditional stuCents. Only undergradu-ates were enrolled in those courses that were part of the undergraduatecurriculum. They felt that n au ii stwienis I,:arned more in graduatecourses. Thus some accelerated studms thought they "lacked as manyconcepts" as traditional students were acquirine, So in both the held andclassroom, accelerated students felt they were learning less.
ui Experien
Most accelerated students weroin itself, is not always a disadval-
M inexperience. Many of thwellare agencies belore emu:
than traditio al stuknts. Age.Hut in :his instance age was coupled.onal students had worked in social
s=2hool. The accelerated stu-dents equated greater experien(i.2 wi reatcr knowledge They failed torecognize thit some mulitional students might experience difficulty be-cause they had acquired the wrong kind of knowledge That is, they mighthave learned techniques and procedures that were considered appropriatefl public welfare but not approved by social work faculty. Accelerated stu-
dents seemed unaware that such students would have the difficult task of_inlearning the "knowledge they had gained through their earlier ex-perienee.
Accelerated students felt their lack of experience keenly. They consid-ered themselves doubly at a disadvantage. Firstly, those more experiencedweft precisely the ones receiving more fieldwork experience. Secondly,Iteld-o,ork in their senior year was restricted w one day a week. Conse-quently, accelerated students assumed that they "were falling furtherbehind.- They feared that they would never be able to "absorb everythingthat they needed.
Social shim) in the School
Sometimes .eelings of inferiority were confirmed by traditional studentsand l'acu:ty. Many traditional students seemed to resent the acceleratedgroup. In one social policy seminar this question was discussed: Should theschool be pushing accelerated students through its program so quickly?
Some faculty openl; expressed doubts about the accelerated program.One member questioned whether a:._celrfrated students were as well pre-pared as traditional students. Another reportedly made "snide remarks"about the accelerated program. PP: "underlying message," as decoded byaccelerated students, was that they were "too young to know anything."When accelerated students performed well, faculty members seemed sur-prised. The students learned firm some faculty thaL they were "moving at
79
9 0

a slower pace." It was cold comfort to hear that "they would make it up-during the summer.
one Audent became quite anxious when a faculty member discussedher inexperience and lack of preparmion. The faculty member told the stu-dent that she was "being damaged" by trying to remain in the program.For a tiroc this student considered dropping out of the progam.
Sorn,,- of the 1972 graduates likened flemselves to members of amirority group: "We didn't feel included. We wanted to be part. of %na
going on, but no one was interested in including us." "If I wanted tobe included in an activity,- one accelerated student noted, "I had to forcemy way in." Another -lid: -We were not even allowed to ride in the backof the bus," A third commented: "No one spoke to me at orientation. If Iopened my mouth, thLy all froze me out."
I lere is another illustration of the student feelings of marginality in.the owl structure of the school: "Every class had a student representa-i ye to the sequences. I never knew one existed. How did you become a
representative No one told me. I didn't know what going on. I wosn'tasked. I wasn't involved. I h:id to learn on my own.-
Accelerated students were singled out in another way. The school useddifferent procedures in evaluating students. Accelerated students receivedletter grades, but the traditional students received pass-fail grades sincethey were in graduate school. When faculty forgot about this distinction,accelerated students had to remiod them. At the library desk, acceleratedstudents also received unfavorable treazment, They were seniors, notgraduate students. Thus thcy had fewer library privileges. Also eventhough they were seniors, they did not fit easily into the student associa-tion, where most of the members were traditional students. All of this wasdisheartening. Accelerated students felt that they were "undergraduatesand yet not undergraduates" that they were "graduate students and yetnot graduate students.-
The status of experimental student seemed to follow them like an un-welcome odor. They thought nf themse Yes as outsiders. They wanted thefull rights and privileges of ksacivate students, yet they had to do withoutthese while they were :-.t; is rI !he undergraduate program. By the timeIney received their bacuiiari-'e, they felt themselves inferior to tradi-tional students. A year latel, tie end of their graduate studies, the gaphad narrowed. Indeed, it seemed to have disappeared. The next sectionidentifies the mechanisms used to rjverconhirig the presumed deficits ofthe "experimental" program,
BECOMING INSIDERSHEIGHTENED MOTIVATION TO LEARN
Accelerated students suffered frOM feelings or being second best. This,however, proved to be an advantage to them. Because they felt they knew
9 1

less, they felt the need to work harder. "Because °Four feelings of ma--quacy, said one student, we dia a lot more reading than second-yearstudents. We dId a lot more work on our own. In this way accelerated stu-dents believed they were able to catch up and become familiar with thelaneuaee and coflcCpt that traditional students appeared to use so conli-demi;
eelerated s 'dents also made great deniatids on their fieldwork in-structors. They pushed harder'. ant ''worked harder'. than did tradi-tional students. liedes trying to catch up. some students had another rea-son tor pushing so bard. As one expressed it: "being in an experiment, Ifelt I had to make the grade. I was being tested. In this instance it ap-peared as it the research itself may have spurred them on to greater etTort.
AnotheT rt:portctd thto acccieratt:d students were able to invest our-st.:k es more in studying. e are more questioning, not always knowing.fherc is no v4:sted irn Jest in being perfect because we were not perfect
for so lotThis l',retronce or their ince despised status will be ted again at a
later point I hew we see that boIng sc,:ond best need not he a permanentstattis Position is htci on achievement. lt,one recngmzes one's disad-vantages. one can mount a campaign to trYto'overi,!Onie them. Further-more, once one succeeds in overcontiolg the. disadvantages, he isstrengthened bv the ordeal that he has passed through on the journey toparity. Being second best, trying harder, leads to the possibility of one daysurpassing those who are presently number one. The summer programproved to be an ordeal to the accelerited students. Meeting its heavy de-mands helped make them feel as competent as traditional students.
WIGHTENED DEMANDS OF THE SUMMER PROGRAM
Rites of passage are a well-know n mechanism that serve to mark thetransition from one status to another. Often the change is officially recog-nited after the initiate has undergon'.! -41 ordeal successfully. Completionof the trial symbolically marks the move from one status to another. A la-tent I unction of thc summer program was to serve 1 his purpose for the ac-celerated students.'
A manif ost function, of course, was to rovide an equivaleto the first-year fieldwork program of traditional students. But the summertook on spe,2ial meaning for them. Accelerated students who had pre-viously passed through the summer program warned the next cycle of stu-dents: "Wait 'til the summer," Some of the students anticipated the startof the long-desired, intensive fieldwork experience with trepidation. Oneworried about lacking the background necessary to work four days a week,
the effects of thc.: summer program were viewed by students as follows:ihe majority itt grosk mg that I tha %kir, durmg Ihe summer. I wouldn't have as muchconfidence in myself orhoui the summer ... You kept Wing WaS ion intense.

HA; i I hcr.;
. I
.11R1 I rc,t11,,,:d
:k I OA fl+,; v,qk
I he studen s cknowledge that alter tt-t-, summer, gaps-.tit! remained in klt 611. Hut this did not detract Yor-it the value of
summer sfk, All know limit [-nore than Hut atter the,Orrink2r 101,2 Whul It 11-tnlit. Other smiler,more than we do. Satd Lr tcheved student:started I. feel I belonged ::--,-;imiewhere and I was
RUN ESS OF ClIAMANC, I,
doing anyr I reall
m where.
FIlL stut wantcd to beergne full-fledged grat -Ineents. Th,ywanted to succeed in thel r :Additional structural mechanisms,both rormal and int-or-mai, Itelped them realrie not only that change waspossible but that n was act trial y occurrme,
one simple. Official ayi held iii iiJi::rahle meaning for the students:notice LII their ibri11,11 admission to graduate school. As seniors, they hadcomplained about not knowing it- they were undergraduate or graduatestudents. t.fter notiticalkm or their admission, they registered as graduatestudents, They knew they 1.4;t:k: On their way,
I he second cohort of students benefited from Iheir informal "fleeting'.itIi SIIILILIItS from the prev ion eohort. The latter served as a positive ref-erence ,goup. lir ex ktii1c proved that it was possible to complete theprogram. Furthermore, graduates or the aCcelrated program found jobs associal workers. Their success was viewed as proof by the next group thatthe program was treconiphshint us goals:
Members of the second cohort wt. to,vtire of the cotiliori they derived1mm the previous cohort. It was a 777 icoling to see iatr,t students work-ing in the sante trgency ;Ind to lino:. or,.. the pro:gran, . tuld work. Theytalked to their predecessors and them i hLi were visible,welcome conlirmtwon that the progran we retdly working.
The accelerated students ake recogited changes in themselves when,as second-year stmlen is, they came to litiVC dejtillgS with first-year stu-dents, In these encounters they reali/ed that they themselves were "moreadvanced. :A l-cw accelerated students were given re- fororienting entering first-year students, This duty also helped confirm theirstatus as bona lide second-year students.
82

(00:ATER INTER ACI ION WITH -IRA DITIONAL STUDLVI SstudenK initi4iiv developed unre,',,n,c expectations about
the L%-,.nipetence tr:idwon swdents. -lyptcraly they voiced such expee-tanoit, as these' he:, 't e ton nottit and th,n, are going to know it all.-
hey "h,n,e read all the hoot,: arc able cotIcentualize like mad.-'In therapy the:: ,,,anal.! know what to dia
,ccelerated students gamed a morc britan:.ett vf0A. lradl-1;- )11 .w.-.; hasten-2d by their corn lete
class and tieldw (irk during the secorid year.liY laar.r)it: more about traditional students, they began t vii2w them-sok es it:m:e positively
-I or eyamp!e, learned ifidi ITAIM,H),d Aky mdoequitictimes even thoiwb thel, -looked so confident,- Accelerated students
now had increased opportunities to spend more tirnc with traditional stu-dents I he% 10 them about their cases, their dass work, and theirheldwork placements. hrom these discussions they "began finding outth,,a they were human.- One student coneluded: '',As we discussed ourcases I came ttt realire that they really didn't know as much as I had giventhem credit for know 11112_ They illso !Lid problems.- Another student re-
irted that he suddenly reahted that everybody encouinenng some.fliculty Said another: "In the held we were all on the same levei was
doing the same amount work and doing it as well.-Some accelerated students applied the social work skills 11%1c they had re-
cently :tcquIred 11111V/IM2, the sLitements of tradrocanal .studc:us. "Mypod essors taught me too much. My diagnostic skills are good. began toreiogniic their lacks.- Another boldly interpreted the moti:iation ac-counung lor the behay tor of his -betters.- "I didn't feel accepted by sce-ond-year students. Some of them laughed at experimental students be-cause they were going through the program in one year. Theytempt lin' people %kilo L'ome to the school with experience and pa: NiO tor
ycar of training.-In other %%ords, i.uxelermed students hegan to question the Ht the
traditional students' f evlings supenority. Instead of giving re,-Icth.nr own interior :italus, as they once had, they were now sec!
to account .'or he traditional students' need to feel superior.Increased himiliarity sometimes brcd contempt. Sitting in the .s
claysroom, accelerated students listenec: -to the dumb questions they[traditional studentsi ask. When you listen to them. you know they can'thelp a client.- In the classroom, aeeelerated students also had un oppor-tunity to learn i';,at -they knew More than some of' them. We got a feelingof how much they didn't know. 'they didn't know any more than we do.-
Onc, student was pleased to hear that some traditional students had trou-ble completing certain papers. lie himself had not experienced artydifficulty in completing. the assignments, After tttlking thiz.m about their
83

trouble he learned -how shallow their thinic m gClearly, during their final year, the accelerated studi Is were riAdv to
nen the balance with traditional students. So ril e of the thove -quotationsho,, that they did so with a vengeance. PerInps they oi..Erreacted. NOrle-
theic,,s_ the ne us- increased evdo.sure to traditional Jo-dent, helped to Wminih I echog, ol int enmity' among he acceleratedgroup
SOCIAL SUPPORT AND GROUP SOLIDAR rr
k We think about ourselves is in part dziet min,Atkty how others thmkNlan is not an island. Therefore it is important to consider the
response or students, fieldwork and classmoTri instruo prs, and otherswhom accelerated students saW frequen
A positke evaluation by a "significant other- hcliVd lixelerated stu-lents have more faith in themselves. When one student syoke about feel-ing inadequate as a worker, her supervisor pointed out that all studentsfeel that way. At first an accelerated student rnighf thim k_ that traditionalstudents knew what they were doing-, a fhe iinc. evenwislly they learnedfront others that all students stiffer from the same problems
.
pne student reported the effect of u supervisor corrirli !renting her onsatisfactorily discharging her fieldwork rCsoti5i hi IHies The student"began 10 realize that she was relatini.1 differeru5y to clients." She feltinure comfortable with them. She was -hot doin& inszi mative stuff any-more.
Another recalled the strength she had gained fro n A dtoctor's positivevaluation of her work. The doctor told her: "1 hope yot can work with me
all of the lime. You're one of the bet soeral workers Item" After that thestudent thought to herself: "I must be doing something right,- She alsobegan to recognize that she -could do the job.'
Some of the students also gained support from a naam: her _; facultymembers, both class and field, who "were invested i 11 IN program.- Theywanted It to succeed. -Either onseiously or um corn4Li ously they tried toenrich the students' experience,- One student Ind beeri incertain aboutfinishing the program. !toy:ever. support from her lelviscor and supervisoronahl Al her to remain and finish her studies.
So far we have dIscussed the su Kurt front professiomd,1 workers. Stu-dent support was dry) extremely val tiabic. Nle ti io a -was in:ade earlier of thecomfort accelerated students derived from their rretteecsors, Acceleratedstudents also drew support from one another. Ihey develloped close tiesuniong lbemselves, "We became a group, a clique.- 'Vtie developed aclose identification, closer than with, 'Amore else." vrv.: lived throughsomethint:. Even though we might not be hest frieft ds, Om is a war-1thamong us w t,out feeling that we have to be best friends."
The studeri-4 b'lieved that this closeness w ts special, ft w F dit'kILFtt
84

Irom the usual closeness some studems have for one anoth r. It resultedla part from feeling excluded 1:nm t1i: .tud,:nt body. Sharing this ,..-
pericrice drew them closer, At lea q. ,hey had eacn otherwhich was morethan some traditional stUdentS had, 1ot ot traditional] students had nogroups to be part or. They were mdtviduak. We. ere a lot less lonely than,he other students. We had each other,'
Friends, of course, are no substitute For Foch ag confident about onesability. Nonetheless, the solidarity of the group and the support they re-ceived from other students andoubiLdk enabled t hem to release feelingsof tension. This relief helped them to n d on the main task of'completing their education and becotiwtg social wozkers.
COMPENSATOR Y FEEL! NGS OF SU PER IORITY
indergntduutes. the accelerated students hail felt that their prepara-tion vas Interior to that of traditional students. At the point of graduationh ey had game to believe their preparation was at least equal. Indeed some
accelerated students were prepared to argue that their preparation wassuperior, because there was much greater conti nuit,if between undergradu-ate hnd graduate school. Much of the knowledge acquired in undergradu-ak..-. school was still Fresh in their minds." lib is was not the case withmany traditional students. Faculty often had to repeat information for tra-ditional students. Some had never learned .1. Others had long since forgot-ten what they once knew.
In time accelerated students began 10 recniae that they were notdeprived in one critical aspect. In their view the undergraduate academicpi:Quo rn in social welfare had ce7tain special nerits. iOce 't was designedto provide, them with a rich background foi cut i1ftCC nto the social workprofession. Traditional students, in contrast, hind tnujore....d in a variety ofundergraduate programs. Cunscquently, some acoelerated studentstgued that their academic preparation was better.
Accolertwd students also felt better prepared hcattC of the great de-mands made upon thm. They spoke of n,...imerous deidliries and increasedworkloads"all those crises- that had to be overcome Also, the rigors ofths'n son-imer program added to their special preparation,
Accelerated students began to reconsider the weight that should beri the more extensive, experience of their rivals, At the point of
graduation, previous work experience seemed mudt less important. Theearlier high evaluation stemmed from a r.ariod when accelerated studentshad been soc.al work virgins, filled with desire but without field ex-
enccIn 1971 and 1972, graduates did not make a suong ease for their
superiority. Rather they seemed to be eirrnic g a right -to feel just as capa-ble as traditional students. They had moved a long distance from the timethcy were frightened seniors. They had thrown off early feelings of being
85

second-class students, as well as their doubts about the program and theircompetence as practitioners.
THE 1973 GRADUATES
The exile tence ol the 1973 graduates (Cycle IV) differed from than ofearlier cycles. These students did not recall being overwhelmed by anx-iety. on the contrary they were rath.lr self-assured. After having listened0 the woes of three previous groups, we were surprised to interview a
group of accelerated students who were rather blase about the prospect ofcompleting their education in five years instead of six.
These students reported normal rather than exce:isive feelings of ans-Cty a rare person can sail through a graduate school without ex-periencing periods of doubt, uncertainty, pain, or frieht. It was from thisperspeetive that most of the 1973 graduates discussed their experience in) he aeeek.,ated program. In the remaindev of this section we will try to ac-count for the different perspective of the final group in this study. We canonly speculate about the reasons accounting for their view. That thietrperspective was different was not known until the final group oh studentswas interviewed. At that point we presented the problem to the 1973 grad-
uates and asked l'or their thoughts.The increase in absolute numbers of accelerated students may have
made students in this group feel more secure. When the program firstbegan, there were only 6 students. In the next two years there were about a
t. In 1973 the number incwased to 24. We sugeest that both the ab-solute and relative number of students in a special program can affect thelevel of anxiety they experience, 13y 1973 the accelerated students had be-come a substantial minonty. Altogether, they constituted approximately25 percent of the 1973 graduating class. Behind them was the class of1974, another substantial group.
At the same time that the program was growing larger it was also becom-ing more generally accepted, The 1973 group was following an educationaltrack that had become clearly demarcated. They were not educationalpioneers. Their anxious predecessors had blazed the trail. When they en-tered the program three other groups had completed the course stic,cessfully,
In time, the acceptance of the program became more widespread. A pro-gram that is five years old is no longer a fly-by-night operation. Its oppo-nents know that it will not wither away. The 1973 graduaws benefited fromthe general acceptance and firmer establishment of the accelerated pro-gram. They were part of a growing, flourishing program. They had reason
to be proud of their status as accelerated students.These students, more than those from previous cycles, felt themselves
to be superior. They felt that they had survived a careful selective process.
The benefits of the program were obviousa shorter, less-expensive
86
97

education, They were proud to ha e been lec1ed. Perhaps for this reicsoothe 1973 group was the first one to formaliN their status by developing Lrnorganization comprised only of accelerated students. They held formalmeetings, collected dues, and planned parties for the members. Previousgroups had provided considerable support to one another. None or these,however, had developed a formal structure. This movement may disap-pear in future cies if the accelerated program should become an integralpart or the school and less importance is attached to being an acceleratedstudent
CONCLUSIONThis chapter shows the importance of looking at results of a program
that span more than a single year. One might have inferred from the ex-perience of the first three cycles that students from future cycles wouldcontinue to think of themselves as secopthelass citizens. In retrospect, onecan detect early signs that were indicative of the accelerated students'growing I Ming of acceptance and strength. A few students in previous cy-cles had talked of their superiority. But their stance appeared to be defen-sive. Also, these students showed a strong .0oup identification with 72aehother. They seemed to huddle together for warmth and protection. Wecertainly would not have predicted the reactioa of the 1973 group on thebasis of interviews with the first three.
Students in future cycles may have reactions similar to those of 1973 asthe program d-i2velops and the results of this evaluation are made known tothc Adelphi community, Possibly, the solidarity among accelerated stu-dents may diminish should the program become increasingly popular.Then they might compete fiercely with one another for openings. Theanimosities engendered might remain long after students have entered theprogram. Accelerated students may Om to thtiik of-themselves as a thor-mighly elne g:roup. If so, they may shun contam with students in the tradi-tional program.
The general point k that the accelerated prom.= is changing and so isthc Adelphi University School of Social Work. This quaViai,ve study illus-trates the response of students to a changing milieu, We make no effort topredict future directions of change, This much, however, can be said withsome certainty about the past experience of acceleratectstudents: they metthe challenge resulting from their special social status. At first they felt in-terior, They had doubts about accelerated education, But they proceededto develop supports that helped them get on with the task at handobtain-ing a social work education that prepared them for practice. As objectiveconditiony, change, the students' responses will undoubtedly change aswell.
NOTEThe summer program made heavy demands upon. studeni. They spent iMar days
,aeck ,it a hold placenient During the 12-week session they also enrolled irt hvo courses.Altogether they completed 14 hours ol credit, including 336 hours of. fieldwork.
87
9 8
Chapter 7
Surn: vary and .Conclus ons
by Aaron Rosenbtai7
Social workers have long debated the pros and cons of envie ing themaster's degree in one year instead of two. For many years no con \pellingevidence was availabfe to support a change. Consequently, the safer, moreconservative position was accepted officially by the Commission on Ac-creditation of the Council on 'SociM Work Education, In 1968, however,ne commission modified its position and granted authority to experiment
outside of standards. Consequently, programs of accelerated educationwere carried out at Adelphi 'University, the University of Wiscon-sin-Madison, and San Diego State College'. The Social Work TrainingBranch of the National Institute of Mental Health recognized the sigrtifi-cance of this breakthrough and awarded research and training grants to thethree sdiools so that an evaluation of each program, could' be conducted,
A different educational design was put into operation at each f theschoo[s. In addrtion, a different research design was used to evaluate theresults of each program. With the completion of the Adelphi study theresults of each of these programs are now available. Those interested inexamining the program and study at San riiego and Wisconsin should con-sult Weinberger' and Kadushin and{
The educational program that was adopted at Adelphi is described indetaif in. Chapter l Essentially it provides students interested in obtainingthe MaStees degree in social work with an opportunity to accelerate theirprofessional, education. As undergraduate students they can elect tO majorin cial welfare. Irthey doso, some coursesusually available only to grad-Uate will be open 'to them° During this period they can also earncredits for their 'fieldwork expedence. Once they receive their baccalaure-ate degree, a number of them are admitted to the accelerated graduate pro-
88
99

gram. lnitaIy thii.) consists of enrodment in a surorner SessIOn theschool of social work. At the completion of Chls: pl,ogorani the studentsenter the school as second-year studerat..
A number of questions need to be rkecY n desrgning an val dtionstudy of an educatkinal program In Chapter r_j! we dealt with these ques-l_ions length. In: this summary, a few major questions an repeated be-cause of :heir importance to the study The questions are quire smpte 1
What is it that is to be the subject of study': ( 2) How are datia iof this natureto he obtained? and (3) When are such data to be obtained?
WHAT IS IT THAT IS TOBE THE SUBJECT OF STUDY?
We heheve that the Adelphi University School of Social Work seeks toeducate its students in accordance with certain objectives and that the eta'riculum reflects these objectktes. FTOTTI thi,s perspenve the first-order cri-terion tor ev aluating the educational program is the learelng 'and thatare avowed 41 accordance with the objectives aPite airricidivot. Examinationof the Adelphi Stlf-Slud'y Iiir Alecrejikilion Review' Was uSed tO specify thefollow(ng areas oi sociaI work education in which learning and skill are tohe acquired.
I. troundaoon knowledge (social welfare otki and services, humanbehavior and the social environment).
2. Knowledge of soclail work practice ksocial work n ethods, social workresearch).
3,Soctal work Mot's.4. Pracfice skills and field pedb n
HOW ARE DATA OF TH'IS NATURE TO BE OBTAINED 7'
31;udy is only as good as the instruments used to collect the needet in'-formation . One cannot study objectives il suitabte instruments are notavadahle for measuring them. Many a study has foundered on this rock.
-en the whole, we were fortunate in our selection of instruments. Foun-dation knowledge was measured by two instruments, the Minnesota In-ventory of Social Work Knowledge and the Study of Barry Black. Thechairperson of the Human Behavior and Soeiall, Environment sequence atAdetphi believed that the latter needed to be supplemented in order to re-ilea all of the objectives of the sequence. She prepared 21 additionat itemsdesigned to measure students' understanding of psychosocial mechanismsthat affect behavior.
Increments in knowkidge of social work research and attitudes towardresearch were measured' by the M ARK test devised by Harris K. Gold-
n. By means of a factor analysis three dimensions wewe identified in theinstrument: ( I) knowledge of quantitative concepts and quagtative retla-
89
0

tionships and of precise differences in concepts: (2) knowdge of abstractideas; and (3) confidence in the ability of science to solve problems.
Changes in social work values were measured by the revised version ofthe Social Values Test_ Social work researchers have frequently made useof this_ indeed, it was used in both the San Diego and the Wisconsinstudies, This test, which was developed by Henry J. Meyer in collaborationwith Donna L. McLeod, taps ten value dimensions.
Practice skills and field performance were measured by the Practice SkillAssessment Instrument (PSAI). This was developed under the directionof Rosemary C. Sarri at the University of Michigan School of Social Workand is able to discriminate between the work of "A and 11" studentsand the work of first- and fourth-semester students.
We sought to validate the use of these instruments by examining differ-ences in combined scores of accelerated and traditional students betweenthe start and the completion of their education. We reasoned that instru-ments able to show increments in learning and in skill were Fuitable foruse in this study. If we could demonstrate that they were capable ofregistering significant change, the validity of the evaluation would beenhanced. When an instrument does not register change from one periodto another, one cannot assume that the instrument is defective. Incre-ments in learning or in skill may not be registered simply because no sub-
ntial degree of learning has occurred. Nevertheless, instruments thatregister an increase freim the start to the completion of an educational pro-gram have a compelling quality about them.
The inventory of Social Work KnoWledge scores of all students, acceler-ated and traditional, were considerably different between the start and thecompletion of their education. The results of t-tests for correlated samplesfor all sections of the inventory reached the predetermined .05 level of sta-tistical significance. Differences in before-and-after scores of the Study ofBarry Black, a/though generally much weaker than those of the inventory,nonetheless reached the .05 level of statistical significance fOr the totaltest. The scores of the MARK test showed an increase in unfavorable at-titudes toward research. Nonetheless the students showed statistically sig-nificant increases in the extcnt of their knowledge of research.
The before-and-after scores of the Social Values test were lower thanhad been expected. For eight of the ten dimensions the differences fromthe start to the completion of education were not statistically significant.There was relatively little positive change noted between the start and thecompletion of the students' education. The results of this test have beenTe Of/lied but they were not used to evaluate the educational experiment atAdelphi.
Differences in the before-and-after ratings for the PSitil were strong andconsistent. The consistently: higher `',,lter" ratings indicated that this in-strunient was capable of Tegistering change in fieldwork performance.
90'
10 1

In summary, f,here is i ill iuon I or much mpr(iveineffl in the instru-ments available for measuring change in the acquisition or knowledge,vat u,-ts, and skihil related to the formal ohlectives of social work education.Still, the instruments med in this study proved to he serviceable. All &Ithem with the evception or the Social Values Test showed significant dif-ferenci-,:s between die start and the completion of the students' formalsocial woirk educXion.
l HEN ARE SUCH D TA TO BE OBTAINED?Lause vie sought to measure the acquisition of knowledge, values,
and ski! l durin6The course of Inc accelerated and traditional programs, wedecided to make use of a. herore-and-Aer research design. An after onlystudy would not provide information un the amount of change that tookplace from the siiart vi the ,:omplctien or the students' formal education.
and after measures were needed in order to make appropriate inter-pretations about the changes that occurred. The interpretation of afteronly measures is, of course, extremdy hazardous.
We Aso favored a before-and-alter panel design for another reason. Wedid not wish to assume that the goats of education were being reachedsimply because there were classrooms, teachers, students, and textbooksproclaiming the presence of an educational enterprise. If philosophers ac-cepted evidence of this kind, they would have proved the existence of Godlong ago by the presence of cathedrals, ministers, eongregations, and re-ports or answered prayers.
At the suggestion &fan NIMH consultant the research design was ex-panded to include the practice of students one year after they had gradu-ated. It was believed that changes in accelerated and traditional studentsmight continue to occur after they had graduated. In other words, the dif-ferent programs, might have a dfillerential impact 'on practice that wouldbecame manifest only after a sufficient passage of time.
One additional part of the study needs to he mentioned before we canproceed to its actual conduct and the presentation of the findings. Someprominent social wor:k educators expressed/ considerable concern that stu-dents attracted to itizitil:rated programs would be tainted by a heavily vocti-tional orientation. They wanted social workers to obtain a strong liberalarts background rb,2fore entering graduate school. Today the value of thispart of the study seems marginal. Initially we believed that the questionhad more merit, hut times have changed and so have we. Some readersmay stilt conside that thi,s part of the study is important and that the find-ings bearing upon iblA i,,sA% we valuable.
In summary, rile es,/,'i,yorn study off the accelerated and traditional pro-grams at Adelphii designed to answer these three broad questions:
1, Did accelerated and traditional students differ in the amount of formal
91
102

iearning they acquired durtog their trtUniog'2. Did accelerated and tratittit'',n,d students differ in their practice one
year ;al fer graduation-.)WeTe there differences ai he etfucational background of stud itsenrolled in the acceiertitc0 dnd :roatitionai r,rograms?
COMPARISON OF LEARNIN6 SCORES
Chapters 4 and contained detailed information about the answers tothc, above questions. in ;his final chapter we wish to highlight the findings.
hereto +31111( the presentation of data by following these pro-0-:dures. we will report on the findings only for each of the cycles and forall three cvcie,, combined. .Also we will report only on findings that com-pare the learning :cores of accelerated and traditional students and on thedifferences between both groups at the completion of their training.
Inventory of Social Work Knowledge
IThe learning scores of accelerated students were nigher in the Inventoryof Social Work Knowledge test t'or Cycles IL and IV. For both of these cy-des. the difference: in learning were statistically significant. The learningscores of accelerated students were also higher when all sections of the test
and :111 three cycles were combined. Furthermore, this overall difference
was titatistically significant.
ti;,Tr Black Test-Fhe Barry Muck test is divided into two sets of items. `Me first set COM-
PritieS items from the standard Form of the test. For Cycles II and IV thelearning scores of traditional students were nigher: l'ar-Cycle III the scores
of accelerated students were higher. None of the differences for all cycles
was statistically significant. When oil three cycles were combined, tradi-tional students scored slightly higher, hut not significantly so.
I hv second group of items was especially designed for Adelphi students.
None of the differences in learning was statistically significant for theseitems on any of the cycles or on the combination of the ibree cycles.Furthermore no discernible trend favored either gr up of students.
Differences between the absolute scores of accelerated and traditionalstudents were not statistically significant at the end of their training. Ineonclusion, the learning scores and the end of training scores were similar
t or both groups.
Measurcnwnl of Attitude and Research IriowIedge
Differences in learning were quite small between accelerated and tradi-
tional students for each of the three cycles and for all three cycles com-
bined on the MARK test. None of the differences was statistically signifi -
92 103

cant At tne end otthe two groups
eir tram itial difference betv,een
Social N\ ork alues Test
The SOCIal Work Values Test is the onk one of the instruments thatladed to show a statistically significant difference hetween the scores of allstudents from the start to the completion ot their education and training.Therefore the results oi f is test were not used En evaluating the acceler-
ated program.1 he findings or the Soca Work Values Test were presLnted in Chapter
4 because of their general interest to social workers. It does not seem ap-propriate to include these findings in ims tin ii ection ot the report. Al-though student values mai, show some turnover, there was no consistentcl-ninge in social work values. Thorefore. we retisoned there was little pointin measuting somethIng that was not changing and then using this infor-mation to evaluate the acceierated proeram The significance of these find-ings has more importance for curriculum development than for thisemvaivatiit ;
Practice Skill Ass&ssmciit Instrun n
A total ot 5`i items was used in evaluatme pract cc skills of social workstudents_ Rather than give information on each of these items a generalsummary is presente
I he practice ratings for both accelerated and traditional studentsshowed positive change on all Items from the start to tne completion oftheir training. Generailv, more improvenlent was shown in the ratings ofaccelerated students. For individual items in each cycle these differenceswere rarely slat stiealt signilicant. When the four cycles were combinedand the number of students eNamined was much larger, the differences inimprovement were more likely to be statistically significant.
At the start of tieldworl'; practice accelerated students performed at a
docloonly tower level than trailitional students. The improvement shownaccelerated students was much greater, so that by the end of training
they had caught up with traditional students I nus accelerated studentsgenerally overcame the initial advantage of traditional students. For 55 of57 items diflorences in practice ratings were not statistically significant at
the completion at training.In summar, pa tne bp.s.15 of ov e- Ind-aper scorcv vi aree/i'rou'd arid
trodalonoi students, one Must thin Ow accelerated progam Itas de-comolishow ItS grials to toe training to work students.
PRACTICE FINDINGS ONE YEAR AFTER GRADUATION
The items used to examine practice skill one year after graduation weresomewhat different from those used in the PSAI. The wording was
93
104

aaged to rollect the new status of students as grahme social workers.Also. it eeined appropriate to drop a few items and add three new ones.
or LIICSC tcs xceptions thiz, instrument was essentially the same asthe PSA 1.
1 he ratings of accicrated and traditional students showed a consistenttrend iirter tho had been in practice for one year. For most of the itemsthe difitNences between the two groups were generally small. Of the 53items only 3 showed statistically significant differences. 11- the level ofanalysis was limited to an item-by-item examination, the difference in therAngs of both groups of students generally was not statistically significant.
A different view was obtained when the overall pattern of the items wasexamined. When we directed our ;ittention to the general pattern, we ob-ser ved small, consistent differences in the two groups of students. For ex-am plc. s.4,,c divided all of the 106 average ratings for accelerated and tradi-tional students into two groups, one above and one below the median, 01the 53 ranngs above the median, 37 or 70 percent were those of traditionalstudents This trend was strong and consistent and should not be over-looked because it did not appear in an item-by:item analysis
n summary, the ratings of trodaiotwl studentsere cmsistently higher oneone, graduation. The differences, houvrer. were of a small magnitude.verage or the awrage dillerences separating the two groups was 0.23. In
our judgment this was not large enough to raise serious doubt about the value ofaccelerated education. Yet the overall trend was consistent enough to merit
/millet inquiry.
INITIAL DIFFERENCES IN ACADEMIC BACKGROUND
Three measures were used to examine the academic background of stu-dents: ( 1) scores on the Graduate Record Examination (GRE); (2) theundergraduate Quality Point Average (QPA) of students; and (3) under-graduate transcripts of courses in the social and behavioral sc-ences.
Graduate Record Examination
For men the scores of traditional students were higher than those of ac-celerated students. The difference was 83 paints on the verbal score and 62on the quantitative score. Both differences favored tratbtional students.The scores of women were much closer, although in both instances thoseof traditional students were higher. The difference on the verbal was 45points and on the quantitative, only 7 points. In short, for both men andwomen the verbal and quantitative scores were hieer for traditional stu-dents.
Quality Point AverageThe quality point average was 141 for accelerated students and 2.73 for
traditional students. These results were not consistent with those obtained
94
1 0 5
from the GR E. The QPA 01 accelerated students was much higher thanthat of traditional students.
It is possible. to reconcile these differences by making the followingassumption: students who obtain high grades in a professionally oriented-curriculum need not always acquire more information. Obtaining highgrades is a practical art" that is not always correlated with the ability tostore information.
Transcripts of Undergraduate Courses
Accelerated and traditional students completed a similar number ofcourses as undergraduates The accelerated students completed a mean of12_0 courses in the social and behavioral sciences in comparison to 12.2courses for traditional students, a negligible difference over a four-yearperiod.
In our ricw, 'he dylerences in GRE scores, the QPA, and tlw nwnbrr of un-dergraduate courses conipkned in the social and behavioral sciences werf. eyrlinjited Imporrancc. Those who wish to make a case against the acceleratedprogram can point to the Glt E scores of men, where the scores of the 11accelerated students were much lower than those of the 22 traditional stu-dents as well as those of both groups or women. This finding bears furtherexploration. Additional study of these two measures is needed since theyare so widely used in screening candidates for admission to graduate pro-grams. Some further effort should be made to account for the considerablyhigher QF A of accelerated students. While these matters are of interest, inour judgment they are of secondary importance. Of far greater importanceis the knowledge and skill that students acquire in their social work train-ing. On the basis of the information reported in this section, we believethat Adelphi is justified in continuing the accelerated program of socialwork education.
IMPLICATIONS FOR THE FUTURE
A word needs to be said about the educational model that was tested atAdelphi. After receiving their baccalaureate degree, the accelerated stu-dents took part in an intensive summer program. They spent four days aweek at their fieldwork agencies. By their own admission they used this ex-perience to catch up with traditional students. The accelerated students'analysis of the program seemed accurate, although no empirical data wereavailable to support this view, The ''before- scores of the PSA1, however,clearly indicated that they were less capable than traditional students at thestart of their training. The combination of the intensive summer ex-perience and a second-year placement equal to that of traditional studentserased the initial differences that had existed in their fieldwork perfor-mance_ The accelerated students did, indeed, catch up to the traditionalstudents_
106 95

What are the irnplicattons of this model for the future of social workeducation? Should all schools wishing to accelerate their graduate program
be required to develop modifications in accordance with this model? Thatis one possible interpretation of the findings.
But some schools may prefer to adopt a different model, since the
Adelphi model is rather conservative. It eliminates only one of the fourterms that comprise graduate education. After all, the summer program isapproximately equal to one term of graduate education in cost and in cre-
dits earned:1Some schools may prefer to adopt the model that was used at Wisconsin.
There, accelerated students who were seniors entered the first-year pro-
gram of the graduate school. They enrolled in the same courses as did tra-
ditional students, and their fieldwork experience was identical. Ac-cordingly, they did not suffer from feeling like second-dass students, asdid the Adelphi students. The Wisconsin model has much to recommend
it. Which is preferable?From the research studies completed, there is no way of knowing
whether one educational model produces better results than the other.Different research designs were used to evaluate the two models and dif-ferent instruments were used to obtain data. Furthermore, the studentsand the instruction they received may not have been comparable. For allof these reasons one cannot compare the results of the two programs.Under these circumstances schools wishing to introduce an accelerated
program should be free tu select whichever model seems preferable.The choice can be influenced by such practical matters as the university
regulations governing the admission of students to graduate schools.
Adelphi University requires a bachelor's degree as a basis for admission to
graduate school. This alTected the development of the Adelphi model.Before the study was begun, there was considerable discussion about dif-
ferent educational models. The Wisconsin model was rejected for practical
rather than intellectual reasons. In retrospect the university's decisionresulted in some positi ve consequences for social work education, sincetwo models were studied instead of one. NoW there is a choice available to
social work edheatOrs.The Council on Social Work Education and the National Institute of
tvlental Health gave the researchers at the three schools great leeway in
choosing how to conduct their evaluative studies. This freedom wasgreatly appreciated. One minor modification that NIN111 requested was
that the initial Adel phi research design be expanded to include a one-year-
after follow-up of students. Another useful suggestion was that data becollected about students experiences in the accelerated program. In effect
the officials of these organizations said: "Do the job in the best way possi-
ble."And yet one must ask whether the three studies. ight not have had a
967

greater impact on social work education if there had been greater similarityin the research designs. If the same design had been followed and the sameinstruments used, comparable information now would be available aboutthe effect of the various models, We would be in a better positioo to knowif One model produced better results than another.
It is easy to make such a suggestion now that all of the studies have beencompleted. If this hindsight suggestion had been adopted earlier a stickyproblem might have arisen. The record shows that the researchers selecteddifferent research designs and different research instruments. If a coordi-nated research program wouki have been followed, it would have beennecessary to resolve these differences. Scme formal mechanism wouldhave been necessary to settle the issues at hand and the researchers wouldhave had to surrender some of their independence'. Yet these li mitationsmay have been worthwhile in view of, the question that still remainsunanswered.
The social work profession should give thanks to the Council on Social,/ork Education and the Social Work Training Branch of the National In-stitute of Mental Health. As a result of their interest and support theproleSsion now has empirical findings available that can be used in shapingthe future form of social work education. Textbooks traditionally extol lthe value of policy research. Rarely are such studies funded. Even morerarely are the results of policy studies heeded. Today the form and lengthof social work education are hotly debated issues. Pertinent data are avail-able, Let us hope that policy makers will consult these studies.
In this final, closing paragraph we present a summary of the seven-yearprogram. We tried to conduct a careful study of the accelerated program ofsocial work education at Adelphi. We pretested students in one cycle andtested those in three successiVe cycles. The accelerated students wereyounger and less experienced than the traditional students. They acquiredmore general knowledge and their practice ratings improved more. At theend of their tniining these improvements did not distinguish them fronttraditional students since they started from a generally lower base. Perbapsthe most serious charge that can be brought against the accelernted pro-gram sterns from the findings on student practice one year after gradua-tion. These differences were small on an item-by-item analysis of-practice.but the overall pattern was clear: the ratings of traditional students werehigher, Nonetheless, the magnitude of difference was relatively small. Onthe basis of all the evidence obtained, we recommend the continuation ofthe accelerated program.
NOTES
I. nil Weinberger, The Undergraduate Continuum Project: A Final Report,mimeographed (San Diego: School of Social Work, San Diego State Univericy, 1972 /.
2. Alfred Kaduhin :Ind George Kelling, "Hnal Report: An Innovative Progra in in Social
97
108

V.( 1..ducotion. it 1 1111111c iphed I \lj&hstiii. ol
IFi Seht)01 Socml Work, j973),3, Se1/-5/10 Areibtat.on Rt.t. (farLicn City, N Iclphi tJnveriiy
of StIcial Work.4 In 1973, on thc hasis it eather hndings from the e permit:mat research the Adelphi
1r1lccrcli Si-told tit Slioal Work modiliekl the elluidional model of the Continuum hyOlinimiting the summer program iiit enrickling the protesstonol ointent of the Junior year11N an equiv:Ilent number ot clv1his t
98
109

Appe d x

TA
BLE
4-1
inve
ntor
y of
Soc
ial W
ork
Kno
wle
dge:
His
tory
and
Phi
loso
phy
Cyc
leSt
uden
tsS
tan
ofS
ocia
l Wor
k E
duca
tion
Com
plet
ion
o/'
Soc
ial W
ork
Edu
catio
nt-
Tes
tV
alue
Bas
edon
Diff
eren
ce in
Lea
rnin
gS
tand
ard
Mea
nD
evia
tion
Sta
ndar
dM
ean
Dev
iatio
nS
tand
ard
Mea
nD
evia
tion
11
Acc
eler
ated
Tra
ditio
nal
t-T
est V
alue
Prob
abili
ty
12 1413
.08
5.62
11.5
13.
780.
7830
fls
12 1413
.17
3.79
14.9
32.
89-1
.290
0fl
s
12 14.0
85.
323.
363.
88-1
.739
3ns
Acc
eler
ated
1111
.18
2.86
1112
.27
3.47
111.
091.
70
rnT
radi
tiona
lt-
Tes
t Val
tie
1612
.12
4.96
-0.5
472
1614
.94
4.78
-1.5
244
162.
822.
97-1
.670
6Pr
obab
ility
asns
ns
Acc
eler
ated
249.
963.
9224
13.2
52.
8024
3.29
3.75
IVT
radi
tiona
lt-
Tes
t Val
ue31
10.0
03.
81-0
.039
631
13.8
13.
89-0
.616
831
3.81
3.70
-0.5
080.
Prob
abili
tyns
nsns
Acc
eler
ated
4711
.04
4.32
4713
.00
3.18
471.
964.
05T
radi
tiona
l61
10.9
2.4.
1861
14.3
63.
9261
3.44
3.53
Com
bine
d1-
Tes
t Val
ue.
0.15
06-1
.988
9-1
.994
8Pr
obab
ility
ns<
.05
<.0
5

TA
BLE
4-2
Inve
ntor
y .o
f Soc
ial W
ork
Kno
wle
dge:
Soc
ial-
Pol
icie
s an
d Is
sues
Cyc
leS
Wde
nts
Sta
rt o
fS
ocia
l Wor
k E
duca
tion
Sta
ndar
dM
ean
Dev
iatio
n
SOC
iaCom
plet
ion
Of
11' W
ork
Edu
ca tr
ont-
Tes
t Val
ue B
ased
on
Din
eren
ce n
Lea
rnin
g
Sta
ndar
dM
ean
Dev
iatio
nS
tand
ard
Mea
nD
evia
tion
Acc
eler
ated
1243
32.
9012
6.42
1.68
122.
082.
.54
Tra
ditio
nal
1448
62.
.14
147.
361.
8214
2.50
1.74
t-T
est V
alue
-1.3
072
-0.4
739
Pro
babi
lity
nsns
ns
Acc
eler
ated
1 1
518
1.40
115.
181.
6011
0.0.
02.
05
111
Tra
ditio
nal
t-T
est V
alue
1.6.
5.56
2.50
-0.4
403
167.
001.
59.
-2.7
996
161.
.44
2.36
-1.5
751
Pro
babi
lity.
ns<
.05
ns
Acc
eler
ated
243.
882.
0924
5.67
1.93
24-
1.79
2.04
IVT
radi
tiona
1(-
Tes
t Yal
ue31
3.84
2.12
0.06
3531
5.65
1.76
0.04
2631
1.81
1.92
-0.0
273
Pro
bagi
lity
nsns
ns
Acc
eler
ated
474.
302.
2247
5.74
1.81
471.
442.
2811
-IV
Tra
ditio
nal
16.k
4.52
2.31
616.
391.
8761
1.87
2.01
Com
bine
d.t-
Tes
t. V
alue
-0.5
171
-1.8
180
-1.0
026.
Pro
babi
lity
nsns
ns

TA
BLE
4-3
Inve
ntor
y of
Soc
it..!
Wor
k K
now
Icic
le: S
ocia
l Sec
urity
end
icia
i Wel
fare
Cyc
teS
tude
nts
Sta
dS
ocia
l Wor
k E
duca
tion
Com
plet
ion
ofS
ocia
l Wor
k E
duca
tion
0- T
est
Diff
eren
ce
N
Vat
ue B
esed
on
in L
earn
ing
Sta
ndar
dM
ean
Dev
iatio
nS
tand
ard
Mea
nD
evia
tion
Sta
nd.
. id
Mea
nD
evia
tic n
11 111
IV
11-1
V.
Com
bine
d
Acc
eler
ated
Tra
ditio
nal
t-T
est V
alue
Prob
abili
ty
Acc
eler
ated
Tra
ditio
nal,
t-T
est V
alue
Prob
abili
ty
Acc
eler
ated
Tra
ditio
nal
t-T
est.
Val
uePr
Oba
bilit
y
Acc
eler
ated
Tra
ditio
nal
t-T
est V
alue
.Pr
obab
ility
12 14 11 16 24 31 47 61
7.83
2.86
10.7
13.
47-2
.196
7<
.05
8.45
2.88
9.81
3.60
-1.0
035
ns
7.17
3.34
9.03
2.70
-2.2
272.
< ;0
5
7.64
3.10
9.62
3.16
-3.2
702
<.0
5
p 14 11 16 24 31 47 61
1.a.
:83
2.48
12.1
43.
08-1
.133
3ns
9.91
1.87
12.9
42.
14-3
.654
1<
:05
10..9
62.
18.
10.3
22,
291.
.050
9ns
10.6
82.
1911
.43
2.68
-1,5
906
ns
. 12 14 11 16 74 31 47 61
3.00
3.93
1.43
3.88
0.98
35ns
.
1.46
3.21
3.13
336
-1.2
435
ns
3.79
3.36
1.29
2.58
3.01
91<
.05
3.04
3.53
1.81
3..1
711
.889
0
ns

TA
BL
E 4
=4
Inve
ntor
y of
Soc
ial W
ork
Kro
wto
dge:
fja
lds
atci
ej W
ork.
Cyc
leu
Stu
dent
S
Sta
rt O
fSo
cial
MO
Edu
catio
nC
onrt
plet
iofi
ofS
ocia
l ft.*
Edu
datio
n
-gc-
t-T
est
Val
ue D
aAed
or
Diff
eren
ce in
Lea
rnin
g
Sta
ndar
dM
ean
Dev
iatio
nS
tand
ard'
Mea
nD
evia
tion
Sta
ndat
dM
ean
Dev
iatio
n
11
Acc
eler
ated
,T
radi
tion:
M.
t-T
est V
alue
Prob
abili
ty
12 149.
583.
4511
.71
2.78
-1.6
735
ns
12 1.4
12.5
03.
4813
.14
2.25
-0.5
449
ns
12 142.
922;
501.
43.2
.59
1.42
.41
ns
Acc
eler
ated
1110
.64
4.15
1$11
,55
2.38
11.9
13.
42.
III
Tra
difi
anal
t-T
est V
alue
1611
.62
3.18
'-0
.673
016
12,2
52.
49-0
.707
516
..6
33.
380.
2054
Prob
abili
tyns
nsns
dUce
lera
ted
249,
0811
224
12.8
32.
4124
3.75
338
IVT
radi
tiona
lt.-
Tes
t Val
ue31
10.4
23.
41-1
,511
431
12.4
22.
810.
5872
312.
002.
832.
0432
Prob
abili
ty.
nsrt
s<
.05
Acc
eler
ated
479,
513.
44.
4712
.45
2.70
-47
2.88
3.33
,
11-1
VT
radi
liona
l61
11,0
33.
2361
12.5
42.
5961
1.51
2.94
Com
bine
dt-
Te3
t Val
ue-2
.241
4-0
.182
82.
2205
Prob
abili
ty<
.0.5
ns<
.05

TA
BL
E 4
-5In
vent
ory
of S
Oci
al W
ork
Kno
wle
dge:
Pro
fess
ion
of S
ocia
l 'W
ork
Cyc
leSt
uden
tsSt
art o
fSo
cial
Wor
k E
dcfc
atio
nC
ompl
etio
n of
Soci
al W
ork
Edo
ca tl
ont-
Tes
t Val
ue B
ased
on
DO
/pra
nce
inLe
arni
ng
Stan
dard
Mea
nC
avie
tjba
Stan
dard
Mea
nD
evia
tion
Stan
datd
meo
Dev
iatio
n
ii HI
IV
11-1
V
Com
bine
d
Acc
eler
ated
Tra
ditio
nal
t-T
est V
alue
Prob
abili
ty
Acc
eler
ated
Tra
ditio
nal
t-T
est V
alue
Prob
abili
ty
Acc
eler
ated
Tra
ditio
nal
It-T
est V
alue
Prob
abili
ty
Acc
eler
alie
dT
radW
onal
i-T
est V
alue
Prob
abili
ty
12 14 11 16 24 31 47 61
9.75
5.08
13.2
12,
67-2
.131
7<
,05
11.0
94.
0612
.69
3.48
-ff-
-1,.0
526
ns
11.5
83.
1712
.23
3.16
-0.7
459
ns
11.0
03.
9212
.57
3.12
-2.2
558
<.0
5
12 14 11 16 24 31 47 61
12.6
72.
5313
.64
1 69
-1.1
231
ns
11.9
11.
3812
.88
2.00
-1.3
411
ns
13.6
22.
4113
.48
2.79
0.20
09ns
12.9
82.
32,
13.3
62.
37-0
.841
4fl
s
12 14 II.
16 24 31 47 61
2.92
5.66
.43
2.31
1.44
50ns
.82
3.40
.19
2.81
0.50
56ns
2.04
4.02
1.25
2.78
0.81
63ns
1.98
4.34
.79
2.69
1.65
48ns

TA
BLE
4-6
Inve
ntor
y of
Soc
ial W
ork
Kno
wle
dge:
Pra
ctic
e of
Soc
ial
Wor
k
Cyc
leS
tude
nti
Sta
rt a
lS
ocia
l Wor
k E
duca
tion
Cor
rela
tion
Of
Soc
iai W
ork
Edu
catio
nI-
res
.! V
alue
Bas
ed o
nD
iffer
ence
:!n
Lear
mng
.F.ta
ndar
dM
ean
Dev
iatio
nS
tand
ard
Mea
noe
vian
oniy
Sta
ndar
dM
ean
Dev
iatio
n
JJ 111
IV II-IV
Com
bine
d
Acc
e1er
attd
.T
rado
nal
t-T
est V
alue
Pro
babi
lity
Acc
eler
ated
Tra
ditio
nal
t-T
est V
alue
Pro
babi
lity
Acc
eler
ated
Tra
ditio
nal
t-T
est V
alue
Pro
babi
lity
Acc
eler
ated
Tra
ditio
nal
t-T
est V
alue
Pro
babi
lity.
12 14 11 16 24 31 47 61
13:8
310
.34
24.0
73.
83-3
.30s
0<
.05
24.1
86.
9023
.06
8,20
0.:i5
73is
23.2
53.
7124
.55
5.04
-1.0
995
ns
21.0
67.
8324
.05
5..7
5
-2.1
974
<.0
5
17 14 11 16 24 31 47 61
25.6
74-
.27
25.5
04.
850.
088.
7ns
27.2
75,
1226
.62
3.07
0.39
44ns
27.1
221
725
.84
4 65
1.36
06ns
26.7
93.
59'
25.9
74.
291.
0805
ns
11 16 24 31 47 61
11.8
311
.87
1.43
5.47
2.82
08<
.05
109
5.75
3.56
6.52
-0.1
863
ns
3.7
3 96
1 29
1 84
2.43
2S<
.05
5.13
1.81
1.92
5.05
2.88
93<
.05"

TA
BLE
4-7
:in
vent
ory
of S
ocia
l Wor
k K
now
ledg
e: T
otal
Sco
re
Cyc
leS
lude
ntS
Sta
rt o
fS
ocia
l Wor
k E
duca
tion
Sta
ndar
dM
ean
Dev
iatio
n
:om
plat
ion
ofS
ocia
l Wor
k E
duca
tion
Sta
ndar
dM
ean
Dev
idho
n
17T
est V
alue
Bas
ed o
nD
iffer
ence
in L
earn
ing
ndal
dM
ean
Dev
iatio
n
II
Acc
eler
ated
Tra
ditio
nal
t-T
est V
alue
.Pr
obab
ility
Acc
eler
ated
liiT
radi
tiona
lt-
Tes
t Val
uePr
obab
ility
Acc
eler
ated
ivT
radi
tiona
l.t-
Tes
t Val
uePr
obab
ility
.
Acc
eler
ated
Tra
ditio
nal
Com
bine
dt-
Tes
t Val
uePr
obab
ility
1258
,42
16.6
714
76.1
413
.61
2.86
71<
.05
1281
.25
11.9
414
86.6
411
.82.
-1.1
092
ns
1222
.83
14.7
814
10.5
09.
702.
4469
<.0
5
1170
.73
16.5
5iI
78.0
99.
3911
7.36
12.3
116
74.8
820
.24
1686
.62
11.0
316
11.7
413
.42
-0.5
413
-2.0
173
-0.8
302.
nsns
ns
2464
.50
14.0
824
83.4
88.
5424
18.9
613
.32
3170
.06
12.9
631
81.5
213
.32
3111
.46
8.31
1.50
490.
6560
-2.
4200
nsos
:..<
.05
4764
.40
15.6
2.47
81.6
49.
7247
17.2
414
.39
6172
.72
15.3
061
84.0
312
.49.
61-
11.3
110
.01
2.76
78.
-1.1
201.
2.40
87<
.0.5
ns<
.05
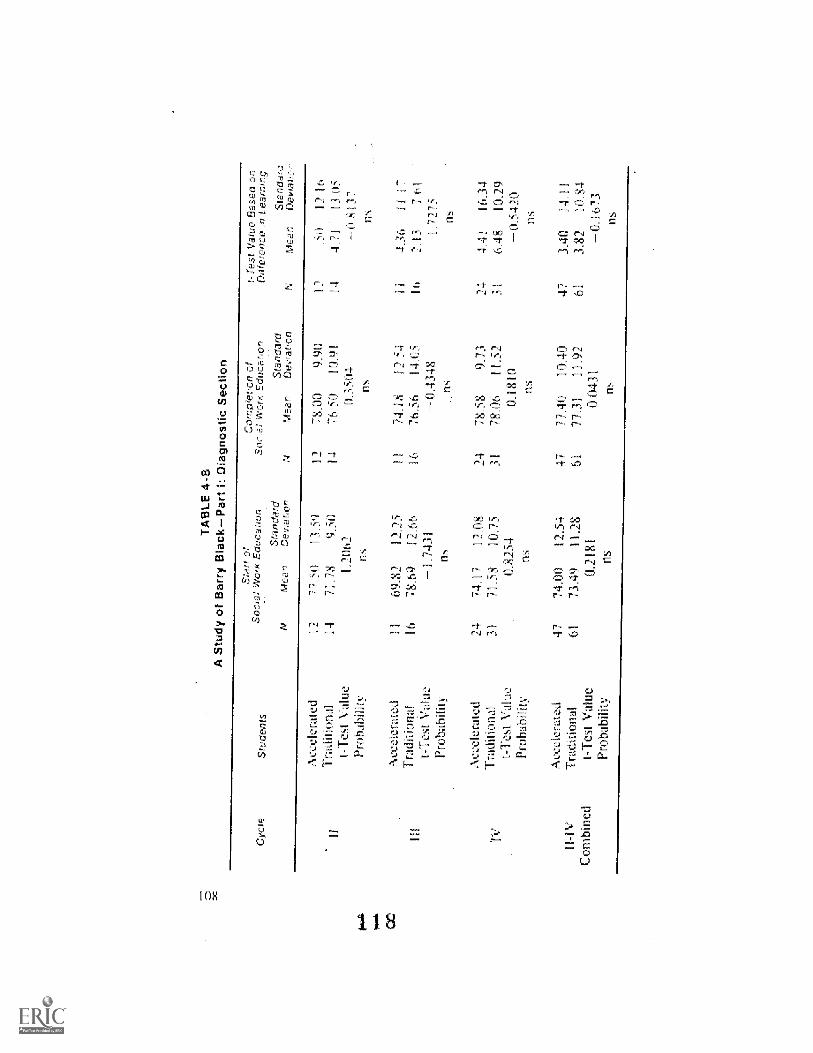
'OC
TA
BLE
4-8
A S
tudy
of B
arry
Bla
ck-P
art 1
: Dia
gnos
ticS
ectio
n'
Inal
,li.
...k
CC
Cyc
leS
%id
eals
Stan
of
Soc
oal W
on,-
Eck
dcaI
don
Sta
ndar
dM
ean
Dev
latio
n
C0m
al'e
r on
oil
Soc
,a.,'
Wor
k E
Ouc
a tlo
o
Sta
nda
rdM
e a
dD
evf a
non
Te.
s t V
alue
Bas
ed o
nO
xffe
renc
e n
Lear
nmg
Sta
nad
Met
atT
De
voa
s
11 111
'IV
Com
bine
d
A.c
cele
rate
dT
radi
tiona
lt-
Tes
t Val
uePr
obab
ility
Acc
eler
ated
Tra
ditio
nal
..
t.-T
est V
alue
Prob
abili
ty
Acc
eler
ated
Tra
thtio
nal
t-T
est V
alue
Prob
abif
ity
Acc
eler
ated
Tra
ditio
nal
I-T
esi V
alue
Prob
abili
ty
12 14 11 16 24 3) 47 61
77 5
013
.59
71.7
89.
..50.
1..7
1062
us
69.8
212
,25
78...
6912
..66
L74
31us
74.1
712
.08
71..5
810
..75
0,82
54us
74.0
012
..54.
73.4
911
.28.
0.21
81ns
1.2
14 11 16 24 31 47 61
78,0
09.
.90
76.5
010
..91
0.35
04.n
s
74-1
81'
2.5
476
.56
14.0
5-0
.434
8us
78.5
89.
7378
..06
11.5
20.
.181
0us
77.4
010
.40
77.3
111
..92
0.04
3.1
us
1.2
14 1.i.
16 24 31 47 61
.50
12.1
64.
.71
13.0
5-0
.813
7us
.
4.36
11A
72.
137.
611.
.727
5.
us
4.41
16.3
46.
4.8
10.2
9-0
.542
0us
3.40
14,1
13.
8210
.84.
-0..1
673
us

TA
BLE
4-9
A S
tudy
of B
arry
Bla
ck-P
art
Tre
atm
ent S
ectio
n
Cyc
leS
tude
nts,
Sta
rt o
fso
cial
WM
Ect
ucat
inn
Com
plet
ion
alS
ecta
t wor
k E
duca
tron
I-T
est V
aive
eas
ed o
nD
:orc
o n
Leat
mng
Sta
ndar
dM
ean
Dev
iabi
onS
tand
:a.e
dM
ean
a9 V
f a t
onS
tand
ard
Mea
nD
evia
tQn
11 HI
IV
.11-
IV
Com
bine
d
Acc
eler
ated
Tra
ditio
nal
t-T
est V
alue
Prob
abili
ty
Acc
eler
ated
.T
radi
tiona
lt-
Tes
t Val
uePr
obab
ility
Acc
eler
ated
Tra
ditio
nal
t-T
est V
alue
Prob
abili
ty
Acc
eler
ated
.T
radi
tiona
lt;r
est V
alue
.Pr
obab
ility
12 14 11 16 24 31 47 61
64.1
75.
.81
66.2
19.
01-0
.649
1.ns
.
62.8
28.
2863
.94
6.77
-0.3
706
ns
66.9
66.
9563
.06
6.71
2.09
21.
<.0
5
65.2
87.
1064
.02
7.29
0.90
40ns
12 14 I I
16 24 31 47 61
67.5
05.
2866
.29
7.17
0.46
55ns
65.0
97.
1565
.19
3.17
-0.0
459
ns
65.8
861
063
.61
6.85
1.29
21ns
66.1
16.
1064
.64
:6.1
91.
2311
ns
14 I I
16 24 31 47 61
3.33
6.51
.08
7.85
1.09
68ns
7.27
8.00
1.25
6.65
,0.
3475
ns
1.08
7.01
.55
5.89
-0.9
169
ns
.83
7.26
.62
6.48
0.15
38oS

TA
BLE
4-1
0A
. Stu
dy O
f Bar
ry B
lack
-Tot
al S
core
Cyc
leS
tude
nts.
Sta
rt o
fS
ocia
l Wor
k E
Ouo
a.bo
nC
ompl
etio
n of
Soc
rat W
ork
Eth
icat
xon
t-T
est V
ahie
Bas
ed o
nO
dier
ence
rn
Lear
neng
Sta
ndar
dS
tand
ard
Sta
nd
rM
ean
De
vi a
ti,o
nN
Mea
n0e
vaw
nN
Me
a n
yta
r C
Acc
eler
ated
1214
1.67
14.5
912
.14
5.50
14.1
212
3.83
'10.
99
Tra
ditio
nal
1413
3.00
13.5
9.14
142.
7912
...53
144.
7914
.57
if1.
-Tes
1 V
alue
.0.
6369
0.49
88-0
1784
Prob
abili
tyns
ns.n
s
Acc
eler
ated
1113
2.64
17.9
011
139.
.27
15...
2911
6.63
15.9
9T
radi
tiona
l16
142.
6218
.39
1614
1.75
14.9
616
0.87
10.7
,5E
lit-
Tes
t Val
ue-1
.349
0-0
.403
11.
4044
Prob
abili
tyns
nsns
Acc
eler
ated
2414
E12
13.9
9.24
14+
,46
12.9
824
3.34
A7.
69
1VT
radi
tiona
l31
134.
6513
.60
3114
1.68
13.5
431
.7.
0310
.26
1.-T
est V
alue
1,32
470.
7732
-0,9
124.
Prob
abili
tyri
sas
...
as
Acc
eler
ated
4713
9.28
1.2
4.47
143.
5113
.73
474.
2315
.58
11.-
1VT
radi
tiona
l61
137,
5115
1161
141,
9513
.49
614.
441.
1 77
Com
bine
dI-
Tes
t Val
ue0.
6001
0.58
98-0
.076
5Pr
obab
ility
nsns
ns

0
TA
BLE
4-1
1A
Stu
dy o
f Bar
ry B
lack
-Psy
chos
ocia
l Dyn
amic
s; S
uppi
emen
tary
Item
s (S
peci
fic)
Sta
n of
Com
plet
ion
ot.t.
Tes
.t V
a)ue
Bas
ed o
nS
ocia
l Wor
k E
duca
tion
Soc
ial W
ork
Edu
catio
nD
iffer
ence
in L
earn
ing
Cyc
leS
tude
nts
.
Sta
ndar
dS
tand
ard
..
Sta
ndar
dN
Mea
nD
evia
tion
NM
ean
Dev
iatio
nN
Mea
nD
evia
tion
Acc
eler
ated
121.
42.9
1311
1.83
.72
12,.4
21.
44T
radi
tiona
l.14
1.50
1.02
141.
57.5
1.'.
1.4
.07
.99
111-
Tes
t Val
ue-0
.210
71.
0379
.0.
6891
Prob
abili
tyns
nSris
Acc
eler
ated
111.
82.9
811
1.82
137
11.0
01.
48T
radi
tiona
l16
1.19
.75
162.
00.9
716
_81
1.11
111
11t-
Tes
t Val
ue1.
8186
-0.4
242
-1.5
660
b.,
Prob
abili
tyns
nsns
Acc
eler
ated
241.
381.
1324
1.46
.83
24.0
81.
35
1VT
radi
tiona
l31
1.42
1.12
311.
90.9
131
.48
1.21
.t-
Tes
t. V
alue
-0.1
446
-1.8
888
-1.1
429
Prob
abili
tyns
nsns
Acc
eler
ated
471.
491.
0447
1.64
.90
47.1
51.
38II
-1V
Tra
ditio
nal
611.
381.
0061
1.85
.85
61.4
71.
15C
ombi
ned
t.-T
est V
alue
0.56
52-1
.258
1.-1
.307
7Pr
obab
ility
.ns
nsns
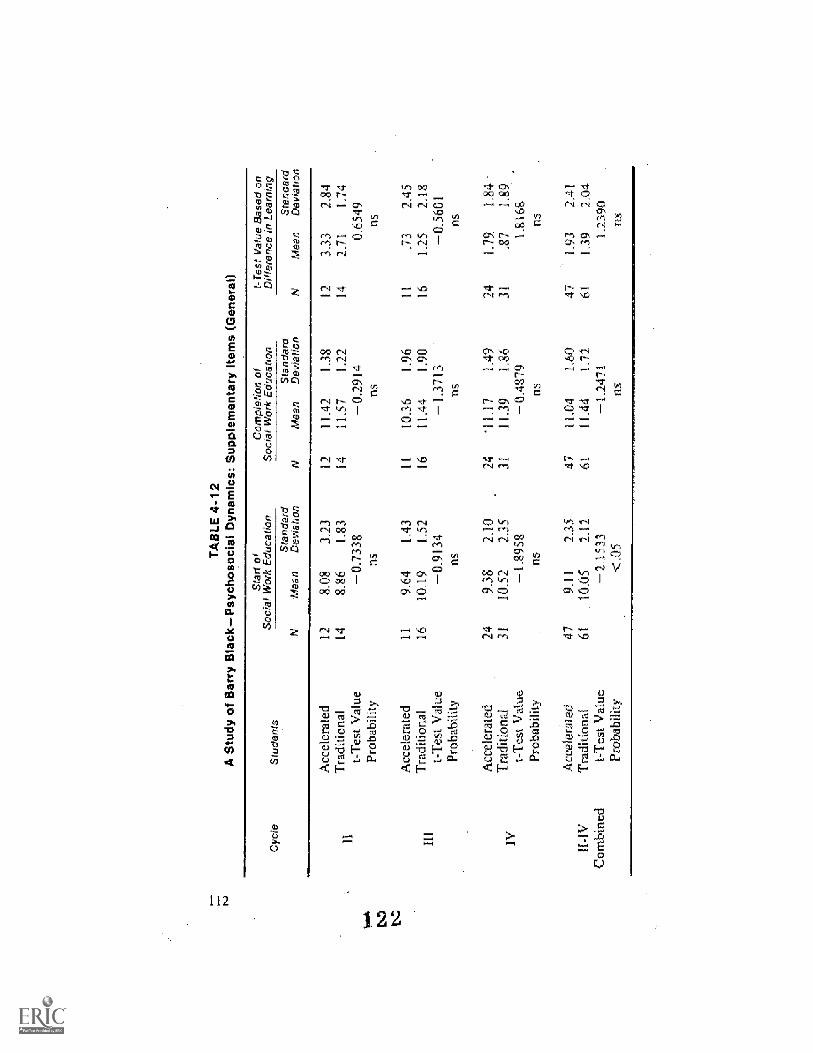
TA
BLE
4-1
2A
Stu
dy o
f Bar
ry B
lack
-Psy
chop
ocia
l Dyn
amic
s::
Sup
plem
enta
ry It
ems
(Gen
eral
)
Cyc
leSt
uden
ts
Sta
rt o
fS
ocia
l Wor
k E
duca
tion
Com
plet
ion
ofS
ocia
l Wor
k E
duca
tion
t- T
est
Val
ue B
ased
onD
iffer
ence
'in
Lear
ning
Sta
ndar
dM
ean
Dev
iatio
nS
tand
ard
Mea
nD
evia
tion
Sta
ndar
dM
ean
Dev
iatio
n
11 111 Iv
Com
bine
d.
Acc
eler
ated
Tra
ditio
nal
t-T
est V
alue
Prob
abili
ty
Acc
eler
ated
Tra
ditio
nal
t-T
est V
alue
Prob
.abi
lity
Acc
eler
ated
Tra
ditio
nal
t-T
est V
alue
.Pr
obab
ility
Ace
& e
rate
dT
radi
tiona
lt-
Tes
t Val
uePr
obab
ility
12 14 1.1. 16 24 31 47 61
8.08
3.23
8.86
1.83
-0.7
338
ns
9.64
1.43
10.1
91.
52.
-0.9
134
ns
9,38
2.10
10.5
22.
35-1
.895
8ns
9.11
2.35
10.0
52.
112
1533
.05
12 14 11 16 24 31 47 61
11.4
21.
3811
.57
1.22
-0.2
914
ns
10.3
61.
9611
.44
1.90
-1.3
713
ns
-11.
171.
4911
.39
1.86
-0.4
879
ns
11.0
4.1
...60
11.4
41.
71.
-1.2
471
12 14 11 16 74 31 47 61
3.33
2.84
2.71
1.74
'0.6
549
ns
.73
2.45
1.25
2.18
-0.5
601
ns
1,79
1.84
.27
1.29
1.81
68n5
1.93
2.41
1.39
2.04
1.23
90.
ns

TA
BLE
4-1
3M
easu
rem
ent o
f Atti
tude
s an
d R
esea
rch
Kno
wie
dge-
Atti
tude
s
Cyc
leS
tude
nts
Sla
rl of
Soc
ial W
ork
Edu
catio
nS
ooia
ir
N
Com
pfet
ion
ofW
ork
Edu
catio
nT
ea::
e B
ased
on
adte
tenc
Ei L
earm
ng
Sta
ndar
d'N
MeA
rTD
elro
abor
Sta
ndar
dM
ean
Dev
iatio
nS
tand
ard
Mea
nD
e V
ra P
on
Acc
eler
ated
1.2
9.25
1.96
128.
921.
78,1
.44
11T
radi
tiona
lt-
Tes
t Val
ue14
8.79
2.26
0.53
3314
8.71
2.23
0.24
2611
4-0
.07
2_21
1'
-1)3
391
Prob
abili
tyns
ns11
11S
Acc
eler
ated
.11
8.27
2.33
118.
001.
8411
-0.2
72.
65"
11[1
.
Tra
ditio
nal.
t-T
est V
alue
168.
812.
07.
-0.6
083
168.
941.
98-1
.195
216
..1
32.
31-
0 39
86Pr
obab
ility
nsns
ns
Acc
eler
ated
249.
501.
6724
9.08
1.53
24-0
.42
2.21
Tra
ditio
nal
319.
612.
2631
8.48
1.95
31-1
.13
2.25
t-T
est V
alue
.-0
.213
01.
2786
1.17
83Pr
obab
ility
nsns
ns
Acc
eler
ated
479.
151.
9347
8.39
.1.6
947
-0.3
62.
11T
radi
tiona
l.61
9.21
2.21
618.
662.
0061
-0.5
52.
29co
mbi
ned
t-T
est V
alue
-0.1
605
0.36
970.
4602
'Pr
obab
ility
nsns

TA
BLE
4-1
4M
easu
rem
ent o
f Atti
tude
s an
d R
esea
rch
Kno
wle
dge-
Atti
tude
s an
d K
now
ledg
e
Cyd
eS
tude
nts
Sta
rt o
fS
ocia
l Wor
k E
duca
bon
Soc
sal
N
Com
ptet
ion
orW
ork
Edu
catio
n1-
Ted
Dif
fere
nce
Vat
ue B
ased
on
o'n
Lea
rdng
Stan
dard
Mea
nD
evia
bon
Stan
dard
Mea
nD
evia
tion
Sta
ndar
dM
ean
Dev
lano
nN
11 III IV II-1
VC
ombi
ned
Acc
eler
ated
'Tra
ditio
nal
t-T
est V
alue
Prob
abili
ty
Acc
eler
ated
.T
radi
tiona
lt-
Tes
t Val
uePr
obab
ility
Acc
eler
ated
.T
radi
tiona
lt-
Tes
t Val
uePr
obab
ility
Acc
eler
ated
.T
radi
tiona
lt-
Tes
t Val
uePr
obab
ility
12 14 11 16 24 31 47 61
2.42
1.16
2.50
1.56
-0.1
465
ns
2.91
1.22
2.94
1.44
-0.5
16.
ns
2.58
0.78
3.10
1.33
1.79
59ns
2.62
0.99
2.92
1.41
-1.3
:043
ns
12 14 11 16 24 31 47 61
2.64
0.92
? .5
71.
090.
3359
ns
2.55
0.57
3.06
1..1
. 2
1.37
03ns
2.58
1.28
2.48
1.15
.
0.29
82ns
2.59
LO
52.
661.
14-0
.324
3ns
12 14 11 16 24 31 47 61
.2 )
L42
.07
1.21
0.36
72ns
...36
V .2
7
.12
1.26
t .94
5401
S
.t rk
i;:t
1 .4
t
-.62
1.23
.
1.68
6.3
ns
.03
1.37
.26
1.26
0.92
78ns
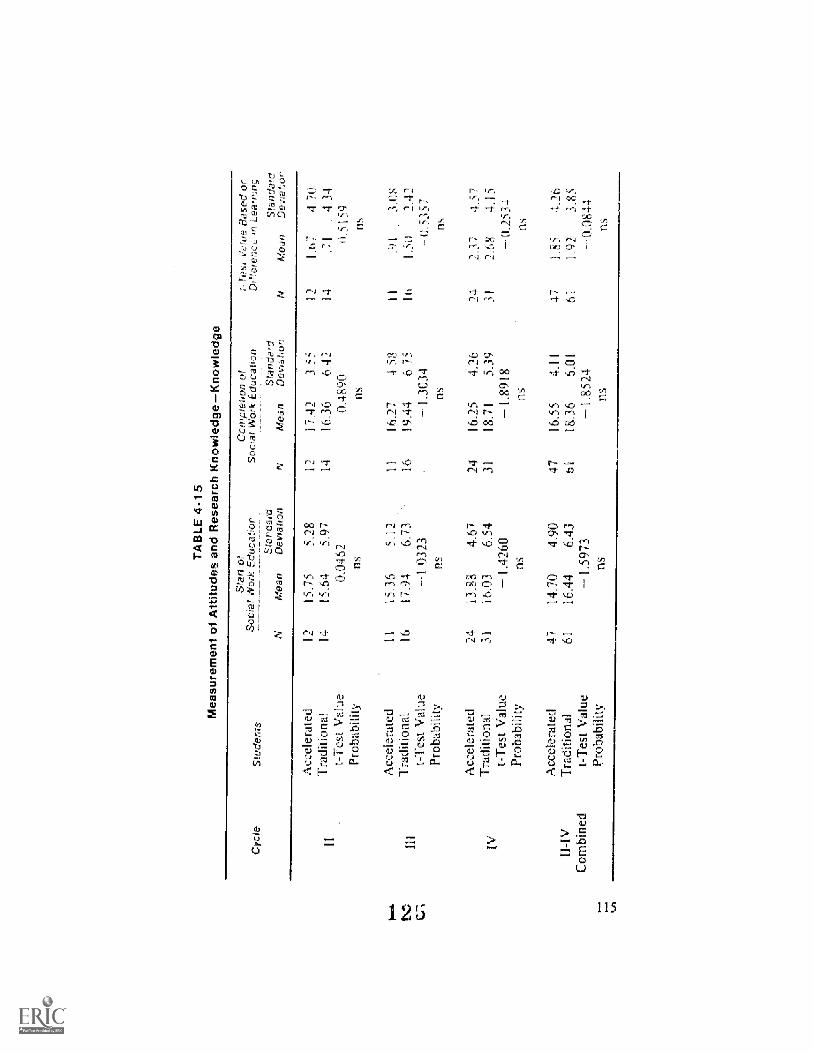
U.;
TA
BLE
4-1
5M
easu
rem
ent o
t Atti
tude
s an
d R
esea
rch
Kno
wle
dge-
Kno
wle
dge
Cyc
ieS
tude
ms
Sta
rr d
iS
ocia
l! W
ork
Elu
cabo
nC
ompl
euon
of
Soc
ia W
ork
Edo
caC
jon
Sia
ndar
dM
ean
Dev
oato
on
r- T
esr
Va,
'ue
Bas
ed o
nD
Mer
ence
n L
eara
hng
Sta
ndar
dN
nD
ev,o
n,or
Sta
ndaf
dM
ean
Deo
afio
n
1H IV
11-1
V
Com
bine
d
Acc
eler
ated
Tra
ditio
nal
t-T
est V
alue
Prob
abili
ty
Acc
eler
ated
Tra
ditio
nal.
t-T
est V
alue
Prob
abili
ty.
Acc
eler
ated
Tra
ditio
nal
I-T
est V
alue
Prob
abili
ty
Acc
eler
ated
Tra
ditio
nal
t-T
est V
alue
Prob
abili
ty
12 14 H 16 24 31 47 61
15.7
55.
2815
.64
5.97
0.04
62as
15.3
65.
1217
.94
6.73
-1 0
323.
RS
13.8
84.
6716
,03
6.54
-1.4
260
as
14.7
04.
9016
.44
6.43
-1.5
973
ns
.1.2 14 H 16 24 31 47 61
17.4
23.
5516
.36
6.42
0.48
90as
16..2
74.
5819
.44
6.75
-1.3
034
as
16.2
54.
26.
18.7
15.
39-1
.891
8as
16.5
54.
1113
.36
6.01
-1.8
524
ns
12 14 11 16 24 31 47 61
1.67
4.70
.74.
340.
5159
as
.1,..
)13.
08.5
i11.
410.
5357
ns
2.37
4.57
2.68
4.15
0.25
34as
1.85
4.26
1.92
3.85
0.08
44ns

TA
BLE
4-1
15
a,M
easu
rem
ent o
f Atti
tude
s an
d R
esea
rch
Kno
wle
dge-
Tot
al S
core
IN.7
1
Cyc
teS
tude
nts
Sta
rr o
fS
oc,r
al lo
Vor
k E
duca
toon
Sta
nda
rdN
'M
ea n
De
wa
toon
Cor
npo'
etw
n of
..0f e
z.,
'.V
a ,.1
.yn
Bds
ed 1
0,;.1
Soc
vai,
MID
,* E
duc
a N
o 1,
oD
d t e
v en
u :
,..,
n Le
a r
n i'
rT g
..
.....
...
._.
._
.
Sta
nda
r d
Sta
nda
rcl
N04
ea
nD
e w
nN
Med
fi'
Dev
Iiiso
.c.,
11 11 lv
1111
-1V
Com
bine
d
Acc
eler
ated
Tra
ditio
nal
t-T
est V
alue
.P
roba
bilit
y
Acc
eler
ated
Tra
ditio
nal
t-T
est V
alue
Pro
babi
lity
Acc
eler
ated
Tra
ditio
nal
t-T
est V
alue
Pro
babi
lity
Acc
eler
ated
Tra
.diti
onal
t-T
est V
alue
Pro
babi
lity
12.
14 11 16 24 31 4.7
61
27.4
26.
2926
.93
6.58
0.18
49'
ns
26.5
56.
8529
.69
7.83
-1.0
369'
ns
25.9
64.
7428
.77
8.66
-1.5
368
ns
26.4
75.
5928
.59
7'35
-1.6
270
ns
12 14 11 16 24 31 47 61
28.6
7-
4.96
27.6
47.
500.
3875
ns
2'6.
825.
5531
.44
7.55
-1.6
670
ns
27.9
24.
9929
.68
6.46
-1.1
411
ns
27.8
55.
0'4
29.6
77.
01
-1.5
697
Os
12 14.
11 16 14 31 47 61
1.25
5.41
76.
811:
)
0.11
111
ns
.27
4.27
1.75
3.21
.
-0.9
861
ns
1.96
5.52
, 91 0.
7128
ns
1..3
85.
.16
1.08
5.20
0.29
94ns

TA
BLE
4-1
7S
ocia
l Wor
k V
alue
s T
est-
Pub
lic A
id v
s. P
rivat
e E
ffort
Cyc
Stu
dent
sS
ocia
Sta
rt o
fW
ork
Edu
ca tt
onC
ompr
eno
n of
SocJ
& W
ork
Edu
caix
on
Stan
dard
Mea
nD
evra
tion
Tes
t V
alu
e B
ased
on
Dot
tere
nce
J'n
Lear
ning
Sta
ndae
oM
ean
De
via
ttc n
Stan
dard
Mea
nD
evta
tton
11 111
1V
1I-1
VC
ombi
ned
Acc
eler
ated
Tra
ditio
nal
t-T
est V
alue
Prob
abili
ty
Acc
eler
ated
Tra
ditio
nal.
t-T
est V
alue
Prob
abili
ty.
Acc
eler
ated
Tra
ditio
nal
t-T
est V
alue
Prob
abili
ty
Acc
eler
ated
Tra
ditio
nal
t-T
est V
alue
Prob
abili
ty.
12 14 1.1 16 24 31 47 61
15.0
013
614
.64
1.78
0..4
927
as
14.2
72.
84.
14.0
02.
850.
.254
2ns
14.4
61.
3814
.23
1.48
0.60
04ns
14...
551.
7014
..26
1.97
0.82
23ns
12 14 11 16 24 31 47 61
14.5
01.
881
4.92
1.69
-0.5
882
ns
14.3
61.
9113
.75
1.77
0.82
42ns
14.5
81.
53.
14.5
51.
710.
07'9
8ns
14.5
11.
6814
.43
1.75
0.25
45ns
12 14 11 16 24 31 47 61
0.50
0.29
137
-0.8
125
ns
.09
1..7
60.
.25
2.61
0.36
28ns
.12
1.23
.32
1.70
0.50
02ns
0,04
1.68
.16
2.11
0.56
65ns
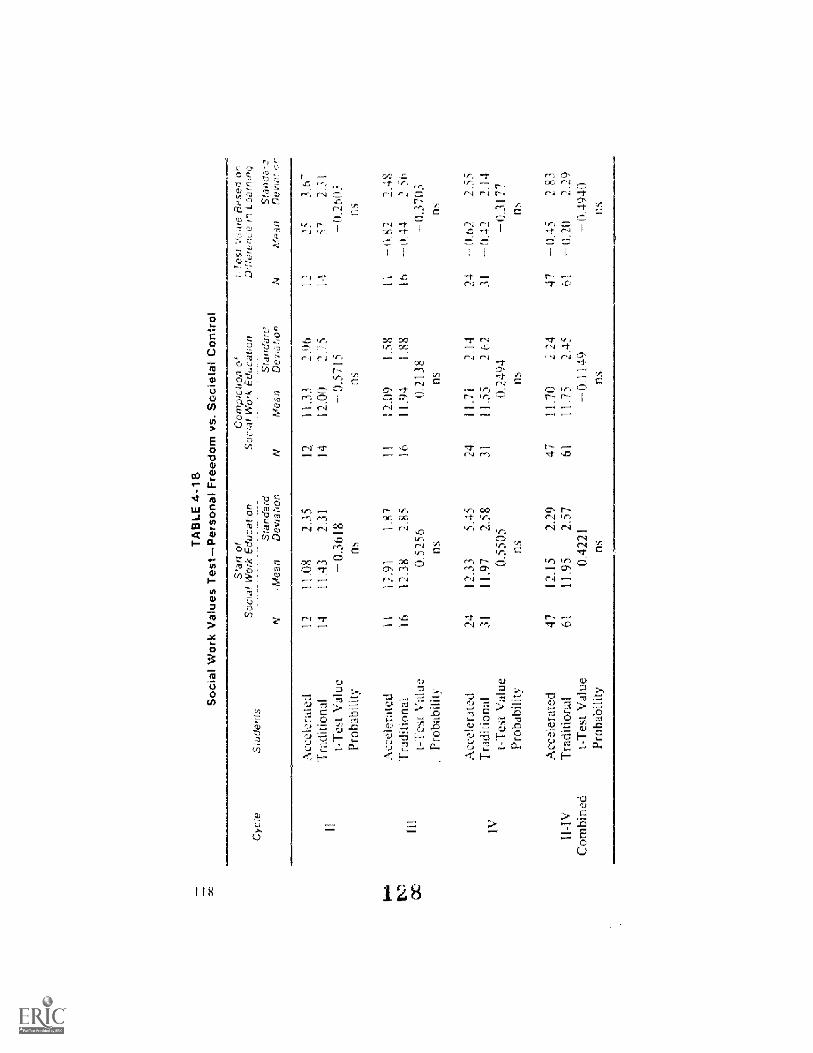
TA
BLE
4-1
8.S
ocia
l Wor
k V
atue
s T
est-
Per
sona
l Fre
edom
vs.
Soc
ieta
l' C
ontr
ol
Cyc
reS
rude
nfs
Sta
rt o
fS
acoa
r W
ork
Edu
calro
n
Sta
ndar
dM
ean
Dew
atro
n
Com
pref
ron
Soc
ial'
Wor
k E
duca
Lon
Sita
ndar
cN
Mea
nD
evo
a tr
on
T e
.,s.r
"Vdo
ue B
ased
on
affe
renc
e o.
n Le
a ro
qrg
Sta
nda-
0M
rzan
DeJ
11
.Acc
eler
a.te
dT
ratf
irtio
nal
t-T
est V
alue
Prob
abili
ty
12 1411
.08
2.35
11.4
32.
31-0
.361
8ns
12 1411
.33
2.96
12.0
02,
-? 5
0.57
15.
as.
12 1..1
.25
3,6-
.57
2.31
0.26
03as
,
1....
6A
ccel
erat
ed11
12.9
11.
8711
12.0
91.
5811
0.8.
22.
48.
Tra
ditio
nal
1612
.38
2.85
1611
.94
1.88
160.
442.
56
C C
i it-
Tes
t Val
ue0.
5256
0.21
380.
3703
.Pr
obab
ility
as,
asas
Acc
eler
ated
2412
.33
.5.4
524
11.7
12.
14.
240.
622.
55T
radi
tiona
l31
11.9
72,
5831
11.5
52.
62.3
1-0
.42
2.14
.
t-T
est V
alue
0.55
050.
2494
-0.3
177
Prob
abili
tyas
nsas
Acc
eler
ated
.47
12.1
52.
.29
4711
.70
i' .2
447
-0.4
52.
8311
-.1V
Tra
ditio
nal
6111
.95
2.57
6111
.75
2.45
610.
202.
)9
Com
bine
dt-
Tes
t Val
ue0.
4221
0.11
490.
4940
Prob
abili
tyns
nsns

TA
BLE
4-1
9S
ocia
l Wor
k V
alue
s T
estP
erso
nal G
oals
vs.
Mai
nten
ance
of G
roup
.
Cyc
leS
tude
rors
Sta
rt o
f.S
oco.
,V W
ork.
Edu
cato
on.
.
Sta
nda.
rdM
ean
Dev
.oa
roon
,
Com
pfer
foo
ofS
o ,-
,ar
.Eda
cafr
of,
Sta
ndar
dN
Mea
nD
evl,a
,cpn
r- r
es.!
Iidrf
lese
a or
iD
v,of
e.re
nce
Lear
epay
Si!a
ndac
NM
aD
owai
!'o1.
1
Acc
eVer
ated
210
58
2 35
2V
2. (
0)L
651.
21.
411
03T
radi
tiona
l14
10.5
7L
8314
V 1
.79
8914
12
1[8
1t-
Tes
t Val
ue0.
0139
0.40
280
2(15
3Pr
obab
ility
as
Acc
eler
ated
.11
11.8
22.
9.3
1111
.73
7..0
iI
I--
0.9I
92.
11
111
Tra
ditio
ruil
t-T
est V
alue
161
1 .8
12.
070.
0057
161
t .5,
61.
51u
11).
2346
I 6)5
2 79
1).1
5211
)
Prob
abili
ty.
nsns
(Ts
Acc
eler
ated
2411
.75
1.75
.24
1.7,
252.
.i3
24.5
024
3
INT
radi
tiona
lt-
Tes
t Val
ue31
11.7
11.
530.
0894
.31
I L
611
..63
1..2
157
3 1
D. 1
01
1610
1 .0
400
Prob
abili
tyas
nsas
Acc
eler
ated
47It
.47
2.23
4712
.06
1.96
4711
-1V
Tra
ditio
nal
6111
.48
1.79
611
L64
1.44
61.
I2
.(11
-7
Com
bine
dt-
Tes
t Val
ue0.
0184
.1.
2481
1..0
157
Prob
abili
tyns
ris

TA
BLE
4-2
.0S
ocia
l Wor
k V
alue
s T
est-
Soc
ial C
ausa
tion
vs. i
ndiv
idua
l Aut
onom
y
Cyc
leS
tude
nts
Sta
n of
Sob
et W
ork
Edu
catio
nC
ompi
ehon
of
Soc,
,a;
Wor
k E
duca
b,on
Stan
dard
NM
ean
Dev
la n
on
V-
Tes
t Ila
iue
Bas
ed o
nD
ofle
renc
e o.
nL
earn
ing
Stan
dard
Mea
nD
evia
hon
Stan
dard
Mea
nD
evia
tion
Acc
eler
ated
.1.
213
.83
1.59
1214
.50
1267
!61
Tra
ditio
nal
1413
.21
1.71
1414
.29
1.54
141
07A
116
I-T
est V
alue
0.91
180.
3065
-0.5
301
Prob
abili
tyns
asns
.0E
1c4
2A
ccel
erat
ed11
13.2
77.
45.
11.
13.5
51.
6911
.28
1..7
9C
Tra
ditio
nal
1613
.94
1.77
1613
.12
1.89
I 60.
822,
01t-
Tes
t Val
ue0.
7870
01.5
692.
1.38
63Pr
obab
ility
asas
.as
Acc
eler
ated
2413
.79
1.82
2413
.58
1.61
240,
-.)
.1
Lb7
Tra
ditk
ioal
3112
.87
2.28
3113
.10
1.81
31.2
32.
17t-
Tes
t Val
ue1.
6677
1.05
050.
8387
Prob
abili
tyas
asas
Acc
eler
ated
4713
.68
1.90
4713
.81
1.71
47.1
31.
69II
-IV
Tra
ditio
nal
6113
.23
2.05
6112
.38
1.82
61.1
52.
17C
ombi
ned
t-T
est V
alue
1.18
141.
2627
-10.
0535
Prob
abili
ty.
nsas
as

TA
BLE
4-2
1S
ocia
l Wor
k V
alue
s T
est-
Plu
ralis
m v
s., H
omog
enei
ty
Cyc
teS
tude
nts
Sta
n of
Soc
.rat
Wor
k E
duca
non
Com
pleb
on o
f.S
oclia
ll' W
ork
Edu
catp
on
Sta
ndar
dS
tand
ard
Mea
nD
evra
tion
NM
ean
Dev
xat f
on
1- T
ess
Vah
.oe
.Bas
ed o
nD
x!'ro
renc
eea
mon
g
Sta
ndar
dM
ean
Dev
raso
r
Acc
eler
ated
1214
.33
1.87
1 2
14.0
82,
35
Tra
ditio
nal
1413
.21
2.39
1414
.36
1.39
t-T
est V
alue
1.26
030.
3524
Pro
babi
lity
nsns
Acc
eler
ated
1114
182.
13.
Tra
ditio
nal
1614
.50
1.46
t-T
est V
alue
-0.4
423
Pro
babi
lity.
ns
11.1
12.8
21.
8316
13.2
52.
21.
0.51
43n.
s
- 0.
251,
66
141.
142.
48L.
5911
Os
111.
361.
.75
161.
25I .
98
n.s
Acc
eler
ated
2414
.38
1.91
2413
.58
1.53
240.
801.
91
Tra
ditio
nal.
3114
.16
1..5
9.3
113
.61
1.80
310.
552.
01.
IVt-
Tes
t Val
ue0.
4423
0.06
580.
4574
Pro
babi
lity
n.s
nsns
Acc
eler
ated
4714
.32
1.91
Tra
ditio
nal
6114
.03
1.81
Com
bine
d.t-
Tes
t Val
ue0.
7902
Pro
babi
lity
ns
4713
.53
1.85
.
6113
.69
1.85
0.43
61ns
470.
791.
82.
61-0
.34
2,26
1.12
96ns

TA
BL
E 4
-22
Soci
al W
ork
Val
ues
Tes
t-Se
cula
rism
vs.
Rel
igio
sity
.
Cyc
teS
tude
nts
Sta
rt o
tS
ocia
t Wor
k E
duca
tron
Sta
ndar
dM
ean
Dev
iatio
n
Com
pteb
on o
tS
ocra
i Wor
k E
duca
ncn
Sta
ndar
dN
Mea
nD
ifia6
on
t- T
est V
a.h,
,e B
ased
o.n
Diff
eren
ce o
n Le
arni
ng
Sta
ndar
dN
Mea
nD
ewar
.;on
Ii III
IV 1I-I
VC
ombi
ned
Acc
eler
ated
Tra
ditio
nal
t-T
est V
alue
Prob
abili
ty
Ace
elet
ated
Tra
ditio
nal
t-T
est V
alue
Prob
abili
ty
Acc
eler
ated
Tra
ditio
nal
t-T
est V
alue
.Pr
obab
ility
Acc
eler
ated
Tra
ditio
nal
t-T
est V
alue
Prob
abili
ty
12 14 11 16 24 31 47 61
13.8
32.
5914
.14
.2.7
1-0
.284
6ns
15.0
01.
1813
..88
2..9
21.
1661
.ns
14.4
21.
6913
.97
2.06
0.88
76ns
14.4
01.
8713
.98
2.42
1.01
87ns
12 14 11
16 24 31 47 61
15.3
31
3714
.43
1.79
1.37
48ns
14.5
51.
44.
14.1
92.
290.
4429
ns
14.4
21.
7414
.03
2..3
00.
7048
ns
14.6
81.
6014
.16
.2.1
61.
4267
ns
1, 2 14
.
H 1.tr
,
24 11 47 61
1.50
1.5'
.29
2.05
11.6
071
ns
0 45
1.57
..31
1.35
-1.3
031
ns
0.00
1 79
.06
1.63
0.13
76ns
.28
1,82
.18
1.65
0.28
44ns
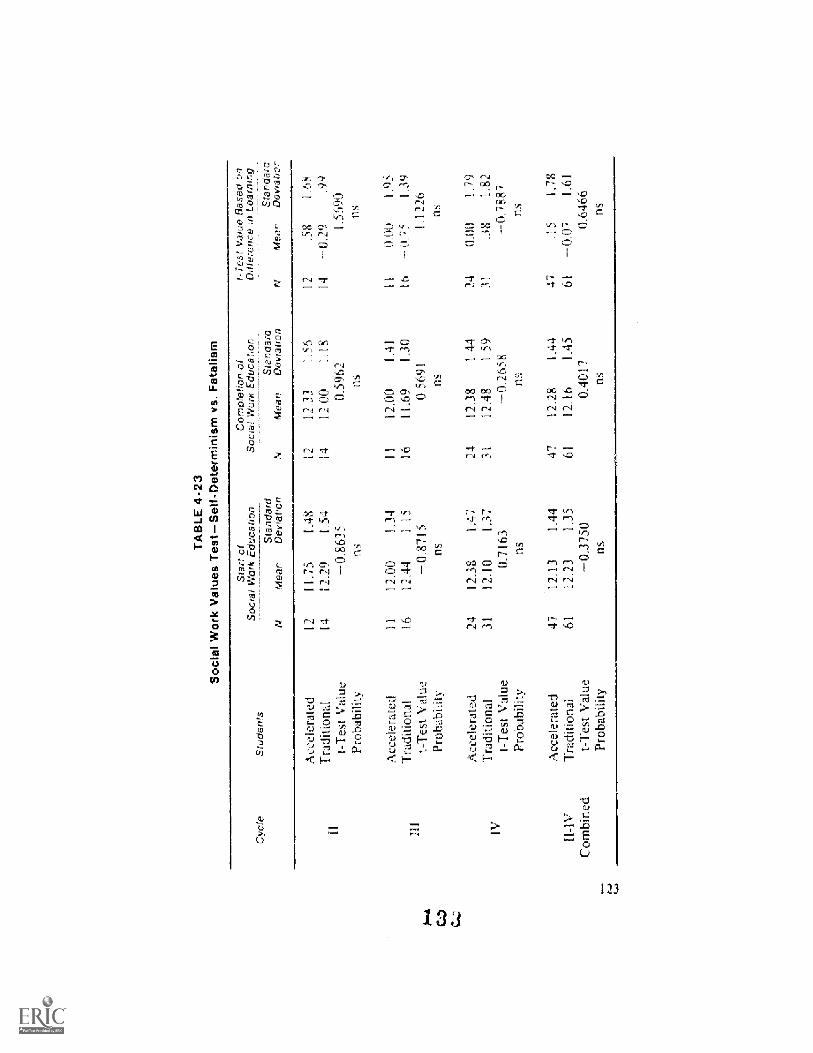
TA
BLE
4-2
3S
ocia
l Wor
k V
alue
s T
est-
Sel
f-D
eter
min
ism
vs.
Fat
alis
m
Cyc
leSt
uden
tsSo
cial
Stan
al
Wor
k E
duca
tion
Com
plet
ion
ofSo
chV
Wor
k E
duca
toon
Stan
dard
Mea
nD
evra
llon
r- T
esr
Val
ue B
ased
on
Dot
tere
nce
on L
earm
ngSt
anda
rdM
ean
Dev
iatio
nSr
anda
rdM
ean
Dev
iatio
n
Acc
eler
ated
1211
.75
1.48
1212
,33
1,56
.58
L68
Tra
ditio
nal
1412
.29
L54
I 4
12.0
01.
114
-0.2
9:9
9
t-T
est V
alue
-0,8
635
0.59
621.
5590
Prob
abih
tyns
nsns
Acc
eler
ated
I1
12.0
01.
3411
1.2.
001.
4 I
110.
.00
1 .0
5,
Tra
di0o
nal
1.6
12..4
41.
1516
11.6
9L
1016
-'0.7
,51.
39
t-T
est V
alue
-0%
8715
0.56
911.
1226
Prob
abili
tyns
nsns
Acc
eler
ated
.7.4
12.3
81.
4724
12.3
81.
4424
0.00
1
IVT
radi
tiona
lt-
Tes
t Val
ue31
12.1
01.
370.
7163
1112
.48
1.59
-0.2
658
11.3
8L
82.
0.78
87
Prob
abili
tyns
nsns
.A
ccel
erat
ed47
12..1
31.
4447
12.2
81,
4447
,15
1.78
11-I
VT
radi
tiona
l.61
12.2
3L
3561
12.1
61.
4561
- 0.
07I
.61.
Com
bine
d.t-
Tes
t Val
ue-
0.37
500.
4017
0.64
66
Prob
abili
ty.
nsns
ns

TA
BLE
4-24
Soci
al W
ork
Val
ues
Tes
t-Po
sitiv
e Sa
tisfa
ctio
n vs
Str
uggl
e-D
enia
l
Cyc
leS
tude
nts
Sta
rr o
fS
ocia
l Wor
k E
duca
tion
Com
plet
ion
ofS
od4,
a1 W
ork
Edu
canc
n
Sta
ndar
dM
ean
Dev
oatw
o
t- T
est V
alue
Bas
ed o
nT
hile
renc
e ri
Lear
nmg
Sta
ndar
dM
ean
Dev
,i,an
orS
tand
ard
Mea
nD
evia
tion
I I
111
IV
II-I
VC
ombi
ned
Acc
eler
ated
.T
radi
tiona
lt-
Tes
t Val
uePr
obab
ility
Acc
eler
ated
Tra
ditio
nal
t-T
est V
alue
Prob
abili
ty
Acc
eler
ated
Tra
ditio
nal
t-T
est V
alue
Prob
abili
ty.
Acc
eler
ated
Tra
ditio
nal
t-T
est V
alue
Prob
abili
ty
14 11 16 24 31 47 61
12.4
22.
5412
.07
2.30
0.34
92ns
12.8
22.
8211
.62
2.68
1.07
03ns
12.4
62.
3611
.74
2.52
1.08
49n.
,s
12.5
32.
4711
.79
2.48
1.55
36ns
12 14 1 i
16 24 31 47 61
13.6
72.
4612
.57
2, 9
00.
9880
ns
13.0
02.
051.
1.81
2.07
1.41
40ns
12.3
32.
2211
.71
2.02
1.07
44ns
12.8
32.
2711
.93
2.25
2.04
10<
,.05
12 14.
11 16 31 47 61
1.25
1..9
1
.50
3.92
0.58
,06
n s
.18
2.68
.19
2.32
-0.0
057
ns
0.13
1.96
-0.0
32
020.
1714
.ns
.30
2.17
.14
2.60
0.32
75 s

TA
BLE
4-2
5S
ocia
l Wor
kV
alue
s T
est-
Soci
al P
rote
ctio
n,vs
. Soc
ial R
etrib
utio
n
Cyc
leS
tude
nts
Sta
rt o
fS
ocia
l Wor
k E
duca
tion
Com
piet
icn
ofS
ocia
l Wor
k E
duca
tion
Tes
r V
alue
Bas
ed o
nO
ttler
ence
tn L
earn
ing.
Sta
ndar
dM
ean
Dev
iatio
nN
Sta
ndar
dM
ean
Dat
onN
Sta
ndat
dM
ean
Dev
iatio
n
II
Acc
eler
ated
Tra
ditio
nal
t-T
est V
alue
Prob
abili
ty.
12 1414
..25
1.81
12..6
41.
952.
.080
4<
.05
12 14
14.2
52.
1812
.93
2.06
1.52
69
12 14
0,00
2.04
192.
33-0
3164
Acc
eler
ated
1114
..73
1..4
911
13.3
62.
5411
1.37
1.96
III
Tra
ditio
nal
t-T
est V
alue
1613
.38
2.13
1.75
5816
12.6
91.
740.
7897
16-0
.69
2.50
-0.7
242
Prob
abili
tyns
nsns
Acc
eler
ated
2413
.88
2.09
2413
.54
1.96
24-0
.34
1.88
IVT
radi
tiona
l.t-
Tes
t Val
ue31
12.3
92.
442.
4293
3112
.87
1.65
1.34
9631
.48
2.46
.-1
.395
8Pr
obab
ility
<.0
5ns
ns
Acc
eler
ated
.47
14.1
71.
8947
13.6
82:
1447
-0.4
91.
97II
4VT
radi
tiona
l61
12.7
02.
2661
12,8
41.
74.
61.1
42.
45C
ombi
ned.
t-T
est V
alue
.3.
6639
2.20
30-1
.459
2Pr
obab
ility
<.0
5<
..05
ns

TA
BL
E4-
26,
Soc
ial W
ork
Val
ues
Tes
t-in
nova
tion-
Cha
nge
vs..
Tra
ditio
nal
Cyc
leS
tude
nts
Sta
rt o
fS
ocia
l Wor
k E
duca
tion
Soc
ial
N
'Com
plet
ion
ofW
ork
Edu
catio
nI-
Tes
t Val
ue B
ased
on
Diff
eren
ce in
Lea
rnin
g
Sta
ndar
dM
ean
Dev
iatio
nS
tand
ard
Mea
nD
evia
tion
Sta
ndar
dM
ean
Dev
iatio
n
Acc
eler
ated
Tra
ditio
nal
t-T
est V
alue
Prob
abili
ty
12 1412
.33
1.50
12.4
31.
34.
-0.1
642
ns
12 14
12.6
7.1
.67
12.7
11.
270.
0793
.ns
12 14
.33
2.10
.29
1.77
0.06
02O
s
Acc
eler
ated
1112
.36
1.96
1111
.73
2.20
1 1
1063
1,91
HI
Tra
ditio
nal
t-T
est V
alue
,16
12.1
91.
110.
2854
1611
.81
1,42
-0,1
177
16-0
.38
1.78
-0.3
495
Prob
abili
tyns
nsO
s
Acc
eler
ated
2412
.75
1.57
2411
.58
1.21
241.
171.
76
IVT
radi
tiona
l.t-
Tes
t Val
ue31
12.0
02.
161.
4914
3111
,71
1.97
-0.2
926
310.
292.
12-1
.675
0Pr
obab
ility
nsns
ns
Acc
eler
ated
4712
.55
1.63
4711
.89
I ,6
347
0.66
1.95
H-1
VT
radi
tiona
l61
12.1
51.
7561
11,9
71,
7261
-0.1
91.
95C
ombi
ned
t-T
est V
alue
1.24
34.-
'0.2
268
1.26
84Pr
obab
ility
nsns
ns

TA
BLE
4-2
7S
ocia
l Wor
k V
alue
s T
est-
Tot
al S
core
.
Cyc
leS
tude
nts
Sta
rt o
fS
ocia
l Wor
k E
duca
tion
Com
plet
ion
ofS
ocia
l Wor
k E
duca
tion
t- T
est V
alue
Bas
ed o
nD
iffer
ence
in L
earn
ing
Sta
ndar
dM
ean
Dev
ia t
ion
NS
tand
ard
Mea
nD
evia
tion
NS
tand
ard
Mea
nD
evia
tion
Acc
eler
ated
1212
942
11.9
912
134.
67.
11.1
012
5.25
10.1
0
11T
radi
tiona
lt-
Tes
t Val
ue14
126.
6410
.46
0.60
5214
131.
869.
510.
6674
145.
2110
.03
01.0
087
Prob
abili
tyas
sas
Acc
eler
ated
1113
3.36
11.0
511
128.
2711
.87
11-5
...09
10.2
3
I.if
fiT
radi
tiona
lt-
Tes
t. V
alue
1612
9.50
11.8
30.
8243
1612
5.81
11.0
90.
5296
16-3
.65
10.2
6.0
.336
4.Pr
obab
ility
nsas
as...
...,1
.
Acc
eler
ated
2413
2.58
10.7
924
129.
888.
0124
-2.7
07.
85
IVT
radi
tiona
lt-
Tes
t Val
ue.
3112
7.10
10.9
11.
8615
3112
7.19
9.84
1.14
1031
-0.0
99.
37-1
.207
4Pr
obab
ility
nsas
ns
Acc
eler
ated
4713
1.96
11.0
247
130.
72..
9.90
47-1
.24
9.68
III-
IVT
radi
tiona
l61
127.
6210
.93
6112
7.90
10.1
961
0.28
10.0
9C
ombi
ned
t-T
est V
alue
2.03
371.
4499
-0.7
905
t..),
Prob
abili
ty<
.05
asas
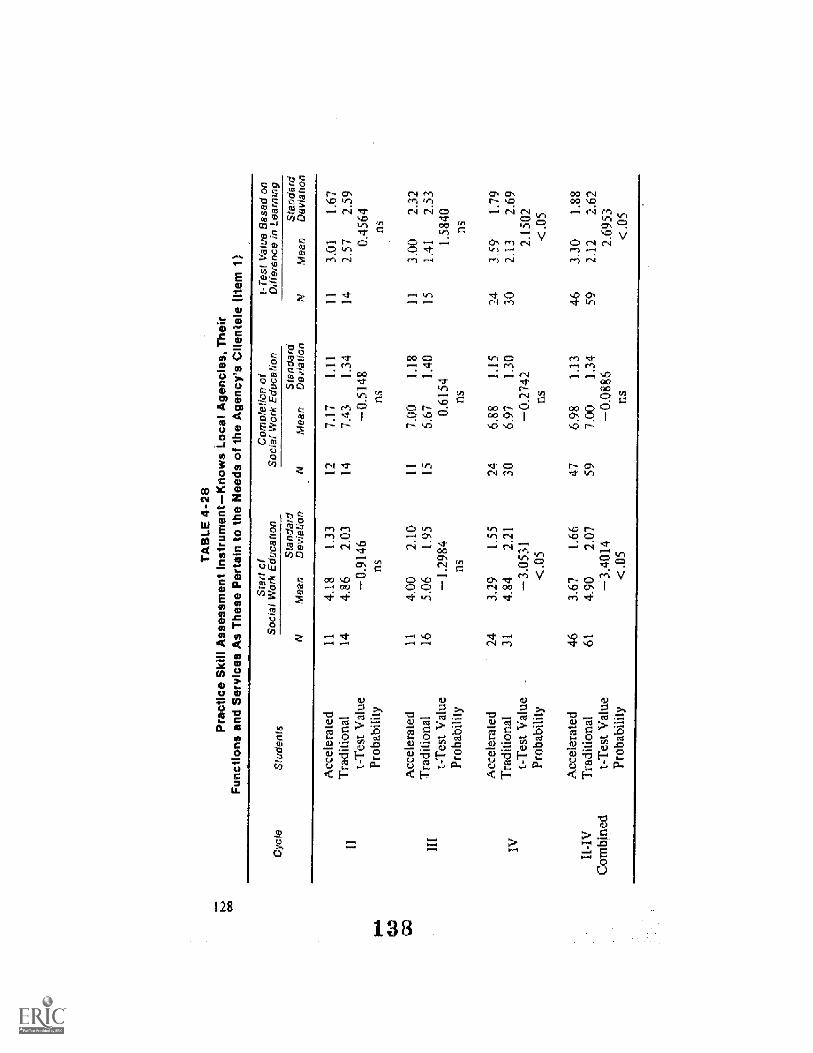
dX1
TA
BLE
. 4-2
8P
ract
ice
Ski
ll A
sses
smen
t lns
trum
ent-
Kno
ws
Loca
l Age
ncie
s, T
heir
Fun
ctio
ns a
nd S
ervi
ces
As
The
se P
erta
in to
the
Nee
ds o
f the
Age
ncy'
s C
lient
ele
(I.te
m 1
)
ow'
CA
,C
ia
Cyc
leS
tude
nts
Sta
rt o
fS
ocia
l Wor
k ,E
duca
tion
Com
plet
ion
ofS
ocia
l Wor
k E
duca
tion
1-T
es1
Val
ue B
ased
on
Diff
eren
ce in
Lea
rnin
gS
tand
ard
Mea
nD
evia
tion
NS
tand
ard
Mea
nD
evia
tion
NS
tand
ard
Mea
nD
evia
tion.
11 Hi
IV
II.-
1V
Com
bine
d
Acc
eler
ated
Tra
ditio
nal
t-T
est V
alue
,Pr
obab
ility
Acc
eler
ated
Tra
ditio
nal
t-T
est V
alue
Prob
abili
ty
Acc
eler
ated
Tra
ditio
nal
t-T
est V
alue
-
Prob
abili
ty
Acc
eler
ated
Tra
ditio
nal
t-T
est V
alue
Prob
abili
ty
11 14 11 16 24 31 46 61
4.18
1..3
3
4.86
2.03
-0.9
146
ns
4.00
2.10
.5.
061.
95-1
.298
4.ns
3.29
1.55
4.84
2.21
-3.0
531
<.0
5
3.67
1.66
4.90
2.07
-3.4
014
<.0
5
12 14 11 15 24 30 47 59
7.17
LH
7.43
1.34
-0.5
148
ns
7.00
1.18
6.67
1.40
0.61
54ns
6.88
1.15
6.97
1.30
-0.2
742
ns
6.98
1.13
7.00
1.34
-0.0
886
ns
11 14 11 15 14 30 46 59
3.01
1.67
2.57
2.59
0.45
64.
ns
3.00
2.32
1.41
2.53
1.58
40ns
3.59
1.79
2.13
2.69
2.15
02<
.05
3.30
1.88
2.12
2.62
2.69
53<
.105

TA
BLE
4-2
9P
ract
ice
Ski
d A
sses
smen
t Ins
trum
ent-
Use
s Lo
cal
Res
ourc
es in
Acc
orda
nce
with
Tre
atm
ent.
Obj
ectiv
es (
item
2)
Cyc
leS
tude
nts
Sta
rt o
fS
octa
i Wor
k E
duca
tion
Com
piew
n of
Soc
,ral
'Wor
k E
duca
tion
Sta
ndar
dN
Mea
nD
evia
hon
r- T
est
affe
renc
e
N
Val
ue B
ased
en
in L
earn
ing
Sta
ndar
dM
ean
Dev
ia b
onS
tand
ard'
Mea
nD
evia
toon
111
IV II-I
VC
ombi
ned
Acc
eler
ated
Tra
ditio
nal
t-T
est V
alue
Prob
abili
ty
Acc
eler
ated
Tra
ditio
nal
t-T
est V
alue
Prob
abili
ty
Acc
eler
ated
Tra
ditio
nal
t-T
est V
alue
Prob
abili
ty
Acc
eler
ated
Tra
ditio
nal
t-T
est V
alue
Prob
abili
ty
10 13 10 16 22 30 42 59
4.70
1.06
5.31
2.43
-0.7
062
ns
4.00
2.49
4.88
2.00
-0.9
475
ris
3.64
1.47
5.00
2.21
-2.6
701
<.0
5
3.98
1.70
5.03
2.17
-2.7
388
<.0
5
12 14 11 15 24 30 47 59
7.17
.94
7.57
L40
0.81
84ns
7.00
1.18
6.73
1.53
0.46
23ns
7.12
1.36
7.33
1.45
-0.5
435
ns
7.11
1.20
.7.
241.
47-0
.505
1ns
10 13 10 15 72 29 42 57
2.40
.97
2.31
2.95
0.09
07ns
3.00
2.47
1.60
L99
1.39
08ns
3.45
1.77
2.45
2.77
1.57
80ns
3.07
1 83
2.19
2.61
1 96
73ns

TA
BLE
4-3
0P
ract
ice
Ski
ll A
sses
smen
t Ins
trum
ent-
Rec
ogni
zes
and
Is C
once
rned
abo
ut th
e P
ract
ices
and
Pol
icie
s of
Loc
al A
genc
ies
Tha
t Req
uire
Cha
nge,
and
Con
side
rs S
teps
for
Mak
ing
Tho
se C
hang
es (
Item
3)
Cyc
leS
tude
nts
Sta
rt o
fC
ompl
etio
n of
Soc
.ial W
ork
Edu
catio
n.S
ocia
l Wor
k E
duca
tion
Sta
ndar
dM
ean
De
Ina
tion
Sta
ndar
dM
ean
Dev
iabo
n
t-T
est V
alue
Bas
ed o
nD
iffer
ence
in L
earn
ing
Sta
ndar
oM
ean
Dev
iatio
n
Acc
eler
ated
Tra
ditio
nal
1-T
est V
alue
Prob
abili
ty
todh
.
Acc
eler
ated
.C
,11
1T
radi
tiona
l1-
Tes
t Val
uePr
obab
ility
Acc
eler
ated
Tra
ditio
nal
IVt-
Tes
t Val
uePr
obab
ility
Acc
eler
ated
Tra
ditio
nal
Com
bine
dt-
Tes
t Val
uePr
obab
ility
104.
701.
3413
4.85
1.51
-0.2
301
ns
126.
831.
7514
5.79
2.12
1.30
74ns
101.
902.
2813
,.9
22.
500.
9219
ns
103.
801.
7511
6.09
1.81
102.
402.
32
144.
362.
2815
6.27
1.98
131.
853.
16
-0.6
217
-0.2
225
0..4
455
nsns
ns
2411
21.
9024
6.75
1.48
243.
632.
34
294.
001.
9630
6.10
1.67
282.
042.
44
-1.6
457
1.51
432.
3946
nsns
<.0
5
443.
641.
8347
6..6
21.
6244
2.98
2.39
564.
291.
9559
6.07
1.84
541.
722.
63
-1.7
100
1.63
232.
4254
.ris
ns<
.05

TA
BLE
4-3
1P
ract
ice
Ski
ll A
sses
smen
t Ins
trum
ent-
.C
ain
Des
crib
e th
e R
ole
of th
e P
rofe
ssio
nal S
ocia
l Wor
ker
and
the
Met
hod
of S
ervi
ce to
Pro
fess
iona
l and
Lay
Per
sons
in th
e A
genc
y an
d C
omm
unity
(Ite
m 4
)
10-.
16
lrra.
1i6
Cyc
leS
tude
nts
Sta
rt o
fS
ocia
l Wor
k E
duca
tion
Soc
ial
N
Com
plet
ion
ofW
ork
Edu
catio
nD
rifer
ence
N
Vak
ie B
ased
on
in L
earn
ing
Sta
ndar
dM
ean
Dev
iatio
nS
tand
ard
Mea
nD
ewat
ion
Sta
ndar
dM
ean
Dev
iabo
.11
111 iv
11-T
V
Com
bine
d
Acc
elen
ned
Tra
ditio
na1
t-T
est V
alue
Prob
abili
ty
Acc
eler
ated
Tra
ditio
nal
t-T
est V
alue
Prob
abili
ty
Acc
eler
ated
Tra
ditio
nal
t-T
est V
a1ue
Prob
abili
ty
Acc
eler
ated
Tra
ditio
nal
t-T
est V
alue
Prob
abili
ty
12 14 10 16 24 31 46 61
4.50
1.73
4.62
1.61
-0.1
656
ns
4.30
1.83
4.69
1.62
0.54
19ns
3.67
1.49
4.42
L86
-1.6
651
Os
4..0
21.
644.
53L
72L
5577
ns
12 14 11 15 24 30 47 59
T 1
71.
477.
071.
140.
.178
7
ns
T27
1.42
6.87
1.64
0..6
332
ns
7.58
1.06
7.20
1.56
1.07
07ns
7.40
1.25
7.08
1.48
1.20
78ns
12 14 10 I 5
24 30 46 59-
2.67
1.83
2.46
1.98
0.25
74.
ns
3.20
1.81
2.00
1.73
1.59
73ns
3.92
2.06
2,87
2.74
1.60
65ns
3.43
1.96
2.55
2.35
2.07
71<
.05

opih
TA
BLE
4-3
2P
ract
ice
Ski
ll A
sses
smen
t ins
trum
ent-
Kno
ws
Abo
ut th
eA
genc
y's
Fun
ctio
n an
d R
elat
ions
hips
to O
ther
Age
ncie
s an
d P
rogr
ams
(item
5).
Cyc
leS
tude
nts
Sta
rt o
fS
ocia
l Wor
k E
duca
tion
Com
plet
ion
ofS
oca(
Wor
k E
duca
tion
t-T
est V
alue
Bas
ed o
nD
iffer
ence
in L
earn
ing
Sta
ndar
dM
ean
Dev
iatio
nN
Sta
ndar
dM
ean
Dev
iatio
nN
Sta
ndar
dM
ean
Dev
iatio
n
HI
IV ii-T
VC
ombi
ned
Acc
eler
ated
.T
radi
tiona
l.t-
Tes
t Val
uePr
obab
ility
Acc
eler
ated
'Tra
ditio
nal.
t-T
est V
alue
Prob
abili
ty
Acc
eler
ated
Tra
ditio
nal
t-T
est
Val
uePr
obab
ility
Acc
eler
ated
Tra
ditio
nal
t-T
est V
alue
Prob
abili
ty
12 14 11 16 24 31 47 61
5.08
1.38
4.93
1.64
0.24
79n.
s
4.55
1.81
5.25
1.57
-1.0
353.
ns
4.00
1.38
5.00
1.97
-2.2
116
<.0
5
4.40
1.53
5.05
1.77
-2.0
269
<.0
5
12 14 11 15 24 30 47 59
7.00
.95.
7.29
1,38
-0.5
796
ns
7.27
1.68
7.40
1.35
-0.2
055
ns
7.25
.85
7.13
1.48
0.36
38ns
7.19
1.10
7.24
1.41
-0.1
884
ns
12 14 11 15 24 30 47 59
1.92
1.24
.
2.36
2.24
-0.5
825
ns
2.72
1.85
1.87
1.60
1,21
92.
ns
3.25
1.59
2.23
2.62
.1.
7562
ns
2.79
1.64
2.19
2.28
1.61
87ns

'TA
BLE
4-3
3P
ract
ice
Ski
ll A
sses
smen
t Ins
trum
ent -
Kno
ws
Abo
utth
e A
genc
y G
oals
and
Pol
icie
s T
o A
chie
ve T
hese
Goa
ls (
item
6)
Cyc
leS
tude
nts
Sta
rt o
fS
ocia
l Wor
k E
duca
tion
Com
plet
ion
ofS
ocia
l Wor
k E
duca
tion
I-T
est V
alue
Bas
ed o
nD
iffer
ence
tn L
earn
ing
NS
tand
ard
Mea
nD
evia
tion
NS
tand
ard
Mea
nD
evia
tion
N
..
Sta
ndar
cM
ean
Dev
iatio
n
11
Acc
eler
ated
Tra
ditio
nal
t-T
est V
alue
12 14
5.17
1.40
5.07
1.90
0.13
77
12 14
7.00
1..0
4
736
1.15
-0.7
908
.
12 14
1.83
Lit
2.29
2.40
-0.5
764
Prob
abili
ty.
nsns
.ns
Acc
eler
ated
114.
271,
4211
6.82
1.60
1.1
2.55
1.29
Tra
ditio
nal
1653
12.
1515
6.93
1.62
151.
332.
23t-
Tes
t Val
ue-1
.352
8-0
.172
61.
5538
Prob
abili
tyns
nsns
Acc
eler
ated
244.
121.
6224
7.21
1.10
243.
092.
26
IVT
radi
tiona
lt-
Tes
t Val
ue31
4.97
1.56
-1.9
422.
307.
001.
490.
5911
302.
072.
271.
6370
.Pr
obab
ility
nsns
ns
Acc
eler
ated
474.
431.
5647
7.06
1.21
472.
631.
87I1
-1V
Tra
ditio
nal
615.
:08
1.78
597.
071.
4459
1.93
2.28
Com
bine
dt-
Tes
t Val
ue-2
.039
0.-0
.015
51.
7512
Prob
abili
ty<
.05
nsns

TA
BLE
4-3
4P
ract
ice
Ski
ll A
sses
smen
t Ins
trum
ent-
Kno
ws
Abo
ut e
nd U
ses
App
ropr
iate
ly C
hann
els
of C
omm
unic
atio
ni, R
ules
, and
Pro
cedu
res
of th
e A
genc
y (I
tem
7)
Cyc
leS
tude
Ms
Sta
rt o
fS
ocia
l Wor
k E
duca
tion
Com
plet
ion
ofS
ocia
l Wor
k E
duca
tion
t-T
est V
alue
Bas
ed o
nD
iffer
ence
in L
earn
ing
Sta
ndar
d'M
ean
Dev
iatio
nS
tand
ard
Mea
nD
evia
tion
Sta
ndar
dM
ean
Dev
iatio
n
11 III
IV
11-I
VC
ombi
ned.
Acc
eler
ated
Tra
ditio
nal.
t-T
est.
Val
uePr
obab
ility
Acc
eler
ated
Tra
ditio
nal
t-T
est V
alue
Prob
abili
ty
Acc
eler
ated
Tra
ditio
nal
t-T
est V
alue
Prob
abili
ty
Acc
eler
ated
Tra
ditio
nal
t-T
est V
alue
Prob
abili
ty
12 13 11 16 24 31 47 60
5.25
1.36
5.62
2.10
-0.4
907
ns
4.09
2.07
5.31
2.36
-1.3
362
ns
3,88
1.73
5.42
1.77
-3.2
564
<05
4.28
1.79
5.43
1.98
-3.1
676
.05
12 14 11 15 24 30 47 59
6.67
1.37
6.71
1,54
-0.0
794
ns
6.45
1.75
6.60
1.55
-0.2
149
ns
7.08
1.21
7.23
1.76
-0.3
704
ns
6.83
1.39
6.95
1.65
-0.4
037
ns
12 13 11 15 24 30 47 58
1.42
1.38
1.15
2,61
0.29
84ns
2.36
2.80
1.00
2.30
1307
4ns
3.20
2.00
1,90
2.60
2.08
78<
05
2.55
2.18
1.50
2.52
.2.
2966
<05

TA
BLE
4-3
5P
ract
ice
Ski
ll A
sses
smen
t Ins
trum
ent-
Rec
ogni
zes
and
Is C
once
rned
Abo
ut A
genc
yP
ract
ices
and
Pol
icie
s R
equi
ring
Cha
nge,
and
Con
side
rs S
teps
for
Mak
ing
Tho
se C
hang
es (
item
8)
1=4'
1141
.
tr4
tM
Cyc
leS
tude
nts
Star
tof
Soc
ial W
ork
Edu
catio
nC
ompl
etio
n of
Soc
ial
Wor
k E
duca
tion
I-T
est %
,4lu
e B
ased
on
Dif
fere
nce
inLe
arni
ngS
tand
ard
Mea
nD
evia
tion
Sta
ndar
dM
ean
Dev
iatio
nSt
anda
rdM
ean
Dev
iatio
n
M
I.1-1
1V-
Com
bine
d
Acc
eler
ated
Tra
ditio
nal
t-T
est V
alue
Pro
babi
lity.
Acc
eler
ated
.T
radi
tiona
lt-
Tes
t. V
alue
Pro
babi
lity
Acc
eler
ated
Tra
ditio
nal
t-T
est V
alue
Pro
babi
lity
Acc
eler
ated
Tra
ditio
nal
t-T
est V
alue
Pro
babi
lity
7 12 11 15 24 31 42 58
486
1 57
5.67
1,78
-0.9
450
ns
3.64
2.01
4.20
2.01
-0.6
787
ns
3.50
1.74
4.32
2.20
-1.5
477
ns
3.76
1.82
'4.
752.
11.
-2.0
456
<..0
5
12 14 11 15 24 30 47 59
6.75
1.21
6.29
1.98
0.67
90ns
6.27
1.42
.
6.20
1.97
0..1
000
as
7.04
1.20
5.87
1.92
2.74
50<
MI5
6.79
1.27
6.05
1.92
2.36
50.
<.0
5
7 12 11 14 24 30 42 56
1.86
1.95
.50
2.58
1.14
11as
2.63
2.29
.2.
002.
690.
6006
ns
3.54
2.13
1.55
2.77
2.91
11<
"..0
5
3.03
2.19
1.46
2.72
3.14
31...
05

TA
BLE
4-3
6P
ract
ice
Ski
ll A
sses
smen
t Ins
trum
ent-
Com
plie
s w
ith A
genc
y R
equi
rem
ents
tor
Rec
ordi
ng a
nd C
omm
unic
atio
n (I
tem
9)
Cyc
leSw
dent
s
Star
t of
Soci
al W
ork
Edu
catio
nC
ompl
etio
n of
Soci
al W
ork
Edu
catio
nt-
Tes
t Vaf
ue B
ased
on
Dif
fere
nce
in L
earn
ing
Stan
dard
Mea
nD
evia
tion.
Stan
dard
Mea
nD
evia
tion.
Stan
dard
Mea
nD
evia
6on
11 III
IV
Com
bine
d.
Acc
eler
ated
Tra
ditio
nal
t-T
est V
alue
Prob
abili
ty
Acc
eler
ated
Tra
ditio
nal
t-T
est V
alue
.Pr
obab
ility
Acc
eler
ated
Tra
ditio
nal,
t-T
est V
alue
Prob
abili
ty
Acc
eler
ated
.T
radi
tiona
lt-
Tes
t Val
uePr
obab
ility
.
12 14 11 16 24 31 47 61
6.50
1.83
6.64
2.06
-0.1
781
ns
5.64
2.50
6.31
2.06
-0.7
389
ns
5.21
2.65
6.84
1.73
-2.6
094.
<.0
5
5.64
2.44
6.66
1.88
-2.3
656
<.0
5
12 14 11 15 24 30 47 59
6.33
2.02
7.71
1.27
-2.0
382
ns
6.73
2,69
6.87
2.13
-0.1
416
ns
7.29
1.33
7.60
1.71
-0.7
432
ns
6.91
1.90
7.44
1.74
-1.4
684
ns
12 14 11 15 24 30 47 59
-0..1
72.
721.
072.
27-1
.214
5ns
1.09
3..2
1
.47
1.68
0.61
73O
s
2,08
2,73
.80
2.50
1.78
12ns
1.27
2,94
.78
2.24
0.95
88os

TA
BLE
4-3
7P
ract
ice
Ski
ll A
sses
smen
tpa
rtic
ipat
es S
uffic
ient
ly a
nd A
ppro
pria
tely
inIn
stru
men
t-A
genc
y S
taff
Mee
tings
(Ite
m 1
0)
Cyc
leS
tude
nts
Sta
rr o
fS
ocia
l Wor
k E
duca
tion
Com
piet
ion
ofS
ocia
l Wor
k E
duca
tion
t- T
est
Diff
eren
ce'Val
ue B
ased
on
in L
earn
ing
Sta
ndar
dM
ean
Dev
iatio
nS
tand
ard
Mea
nD
evia
tion
Sta
ndar
dM
ean
Dev
iatio
n
iiA
ccel
erat
edT
radi
tiona
lt-
Tes
t Val
uePr
obab
ility
11 145.
551.
376,
151.
950.
8320
ns
12 147.
171.
117.
211.
370.
0925
ns
11 13
1.82
1.94
1.23
1.88
0.72
01ns
Acc
eler
ated
.9
4.44
2.56
116.
642.
549
2.33
3.20
111
Tra
ditio
nal
t-T
est V
alue
126.
251.
48.
-1.9
336
156.
731.
94-0
.105
912
.42
2.68
.1.
.418
7Pr
obab
ility
nsns
ns
Acc
eler
ated
225.
362.
5423
7.43
1.34
212.
102.
79
1VT
radi
tiona
l30
5.67
2.06
296.
972.
1128
1.32
.3.4
6t-
Tes
t Val
ue-0
.460
30.
9737
0.86
56Pr
obab
ility
.ns
ns
Acc
eler
ated
.42
5,21
2.28
467.
171.
6541
2.07
2.63
Tra
ditio
nal
565.
911.
9158
6.97
1.89
53.
1.09
2.95
Com
bine
dt-
Tes
t Yal
ue-1
.594
40.
5993
1.69
63.
Prob
abili
ty.
nsns
ns

TA
BLE
4-3
8P
ract
ice
Ski
d A
sses
smen
t Ins
trum
ent-
coop
erat
es w
ith! a
nd! M
akes
!Use
of S
taff
Mem
bers
(Ite
mi)
Cyc
leS
tude
Ms
Sla
nt o
fS
ocia
l Wor
k E
duca
tion
Com
plet
ion
ofS
ocia
l Wor
k E
duca
tion
1-T
est V
alue
eas
ed o
nD
iffer
ence
in L
earn
ing
Sta
ndar
dM
ean
Dev
iatio
nN
Sta
ndar
dM
ean
Dev
iatio
nN
Sta
ndar
dM
ean
Dev
iatio
n
II
Acc
eler
ated
Tra
ditio
nal
t-T
est V
alue
Prob
abili
ty
12 14
5,92
1.68
6.21
1.93
0.40
01ns
12 14
7.17
.94
7,50
'1.4
00.
6733
ns
12 14
1.25
1.86
1.28
2.1.
6-0
.042
9ns
Acc
eler
ated
114.
912.
2111
7.45
1.69
112.
542.
21
III
Tra
ditio
nal
t-T
est V
alue
,16
6.38
2.00
-1.7
261
157.
80.9
4.-0
.636
4.15
1.13
1.64
1.79
72Pr
obab
ility
nsns
n.s
Acc
eler
ated
245.
462.
1524
7.58
1.10
242.
122.
40
1.V
Tra
ditio
nal.
t-T
est V
alue
315.
941.
950.
8510
307.
201.
750.
9816
301.
302.
51.
1.23
01Pr
obab
ility
nsn.
sns
Acc
eler
ated
475,
452.
0447
7.45
1.21
.47
200
2.24
II-I
VT
radi
tiona
l61
6.11
1.93
597.
421.
5059
1.25
2.20
Co
bine
dt-
Tes
t Val
ueI
.725
30.
0876
1.71
74Pr
obab
ility
nsns
ns

TA
BLE
4-3
9!P
ract
ice
Ski
ll A
ises
smen
t Ins
trum
ent-
Hel
ps D
efin
e an
d E
xpre
ss O
wn
Lear
ning
Goa
ls (
Item
12)
I. IP.
CO
- L.,
Cyc
leS
tude
nts
Sta
rt a
tS
ocia
l Wor
k E
duca
tion
Soc
ial'
N
Com
plet
ion
ofW
ork
Edu
catio
nt-
Tes
t Vai
ue B
ased
on
Diff
eren
ce in
Lea
rnin
g
NS
tand
ard
Mea
nD
evia
tion
Sta
ndar
dM
ean
Dev
iatio
ri
.
NS
tand
ard
Mea
nD
evia
por
II III IV li-IV
Com
bine
d
Acc
eler
ated
Tra
ditio
nal
t-T
est V
alue
Prob
abili
ty
Acc
eler
ated
Tra
ditio
nal
t-T
est V
alue
Prob
abili
ty
Acc
eler
ated
Tra
ditio
nal
t-T
est V
alue
Prob
abili
ty
Acc
e1er
ated
Tra
ditio
nal
t-T
est V
alue
Prob
abili
ty
12 14 11 16 24 31:
47 61
3.92
1.68
5.21
1.72
-1.8
655
ns
4.45
1.44
5.69
1.82
-1.8
110
ns
5..2
91.
685.
291.
94.
0.00
28ns
4.74
1.70
5.38
1.84
-1.8
506
ns
12 14 11 15 24 30 47 59
7.08
1.38
.7.
501.
22-0
.783
9ns
6.27
1.85
6.80
1.82
-0.6
964.
ns
7..0
81.
287.
071.
660.
.416
0ns
6.89
1.46
7.10
1.60
-0.6
967
ns
12 14 11 15.
24 30 47 59
3.67
.1.8
02.
291.
981.
1335
ns
1.82
2.27
1.00
2.75
0.77
36.
ns
1.79
2.32
1.83
2.61
-0.0
602
ns
2.15
2.23
1.72
2.52
0.91
06ns
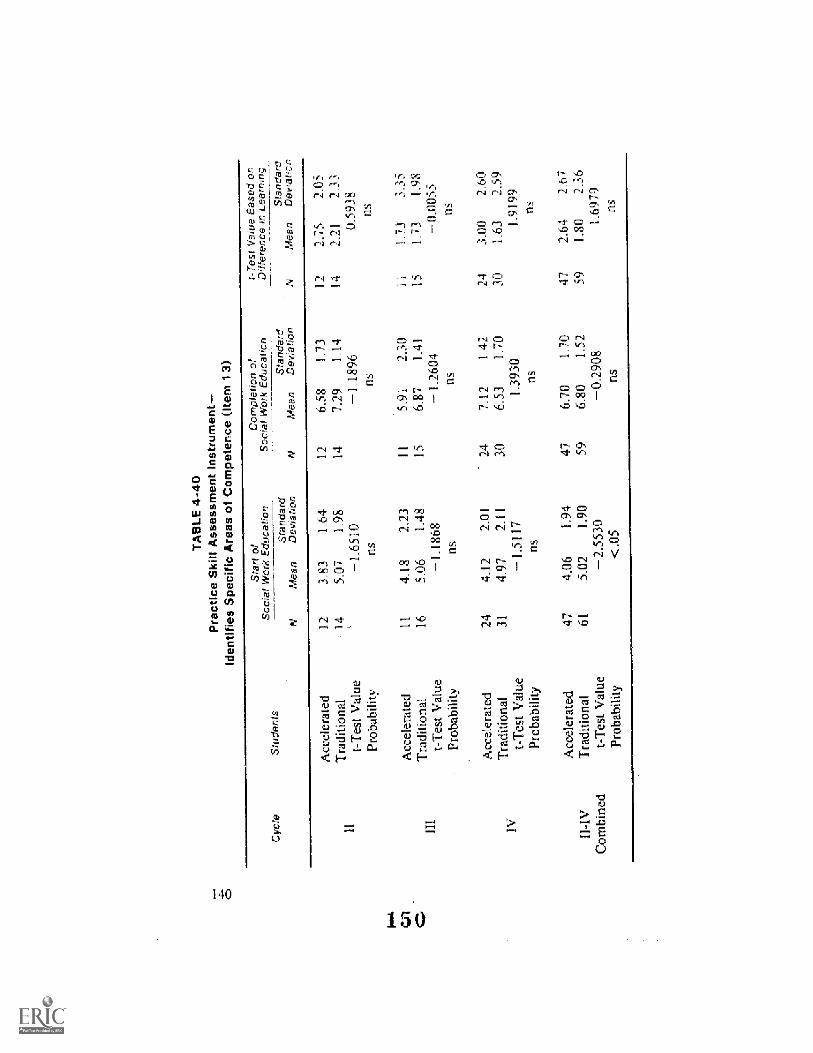
TA
BLE
4-4
0P
ract
ice
Ski
ll A
sses
smen
t ins
trum
ent-
.id
entif
ies
Spe
cific
Are
as o
f Com
pete
nce
(item
13)
Cyc
leS
tude
nts
Star
tof
Soc
ial W
ork
Edu
catio
nC
ompl
etio
n of
Soc
ial W
ork
Edu
catio
nT
est V
aiue
Bas
ed o
nD
iffer
ence
in L
earn
iing
Sta
ndar
dM
ean
Dev
iatio
nN
Sta
ndar
dM
ean
Dev
iatio
nN
Sta
ndar
0M
ean
Dew
anon
HI
IV II-1
VC
ombi
ned
Acc
eler
ated
Tra
ditio
nal
t-T
est V
alue
Prob
abili
ty
Acc
eler
ated
Tra
ditio
nal
t-T
est V
alue
.Pr
obab
ility
Acc
eler
ated
Tra
ditio
nal
t-T
est V
alue
Prob
abili
ty
Acc
eler
ated
Tra
ditio
nal.
t-T
est V
alue
Prob
abili
ty
12 14 11 16 .24
31 47 61
3.83
1.64
5.07
1.98
-1.6
5 W
ns
4.18
2.23
5.06
1.48
.
1..1
868
ns
4.12
2.01
4.97
2.11
-1.5
117
ns
4.06
1.94
5.02
1.90
-2.5
530
< .0
5
12 14 1 II 15 24 30 47 59
6.58
1.73
7.29
1.14
-1.1
896
ns
5.91
230
6.87
1.41
1.26
04ns
7.12
1 .4
26.
531.
701.
3930
ns
6.70
1.70
6.80
1.52
0.29
08
12 14 11 15 24 30 47 59
2.75
2.05
2.21
7.33
0.59
38ns
1,73
3.35
1.73
1.98
0..0
055
ns
3.00
2.60
1.63
2.59
1.91
99ns
2.64
2.67
1.80
2.36
1.69
79ns

TA
BLE
4-4
1'P
ract
ice
Ski
ll A
sses
smen
t ins
trum
ent-
Poi
nts
Out
Are
as o
f Diff
icul
ty in
, His
Ow
n W
ork
with
Clie
nts
(Ite
m 1
4)
Cyc
leS
tude
nls
Sta
rtof
Soc
ial W
ork
Edu
catio
nC
ompl
etio
n of
Soc
ial W
ork
Edu
catio
nt-
Tes
t Val
ue B
ased
onD
iffer
ence
in L
earn
ing
Stan
dard
NM
ean
Dev
iatr
onSt
anda
rdM
ean
Dev
iatio
nN
Stan
dard
Mea
nD
evia
tion
II
Acc
eler
ated
Tra
ditio
nal
t-T
est V
alue
Prob
abili
ty.
12 14
3.83
1.27
5.71
1.86
-2.8
493
< .0
5
12 146.
831.
806.
931.
33-0
.148
7ns
12 14
3.00
1.86
1.21
2.52
1.94
93ns
Acc
eler
ated
113.
641.
2111
6.45
2.07
112.
872.
36
III
Tra
ditio
nal
166.
192.
0115
6.80
1.61
15.6
72.
19t-
Tes
t Val
ue-3
.630
5-0
.459
72.
2994
Prob
abili
ty<
.05
nsns
Acc
eler
ated
245.
001.
9124
7.00
1.38
242.
002.
28
IVT
radi
tiona
l31
5.52
1.82
307.
131.
4630
1.70
2.37
t-T
est V
alue
-1.0
133
-0.3
439
0.47
20
Prob
abili
tyns
nsns
Acc
eler
ated
474.
381.
7147
6.83
1.65
.47
2.45
2.20
114V
Tra
ditio
nal
615.
74L
8759
7.00
1,45
591.
322.
36
Com
bine
dt-
:Tes
t Val
ue-3
.913
8-0
.557
22:
5291
Prob
abili
ty<
.05
ns<
.05

foal
TA
BLE
. 4-4
2P
ract
ice
Ski
ll A
sses
smen
t ins
trum
ent-
Dis
tingu
ishe
s B
etw
een
Per
sona
l Pro
fess
iona
l, an
d S
tude
nt R
oles
(Ite
m 1
5)
Cyc
leS
tude
nts
Sta
rt o
fS
ocia
l Wor
k E
duca
tion
Com
pfet
ion
ofS
ocia
l Wor
k E
duca
bon
S.ta
ndar
dM
ean
Dev
atto
n
t- T
est V
alue
Bas
ed o
nD
iffer
ence
tn L
earn
mg_
Sta
ndar
dM
oan
Dav
iatjo
nS
tand
ard
Mea
nD
evR
aDo.
.7
11.
In IV
1I-I
V
Com
bine
d
Acc
ekra
ted
Tra
ditio
nal.
t-T
est V
alue
Prob
abty
Acc
eler
ated
'Tra
ditio
nal
t-T
est '
Val
uePr
obab
ility
Acc
e1er
ated
Tra
ditio
nal
t-T
est V
alue
Prob
abili
ty.
Acc
eler
ated
Tra
ditio
nal
t-T
est V
alue
Prob
abili
ty
12 14 I I 16 24 31 47 61
3.83
1.40
5.21
119
-1.8
1048
ns
4.09
1.76
5.94
1..6
92.
6388
.<
.05
4.38
2.26
5.00
2.35
-0.9
988
ns
4.17
1.94
5.30
2.16
2.84
31<
.05
12 14 11 15 24 30 47 59
6.58
1.31
7.14
1.66
0.90
64.
ns
6.18
1.94
6.20
1.82
-0.0
233
ns
6.67
1.13
7.37
1_59
-1.8
911
ns
16.5
31
387.
021.
71-1
.617
3ns
12 14 11 15 24 30 47 59
2.75
1.36
1.93
2.76
0.90
19ns
2.09
2.47
1015
41.
8231
ns
1.19
1.49
2.4.
32.
710.
1995
ns
2..3
62.
221.
732.
801.
2643
ns

C01
TA
BLE
4-4
3P
ract
ice
Ski
ll A
sses
smen
t Ins
trum
ent-
Rec
ogni
zes
His
Ow
n F
eelin
gs a
s T
hey
Aris
e in
and
Effe
ct th
e T
reat
men
t Pro
cess
(ite
m 1
6)
Cyc
leS
tude
nts
Sta
rt o
fS
ocia
l 'W
ork
Edu
catio
nC
orno
tetto
n of
Soc
ial '
Wor
k E
duca
tIon
Sta
ndar
dM
ean
Dev
oato
'on
Tes
t Vai
ue B
ased
on
Dof
fere
nce
on L
earn
ing
Sta
ndar
dN
Mea
nD
evia
tion.
Sta
ndar
dM
ean
Dev
iatio
n
ii 111
IV
11-1
11
Com
bine
d.
Acc
eler
ated
.T
radi
tiona
lt-
Tes
t Val
uePr
obab
ility
Acc
eler
ated
.T
radi
tiona
l.t-
Tes
t Val
uePr
obab
ility
Acc
e1er
ated
Tra
ditio
na1
I-T
est V
alue
Prob
abili
ty
Acc
eler
ated
Tra
ditio
nal
t-T
est V
alue
Prob
abili
ty
12 14 H 16 24 31 47 :61
4.08
1.68
4.79
2.19
-10.
8708
ns
3.91
1.51
6.12
2.00
2.99
96<
.05
4,62
2.00
4.90
2.33
-0.4
765
ns
4.32
1.81
5.20
2.25
-2.2
477
< .0
5
12 14 11 15 24 30 47 59
7.17
1.64
.
7.21
.98
-0.0
877
ns
6.09
1.64
.7.
13.1
.60
-1.5
614.
ns
7.04
1.37
6.97
1.75
0,17
67ns
6.8.
51,
537.
071.
54-0
.721
7ns
12 14 11 15 .,...-
fr
30 47 59
3.08
1.51
2.43
2..7
70.
7037
ns
2.18
2,18
1.07
2.02
'1.
2924
ns
2.42
2.22
.2.
202,
8303
.148
ns
2.53
2.04
1,97
2.65
1,24
27ns

TA
BL
E 4
,44
Prac
tice
Skill
Ass
essm
ent I
nstr
umen
t-4.
Dis
cipl
ines
and
Util
izes
Him
self
in in
tera
ctio
n w
ith C
lient
s (it
em 1
7)
Cyc
leS
tude
nts
Sta
rt o
fS
ocr'a
t Wor
k E
doca
rron
Sta
ndar
dM
ean
Dev
ralro
n
Com
pret
ron
ofS
ocla
t Wor
k E
duca
rron
Sta
ndar
dM
ean
Dev
ratto
n
t-T
esr
Vai
tre
Ba
ed o
nD
O:T
eren
ceLe
arnm
gS
tanc
idfa
Med
nD
e:vi
le, n
or,
11
Acc
eler
ated
Tra
ditio
nal
t-T
est V
alue
12 14
4.00
1.35
5.00
2.22
-1.3
073
12 14
6.92
1.31
7.00
.68
-0.1
994
12 14
2.91
1..5
,6
1..0
02.
001.
2.15
5iI i.o
4b
Prob
abili
ty
Acc
eler
ated
.
ns
4.00
1.67
11
ns
6.45
1.02
1.1
as
2.45
1,16
Tra
ditio
nal.
164.
811.
8015
6.93
1.71
151:
932.
25
t-T
est V
alue
- 1.
1422
- 0.
6275
0..5
699
Prob
abili
tyns
nsns
Acc
eler
ated
244.
.33
2.24
.2.4
.7,
211.
2824
2.88
2.19
IVT
radi
tiona
l.t-
Tes
t Val
ue.
315.
231.
98-1
.5,4
1530
7.00
1.72
0.50
8930
1.90
2..6
81.
4694
Prob
abili
tyns
nsns
Acc
eler
ated
.47
4.17
1.89
476.
961.
4947
2.79
2.01
1I-I
VT
radi
tiona
l61
5.07
11.9
759
6.98
1.51
591.
932.
39
Com
bine
dt-
Tes
t Val
ue-2
.397
5-0
.087
31.
9992
Prob
abili
ty<
.05
ns<
.05

TA
BLE
4-4
5P
ract
ice
Ski
ll A
sses
smen
t Ins
trum
ent-
App
lies
The
orie
san
d T
echn
ique
s of
Inte
rven
tion
from
Aca
dem
icC
ours
es to
Pra
ctic
e (I
.em
18)
.1.4
6.
CO
C;1
1.
+-A
Cyc
eeS
tude
nts
Sta
rt o
fC
o rn
pte
h a
n at
Soc
ial;
Wor
k E
duca
tion
Soc
xat W
ork
Edu
catio
n
Sta
ndar
dS
fa n
da r
dM
ean
Dev
iat
fiM
ean
De
v o
a bo
n
Tes
Ve
Bas
ed o
nD
tlfer
ence
Aro
Lea
rnin
g
Sta
n da
reN
tean
il. 1.1.
1
IV
H-I
VC
ombi
ned
Acc
e1er
ated
Tra
ditio
nal
t-T
est V
alue
'Pro
babi
lity
Acc
eler
ated
Tra
ditio
nal
t-T
est.
Val
uePr
obab
ility
Acc
eler
ated
Tra
ditio
nal.
t:Fes
t Val
uePr
obab
ility
Acc
eler
ated
.T
radi
tiona
l1-
Tes
t Val
uePr
obab
ility
17 14 11 16 24 29 4 7
59
3.50
1 A
5
4.14
1.61
1.02
17ns
3.82
1.54
4.69
2.15
-1.1
094.
ns
4.42
I .8
64.
932.
05-0
.955
5ns
4.04
1.71
4.68
1.98
-1.7
744
ns
12 14 11 15 24 30 47 59
7.00
1.04
.7
1010
188
0000
0ns
6.45
1.51
6.73
1.79
0.40
23ns
7.38
1.17
6.70
1.82
1.64
69ns
7.06
1 .2
66.
781.
621.
0166
ns
12 14 11 15 24 28 47
3.50
1.31
2.86
1.83
0.97
22ns
2.63
1..5
01.
872.
560.
8562
ns
2.96
2.33
.1.
862.
941
,,505
3
ns
3.02
1.93
2.10
2..6
02.
0589
< .0
5

TA
BLE
4-4
6P
ract
ice
Ski
ll A
sses
smen
t Ins
trum
ent-
Pla
ns fo
r,P
artic
ipat
es in
, and
Util
izes
Lea
rnin
g fr
om F
ield
Inst
ruct
or C
onfe
renc
es (
Item
19)
Cyc
leS
tude
nrs
Sta
rt o
fS
ocia
l Wor
k E
duca
tion
Soc
ral
N
Cor
nMet
fon
ofW
ork
Edu
catr
ont-
Tes
f Val
ue B
ased
on
Diff
eren
ce in
Lea
rnm
g
Sta
ndar
dN
Mea
nD
evia
tton
Sta
ndar
dM
ean
Dev
iatio
nS
tand
ard
Mea
nD
evia
bon
Acc
eler
ated
125.
251.
7112
7.25
1.42
122.
001.
28
1.1
Tra
ditio
nal
t-T
est V
alue
135.
921.
610.
9730
147.
431.
220.
3308
131.
622.
220.
5038
Prob
abili
tyns
nsns
Acc
eler
ated
115.
001.
6711
6.18
2.04
.11
1.18
2.27
HI
Tra
ditio
nal
t-T
est V
alue
166.
691.
82-2
.357
01.
57.
131.
301.
3914
15.4
72.
760.
7634
Prob
abili
ty<
.05
nsns
Acc
eler
ated
245.
422.
04.
247.
381.
4124
1.96
2.96
Tra
ditio
nal
316.
101.
6230
7.56
1.66
301.
472.
27t-
Tes
t. V
alue
-1.3
383
-0.2
996
0.67
17Pr
obab
ility
nsns
ns
Acc
eler
ated
4752
8L
8547
7.06
1.62
471.
782.
45II
-IV
Tra
ditio
nal
606.
221.
6759
7.39
1.46
581.
242.
27C
ombi
ned
t-T
est V
alue
,-2
.723
0-1
.074
11.
1742
Prob
abili
ty<
.05
nsns

TA
BLE
4-4
7P
ract
ice
Ski
ll A
sses
smen
t Ins
trum
ent-
Allo
cate
s T
ime
App
ropr
iate
ly (
Item
20)
Cyc
leS
tude
nts
Sta
rt o
fS
ocia
l Wor
k E
duca
tion
Com
plet
ion
of.
t- T
est V
alue
Bas
ed o
nS
ocia
l Wor
k E
duca
tton
Diff
eren
ce in
Lea
rnin
g
Sta
ndar
dS
tand
ard
Sta
ndar
dM
ean
Dev
iatio
nN
Mea
nD
evra
tion
lM
ean
Dev
iab
on
Acc
eler
ated
125.
921,
381
77.
001.
3512
1.08
1.73
Tra
ditio
nal
146.
002.
2214
7.57
1.45
14II
1.57
2.14
t-T
est V
alue
-0.1
083
0.99
300.
..608
1Pr
obab
ility
nsns
ns
Acc
eler
ated
114.
731.
9011
6.27
2.53
111.
..54
2.50
lAII
I'T
radi
tiona
l16
6.81
2.04
157.
071.
3315
.26
1.83
--t-
Tes
t Val
ue.
-2.5
806
0.99
33.
1.44
50...
.4Pr
obab
ility
<...
05ns
ns
Acc
eler
ated
245.
421.
6724
7.21
1.35
.24
1.79
2.43
Tra
ditio
nal
316.
062.
1430
7.53
1.46
301.
532.
22IV
t-T
est V
alue
-1.2
611
-0.8
486
0.40
29Pr
obab
ility
nsns
ns
Acc
eler
ated
475.
381.
68.
476.
941.
7047
1.56
2.26
II-I
VT
radi
tiona
l.61
6.25
2.13
59'
7.42
1.42
591.
222.
15C
ombi
ned
t-T
est V
alue
.-2
.358
7-1
.578
20.
7690
Prob
abili
ty<
..05
nsns

TA
BLE
4-4
8P
ract
ice
Ski
ll A
sses
smen
t Ins
trum
ent-
The
Stu
dent
Giv
es E
vide
nce
ofK
now
ledg
e A
bout
Per
sona
lity
Cha
ract
eris
tics
As
The
se R
elat
e to
Atti
tude
s an
d B
ehav
ior
(Ite
m 2
1)
Cyc
leS
tude
rds
Star
t ot
Soc
ial W
ork
Edu
catio
nC
ompl
etio
n of
Soc
ial W
ork
Edu
catio
nt-
Tes
t Val
ue B
ased
on
Did
eien
ce in
Lea
rnin
gS
tand
ard
Mea
nD
evia
tion
NS
tand
ard
Mea
nD
evia
tion
Sta
ndar
d'M
ean
DeW
a ti
on
11 iii IV 114V
Com
bine
d
Acc
eler
ated
Tra
ditio
'al.
t-T
est V
alue
Prob
abili
ty
Acc
eler
ated
Tra
ditio
nal
t-T
est V
a1ue
Prob
abili
ty
Acc
eler
ated
.T
radi
tiona
lt-
Tes
t Va1
uePr
obab
ility
Acc
eler
ated
Tra
ditio
nal
t-T
est V
alue
Prob
abili
ty
12 14 11 16 24 31 47 61
3.92
131
4.71
2.02
-1.1
279.
ns
4.09
1.64
5.06
1.53
-1.5
168
ns
3.75
1.78
.4.
11'2
.12.
-1.8
272
ns.
3.87
L61
4.80
1.93
-2.7
303
<.0
5
12 14 I I
.15
24 30 47 59
7.33
1.07
7.00
.88.
0.83
71ns
6.81
1.25
6.73
1.62
0.13
90.
ns
6.96
1.27
7.00
1.41
-0.1
140
ns
7.02
1.21
6.93
1.35
0.35
81ns
12 14 11 15 24 30 47 59
3.42
1.44
7.29
.1.4
01.
3704
ns
7.72
1.79
1.53
1.81
1.60
39ns
3.21
1.98
2.36
2.60
1.34
88ns
3.15
1.79
'2.1
32.
372.
5070
<.0
5

TA
BLE
4-4
9P
ract
ice
Ski
ll A
sses
smen
t Ins
trum
ent-
Sho
ws
Kno
wle
dge
Abo
ut th
eC
lient
's S
ocia
l Rol
es A
s T
hese
Are
Rel
ated
to P
rese
ntin
g P
robl
ems
(Ite
m 2
2)
4=.
,tz
Cyc
leS
tude
nts
Sta
rt o
fS
ocia
l Wor
k E
duca
tion
Com
plet
ion
ofS
ocia
i Wor
k E
duca
nen
Sta
ndar
d'M
ean
Dev
da Ir
on
t- T
est V
alue
B'a
sod
onD
ilfer
ence
in L
earn
ing
;S
tand
ard
Mea
nD
e vi
la o
nS
land
aro
iAba
nD
e vi
a bo
n
1
111
1V
'Com
bine
d
Acc
eler
ated
Tra
ditio
na1
t-T
est V
alue
Prob
abili
ty
Acc
eler
ated
Tra
ditio
nal
t-T
est V
alue
Prob
abili
ty
Acc
eler
ated
.T
radi
tiona
lt-
Tes
t Val
uePr
obab
ility
Acc
eler
ated
'Tra
ditio
nal
t-T
est V
alue
Prob
abili
ty.
12 14 11 16 24 31 47 61
4.08
1.31
4.86
1.88
-1.1
528
ns
3.91
1.30
5..3
11.
62-2
.300
1<
..05
4.38
1.71
4.77
2.31
0.71
38ns
4.19
1.51
4.93
2.03
.-2
..163
8<
.05
12 14 11 15 74 30 47 59
7.08
1.24
6.43
1.65
1.08
37ns
7.00
1.34
7.00
.93
0.00
00ns
7..1
21.
197.
001.
310.
36,6
1ns
7.09
1.21
6.86
1.32
0.89
52ns
.
12 14 11 15 24 29 47 58
3.00
1.48
1.57
2.28
1.78
98ns
3.09
1.58
1.5.
31.
682.
2980
< .0
5
2.74
2.31
2.34
2.53
0.60
96n5
2.90
1.94
.1.
932.
272.
2999
< .0
5

TA
BLE
4-5
0,P
ract
ice
Ski
n A
sses
smen
t Ins
trum
ent-
Evi
denc
es K
now
ledg
e A
bout
the
influ
ence
of E
thni
c G
roup
s, S
ocia
l Cla
ss a
nd S
tatu
s, a
nd S
ocia
l Con
ditio
ns o
n B
ehav
ior
Mem
23)
Cyc
leS
tude
nts.
Sta
rt o
tS
ocia
l 'W
ork
Edu
catio
nC
ompl
etio
n of
Soc
ial W
ork
Edu
catio
nt-
Tes
t Val
ue B
ased
on
Diff
eren
ce in
Lea
rnin
g
N'
Stan
dard
Mea
nD
evia
tion
NS
tand
ard
Mea
nD
evia
tion
NS
tand
ard'
Moa
nD
evia
tion
Acc
eler
ated
124.
081.
3812
6.83
.72
122.
751.
42T
radi
tiona
l14
5.21
1.72
146.
501.
7014
1.29
1.64
1-1e
st V
alue
-1.7
587
0.60
832.
3193
Prob
abili
tyns
ns<
.05
Acc
eler
ated
113.
642.
25.
116.
821.
6011
3.18
2.71
Tra
ditio
nal
165.
251.
4815
7.47
1.06
152,
071,
53t-
Tes
t Val
ue-2
.161
8-1
.192
3.1.
2762
Prob
abili
ty<
.05
nsns
Acc
eler
ated
244.
581.
8424
7.12
1.12
242,
542.
45
IVT
radi
tiona
lt-
Tes
t Val
ue31
5.13
2.11
-1.0
230
307.
101.
690.
0652
302.
102.
750.
6238
Prob
abili
tyn.
sns
ns
Acc
eler
ated
474.
231.
8447
6,98
1.15
472.
752.
27T
radi
tiona
l61
5.18
1.85
597.
051.
5759
1..9
02.
25C
ombi
ned
.1-T
est V
alue
-2.6
412
-0.2
727
1.91
51Pr
obab
ility
<.0
5ns
ns

TA
BLE
4-5
1P
ract
ice
Ski
ll A
sses
smen
t ins
trum
ent-
Ass
esse
s th
e in
form
atio
n N
eces
sary
fzr
anA
dequ
ate
Dia
gnos
is a
nd A
ctiv
ely
See
ks in
form
atio
n w
hich
is N
ot R
eadi
ly A
vaila
ble
(Ite
m 2
4)
Cyc
leSt
uden
ts
Sta
rt o
fS
ocia
l Wor
k E
duca
tion
Com
piot
ion
ofW
Ork
Edu
catio
nt-
1705
t Val
ue &
Med
on
Dof
foro
nco
in L
earn
ing
Sta
.not
ard
Mea
nD
e vi
a tio
nS
ta n
dard
Mea
nD
evP
atr
onS
tand
ard
Mea
nD
avie
fk)n
I E
Acc
eler
ated
Tra
dona
lt-
Tes
t Val
ue.
Prob
abili
ty
12 143.
921.
385.
142,
031_
7002
us
12 14
6.75
1.21
6.93
1.07
0.38
25ns
12 14
2.83
1.47
1..7
92,
421.
2551
us
Acc
eler
ated
113.
271,
7411
6.45
1..8
.13,
181.
89
iiiT
radi
tiona
lt-
Tes
t Val
ue16
4,88
1.93
-2.1
248.
156.
731,
53--
0.40
7515
1 .7
32.
221.
6812
Prob
abili
ty.
< .0
5ns
us
Acc
eler
ated
244.
332.
0624
6.58
1.72
242.
252.
54
IVT
radi
tiona
lit-
Tes
t Val
ue29
4.62
2.08
-0.5
040'
30.
7.10
1.69
L10
6728
2.54
3.01
0.37
10Pr
obab
ility
us.
usus
Acc
eler
ated
473.
981.
8547
6.60
1.60
472.
622.
16IN
VT
radi
tiona
l59
4.81
2.00
596_
971.
5157
2.14
2.67
Com
bine
dt-
Tes
t Val
ue.
-2.2
258
-1.2
156
1.00
61Pr
obab
ility
<.0
5tiS
115

TA
BL
E 4
-52
Prac
tice
Skin
Ass
essm
ent I
nstr
umen
t-A
sses
ses
Indi
vidu
alPr
esen
ting
Prob
lem
s of
Clie
nts
Spec
ific
ally
and
Ski
llful
ly (
Item
25)
Cye
Stud
ents
Sta
rt a
tS
ocia
l Wor
k E
duca
tion
Stan
dard
'M
ean
Dev
iatio
n
Co
trpt
e tiO
nat
Soci
al W
ork
Edu
catio
n
Staa
card
Mea
nD
evia
tion
t-T
os4
Dsf
tere
nce
Va4
ueB
ased
on
xn L
ea r
n m
g
Sta
.ntla
rM
oan
Dev
iatio
n
Acc
eler
ated
124,
25D
M1.
.:!7.
251.
42.
I 2
3.00
I .5
4T
radi
tiona
l14
5,14
1.88
147.
00.9
61
4L
8o2.
1.S
t-T
est V
alue
.-
L4.
054
0.51
051,
4615
Prob
a M
ayns
,
Acc
eler
ated
113.
36'i
.91
116.
361.
5711
3.00
1.95
Tra
ditio
nal
164.
691.
7015
6.73
1.67
15L
871.
73t-
Tes
t Val
ue.-
- 1
1 t 6
8-0
.593
4I
.503
7Pr
obab
ility
nsos
ns
Acc
eler
ated
.24
4.04
lf.;3
.24
6.75
1,54
142,
712.
18T
radi
tiona
l31
4.74
1.79
307.
171.
.68
302.
502.
30t-
Tes
t Val
ue-1
.515
2-0
.948
00,
3407
Prob
abili
ty'
nsns
ns
Acc
eler
ated
473.
941.
5847
6.79
.1.
5247
2.85
1.94
.11
-1V
Tra
ditio
nal
614.
8Z1.
7759
7.02
.13
592.
192.
13C
ombi
ned
t-T
est V
alue
-2,7
370
0.77
251.
6757
Prob
abili
tyns
ns,
Aow
sum
orao
r,

TA
BLE
4-5
3P
ract
ice
Ski
ll A
sses
smen
t Ins
trur
nent
-Acc
urat
ely
Ass
esse
s th
e C
lient
's C
apac
ity a
nd D
esire
tor
Mov
emen
t and
Cha
nge
tlter
n 26
)
1,...
,.
Cti
L4n
,
Cyc
j'eS
tude
nts
Sta
rt o
fS
ocia
l Wor
k E
duca
tion
Sta
ndai
dM
ean
Dev
iatio
n
Com
pha
faun
' of
Soc
ial W
ork
Edu
cano
n
Sta
ndar
dM
ean
Oew
atro
n
r-T
esrt
Val
ue B
aSed
on
Orf
fere
ace
Lea
rnol
g
Sta
crei
Mri
Do
vra
11 111
IV
Com
bine
d
Acc
eler
ated
'T
radi
tiona
l(-
Tes
t Val
ue.
Prob
abili
ty
Acc
eler
ated
Tra
ditio
nal
t-T
est V
alue
Prob
abili
ty
Acc
eler
ated
.T
radi
tiona
l-T
est V
alue
Prob
abili
ty
Acc
eler
ated
Tra
thtio
nal
t-T
est V
alue
Prob
abili
ty
12 13 11 .16
23 29 46 58.
4...0
8
4 38
2.14
.-0
.426
6fiS
3.45
1.97
4,44
1.79
-1.2
96 I
.ns
4.30
1,66
4.69
1..7
1.
-0.8
1. us
4.0.
41.
604.
55I.
.81
.-L
.516
2ns
1.1
1.5
24 30 47 59
6.75
1.60
6.64
.93
6.18
1.17
5.93
1.87
0.37
35os
6.62
1.53
6.87
1.55
0574
4ns
.
6.55
1.46
6.58
1.54
-0.0
1 9
OS
12 13 1)
1.5, 23 28 46 56
2.67
1.6.
1
2.23
2.3'
00.
5090
ns
2.73
2.05
1.2'
71.
.91
1.79
39ns
2.30
2.38
.
7..3
22.
.13
-0.0
267
ns
2.50
? A
O
2,02
2,14
1.14
42oS
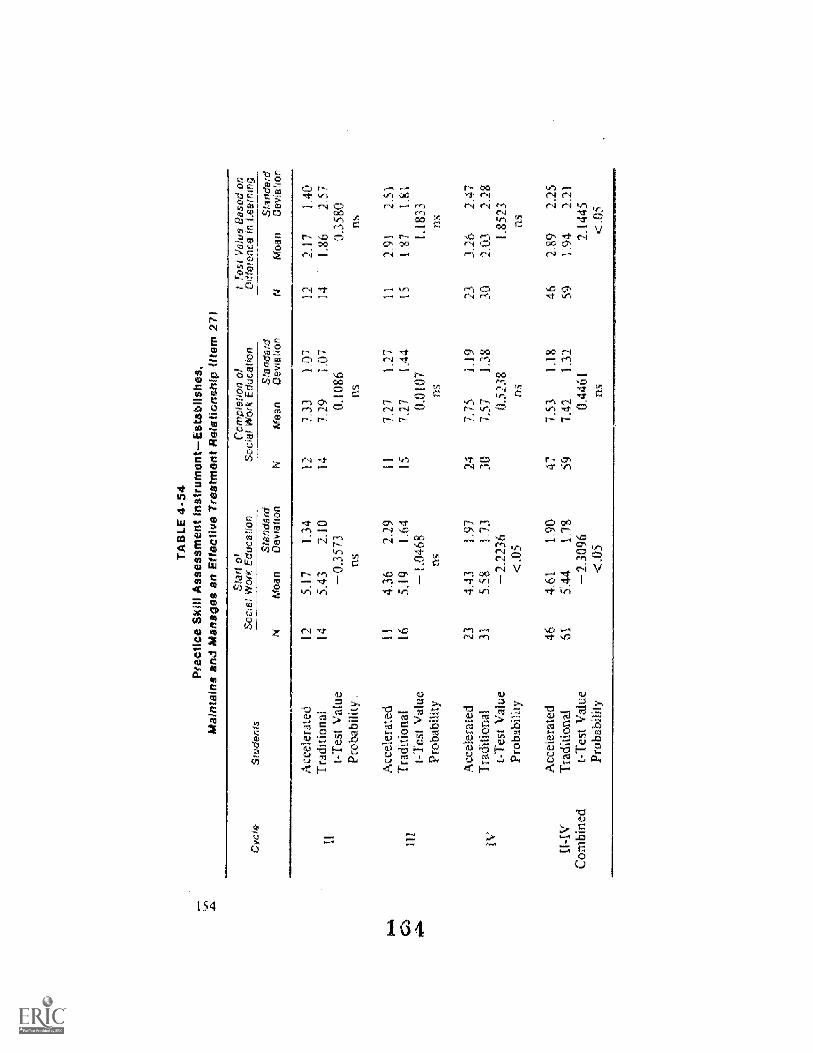
TA
BLE
4-5
4P
ract
ice
Ski
ll A
sses
smen
t ins
trum
ent-
Est
ablis
hes,
,M
aint
ains
and
Man
ages
an
Effe
ctiv
e T
reat
men
t Rel
atio
nshi
p (U
ens
27)
Cyc
leS
tude
nts
Star
t ot
Soc
ial W
ark
Edu
catio
nC
omph
abon
of
Soc
ial'
Wor
k E
duca
tion
1-T
est V
alue
Bas
ed o
nO
rfle
tenc
e in
Lea
rndi
gS
tand
ard
mea
nD
evia
tion
NS
tand
ard'
Mea
nD
evdi
.tion
NS
lInda
rdM
ean
Dev
iatio
n
Acc
eler
ated
125.
171.
3412
7.33
1.07
122.
171.
40T
radi
tiona
l14
5.43
2.10
1471
91.
0714
1.86
2.57
t-T
est V
alue
- 0.
3573
0.10
860.
3580
Prob
abili
tyns
nsns
1....
kA
ccel
erat
edI
I4.
362.
2911
7.27
1.27
112.
912.
51C
)11
.1T
radi
tiona
l16
5.19
1.64
S7.
271.
.44
IS1.
871.
.8.1
AP.
.t-
Tes
t Val
ue-1
.046
80.
0107
1.18
33Pr
obab
ility
Os
Os
ns
Acc
eler
ated
234.
431.
9724
7.75
1.19
233.
262.
47T
radi
tiona
l31
5.58
1.73
307.
.57
1.38
302.
032.
28t-
Tes
t Val
ue-2
.223
60.
5238
1.85
23Pr
obab
ility
<.0
5as
OS
Acc
eler
ated
464.
611.
90.
477.
531.
1846
2.89
2.25
11-I
VT
radi
tiona
l61
5.44
1.78
.59
7.42
1.32
591.
942.
21C
ombi
ned
t-T
est V
alue
:-
2.30
960.
4461
2.14
45.
Prob
abili
ty.
fla
<.0
5

TA
BLE
4-5
5P
ract
ice
SW
Ass
essm
ent i
nstr
umen
t-F
orm
ulat
es E
xplic
it!D
iagn
ostic
Sta
tem
ents
with
an
Aw
aren
ess
of P
robl
ems
Pre
sent
on
the
indi
vidu
al, I
nter
pers
onaL
.and
Com
mun
ity L
evel
(Ite
m 2
8)
,1Pi
wk
Cs
C..7
11
LA
LA
Cyc
leS
Wde
nts
Sta
rt o
fS
ocia
i Wor
k E
duca
tion
Soc
ial
Com
plet
ion
ofW
ork
Edu
catio
n.t-
Tes
t Val
ue B
ased
on
Diff
eren
ce in
Lea
rnin
gS
tand
ard
Mea
nD
evia
tion
Sta
ndar
dM
ean
Dev
iatio
n'S
tand
ard
Mea
nD
evia
tion
Ii III
IV II-I
VC
ombi
ned
Acc
eler
ated
Tra
Otio
nal
t-T
est V
a1ue
Prob
abili
ly
Acc
eler
ated
Tra
ditio
nal
t-T
est V
alue
Prob
abili
ty
Acc
eler
ated
Tra
ditio
nal
t-T
est V
alue
Prob
abili
ty
Acc
eler
ated
Tra
ditio
nal
t-T
est V
alue
Prob
abili
ty
12 13 11 16 24 29 47 58
4.00
1.28
4.69
1.89
-1.0
211
ns
3.63
1.75
4.31
1.78
-0.9
406
ns
3.50
1.69
4.55
1.96
-2.0
970
< .0
5
3.66
1.59
4.52
1.87
-2.5
408,
<.0
5
12 14 11 15 24 30 47 59
6.75
1.48
6.50
1.16
0.46
26ns
6.27
1.56
6.60
1.88
-0.4
523
ns
6.50
1.32
6.53
1.61
-0.0
835
ns
6.51
1.40
6.54
1.57
'-0
.110
0..n
s
12 113
I I IS 24 28 47 56
2 75
:97
1.69
2.29
1.42
410
ns
2.64
1.80
2.07
2.15
0.68
49ns
3.00
218
2.04
2.82
1.36
13ns
2.85
1.89
1.96
2.50
2.04
79<
.05
'

TA
BLE
4-5
6P
ract
ice
Ski
ll A
sses
smen
t Ins
trum
ent-
.P
rese
nts
Evi
denc
e to
Sub
stan
tiate
His
Dia
gnos
is (
item
29)
Cyc
eSt
uden
ts
Star
tSo
cial
Wor
k E
duca
bon
Stan
dard
Mea
nD
evra
tton
Com
plet
ion
ofSo
c,a1
Wor
k E
duca
tion
Stan
dard
NM
ean
Des
aatio
n
Tes
t Val
ue B
ased
on
Dif
fere
nce
in L
earn
ing
Stan
t:law
'N
Mea
nD
evle
hc
11 ill IV II-I
VC
ombi
ned
Acc
eler
ated
.T
radi
tiona
lt-
Tes
t Val
uePr
obab
ility
..
Acc
eler
ated
'Tra
ditio
nal
t-T
est V
alue
Prob
abili
ty
Acc
eler
ated
.T
radi
tiona
lt-
Tes
t Val
ue,
Prob
abili
ty
Acc
eler
ated
Tra
ditio
nal
t-T
est V
alue
Prob
abili
ty
12 14 10 16 24 29 46 59
3.92
1.31
4.79
2.04
-1.2
163
ns
3.50
1.84
4.19
1.87
-0.8
816
ns
3.58
1.74
4.48
199
L75
21.
ns
3.65
1.64
4.47
1.95
-2.3
480
< .0
5
12 14 11 15 24 30 47 59
6.83
1.53
6.86
35--
0.04
65.n
.s
6.09
1.64
6.53
2.07
-0.5
:644
ns
6.71
146
6.63
1.63
0.17
82ns
6.60
1.51
6.66
1.60
-0.2
148
ns
12 14 10 15 74 28 46.
57
2.92
..9
02
071.
410
1.11
069
ns
2..0
2.25
1.13
2.07
ft 7
314
.
ns
3.13
2.51
2.25
2.52
.1.
2519
.ns
3.00
2.11
2.18
2.34
1.87
91fl
s

-
TA
BLE
4-5
7P
ract
ice
Ski
ll A
sses
smen
t Ins
trum
ent-
The
Stu
dent
.For
mul
ates
Ach
ieva
ble
Tre
atm
ent G
oals
in W
hich
the
Des
ired
Out
cOm
es A
re E
xplic
i5ly
Sta
ted
and
Rel
evan
t to
His
FU
nctio
ning
in H
isS
ocia
l Env
ironm
ent..
He
Diff
eren
tiate
s B
etw
een
Inte
rmed
iate
and
Ter
min
al G
oals
(Ite
m 3
0)
Stu
dent
s
Sla
y! o
f.S
octa
t Wet
* E
do..
ca.',
'.on
Sta
nri,,
rdN
Mea
nD
eVia
tlic
fir
Com
peho
h of
Soc,
at.w
ork
Edu
catio
n
Sta
ndar
dN
Mea
nD
eOat
ian
t-T
est
Ddt
eren
ce
N
Vat
ue B
ased
on
,rn
Lear
rung
Sta
ndar
dM
ean
Dev
iatio
n
Ii 111 V
11-I
V
Cor
nbin
ed
Acc
eler
ated
Tra
ditio
nal
t-T
est V
alue
Prob
abili
ty
Acc
eler
ated
Tra
ditio
nal
t-T
est V
alue
Prob
abili
ty
Acc
eler
ated
Tra
ditio
nal
t-T
est V
alue
Prob
abili
ty
Acc
eler
ated
Tra
ditio
nal
t-T
est V
alue
Prob
abili
ty
12 14 11 16 22 28 45 58
4.08
1.24
4.50
2.03
0.59
49ns
2.91
1.58
4.31
2.15
-1.7
786
ns
3.82
1.82
4.57
1.83
.-1
.449
3ns
3.67
1.65
4.48
L94
-2.3
038
<.0
5
1 2
1.-.
,.
1 I
15 24 30 47 59
6.42
1.38
6.71
1.07
-0.5
949
ns
6.27
1.19
5.93
1.87
0.50
78ns
6.92
1.35
6.70
L49
0,55
33.
ns
6.64
1.34
.6.
511.
520.
4657
ns
12 14 11 1 5
22 27 45 56
2.33
[56
2.11
1.15
0.15
28aS
3.36
1.69
1.40
2.26
2.33
07<
.05
3.04
2,40
2.15
2.71
1.22
74ns
2.93
2.04
1.96
2.45
2.16
99<
.05

CC
TA
BLE
4-5
8.P
ract
ice
Ski
ll A
sses
smen
t Ins
trum
ent-
Est
ablis
hes
a.C
ontr
act w
ith th
e C
lient
Tha
t is
With
in th
e C
lient
's C
urre
nt L
evel
of
Und
erst
andi
ng C
once
rnin
g th
e C
hang
e G
oals
sr-
Ant
icip
ated
Tre
atm
ent (
Item
31)
Cyc
leS
tude
nts
Sta
n of
Soc
ial W
ork
Edu
catio
n
Sta
ndar
d
Com
plet
ion
ott-
Tes
t Val
ue B
ased
on
Soc
ial W
ork
Edu
catio
nD
iffer
ence
in L
earn
ing
Sta
ndar
dS
tand
ard
Mea
nD
evia
tion
NM
ean
Dev
iatio
nN
Mea
nD
evia
tion
Acc
eler
ated
113.
731.
1012
6.75
1.42
113.
181.
33T
radi
tiona
l14
4.64
1.86
147.
00.9
614
2.36
1.95
IIt-
Tes
t Val
ue-1
.383
0-0
.510
51.
1536
Prob
abili
tyns
ns.
ns.
Acc
eler
ated
VI
3.45
1.63
116.
551.
3711
3.09
1.70
Tra
ditio
nal
165.
002.
0715
6.40
1.80
151.
132.
2611
1t-
Tes
t Val
ue,
-1.9
963
0.21
542.
3177
Prob
abili
tyns
ns<
....0
5
Acc
eler
ated
234.
131.
..66
247.
171.
2423
3.00
2.37
Tra
ditio
nal.
314.
..87
1.80
306.
901.
4230
2.13
2.43
IVt-
Tes
t Val
ue-1
.562
60.
.735
41.
3034
Prob
abili
tyas
asus
Acc
eler
ated
453.
871.
5347
6.91
1.32
453.
071.
97T
radi
tiona
l61
4.85
1.86
596.
801.
4459
1.93
2.30
Com
bine
d.t-
Tes
t Val
ue-2
.987
80.
4415
2.70
72Pr
obab
ility
<.0
5ns
<...
05

TA
BLE
4-5
9P
ract
ice
Ski
ll A
sses
smen
t Ins
trum
ent-
Gui
des
Clie
nts
To
Ach
ieve
Beh
avio
ral C
hang
es T
hat A
re B
enef
icia
l to
The
ir O
wn
Inte
rest
s an
d to
The
ir In
tera
ctio
n3 w
ith O
ther
Indi
vidu
als
and
Gro
ups
Ote
m 3
21
- C
ycle
Stud
ents
Stan
of
Soci
al W
ork
Edu
catio
nC
ompl
etio
n of
Soc
ial W
ork
Edu
catio
nt-
Tes
t Val
ue B
ased
on
Diff
eren
ce in
Lea
rnin
gS
tand
ard
Mea
nD
evia
tion
NS
tand
ard
Mea
nD
evia
tion
NS
tand
ard
Mea
nD
evia
tion
11
Acc
eler
ated
.T
radi
tiona
lt-
Tes
t Val
ue
12 133.
92L
445.
2317
4-1
.962
8
12 14..
7.17
1.11
7.43
.76
-0,6
814
12 13
3.25
1.66
2.15
1.95
1.44
58Pr
obab
ility
nsns
Ins
Acc
eler
ated
11:1
36
1,63
116.
821.
33I
I3.
461.
81T
radi
tiona
l15
4,93
2 15
157.
331.
.23
142.
001.
57i-
Tes
t Val
ue-1
.949
2-0
.978
02.
0626
Prob
abili
tyns
nsO
s
Acc
eler
ated
213.
901.
6721
7.42
1.21
213.
382.
13-
IVT
radi
tiona
lt-
Tes
t Val
ue30
4.57
1.91
-1.3
134.
307.
171.
560.
6636
292.
622.
741.
1017
Prob
abili
ty.
nsns
ns
Acc
eler
ated
.44
3.77
1.58
447.
211.
2144
3,36
1.89
II-I
VT
radi
tiona
l.58
4.81
1.92
597.
271.
3156
2,36
2.31
Com
bine
dt-
Tes
t Val
ue-2
.986
20.
2375
2.39
52Pr
obab
ility
<.0
5ns
<.0
5

Ow
.
TA
BLE
. 4-6
0P
ract
ice
Ski
ll A
sses
smen
t lns
trum
ent-
Wor
ks w
ith R
elev
ant i
ndiv
idua
ls G
roup
s an
dO
rgan
izat
ions
Oth
er T
han
the
Clie
nt T
o F
acili
tate
Ach
ieve
men
t of T
reat
men
t Goa
ls (
Rem
33)
Cyc
leS
tude
nts
Sta
rt o
fS
ocia
l Wor
k E
duca
tion
Soc
N
Com
plet
ion
of4a
t Wor
k E
duca
tion
it-T
est V
alue
Bas
ed o
nD
iffer
ence
in L
earn
ing
Sta
ndar
dM
ean
Dev
iatio
nS
tand
ard
Mea
nD
ewat
ion
Stan
dard
Mea
nD
evia
tion
ii Ill
IV
11-I
VC
ombi
ned
Acc
eler
ated
Tra
ditio
nal
t-T
est V
alue
Prob
abili
ty
Acc
eler
ated
Tra
ditio
nal
t-T
est V
alue
Prob
abili
ty
Acc
eler
ated
Tra
ditio
nal
t-T
est V
alue
Prob
abili
ty
Acc
eler
ated
Tra
ditio
nal
I-T
est V
alue
Prob
abili
ty
10 13 9 16 22 30 41 59
5.30
1.34
.
6,00
1 .3
5
-1;1
807
ns
4.33
1.66
5.31
1.85
-1.2
631
ns
4.68
2.01
5,40
1.90
-1.3
017
ns
4.76
1.79
5.51
1.78
-2.0
773
..<.0
5
12 14 11 15-
24 30 47 59
7.42
1.31
6.86
135
1.02
54ns
6.36
2.16
7.67
.90
-2.0
205
ns
7.25
1.29
7.40
1.25
-0.4
300
ns
7.09
1.56
7.34
1.21
-0.9
176
ns
10 13. 9 15 .2
2 29 41 57
1.90
1.45
1.00
2.12
1.09
97ns
217
1.64
.2.
071.
581.
0073
ns
2.45
2,58
2.07
2.27
0.55
71ns
2.39
2.14
1.83
2.09
1.30
27ns

TA
BLE
4-6
1P
ract
ice
Ski
ll A
sses
smen
t ins
trum
ent-
Eva
luat
es in
divi
dual
Cha
nge
Dur
ing
and
at th
e T
erm
inat
ion
of T
reat
men
t (Ite
m 3
4)
Cyc
leS
tude
nts
Sta
rt o
lS
ocia
l Wor
k E
duca
tion
Com
plet
ion
otS
ocia
l Wor
k E
duca
tion
t-T
est V
alue
Bas
ed o
nD
iffer
ence
in L
earn
ing
Sta
ndar
dM
ean
Dev
iatio
nN
Sta
ndar
dM
ean
Dev
iatio
nS
tand
ard
Mea
nD
evia
tion
III
IV II-I
VC
ombi
ned
Acc
eler
ated
Tra
ditio
nal
t-T
est V
alue
Prob
abili
ty
Acc
eler
ated
Tra
ditio
nal
t-T
est V
alue
Prob
abili
ty
Acc
eler
ated
Tra
ditio
nal
t-T
est V
alue
Prob
abili
ty
,
AC
Cel
erat
edT
radi
tiona
lt-
Tes
t Val
uePr
obab
ility
9 10 10 8 19 22 38 40
4.11
.93
4.80
1.32
-1.2
343
ns
3.50
2.07
4.00
1.41
-0.5
500
ns
4.16
1.92
4.41
2.28
-0.3
826
ns
3.97
1.76
4.43
1.91
-1.0
862
ns
12 14 1 I
15 24 30 47 59
6.75
1.42
6.86
1.23
-10.
1978
rts
6.73
1.79
.7.
331.
05-1
.038
9ns
7.04
1.37
7.07
1.66
-0.0
607
ns
6.89
1,46
7.08
1.42
-0.6
774
ns
9 10 108 19 22 38 .10
2.67
1.41
2..4
01.
.51
0.37
52ns
3.40
2.59
3.38
2.00
0.02
12ns
2.63
2.43
2.50
2.96
0.15
63ns
2.84
2.25
2.65
2.47
0.35
98ns

TA
BL
E 4
-62
Prac
tice
Skill
Ass
essm
ent I
nstr
umen
t-Pr
epar
es C
lient
tor
Ter
min
atio
n (i
tem
35)
tom
i6
Cyc
leS
tude
nts
Sta
rt o
f6o
cial
Wor
k E
duca
tion
Com
plet
ion
ofS
ocia
l Wor
k E
duca
tion
1-T
est V
alue
Bas
ed o
n:D
iffer
ence
in L
earn
ing
Sta
ndar
dM
ean
Dev
iatio
nN
Sta
ndar
dM
ean
Dev
iatio
nN
Sta
ndar
d'm
oan
Dev
iatio
n
ill
Acc
eler
ated
.T
radi
tiona
l.t-
Tes
t Val
uePr
obab
ility
- -.-
-
12 147.
251.
367.
361.
15-0
2093
ns
....1
Acc
eler
ated
__
117,
271.
19_
N,
Tra
ditio
nal
tjest
Val
ue-
147.
86.6
6-1
.491
4-1
:11
Prob
abili
tyn
s
:....
Acc
eler
ated
153.
801.
9324
7.25
1.07
1.5.
%.
3.4.
02.
03'
Tra
ditio
nal
164.
752.
3530
7.53
1.43
.16
2.69
2.91
IV1r
est V
alue
-1.2
312
-0.8
306
0.79
40Pr
obab
ility
nsns
ns
Acc
eler
ated
243.
542.
0047
7.26
1.15
243.
792.
08il-
IVT
radi
tiona
l26
4.77
2.07
587.
571.
2226
2,73
2.52
Cor
nbin
edt-
Tes
t Val
ue-2
.134
9-1
.354
01.
.625
7Pr
obab
ility
.<
..05
ns11
S
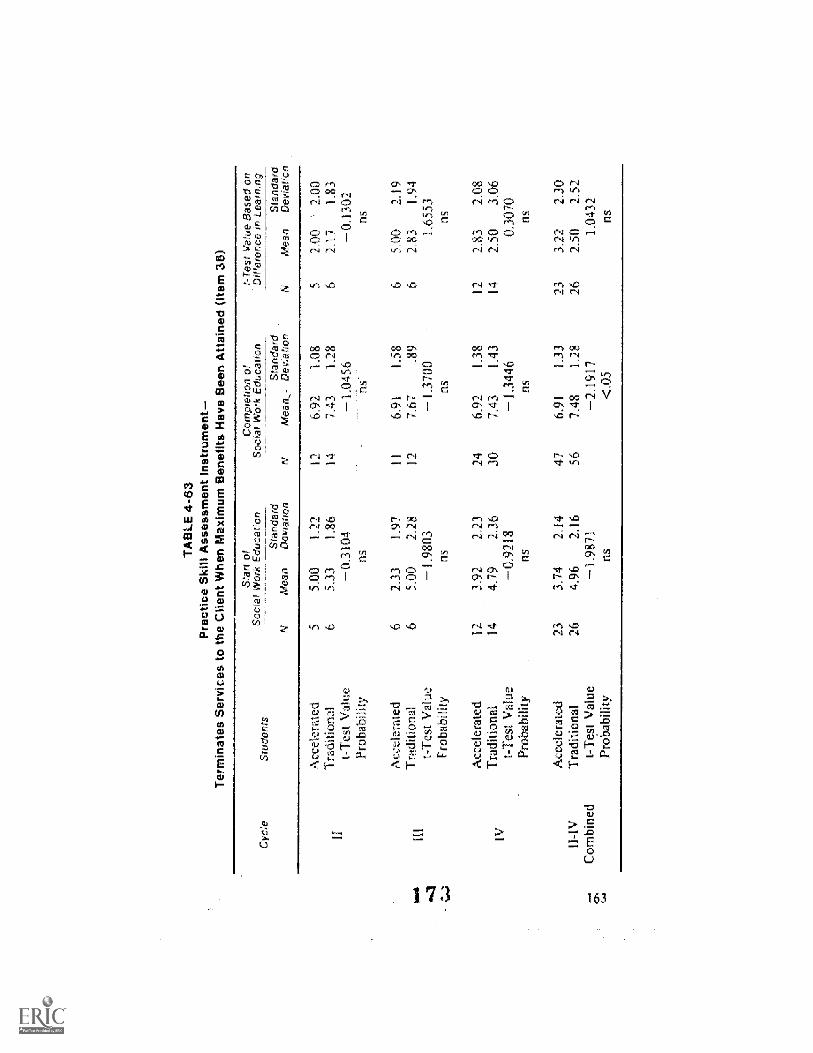
t..,
TA
BLE
4-8
3P
ract
ice
Ski
ll A
sses
smen
t Ins
trum
ent-
Ter
min
ates
Ser
vice
s to
the
Clie
nt W
hen
Max
imum
Ben
efits
Hav
e B
een
Atta
ined
(Ite
m 3
6)
Cyc
leS
tude
nts
Soc
ial
Sta
rt o
fW
ork
Edu
catio
nS
ocia
lC
ompl
etio
n of
Wor
k E
duca
tion
t- T
est V
atue
Bas
ed o
nD
iffer
ence
in L
earn
ing
Sta
ndar
dM
ean
Dev
iatio
nS
tand
ard
Mea
n,-
De
viat
ton
Sta
ndar
dM
ean
Dev
iatio
n
11 1;11
1
IV
II.-
IVC
ombi
ned
Acc
eler
ated
Tra
ditio
nal
[-T
est V
alue
Prob
abili
ty
Acc
eler
ated
.T
radi
tiona
lt-
Tes
t Val
ue.
Prob
abili
ty
Acc
eler
ated
.T
radi
tiona
lI.
-Tes
t Val
uePr
obab
ility
Acc
eler
ated
Tra
ditio
nal
t-T
est V
alue
Prob
abili
ty.
6 6 12 14 23 26
5..0
01.
.22.
5.33
1.86
-0.3
104
ns
2.33
1.97
5.00
2.28
-1.9
803
as
3.92
2.23
4.79
2.36
-0.9
218
ns
3.74
2.14
.4.
962.
16-1
.987
1ns
12 14 11 12 24 30 47 56
6.92
1.08
7.43
1.28
-1.0
456
fls
6.91
1.58
7.67
.89
-1.3
700
ns
6.92
1.38
7.43
1.43
-1.3
446.
ns
6.91
1.33
7.48
1.28
-2.1
917
<.0
5
6 6
12 14 23 2.6
2.00
'2.
002.
171.
83-0
.130
2ns
5.00
2.19
2.83
1.94
.1.
6553
ns
2.83
2.08
2.50
3.06
0.30
70ns
3.22
2.30
2.50
2.52
1.04
32ns
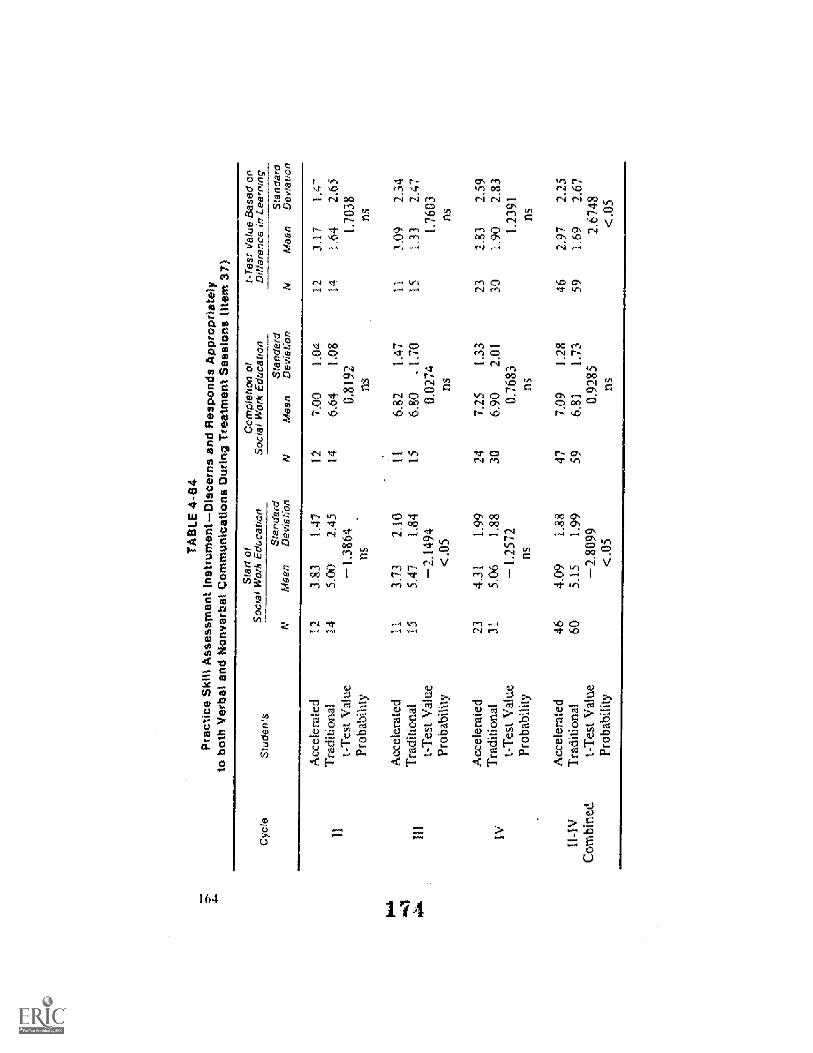
TA
BLE
4-8
4.P
ract
ice
Ski
ll A
sses
smen
t Ins
trum
ent-
Dis
cern
s an
d R
espo
nds
App
ropr
iate
lyto
bot
h V
erba
l and
Non
verb
al C
omm
unic
atio
ns D
urin
g. T
reat
men
t Ses
sion
s (it
em 3
7)
lbw
*N
.,.3
Cyc
leS
tude
nt's
Sta
rt o
fS
ocia
l Wor
k E
duca
tion
Com
ple
tion
ofS
ocia
l Wor
k E
duca
tion
t-T
estV
alue
Bas
ed o
nD
iffer
ence
in L
earn
ing
Sta
ndar
dM
ean
Dev
iatio
nN
Sta
ndar
dM
ean
Dev
iatio
nS
tand
ard
Mea
nD
evia
tion
1.1
1.11
.
.1V
1.1-
1V
Com
bine
d.
Acc
eler
ated
Tra
ditio
nal.
I.-T
est.
Val
uePr
obab
ility
Acc
eler
ated
.T
radi
tiona
l.t-
Tes
t Val
uePr
obab
ility
Acc
eler
ated
.T
radi
tiona
l.t-
Tes
t Val
uePr
obab
ility
Acc
eler
ated
Tra
ditio
nal
t-T
est V
alue
Prob
abili
ty.
12 14 11 15 23 31 46 60
3.83
1.47
5.00
2.45
ns
3.73
2.10
5.47
1.84
-2.1
494
<.0
5
4.31
1.99
5.06
1.88
-1.2
572
ns
4.09
1.88
5.15
1.99
-2.8
099
<.0
5
12 14 11 15 24 30 47 59
7.00
1.04
.
6.64
1.08
0319
2ns
6.82
1.47
6.80
130
0.02
74ns
7.25
1.33
6.90
2.01
.
0.76
83ns
7.09
1.28
6.81
1.73
0.92
85ns
12 14 11 15 23 30 46 59
3,17
1,4'
1.64
2.65
1.70
38ns
3.09
2.34
1.33
2.47
1.76
03ns
2.83
2.59
1.90
2.83
1.23
91ns
2.97
2.25
1.69
2.67
2.67
48,
<.0
5.

TA
BLE
4-6
5P
ract
ice
Ski
If A
sses
smen
tto
r C
lient
Con
tact
s In
Ord
er to
Fac
ilita
te M
ovem
ent T
owar
d T
reat
men
t Goa
ls M
em 3
6)
. cr,
u.
Cyc
leSt
ar:te
nts
Stan
of
Soci
al W
ork
Ede
catio
nC
ompl
etio
n of
Soci
al W
ork
Edu
cado
nt-
Tes
t Vai
de B
ased
on
Dif
fere
nce
in L
earn
ing.
Stan
dard
Mea
nD
eWat
ion
NSt
anda
rdM
ean
Dev
iatio
nN
Stan
dard
Mea
nD
evia
tion
11.1
I.V
H4V
Com
bine
d
Acc
eler
ated
Tra
ditio
nal
t-T
est V
alue
Prob
abili
ty
Acc
eler
ated
Tra
ditio
nal
t-T
est V
alue
Prob
abili
ty
Acc
eler
ated
.T
radi
tiona
l.t-
Tes
t Vat
tre
Prob
abili
ty
Acc
eler
ated
Tra
ditio
nal
t-T
est V
alue
:Pr
obab
ility
12 14 11 15 23 31 46 6.0
4.58
1.16
.5.
002.
35-0
.535
7ns
400
1.55
,5.
331.
88-1
.848
3.ns
4.61
2.21
5.03
1.85
.-0
.745
1ns
4.46
1.82
5.10
1.95
-1.7
458.
IPS
12 14 11 15 24 30 47 59
7.08
1.16
7.07
1.20
0.02
45ns
6.45
.1.
636.
931.
67-0
.700
7ri
s
7.08
1.50
.7.
101.
35-0
.042
4ns
6.94
1.45
7.05
1.38
.-0
.412
8.as
.
12 14 11 15 23 30 46 59
2.50
1..3
1.
2.07
2.50
0.51
38ns
2,45
1.75
1.60
2.50
0.93
34ns
2.39
2.66
2.17
2.20
.0.
3282
ns
2.43
21 4
2.00
2.32
0..9
965
11S
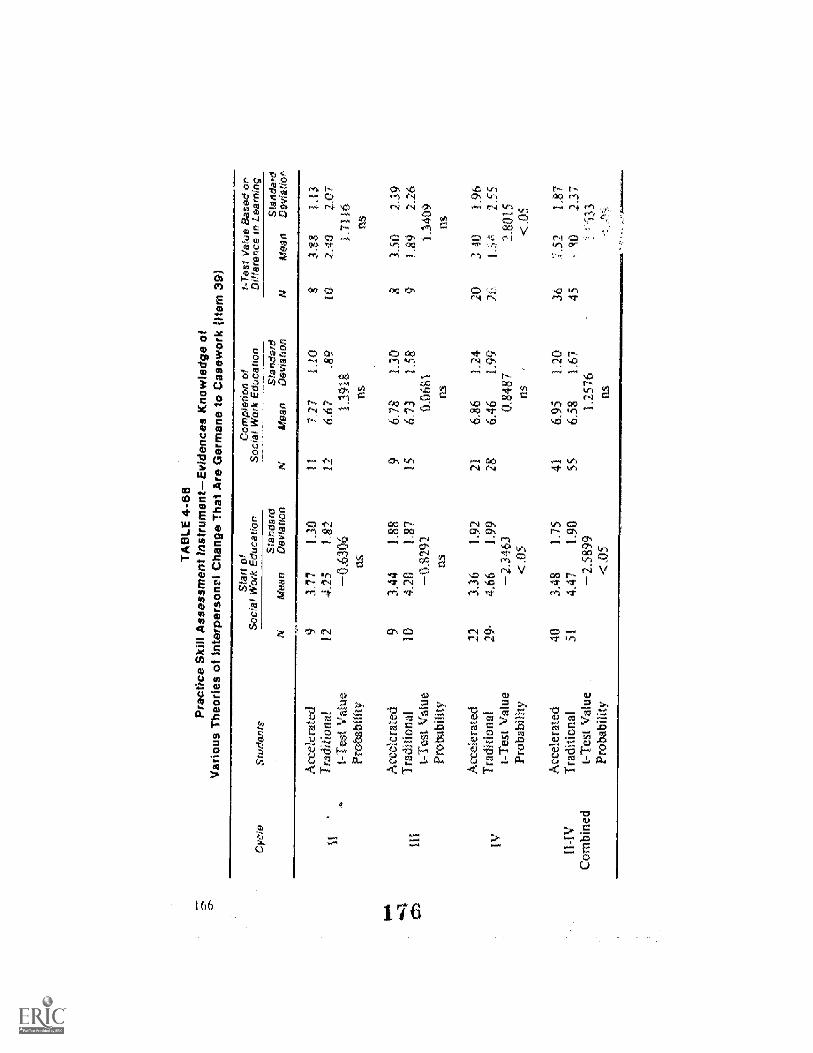
TA
BLE
4-6
8P
ract
ice
Ski
ll A
sses
smen
t Ins
trum
ent-
Evi
denc
es K
now
ledg
e of
Var
ious
The
orie
s of
inte
rper
sone
l Cha
nge
Tha
t Are
Ger
man
e to
Cas
ewor
k M
em 3
9)
Cyc
leS
tude
nts
Sta
rt o
fS
ocia
l-Wor
k E
duca
tion
Com
plet
ion
ofS
ocia
l Wor
k E
duca
tion
t-T
est V
alue
Bas
ed o
n.D
iffer
ence
in L
earn
ing
Sta
ndar
dM
ean
Dev
iatio
nN
Sta
ndar
dM
ean
Dev
iatio
nN
Sta
ndar
dM
ean
Dev
iaU
on
11.1
.
IV
.11-
1V
Com
bine
d
Acc
eler
ated
.T
radi
fion
al1-
Tes
t Val
ue.
Prob
abili
ty
Acc
eler
ated
Tra
ditio
nal
t-T
est V
alue
Prob
abili
ty
Acc
eler
ated
Tra
ditio
nal
t-T
est V
alue
Prob
abili
ty
Acc
eler
ated
.T
radi
tiona
lt-
Tes
t Val
uePr
obab
ility
9 12 9 10 22 29.'
40 51
3_77
1.30
.4.2
51.
82-0
.630
6.rt
s
3.44
1.88
4.20
3.87
-0,8
2.92
n.s
3,36
1.92
4.66
1.99
-2.3
463
< .0
5
3.48
1.75
4.47
1.90
-2.5
899
< .0
5
1'1 1 , 9 35 21 28 41 55
7..2
71.
106.
67.8
91.
3918
.ns
6.78
1.30
6..7
31.
58.
0.06
81.
ns
6.86
1.24
6.46
1.99
0.84
87ns
6.95
1,20
6.58
1.67
1..2
576
ns.
81.
0 8 9
20 2f.
36 45
3.!e
g1,
132.
40..7
.07
1_71
16.
ns
_3.5
02.
391.
892.
261.
54.0
9.ns
3 ,4
01.
9613
4.=
2.55
1801
5..0
5
,7.5
2L
87cl
02,
37"1
33

TA
BLE
4-6
7P
ract
ice
Ski
n A
sses
smen
t ins
trum
ent-
laen
te$
Grid
ii er
entia
tes
the
S(r
uctu
ral a
ndIn
tera
ctio
nal P
atte
rns
Tha
t Exi
st W
ithin
Rel
evan
t Gro
ups
to W
hich
the
Clie
nt B
elon
gs li
tem
40)
Cyc
le.
Stu
dem
ls
Sta
rt o
fS
ocia
t Wor
k E
duca
tion
Com
plet
ion
ofS
ocia
l Wor
k E
duca
tton
I-T
est V
alue
Bas
ed o
nD
iffer
ence
n L
earn
ing
Sta
ndar
dM
ean
Dev
iatio
nN
Sta
ndar
dM
ean
Dev
iatio
nN
Sta
ndar
dM
ean
Dev
iarr
on
111
IV
11-1
V
Com
bine
d
Acc
eler
ated
Tra
ditio
nal.
t-T
est V
alue
Prob
abili
ty
Acc
eler
ated
Tra
ditio
nal
t-T
est V
alue
Prob
abili
ty
.A
ccel
erat
ed.
Tra
ditio
nal
t-T
est V
alue
Prob
abili
ty
Acc
eler
ated
Tra
ditio
nal
t-T
est V
alue
Prob
abili
ty
9
11
9 M.
22 30 40 51
3.78
.1.3
04.
551.
69-1
.058
7ns
3.22
1.99
4.10
HO
-1.1
416
ns
3.55
2.09
4.23
1.85
-1.2
312
ns
3.53
1.88
4.27
1.67
-1.9
792
<.0
5
VI
12 9 15 21 28 41 55
6,09
1.22
6.08
1.44
0.01
29ns
6.78
1.20
6.67
1.50
0.18
11ns
6.76
1.22
6.57
1.75
0.44
82rt
s
6.59
1.22
6.49
1.61
0.32
67ns
8 9 8 9 20 27 36 45
2.75
1.67
1.78
2,22
0.94
82ns
3.50
2.33
2.22
11 1
1..1
150
ns
3.10
2.17
2.22
2.52
1.27
92
3.11
2.07
2 13
2.34
1.99
38<
.05

TA
BLE
4-6
8P
ract
ice
Ski
ll A
sses
smen
t Ins
trum
ent-
Per
ceiv
es P
atte
rns
in C
lient
's g
enav
ior,
and
Atte
mpt
a T
o D
eter
min
e T
heir
Und
erly
ing
Cau
se a
nd M
eaffi
ng .i
ttern
41)
Cyc
isS
tude
r$.1
0.
Sta
rt o
fS
ocia
l Wor
k E
deca
tion
Com
plet
ion
ofS
ocia
l Wor
k E
duce
tion
t-T
est V
atue
Bas
ed o
nD
iffer
ence
in L
earn
ing
Sta
ndar
dM
aar.
'D
evia
tion
Sta
ndar
dM
ean
Dew
atio
nS
tand
ard
Mea
nD
evia
tion
Acc
eler
ated
.T
radi
tiona
lt-
Tes
t Val
uePr
obab
ility
9 11
4.78
1.56
5.18
2.04
-0.4
632
ns
11 12
6.82
1.25
6.92
1.16
0.18
69ns
8 92.
251.
832.
112.
370.
1259
as
Acc
eler
ated
93.
561.
339
6.56
1.24
.8
3.00
2.00
111.
Tra
ditio
nal
I-T
est V
alue
1041
02.
08-.
0.63
4915
7.13
1.19
--1
.088
19
2.33
2.40
0..5
806
Prob
abili
tyns
Acc
eler
ated
223.
502.
2221
6.81
1.36
203.
2023
3.
WT
radi
tiona
lt-
Tes
t Val
ue30
5.17
'1.
862.
8618
286.
861.
88-0
1027
271.
..63
2.59
1.99
46Pr
obab
ility
< .0
5ns
ns
Acc
eler
ated
403.
801.
9541
6.76
1.28
362.
942.
38Il
-1V
Tra
ditio
nal.
514.
961.
9555
6.95
1.56
451.
872.
47C
ombi
ned
t-T
est V
alue
.-2
.818
6-0
.653
21.
9911
Prob
abili
ty<
.05
.ns
< .0
5

TA
BLE
4-6
9P
ract
ice
Ski
ll A
sses
smen
t ins
trum
ent-
Est
ablis
hes
a V
iabl
e T
reat
men
t Pla
n R
elat
ed to
Indi
vidu
al T
reat
men
t:;o
als
lltem
42)
Cyc
leSt
uCen
lsSt
arr
rSo
csar
Wor
k .E
duca
bon
Stan
dard
NM
ean
Dev
iabo
nN
CO
UIP
lerx
0,ro
,
VV
OI
Edb
SiC
anda
rdM
ean
Daw
aSon
a, te
e
N
Bas
ed o
nL
eaft
ung
Stan
dard
Ma
nD
evla
bor
II
Acc
eler
ated
Tra
ditio
nid
t-T
est.
Val
uePr
obab
ility
.
9 10
4.11
1..0
5
4..2
01.
..H
0.12
.18
ns
11 12
6:81
1.17
6..9
21.
240.
1869
ns
83,
(iti
tl .2
t1
0.16
88ns
Acc
eler
ated
93.
562.
079
6.33
1.73
82.
872.
7011
11T
radi
tiona
l10
3.70
1.42
156.
.67
1..5
.44
2.78
1.09
t-T
est V
alue
.-0
.169
3-0
.468
211
.093
4Pr
obab
ility
nsns
.ns
Acc
eler
ated
.21
3.33
2.08
216.
951.
3219
.3.6
22.
89IV
Tra
dona
l29
4.59
1.09
286.
791.
7126
2.20
2.80
rt-T
est V
alue
.2.
..178
40.
3851
1.83
30Pr
obab
ility
< .0
5ns
ns
Acc
eler
ated
.39
3.56
1.88
416.
781.
3735
3.29
2.52
Il-T
VT
radi
tiona
l49
4.33
1.80
556.
.78
1.55
.43
2.33
2.34
Com
bine
dt-
Tes
t Val
ue1.
9307
-0.0
04.5
7305
Prob
..:C
ilny
nsns
11
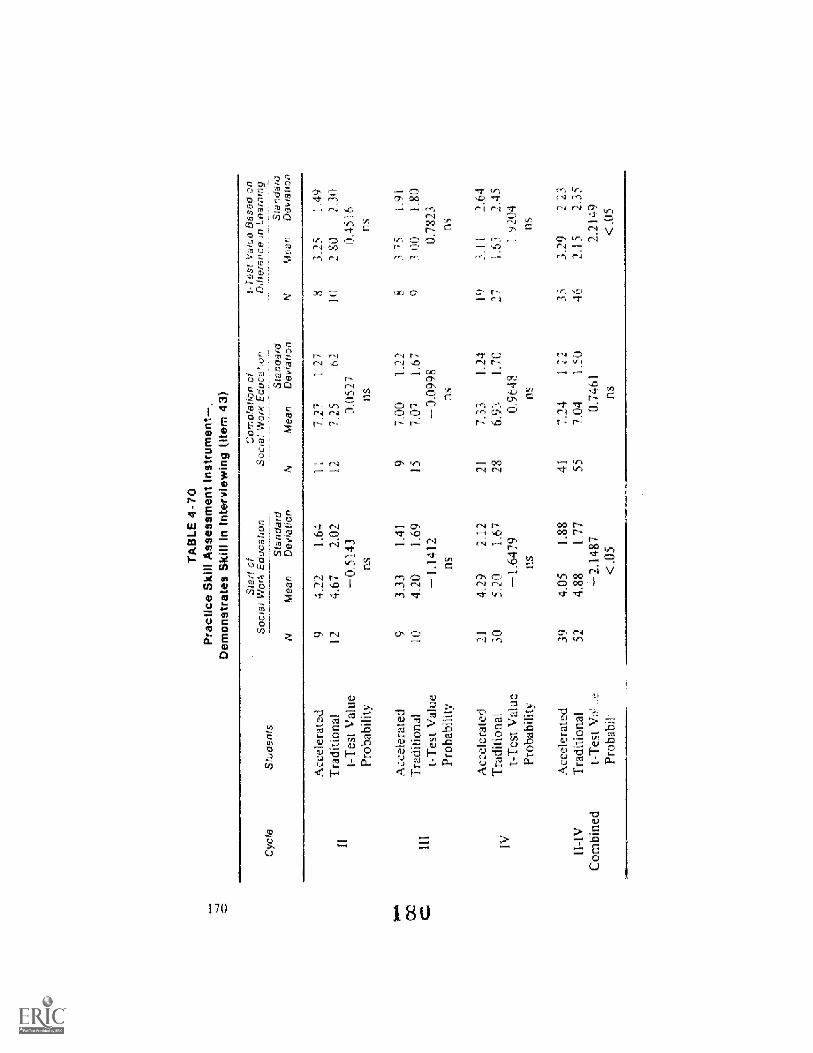
TA
BLE
4-7
0P
ract
ice
Ski
ll A
sses
smen
t ins
trum
ent-
,D
emon
stra
tes
Ski
ll in
inte
rvie
win
g (it
em 4
3)
Cyc
leS
tude
nts
Sta
rt o
tS
ocia
l Wor
k E
duca
tion
Soc
;a4
.N
Com
plet
ion
ofW
ork
Edu
ca l!
ivn
Tes
t Val
ue B
ased
on
Don
eren
ceLe
arnm
g
Sta
ndar
dN
Mea
nD
eOill
oon
Sta
ndar
dM
ean
Dev
iatio
nS
tand
ard
Mea
nD
evia
tion
ii
Acc
eler
ated
'Tra
ditio
nal
t-T
est V
alue
Prob
abili
ty
9.1
2
4.22
1.64
4.67
2...0
2
-0.5
143
n.s
11 12
7.27
1.27
7.25
6.,1
0.05
27ns
8
I Il
l
3.25
1.49
2 .S
02.
300.
4516
ns
10.6
Acc
eler
ated
93.
331.
419
7.00
122.
837
5C
C C1.
11T
radi
tiona
lt-
Tes
t Val
ue10
4.20
1.69
-1.1
4112
157.
071.
67_0
.099
89
3.00
1.80
0782
3Pr
obab
ility
nsns
ns
Acc
eler
ated
214.
292.
1221
7.33
1.24
19'
3.11
2.64
1.V
Tra
ditio
nal
t-T
est V
alue
305.
201.
67-1
..647
928
6.93
.1.
700.
9648
.27
1.63
2:45
1..9
.204
Prob
abili
tyns
nsns
Acc
eler
ated
394.
051.
8.8
417.
241.
2235
3.29
2.23
II-.
1.V
Tra
ditio
nal
524.
881.
7755
7.04
1.50
462.
.15
2.35
Com
bine
dt-
Tes
t Va!
..,..
.--2
.148
70.
7461
2..2
149
Prob
abil-
< .0
5ns
< .0
5

CO
TA
BLE
4-7
1P
ract
ice
Ski
n A
s-,,e
ssril
ent I
nstr
umen
t-U
ses
Inte
ryie
win
g S
kifis
Diff
eren
tially
in A
ccor
danc
e w
ith th
e C
onte
.x.t
of C
lieni
Con
tact
Ote
rn 4
4)
Cyc
leSf
tdde
nts
Star
t of
Soci
al W
ork
Edu
cc."
...7
Cor
note
hon
Soci
,at W
ork
Edu
catr
on
Sta
ndar
dM
aar,
Dav
ie f
ion
Tes
tD
iffe
renc
eV
alue
Cas
ed o
neq
Lea
rnin
g.
Mea
nSt
anda
rdM
ean
Dev
iatio
n
ii
Acc
eler
ated
Tra
ditio
nal.
t-T
est V
alue
Prob
abili
ty
7 11
4.23
L90
4.64
2.42
-0.1
815
fits
16.
451.
576.
831.
110.
6408
.ns
62.
501.
972.
332.
500.
1278
ns
Acc
eler
ated
93.
111.
699
7.22
.97
84.
122.
.17
inT
radi
tiona
lt-
Tes
t Val
ue10
4.00
1.89
-1.0
187
157.
001,
930.
3085
9.3
.11
1:14
0
0.96
54Pr
obab
ility
nsns
ns
Ace
lera
teil.
223.
501.
5721
7.19
1.17
203.
752.
27T
radi
tiona
l28
4.57
1.85
286.
681.
682.
62.
032.
49.
t-T
est V
alue
2.21
351.
2582
2.43
11Pr
obab
ility
< .0
5ns
< .0
5
Acc
eler
ated
383.
581.
6741
7.00
1.26
343.
622.
21II
-IV
Tra
ditio
nal.
494.
471.
9755
6.80
1.63
442.
322.
37C
ombi
ned
t-T
est.
Val
ue-2
.279
30.
6777
2.49
95Pr
obab
ility
<..0
5ns
< .0
5

TA
BLE
4-7
2P
ract
ice
Ski
ll A
sses
smen
t Ins
trum
ent-
Enc
oura
ges
the
C1i
ent''
3P
artiz
ioei
on in
the
Ana
lysi
s, E
valu
atio
n, a
nd S
olut
ion
of H
is P
robl
ems
(item
45)
Cyd
eS
:!_:d
ents
Sr
art o
fS
ocia
l Wor
k E
duca
tlion
CoM
pfgt
iori
ofS
ocxa
l WcI
rk E
Sta
ndar
dN
ean
Dev
ta
Tes
Tav
iffef
ence
N
Vai
Wo
Bas
ed o
nn
Lcia
rnm
g
Sta
ndar
dM
ean
Dek
natio
nS
tand
ard
Mea
nD
owat
ion
Acc
eler
ated
94.
1111
711
7.27
1.27
3.62
1.41
11T
radi
tiona
lt-
Tet
Vce
12.5
01.
4704
161
126.
67 1.22
63
2.50
0.97
54
fkob
abili
tyfl
nsns
Acc
eler
ated
83.
881.
739
6.78
1.20
73.
002.
45
IFT
radi
tiona
l10
4.10
1.73
157.
061.
499
2.44
1 .9
4
t-T
est V
alue
0.25
88-0
..473
10.
4731
Prob
ab!l
ityns
nsO
s
Acc
eler
ated
21i 5
7L
6621
7.14
1.31
193.
572.
43
IVT
radi
tiona
l.t-
TeS
t Val
ue29
....f
:'.2
.1J'
1.'.'
e.
1.97
7078
7:00
1.49
0.35
5326
2.31
2.46
1.77
21
Prob
abili
tyns
nsns
Acc
eler
ated
..38
7-'7
61.
5541
7.10
1.26
343.
472.
19
1I-I
VT
radi
tiona
l51
4.2,
31.
8755
6.95
1.38
452.
402.
33.
Com
bine
dt-
Tes
t Vce
-1.8
417
0..5
614
2.09
22
Pt J
naN
lity
nsns
..05

TA
BLE
4-7
3,P
ract
ice
Ski
ll A
sses
smen
t Ins
trum
ent-
Has
Abi
lity
To
Use
Var
ious
The
rape
utic
Tec
hniq
ues
on A
ppro
pria
te O
ccas
ions
(he
m46
)
Stu
dent
s
Sta
rt o
fS
ocia
ir W
ork
Edu
catio
n
Sta
ndar
dM
ean
Dev
iadn
Com
plet
ion
ofW
ork
Edu
catio
n
Sta
ndar
dr,
ean
Daw
arlo
n
II hI
Com
bine
d
t-T
est V
alue
Bas
ed o
nD
illur
ence
fl L
earm
ng
Sta
ndar
dM
ean
Dev
ratIv
ol
Acc
eler
ated
93.
562.
1311
6.63
1.29
83.
502.
14T
radi
tiona
l10
4.7.
07.
2112
.6.
751.
06S
2.38
2.26
t-T
est V
alue
1.08
40-0
.222
10.
..955
9Pr
obab
ility
nsns
us
Acc
eler
ated
.8
3.12
1.81
96.
44.7
3,7
3.42
L81
1.T
radi
tiona
l10
3.40
1.65
156:
83L
609
3.22
2.11
t -T
est V
alue
-0.3
138
--0.
7160
0.19
30Pr
obab
ility
nsus
ns
Acc
eler
ated
193.
321.
.53
211.
2617
3:53
1.97
.T
radi
tiona
l28
4.14
2.21
281.
7316
2 42
3...6
t-T
est V
a1u
-1.5
177
'. .2
451.
3845
Prob
abili
tyns
nsns
Acc
eler
ated
.36
3.33
1.71
416.
8J1.
18.
323.
501.
92T
radi
tiona
l48
4.10
2.11
556.
801.
.54
432.
582.
86t-
Tes
t Val
ue-1
.851
30.
1052
.1.
6646
Prob
abili
tyns
ns.
.ns

-.4
and
the
Tre
atm
ent P
roce
ss in
Ter
ms
of T
his
Ass
essm
ent (
item
47)
TA
BLE
4-7
4.iic
tice
Ski
ll A
sses
srne
nt In
stru
men
t-A
sses
ses
Ade
quat
eiy
Vie
Rea
dine
ss fo
r N
ew B
ehav
iora
l Tas
ks o
r N
ew U
nder
stan
ding
Cyc
eSh
:der
ns
Star
t dt
Soc,
rai W
ork
Edu
catio
nC
ampl
eyon
of
Soc
ial W
ork
Eth
ical
/on
Sta
ndar
dN
Mea
nD
e vo
n
t- T
est V
'Wee
Bas
ed o
naV
aren
ce in
Lea
rnin
gS
tand
ard
Mea
nD
evia
tson
Acc
eler
ated
93.
671.
3211
6.45
1.37
3.12
1.11
3
IIT
radi
tiona
lt-
Tes
t Val
ue19
4.60
2.12
1.07
5512
6.42
1.00
0.07
298
2.00
2.51
1.08
30
Pr.o
babi
lity
nsns
ns
Acc
eler
ated
83.
251.
759
6.11
1.36
73.
292.
29'T
radi
tiona
l9
3.78
Lh
156.
531.
368
2.50
2.43
t-T
est V
alue
0.56
430.
7055
0.78
68Pr
obab
ilit y
.ns
nsns
Acc
eler
ated
.20
3.30
1..6
321
.6.9
51.
4718
3.61
2.62
IVT
radi
tiona
lt-
Tes
t Val
ue29
4..1
41.
901,
6527
286.
501,
601.
02.8
326
2.23
2.67
1.70
58
Prob
abili
ty.n
s.71
5I1
S
Acc
eler
ated
3733
81.
5541
6.63
1.43
333,
422.
22
II-I
V",
:adi
tiona
l47
4.17
1.92
556.
.49
1.40
422.
102.
54
Com
bine
dt-
Tes
t Val
ue2.
0946
0.49
042.
2404
Prob
abili
ty<
.105
.ns
< .0
5

TA
BLE
4-7
5P
ract
ice
Ski
ll ,A
sses
smen
t Ins
trum
ent-
Inte
rpre
ts th
eB
ehav
ior
and
Fee
lings
ot t
he C
lient
and
Oth
ers
with
Who
m th
eC
lient
Com
es In
to C
onta
ct in
Way
s T
hat A
re M
eani
ngfu
l to
the
Clie
nt (
Item
48)
o-i
00 - --:1 u,
Cyc
leS
rerU
sS
tart
of
Soc
ial W
or*
Edu
ca ti
on
Sta
nda
ftM
ean
Dev
iiabo
n
C r
rIpv
ion
S()
CA
I IN
GO
:E
thi1
Cano
n
Sta
ndar
dM
ean
De
rfrq
d r
on
it- T
est V
dlue
Bas
ed o
nfte
renc
e on
Lea
rnIn
g
Sta
ndar
oM
ean
De
wa
toor
11 II 1 iv
1.1-
IV
Com
bine
d
Acc
eler
ated
Tra
ditio
nal
t-T
est V
aiue
Prob
abili
ty
Acc
eler
ated
Tra
ditio
nal.
t-T
est V
alue
Prob
abili
ty
Acc
eler
ated
Tra
ditio
nal
t-T
est V
alue
Prob
abili
ty
:44-
,:ele
rate
dT
radi
tiona
lt-
Tes
t Val
uePr
obab
ility
911
9 10 21 30 39 51
4.44
1 .4
2
4.09
'2.
120.
4057
ns
3.67
2.18
4.00
1.33
.
-0.3
84f
ns
4.14
21 5
4.70
1.82
0.96
83ns
4.10
1.98
4.43
1.80
-0.8
103
ns
1I
12 9
15.
21 28 41 55
6.73
1.27
6:33
,94.
0.21
87ns
6.67
1.58
6.86
1.60
-0.2
854
ns
7...2
91.
316.
711.
701.
3306
ns
7.00
1.36
6.78
1.51
.
0.74
11ns
8 9 8 9 19 27 .35
45
2.50
1.20
3.33
2.60
0..7
818
ns
3,00
2.3
9
2.89
1.97
0,09
87ns
3.05
2.72
1.89
2.67
1.44
15.
ns
11.9
12.
332.
392.
550.
9796
ns

TA
BLE
4-7
6.
- A
sses
smen
t ins
trum
ent-
Use
sth
e T
reat
men
t Rel
atio
nshi
pin
Ord
er T
o 4
..rr:
Aat
her
Tha
n Im
pede
the
Ach
ieve
men
t of T
reat
men
t Goa
ls O
tern
49)
Cyc
leS
tude
nts
Soc
ial
Sta
rt o
fW
ork
Ed,
c.to
'on
Soc
aJ"W
ork
N
Com
phet
ion
ofE
duca
tion
t-T
est
Dof
fere
nce
N
Vat
ue P
i,sed
. on
in L
eerm
ng&
,nda
rdM
edo
Dev
iaeo
nS
tand
ard
Mea
n00
vlat
ion
Sta
ndar
dM
ean
Dov
iar
On
iii III
IV 1I-I
VC
ombi
ned
Acc
eler
ated
Tra
ditio
nal
t-T
est V
alue
Prob
abili
ty
Acc
eler
ated
Tra
ditio
nal
t-T
cst V
aitte
Prob
abili
ty
Acc
eler
ated
TrP
ditio
nal
t-T
est V
alue
Prob
abili
ty
Acc
eler
ated
Tra
ditio
nal
t-T
est V
a1ue
Prob
abili
ty
9
12'. 9 10 21 29 39 51
4.22
1.79
4.08
2.15
0.14
95ns
4.22
1.79
.4.
202.
04.
0,02
37ns
4.43
2...2
0
510
1.61
- 1.
1915
ns
4..3
31.
984.
691.
86.
- 0.
8607
ns
I 1
6.91
1.30
1:2
7.42
.79
-1.0
898
ns
97,
001.
12I
S7.
271.
87-0
.371
7ns
21:'.
':'.:'
1,08
21i.
7.36
1.91
0.49
'8R
S
417.
271.
1655
7.35
1.69
- 0.
2647
ns
8 10 8 9
I 9
2.,;, 15 45
2.62
1.77
3.40
2..4
6
-070
70ns
2.87
1.96
3.1
I2.
37-0
.208
8ns
3.26
2.66
2.19
2.43
1.38
12ns
3.03
2.29
2,64
2.43
0.72
35ns

CC
+
TA
BLE
4-7
7P
ract
ice
Ski
ll A
sses
smen
t ins
trum
ent-
Ade
quat
ely
Rec
ogni
zes
the
Poi
nts
of S
trai
n or
Har
mon
y in
the
Ong
oing
Wor
ker-
Cke
iliR
elat
ions
hip,
and
Rel
ates
The
se tc
His
Ow
n F
eelin
gs a
nd T
hose
of t
he C
liefit
Ul.,
v-r4
50)
Cyc
leS
tude
nts
Sta
rt o
fS
ocia
l Wor
k E
duca
tkan
SlIa
ndar
dM
ean
Dev
iatta
n
Com
pA'e
rfan
at
Soc
ilat W
ork
Edu
catio
n
Sta
ndar
dN
Mea
nD
ev.o
.kth
on
r- T
est V
akl'e
Bas
edon
CL
edrn
gS
tand
e;d
NM
ean
advt
abor
Acc
eler
ated
Tra
ditio
nal
t-T
est V
alue
Prob
abili
ty
9 11
3.89
1.83
4.45
2.70
0.50
85ns
11 126.
451.
576.
921.
000.
8112
ns
3.1
22.
172.
443.
320.
4637
ns
Acc
eler
ated
93.
671.
949
6.67
1.50
83.
002.
20T
radi
Onn
oi10
4.70
1.83
156.
731.
919
7.11
2.57
t-T
f-st
-1.1
312
0.08
570.
7144
nsns
ns
Acc
eler
cd21
3.86
2.08
217.
101.
3719
3.37
2.50
1VT
radi
tiona
lt-
Tes
t Val
ue74
94.
692.
121.
3845
287.
251:
99-0
.321
426
2.54
3.10
0.99
29Pr
obab
ility
nsflS
ns
'Acc
eler
ated
393.
821.
9441
6.83
1,45
353.
232.
30H
AN
Tra
ditio
nal
504.
642.
1655
7,04
1.78
4424
32.
98C
ombi
ned
t-T
est V
alue
-1. .
8767
0.62
731.
3396
Prob
abili
tyO
sns
ns
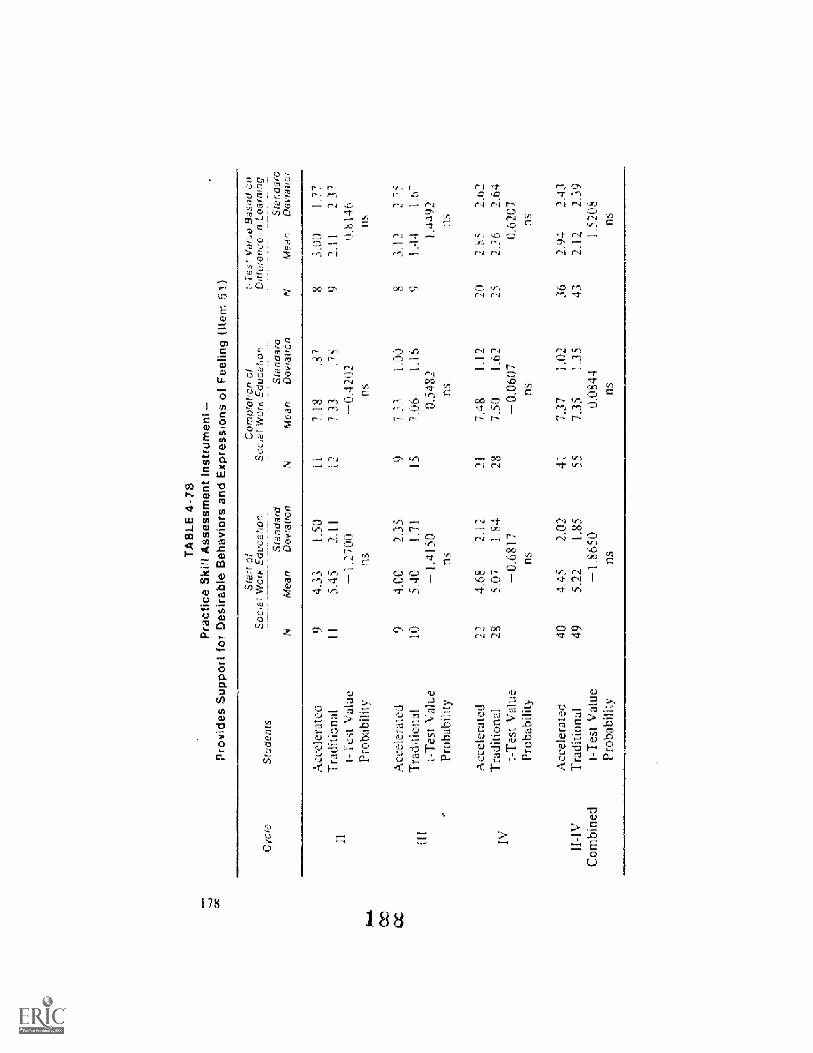
TA
BLE
4-7
8P
ract
ice
Ski
ll A
sses
smen
t Ins
trum
ent -
--A
Pro
vide
s S
uppo
rt fo
r 'D
esira
ble
Beh
avio
rs a
nd E
xpre
ssio
ns o
i Fee
ling
(item
51)
11 .-
+
CC
CC
Cyc
teS
tude
nts
Soc
at,S
rari
otW
ork
Edu
catr
onC
orno
totr
onor
soc.
o& W
ork
Edu
cato
on
Sta
ndar
dN
Moa
nD
evta
tron
Tes
t Vat
ue B
ased
on
Dot
to;r
ence
m L
earr
ong
Sta
ndar
cN
Mea
n'D
oato
onS
tand
ard
Mea
nD
evaa
on
11 111
IV
Com
bine
d
Acc
eler
ated
Tra
ditio
nal
I-.r
.est
Val
uePr
obab
ility
Acc
eler
ated
Tra
ditio
nal.
t-T
est V
alue
Prob
abili
ty
Acc
eler
ated
Tra
ditio
nal
i-T
est V
alue
Prob
abili
ty
Acc
eler
ated
Tra
ditio
nal
t-T
est V
alue
Prob
abili
ty
9 11 9 10 72 28 40 49
4.33
1,50
5.45
2.11
-1.2
700
ns
4.00
2.35
5.40
1.71
.
- / .
4150
ns
4.68
2.12
5.07
1.84
.-1
0.68
17ns
4.4.
52.
02.
5.22
1..8
5
-1.8
6.50
ns
11 12 9 15 2.1 28 .41
.55
7.11
8.8
77.
33.7
8-0
.420
2ns
7.33
1.00
7.06
1.16
0.54
82ns
7.48
1.12
7.50
L.6
2-
0.06
07/is
7.37
1 .0
2
7,35
1.35
0.08
44.
ns
8 9 8 9 20 25 36 43
3.00
1.77
.
2,11
2.37
0.81
46ns
3.11
22.
751.
44.1
.6-
1.44
92ns
2.85
2.62
2.36
2.64
0.62
07ns
2.94
2.43
2.12
2.39
1.52
08.
ns

TA
BLE
4-7
9P
ract
ice
Ski
ll A
sses
smen
t ins
trum
ent-
.R
efra
ins
from
Enc
oura
ging
Beh
avio
rs T
hat A
re J
udge
d(R
em :5
21
Cyc
,re
Sw
denr
s
Sta
rr. Q
..'S
ocia
t Wor
k E
duca
tl:on
Sta
ndar
dM
ean
Dev
,iaril
onN
Coy
-np,
ter:
Y`t
o,rh
Mea
nD
a
V)'U
,E3
iLsa
d on
aitte
renc
eLe
arrH
ng
Sta
ndar
dM
ean
Dev
iallo
:-,
ii 111
IV 11-I
VC
ombi
ned
Acc
eler
ated
.T
radi
tiona
lt-
Tes
t Val
uePr
obab
ility
Acc
eler
ated
Tra
ditio
nal
t-T
est V
eue
Prob
abili
ty.
,zst
Val
we
jbab
ility
A.f
.:cel
erat
edT
rod:
Mon
o! Val
ueP
otab
ility
9 11 9 10 71 28 39 49
4...6
71.
805.
272.
,7.0
-0..6
308
3.67
2.01
6
5.40
1.84
- 1.
8327
ns
4.67
2.24
5.39
2.23
- 1.1
234
ns
4.44
2.10
5.37
2.11
-2.0
632
<..0
5
11 12
9 15 21 28 4
7:00
1.10
6;92
.90
0.19
11n.
S
7.33
1.12
8.00
1 .0
6-
.447
5
7.47
1.17
7.36
1.66
0 29
90ns
'1.
11
1..4
0
8 9 8 9 19 25 35 4.3
2.50
1.69
2.11
2.71
0.32
84n.
s
3.75
2.60
2.11
1.54
1.50
30ns
7 89
2.58
1:88
2.49
1.31
22ns
3.00
2.39
1 98
2.32
1.90
44ns

TA
BLE
4-6
0P
ract
ice
Ski
ll A
sses
smen
t Ins
trum
ent-
Act
ivel
y 01
!7co
urag
es B
ehav
ior
Whi
chH
as im
med
iate
and
Pre
sent
Dan
ger
for
Eith
er th
e C
lient
or O
ther
t Ilte
rl 53
)
Cyc
leS
tude
nts
Sta
n or
Soc
ial W
ork
Edu
cat;r
an
Sta
iicla
rdW
arr
Dev
ialia
n
Cot
roJe
tion
ofS
ocia
l Wor
k E
duca
tion
e-T
ost V
alue
Ba
Sod
on
Ditt
eran
ce n
Lee
rnfin
g
Sta
ndar
CN
Mea
nD
owel
lion
Sta
nd&
Mea
nD
ev1o
':
Acc
eler
ated
94.
112.
0311
7.00
83.
007,
:,.07
IiT
rae:
1tio
nal
114.
822.
4412
7.00
1..4
1-,
92.
222,
77t-
T;,-
-a V
alue
-0.6
589
0.00
000.
6093
Prob
abili
tyns
ns11
15
Acc
eler
ated
94.
112.
379
7.00
,71
Fi2.
757.
..12
HI
Tra
ditio
nal
95.
331.
8715
8.07
.88
82.
121.
'96
t-T
est V
alue
-1.1
453
-2.9
468
0.57
26Pr
obab
ility
ns<
.05
ns
Acc
eler
ated
205.
252.
2221
7.67
1.11
182.
392.
64
IVT
radi
tiona
l24
5.54
1.93
287.
321.
5223
1.65
2.10
t-T
est V
alue
:-0
.459
80.
9198
0.96
85Pr
obab
ility
nsns
ns.
Acc
eler
ated
384.
712.
2341
7.34
1.20
342.
6'.,:
.2.
35II
-IV
Tra
ditio
nal
445.
322.
0355
7.45
1.40
401.
882.
20C
ombi
ned.
t-T
est V
alue
-1.2
823
-0.4
260
1.39
60Pr
obab
ility
nsns
ns

GO
TA
BLE
4-8
1P
ract
ice
Ski
n A
sses
smen
t Ins
trum
ent-
Ant
icip
ates
Diff
icul
ties
in th
eC
lient
's E
nviro
nmen
tal S
ituat
ions
and
Pre
pare
s th
e C
lient
for
The
m °
tem
541
Cyc
leS
tude
nts;
Soc
,ial
Sta
rt o
fW
ork
Edu
cano
nC
ompt
e he
n of
Soe
xaf W
ork
Edu
cairo
n
Sta
ndar
d'N
Moa
nO
evta
tfon
Tes
t Val
ue E
ased
on
Dol
le,r
ence
in L
earn
ing
Sta
ndar
dM
ean
De
'Ind
foon
Sta
ndar
dM
ean
Dev
iatio
n
11 Iii
IV
Com
bine
d
Acc
e1er
ated
Tra
ditio
na1
i-T
est V
alue
Prob
abili
ty
Acc
eler
ated
Tra
di.0
onal
.t-
Tes
t Val
uePr
obab
ility
Acc
eler
ated
.T
radi
tiona
lt-
Tes
t Val
uePr
obab
ility
-
Acc
eler
ated
Tra
ditio
vitti
t-T
est V
alue
Prob
;117
,dity
9 10 9 10 21 27 39 47
4.00
1.66
4.80
2.20
0.83
91ns
3.78
1.99
4.80
1.75
-1.1
277
4.24
1.70
4.59
2.17
0.63
45ns
4.08
1.72
.
4.68
2.05
.-1
..482
6ns
ii 12
9
15 21 28 41 55
6.82
.87
6.75
1.96
0.10
14
6.55
1.51
6..7
31.
47-0
.270
0ns
7.29
1.23
6.93
1 A
6.
0.92
63ns
7.00
1.22
6.84
1.56
0.57
54
8 8 8 9
19 25 35 42
2.75
.49
1.88
3.27
0.64
43ns
2.75
2,38
1.67
7.18
0.92
10ns
3.05
2.46
7..1
22.
761.
1816
ns
2.91
2.2.
01.
982.
691.
6824
ns

TA
BLE
4-8
2P
ract
ice
Ski
ll A
sses
smen
t Ins
trum
ent-
Mod
ifies
Inte
ract
iona
lan
d S
truc
tura
l Pat
tern
s in
Rel
evan
t Gro
ups
to W
hich
the
Clie
ntB
elon
gs
CS
e
S..a
rr o
fso
c,.,3
4 W
orA
Edu
ca S
oon
Sra
ncia
ld.1
4ean
D e
v,La
,Nan
rchr
noce
loon
191
S,:,
C-
a'0IN
or*
, Edu
car,
on
Sla
nday
aM
ean
Die
vi.a
l'o r
V.1
ehi
S
Acc
e!er
ated
11(y
.73
Tr
adlip
anal
--
126.
501.
5-
t-T
est V
alue
_,0.
3811
Pi (
!!bab
ility
1,17
,
.Acc
eter
ated
81.
501.
459
5.89
1.83
_1.
432.
23;
111
Tra
ditio
nal
t-T
est V
aine
94.
111.
27
.-0.
.614
,11
146.
911.
14.
-1.0
016
81
62.3
0
-0,1
9-0
Pro
babi
lity
nIS
ll:i
TIS
Acc
eler
ated
173.
.76
1 68
216.
621.
0715
7 73
2 31
iV
Tra
ditio
nal!
t-T
est V
a1ue
154.
602.
04.
-1..4
490
2667
31.
31
-9.7
212
212
052
48ill
i..85
1!8
Pro
bab1
1n,:,
as4`
1:7,
'.7
ns
Acc
eler
ated
291.
831.
8141
6,49
1 29
2.33
.7.
.08
11-I
Vr
a di
tion
ai
454.
511.
8752
6.73
1.32
382.
1
Com
bine
dt-
Tes
t Val
ue-1
.564
5-0
..895
20.
.807
2
Pro
babi
lity.
nsnS
11,s

TA
BLE
4-8
3P
ract
ice
Ski
ll A
sses
smen
t Ins
trum
ent-
Use
s E
xist
ing
Inte
ract
iona
l and
Str
uctu
ral P
atte
rns
To
Fac
ilita
te th
e A
chie
vem
ent o
t Tre
atm
ent
Goa
ls O
tem
56)
Cyc
leS
tude
nts
Sta
rt a
tS
ocia
t Wor
k E
duca
tion
Soc
ial
N
Com
plet
ion
ofW
ork
EdO
catio
nt-
Tes
tD
iffer
ence
N
Val
ue B
ased
on
in L
earn
ing
Sta
ndar
dM
eari
Dev
iatio
nS
tand
ard
Mea
nD
evia
tion
Sta
ndar
dM
ean
Dev
iatio
n
Acc
eler
ated
Tra
ditio
nal.
-Tes
t Val
uePr
obab
ility
9 15
6.73
1.42
6.67
.98
0.11
44ns
Acc
eler
ated
83.
502.
569
6.44
1.67
72.
712.
87T
radi
tiona
110
4.60
1.84
156:
801.
379
1.78
1.99
t-T
est V
alue
.'-0.
.998
2-0
.541
80.
7204
Prob
abili
tyns
nsns
Acc
eler
ated
.70
3_80
179
217.
241.
34.
183.
782.
59IV
Tra
ditio
nal
t-T
est V
alue
294.
621.
88-1
.543
428
6.93
1.36
0.79
6026
2.63
239
1.31
14.
Prob
abili
tyns
nsns
Acc
eler
ated
323.
881.
9139
6.93
1,44
293,
002.
4511
-1V
Tra
ditio
nal
504.
701.
8248
6.84
1.27
442,
072.
20C
ombi
ned
t-T
est V
alue
-1.9
405
0.32
001.
6544
Prob
abili
tyos
nsns

TA
BLE
- 4,
84P
ract
ice
Ski
ll A
sses
smen
t Ins
trum
ent-
Effe
cta
App
ropr
iate
Cha
nges
in th
R In
divi
duar
s R
elat
ions
hips
to H
is E
xter
nal E
nviro
nmen
t {ite
m 5
71
Cyc
leS
tude
nls
Sta
rt o
fS
ocia
l Wor
k E
duca
tion
Soc
ial
N
Com
plet
ion
ofW
ork
Edu
ceho
nI-
Tes
t Val
ue B
ased
on
Diff
eren
ce in
Lea
rnin
g
Sta
ndar
dM
ean
Dev
iatio
nS
tand
ard
Mea
nD
evia
tion
Sta
ndar
dM
ean
Dev
iatio
n
Acc
eler
ated
84.
121.
3511
7.00
1.00
73.
141.
07
Tra
ditio
nal
114.
821.
66.
126.
67.9
89
2.00
1.87
I-T
est V
alue
-0.9
158
0.16
911.
3501
Prob
abili
tyns
nsns
Acc
eler
ated
83.
502.
459
6.67
.71
73.
142.
73
Tra
ditio
nal
104.
601.
1713
7.23
1.01
72.
001.
00
t-T
est V
alue
.L1
802
1.37
760.
9615
Prob
atili
tyns
nsns
Acc
eler
ated
174.
591.
8021
7.19
1.33
152.
472.
42
11/
Tra
ditio
nal
t-T
est V
alue
274.
632.
02-0
.070
728
7.11
1.20
0.22
6825
2.24
2.55
0.28
11
Prob
abili
tyns
nsns
Acc
eler
ated
.1.3
4.21
Lsa
417.
02L1
329
2.79
2.21
VI-
1VT
radi
tiona
l48
4.67
1.77
537.
04.
1 .1
141
2.15
-2,
19
Com
bine
dt-
Tes
t Val
ue1.
0944
.-0
.057
31.
2116
Pro
babi
lity
nsns
rits

b _ ography

Bibliographyi3krnm . Martin. -Evaluation of Social Work Education Outcomes: A
Survey of Pre-Behavioral, Behavioral, and Post-Behavioral SolutionPaper delivered at the School of Social Work, Cniversity of Wiscon-sin-Madison, June 1973.
Bloom, S:unuel. ''In Evaluation of Undergraduate Psychiatric Teaching,In Cowerence Proceedings. W D.C.: :Association of SouthernProfessors of Psychiatry, 1958.,
Uisno. tlerhert. /he Piace of ihe UufrrgrnldIaie Currawlwn Socia/ lI!orkEdoc000n. Currk:ufuin Study, Vol II. New York! (ounci'l on SodalWork Edrimit ion , 1959'.
Camohelt Don.ald T. "Rel orrus As Expe Then PI Pcychologicir
24 969): 409-29.Carter, Reginald K. "Cheats' Resistance to Negative Findings and the La-
tent Conservative Function of Evaluation Studies." The AmericanSociologist 6 (1971): 118-24.
Eysenck, Hans. The Oleos Psycifiotherapy. New York: Iii rn tiionalScience Press, 1966.
Fisher,, Joel. "Is Casework EATectiv A Review.- Social Work S (1973):5-20.
Fox. 1David J. "Issucs in Evaluating Programs far DisadvantagedChildren:" The Urhani i?eview 2 1967): 6-8,
Goldstein, Harris K. Aravintizing Research Learning ,fiir Thrm Types ofSocial Work Students, Tallahassee, Fla.: Florida State University, 1972.
Guae m the Use cilthe GRE Scores in Graduaw Athnissioms 1971-72'. Prunce-ton, N.J.: Educational Testing Service, 1971.
Hollis, Florence. "The Implications of the Curriculum Study cor SocialWork:' Journal ofkit'ish Contnnwal Service 37 '(1960): 135-42.
Horrocks,,I. E. Horrocks, W. B.;; and Troyer, NI. E. A Study of Barry BlackColumbus, Ohio: Chortles E. Merrill., 1960,
Hyman, Herbert II.; Wright, Chairles R..,,and Hopkins, Terence.hop of Afethods of Evaluation: rola Studfcs of the Encainpmentlbr Chizen,-s1up. Berkeley: University of California Press, 1962.
Kadushin, Alfred. "A, Proposal for an Accelerated Program in Social
96

; k llfucaaUIl RI .go tor Ha I 'ilk 'I
b.,6111tiil 'It21.11001 SO urk, fiLL1 esting the 1)isennunaton apabilities ot a Series 01 kHdua
non NIc,isures As Applied to a Program of Social Work Educatim
minicogroned, NLidison, Unicrsoy (it' Wisconsin School 01Sociai Work, Ions:,
kadushin. .Altred. and Ketting. :tinal Report: An InnovativeProgram Sleidl Work Education, the 3-2 Program,- mimeographed.Madison, Wis,: niversit, of Wisconsin Scho(l of Social Work, 1973,
\1.per. John F. . and Rosenblrit, Aaron. "Encounters with 1)angefr: SocialoTkers in the Ghetto:- ,SH(101H0 (1/ U orA am/ (kruIvtions 2 (August
1 975) 227 -45.\le\ er, Ilenry J., and McLe )onna I,. "A Study of the Values of Social
Workers,- In Elchm /oral ,hcc, ,SOCia OrlCTS. ad, Edwin Fhomas,
No+, York Free Press, 1967.Edward J , and Chatin, Robot: perimental Inter.univer-
sio. 4-1 Continuum: An Interim Report Paper presented at the 20Ith
.Annual Program \-feenng (it' the Council on Social Work Education,:
Mania, Georgia, March 1974,Navarre, kli/aheib, and Sarri, Rosemary C. 'Repo , on the Preliminary
Analysis of Criteria for Assessing Student Progress in Group WorkEield Instruction,- mimeographed. Ann Arbor, Mich,: University ofMichigan School of Social Work, 19%67,
Rosenhlatt , Aaron. "A Comparison of Faculty Ratings of Studenttssars. mitneographed. Ciarden City, N. Y.: Adelphi University
School of Social Work. 196.g._. "Practitioner's Ilse and L' iii it con of Research." Social Work
13 119681: 53-59."Social Conis rui nts Affecting the Interpretation of Findings in
Lvaluative Studies."' An ea I et version of this paper was delivered at a
conterence on evaluative ,-esearc11 at the University of Wiscon-sin-Madison School of-Social Work; lune 11-13, 1973.
Rosenhfaft Aaron, and Mayer, John E. "Objectionable Supervisory
Styles: The Students' View.- Social( Work- 20 (1:975): 184-89..
Sarri. Rosemary C., and \linter, Robert. Practice ,:tY.wssment h
Ann Arbor, Mich.: Campus Publishers, 1967,
S(Nesinger, and Wolock, Isabel. "An Accelerate( and Tradi-
tional MSW Program Compared,- jounwl ut Eaucahm ,ciocial Work
10 (Winter 197411; 68-76,Seff-Sturiv,Thr AciTeditwron Rcrueic. Vol. 1. Garden City, N. Y.: Adelnhi
tkiiversity School of Social Work, 1965.Smalley, Ruth . "Rewtion to the \Curriculum Study.- Social Work 4
(1959): 105-107.Towle, Charlotte. -( )1-Yi ive:i for the Social Work Curriculum for the
188

Ho)! -P)2 8-r; N. k /..e/ouLc Hun\c//r,,%, (Ind 19s1-
reLigo. AMine. 1967,Fmle. 1<teHrLI Rp/o% /f)r in6H.L.'0,/.. SoThc
h1_,%or:_zi?!/o.o: Keni St;iie Press, N7.4_l I acid -F6/.0, Rowi/Lii 1,1 So( /(41 11 wk. ticv,1(0 olumb,ki ersnt pres, 1974
"Soual Wolk Valuo,:Crrdirwes VLIk.IL:tornilliiments'`Inkk'n1` h AdrIllYth)11 H.) N 1SM, (irdat.airon.-do:nm,i/ot
stH orA 4 1968): 1,7-76."1 he NlitincyAd Imenior sof Nitowledge:-
numeo.i.wbed Sehotti Soeuii ort, University tutne,t,zi.i.
;.ind kassehauin. (iene "On Bitimt the Mind, nutcod, cd, C:trol Weiss. Rston: Allyn
ctld R.i.eturi, |w72
ewhergoi 1:,riderilralwtf.e (-ontinuum Proteci: Final Re-Pori, inioetm214`hed: Ssin Diego: School of Work San Diego'State t`no.erstly, 1472.
Thc Volitici/mort usl Resedreb.: Journal ofRurN 470): -uS.
Wilcio,,:howskt'Stiph.te, "1 he Lorninuom in Social Work Fduc:ition.-TW,or prosL:nioi Lathe 19th Annwl ProLtrant Ntee)ting. ol tho Council on
\Vork 5;tri rutioso), February 197i
198 189