ed 074 734 duran, edwin p. a 'feasibility study
TRANSCRIPT

DOCUMENT RESUME
ED 074 734 EM 010 919
AUTHOR Duran, Edwin P.TITLE A 'Feasibility Study: Remediation By Computer Within A
Computer-Managed Instruction Course In Junior HighSchool Mathematics.
INSTITUTION Florida State Univ., Tallahassee. Computer-AssistedInstruction Center.
REPORT NO FSU-CAI-TR-25PUB DATE 1 Aug 72NCTE 79p.
EDRS PRICEDESCRIPTORS
ABSTRACT
MF-$0.65 HC-$3.29Ability Grouping; Comparative Analysis; *ComputerAssisted Instruction; Conventional Instruction; *CostEffectiveness; Feasibility Studies; Grade 7;*Individualized Instruction; Junior High SchoolStudents; Programed Instruction; *Programed Tutoring;Remedial Mathematics
Approximately 70 seventh grade mathematics studentsworked individually in self-instructional booklets for a period of 15weeks. Upon completion of each booklet, the student was evaluated bydirect contact with a computer through teletype terminals. Ifcriterion was not attained, half the students received firstremediation through the computer and half from the teacher. Furtherremediation, if necessary, was from the teacher for both groups. Thetwo methods of remediation were equivalent overall, but there wassome indication that low ability students found teacher rcmediationmore supportive. Analysis of economic factors in relation toperformance measures indicate computer remediation of studentperformance is not economical at present. However, opposing costtrends for computer hardware and personnel indicate computerremediation could be feasible within a decade. (Author/RH)

At
FILMED FROM BEST AVAILABLE COPY
A FEASIBILITY STUDY: REMEDIATION BY COMPUTER
WITHIN A COMPUTER-MANAGED INSTRUCTION COURSE
IN JUNIOR HIGH SCHOOL MATHEMATICS
U S DEPARTMENT or HEALTH,EDUCA HON 8, WELFAREOFFICE OF EDUCATION
THIS DOCUMENT HAS t3EL N lit PROoucru EXACTtr AS PECTIV1.1) ! ROMTHE PERSON OR ORGANIIAMON OM!,INA TINT; IT POINTS 0! VIt OR ()PINIONS STATED DO NO NT TAS'AARITREPRESENT OTT R;JAL ET! E ICE Of FOUCATION POSITION OR PO; ICY
omputer,:AsaistedLns.tractionFlorida State University
Tallahassee, Florida 32306

FILMED FROM BEST AVAILABLE COPY
TECH REPORT SERIES
The FSU CAI Tech Report Series is intended to communicate theresearch findings from studies and sponsored projects that have directimplication for the role of computers in education and training. -The_rationale for the tech report series is fourfold. First, the techreports provide a convenient document format for reporting the resultsof all phases of large CAI projects. These projects typically spantoo many areas to be reduced into the more conventional researcharticle format. Second, major computer systems designs will be pre-sented in their entirety within the tech report series. Third, thisseries will Provide colleagues at the FSU CAI Center an opportunity todevelop major conceptual papers relating to all phases of computers andinstruction. And fourth, all the dissertations performed at the CAICenter will be published within this series.
In terms of content, one can anticipate' a detailed discussionof the rationale of the research project, its design, a ccaplete reportof all empirical results as well as appendices that describe in detailthe CAI learning materials utilized. It is hoped that by providing this
voluminous information other investigators in the CAI field will havean opportunity to carefully consider the outcomes as well as havesufficient information for research replication if desired. Any commentsto the authors can be forwarded via the Florida State University CAICenter.
Duncan N. HansenDirector
Computer Assisted Instruction Center

I
A FEASIBILITY STUDY: REMEDIATION BY COMPUTER
WITHIN A COMPUTER-MANAGED INSTRUCTION COURSE
IN JUNIOR HIGH SCHOOL MATHEMATICS
Edwin P. Durall
Tech Report No. 25August 1, 1972
Computer-Assisted_InstrUction.Florida State University.
Tallahassee, Florida. 32306

A FEASIBILITY STUDY: REMEDIATION BY COMPUTERWITHIN .A ,COMPUTER-MANAGED INSTRUCTION COURSE
IN JUNIOR HIGH SCHOOL MATHEMATICS
Edwin P. Durall
ABSTRACT
Within a terminal-oriented CMI system, this study investi-
gated the feasibility of presenting remedial instruction to students
by computer as compared to remedial instruction presented by a
teacher.
Approximately 70 seventh grade mathematics students worked
individually in self-instructional booklets for a period of 15 weeks.
Upon completion of each booklet, the student was evaluated by direct
contact with a computer through teletype terminals. Half of the
students, if the criterion of 80% was not attained, received remedia-
tion from an instructional sequence programmed into the computer.
The other half of the students received remediation from their teacher.
The remediation for both:groups consisted Of the student working
through a sample test.question while recieving feedback at each
step in the solution. The student was then required to work a second
sample problem without assistance. When the student had, successfully
Solved the second sample problem, the test was readministered. If
the test was failed a second time, the teacher worked with the student
until criterion could be attained.
ii

The computer-remediated (CR) students demonstrated equivalent
academic performance, rate of movement, and attitudinal measurements
as compared to the teacher-remediated (TR) students, These results
are particularly encouraging,for high ability. students. Analysis
of the performance data according to ability level, however,
discovered significant differences among the lower ability students
favoring the TR group, The computer. remediation was not detrimental,
but apparently the teacher remediation was more supportive for lower
ability students. Within ability levels, there was no significant
difference between CR. and TR groups as to the rate of movement throuch
the instructional materials.
Highly positive attitudes toward mathematics in general, CMI,
and individualized instruction, were exhibited by students in both
remediation groups at the end of the study. Due to very high initial
attitude measurements, no significant pre-post gains were demonstrated. .
During the study, the attitudes of the CR students toward.CMI tended
to become more positive while the comparable attitude of the TR group
tended to become less positive.
The teacher in the program, freed from clerical burdens,
was able to concentrate on the higher level professional tasks involved
in interacting individually with studehts as they worked in the book-.
lets and as they required remediation following a test. A closer,
more personal relationship was developed between.the students and
teacher in the individualized setting compared to the traditional'
lecture and demonstration. classes which existed prior to the study.

Analysis of economic factors in relation to performance
measures indicate computer remediation of student performing below
grade level is not feasible at present. Rising personnel costs and
lowering computing hardware costs, in concert with the equivalent
performance between high ability groups, indicate computer remediation
for high ability students could be feasible within a decade.
It is interesting that no significant difference existed
between remediation modes in the amount of time spent in contact with
the computer. However, the lower ability students spent a signifi-
cantly greater (p<.01) amount of time on line than did the high
ability students. These findings would indicate that when considering
the economics of implementating a terminal-oriented CMI system, ability
level of the students appears to be a more important factor than mode
of remediation.

I
TABLE OF CONTENTS
Page
Abstract Iii
Acknowledgements Vii
List of Tables viii
List of Figures ..._.ix
Chapter
I. BASIS FOR THE STUDY 1
Introduction 1
Statement of the Problem 4
Description of the Study 4
II. REVIEW OF LITERATURE 7
ComOter-Assisted Instruction 7
Drill and Practice . . . . . . . 8
Tutorial 9
Evaluation 10
Computer-Managed Instruction 11
Project PLAN N, 12
SDC/SWRL 13
IPI /MIS 14
Terminal-Oriented CMI 1.6
Summary 17
III. METHODOLOGY 18
CMI Model 18
Learning Materials 18
Remediation. 21
Instruments 22
Subjects 26
Apparatus 28
Experimental Design 29
Procedural Schedule 29
IV. ANALYSIS OF RESULTS 33
Question 1: Student Performance 33
Unit Tests 34
Review Tests 36
Posttest 38
Retention Test 39
CTBS 41
v

Page
Question 2: Movement Through the InstructionalMaterials 43
Number of Units Completed 43
Rate of Movement 44
Question 3: Student Attitudes 46
General Mathematics Attitudes 47
CMI/Individualized Instruction Attitudes 47
Question 4: Impact on the Teacher 49
In-Class Activities 49Out-of-Class Activities 50
Question 5: Economic Factors 51
Program Costs 51
Computer Time 52
V. DISCUSSION AND CONCLUSIONS
REFERENCES
APPENDICES
53
Effect on the Students 53
Effect on the Teacher 57
Economlc Factors 59
Conclusions 64
Appendix A:Appendix B:Appendix C:Appendix D:Appendix E:Appendix F:Appendix G:
Appendix H:
66
69
List of TopiCs 71
Sample Booklet and Evaluation 75
Feedback Table 84
Sample Remediation 86
Retention Test 89
General Mathematics Attitude Questionnaire . . 97
NI/Individualized Instruction AttitudeQuestionnaire 100
Description of Community 106
VITA 108
vi

ACKNOWLEDGEMENTS
I wish to express the deepest appreciation to:
my major professor, Dr. Duncan Hansen, and the members of the
doctoral committee, Drs. Jacob Beard, Bobby Brown, and David
Redfield, for their patience, wisdom, and leadership;
Mrs. Barbara Johnson, whose assistance and encouragement
were invaluable;
Mrs. Betty Wright and Mrs. Edna F3eynolds, whose CAI
coding skills avoided many a pitfall;
Mr. Randy Anderson, who was innovative enough to agree
to the study, and brave enough to stay with it;
Mrs. Verlie Byrd, who assembled the instructional booklets;
Mrs. Winona High and Mr. George Green, who kept the
terminal room operating smoothly;
My wife and children,who perhaps bore the heaviest burden
of all: me. They demonstrated exceptional patience and under-
standing, for which I am most grateful.
vii

LIST OF TABLES
Page
1. Number and percentage of students who passed and failed
unit tests. Criterion = 80% 35
2. Group mean scores on review tests 37
3. Percentages of students who attained criterion of 80% on
review tests g 38
4. Group mean scores on posttest 39
5. Group mean scores on retention test 40
6. .CTBS mean mathematics grade equivalents for each group . 41
7. ANCOVA summary table for CR and TR grodps . 0, 42
8. ANCOVA summary table for all four groups 42
9. Mean number of units completed by each group 44
10. Cost data 51
11. Average amount of time (in minutes) spent on line during
the 15 weeks 52

LIST OF FIGURES
Pege
1. Steps in instructional system 19
2. Pr-ocedural schedule 30
3. Mean number of units completed per week du0ng each
three week period .45
ix

I. BASIS FC UL
Introduction
For centuries, teachers have been attempting to devise better
methods of helping students learn in accordance with their abilities.
But, apparently due to the complexities involved, the full potential
of individualized instruction has not been realized.
Two recent developments, the formulation of a systematic
approach to the generation of instructional materials and the
proliferation of computers, have given educators the means not
only to devise models for individualized instruction but also
to realize progress in the quest for a better instructional system. .
The systems approach provides a more efficient means of generating
instructional materials and of organizing learning environments.
However, it was not until the computer gained widespread educational
Usage in the processes known as computer-assisted instruction
(CAI) and computer-managed instruction ,(CMI), that the individualization
of instruction began to make substantial progress.
CAI is a process whereby the student receives instruction
directly from a computer through some type of terminal which
serves as the student/computer interface. Typical terminal devices
are typewriters, teletypes, or cathode-ray tubes (CRT). A CRT is a
television-like screen upon which instructional materials may be
1

2
displayed and which contains a typewriter keyboard and/c light-
sensitive pen which the student may use as response devices. Since
the student spends large blocks of time indirect contact with the
computer, CAI is considered to be somewhat expensi.ve.
CMI, a more cost-effective use of the computer, relies
upon a variety of multi -media or textual materials to.provide the
bulk of the instruction, while the computer is involved with functions
which may be, considered primarily as managerial in nature. Thesefunc-
tions include the recording 'of student responses, prescription of
learning activities, maintenance of a student date file, and other
tasks of essentially clerical nature which the classroom teacher
is normally expected to perform. A typicalCMI mode of instruction
contains the following steps: (a) the student studies material
relevant to a particular unit or objective;- (b) the student is tested
over the material-studied; (c) if he fails to attain the acceptable
performance criterion, the student studies the materiaA again
or is given remedial assistance; (d) lf'the student attains. the accept-
able level of performance, he is allowed to progress to the next sego
ment of,instruction. , CMI is usually found in conjunction - with a pro-
gram of individualized instruction in which the .student is allowed
to progress through the learning materials at his own rate..
Within the paradigm known as CMI there are two models presently
in operation: batch-process and terminal-orienteL Batch-process
CMI is a procedure wherein the student does not come in direct
contact with the computer. Tests are answered on mark-sense answer

3
sheets or computer cards which are collected at the end of the school
day, taken to a computer center to be analyzed, and returned to the
school the following day. This is an economical use of the computer
in that the data from large lbers of students can be processed at
one time and the comput r sys 1 does not need to be dedicated to
that particular program, as is the case in some CAI operations.
Disadvantages include the need for a middle man to handle the data
and the likelihood of an overnight delay in receiving feedback
regarding performance.
In the terminal oriented CMI procedure the student interacts
directly with the computer in the testing phase of the instruction.
Rather than marking answers on paper sheets or cards, the student is
presented questions via a computer terminal and the response is recorded
immediately by the computers. It is assumed that the direct student-
computer interaction will allow the merging of the instructional capa-
bilities of :CAI with the managerial capabilities of CMI into a highly
efficient system for the individualization of instruction. Hansen (1970a)
has set forth three factors considered to be advantages of a combined
CAI/CMI instructional system: (a) the capability to utilize CAI tech-
niques in providing remedial assistanc,, when desired; (0 elimination of
a source of error in that the student is directly responsible for the
information flow to and from the system; and, (c) student receipt of
immediate feedback regarding his performance.
The literature contains numerous accounts of the application of
CAI as an instructional system. There are also numerous reports of the

4
application of CMI techniques as being distinct and different from CAI.
There is, however, a scarcity of empirical evidence to support the
assumption that CAI and CMI can be merged into a single instructional
system or that the factors enumerated above are indeed advantages of
such a combined system. In particular, when considering the use of
CAI techniques to provide dial assistance, an important question
arises: Can a c, ,,er pr(, 4 lue remediatiOn as well as a teacher?
This study is directed toward that specific question.
Statement of the Problem
The feasibility of computer remediation as compared to teacher
remediation was investigated through the-following questions:
1. Do students who receive computer remediation perform as well
as students who receive remediation from their teacher-?
2. Does the mode of remediation received affect the rate at which
students progress through the instructional materials?
3. Does the presence of computer-managed individualized instruction
have an effect on the student's attitude toward mathematics?
4. What effect does the presence of computer -managed instruction
have upon the functions and daily actions of the teacher?
5. What are the costs of a terminal-oriented CMI system?
Description of the Study
In order to investigate the feasibility of CAI remediation' within
a CMI format, two groups of seventh grade students received 15 weeks of
mathematics instruction (February 8, 1971 through May 21, 1971) via:
individualized booklets. Each'booklet comprised a single unit and.
was concerned with one topic in mathematics (see list of topics in
Appendix A). Upon completion of a unit of work, each, student received a
5
test from a computer via a teletype terminal. Half of the students,
upon failure of a test, received remediation from an instructional
sequence programmed into the computer. The other half of the students
were referred to the teacher for assistance if they failed a test.
Thus each aspect of the instructional process was held constant except
the mode of remediation, allowing the feasibility of compute!- remedia-
.tion as compared to teacher remediation to be investigated.
For the purposes of the study, remediation is defined as the
presentation of examples similar to questions the student had received
on a test which had been failed. In the first example the student was
required to respond at intermediate steps in the solution in order to
determine the source of misunderstanding. The student was then presented
a second example to work without assistance. A correct response to
the second example was considered an indication that the student under-
stood what he had done wrong and was prepared to proceed with the next
step in the instructional process. The rationale for this remeeation
pattern is based on two aspects: (a) consultation. with the mathematics
teacher in the experimental classes; and (b) experience gained by the
author in ten. years of teaching in the public schools at both elementary
and secondary levels. In those ten years, through observation of the
techniques of a large number of mathematics teachers, it has been
observed that almost all of them use essentially the same remediation
system as was used in this study: working through a problem with the
student and then requiring him to work one without assistance. Both

6
the teacher remediation and computer remediation in this study followed
this same pattern.
Through the investigation of the five questions listed in this
chapter, the researcher is attempting to contribute to the literature
of educational research through the implementation and investigation
of a combination CAI/CMI instructional system. It is hoped that this
prototype system can make a positive contribution toward the individuali-
zation of instruction within the schools.
To provide a background of previous research and formulate the
basis for this study, the next chapter presents a review of selected
literature concerning CAI and CMI as they are particularly related to
the individualization of elementary and junior high school instruction.

REVIEW OF LITERATP,E
In the late 1950's it became apparent to innovative educators
that the computational capabilities and managerial functions of the
computer, which were making such an impact on the business and
tific community, could be applied to education. The computer
was seen as a means of presenting instruction, but additional
advantages would be in the storage and analysis of data generated by
student responses and the use of these data in the prescription of the
instructional program for the student. In this manner a truly individ-'
ualized course of study could be designed for each student according to
his unique capabilities, and through the use of the data generated by
the student himself, the course of study could be updated and revised
qui,ckly and efficiently.
Computer-Assisted Instruction
The initial attempts to apply the computer to the individuali-
zation of instruction were made in the area of providing instruction
directly by the computer. This instructional paradigm became known as
computer-assisted instruction (CAI) and quickly developed several levels
of instructional sophistication: drill and practice, tutorial, problem
solving, simulation, and evaluation (Hansen, 1970b). Emphasis herein
will be placed On.the basic instructional levels of CAI as they per-
tain to this study; i.e., drill and practice, tutorial, and evaluation.
7

8
The reader is referred to Bushnell (1967) for discussions of simulation
and problem solving applications.
Drill and practice, The pioneer in drill and practice applications
of CAI is Suppes (1967) of Stanford. This type of sfu:!L,
interaction can be thought of as a supplement to the regular curriculum
taught by the teacher. Building upon evidence that students need a
great deal of practice in order to obtain mastery of basic arithmetical
skills, programs were designed which allowed students to work individ-
ually at various levels of difficulty. The student may be moved up
or down in difficulty level depending on his level of performance. A
typical procedure is for the teacher to introduce the mathematical con-
cLpt in class; the drill and practice by the student is accomplished
at the computer terminal. The teacher is thus freed to pursue other
more, important functions. The advantages of this mode of application
are that the student receives imnediate feedback as to his performance,
and the teacher receives a complete report of student performance
(Suppes & Jerman, 1969).
A significant application of .Lippes' drill and practice material
via CAI was lin the McComb, Mississippi, school district. Students in
the first six grades were divided into experimental and control groups
and their grade placement in mathematics was determined. At the end of
the school year, their grade placement was again measured. The differ-
ence between pre nd post-grade level, placement favored the CAI group
and was, significant at the .01 level in all six grades (Suppes & Jerman,
1969).

9
Tutorial. At the second Instructional level of application of
CAI are the tutorial programs which have the capability of real-time
branching contingent on a single respontl or series of responses (Atkinson,
1969). In other words, the tutorial level of CAI is one in which func-
tions of the teacher may be assumed for certain periods of a school day.
During this time the student may receive instruction in areas which
redundantly consume teacher time. For example, a student could be shown
a sentence in which there are three different words he may choose
from to use as the verb in the sentence. He chooses the verb which causes
the sentence to make sense, This type of work, with its accompanying
error messages, can easily be provided by a computer, but would consume
great amounts of teacher time.
One of the first programs to utilize CAI in a tutorial mode was
the reading program developed at Stanford for use in the Brentwood School
in East Palo Alto, California. This program consisted of a core .of prbb-
1??.ms- which the student was required to master. The problems could be
branched around by passing pretests, solving correctly, or solving in-
correctly, in which case they were branched to remedial material. At
the end of the year there was between fastest andslowest students a
difference in problems completed of over 4000 problems; on achievement
measures, the CAI group outperformed the control group at either the
.05 or .01 levels of significance in nine of the ten measures (Atkinson,
1969).

10
A major public school program involving CAI at the tUtoHal leve!
in b6th reading and mathematics was the rural county CAI project in..
Wakulla County, Florida.. Developed in conjunction with the Cbmputer-
Assisted Instruction Center at'Florida- State University, this tiwee
year pro4qct'sdata.show significant positive improvement in rea.dinq
and mathematics skillsfrom year to year. Due to contamination of
control groups brought about by large scale shifting 1 students when
the d4trict underwent total'desegregation, comparative resultE wefe
somewhat mixed. HoWever, the data show steady progression of black stud
upward toward more normative achievement test means as adjusted by
Kennedy (1949) for southern rural black students (Hansen, Johnson, Dural'
Lavin, O McCune 1971).
Evaluation. _Research has 'indicated-that CAI can be utilized. In
performing testing and evaluation functions.. Using elementary stUdepts
as sub*ts and teletypes as computer terminals, Ferguson (1970) reports
that computer -based criterion- referenced testing can be as reliable and
valid conventional teSting'and.that-computer-based:testing consumes
less time-.
At Florida State UniVersity CAlhas,played an important role in
the formativq evaluation 'of the:Intermediate'Science-Curriculum Study, a
program designed for grades 7-9. After three years of instructional
material preentatioriviaCAI, three factors appear to be particularly
interesting: (a) CAl provides a much more detailed evaluation than is

11
possible through field trials; (b)-evaluation information can be fed
back to curriculum revisors with a-greatly reduced lag time; and,
(c) after approximately four hours a-week of exposure to CAI through-
out three years, thus logging more CAT time than any other known group,
the students still indicated a strong positive reaction to CAI and a
willingness to continue in a CAI program (Hansen, Brown. King,
& Rivers, 1970).'
To summarize, it.may be noted-that the use of CAI has grown
considerably -since,its inception as. witnessed by the fact that in 1963
one public school was utilizing CAI-whereas this had increased to 77 by
1969; in 1959 oneuniversity.had CAI-capabilities and this had grown to
50 by 1969 (Tuttle, 1970). In a broad sampling of journals and insti-
tuti reports Bundy (.1968) reports:thefollowing-conclusions.:.. (a).
students learn as well,witfrCAI; (b) CAI can provide equivalent learning
in the same amount of time; (c;) CAI adjusts quite well to individual:
differences; and,.(d)-students-generally.have-apositive attitude toward
CAI. Keeping in mind: the-relative lnfaney-of-CAI,these conclusions must.
be considered tentative,:butAtmay-be noted that,CALis apparently.a
viable instructional anthevaluation-systemi-,and, as such, is expected to
'play a major.role.in the individualization of instruction-imthe future,:
Computer-Managed Instruction
Many educators recognized the contributionCAI could make
toward a program of individualized instruction, but most-were wary of
12
the costs of implementing CAI and the concomitant large developmental
efforts that were required:- Out of this quandry grew a second appli-
cation of the computer to the instructional process, It was proposed
that the computer. utilized in the management -and record keeping aspects
of instruction, but that students work from a variety of-off- the -shelf
or textual materials.. Thus. , existing.instructional materials could be
utilized without an expensive'developmental effort. Further savings
would be realized by removing the computer from the teaching phase of
the instructional process,.but at the same time the advantages of the
high speed data handling, storage, and retrieval functions.of the comout,,-
could be used to full advantage. This model became known as computer-
managed instruction (CMI) and-quickly assumed-importance.in elementary
and junior high school individualized instruction efforts. Three of
the major. CMI projects are worthy of detailed consideration.
Project PLAN. Project PLAN (Program for Learning in Accordance
with Needs) was originated in 1966-through a joint venture involving
the American.Institutes'for. Research, the-Westinghouse Learning Corpor-
ation,,and twelVe school districts throughout the.country.(Flanagan, 1970).
It has now spread to 24-cities involving 20,,000 students (Rogers, 1971) -
The proposed function of thenew educational program is toprovide a.flexible,system.im.which. the student,can.be assistedto-take as -much- responsibility as possible-iwthe planning and.carrying out:of. -his'own. educational development. (Flanagan,1970, p. 2).

13
The five major components of the PLAN system are: (a) a set
of educational objectives; (b) learning methods and materials; (c)
evaluation; (d) guidance and individual planning; and, (e) teacher
development (Flanagan, 1970).
The role.of the computer in-PLAN'involves-a.great variety of
functions. The computerprocesses the daily tests taken by the students
and provides-printouts of, these results.forthe teachers.. These data
are used to constantly update' and revise-the student's program of studies.
A weekly .status report is also provided. In addition-to the daily and
weekly processing.functions, the computer-assists. in.registration of
the student and in the actual planning of.hfs-course:of.study, including
the placement of '.the student-in tWprogram of establishing
a quota in terms of numbers ofmOdules to.be:completedi and a selection
of the actual modules-of instruction to'be:receivediv the student
(Flanagan 1970). The.constantupdating-and revision pf:student data
and the, planning and prescriptive-usage are critical features in making
this type of computer application practical. In an effort to facilitate
the flow of information to and from the computer,- each of the Project
PLAN schools has recently received-a terminal through which" the, teachers
can interact directly with the-computer (Rogers, 1971).
System Develppment-Corporation/Southwest Regional Laboratory.
Working outside the realm-of individualized instruction but designed to
assist teachers in a traditional elementary-school-setting achieve a
measure of individualization, a CMI effort-was originated under the joint
sponsorship of the System Development Corporation and the Southwest.

14
Regional Laboratory for Educational Research. and Development (Silberman,
1969). This CMI system was designed to help the teacher monitor the
progress of the students and make decisions on the pace or instruction,
the grouping of children, the sequence of lessons, and the Ind'Aidua1i2a7
tion of instruction. The four primary components of the rtfo-ration
management system are objectives, tests, repchts, and prescriptions; it
helps teachers by providing information about ea-.h chYd's achleement,
suggesting activities to help a pupil understand a lesson, and pr-ovIdng
a framework for making decisions on classroom management (Geddes &
Kooi, 1969).
Individually Prescribed Instruction. Perhaps the most far-
ranging effort in the CMI field-was the IndividLaIly Prescribed Instruction
(IPI) project instituted in the Oakleaf School System in Pittsburgh by
the Learning Research and Development Center of the University of
Pitttburgh. The IPI program is based on an instructional model consist-
ing of the following sequence of operations:
1. The goals of learning are-specified in-terms of observablestudent behavior-and-the conditions under which this behav-ior is to be exercised.
2. Diagnosis is made of the initial capabilities with whichthe learner begins-a-particular:Course'of instruction. Thecapabilities that are assessed are those relevant-to the forth-coMing instruction-.
3. EdUcational'alternatiVet adaptive- to the initial profile ofthe student arepretented-to'hirm. The'student-selects or isassigned-one ofthese:alternatives.
4. Student performance,is monitored-and:continuously assessed asthe student proceeds to learn:
5. Instruction proceeds as-a functionHbf,the relationship betweenMeasures-w student performance, available instructional alter-natives, and criteria of competence.
6. As'instruction-proceeds, data are generated fOr monitoringand improving.the'instructional system (Cooley & Glaser,1969, p. 96).

15
Automation is not a prerequisite for the implementation of the
IPI model and the project initially operated in the nonautomated form,
much as it is being used in school systems across. the country at Present.
After three years of operation in the nonautomated form, batch-process
computer capabilities were added to the program in the form of a Manage-
ment Information System (MIS).
There are four major functions which the-MIS can provide in an
individualized school: (1) collect data; (2) monitor student
progress; (3) provide prescriptions; (4) diagnose student diffi-
culty. These functions have two primary objectives: to increasethe effectiveness of the model for individualizing inst)nuctOn_
and to maximize the productiyity of the teacher operating the
IPI system (Cooley & Glaser, 1969, p. 106).
Through supporting theIPI instructional system with the functions
of the MIS, IPI/MIS has been shown to be one of the leading projects in
the research and implementation of individualized computer-based instruc-
tion. Cooley and Glaser (1969) admit that a shortcoming of' the IPI/MIS
system is that each school has only one terminal and it is not in the
classroom. They speculate that the next step in the development of IPI /
MIS is to add classroom terminal capability so that both students
and teachers will have actess to computer terminals. The papet, on
computer - based testing by Ferguson (1970), an associate of Cooley and
Glaser, indicates that IPI/MIS is moving in.that.direction at the
present time.
Thus we tansee-that IPI/MIS is unique in that it is the only
project which has.existed.in a nonautomated form, moved to:batch-process
CMI; and is now moving into the other CMI mode-, which was earlier
described as-terminal-oriented CMI.
16
Terminal-oriented CMI. The model toward which IPI/MIS appears
to be moVing'is in full scale implementation at Florida State. University,
where the majority of the CMI activities are directed toward university
undergraduate and graduate instruction. Since this study was conducted
on the junior high school level, these university level instructional
activities, with the exception of one research study, will not be dis
cussed in this paper. However, the reader is referred to the FSU CAI
Center annual reportS authored by Hansen,, et al. (1970); and Hansen,
Brown, O'Neil, Merrill, & Johnson (1971).
The study which relates most directly to the research described
in this paper is the terminal-oriented CMI- investigation conducted by
Lawler (1971). With university undergraduate health education students
as subjects, Lawler examined the efficacy of providing remedial prescrip-
tions for students who failed to attain criterion on unit tests, thereby
forcing the students to attain mastery on each test. The prescriptions
were usually hints as to which portions of the instructional materials
should be studied again or were suggestions as to which references
should be pursued closely. This can be considered a somewhat limited
use of the terminal-orientedcapabilities to provide remedial activities
nor does this use capitalize on the full power of CAI techniques that are
available to provide remedial instruction. Nevertheless., significant
differences were observed in favor-of the prescription-forced mastery
CMI group over. a CMI, group which did not receive prescriptions and was
not forced to attain mastery. In addition, significant' differences in
performance and attitudes, infavor of the CMI groups as opposed to a
control group taught by conventional classroom techniques, were obServed.

III. METHODOLOGY
CMI Model
The Model for computer-managed ind 4idualized instruction
developedfor-this -study -is-one which, incorporates the tutorial 'capa-
bilities of CAI within the managerial capabilities of CMI, as discussed
in the previous chapter. A flowchart of the stepsin the instructional
system is depicted in Figure 1.
Learning Materials
The learning materials consisted of self-instructional booklets
generated through a. curriculum project in Palm Beach County, Florida
(Palm Beach County Board of Public Instruction, 1969). The project was
funded by State of Florida Educational Improvement Expense and ESEA
Title III funds. On its staff were a total of 34 mathematics teachers
and othpr personnel experienced in curriculum planning and development.
The materials were provided for this research in return for documentation
of their use in a computer-based-program.
The systematic technique utilized in developing the instructional
units involvedseveral stepsloeginninT with the statement of performance
objectives for each unit of instruction. Instructional strategies. and
activities designed to lead the student toward the performance criterion
were designed in conjunction-with-existing textual materials.. Other.
18

Start
Complete Individualized
Booklet, Unit N
Pass Test
Off Line
LSign Off
Consult Teacher
Sign Off
A
VSign On To
Terminal
Check far Proper
Student Number
<
Hello, --- ---
Is This Your Name?
Sign Off
Present Performance
Table
Let N=N+1
Let N=N+1
Example
Yes
<Yes
2nd
ime Faile
Test?
Yes
n-Lin
Group?
Branch to
Unit N
Present Questions
Consult Teacher
\V
>2\t,
Right?
Yes
//No
Figure 1.--Steps in Instructional System.
Example 2
Sign Off
No
Rea
o Take
Test Again?
Yes
LO

1
1
20
state-adopted textbmOks mere.us0,d.as supplementary, referenca:,. sources.
Evaluation of stude per:ormarv. was conducted within eaChunit and
at the end of segmerr--.0 , units .7:rtaining to a general topic (e.g.,
multiplication of fraztx-ns). T7iie_results of the evaluations con-
ducted during the imrtiall year kJ, implementation.provided data for the
revised version of the materia portions of which were-utilized in this
study.
The particular materials used in this study were selected to
maintain continuity wl'th the topics which had been discussed during the
first semester of the school year and to generally follow the content
outline presented in the state-adopted textbook in use in the school.
See Appendix B for a. sample unit booklet and its accompanying unit evalua-
tion.
Each booklet, which comprised one unit concerned with a single
topic, contained behavidral objectives pertaining to the skill to be
acquired-in.thestudy of that topic. The students were-provided instruc-
tion regarding the topic and worked at their own pace through problems
which led them toward the skill required to fulfill.the.objective for
the unit. Upon completion of the work required in the booklet, and when
they felt they were prepared to be-evaluated,:the:students proceeded
-to a teletype-terminal and received the test questions, from the computer.
The examination consisted of five criterion - referenced multiple choice
questions, designed to.test,the.skill required in the behavioral :objec-
tive for that unit. Upon completion of the examination the students.
were provided immediate'feedback through:presentation of a table

21
summarizing performanceon.the test:--A-Sample table is shown in Appendix
C and represents abasic form of a data management. system integral to
any CMI system.
If the-studentachievedcriter. ;on (80 %') in the test, he was told
to proceed to the next unit.
Remediation
if the student failed the test, the performance table was presulted
and the remediation proceeded according to the following steps: (see
also Appendix D):
A. Teacher-remediated group.
1. The student was directed to consult. the teacher for help and
was signed off.
2. After being assisted by the teacher the student returned to
the terminal and, the testwasi)resented again.
a. If the student passed the test he proceeded to the next
unit.
-b.! If'he-failed.again he-was-once:.more. directed to see the
teacher,: who worked with.the-studentuntil'he could pass
Ha test off line (away from-the computer) The second
failure-branched-the computer. to the next unit.
B. Computerremediated group.
1. .Jhe student:was presentede-sample.problemsimilar to the
-problems "on:the test.- Inthis-firstprobleu, the student was
required.tcyreSpond.at-intermediate,steps'inthe-solution in
orderta-determine-areaof.difficultyy,Error-messages intended
t6alleviate. the. difficultvwerethen presented,

22
2. A second example was presented which the student was required
to work without assistance as in a test situation.
a. If the student answered this second example correctly,
he was presented the test again.
(1) If he passed the test he proceeded to the next unit.
(2) If he failed the test the second time;- he was signed
off and sent to the teacher for assistance. No
further computer remediation was attempted. The
teacher worked with the student until- he could pass
a test off line before proceeding to the next unit.
b. If he answered the second example incorrectly, he was
told the correct answer and why it was correct.
(1) If the student was aware of what he. did wrong, he
could elect to take the test again at this point.
(a) Step 2.a.1. above.
(b) Step. 2.a.2. above.
(2) If the student still did not understand the problem
following- the second example., he could elect to
sign off and consult the teache. He was required to
sign on again to retake the test.
(a) Step 2.a.1 . above.
(b) Step- 2.a.2. above.
Instruments
The- evaluation instruments for- this study were:
Individual unit- tests., These were five. question criterion-refer-
enced multiple choice tests taken directly from the Palm- Beach County

23
materials.' The tests- were generated concurrently with the, instructional
material s through the major. State and Federal ly funded- curriculum effort
in Palm :Beach County. The tests had been in use and had undergone one
revision. See Appendix. B.
Review tests. At, the-end: of:major topical sections of the
materials were. ten. question review tests-which- were :presented to the
student at the computer: terminal .. The. questions On these tests were
equivalent forms of the- individual uni,t. test questions... These tests
occurred at units 10, 19, 26., and 31, and no remediation- was presented
on these units,
Posttest. The posttest was 'a 25 question multiple choice test
administered individually away. from the computer terminal upon completion
of the first 31 units of- the instructional materials.
.Upon completion of the unit 31 test the student was allowed the
next class period to .study. for the postteSt,- which. was then- administered
the following day in a very smal 1 number of :cases:, a weekend was
involved in this procedure'.: However, none. of the- instructional materials
was taken home by the students- and. all. studying was done. in class. The
prOcedure for allowing one class- period of- study- time- for. the posttest
was adhered to for all students.
Since the students- moved- at different: rates through- the instruc-
tional materials and :completed. unit 31 at different- times', it was felt
that :some: method: of- providing equivalenti- but not identical tests had to
be devised: This was accomplished by forming a. pool. from all questions .
received in units 1 through. 31. {excluding. review units 10-, 19-,. 26, and 31).

24
Th'it-F pool as then stratified according to the four major, topic areas
whirch were represented by the first 31- units.. A routine was devised so
that the computer randomly generated 25' questions in such a manner that
the posttest questions reflected. the same concentration' of. topics as was
reflected in- the 31, units themselves; By signing on to. teletype terminals
located in the CAI Center with each. student's individual identification
nurr-r, a separate test for each student was' generated by random selec-
tion from this pool. of questions.
Because each student received a different. set. of questions during
the posttesting,. it was not possible. to cal cul ate. a reliability Coeffi-
cient for the instruments: However,. when the posttest scores were corre-
lated with the retention test, scores. (coefficient. alpha reliability = .79),
a correlation coefficient. of .76 was realized-.- This correlation was
significant well beyond. the- .01. level. of probabi I ityy where. a coefficient
of .325 was sufficient for- significance. (N=64,. 62. Thus , concerns
about the reliability of this. instrument were somewhat alleviated.
Retention test. The same. routine. as described above for the
posttest was used to' generate. the retention' test (see-Appendix E). By
signing on-to a teletype terminal at the' CAI Center with an unused
student. identification. number,. another 25' question. multiple choice
test was generated., This test was. then' dupl icated. and administered
to. all students in- the, study on' the same day.

25
In the case of the retention test, a true measure' of retention
that was not affected by study time- was desired. Therefore, -at the end
of the 15 weeks of the study, all work in- the- materials' ended on Friday,
May 21. No materials. were taken- home over the. weekend., Monday's class
period was fully consumed by administration of the CMItIndi vidual i zed
Instruction- attitude scale-, and the retention' testwas administered on
Tuesday, May 25.
The rel iabi 1 ity of the retention test became a. matter of concern
when it was learned that the students.had been involved- in a softball
game during the period prior- to the testing and were to return to the
game following completion of- the- testy Administering- an important
achievement measurement- between. innings of a softball- game is apparently
one of the unknown factors a researcher must be prepared to face when.
field testing a program in the public schools.. When- the retention test
scores were analyzed, however,' the coefficient- alpha reliability was
calculated to be .79.
Mathematics- attitude. questionnaire. Studies reviewed by Aiken
(1970) have indicated that attitude plays a significant role in achieve-
ment in mathematics.' To assess' the effect of the experimental program
on the student attitudes, mathematics' attitude' measurements were taken
prior to the beginning of the investigation and' again' upon completion
of unit 31. The attitude questionnaire presented was derived from
that- developed, by Dutton. and. Blum (1968.)-,' and used most often in
mathematics attitude studies- at the junior high' school. level (Aiken,

26
1970). Dutton has reported: a. Spearman-Brown Test-Retest Reliability
coefficient of .84 for the instrument,.
The. questionnaire' contained 25 items calling for responses
ranging from 1 to 5-, where 3. was a. neutral. response. The students'
scores were obtained. by summing all responses after reversing negatively
worded items. A score of 75, therefore. , would. be considered a neutral
score. A copy of the. questionnaire is included in Appendix F.
CMI/indi vi dual i zed. instruction attitudes A questionnaire
concerning attitudes toward CMI developed by._ Brown. (1966) WaSY'reri7sed
to be compatible with a junior high school situation.,. a subscale re-
garding nonautomated. indivldualized instruction- was included. This
questionnaire was administered. at. the. end of the second week of the
study to measure initial reaction and again at the end' of the 15 week
period. The total 'instrument , containing. both the CMI' and individualized
instruction subsea:les, was made up' 36 items calling' for responses rang-
ing from 1 to. 5., where. 3 was a neutral' response. These scores were also,
obtained by summing. all responses after reversing' negatively worded
items. A score of 108,. therefore., would' be considered a- neutral score.
Brown reports an alpha reliability coefficient. of .86 for this ques-
tionnaire. A copy of the instrument is included in Appendix G.
Subjects
Two classes seventh grade mathematics students taught
by Mr. Randy Anderson at; Wakulla County High. School, Medart, Florida,
served as subjects for, the study.. Seventy-one. students. participated at
the beginning of the progra, but attrition reduced this number to
65 by the conclusion' of the study:- Mr. Anderson: taught two other

27
classes, but it was found through. interviews. with' the students
in the other two classes' that the reading level' of the mathe-
matics materials, even though it was' about fourth' grade level , was
too difficult' for ther. The' students' participating' in this study,
therefore, were those who were generally' able- to' follow the direc-
tions in the booklets. There existed within- this group' a wide range
of mathematical and reading abilities as evidenced' by the' scores on the
Comprehensive Tests of' Basic Skills (California' Test Bureau, 1968)
administered in September,' 1970. In' reading', the' grade equivalents for
this group ranged from 2.0 grades- to 12.6' grades , with a median of 6.6
grades. The ma-ftematics gradeequivalents also ranged from 2.0 to 12.6
grades, with a median of 6.3 grades.
The students' at. Wakul la High' School are' grouped' according to
ability. The two classes participating' in' this study comprised the
high and medium ability groups' in the' seventh grade. The. median grade
equivalents' in reading' and mathematics' showed' a deficiency of .4 and .7
grades,- respectively', for these' groups',' while. school' 'testing records
indicate the average- seventh' grader was 11/2 years below' grade level .
See Appendix H. for a description of the' Wakulla County community.
The students were randomly assigned' to treatment' groups within
each class so that half' of- each class' received' computer remediation and
half received teacher remediation'. The' intent of this' procedure was two-
fold: first, to avoid the chance assignment' of a majority of one class
to the, teacher remediation group, thus working a hardship' on the teacher
and causing undue delays for the' students; and secondly, to distribute
the possible effect of the teacher across student groups.
28
All of the subjects had prior. experience with the use of the
teletype terminals which comprised. the student-computer -interface. They
had participated in the CAI mathematics and reading' project developed
through the CM Center- at Florida' State University; Therefore-, any novel ty
effect which might have- been a- factor' in the students' achievement shoul d
have been considerably reduced.
Apparatus
The computer and terminals that were utilized in- the study are
components of the Computer-Assisted Instruction Center at- Florida State
University. The computer is an' IBM 1500 CAI instructional system
composed of an. 1800 central- processing unit, two: 1810- disk drives, and
a 1502 station control unit.
The IBM. 1500 CM. system is equipped with- a- dual- magnetic tape
drive upon which all student responses are uniquely identified' and recorded.
The staff of the FSU-CAI Center' has developed. a. data management system
which compresses, sorts, merges, and summarizes. this data- for theoretic
analyses. This system was utilized- to collect and' analyze data for this
study.
Late in 1968,. a' telecommunications capability. was added to the FSU
1500 CAI system. This' was accomplished, by the addition. of a Digital
Equipment Corporation 680. Switching' System. This device. collects and
sends data to local or remotely. located. teletype. terminals' under control
of a PDP-8 computer. This system. is. interfaced. with' the IBM. 1502 Station
Control Unit in such a way that the 1500 system' will service remote tele-
types in the same manner it. would a local 1518 typewriter.. At the time

29
of this study, fourteen teletype terminals were supported via the 680
system. Six of these.teletypes were located-at the- CAI Center and four
in Shadeville Elemeltary'School-in Wakulla County.
The remaining four teletypes, located at the Wakulla. County
High School, comprised the, student- computer interface.for this study.
The teletypes were housed in a room reserved for this purpose which
was very near the classroom.' Two capable adult proctors were present
in the terminal room during school hours and were responsible for signing
the students on to the program and assisting them in. the use of the
terminals.
Experimental Design
The research design for-this study is essentially a Post Test
Only-Control Group Design (Campbell & Stanley, 1963), with the computer
remediated group receiving the "treatment" and the-teacherremediated
group acting as a control. A deviation from the design presented by
Campbell and Stanley exists in that the post-testing occurred as the
students completed a fixed amount.of instructional material, and thus
varied in time. Time, therefore, was an uncontrolled-variable, but
this is inherent in an individualized instruction setting where students
are free to work at their own pace.
Procedural Schedule
A graphical representation of the activities. of the study is
shown in-Figure 2.. In summary form, the procedural schedule was as
follows:

February
38
19
March
April
May
21
24 25
I1
Instructional and
Testi rig Activities
AthA*
A0.
4..Aa ri abl e as
s u en ts co -
ete
t 3
Pos ttes ti ng and end
of Uni t-by-Uni t
Remedi ati on
General Mathemati cs
Attitude Measurement
variable as
students cam'
ALlete
31
CMI Attitude
Measurement
Retention Testing
A gure
.-- Procedural-Schedule

31
Wednesday, February 3, 1971 -- administration of the general mathe-
matics attitude questionnaire.
Monday, February 8 through Friday May 21 -- students. received in-
struction from the' individualized booklets. and -were tested on
the computer terminal.
Friday, February 19 (end' of second' week) - administration of. CMI
attitude questionnaire- to 'obtain initial' student reaction.
Thursday, April 1 (eighth week) students.' began moving through
Unit 31 and the post-testing began.. The general mathematics atti-
tude questionnaire was readministered upon. completion of the
posttest. As the students worked through units' above number 31,
the unit-by-unit remediation ended. Instead of a computer-
administered test over each unit,- the students took. a written test
which they checked themselves', and received a computer test only.
at the end of five-unit segments This change. served' three primary
purposes:
1. Reduced the use- of the terminals by the' fasten-moving students and
provided more time for the slower-moving students to Use the
terminals.
Z. Provided an opportunity. to compare weekly testing with daily
testing in order to determine' an optimum routine.
3._ Reduced the time the students were on. 1 ine. and-thus facilitated
movement to and from the terminals.
The post-esting an attitude measurement occurred' continuously
throughout April ands May as the students' finished Unit 31

32
Friday, May 21 completion of the-instructional' portion' of the study.
Monday, May 24 -- administration- of the CMI attitude. questionnaire.
Tuesday, May 25 -- administration of the retention' test over the
material in the first 31 units.
Wednesday, May. 26 last day of school .

IV, ANALYSIS OF RESULTS
In this chapter each research question will have its statistical
..findingt_presented in the order;reflectingAhe activity of the experi-
ment. Because this is a feasibility study as opposed to theoretical
research, many of the statistical analyses are posed in descriptive
form. Where inferential statistics are used, the null hypothesis
of no difference between remediation modes is implied, all statistical
tests are two-tailed, and no-specific rejection level, of probability
is adhered to. The calculated probabilities are.reported and
the reader is allowed -to determine feasibility relative to his
own situation.
Throughout the remainder,of this document the four groups
involved in the study will be identified by the following codes:
CR = Computer-remediated
TR = Teacher-remediated:
HCR = High ability computer-remediated
LCR = Low ability comouter-remediated
HTR = High ability.teacher-remediated
LTR = Low ability teacher-remediated.
question 1: Student Performance
Do students who receive computer remediation perform as well as
students who receive remediation from their teacherl
33

34
Unit The forced Jnriterion level of 80% for each-of the
individual unit 1..==a4s precluded -the use of traditional norm-
referenced staltaisal analyses on these scores. The most value,
ble information, therefore, would seem to involve the number of
students in each remediation mode who attained criterion on the
individual unit tests. Since there were unequal numbers of students
in the remediation modes and all students did not complete the
same number of units, percentages of units successfully-completed
by each group compared to the total number of units completed were
calculated for each group. These figures are presented in Table 1 and
concern only those units among the first 31 units in which remediation
was received (this excludes review test units 10, 19, 26, and 31).
Within each group shown in Table 1, the top row of numbers
in columns B through G are numbers of units, and the second row of
numbers indicate the units in terms of percentages. For example, in
the HCR group a total of 513 units was completed. Columns B and C
show that of those 513 units, 457 089.1%) of the units were passed. and.
56 (10.9%) were falle.E:on the first trial. Columns D and E show-that
of the 56 units fl' in Column C, 42 (75%) were passed on the second
trial while 14 (2W were failed., Columns F and G give the totalfor.
both 1 and 2 trigs..

35
TABLE 1
Number and'percentage of students who passed andfailed unit tests. Criterion = 80%.
Total UnitsA
1st Trial
Passed Failed2nd Trial
Passed Failed
Total 1
Passedor 2 TrialsFailed
HCR =19) 513 457 56 42 14 499 14
% 89.1. 10.9 75,0 25.0 97.3 2.7
LCR (n =17) 456 340. 116 72 44 412 44
% 74.6 25.4 62.1 37.9 90.4 9.6
HTR (n=18) 486 411 75 60 15 471 15
% 84.6 15.4 80.0 20.0 96.9 3.1
LTR (n=16) 432 338 94 65 29 403 29
% 78.2 21.8 69.1 30.9 93.3 6.7
All CR 969 797 172 114 58 911 58
82.2 17.8 66.3 33.7 94.0 6.0
All TR 918 749 169 135 44 874 44
81.6 18.4 74.0 26.0 95.2 4.8
All Hi 999 868 131 102 29 970 29
% 86.9 13.1 77.9 22..1 97.1 2.9
All Lo 888 678. 210 137 73 815 -73
% 76.4 23.6 65.2 34.8 91.8 8.2
All 1887 1546 341 239 102 1785 102
% 81.9 18.1 70.1 29.9 94.6 5.4
To determine if a significant differenceTxist=id between the
unit test performance of the CR and TR students, a Chi-square test was
applied to the data in columns F and G. The following comparisons were
made: HCR versus HTR, LCR versus LTR, and All CR versus All TR. The
probability of a significant difference was greater than .20 for, the
HCR-HTR and All CR-All TR comparisons', and greater than .10 for the

36
LCR-LTR comparison. These results indicate that the performance of
the CR and TR students did not differ significantly on theiunit tests.
Column D provides a direct measure of the efficiency of the reme-
diation provided to the students. Among the high ability students,
the teacher remediation was 80% effective compared to 75% effectiveness
for the computer remediation. The differential between lower ability
students was 69% to 62% in favor of teacher remediation, and the total
for each remediationtmode was 74% to 66%, also favoring teacher remedia-
tion. A Chi-square test indicated the probability of a significant dif-
ference in the. All CR-All TR distributions was greater than the .05
level, and that the probability of a significant difference. in the HCR-HTR
and LCR-LTR distributions was greater than the .20 level. These results
are encouraging in that even though the teacher remediation was more
efficient, the performance of the students within each ability group
on the computer remediation.was within. acceptable levels.
Review tests. A second measurement of the performance of the-CR
groups as compared to the TR poups.is the score achieved 4 each
group on the.review testswhitill occurred at units 10, 19,26, and 31.
The analysis of the review test scores is presented in labile 2.

37
TABLE 2
Group Mean*Scores on Review Tests
Ability LevelHigh Low
Remediation Mode:Computer_ 92.1 (n=19) 75.2 (n=17) 84.1
Teacher 90.7 (n=18) 82.5 (n=16) 86.8
91.4 78.8 85.4
Analysis of Variance TableSource d.f. MS F Ratio
ARemediattonAdde 11 503A1 1125L p >.25
Ability Level 1 10691.43 26.597 p<.01
Remediation MaritAAbility Level 1 1291.92 3.214 :10>p> X5
:Error 64 401.97
The analysis indicates no statistically significant difference
between high ability students across remediation modes, but a difference
favoring the TR students between'the'lower ability students. The probabi-
lity of a significant interaction was'greater than the .05 level, pri
marily due to the seven point difference between the means of the LTR.
and LCR students.
Table 3 reports the performance of the students on the review
tests relative to the criterion of 80%.

38'
TABLE 3
Percentages of students who attainedcriterion of 80% on review tests
10
Review Test Units19 26 3P Total
HOR(n=19) 94.7 89.4 89.4 842 89.5
ICR(n=17) 88.2 41.2 76.5 56-3 71.3
All CR 91.7. 66.7 83.3 711.4 80.1
HTR(n=18) 94.4 77.8. :94.4 88.9 88.9
221111n=16) 87.5 68.8 87.5 11112 78.1
All TR 91.2 73.5 91.2 7g.0:- 83.8
In general, higher percentages of TR,5tudents attained criterion
Imthe review tests than did CR students. There are somewhat mall
differences between-the.higher ability groups, with the tote beirg
:slightly in favor of the HCR group. However;, with the exception:
-Idle unit 10 test, there were large differences in favor of the
ifl group over the LCR group, - indicating 'that the teacher remedlation
tada more positive effect for the lower ability students.
Posttest. As the students completed unit 31, the 25 question
posttest was administered. The results of the analysis of the scores
are presented in Table 4.

39
TABLE 4
Group mean-stores on posttest
/AEU-HiLevelHigh Low
Remediation ModeComputer 86.5(n17,19) 60.3(n=16) 73.4
Teacher 83.3(n=17) 69.9(n=14) 76.6
84.9 65.1 75.7
Analysis of Variance TableSource d.f. MS F Ratio
Remediation Mode 1 180.669 .7043 p=.59
Ability Level 1 6876.622 26.8086 p<.001
Remediation Mode XAbility Level 1 716.695 2.7941 p=.096
Error 66 256.508
As in the review test results, a nonsignificant difference is
observed between the high ability groups along with a larger difference,
in favor of the LTR group, between the lower, ability students.. In
relation to the '80% level, 84% of the NCR group attained that, level
compared to 61% of the HTR group. Among the lower ability students,
38% of the HTR group scored 80% or higher compared to 13% of the LCR
group. The total for each nemediation mode shows that 54% of the CR,
students attained the criterton compared to 50% of the TR students.
Retention test. Slightly different results were obtained in the
retention testing than were obtained in the review test and posttest
situations. These results'are presented in Table 5.
40
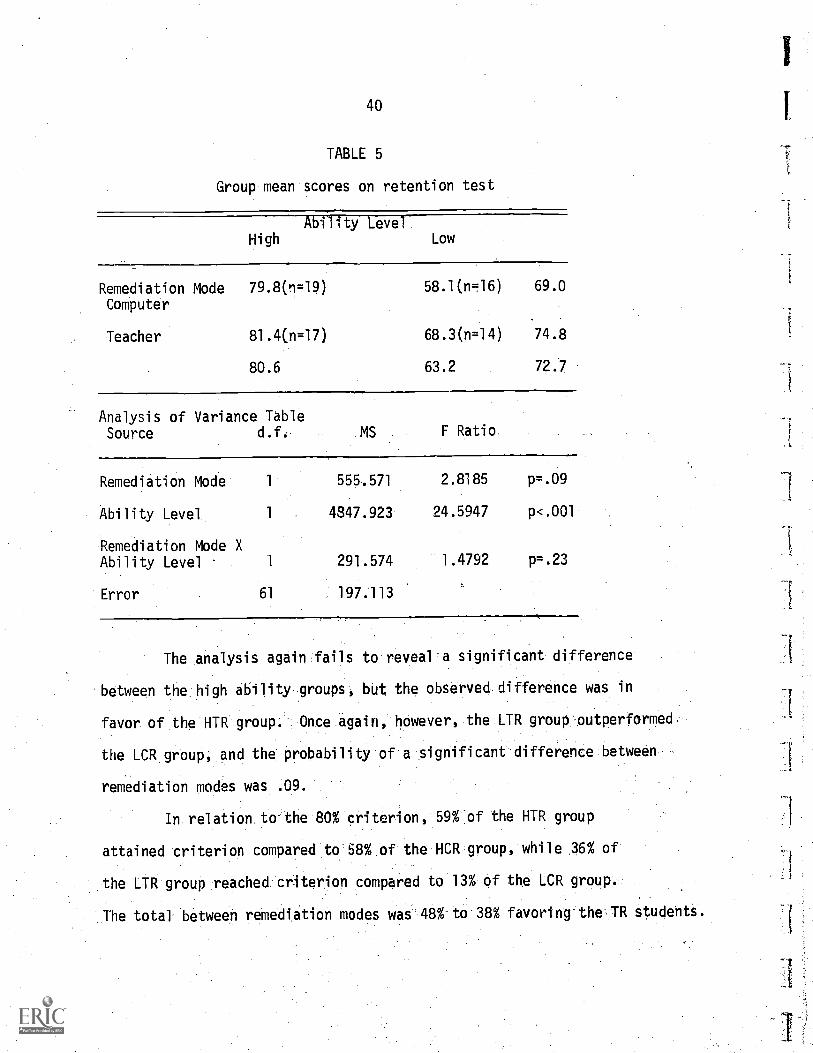
TABLE 5
Group mean scores on retention test
Ability Level.High Low
Remediation Mode 79.8(1=19) 58.1(n=16) 69.0
Computer
Teacher 81.4(n=17) 68.3(n=14) 74.8
80.6 63.2 72.7
Analysis of Variance TableSource d.f. MS F Ratio.
Remediation Mode 1 555.571 2.8185 p=.09
Ability Level, 4847.923 24.5947 p<.001
Remediation Mode XAbility Level 1 291.574 1.4792 p=.23
Error 61 197.113
The analysis again fails to reveal a significant difference
between the high ability groups, but the observed difference was in
favor of the HTR group. Once again, however, the LTR group-outperformed.
the LCR group, and the probability of a significant difference between
remediation modes was .09.
In relation to the 80% criterion, 59% of the HTR group
attained criterion compared to 58% of the NCR group, while 36% of
the LTR group reached criterion compared to 13% of the LCR group.
The total between remediation modes was 48% to 38% favoring the TR students.

41
Comprehensive Tests of Basic Skills. The Wakulla County School
system, as part of their evaluation program, administered the CTBS
in the fall of 1970 and again in the spring of 1971. This provided
an opportunity to examine the performance of the experimental groups
on a test which'was of otherthan.local origin. It must be emphasized
that the pretest and posttest were administered approximately eight
months apart and the period of'this.study accounted for only three of
those eight months. Nevertheless, if the assumption is made that all
students received comparable instruction in the traditional classroom
during the five months-priorto this study, the results of the CTBS
achievement testing.deserve.consideration. Tables 6 through 8
present the results of the pre= and posttests on the CTBS mathematics
subtest.
TABLE 6
CTBS mean mathematics grade equivalents for each group
PreIest Mean. Posttest Mean Adjusted Mean
HCR (n=15) 7.9 9.2 8.4
LP (n=12) 5.0 6.1 7.2
All CR 6.7 7.9 7.8
HTR (n=17) 7.4 8.3 7.7
LTR (n=16) 5.4 6.0 6.9
All TR 6.4 7.2 7.3
Because ofthe differences which existed between the groups
on the pretest, an analysis of covariance with the pretest as covariate
was performed on the-posttest.scores. The adjusted-meansare shown in

42
the last column of Table '6 and the ANCOVA summaries are presented in.
Tables 7 and 8.
TABLE 7
ANCOVA summary table of CR and TR groups:variate = posttest score and covariate = pretest score (CTBS)
Source df MS
Total 58
Error 57 1.8321
Treatments 1 3.6244 1.978 >.10
TABLE 8
ANCOVA summary table for all 4 groups:variate = posttest score and covariate = pretest score (CTBS):.
Source df MS
Total 58
Error 55 1.7019
Treatments .3 4.8162 2.83 .05
Table 6 shows that the CR groups exhibited greater gains than
the TR group of similar ability, providing results which are somewhat
different from the outcomes of the previously described testing situa-
tions. Where the previous tests showed mixed results the CTBS tests

43
indicate the CR students performed better than the TR students at
both ability levels. This is particularly evident among the lower
ability students'where the LCR students began the year .4 grades
behind the LTR students but were .1 grades ahead on the unadjusted
posttest mean and .3 grades ahead on the adjusted mean. The probability
of a significant difference between the HCR and HTR groups, in favor
of the HCR group, was slightly greater than the .10 level on both the
unadjusted and the adjusted means.
Question 2: Movement Through theInstructional Materials
Does the mode of remediation received affect the rate at which
students progress through the instructional materials?
Number of units- comAted. The rate at which the four groups
moved through the instructional materials was closely monitored. Table 9
shows the mean number, of units'completed by each group at three week
intervals throughout the 15 week study.
The figures in Table'9 can be considered accurate only through
the ninth week. At that.time,'thelligher ability students were moving
into the portion-of the materials where no remediation"was provided.
This freed the-terminals for more extensive use by the lower ability
students during class time, which partly accounts for the anomalous
situation at the end of 12 weeks'in-which the HTR and LTR groups had
completed the same mean number of units.
The data.at the end of nine weeks, when analyzed by the Mann-
Whitney U Test, show no significant differences in mean number of units
completed between'all CR and TR students or between LCR and LTR students.

44
TABLE 9
Mean numberof'units completed by each group
Ability Level
Time(Weeks)
Remed.
Mode
High Low Total
3 CR 10,2(n=19) 8.1(n-17) 9,2
TR 9,6(n.18) 8.3(n=16) 9.0
6 CR 17.6 13.2 15.5
TR 15,3 13.6 14.5
9 CR 25.4 18.4 22.1
TR 21,2 19.9 20L5
12 CR 31.4 24.4 28.0
TR 27.8 27.8 27.8
15 CR 40.9 34.5 37.3
TR 37.1 34,6 35.9
However, the probability of a significant difference in favor of the
HCR group over the HTR group was between the .05 and .10 levels.
Rate of Movement. A closer examination of the rate of movement
through the materials is graphically presented in Figure 3. Calcula-
tion of average movement rates indicated that very high rates at the
beginning and end of the study tended to obscure yate measurements
in other time segments; -Therefore the rate of movement was calculated
for each separate three-week time period.

3.53.43.33.23.13.02.92.82.72.62.52.42.32.22.12.01.91.81.71.61.5
.45
F
\\\\\
---eHCR
LCR
HTR
LTR.
6 .9
WEEKS
12 15
Figure 3.--Mean number of units completed per week duringeach three week. period.

46
When it became apparent-at about the twelfth week'that most of
the students were going-to reach the 31 unit plateau, the two lower
ability .groups reacted in startlingly different manners, The LTR group,
upon completion of the minimum amount of work required of them, did
very little more. The LCR group, on the average approximately 3.5 units
behind the LTR group at the end of 12 weeks, continued working at a high
rate, reached the 31 unit plateau, arid pushed beyond it. In the
high ability class; it'had-become a contest and a-matter of prestige to
see who could complete.the greVest-number of units:. These factors are
reflected-in the-varying-rates'of-movement observed-in Figure 3.
The-figures in-the last-column-of'Table-9-indicate-that the CR
'groups. completed-a-greaternumberof-units-throughoutthe study than
did-the TR'groups.--However 'since-this-difference-was not statistically
significant,'it'wouV appear-that'mode-of remediation:had no effect
on the rate ofmovement ,throudh7the-instructional materials.
Question 3:11tudent Attitudes
Does the presence-of-computer=managed-individualized instruction
have an effect-on the-student's-attitude-toward-mathematics?
in investigating-the feasibility of a new instructional program,
it would seem-to be wise-notto-ignore-the'effect.of-the new program
on the attitudes-of-the-students-toward the program-and-toward the subject
matter involVed. *This:would-seem-to'b especially -true-irrmathematics
where research-has shown-an-extremely-closetrOatiunship-between attitude
and- achievement'(Aiken, 1970).

T
47
To investigate-the-attitudes-of the.Wakulla students toward
the computer - managed' individualized instruction program, attitudes
were assessed.in.three areas:. mathematics in general, computer-
managed instruction, and individualized instruction.
General.mathematics attitudes:. -The'median score on the Dutton
quettion6aire on both the pretest..and.posttest was 84,- On'the pretest,
35 students scored-above the median.and'36-below. On the posttest,
31 students scored above'the median-and 33 below. The Median Test
of these data-indicated (p>-.90).that-the two sets.of scores came from
the same population, leading.to.the.conclusion' that-the students'
attitudes-toward mathematics-in-geleral.were-not affected.by.the computer-
managed individualized instructional-program..-In.addition, no signi-
ficant differences.in'attitudes-were.observed when-the-students with-
in each remediation.mode were.divided-according to ability.
CMI/individualized-instruction attitudes. On the-Brown question-
naire incftparating both'subscales, the initial testing provided a median
score of 138.5 and the median score on the'posttest.was-141. On the
initial testing; 34 students-scored above the median and 34 were below.
On the posttest; 35 students exceeded-138.5 and 30 fell below. Even
though the median-increased.between-measurements,.the Median Test indi-
cated (p>.50) that-the-change in-distribution was not statistically
significant.
48
On the CMI subscale; the-initial testing demonstrated a median
score of 79.5, with.34 students''scores-falling on each side of that
figure. The posttest median-was-80:5, with 33 scores above the
initial median and 32 below,.resulting in a minimal change. When the
posttest data for this-subscale.were divided and analyzed according to
remediation-mode, it'was found-that.19 CR students scored above the
initial median and'12 were below. In contrast, 14 .of the TR scores
were above the"same figure and 20-scored below. The probability of a
significant difference-between these-score distributions was between
the .05 and .10 levels, indicating that.the'CR students' attitudes
toward CMI became.more-positive while-the TR students' attitudes
toward CMI became-more negative.
Somewhat different results for the entire-group-were obtained
on the individualized instruction.subscale. 'The median'score on the
initial testrig .was 59 and the posttest median was 61.' On the initial
test, 30 students scored above 59 and a large numberof-ties resulted
in 38 scores below 59. On-the posttest, however, 38 students scored
above 59 while 27 were below. 'The probability of a significant dif-
ference between these'score'distributions-was .slightly greater than
the .10 level indicating-that even though-the .attitudes-toward mathe-
matics in general.and CMI did not change,-the students' attitudes toward
individualized instruction-per'se-tended.to become.more'positive during
the study.
A further indication-of.this.positive'shift-iwattitudes is seen
in the responses to'a'guestion.which'waS asked at the-end of the study.
When asked "Compared'to towyou felt'about mathematics-before we started

49
the CMI program, how do you feel now?", 49 of the.students-(71%) responded
to the choice*"much better", 15-(21.7%) replied "better", four (5.7%)
replied they felt the same; and one student (1.4%) indicated she felt
worse about*mathematics:- This evidence indicates the merit of a
program of individualized.instruction,-whether.itbe-automated or
nonautomated.
Question 4; Impact-on the Teacher
What effect-does-the presence-of-computeNmanagedinstruction
have upon the.functions-and'daily:actions-of the teacher?
The introdUctfovof-the CMI program created-a significant change
in the day to-day-activities-performed-by-the-teacher; both in and out
:of the classroom.
In -class activities;PriortOthe'study;'the'teacher's in -class
activities.consisted.prtmarily-of.theactivities-normally associated
.with,a traditional mathematics classroom. The majoritTof the class
period-was spent Wthe-mass'dissemination-of information through lecture
and demonstration, and a short period of-time was allowed for the stu-
dents to work'on:the assignment:- During that time the-teacher usually
worked with'somestudents-individuallY;tutthisindividual contact was
extremely limited-due-to-class enrollments in excess of-30 students.
PeriOdically aventire class,period was devoted to.testing, during
which.theyteacher usually, graded-papers-orbeganpreparations for.the
next set: pf lessons.
While:the CMI program was in'progress, the -- teacher spent all,hit
time in individ01:cOntactwith-.thestudents: Some:students-were calling
on'him for-help'eth the Material.in:the-booklets:While others were re7.

50
quiring remediation.after-failure of-a-test. Thus, he-was constantly
in demand. If-he moved -about the -room helping students, there were
always several hands-up'where-students-were waiting-for him to come
to their desk-next:.-If he-remained seated at his'desk;-a minimum of
six or eight.students-quicklTgathe'red around him.
The teacher-found-this opportunity.to engage in activities of
a more interactive,-tutorial-nature to-be.a stimulating experience,
both personally-and professionally; In the personal context, it allowed
him to become better-acquainted with-his students-and their unique
characteristics-as individuals-in-a-learning situation: 'Professionally_.
rather than-being .memly a.dispenserofinformation,-hd.was provided
an opportunity to-perform at-a higher-level of-professional competence.
Out-of -class activities. With-the exception-of-assigning grades
and filling out grade cards-every.six weeks, the teacher'hadno duties,
to perform outside-the classroom. 'It-was not necessary to do any
planning for the.two .CMI-classes-since-the.booklets had already been
developed-and sequenced;--The-most significant-factor-in-the reduced
workload,-however came-from beingfreed-frowthe -clerical :duties,which
consume so much:of a-teacherLstime*outsideof-the classroom. He had
no papers to grade:andi-ecord'and no'tests'to-.generate,-score; and record.
-Since-two of'his-four classes-had-been'converted to CMI, his
outside-workload was effectively cut -in This'extra time gained
was utilized in-additional:planning for-the-twolower:ability classes
on his schedule.

51
Question, 5; Economic Factors
What are the costs-of.a-terminal-oriented CMI system?
Program costs. The-costs of the development and operation of
the CMI course for 70 students-for 15 weeks are presented.in Table 10.
TABLE 10
Cost Data
Developmental
1. One graduate student spent approximately 180 hours on 57 units,
20 hours/week @ $138.80 biweekly $625.00
2. Materials and duplication 100.00
3. Computer Coding Time 50 hours @ $3.33/hr. 167.00
4. 57 instructional units'@ $110.00/unit 6,270.00$7,162.00.
$7,162.00.
1 hour per day X 75 days X 70 Students (5,250 hrs.) = $1.36 per 'Stu-
dent hour
Operational
1. Teacher. $6,500/36 weeks X 15 weeks X 1/2 Time 1,354.00
2. Two terminal room proctors
3. Computer time 375 hours/$3.33/hr.
$4,102.005,250 hours = $.78 per student hour
Total Hourly' Cost $2:14 per-student hour.
1,500.00
1,248.00$4,102.00
Since only 70 students were involved in these calculations,
the develOpmental costs comprised an-inordinatelproportiorvof the total
instructional costs

52
Computer time. It would seem that the presentation of remedia-
tion to one group of students would cause that group to spend more time
in direct (on-line) computer contact. This in turn would make computer
remediation more expensive than teacher remediation within a CMI format.
Analysis of the on-line-time by remediation mode and ability level,
as presented in Table 11, indicates that inn this particular study the
above assumption was not valid.
TABLE 11
Average amount of time (in-minutes) spenton line during the 15 weeks.
Ability Level
Remediation. Mode High Low Total
Computer 298.8 346.8 322.8
Teacher 300.5 345.7 323.1
Total 299.7 346.2
It is obvious that the only significant difference appearing
in Table 11 is the difference between ability levels. The median
on-line time was 312.5 minutes. Twelve high ability students were
on line longer than that and 25 less. Of thelower ability students,
23 were on line longer than the median figure and-11 less than that.
The Median Test indicated.this-difference,was significant-at less than
the .01 level .of probability. Since communications-costs represent a
substantial portion of the cost'of.terminal-oriented CMI, these data
indicate that ability level could.be a more crucial economic factor than
remediation mode.

DISCUSSION AND CONCLUSIOWS
The primary pqmpase for canductino VINT study was to investigate
the,feasibility of a terminal-oriented CMI program in a public school
setting. One of the capabilities of terminal-oriented CMI is the provi-
sion of remedial assistance to the student in the event a zest is
failed. The effectiveness c caMoter-pr esanted remedial assistance
and its viability as an alternative to teacher- presented remedial
assistance was the specific factor under investigation.
The five questions which this study attempted to answer can. 64
grouped into thre# MajOr &ren Otit.shouTd be considered in determining
the feasibility of an.instructional-system; They are the program's:
(a) effect on'the students;.(b) effect on the teacher; and (c) economic
factors. The purpose of this chapter.is to summarize the findings of
this study 'Ai each.of.these areas.
Effect on.the Students
Measurements of the effect-of.the.experimentalinstructional
system on the students.were.taken in-both the cognitive and affective
domains. In the cognitive.domain; performance data were gathered
through both criterion - referenced- assessment instruments-and norm-re-
ferenced achievement.tests.. From the'affective domain.student attitudes
toward mathematics and the CAI/CMI system were sampled.
53

54
Student performance. The data from the primary focus of this
investigation, teacher remediation compared to computer remediation,
indicate no statistically significant differences in student perfor-
mance between remediation Nodes. Differences which existed between
lower ability groups tended; o-favor.teacher remediation, and could
have bee due to the possibility that the teacher remediation was
more suppprtive in nature or that the teacher might have provided more
than two ,,xamples to-some students. However, a concerted effort was
made to maintain uniformity between remediation modes:' The more efficient
teacher remediation for lower ability students also could be due to
characteristics of the computer remediation provided in.this particular
program, and should not be a condemnation of all efforts to provide
remediation via computer.
It should also be noted that the remediatiorrwas considerably
more efficient in the hiciher ability groups than in the lower ability
groups, a factor which could be related to the ability of'the LCR group
to read the remediation and to the possibility that more than two examples
may be required for proper' remediation.
In general; the criterion-referenced performance indicators
show nonsignificant differences'between CR and TR students. When the
CR and TR students'Were subdivided'according.to ability, nonsignificant
differences again appeared between the.high ability groups, but larger
differences became apparent between-the lower ability groups. These
differences favored the-LTR students.and-the majority of'the differences
were statistically significant.

55
With the exception of the CTBS achievement test, the LTR st0-
'dents demonstrated performance superior to that of the LCR students.
This difference was most noticeable in the testing situations. Both
lower ability groups demonstrated relatively high success rates on
the individual units, with the LCR performance level within h oi the.
level of the LTR students. Unfortonately, this success rate (1(1 not
carry over to the reOew, post-, and retention Testing Situations.
Both grobps performed less well on these tests, and The LCR group
fell seven to. ten .points be thi of the LTR g,c:p, it appears that
allowing a student to progress at his own rate through the instructiona;
materials hada:positiveettecA on performance 'n the day-to-day situa-
tion, but did not:carryover to the testing situation. The higher
test performance .of-the LIR., group would indicate that. interaction with
a teacher during remediatiovhad a more positive effect on'lower-abitity
students than computer-remediation, plv:Ing great importance on the
nature of student- teacher relationships fo fewer ability students.
The indication that teacher interaction is more important for
lower ability students is further- reinforced. by the nonsignificant
differences in performance between .HCR and- HTR students, The high
ability students in this'study apparently mereable..to.work independently
without heavy reliance Upon the:techer: and to maintain'a high perfor
mance level. This would indicate that the provision of remedial assis-
tance via computer Would not.nave:.an..advee:seHeffect,.onthe course-.
perfc*Mance'oroVeinall..achievement-of:higher'.abj)itystudents
56
The norm-referenced CTBS achievement testing yielded data
which only partially agreed with the data from the criterion-referenced
tests developed in conjunction with the program. On the CTBS the CR
students performed better than the TR students at both ability levels.
A possible explanation-mightte'that'through personal characteristics,
inadvertent actions, or subtle voice inflections which could pervade
the student-teacher interaction, the teacher might unintentionally
focus upon the immediate'objectives of'the program. In other words,
the "teach to the test" phenomenon could enter into the teacher -pre-
sented remedial activity. In contrast, the computer treated all stu-
dents equally and provided exactly the'same remediation to all students
regardless of ability. These factors may have reduced the tendency
to focus on immediate objectives; allow better generalization to occur,
and resulted in better performance'by'the CR students on the norm-
referenced, broader-based achievement test.
Rate of movement. The data regarding the rate'at which the
different groups progressed through-the instructional materials indicate
that ability level was the primary determinant, not the'mode of remedia-
tion. The CR students completed'a'greater mean'number-of-units than the
TR students, but this-difference-was not statistically' significant.
Thus, remediation mode had little-effect on the students''rate of move-
ment through thelearning materials.
Student attitudes. Perhaps-the most important aspect -of the atti-
tude measurements is not the smallillagnitude'of the'prepost*gain, but the

57
high level of the posttest'scores. Regardless of the scores obtained
on the.pretest,-which-were.obviously positively skewed, it is apparent
that at the end of the.15 week period the students exhibited highly
positive attitudes toward both mathematics in general and CM1/individ-
ualized instruction in particular. The high pOsitive attitudes
toward the CMI program are especially noteworthy ire light of the fact
they were measured on the next-to-last day of the academic year.
Closer examination of the'CMI and-individualized instruction
subscales of the Brown questionnaire indicates that all median scores
increased from the initial-testing to the fthal testing except for
the TR students on.the CMI subscale. Their median score decreased. All
the students indicated that the the computer terminals was the
most exciting part of the program. Evidently, then,-the less extensive
use of the terminals-by the TR students led-to a reduction in their
:attitude toward the.CMI program: Another factor which may have contri-
buted to this situation is-that when-the TR-students failed a test,
they were required to tear the-paper-off of the teletype and take it
back to the classroom to'get help-from the teacher. 'Therefore, when
a student walked into the room with a long piece of teletype paper-
in his'hand everyone-in the clasp knew-he had failed a test. The CR
students were able to fail in privacy.
Effect on the Teacher
In this study, the HCR nciliTR students demonstrated equivalent
perfOrmahce levils-Which'were significantly higher thari the perforManc

58
levels of the LCR and LTR students. Within the lower ability groups,
teacher remediation appears to have had a more positive effect on
student achievement, indicating that the presence of a teacher is an
important factor in the provision of learning experiences for lower
ability students.
These observations offerimplications for thc recent movement
within the schocls toward a more flexible use of the time and talents
of classroom teachers. Since'hiclh ability.students.apparently can
work independently, receive remediation from a computer.if necessary,
and maintain an acceptable level of performance, it would seem that an
aide or intern could supervise the learning activities of those students
in the kind of program offered in this study. This would free the more
highly- skilled teacher to work individually with the lower ability
students who seem to.need their attention more The teacher could
focus more closely on identifying the particular learning difficulties
of the individual students and-the prescription of.learning experiences,
which could alleviate those difficulties,
The teacher who participated.in this study was not operating under
typical.conditions which would be:.present:inthe'usdal CMI classroom
application. The experimental teacher was only minimally involved
in the preparation.of the instructional'materials and remedial exercises
for the study. In the'usual situation the teacher would be involved
in the developmental activities; theimplementation,procedures
evaluation and reviSion'methods. 'Thus the usual
his work ,,load cut in half as did the
and the
teacher would not find
experimental teacher. However the

59
usual teacher, relieved-of the'mind,-numbing clerical duties which
consume so much evening and'weekend time; would be involved in the
professionally higher level developmental, prescriptive, and diagnos-
tic tasks for which he was trained: The teacher would be equally as
busy in a CMI situation as in a traditional program, but his energies
would be directed-toward those more professionally satisfying tasks
he is most competent to perform.
Economic Factors
Table 10 indicates that the cost per student instructional
hour of this study was $2.14. The immediate impression is that this
is an exorbitant cost and that such a terminal-oriented program is
far from feasible in a typical school system. It must be remembered,
however, that this was an "add-on" to the normal school program, and
since it involved only 70 students, the cost is, indeed exorbitant.
However because this research was designed to investigate an instruc-
tional system which might exist in the future, it will be necessary
to discuss the economic-factors surrounding the study in terms of the
future. To provide'a more'reasonable level of analysis, the calcula-
tions will be based'on 700 students rather than 70.
Two major assumptions underlie this cost analysis. The first
is that schools-will'continue present trends and implement pro-
grams of individualized instruction based on 'differing.student needs
and learning capabilities. The second assumption is that the two
remediation'modes are-equally effective inbringingabout'student learning.

60
In regard to the.first assumption; the'provision of a program
of individualized instruction should tend to increase the cost of
traditionally administered instruction (TAI). The teachers and all
the school facilities'would-need'to be provided to the students for
the same number of hours as atpresent, but to these fixed costs
must be added the'cost"of'developing'the instructional materials needed
to support a program-ofindividualized instruction. The costs incurred
by Palm Beach County in developing thematerials used-in-this study
amounted to $110'per unit:--When-multiplied'by the 57 units used in
the study, this cost'amounts'to'nearly $6300.
In a normal sitiation,'as'opposed'to a short-program like this
one, these costs-would be amortized-over a period oftime. Using the
standard five year life span of a textbook as the amorization period
and adding additional printing charges, an annual.costofapproximately
$1300 is realizeth. Dividing by 52,500 instructional hours provided the
700 students during the'study, it -is found that-an additional $.03 per
hours must be added to the-base cost'ofTAI in order to provide a
nonautomated individualized instruction program.
Recent U:S.*Office-of'Education.estimates place the cost of
elementary and secondary educa0on during the 1970-71 school year at
$.38 per student hour:(Kopstein. kSeideL 1969). TThus the cost
of basiC services plus the'softWare necessaryfor-a nonautomatpd
individualizedInStruction..prOgram for700studepts'Ould
perstudent hour.

61
Using the $.41 per hour as the basic cost of the teacher,
facilities, and'software; it is now possible to calculate the cost of
providing an individualized instruction-program supported-by a terminal-
oriented CMI system.- It should be -noted that the figure of $3.33 per
hour charged by the-FSU'CAI Center for the use of the IBM 1500 CAI
system is somewhat inflated.due*to a nonutilization charge. Stolurow
(1967) estimates that with student-use of the terminals for two
normal scho614-day shifts per day, the cost.of-the IBM-1500*could be re-
duced to $1.95 per hour. At that-rate,-the 3;750 hours required for
the program would-result in.computercharges of.$7;312. Adding this
figure to the'costs for-eight-part=time proctors-results'in an opera-
tional expenditure of'$13 312, yielding an hourly cost-of $.25. The
remaining developmental costsi-when-amortized-overfive years and
divided by-52 500 hours, amounttoless than one-half.cent per hour,
and may be disregarded. 'Thus, the-costof providing terminal- oriented
CMI in addition to-the individualized'program would'total $.66 per hour.
This increase in.cost can.only be'justified.by an increase in
student Performance. Since the CR students'in this study demon-
strated equivalent;.but.not-superior 'performance, this*cost overage of
60% cannot be'considered feasiOle'at the present-time; -However Pro-
jections of'presenteconomid trends'into-the'future indicate that'a'
changing pictureHmaybe emerging.
It is generally acknowledged that computing hardware costs are
decreasinvdpe'to..mass4roductiOn methods*d7technological advances.
At the sametimemoreoveri.::PeSollnel costs-areA5ing. For the

62
purpose of these projections,' it will be assumed that hardware cost
decreases will be balanced by personnel cost increases and the cost
of an individual ized Program -wi th terminal-oriented CMI capabilities
will remain constant at-$:66 per hour.
USOE estimates indicate the $.38 per hour cost of 1970-71. wi 1 1
increase to $.42 by 1974-75, a four-year increase of 10.5%. Assuming
this rate of increase to be constant and beginning with a 1970-71 cost
of $.41 per hour, projected costs 'of teacher administered individualized
instruction shbuld reach $.66 at 'about 1988. This is a conservative
date, however, due primarily to two factors. First, the figure of $:4-,
per hour for a nonautomated individualized instruction program assumes
that the teacher is the entire information management system an impossible
assignment. No individual teacher could possibly cope with the moun-
tain of prescriptive, diagnostic'; and evaluative data generated by an
individualized program-. Clerical or mechanical -assistance will be needed
to provide a management system, thereby increasing the costs of TAI at
a rate greater than 10.5%. Secondly, if a terminal-oriented CMI program.
was present in a school an aide or finterry (two or three of whom can
teacher unit)
vise the learning activities of many of the students leaving the master
teacher free to work with individual learning difficulties. An example:
a typical classroom adult/pupil ratio of 1 to 30 would require eight
teachers (not counting teachers for special areas such as .art and music)
to accommodate 240 students. If four teacher units were traded for eight
trained paraprofessionals, n adult/pupil ratio of 1 to 20 .could be

63
achieved with no increase in expenditure. A net reduction in the cost
of instruction should'tesult due-to more efficient use.of the higher-
paid teacher's time,.increased.frequency of pupil contact with adult
assistance -and.provision.of remediation by computer.
If'the assumptions.which.have.been made are.true, and if the
projections made.herein based.on'1970-71 dollars and not considering
inflation are accurate, the-cost of .a, teacher administered individ-
ualized program.and the-cost of an individualized program supported by
a terminal-oriented-CMI system should'become-equal near the year
1980.
The projections.just presented.are based on the.very important
second assumption'of equal effectiveness of teacher and computer reme-
diation and if the data from this study are applied in terms of the
performance of the TR students compared to the CR students, the assump-
tion appears valid: However; when.the students in the.two remediation
modes are subdivided according to ability, the data do not meet the
assumption. Therefore it will.be necessary to modify.the above projec-
tions with the phrase"for.high ability students."
differential between the LIR andl_CR students
The performance
would.indicate.the provision
of computer remediation to students performing below grade
not be feasible.
level would
.7 grades below
grade level on the'CTBS achievement.test. It is obvious that further
needed to determine at-what ability level the computer remedia-
The lower ability
research is
students-in this study averaged
tion would' become feasible. Replication. of this research in other
64
academic areas,with.other students is needed to determine if these
results are related only to these students and to.mathematics,
Conclusions
Considering both'quantitative data and information of an observa-
tional nature,-.the following conclusions arise from this study:
I Computer remediation allowed higher ability students to maintain
acceptable performance.standards, but teacher remediation had a
more positive effect on the lower ability students..
2. The students exhibited.greater'pleasUre with their mathematics
class due to the absence of daily lectures and homework.
The students developed closer relationships with the teacher.
. Mode of remeelation had no effect on the 'ate at which the students
moved f!.rough the instructional materials. The determining factor
here was ability level.
Due to extremely high pretest levels, the students did not exhibit
significant attitude gains. However-, highly positive attitudes toward
mathematics in general; CMI, and individualized instruction were exhi-
bited at the ,end` of the studY. The CR' students demonstrated more posi-
tive attitudes toward the CMI program in particular than did the TR
students.
The teacher developed a better rapport with his students and was able
to work more easily with them'in the dissolution of their learning
difficulties with the instructional materials.
The teacher found'more.personal*satWaction with the individualized
situation than'in the traditional lecture and demonstration setting.
-T

65
8. Freed from clerical tasks-and-with the needed assistance in managing
the individualized program'; ",e teacher was able to perform at a
higher level-professionally.
9. A terminal-oriented-CMI system.is not-economically feasible at
present in.a typical public school system. Barring a significant
breakthrough in terminal and-communication costs, 'the earliest
date-of feasibility' for high ability. students appears to be about
1980.
10. Until educational.research-discovers better methods-of alleviating
the learning-difficulties of students.performing below.grade level,
the economic-utility of providing computer remediation for such
students is quastinnable.
REFERENCES
Aiken, L.R. Jr. Attitudes toward mathematics.* Review'of EducationalResearch, 1970, 40(4), 551-596.
Atkinson, R. Computerized instruction, and the learning process. In.
R. Atkinson & H. Wilson-(Eds;); Computer-assisted instruction:A book of.readings.. New York:.Academic Press :1969. Pp. 3-14.-
Brown, B.R. An instrument forthe measurement of expressed attitudetoward.computer,assisted instruction:-In Semi-Annual ProgressReport, Experimentation.with Computer-Assisted Instruction,Project No 5-85-074, prepared by H.E. Mitzel, et-al., December31, 1966.
Bundy, R.F." Computer-assisted.instruction--where.are we Phi DeltaKappan, 1968,.49, 424-429.
Bushnell, D.D. 'Applications of °computer° technology to.the improvementof learning: In D..Bushnell & D. Allen-(Eds.)',-The computer inAmerican Education. New.York: John Wiley & Sons 967: Pp. 59-76.
California. TestBureaU;-. Comprehensive jests.of-BaSio'Skills, FormQ3.
Monterey; CalifOrrlia.:,,McOraw.'AillAoOk.COmpany,;1968.
Campbell, D. & Stanley, -J. ,Exper=imental and-quasiL.experimental designs
for research. Chicago:Aland McNally &Company, 1963.
Cooley, W. & Glaser,11. An information and management system forAndividuallY'prescribed instruction: In R.. Atkinson & H. Wilson"(Eds:);.ComputeNassisted.instruction:*A book.of readings. New
York: Academic Press,1969: PP. 95-117.
Dutton,14.H.;.& Bium;.M:P:..The.measurement.of'attltudes towardarithmetic:with.a.Likert.-tYpe'test:-Elementary.School Journal,1968, 68 259-264.
Ferguson, R.L. Computer,assiste&criterion-referenced:testing. Workingpaper, Learning Research' and 'Development. Center, -University ofPittsburgh, 1970.
Flanagan J...The Tole-of the computer-in PLAN.-Journal'oData Processing;,February,'1970,
Educational

67
Geddes, C. & Kooi ; B: An instructional Management system for classroom
teachers -Elemental Sc hool Journal ; 1969 , 69 , 337-345,
Hansen, D. The role of computers in education in the 70 ' s . Technical
MemoranduM Number- 15, CAI Center; Fl orida State University, 1970a.
Hallsen; D.. Current research development in computer-assisted instruction.
Technical Memorandum 'Number .17 , CAI Center, Fl orida State University
19706.
Hansen; D. , Johnson ; B.; Durall , E., Lavin B., & McKune , L. End of
Project:Report ; July ; 1968tJund 30, 1971: A rural county computer-
relAted instructional technology: project.: CAI Center, Florida State
University, 1971.
'Hansen, D., WNei H., Brown , :B. King, A. & Rivers, L. Annual Report :
January 1 :1969 'through December 31; 19b9, CAI Center , Florida
State' University, 1970.
Hansen , D., Brown , B., 0 'Nei 1 , H., Merrill, P . , & Johnson, B. Annual
Report : J a n u a r y ] ; 1970 through December 31 , 1970, CAI Center,
Florida State University, 1971.
Kennedy , W. A follow -up normative study of Negro intelligence andachi evement: .Monoanaphs -of 'the -SocIttEfor -Research in Child
Development, 1969, 34, (2 , Whole .Numbe; 126) .
Kopstein , F., & Seidel, R. Computeradministered instruction versus
traditionally administered instruction: Economics': In R. Atkinson
& H . Wi 1 son ( Eds ; ) ; ComputeNassisted instruction : 'A 'book-of readi .
New, York : Academi c 'Press , 1969; Pp. 327-362.
Lawyer, R.M. An investigation of selected instructional strategies in
an undergraduate computerAmanaged instruction. course. Techni cal
Report Number 19; CAI Center ; Florida 'State University, 1971.
Palm Beach County -Board *of Publ c Instruction ; Mathematics Curriculum
EIE Project, Secondary Curri cul um DevelopMent ; Frank 'Mil ler, Director,
1969.
1
Rogers', J. Dear computer ; how: am I 'doi ngr PARADE: 'TheSunday Newspaper
'Magazine, .Fobruary 7, 1971 , 10-13.
Silberman ; N. Computer,managed instruction.. : Use- of 'a, computer to
noni tor student performance: Engineering Education ;-1969 -69, 484-486.
Stolurow,, L. "Computer,assisted instruction (CAI) " Unpublished paper,
Harvard University, 1967, 56 as quoted i n Oettinger , A. Run ,
computer , run : The mythology of educational innovation: Cambri dge,
Mass . :Harvard University Press, 1969, Pp. 191,
71

68
Suppes, P. On using computers-to individualize instruction. In
D. Bushnell Si.D..Allen'(Eds:),-The computer-in-American education
New York: Johnlliley1 Sons, 1967; Pp. 11-24.
Suppes, P. & Jerman,-M.-CAI at-Stanford:'.Educational Television
International, 1969, 3, 176-179.
Tuttle, J.- The historical development of.computer capabilities which
permitted-the'use'of'the computer.as an educational-medium in the
United-States.from.1958 t9'1968;-with. implications of trends.
Unpublished doctoral dissrtation; New York University, 1970.