ed 018 219
TRANSCRIPT
R E P O R T RESUMESED 018 219 PS ODD 276TEACHERS' BELIEFS, CLASSROOM ATMOSPHERE AND STUDENT BEHAVIOR.FINAL REPORT.BY HARVEY, 0.J. AND OTHERSCOLORADO UNIV., BOULDER, EXTENSION DIVISIONREPORT, NUMBER 0E0-1274 PUB DATE 28 JUL 6?EDRS PRICE MF$0.50 HC$3.04 74Pe
DESCRIPTORS *CLASSROOM ENVIRONMENT, *TEACHER ROLE, *ACADEMICPERFORMANCE, STUDENT BEHAVIOR, *FAMILY ENVIRONMENT, FAMILYLIFE, PIRENT ATTITUDES, SURVEYS, BEHAVIOR RATING SCALES,BELIEFS, OBSERVATION, EARLY CHILDHOOD EDUCATION, *INTERACTIONPROCESS ANALYSIS, TEACHING METHODS, ENVIRONMENTAL INFLUENCES,LOW ACHIEVEMENT FACTORS, COLORADO: HEAD START, THIS I BELIEVETEST, CONCEPTUAL SYSTEMS TEST,
THIS FINAL REPORT CONSISTS OF 3 SECTIONS. ITS CONCERN ISWITH THE INTERACTION OF HOME AND CLASSROOM ENVIRONMENTS ONTHE ACHIEVEMENT OF LOWER SOCIOECONOMIC LEVEL CHILDREN WHOATTENDED OR WERE ELIGIBLE TO ATTEND THE 1965 COLORADO HEADSTART PROGRAM. SECTION 1 REPLICATES AN' ELABORATES A STUDY ONTHE EXISTENCE OF CONCRETE AND ABSTRACT BELIEF SYSTEMS INTEACHERS AND ON HOW SUCH BELIEF SYSTEMS EFFECT CLASSROOMATMOSPHERE. THE SAME ELEMENTS WERE INVESTIGATED IN THIS STUDYIN ADDITION TO THE PRIMARY OBJECTIVE OF OBSERVING THE EFFECTOF THE 2 BELIEF SYSTEMS ON STUDENT PERFORMANCE. THE
HYPOTHESIS THAT THE GREATER THE ABSTRACTNESS OF THE TEACHER'SBELIEF SYSTEM: THE GREATER WOULD BE HER RESOURCEFULNESS, THELESS HER DICTATORIALNESS AND PUNITIVENESS, AND THE BETTER THEACADEMIC PERFORMANCE OF THE PUPILS WAS DEMONSTRATED. SECTION2 IS A FAMILY' SURVEY OSED TO DETERMINE FAMILY ATTITUDES ANDVALUES WHICH WERE THEN ANALYZED TO SEE IF AND HOW SUCHATTITUDES RELATED TO THE CHILD'S PERFORMANCE IN HEAD STARTAND IN PUBLIC SCHOOL. SECTION 3 PRESENTS THE CHUDREN'SPERFORMANCE SCORES OBTAINED DURING THEIR ATTENDANCE IN PUBLICSCHOOL AT THE PRIMARY LEVEL. THE TEST MATERIALS WERE MOVIEFILMS OF 13 BRIEF SITUATIONS RELEVANT TO SOME ASPECT OF THECHILD'S BEHAVIOR AND ON WHICH HE WAS ASKED TO COMMENT. THESCORES OF THESE TESTS WERE THEN COMBINED WITH THE INFORMATIONFROM SECTIONS 1 AND 2 TO SHOW THE RESULTS OF THE INTERACTIONOF THE 3 VARIABLES OF TEACHER, PUPIL, AND PARENT ON PUPILPERFORMANCE. (WD)

- -
px4/4/F, L U. f. DEPARTMENT OF HEALTH, EDUCATION& WELFARE
OFFICE OF EDUCATIONott RelozrTHIS DOCUMENT HAS BEEN REPRODUCED EXACTLY AS RECEIVED FROM THEPERSON OR ORGANIZATION
ORIGINATING IT. POINTS OF VIEW OR OPINIONSSTATED DO NOT NECESSARILY REPRESENT OFFICIAL OFFICE OF EDUCATIONPOSITION OR POLO,
Teachers' Beliefs, Classroom Atmosphere and Student Behavior1
Kr
University of Colorado0. J. Harvey 2 Misha Prather
University of Colorado
c\J
COr-I
wB. Jack WhiteUniversity of Utah
and James K. HoffneisterUniversity of Colorado
Footnotes
1. The collection of these data and part of their analy-ses were supported by the Office of Economic Opportunity,Contract 0E0-1274 with the Extension Division of the Uni-versity of Colorado.
2, Harvey's participation in the data collection pert ofthis study occurred while he was a Fellow at the Center forAdvanced Study in the Behavioral Sciences. His subsequentparticipation has been supported by a Career DevelopmentAward from the National Institute of Mental Health.

Harvey, White, Prather, Alter and Hoffmeister (1966)
found recently that preschool teachers of concrete and ab-
stract belief systems differed markedly in the classroom
environments they created for their students. Teachers
representing System 4, the most abs=act belief system
treated by Harvey, Hunt and Schroder (1961) differed from
representatives of System 1, the most concrete mode of
functioning characterized by Harvey %I al. (1961), in
what was presumed to be an educationally desirable dir-
ection on all 26 dimensions of classroom behavior on
which they were rated.
The difference was statistically significant on 14
dimensions: System 4 teachers expressed greater warmth
toward children, showed greater perceptiveness of the chil-
dren's wishes and needs, were more flexible in meeting the
interests and needs of the children, were more encouraging
of individual responsibility, gave greater encourageent to
free expression of feelings, were more encouraging of crea-
tivity, displayed greater ingenuity in improvising teaching
and play materials, invoked unexplained rules less frequently,
were less rule oriented, were less determining of classroom
and playground procedure, manifested less need for struc-
ture, were less punitive, and were less anxious about being
Observed.
A cluster analysis of these 14 dimensions (Tryon &
Bailey, 1965, 1966) yielded the three factors of resource-
fulness, dictatorialness and punitiveness. System 4 tea-
chers were more resourceful, less dictatorial and less puni-
tive than System 1 teachers.

1010i,mIMA4000IBPNIVIWHMONWIO.W7bFWOVAMWrt.,...4.,,,,Trt:;Sa-apA.bmrmgeoummam.mwwp.-
2
While consistent both with our theoretical stance and a
wide range of other differences found between the more con-
cretely and the more abstractly functioning ine4viduals (e.g.,
Adams, Harvey & Heslin, 1966; Harvey, 1963; 1966; Harvey &
Ware, 196/; Ware & Harvey, 1967; White & Harvey, 1965), the
finding that teachers' belief systems affect their overt be-
havior in the classroom does not bear directly upon the more
educationally significant question of the influence of tea-
chers.; beliefs and behavior upon the learning and performance
of their students. It is with this latter question that the
present study is concerned.
More specifically, the main aim of this study was to
assess the relationship between students' performance and
teachers' resourcefulness, dictatorialness and purrit.f.ver-3s.
In addition, the study provided a test of the replicability
of the earlier findings that concrete and abstract teachers
differ in the kinds of classroom behavior they manifest.
The general expectancies were that teachers of more con-
crete belief systems would display less resourcefulness, more
dictatorialness and more punitiveness in the classroom than
the more abstract teachers, as found in the previous study
(Harvey, et alq,1966); and that greater abstractness, greater
resourcefulness, less dictatorialness and less punitiveness
on the part of the teacher would be associated with more ed-
ucationally preferable performances of the children.

Method
3
Concrete vnd abstract teachers of kindergarten and first
grade were rated on the 14 dimensions found by Harvey et a/.
(1966) to discriminate significantly between concrete and ab-
stract teachers. Their students were rated, as a class, on
a specially constructed 31-item rating scale.
Teacher Rating Scale. This instrument, while providing
the necessary information for a test of the replicability of
the earlier results (Harvey, et al., 1966), was intended pri-
marily ari a measure of teachers' overt resourcefulness, dicta-
torialness and punitiveness. It consisted of the 14 items
from which these three factors were derived: (1) warmth to-
ward the children, (2) perceptiveness of the children's needs
and wishes, (3) flexibility in meeting the needs and interests
of the children, (4) maintenance of relaxed relationships
with the children, (5) encouragement of individual responsi-
bility, (6) encouragement of free expression of feelings,
(7) encouragement of creativity, (8) ingenuity in improvising
teaching and play materials, (9) use of unexplained rules,
(10) rule orientation, (11) determination of classroom pro-
cedures, (12) need for structure, (13) punitiveness and (14)
anxiety induced by the observers' presence.
Student RatimScale. This measure of student behavior,
which provided the major dependent variables of this study,
consisted of the following items: (1) overall adherence to
the teacher's rules, (2) immediacy of response to the rules,
(3) adherence to the spirit: (vs. the letter) of the rules,
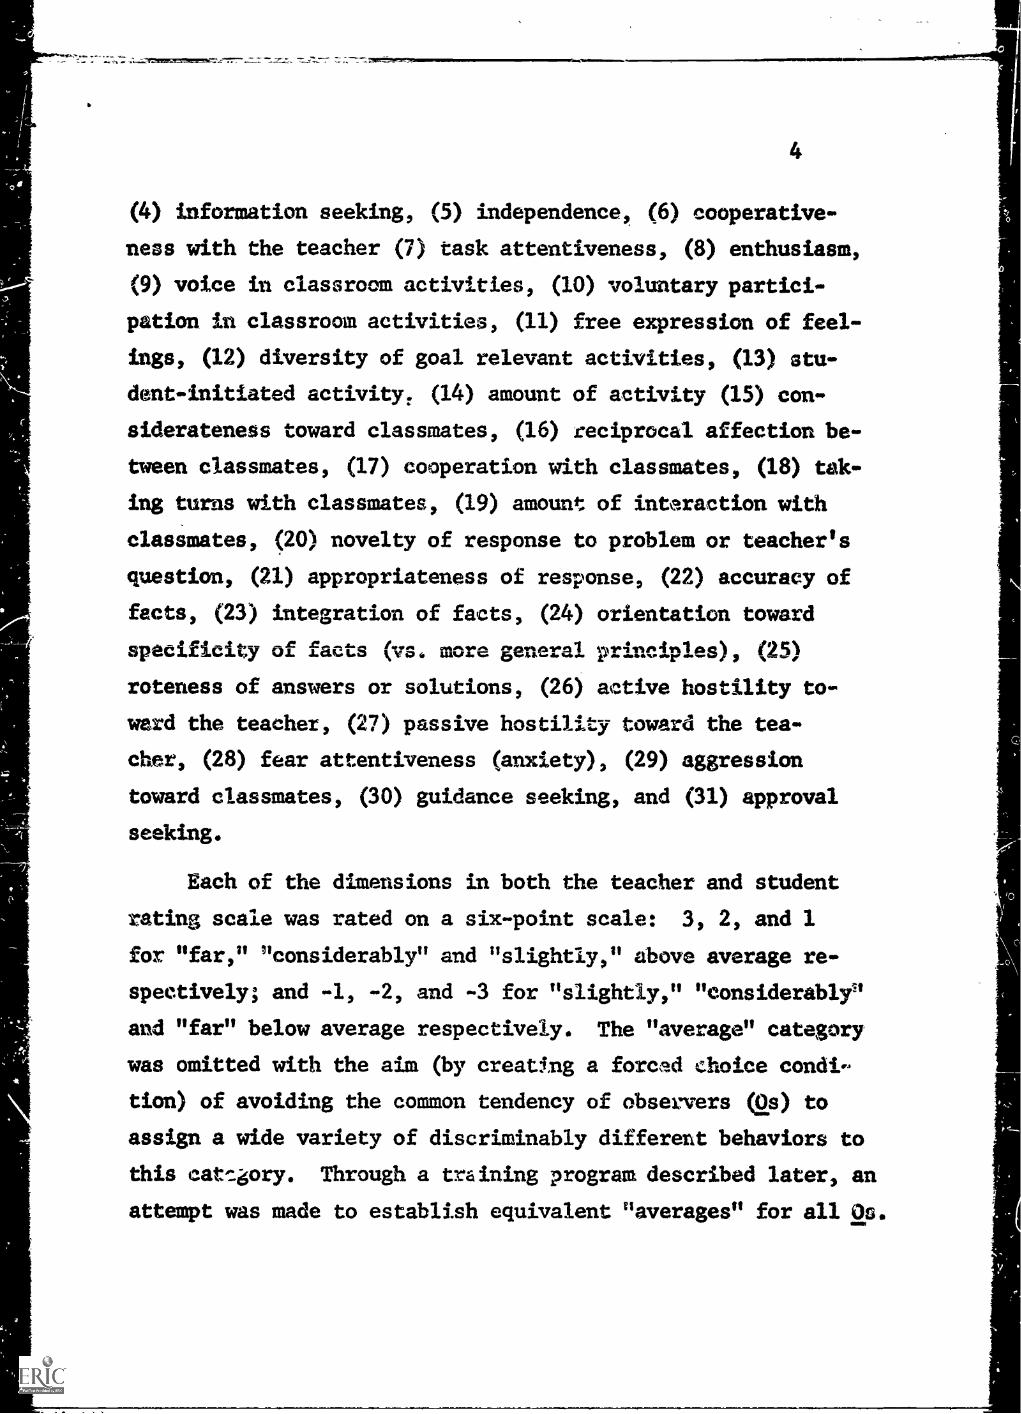
(4) information seeking, (5) independence, (6) cooperative-
ness with the teacher (7) task attentiveness, (8) enthusiasm,
(9) voice in classroom activities, (10) voluntary partici-
pation in classroom activities, (11) free expression of feel-
ings, (12) diversity of goal relevant activities, (13) stu-
dent-initiated activity, (14) amount of activity (15) con-
siderateness toward classmates, (16) reciprocal affection be-
tween classmates, (17) cooperation with classmates, (18) tak-
ing turns with classmates, (19) amount of interaction with
classmates, (20) novelty of response to problem or teacher's
question, (21) appropriateness of response, (22) accuracy of
facts, (23) integration of facts, (24) orientation toward
specificity of facts (vs. more general principles), (25)
roteness of answers or solutions, (26) active hostility to-
ward the teacher, (27) passive hostility toward the tea-
cher, (28) fear attentiveness (anxiety), (29) aggression
toward classmates, (30) guidance seeking, and (31) approval
seeking.
Each of the dimensions in both the teacher and student
rating scale was rated on a six-point scale: 3, 2, and 1
for "far," "considerably" and "slightly," above average re-
spectively; and -1, -2, and -3 for "slightly," "considerably"
and "far" below average respectively. The "average" category
was omitted with the aim (by creating a forced choice condi-
tion) of avoiding the common tendency of observers (2s) to
assign a wide variety of discriminably different behaviors to
this cat gory. Through a training program described later, an
attempt was made to establish equivalent "averages" for all Os.

Sublests
Since the present study was part of a larger investigation
concerned with the effects of prior participation in Head Start,
classrooms were selected for observation if they contained At
least one kindergarten or first grade student who had gone to
Head Start nine months earlier (i.e., during the summer of 1965)
and who was attending public school for the first time. These
criteria yielded 118 classes, 92 kindergarten and 26 first grade,
in 18 rural and urban Colorado school districts. The 92 kin-
dergarten classes were taught by 64 teachers while the 26 first
grade classes were taught by 26 teachers. Each of the 118
classes, with an average of 26 students, was observed and rated
as a class, not as individual students, on the student rating
scale.
Of the 90 teachers, 67 completed the "This I Believe" (TIB)
Test and 66 completed the Conceptual Systems Test (CST). Both
the TIB and CST are tests of concreteness-abstractness of be-
lief systems, the former being based upon sentence completions
and the latter upon response to objective items.
The "This I Believe" (TIB), Test. Thi.s test, developed
specifically as a measure of concreteness-abstractness of con-
ceptual or belief systems (e.g., Harvey, 1964, 1966; Harvey,
et al., 1966; Ware & Harvey, 1967; White & Harvey, 1965), re-
quires S to indicate his beliefs about a number of socially and
personally relevant concept referents by completing in two or
three sentences the phrase "This I believe about .0
the blank being replaced successively by one of the referents.
6
tk.
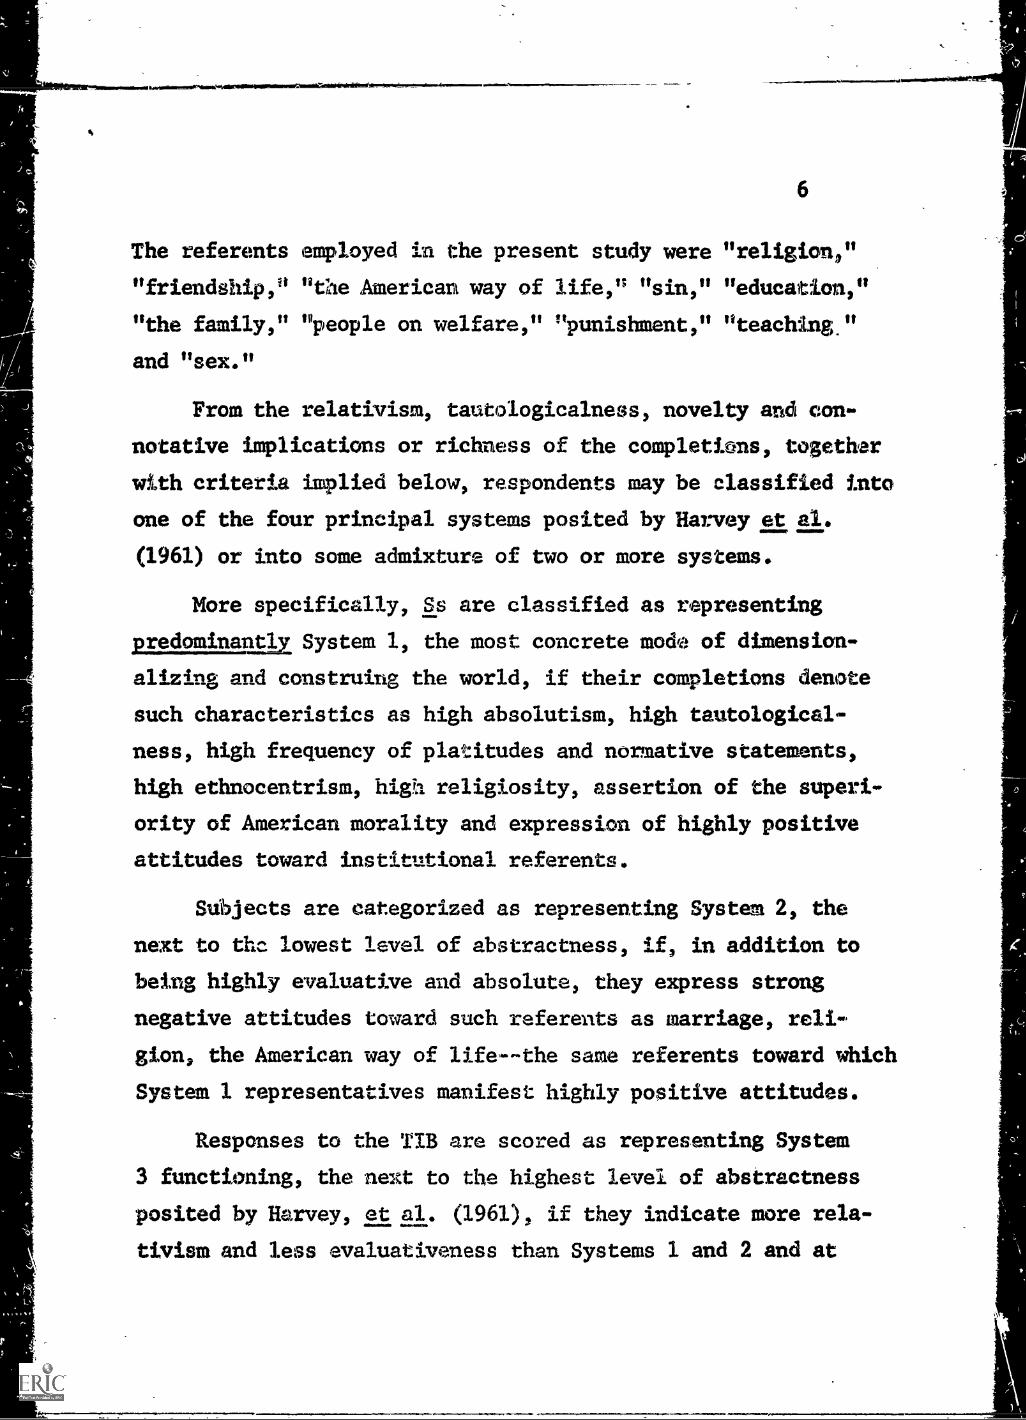
The referents employed in the present study were "religion,"
"friendship,'' "the American way of life," "sin," "education,"
"the family," "people on welfare," "punishment," "teaching."
and "sex."
J From the relativism, tautologicalness, novelty and con-
notative implications or richness of the completions, together
with criteria implied below, respondents may be classified into
one of the four principal systems posited by Harvey et al.
(1961) or into some admixture of two or more systems.
More specifically, Ss are classified as representing
nredominaetil System 1, the most concrete mode of dimension-
alizing and construing the world, if their completions denote
such characteristics as high absolutism, high tautological-
ness, high frequency of platitudes and normative statements,
high ethnocentrism, high religiosity, assertion of the superi-
ority of American morality and expression of highly positive
attitudes toward institutional referents.
Subjects are categorized as representing System 2, the
next to the lowest level of abstractness, if, in addition to
being highly evaluative and absolute, they express strong
negative attitudes toward such referents as marriage, reli
gion, the American way of life--the same referents toward which
System 1 representatives manifest highly positive attitudes.
Responses to the TIB are scored as representing System
3 functioning, the next to the highest level of abstractness
posited by Harvey, et al. (1961), if they indicate more rela-
tivism and less evaluativeness than Systems 1 and 2 and at
7
the same time express strongly positive beliefs about friend-
ship, people and interpersonal relations.
System 4 functioning, the highest of the four levels
of abstractness, is indicated by TIB responses that imply a
high degree of novelty and appropriateness, independence
without negativism, high relativism and contingency of
thought, and the general usage of multidimensional rather
than unidimensional interpretive schemata.
Of the 67 teachers who completed the TIB, 50 were clas-
sified as System 1, none was categorized as System 2, four
were scored as System 3, eight were classified as weak in-
stances of System 4, and five were scored as admixtures of
Systems 1 and 3. In the analysis involving the TIE the ad-
mixtures were omitted; Systems 3 and 4 were combined into
the more abstract group; and System 1 teachers were treated
as the more concrete group. Of,the 50 concrete teacaers,
30 taught 44 classes of kindergartners and 20 taught 20
classes of first-graders. Seven of the 12 abstract teach-
ers taught 11 kindergarten classes while the other five ab-
stract teachets taught five first-grade classes. Thus it
should be noted that while both concrete and abstract first
grade teachers each taught only one class, kindergarten
teachers, both concrete and abstract, each taught an approxi-
mate average of 1 1/2 classes.
The Conceptual astern! Test (CST). All but one of the
67 teachers who completed the TIB Test also completed the ob-
jective measure of belief systems, the CST. From a pool of

_=sowt s...~smorst- txmMvms~waNIMIL
8
several hundred items and numerous runs through Tryon's
program of cluster analysis (Tryon & Bailey, 1965; 1966)
seven factors have been extracted and replicated which are
theoretically consistent with the major characteristics of
the four principal belief systems posited by Harvey, et. al.
(1961). These factors as we have tentatively labeled them
(Harvey, 1967) are (1) Divine Fate Control, (2) Need for
Simplicity-Certainty, (3) Need for 'structure- Order,
Distrust of Social Authority, (5) ,riendship Absolutism,
(6) Moral Absolutism, and (7) General Pessimism.
While the CST was administereJ in its entirety, for
purposes of this study scores were derived for only the three
clusters of Divine Fate Control, Need for Simplicity-Certainty
and Need for Structure-Order. The combined scores from these
three factors were treated as our second measure of a tea-
cher's concreteness-abstractness. Representative items com-
prising each of the three of these component factors include:
1. Divine Fate Control (an) is assessed by such items
as "There are some things which God will never permit man to
know " "In the final analysis, events in the world will be
in line with the master plan of God," and "I believe that
to attain my goals it is only necessary for me to live as
11
Cod would have me live."
2. Need for Simplicity-Certainty (NS -C) is inferred from
response to such state ents as "I dislike having to change my
plans in the middle of a task," "It is annoying to listen to
a lecturer who cannot seem to make up his mind as to what he
really believes," and "A group which tolerates extreme dif-
ferences of opinion among its own members cannot exist for long."

9
3. Need for Structure-Order (NS-0) is derived from such
items as "I don't like to work on a problem unless there is a
possibility of coming out with a clear-cut, definite answer;"
"I don't like for things to be uncertain and unpredictable,"
and "I like to have a place for everything and everything in
its place."
Training of observers and assessment of inter-observer
reliability. Each of the nine Os, all females, participated
in six training sessions during which six teachers and their
classes were observed and independently rated. Each obser-
vation session was followed by a lengthy group discussion
among the Os and other staff members aimed at increasing the
reliability of the ratings through improving observation
techniques and clarifying and standardizing meaning and
usage of the rating categories.
Inter-judge reliability for the nine Os was assessed for
both the teacher and student rating scales at three points:
immediately following the last training session, one week
after field observations began, and immediately preceding
completion of the experimental observations, 2 weeks later.
The mean correlation between every pair of judges for the
teacher scale was .78, .76 and .70 for the three periods
respectively; the corresponding reliability values for the
student scale were .84, .75 and .77.
Procedure. Each teacher and her students were observed
in the classroom on a single occasion by a single 0 for ap-
proximately two hours. All teachers had been advised earlier

10
by their principals of the dates on which they were to be
observed.
Observation occurred during normal classroom activities
on\a day free of special events in order to render the con-
ditions of observation as comparable as possible across
classrooms. The 0 arrived before class, introduced herself,
explained (with the aim of allaying the teacher's apprehen-
sion and fostering her cooperation) that the purpose of
the visit was to gather examples of good teaching procedure
that could be utilized as bases for future teacher training
programs, and requested that she be allowed to observe while
remaining as inconspicuous as possible in order to minimize
the effects of her presence upon the children. To further
O's unobtrusiveness and simultaneously to increase the lik-
lihood of both the teacher and her students behaving in
their usual fashion, each teacher was asked not to converse
with 0 during the observation period.
The teacher and her class were rated by the same 0,
the students being observed and rated first as independently
as possible of the teacher's behavior. This procedure was
aimed at minimizing the contamination between the dependent
and independent variables likely to result from the students
and teacher being rated by the same 0. Extensive pretesting
indicated that this procedure, of having the 0 first concen-
trate on and rate the behavior of the students as a class
before focusing on the teacher, yielded a relationship be-
tween student and teacher ratings that was no higher than
that between separate ratings of the teacher and her students

11
by different judges. In fact, the evidence indicated clearly
that while the use of a single 0 for both the teacher and
her students may have produced contamination, at the same time
it produced seemingly more valid ratings than those yielded by
the practice of one judge observing only the teacher while the
other 0 noted only the responses of the children. Thus the
degree of contamination inherent in the method of observa-
tion we employed appears to be preferable to the loss of val-
idity that results from attempts of 0's to rate the behavior
of the teacher and her students without the use of the other
as a referent.
In rating the children, care was exercised to rate the
class as a whole and not to give inordinate weight to a small
minority by concentrating on the behavior of a single child
or a few children.
Results
Tests of Assumptions
Before analyzing the effects of teachers' overt behavior
upnn students' performance, it was first necessary to test
two basic assumptions: (1) that the 14 items of the teacher
rating scale would yield the three factors of resourcefulness,
dictatorialness and punitiveness, as they had in the earlier
study (Harvey, et al., 1966); and (2) that variations in the
concreteness-abstractness of the teachers' beliefs would lead
them to score differently on these three behavioral factors.

12
The validity of the first assumption was demonstrated
by the results of a factor analysis of the teacher rating
scale by Tryon's method of cluster analysis (Tryon & Bailey,
1965; 1966) which yielded Lhe three anticipated clusters.
Resourcefulness was comprised of four behavioral items.
They, together with their factor leadings (represented by
the values in the parentheses) were: utilization of physical
resources (.77), diversity of simultaneous activities (.77),
encouragement of creativity (.72) and ingenuity in improvising
teaching and play materials (.71).
Dictatorialness contained seven items; need for struc-
ture (.90), flexibility (-.90), rule orientation (.86), en-
couragement of free expression of feelings, (-.84) , teacher
determination of classroom procedures (.81) and the use of
unexplained rules (.70).
Punitiveness was based on three items: warmth toward
the children (-.86), perceptiveness of the children's needs
and wishes (-.85) and punitiveness (.77).
The second assumption also proved to be warranted.
Teachers classified on the basis of the TIB as being concrete
were significantly less resourceful (t=4003, 2<.001), sig-
nificantly more dictatorial (t=1067, 2<.05), and were more
punitive, although not significantly more, (t=1.05, p<.10)
than teachers classified as abstract. NbreOver, the abstract-
ness measure from the CST correlated significantly positively
with teacher resourcefulness (r=.37, 2.005), and significantly
negatively with both teacher dictatorialness (r=-.19, 2.05)
and punitiveness (r=-.19, 2<.05). These results, through
replicating the more essential findings of our earlier study

13
(Harvey, et al., 1966), take it clear that variation in the
concreteness-abstractness of teachers' beliefs generates .---
theoretically consistent and predictable parallels in the
overt behavior of these individuals. Thus an examination of
the effects of teachers' beliefs and behavior upon their stu-
dents, the major concern of this study, becomes appropriate.
Concreteness-Abstractness of Teachers Beliefs and Student
Performance.
Factor Analysis of the Student. Raci.rIg Scale. In order
to extricate the more generic dimensions encompassed within
the 31-item student rating scale and thus enhance the co-
herency of the presentation of results, the student rating
scale was factorized by Tryon's method of cluster analysis
(Tryon & Bailey, 1965; :1966) and the resulting factors re-
lated to variation in teachers' beliefs and overt behavior.
Seven factors were derived from the student rating
scale. The first cluster, termed cooperation, was com-
prised of five items, which with their factor loadings
were: immediacy of response to rules (.91), overall ad-
herence to teachers' rules (86), child-sustained activity
(.68), cooperativeness with teacher (.57), and adherence to
the spirit of the rules (.55). The second factor, which
centered around student involvement, consisted of eight
items: enthusiasm (.89), voluntary participation in class-
room activity (.82), free expression of feelings (.78),
voice of students in classroom activity (.78), independence
(.76), information seeking (.72), insecurity (-.66) and task
attentiveness (.63). The third factor, labeled activity level,
14
was derived front two items: amount af activity (.81)
and diversity of goal-relevant activity (.81). The
fourth factor, nurturance senekina, contained two items:
guidance seeking (.68) and approval seeking (.59).
The fifth factor, termed achievement level, included
three items: accuracy of facts (.81), appropriateness of
solution (.80) and integration of facts (.71) . The
sixth factor, helpfulness, was comprised of four items:
consideratenss toward classmates (.79), cooperativeness
with classmates (.71), taking turns (.56) and aggression
(-,.49). The seventh cluster, referred to as concreteness
of response: contained three items: rcteness of answers
or solutions (.88), orientation toward specificity of
facts (.71) and novelty of answer or solution (-.56).
Four of the items from the student rating scale were
not included in any of the seven clusters: amount of
interaction, reciproc:11 affection, passive and active
hostility. Results relating to these four items will
not be reported.
TIB Classification and Student Performancei Com-
parisons were made between the 54 classes taught by the
50 teachers classified by the TIB as being concrete and
the 16 classes taught by the 12 teachers on each of the
seven factors derived from the student rating scale.
As indicated in Table 1, students of more abstract
teachers, in comparison to their counterparts, were sig-
nificantly more involved ia classroom activities,
g....1111i0.Table 1 About klere

15
more active, higher in achievement and less concrete in their
responses. They were also less nurturant seeking, more cooper-
ative and more helpful, but not significantly more, than stu-
dents of concrete teachers.
CST Factors and Student Performance. Teachers scores on
the abstractness measure from the CST and on each of the three
factors going into this measure were correlated with each of
the seven factors from the student rating scale. These rela-
tionships are presented in Table 2.
6.1.H..1 -"vmm.
Table 2 About Here
The CST measure of abstractness related significantly to
every one of the student performance factors. Greater abstract-
ness of the teacher was accompanied by greater involvement,
greater cooperation, more activity, less nurturance seeking,
higher achievement, greater helpfulness and less concreteness
on the part of the students.
While all three of the factors constituting the measure
of teacher abstractness correlated in the predicted direction
with tprc^rman,. of the children, the teachers' need for struc-
chers' scores on the behavioral factors of resourcefulness,
all abstractness.
divine fate control, need for simplicity-consistency and over...
ture-order correlated the highest and most consistently. In
in-
fluence on the performance of the children than her belief in
fact, the teacher's need for structure-order had greater in-
Teachers' Overt Behavior and Student Performance. Tea-
dictatorialness and punitiveness were correlated with the
seven student performance clusters, the results of which are
included in Table 3..=Table 3 About Here

16
The resourcefulness of the teacher correlated sig-
nificantly positively with student cooperation, involve-
ment and activity and significantly negatively with the
concreteness of students' responses.
The teachers' dictatorialness correlated signifi-
cantly negatively pith the students' cooperation, involve-
ment; activity, achievement and helpfulness and signimi
ficantly positively with students' concreteness responses.
Teachers punitiveness correlated significanity nega-
tively with student cooperation, involvement, activity,
achievement and helpfulness and significantly positively
with the concreteness of the students responses.
Nurturance seeking was the only one of the seven
student performance clusters that did not relate sig-
nificantly to any one of the teacher behaviors.
Discussion
By replicating the findings of our earlier study
(Harvey, et 4,21966), these results make it clear that
the concreteness-abstractness of teachers' belief systems
affect their overt resourcefu9mess, dictatorialness and
punitiveness in the classroom. In addition, the results
of the present study allow the inference that not only
does the abstractness of teachers' beliefs influence their
own classroom behaviors it also affects the performance
of the students themselves.
The obtained differences betweert concrete and abstract
teachers probably world 7.1a..7e been accentuated had the
group of more abstract teachers been comprised only of
17
aear instances of System 44 tfistead daefiat thottfteed
together with cases of System otre dontihod oith c1 a*
instances of System 4 to constitute the abstract group
in this study. Yet, if our experiences from the sarlier
(RTrvsy, at al,, 1966) and the present study are typical,
a large sample of teachers would be necessary to yield
an adequate number of clear cases of System 4. Of the
292 teachers to whom we have administered the TIB, only
18, or six per cent, have been classified as System 4,
not all of which were ideal cases. While strongly sug-
gesting that in terms of absolute numbers few teachers
operate at the System 4 level, it should be noted that
this percentage is identical to the seven per cent of
System 4 individuals we have found from among approxi-
mately 3000 undergraduates administered the TIB. In
fact, this percentage appears to be sc constant across
a large sample of subjects that some special factor(s)
may be necessary to account for it.

Adams, D. K., Harvey, 0. & Heslin, R. E. Variation
in flexibility and creativity as a function of
hypnotically induced paJt histories. In 0. J. Harvey
(Edit.) Experience, Structure and Adaptibility. New
York: Springer, 1967, pp. 217-234.
Harvey, 0. J. Cognitive determinants of role playing,
Technical report No. 3, Contract Nonr 1147(07),
University of Colorado, 1963.
Harvey, 0. J. Some cognitive determinants of inElnencia
bility. Sociometry) 1964, 27, pp. 208-221e
Harvey, 0. J. Systemstructure, flexibility and crea-
tivity. In 0. J. Harvey (Edit.) Experience",
Structure and Adaptibility. New York: Springer,
1966, pp. 242-262.
Harvey, 0. J. Conceptual systems and attitude change,
Carolyn W. Sherif & M. Sherif (Edits.) Attitude,
ego-involvement and attitude change. New York:
Wiley, 1967, pp, 201-226.
.Harvey, 0. J., Hunt, D. E. & Schroder, H. M. Conce tual
systemand pArsort]..ity.,IrsaL.E.E._zation. New Yor s
Wiley, 1961.
Harvey, 0. J. & War R. Personality differences in
dissonance resolution. Journal. of Persona
and Social Psycholggy,9671. (In press)
Harvey, 0. J., White, B. J., Prather, Misha, Alter,
R. D. & Hoffmeister, J. E. Teachers' belief
systems and preschool atmospheres. Journal ofEducational, Psycttology, 1966, 57, pp. 373-381.
Tryon, R. C. & Bailey, D. E. Trz User's Manual.Boulder: University of Colorado Computing Center,
1965.
Tryon, R. C. & Bailey, DI E. The B. C. 312:system of
cluster anal....ylk. Boulder: University of Colorado
Computiug Center, 1966.

Ware, R. & Harvey, 0. J. A cognitive doterminapt ofimpression formation. Journal of personality, andSocial Psychology, 1967.
White, B. J. & Harvey, 0. J. Effects of personality andown stand on judgment and production of statementsabout a central issue. Journal of ExperimentalSocial Psychology,, 1965,10 pp. 334-347.
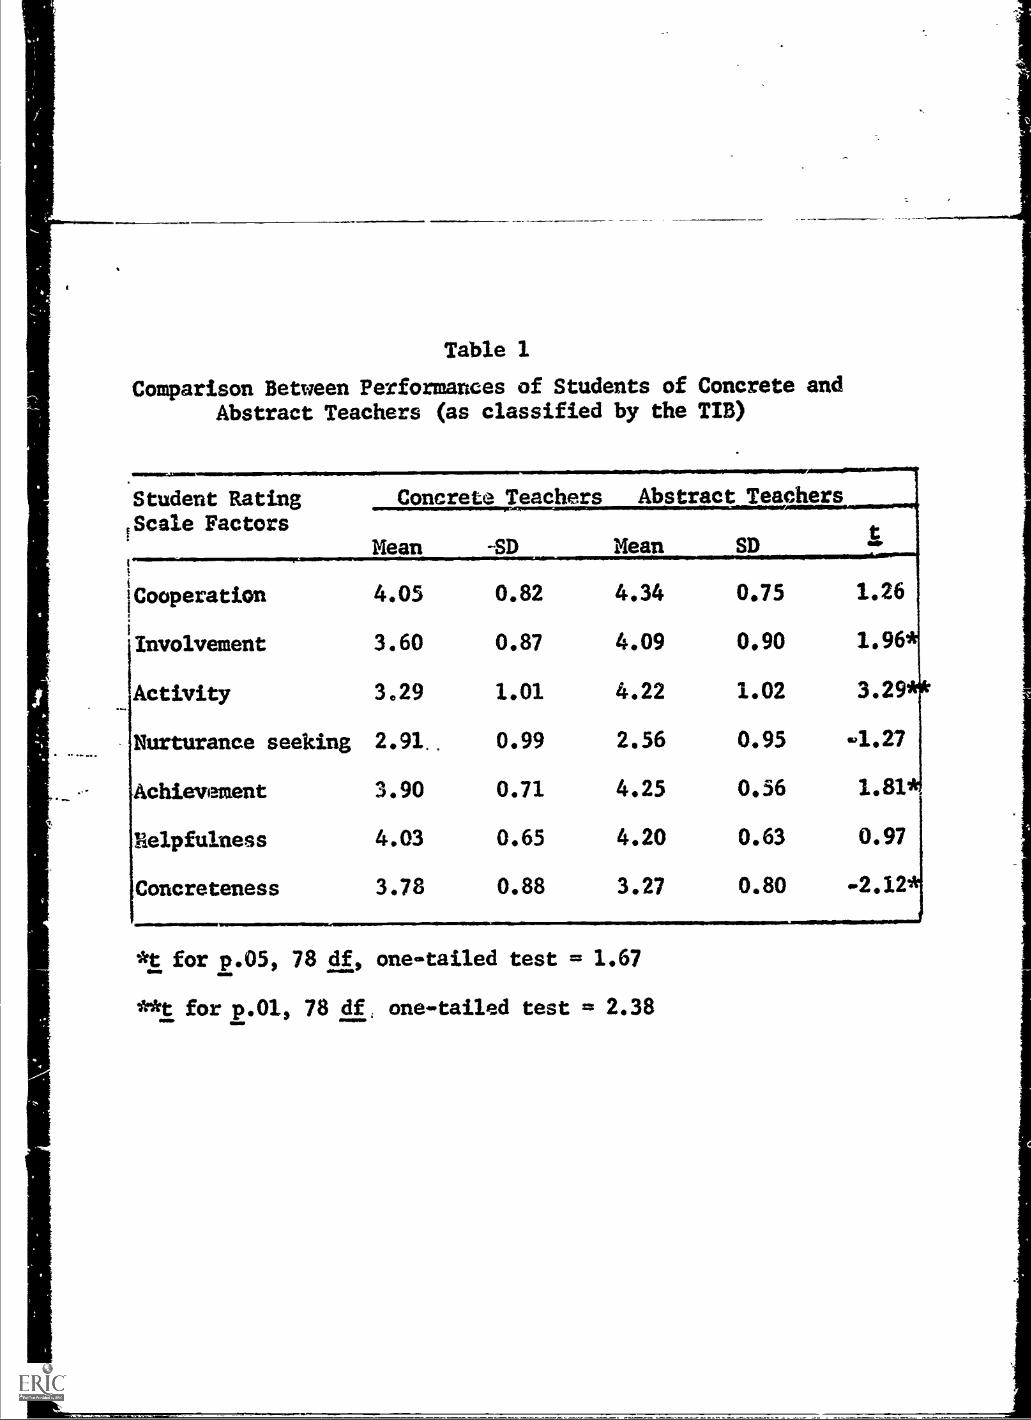
Table 1
Comparison Between Performances of Students of Concrete and
Abstract Teachers (as classified by the TIB)
Student RatingEScale Factors
Cooperation
Involvement
Activity
Concrete Teachers Abstract Teachers
Mean -SD
4.05 0.82
3.60 0.87
3.29 1.01
Nurturance seeking 2.91.. 0.99
Achievement 3.90 0.71
Helpfulness 4.03 0.65
Concreteness 3.78 0.88
Mean SD
4.34 0.75
4.09 0.90
4.22 1.02
2.56 0.95
4.25 0.56
4.20 0.63
3.27 0.80
t
1.26
1.96
3.29
4-1.27
1.81
0.97
*t for p.05, 78 df, one-tailed test = 1.67
**t for p.01, 78 df. one-tailed test = 2.38
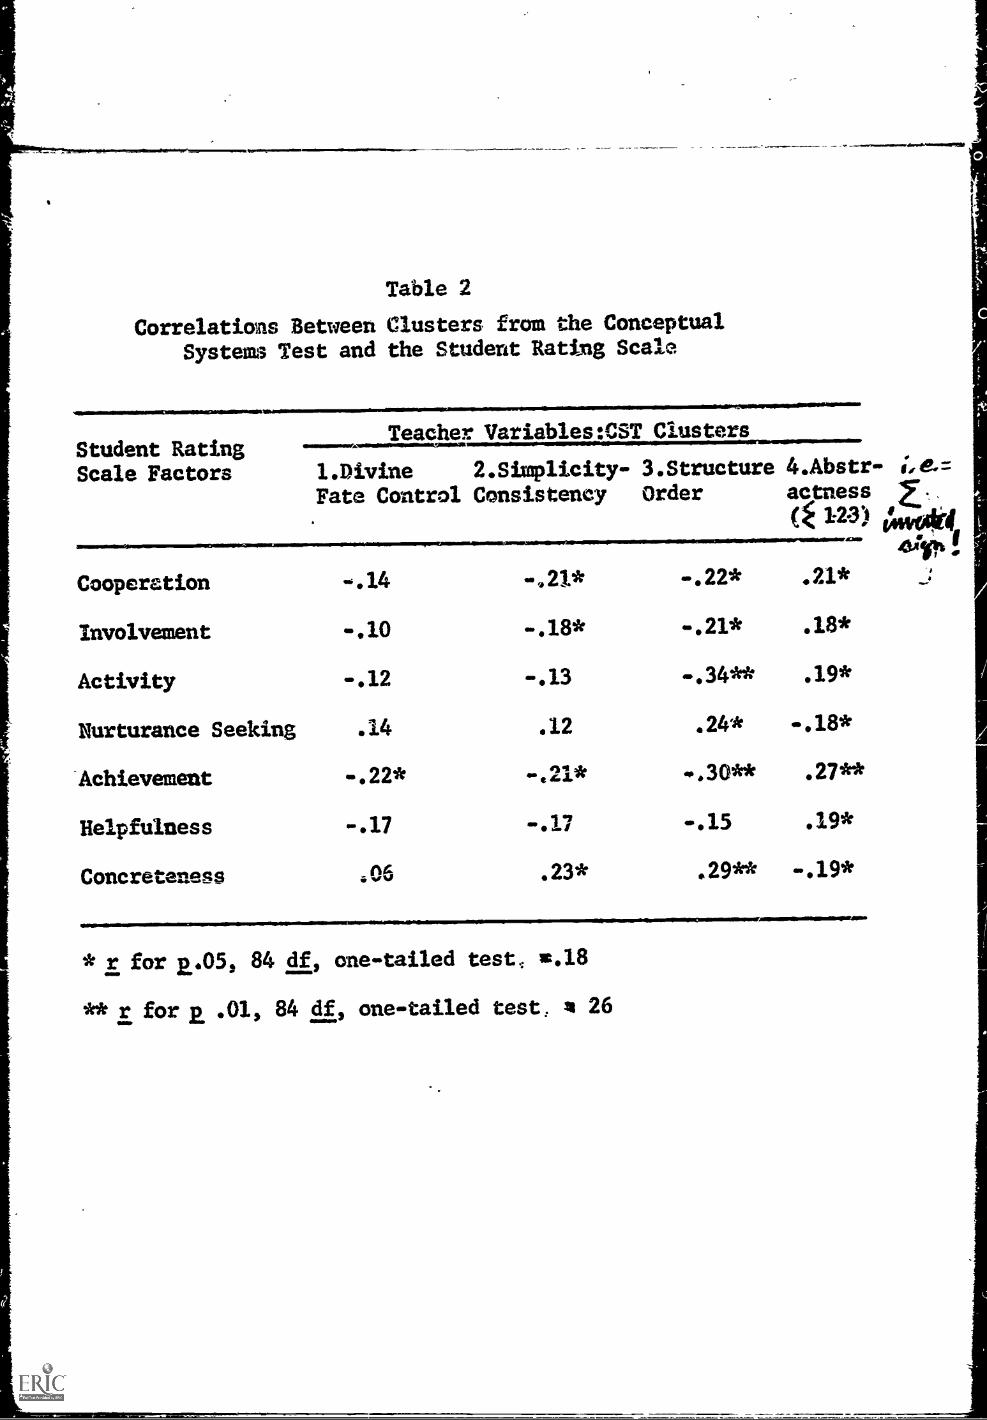
Table 2
Correlations Between Clusters from the Conceptual
System; Test and the Student Rating Scale
Student RatingScale Factors
1111=101=1111M
Teacher Variables:CST Clusters
1.Divine 2.Simplicity- 3.Structure 4.Abstr-
Fate Control Consistency Order actness 2E.
( 123) 01044AftmertemswAramo !
Cooperation -.14
Involvement -.10
Activity -.12
Nurturance Seeking .14
Achievement -.22*
Helpfulness -.17
Concreteness .06
-.22* .21*
-.21* .18*
-.34** .19*
.12 .24* -.18*
l'1
eA*GL* -.30** .27**
-07 -.15 .19*
.23* .29** -.19*
* r for 2..05, 84 df, one-tailed test, ic.18
** r fork .01, 84 df, one-tailed test: sit 26

Table 3
Correlations of Teacher Dictatorialness, Punitiveness
and Resourcefulness to Student Performance Factors
StudentBehavior
Teacher Behavior
Resourcefulness Dictatorialness Punitiveness
Cooperativeness .23**
Involvement .69**
-Activity .76**
----liurturance_.Seeking -.12
Achievement .28**
Helpfulness .02
Concreteness -.60**
NIMINM.M.M.:201111.1111,
-.34**
-.73**
-.29**
-.05 -.01
-.28** -.32**
-.23** -.32**
.67** .56**
* r for p, .05, 116 df one-tailed test = .15
r for E..01, 116 df one-tailed test = .22
Nesmospess..-NoormiNow

0E0 - 1274FINAL REPORT
FAN= SURVEY
July 28, 1967
This report is the result of the study of families
whose children attended or were eligible to attend the
first Head Start programs in Colorado carried out during
the summer of 1965. Eighteen towns and cities were repre-
sented, each with somewhat different Head Start programs
developed to meet local needs as viewed by the represen-
tatives'of the community responsible for the programs.
The purpose of the study was twofold: to determine
family attitudes and values of Head,Stert children; end to
get family data which could be related subsequently to the
children's responses to Head Start and the public school.
A study of classroom environments created by Head Start
teachers of different belief systems (Harvey, White, PTa-
ther, Alter and Hoffmeister, 1966) preceded the family in-
terviews. A study of the children in their first year of
public school was planned as a final effort to extricate
interactive effects between family values and classroom
atmospheres, and whether Head Start experience contributed
to the interactions.
Of the many family values and attitudes that could
be expected to relate to children's performance in Head
Start and reblic school, those considered most relevant
01) were: the family's view of its place in the social sys-
b. tens and relationship to it; the hopes and aspirations of
(Nt of the parents for themselves and for their children; the
4:: perceived possibility of attaining these goals; the degree
of satisfaction, with atteined status; and the view of self
4::)as a causal agent in effecting desired outcomes.
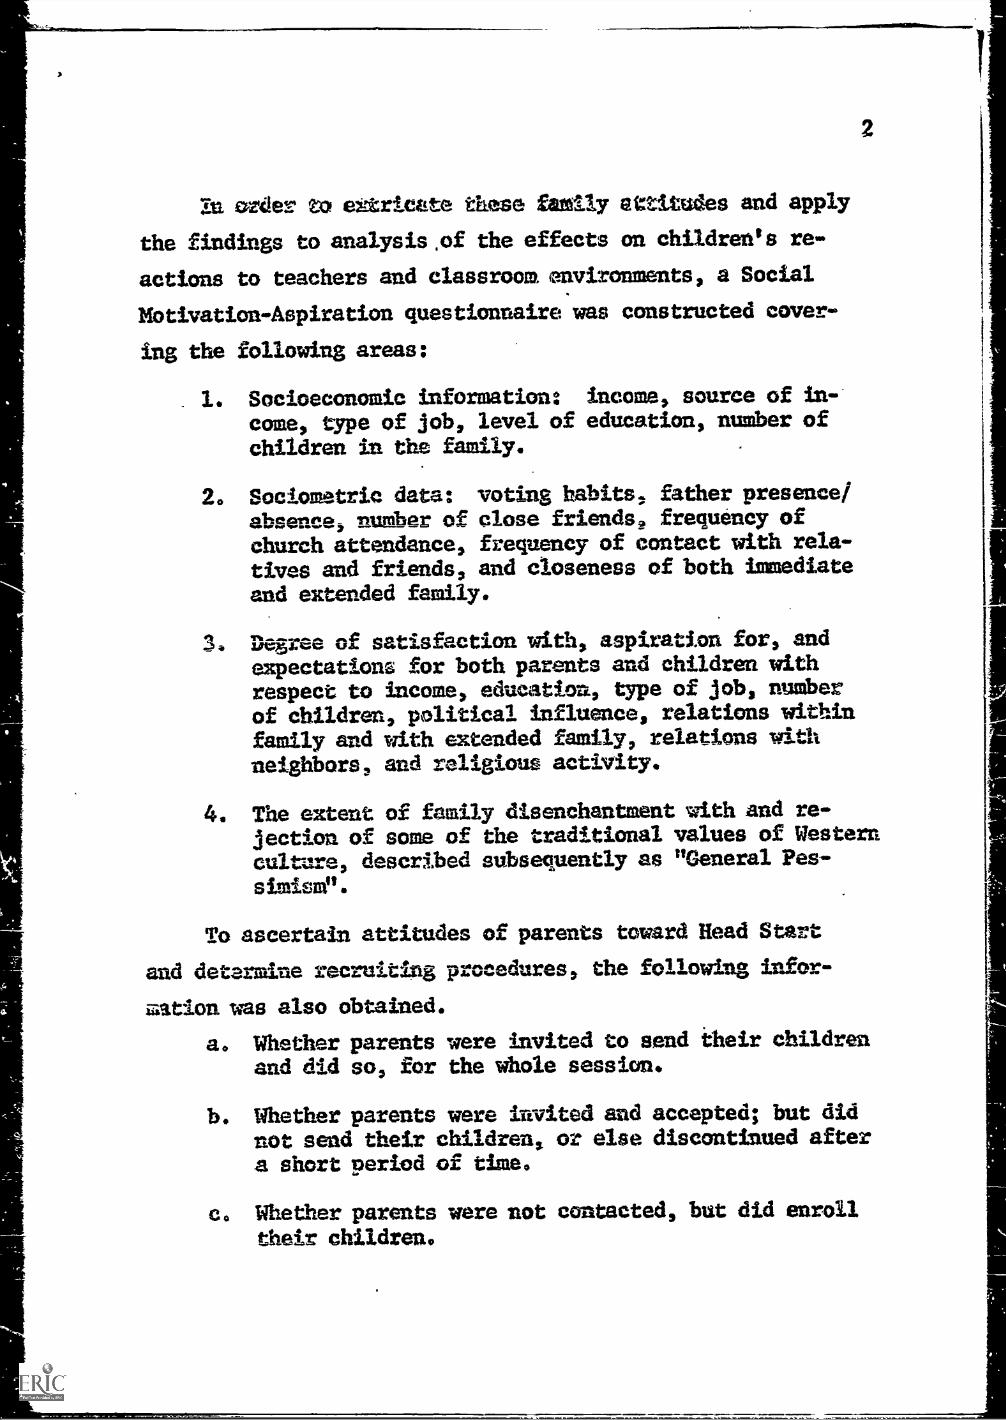
In 0,N/ex' to extricate these family attitudes and apply
the findings to analysis,of the effects on children's re-
actions to teachers and classroom environments, a Social
Motivation-Aspiration questionnaire was constructed cover-
ing the following areas:
1. Socioeconomic information: income, source of in-
come, type of job, level of education, number of
children in the family.
2. Sociometrie data: voting habits, father presence/absence, number of close friends. frequency of
church attendance, frequency of contact with rela-
tives and friends, and closeness of both immediate
and extended family.
3, Degree of satisfaction with, aspiration for, andexpectations for both parents and children withrespect to income, education, type of job, numberof children, political influence, relations withinfamily and with extended family, relations withneighbors, and religious activity.
2
4. The extent of family disenchantment with and re-jection of some of the traditional values of Western
culture, described subsequently as "General Pes-
simism".
To ascertain attitudes of parents toward Head Start
and determine recruiting procedures, the following infer-
zation. was also obtained.
a. Whether parents were invited to send their childrenand did so, for the whole session.
b. Whether parents were invited and accepted; but didnot send their children, or else discontinued aftera short period of time.
c o Whether parents were not contacted, but did enroll
their children 0

d. Whether parents were not contacted, knew nothingof the program and said that they would have senttheir children had they known about it or had beeninvited to send them.
e. Whether parents who were not contacted would haverefused if they had been invited to send theirchildren.
Interviewers
Two main considerations affected the selection of in-
terviewers for this survey. One was that families of chil-
dren eligible for most Head Start programs might have nega-
tive feelings toward persons like social workers and other
institutional representatives they deal with; but would be
more responsive to people more near* like themselves.
The other concern was consonmt with the aims of the Office
of Economic Opportunity: to engage members of the poverty
community in work related to the War. an Poverty.
People likely to be capable of meeting the requirements
for the particular task involved were available from a lead-
ership training class conducted in the spring of 1965 at
the University of Denver. 32 members of that class had
participated in the Universit.y of Colorado Head Start Tea-
cher Training Program in lime, 1965. They were hired then
as guides to poverty areas in Denver and had' evidenced high
octivation, trainability, and ability to follow instructions
responsibly and effectively.
Criteria for selection of the interviewers were based
on the following needs:
1. Ability to speak Spanish.
4
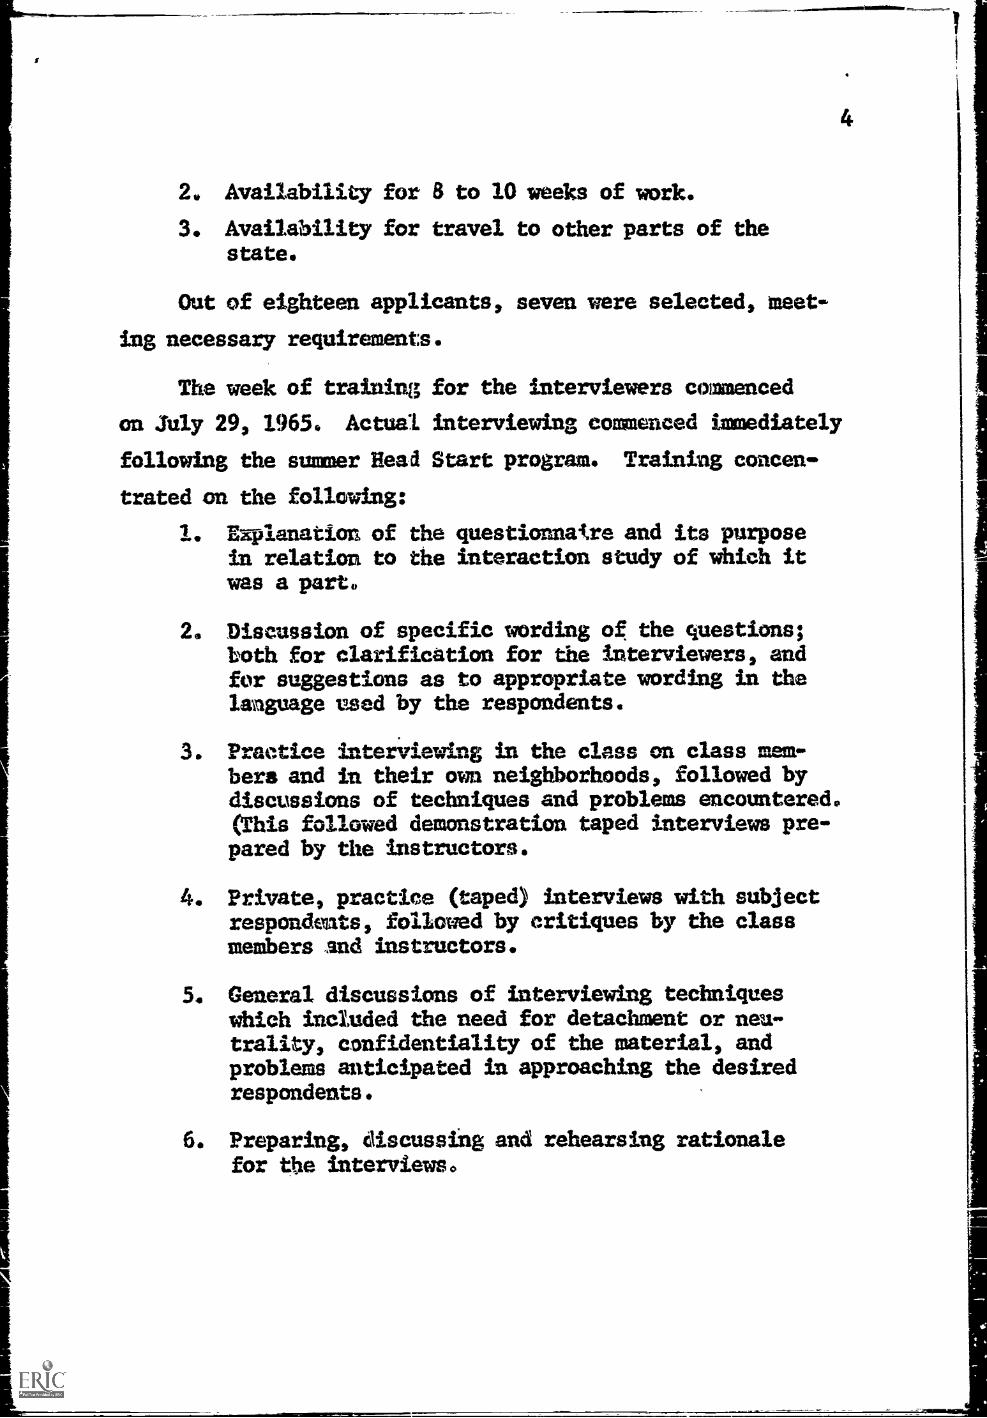
2. Availability for 8 to 10 weeks of work.
3. Availability for travel to other parts of thestate.
Out of eighteen applicants, seven were selected, meet-
ing necessary requirements.
The week of training for the interviewers commenced
on July 29, /965. Actual interviewing commenced immediately
following the summer Head Start program. Training concen-
trated on the following:
1. Explanation of the questionnaire and its purposein relation to the interaction study of which itwas a part.
2. Discussion of specific wording of the questions;both for clarification for the interviewers, andfor suggestions as to appropriate wording in thelanguage used by the respondents.
3. Practice interviewing in the class on class mem-bers and in their own neighborhoods, followed bydiscussions of techniques and problems encountered.(This followed demonstration taped interviews pre-pared by the instructors.
4. Private, practice (taped) interviews with subjectrespondents, followed by critiques by the classmembers snd instructors.
5. General discussions of interviewing techniqueswhich included the need for detachment or neu-trality, confidentiality of the material, andproblems anticipated in approaching the desiredrespondents.
6. Preparing, discussing and rehearsing rationalefor the interviews.
I
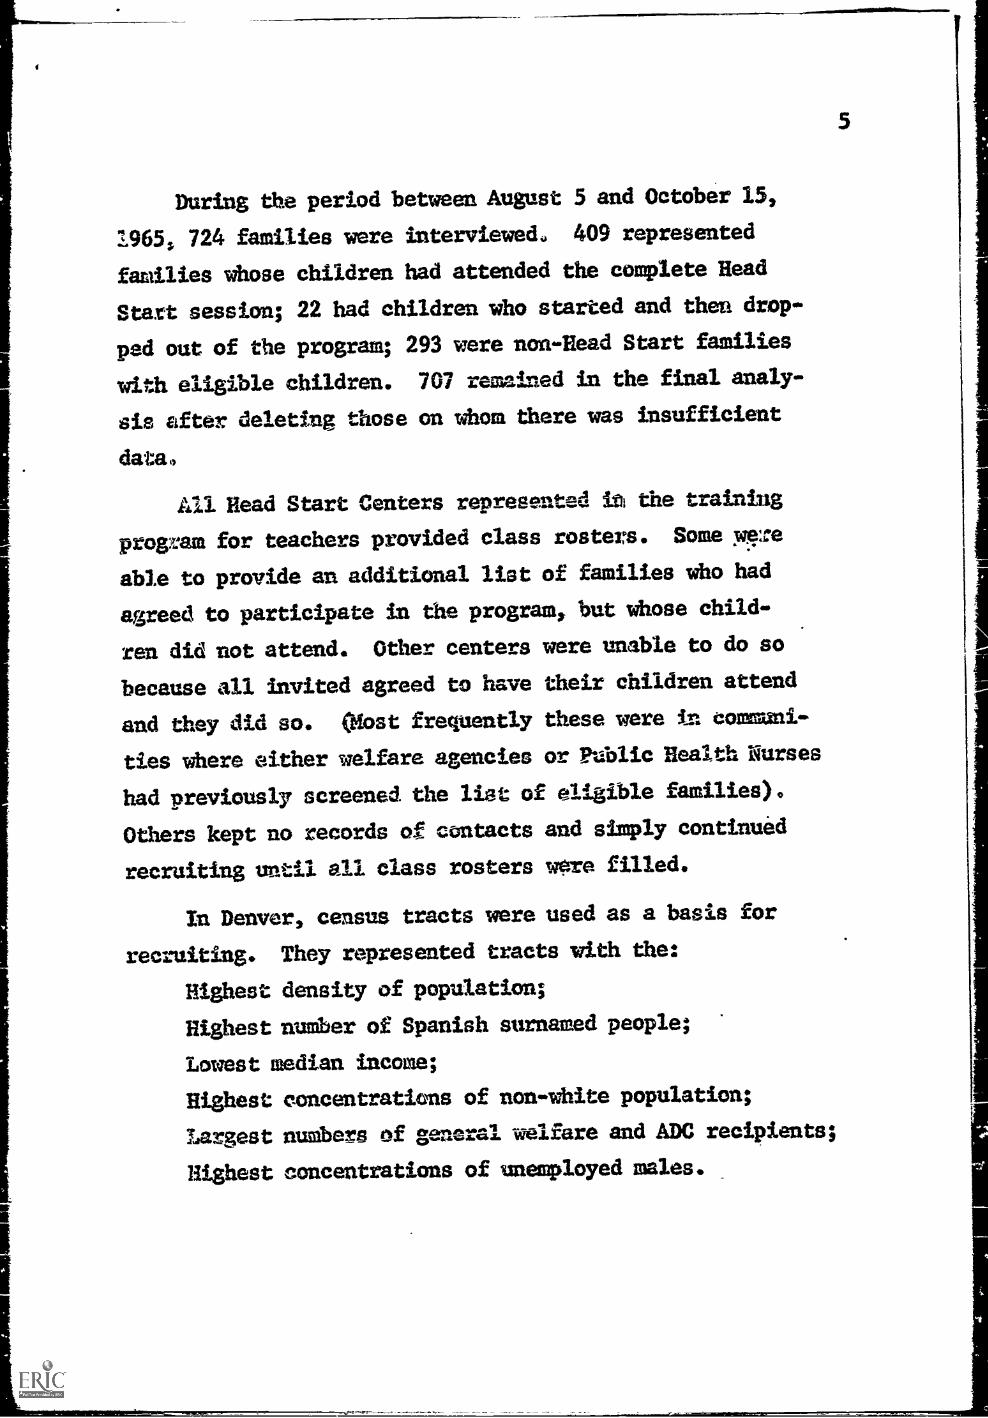
During the period between August 5 and October 15,
1965, 724 families were interviewed. 409 represented
families whose children had attended the complete Head
Start session; 22 had children who started and then drop-
ped out of the program; 293 were non-Bead Start families
with eligible children. 707 remained in the final analy-
sis after deleting those on whom there was insufficient
data.
All Head Start Centers represented its the training
progzam for teachers provided class rosters. Some we
able to provide an additional list of families who had
agreed to participate in the program, but whose child-
ren did not attend. Other centers were unable to do so
because all invited agreed to have their children attend
and they did so. most frequently these were in communi-
ties where either welfare agencies or Public Health Nurses
had previously screened the list of eligible families).
Others kept no records of contacts and simply continued
recruiting until all class rosters 1,m-re filled.
In Denver, census tracts were used as a basis for
recruiting. They represented tracts with the:
Highest density of population;
Highest number of Spanish surnamed people;
Lowest median income;
Highest concentrations of non-white population;
Largest numbers of general welfare and ADC recipients;
Highest concentrations of unemployed males.
5
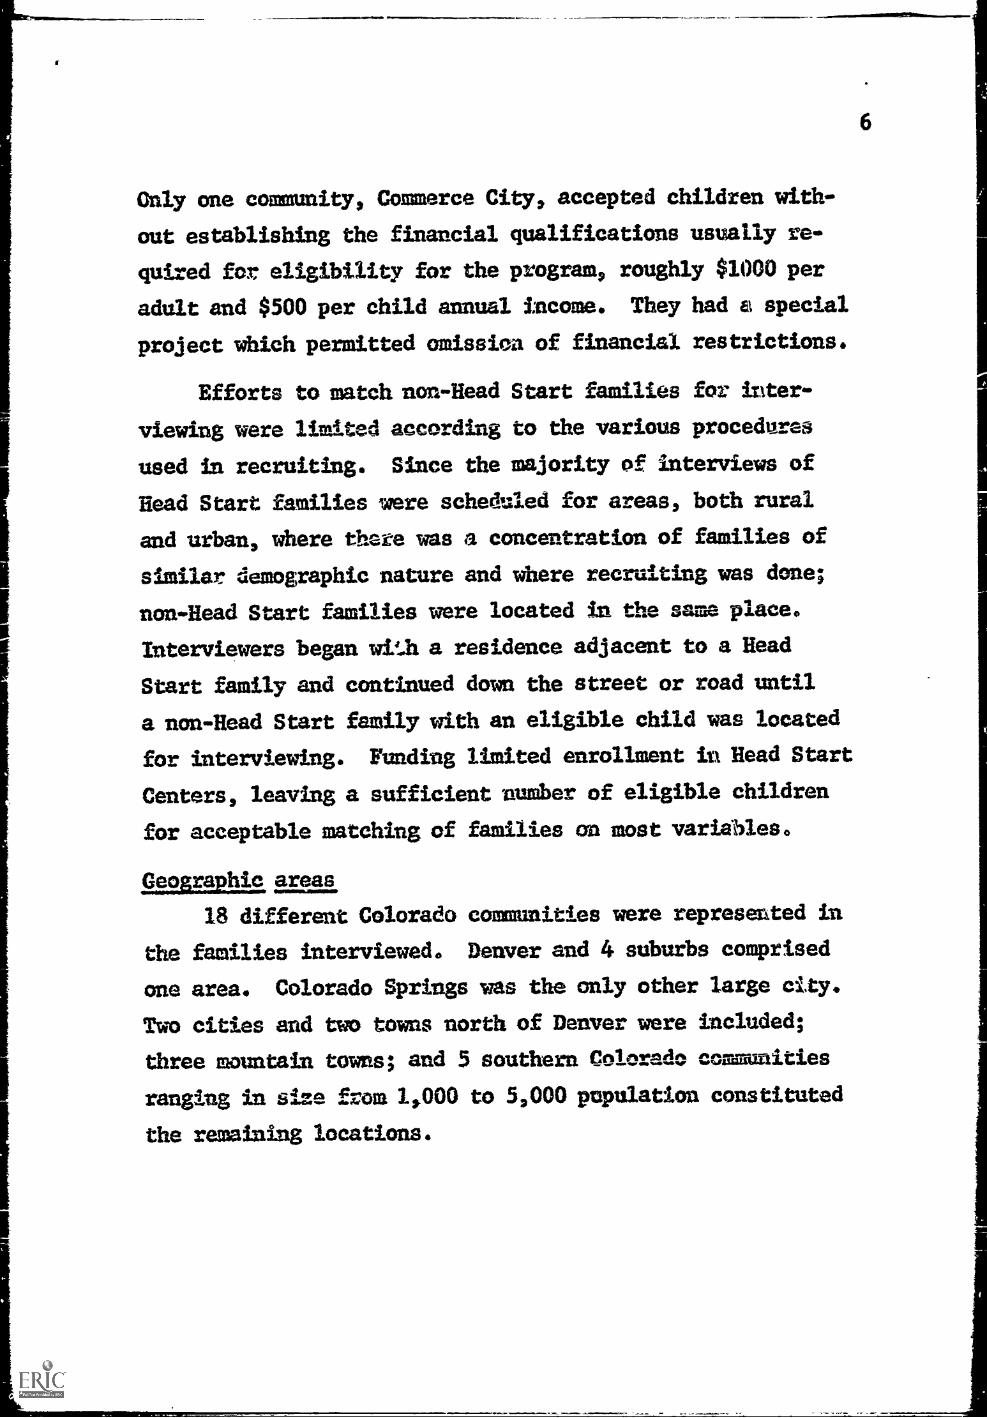
Only one community, Commerce City, accepted children with-
out establishing the financial qualifications usually re-
quired for eligibility for the program, roughly $1000 per
adult and $500 per child annual income. They had as special
project which permitted omission of financial restrictions.
Efforts to match. non-Head Start families for inter-
viewing were limited according to the various procedures
used in recruiting. Since the majority of interviews of
Head Start families were scheduled for areas, both rural
and urban, where there was a concentration of families of
similar demographic nature and where recruiting was done;
non-Head Start families were located in the same place.
Interviewers began with a residence adjacent to a Head
Start family and continued down the street or road until
a non-Head Start family with an eligible child was located
for interviewing. Funding limited enrollment in Head Start
Centers, leaving a sufficient number of eligible children
for acceptable matching of families on most variables.
211.9102NE areas
18 different Colorado communities were represented in
the families interviewed. Denver and 4 suburbs comprised
one area. Colorado Springs was the only other large city.
Two cities and two towns north of Denver were included;
three mountain towns; and 5 southern Colorado communities
ranging in size from 1,000 to 5,000 population constituted
the remaining locations.
6

ANALYSIS OF THE INTERVIEW SCHEDULE
The total questionnaire included 3 items on Head
Start status, 45 items from a Bureau of Census inven-
tory and 121 items designed to measure family status on
income, occupation and education; social contacts within.
and without the family, religious activity and anomie.
Aspirations and expectations were also maasured (See
Appendix A)
The general approach to the data has been (a) to
divide the total inventory into two general sets of items:
those scored as discontinuous categories, and those scored
in terms of what are assumed to be continuous categories;
(b) to select for further analysis only those items from
these two sets Which appeared most likely to maximize
differences between subjects (Fidke, 1963); and (c) to
further subdivide these remaining continuously scored
items into subsets which were thought to be measures to
single domains, such as anomie.
Chi-squares were done between all posoible pairs of
discontinuous items and cluster analyses (Tryon & Bailey,
1965; Tryon & Bailey, 1966) were done on the several sets
of continuous items. In addition, all relevant items were
converted to hope-expectancy scores; e.g., a family indi-
catimg low hope and low expectancy with respect to a par-
ticular domain, such as family income, were coded as "1",
those with low hope and high expectancy as "2", high hope
and low expectancy as "3", and high hope and high expec-
t-Ailey as "4".,
*low and high were based on scores below or above the medianfor that item.

8
DESCRIPTION OF THE SAMPLE
The children of 55.31% of the 707 families inter-
viewed had attended the summer Head Start session; 43%
were recruited, the remaining were enrolled without invi-
tation on the initiative of the parents. 15.42% were in-
vited but did not send their children; 6.5% were not
invited and said they would not have sent their children
in any case.
692 (97.88%) of the respondents were the mothers of
the family. 77.51% of the respondents were married. The
fathers of 21.92% of the families did not live at home.
No one was employed in 158 or 22.35% of the families, and
191 (27.02%) were receiving' public assistance. In the
73.41% of the families where someone was employed, 483
or 68.32% were the fathers; 26 or 3.68% were mothers;
and 8 or 1.3%, were children.
670 (94.77%) of the families owned TV sets. 493 (69.73%)
were registered to vote.
Because of the one large program which had no limiting
income requirements for participation in the Head Start
program, a larger number of respondents owned their own
homes than was expected. 267 or 37.77% were in this cate-
gory. 77 or 10.89% lived in public housing; 65 or 9.19%
of the families lived in a private apartment building; and
242 or 34.23% rented a house. 121 or 24.611 had 4 or fewer
people living in their residence; 106 or 14.99% had 9 or
more in their home.
9
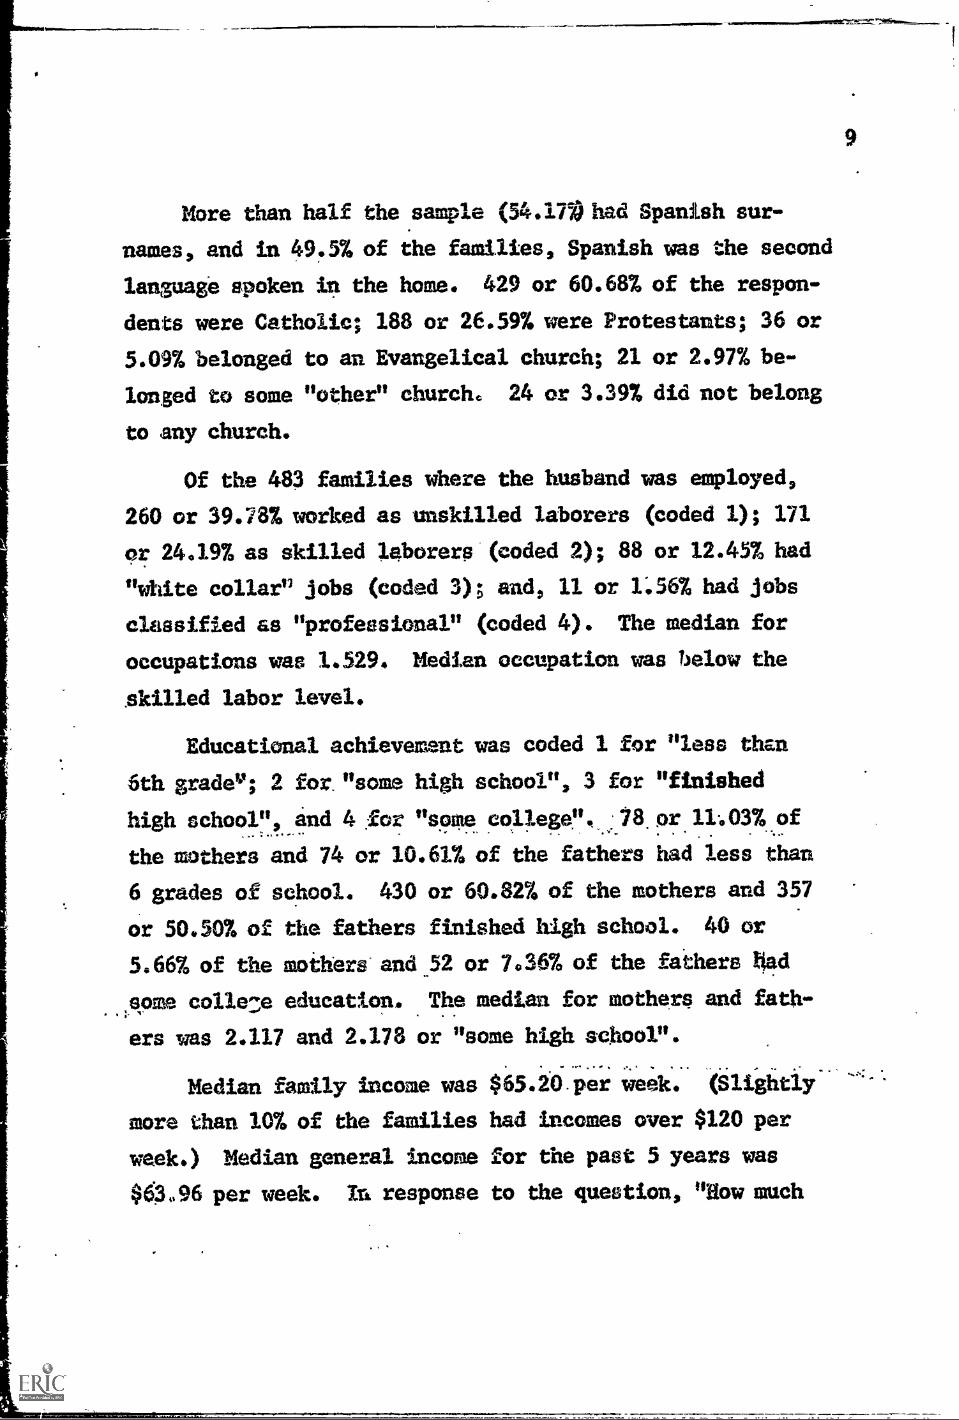
More than half the sample (54.174 bad Spanish sur-
names, and in 49.5% of the families, Spanish was the second
language spoken in the home. 429 or 60.68% of the respon-
dents were Catholic; 188 or 26.59% were Protestants; 36 or
5.09%, belonged to an Evangelical church; 21 or 2.97% be-
longed to some "other" church. 24 or 3.39% did not belong
to any church.
Of the 483 families where the husband was employed,
260 or 39.78% worked as unskilled laborers (coded 1); 171
nr 24.19% as skilled laborers (coded 2); 88 or 12.45% had
"white collar" jobs (coded 3) ; and, 11 or 1:56% had jobs
classified as "professional" (coded 4). The median for
occupations was 1.529. Median occupation was below the
skilled labor level.
Educational achievement was coded 1 for "less than
6th gradev; 2 for "some high school", 3 for "finished
high school", and 4 for "some college ". 18 or 11003% of
the soothers and 74 or 10.61% of the fathers had less than
6 grades of school. 430 or 60.82% of the mothers and 357
or 50.50% of the fathers finished high school. 40 or
5.66% of the mothers and 52 or 7.36% of the fathers tied
some colle:e education. The median for mothers and fath-
ers was 2.117 and 2.178 or "some high school".
Median family income was $65.20 per week. (Slightly
more than 10% of the families had incomes over $120 per
ueek.) Median genera/ income for the past 5 years was
$63.96 per week. In response to the question, "How much
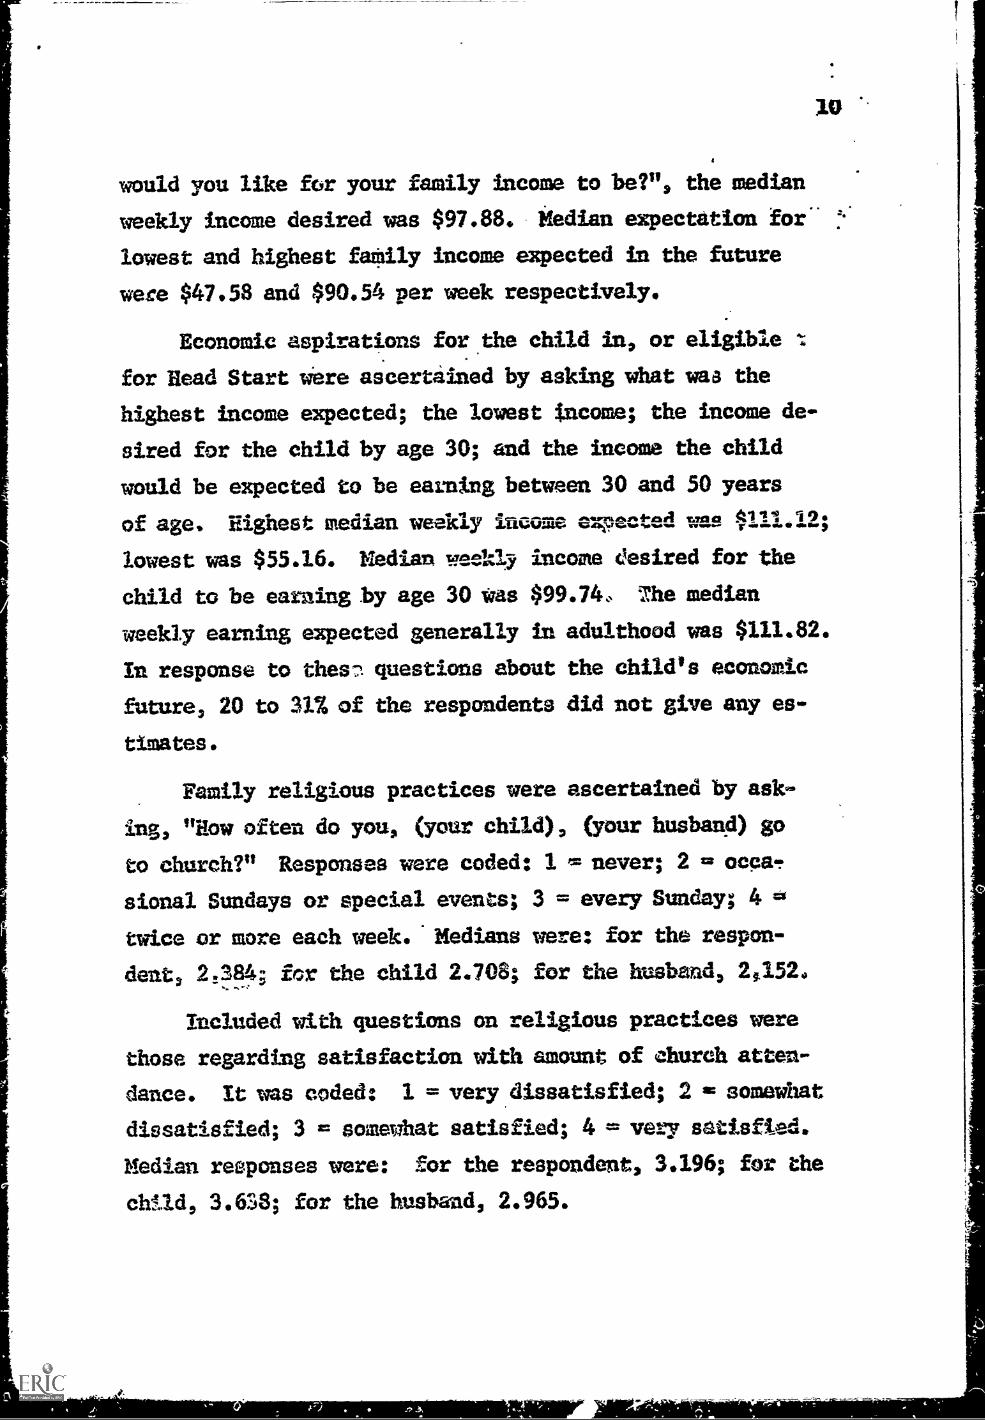
would you like for your family income to be?", the median
weekly income desired was $97.88. Median expectation for
lowest and highest faMily income expected in the future
were $47.58 and $90.54 per week respectively.
Economic aspirations for the child in, or eligible
for Head Start were ascertained by asking what waa the
highest income expected; the lowest income; the income de-
sired for the child by age 30; and the income the child
would be expected to be earning between 30 and 50 years
of age. Highest median weekly income expected waa $111.19;
lowest was $55.16. Nedian weekly income desired for the
child to be earning by age 30 was $99.74,. The median
weekly earning expected generally in adulthood was $111.82.
In response to then 7, questions about the child's economic
future, 20 to 31% of the respondents did not give any es-
timates.
Fami/y religious practices were ascertained by ask-
ing, "How often do you, (your chi/d), (your husband) go
to church?" Responses were coded: I =never; 2 = (=ca.,
sional Sundays or special events; 3 = every Sunday; 4 =
twice or more each week. Medians were: for the respon-
dent, 2.384; for the child 2.708; for the husband, 2452.
Included with questions on religious practices were
those regarding satisfaction with amount of church atten-dance. It was coded: 1 = very dissatisfied; 2 = somewhat
dissatisfied; 3 = somewhat satisfied; 4 w very satisfied.
Median responses were: for the respondent, 3.196; for the
child, 3.6S8; for the husband, 2.965.

Religious attitude was ascertained by the questions:(1) How close do you feel you are to God? (coded 1 as
very far: 2 = somewhat far; 3 as somewhat close; 4 at veryclose); (2) How happy are you with your closeness to God?(coded .1..ss very unhappy; 2 = somewhat unhappy; 3 ss some-what happy; 4 es very happy); and (3) On the whole I am areligious person. (coded 1 = agree a lot; 2 = agree alittle; 3 as disiigree a little; 4 = disagree a lot). Med-
ian responses were in order (1) 3.503 (feel close); (2)3.638 (happy about it) and (3) 1.380 (am religious).
Family relationships and practices were measured withitems such as, "How often do you visit, phone or writeyour brother(s) and/or sister(s) and how often do theyvisit, phone or write you?* were coded: 1 as never; 2 atnot very often; 3 = pretty often; 4 ss very often. .Medianresponses for these 2 items were 2.949 and 2.933 respec-tively, or pretty often. The question, "How close are youto your brother(s) and/or sister(s)?" was coded: I as verydistant; 2 == somewhat distant; 3 = somewhat close; 4 =very close. Median response was 3.724, quite close.
"How often do friends or neighbors contact you; howoften do you contact friends and neighbors; and, how manyclose friends do you have in this neighborhood?" werecoded: l = never; 2 not very often; 3 = pretty often;4 se real .often. Medians for responses to these two. ques-tions were 2.734 and 2.430 respectively. The responses tothe number of close friends in the neighborhood was scoredI for "none," 2 for "not very many," 3 for "quite a few,"and 4 for "many." Fedian response was 2.250.

12
Educational achievement, aspiration and expectation
items were coded; 1 = less than 6th grade; 2 = some high
school; 3 = finished high school; 4 = some college or fin-
ished. To "How far in school do you. wish your husband had
gone?" the median response was 3.551, for "How far in:School
did your husband go?" the median was 2.178, for "How far in
school do you hope your child will get?", it is 3.709;
and for "Haw far in school do you expect your child will
go?", it was 3.350.
Items designed to tap anomie, or general pessimism,
as described in the introduction were scored: 1 = disagree
a lot; 2 = disagree a little; 3 at agree a little; 4 =agree
a lot. They and their medians are listed in table below.
Item
Politicians have to bribe people.
Most people in public office aren'treally interested in the problems of
the poor man..Judges can be "fiked" for the right
price.In spite of what some people say, the
poor man's condition is getting worse.
This world is run by a few people in
power and there isn't much the poor
man can do about it.
You sometimes can't help wonderingwhether anything's worthwhile anymore.
It's hardly fair to bring a child into
the world the way things look.
To be successful, a businessman has to
be crooked. .
Most people don't really care what
happens to the other fellow.
Median
1.791
2.150
1.505
1.842
1.91
2.081
1.958
1.165
2.728
13
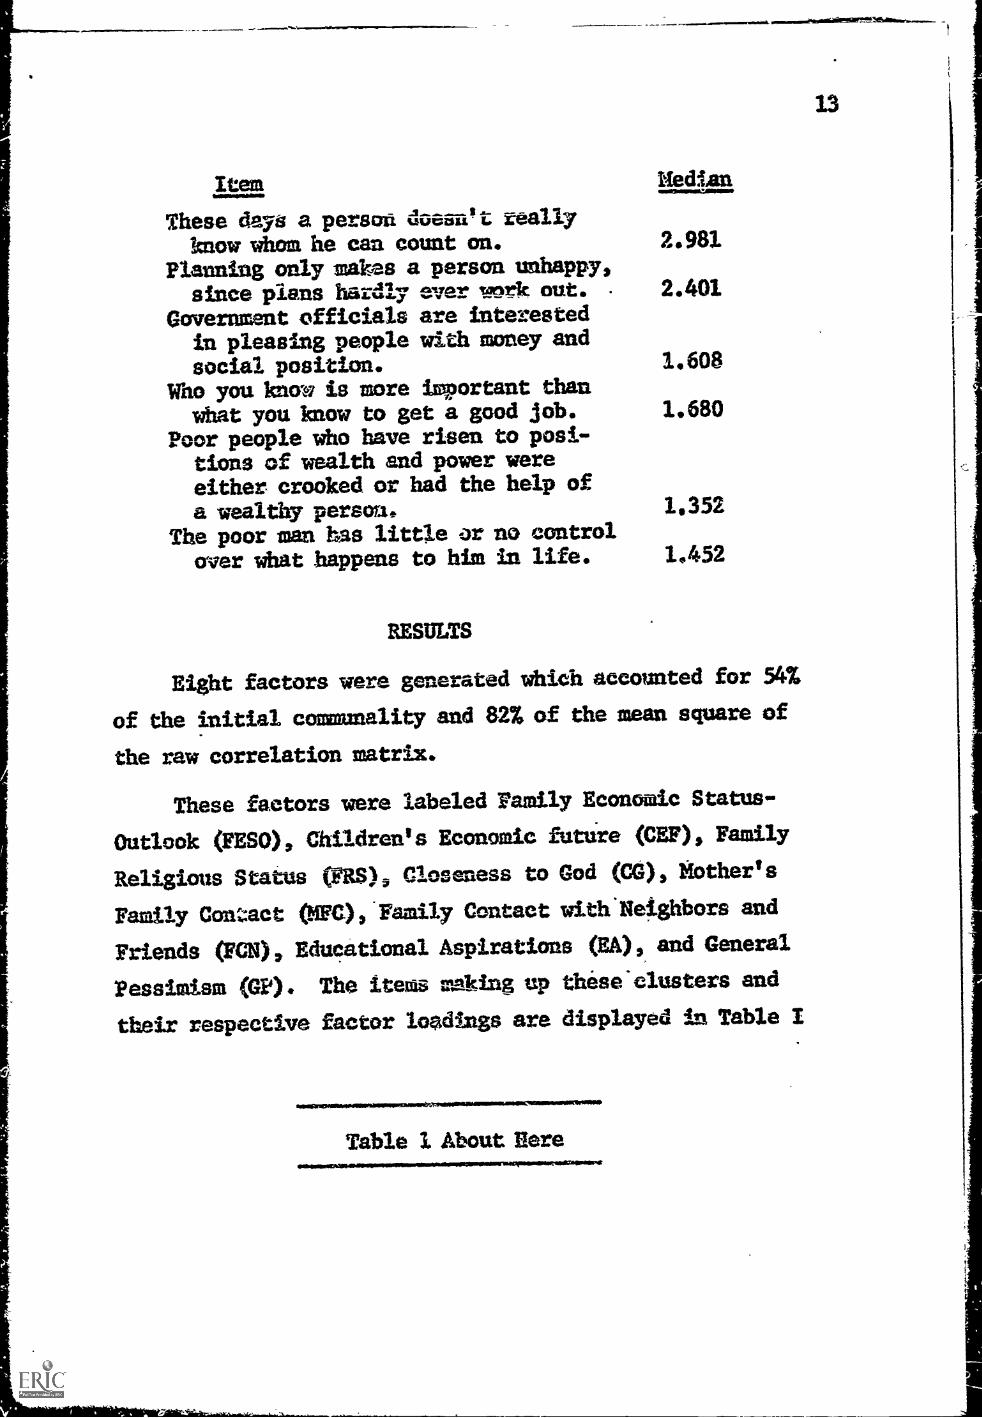
Item
These days a person doesn't teallyknow whom he can count on.
Planning only makes a person unhappy,since plans hardly ever work out.
Government officials are interestedin pleasing people with money and
social position.Who you know is more is thanwhat you know to get a good job.
Poor people who have risen to posi-tions of wealth and power wereeither crooked or had the help of
a wealthy person.The poor man has little or no control
over what happens to hiss in life.
RESULTS
Medtan
2.981
2.401
1.608
1.680
1.352
1.452
Eight factors were generated which accounted for 54
of the initial communality and 82% of the mean square of
the raw correlation matrix.
These factors were labeled Family Economic Status-
Outlook (PESO), Children's Economic futtire (IGEF), Family
Religious Status (FRS); Closeness to God (CG), Mother's
Family Con;:act (KFC),'Family Contact withIelshbors and
Friends (MN), Educational Aspirations (RA) , and General
Pessimism (GP) . The items making up these'clusters and
their respective factor loadings are displayed in Table I
Table 1 About Here
f
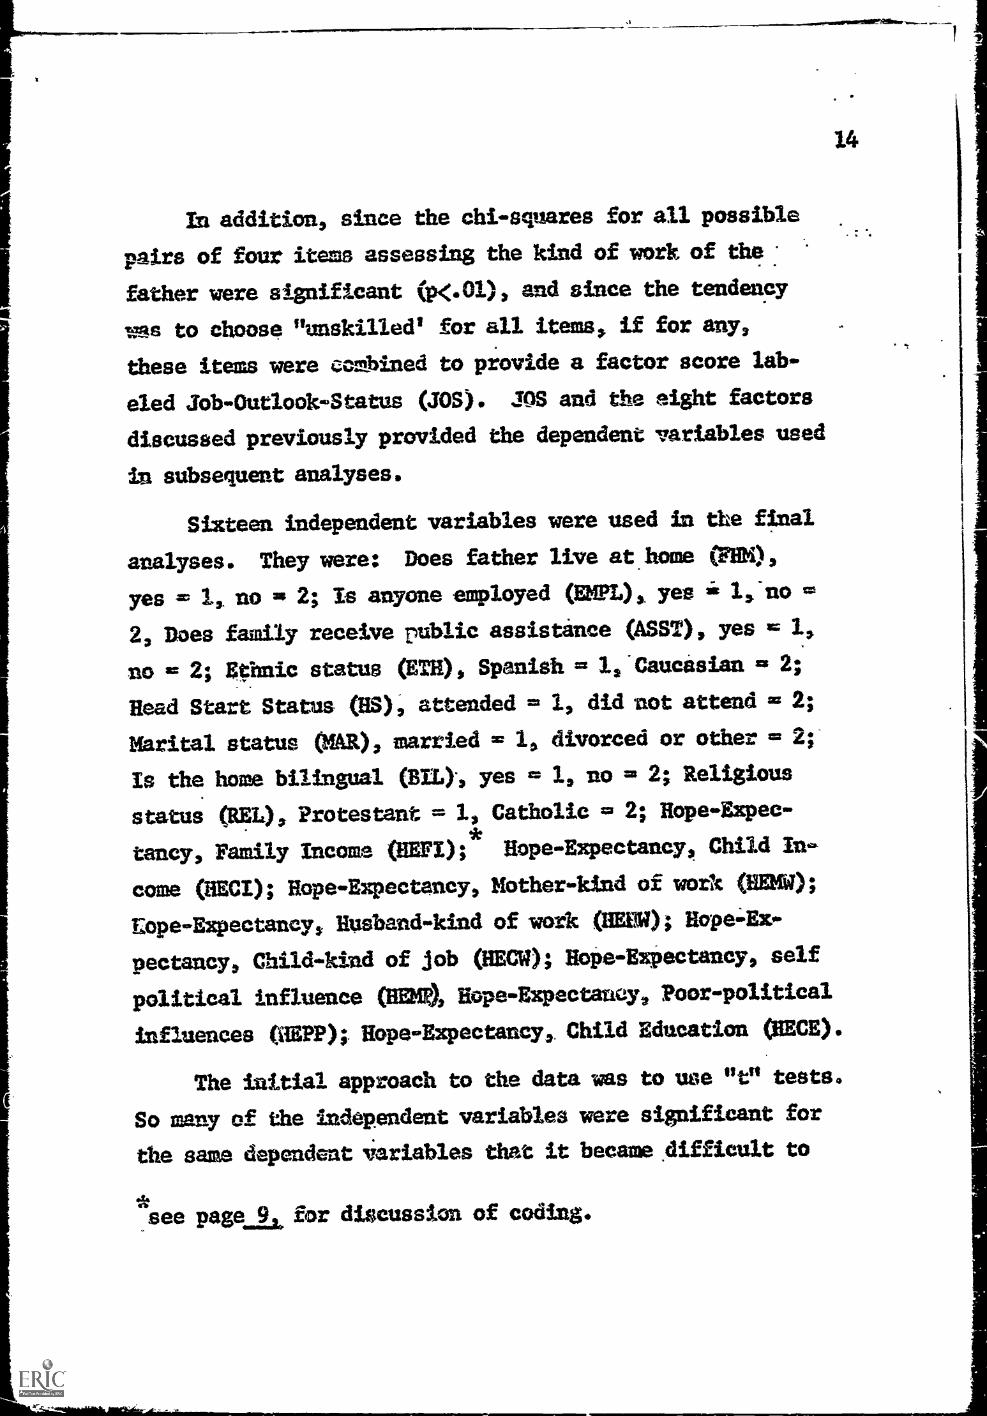
In addition, since the chi-swares for all possiblepairs of four items assessing the kind of work of thefather were significant (x.01), and since the tendency
was to choose "unskilled' for all items, if for any,
these items were combined to provide a factor score lab-
eled Job-Outlook-Status 000. SOS and the eight factors
discussed previously provided the dependent variables used
in subsequent analyses.
Sixteen independent variables were used in the final
analyses. They were: Does father live at home MEM),
yes = 1, no = 2; Is anyone employed (EKPL) yes it =
2, Does family receive public assistance (MST), yes = 1,
no = 2; Etimic status SETH) Spanish = 1, *Caucasian = 2;
Head Start Status (HS), attended = 1, did not attend = 2;
Marital status (MAR), married = 1, divorced or other = 2;
Is the home bilingual OILY, yes = 1, no = 2; Religious
status (REL), Protestant = 1, Catholic = 2; Hope-Expec-
tancy, Family Income (ffEFI); Hope-Expectancy, Child In
come (MCI); Hope-Expectancy, Mother-kind of work (B1261);
L.-ape-Expectancy, Husband-kind of work (HEM; Hope=Ex
pectancy, Child-kind of job (HECW); Hope-Expectancy, self
political influence (MK Hope-Expectancy, Poor-political
influences (1EPP) ;. Hope - Expectancy,. Child Education CHEM.
The initial approach to the data was to use "t" tests.
So many of the independent variables were significant forthe same dependent liariables that it became .difficult to
see page for discussion of coding.
14
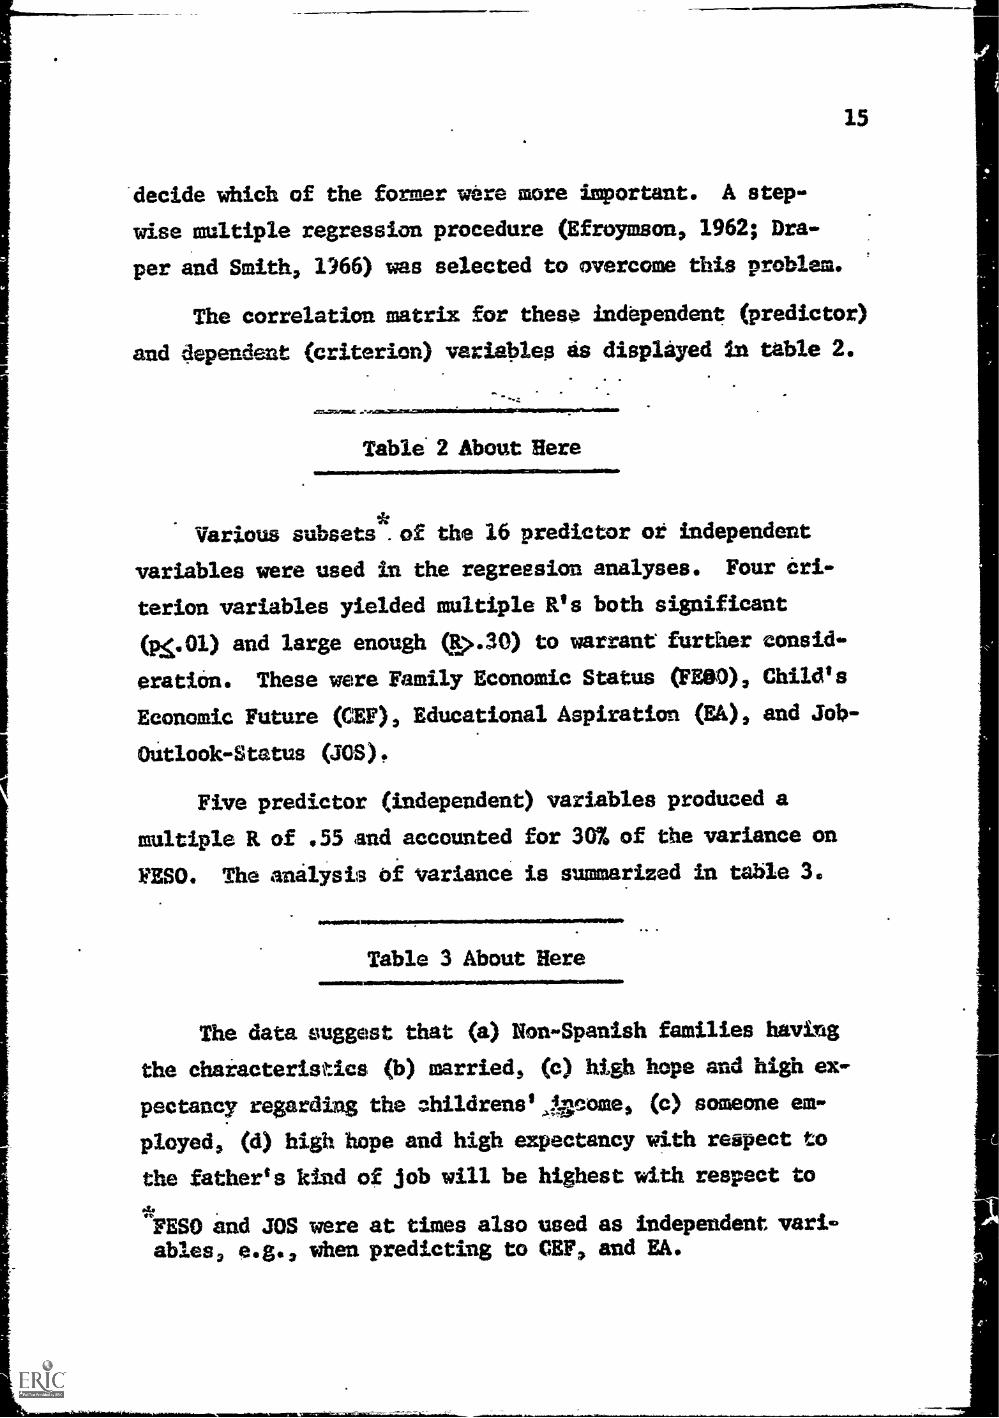
decide which of the former were more important. A step-
wise multiple regression procedure (Efroymson, 1962; Dra-
per and Smith, 1)66) was selected to overcome this problem.
The correlation matrix for these independent (predictor)
and dependent (criterion) variables as displayed in table 2.
=7..VMMOli ...ftemommimmelwroollor
Table 2 About Here
Various subsets*. of the /6 predictor or independent
variables were used in the regression analyses. Four Cri-
terion variables yielded multiple R's both significant
(p.01) and large enough (D.30) to warrant further consid-
eration. These were Family Economic Status MOO), Child's
Economic Future (CrEF), Educational Aspiration (EA), and job-
Outlook-Status (JOS),
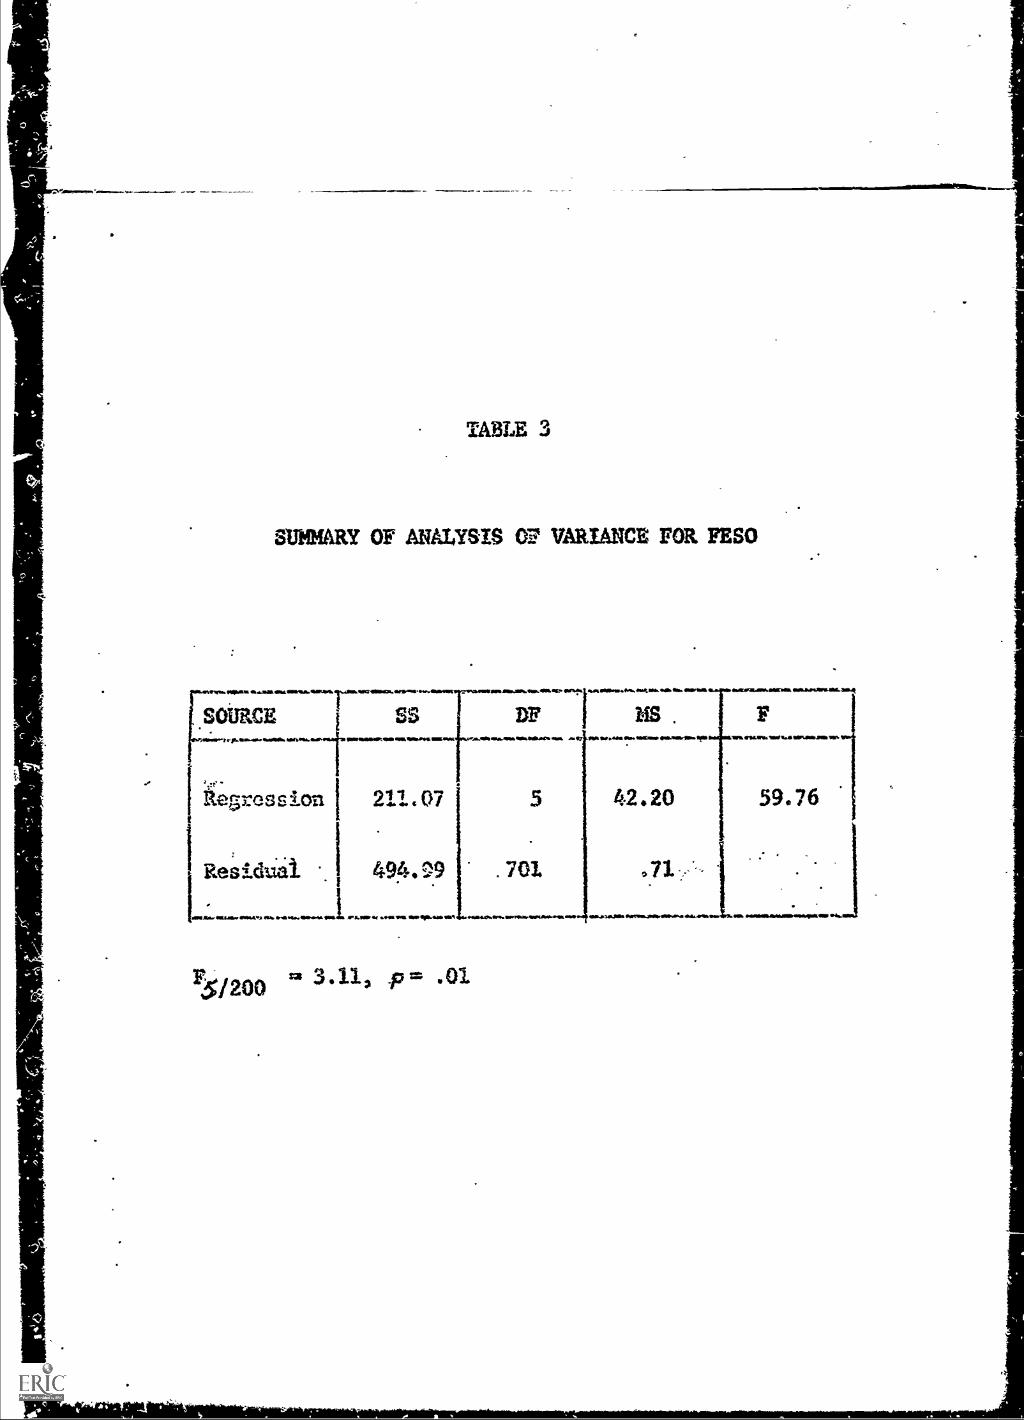
Five predictor (independent) variables produced a
multiple R of .55 and accounted for 30% of the variance on
VESO. The analysis of variance is summarized in table 3.
Table 3 About Here
The data suggest that (a) Von-Spanish families having
the characteristics (b) married, (c) high hope and high ex-
pectancy regarding the zhildrenslArome, (c) someone em-
ployed, (d) high hope and high expectancy with respect to
the father's kind of job will be highest with respect to
"PESO and JOS were at times also used as independent vari-ables, e.g. 2 when predicting to CEF, and EA.

family economic status. The regression
Marital status (-.28); Hope - Expectancy,
Anyone employed (-.19); Ethnic Status (
tancy, Father's kind of job (.13),
Three variables yielded a multtple
counted for 17% of the varianca on CEF.
the analyses of variance.
16
coefficients* were
Child Income (.20);
.17), and Hope-Expec-
R of .41 and ac-
Table 4 displays
Table 4 About Here
The data indicate that families who are (a) higher
on Family Economic Status, and who have high hope and
high expectancy regarding (b) the child's education and
(c) the child's kind of job will tend to be higher on
Child's Economic Future. The regression coefficients
were:a FESO (.26); Hope-Expectancy, Ch%ld's Education
(.18); and Hope-Expectancy, Child's kind of job (AO.
Four variables produced a multiple R of .50 and ae-.
counted for 25% of the variance of EA. Table 5 displays
the analyses of variance.
Table 5 About Here
=02CORMIIMINI=L.71110,
The data suggest that (a) Non-Spanish families who
(b) are higher on Job-OutloOk4tatus, (c) are married, and
(d) have high, hope and high expectancy regarding the moth-
er's kind of job will have higher educational aspirations
*these regression coefficients and those listed subsequently
were based oft predictions to standardized scores.

17
than their counterparts. The regression coefficients were:
JOS (.38); Ethnic Status (.26) ; Marital Status (.17); and
Hope-Expectancy-Mother's kind of job (.16).
Three variables produced a multiple R of .63 and
accounted f ©r 3970 of the variance of Job-Outlook-Status.
The analyses of variance is displayed in table 6.
Table 6 About Here
These data indicate that (a) married families who have
high hope and high expectancy with respect to (b) the chil-
dren's education, and (c) family income will tend to be
highest on Job-Outlook-Status. The regression coefficients
were: Marital status (-.50); Hope-Expectancy, child edu-
cation (.20); and Hope-Expectancy, family income (.16).

TABLE 1
Vo. Family Clusters
I Family ics2slc Stf:iSu2:....g..iomOutlook ESO
Obi .Fact .Coef
What is the highest family income you ever expect
to have per month? .88
How much is your present family income per month? .82
How much would you like for your family income to
be per month? .76
What is the lowest income you over expect to have
per month? .71
Hour much has your family income generally been for
the past five years? .70
Child's Eemomic Futu
What is the highest income you expect him/her to
have per month? .89
What income would you like for (child) to be
making by age 30? .84
Mat income do you expect him/her to be generally
from age 30 to 50? .79
What is the lowest income you expect him /her to
have per month? .67
IIl naiI Reli 3.aus Status (FRS.,
How often do you go to church? 085
How often do your children go to church? .83
How often do you attend religious services? .83
How often does your husband go to church? .71
How often does your child attend church, Sunday
school, or religious services? .70
Gill
How close do you feel you are to God? .87
How happy are you. with your closeness to God? .87
On the whole, am a religious person. .50
How often does your husband attend religious
services? .70
How satisfied are you with the number of times
your children go to church? .61
How satisfied are you with the number of times
you go to church? .61
How satisfied are you with the number of timesyour husband goes to church? .47
IV Closeness to God
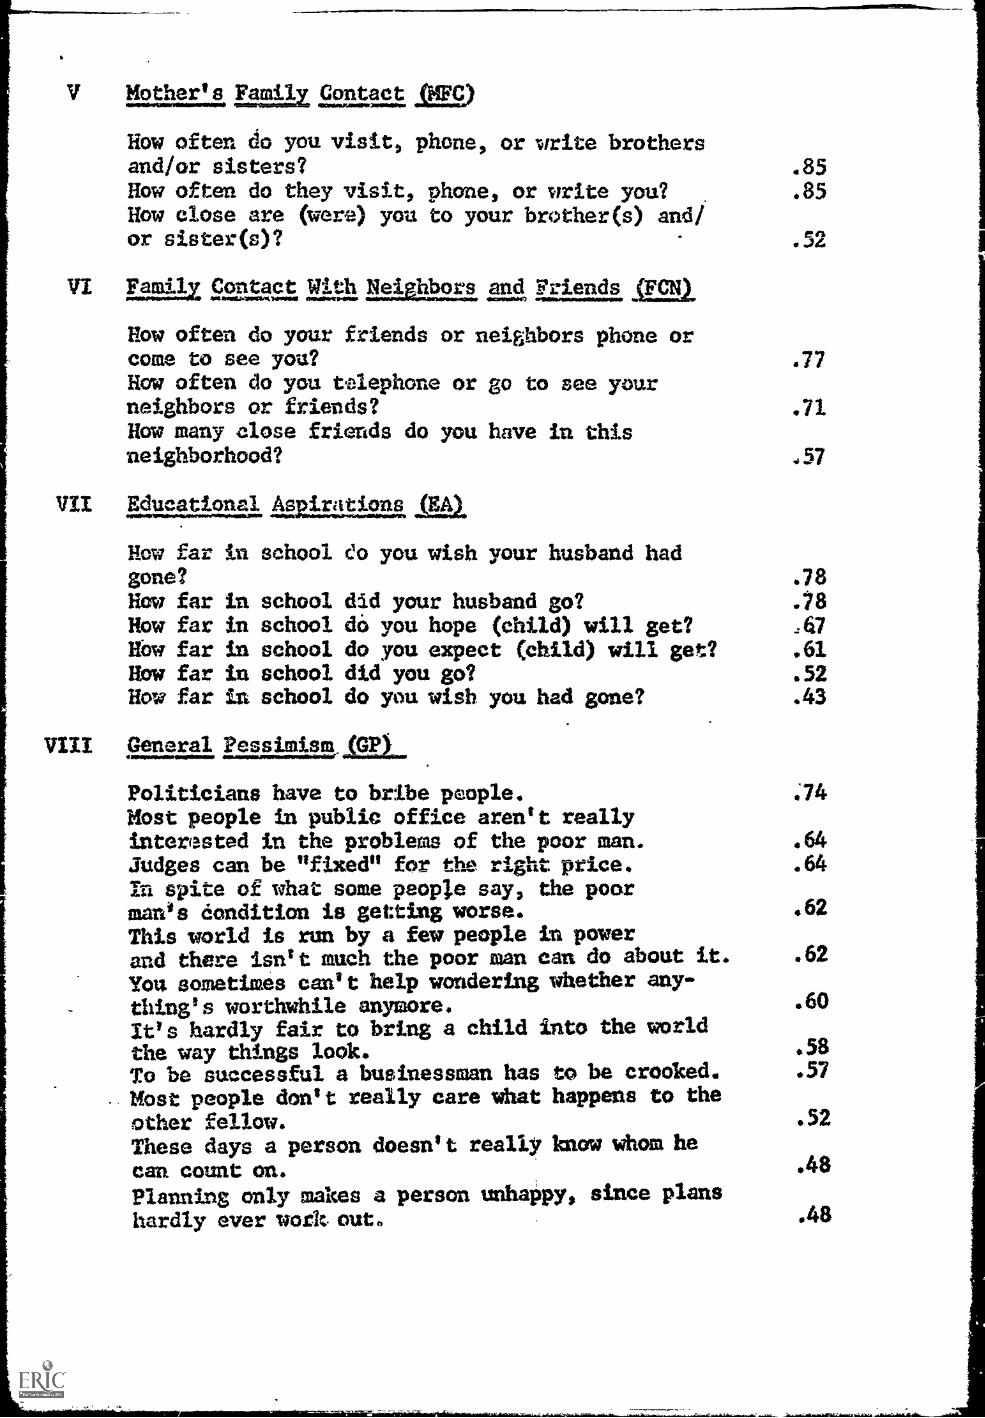
V Mother's Last& Contact ..aca)
How often do you visit, phone, or write brothersand/or sisters? .85Haw often do they visit, phone, or write you? .85How close are (were) you to your brother(s) and/or sister(s)? .52
VI Eagaz Contact Withal:ram and Friends RUN.
How often do your friends or neighbors phone orcome to see you?How often do you telephone or go to see yourneighbors or friends?How many close friends do you have in thisneighborhood?
VII Educational halsatim gA
.77
.71
.57
Haw far in school so you wish your husband hadgone? .78Haw far in school did your husband go? .78How far in school do you hope (child) will get? 267
Him far in school do you expect (child) will get? .61
Haw far in school did you go? .52Haw far in school do you wish you had gone? .43
VIII General Pessimism Dn.
Politicians have to bribe people. .74
Most people in public office aren't reallyinterested in the problems of the poor man. .64
Judges can be "fixed" for the right price. .64
In spite of what some people say, the poorman's condition is getting worse. .62
This world is run by a few people in powerand there isn't much the poor man can do about it. .62
You sometimes can't help wondering whether any-thing's worthwhile anymore. .60
It's hardly fair to bring a child into the worldthe way things look. .58
Jo be successful a businessman has to be crooked. .57
Most people don't really care what happens to the
other fellow. .52
These days a person doesn't really know whom he
can count on. .48
Planning only makes a person unhappy, since plans
hardly ever work, out .48
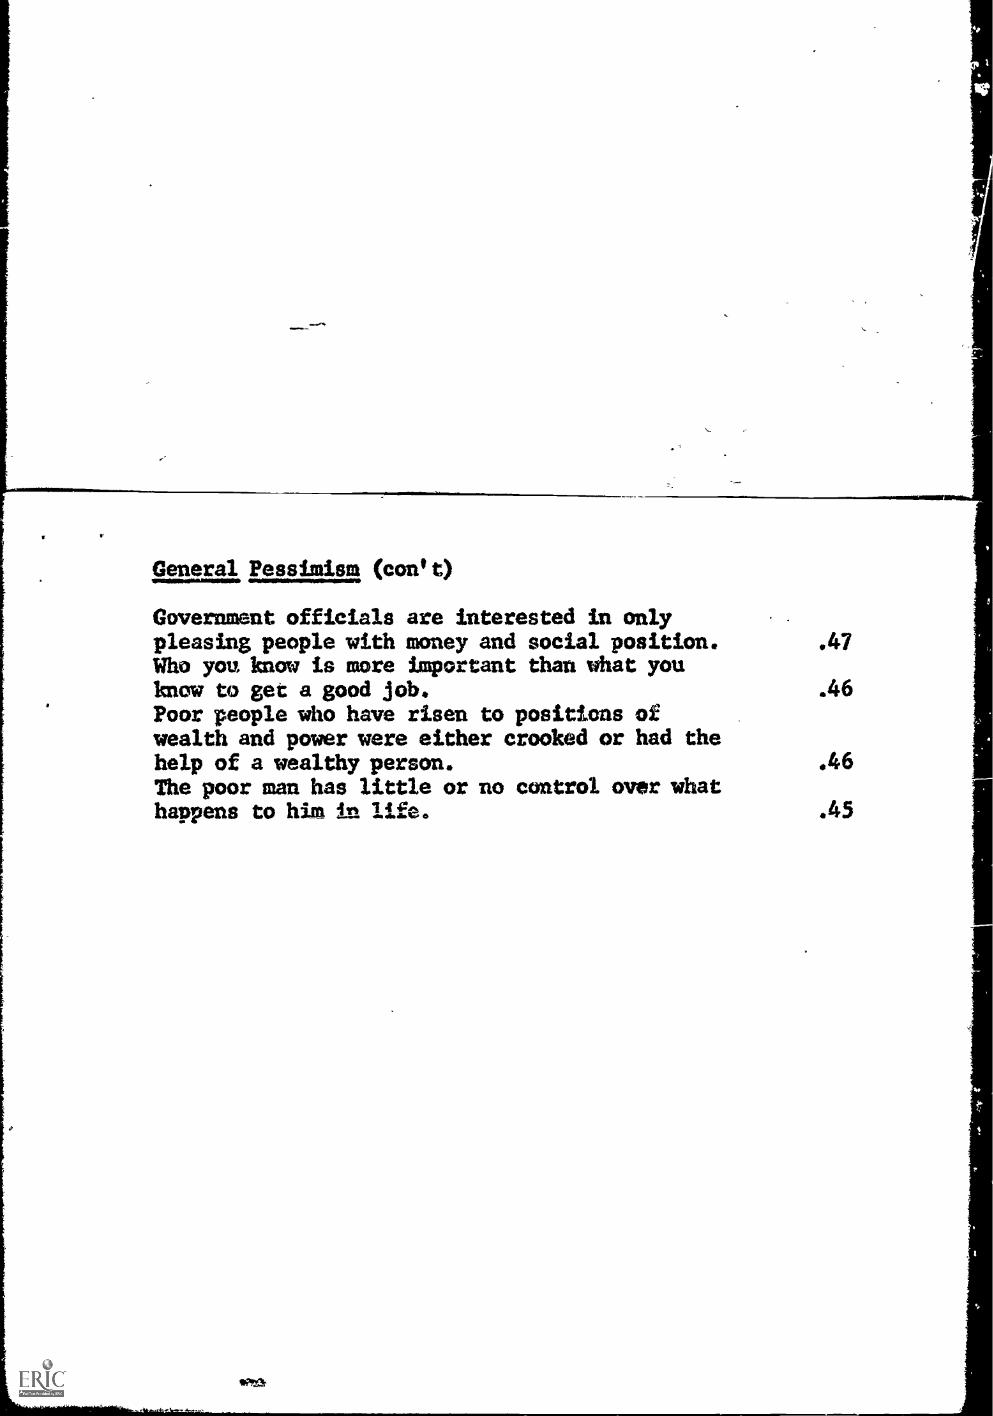
General Pessimism (con' t)
Government officials are interested in onlypleasing people with money and social position.Who you know is more important than what youknow to get a good job.Poor people who have risen to positions ofwealth and power were either crooked or had thehelp of a wealthy person.The poor man has little or no control over whathappens to him in life.
.47
.46
.46
.45

IItT9
0°I0° :70:
0°10°10'
70?-iz0-°
(NO°
0°
00°10°1t0*
6F0°
10in. pr ft° or
9.1. 00. fo.
27I7kO
° 9T' in° V
T°
Z° 00° 0°
'0°lilt '
'r I'Z
If0° TO
°I
Z°
I°I
°0
'
wr
pc°3 T
°I°
0
'47E* tI*1170.
re re
0 to
tr0°-11:0°
9010°
p°
70°
0° WE°
0*-1(0°
1E0°
Z°
L0'
0°
°0° [
1
Z°
Fr
ET
°iI
0°0°
0'-' 0
°W
' TO
'"fr tr"44E0°
0°0° E
O 'E
('
zipt-
fit .t.T
.0
Lt
61 kw0°
1Z
I°
0E
*1 *
0°
0°,
`fit' 01
lue-in°
fl*
arlkillsok.41.11,4111.1,411.11.4
II
i
0114IJIMP
Or
41/0IS
DS
I'1
ET
I)T
,'1-0°
O 100 C
T'
TO
° CC
°I°
I°T
° 0'0°
Ii30°
0° )70°0
0o°
0'0°
0Z
4.-t"0'
I°0°
II°
0°
EE
' IT'
0' ZI' C
O°
I°T
°°M
47C
T.
T
...0° ti.E0°
V°
17I° NY
179°T
0°
ISSO3
rail
SIDIMARY OF ANALYSIS OP VARIANCE FOR PESO
wng.. pawn ..61111.61.116011..."
SOURCEA4i"1,116.1uawiili elIMOear.
':e
R.f?-jreS :3 I on.,..
Resid
...C............A.....*....e.... OM
..011110601/111,s1...MIONM
iSS
- 6011111.NrOW, 01.1.
DF.110.
illems.1...Ortirn..111kfar ~OM
MSIt
IMILWAVNINCula 111014.41AROLAnnq
FIIMIIMMV11111.1111.~01111=som
21.1 . 0 /
494. D9. .
....PM .4 e.IMil 5 0.1.10010 MICt
....11111..14. A.
5
. 701
..1.0.....0...01.40.0...aMO
IPIO V OM Memo& 011611111.11.
42 20
.71
011..30.11041...6.01.01... 0.1164ft
59.76
OM 1111411MAIM04111 04.
FS / 2 0 0 321 3 na p =

SUMMARY OF ANALYSIS OF VARIANCE ON CEF
....... _
SOURCE
..................r......................
SS DF NS F
Regression
Residual
0.c141M
,
I 118.83 1
587.17
1AMPSMANN0.0.MIIJOIWOMWOMMI.....%
3
703
OW .,MOMMOW.4**
39.61 47.42

TABLE 5
SUMMARY OF ANALYSIS OF VARIANCE FOR EA
SOURCE SS I DE MS F I
Regression
Residual
174.22
531.78
4
702
43.56
.76
BM.
57.50
1.2MilliaalINIMMI.IMS41
7 /200 = 3.11, 'p = .01
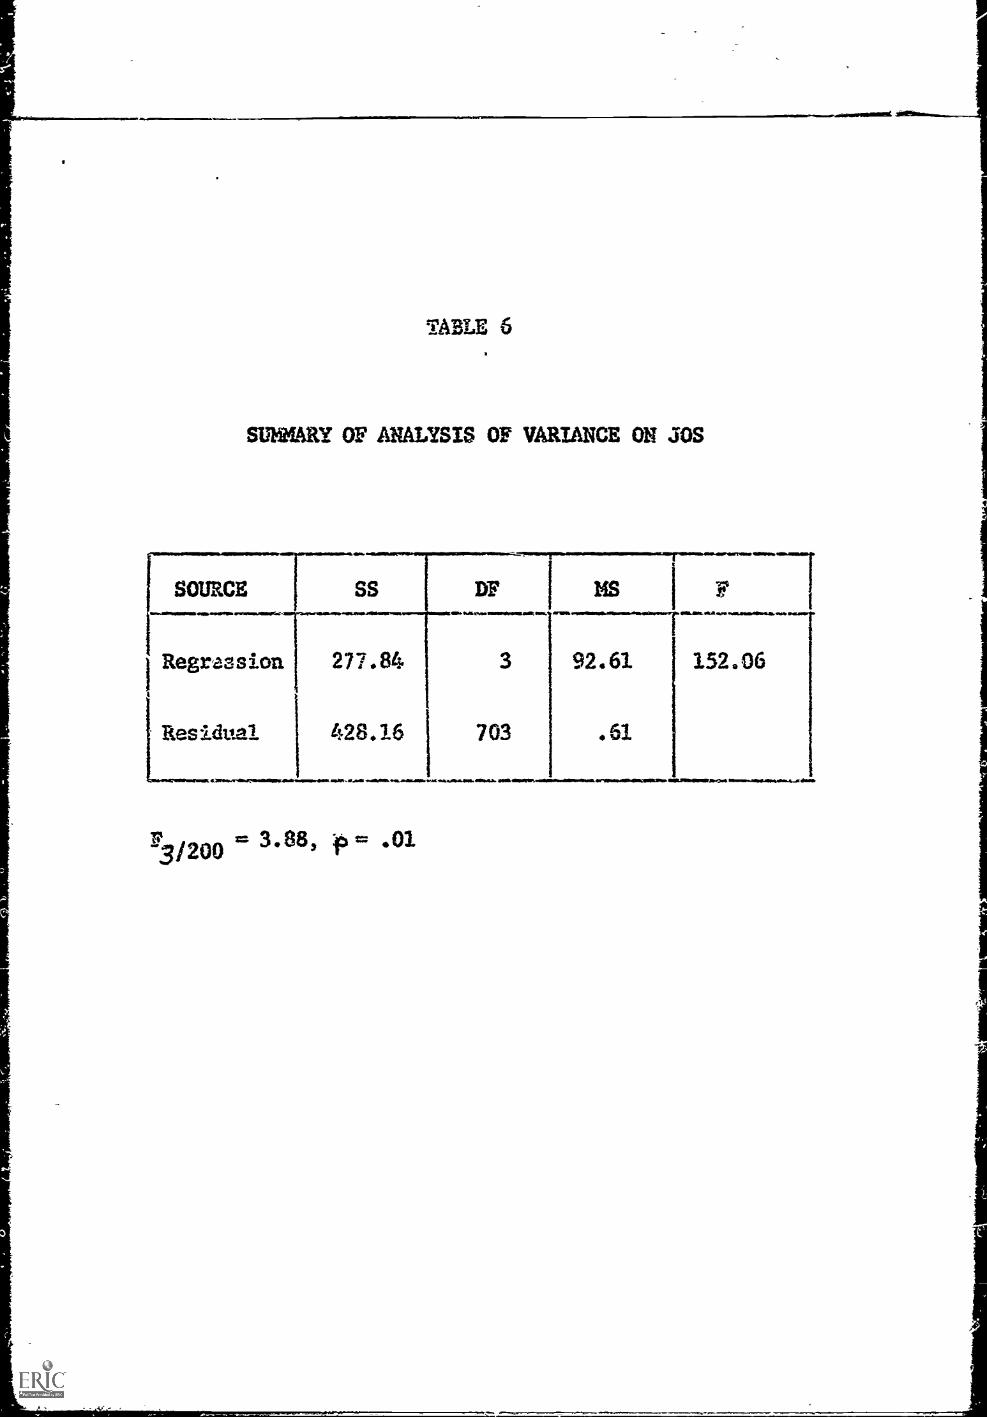
TABLE 6
SUMARY OF ANALYSIS OF VARIANCE ON JCS
SOURCE SS F HS
1 Regrassion 277.84 3 92.61 152.06
Residual 428.16 703 .61
a ........vounrommura.,0-. ..sbe.......m.....a. Ammana. amnommew. -ommonmara...n.ammars.r.r..._Az i
.01

REFERENCES
Draper, N. R. and sloth, n. &gag psErgatim.New York: John Wiley & Sons, Inc., 1966'.
Efroymson, M. A.Ralston andfor DigitalInc., 1962.
tfultiple regression analyses. In AH. W. ME (Eds.) Mathematical MethodsComputers. New York:. 3ohn Wiley & Sons,
Fiske, D. W. Homogeneity and variation in measuring per-sonality. Amer.. Ps!choloPist, 1963, 18, 643-652.
Harvey, Mite, Prather, Alter, Hoffmeister. Teachers'belief systems and pre-school atmospheres. S. Ed.Pach. Dec., 1966.
Tryon, R. C. Bailey, D. E. The PCT System of clusterand factor analvsic: Multivariate behavioral research.In Press.
Tryon, R. C. & Bailey, D. E. B. C. Try user's manual..Boulder, Colorado: University of Colorado GraduateSchool Computing Center, 1965.
Tryon, R. C. & Briley, D. E. The BC Try computer gyutemo: cluster and- factor analysis: Wiltivariate behav-ow.. 4... OR. Ow..., OM eitmal raseara Ttass.
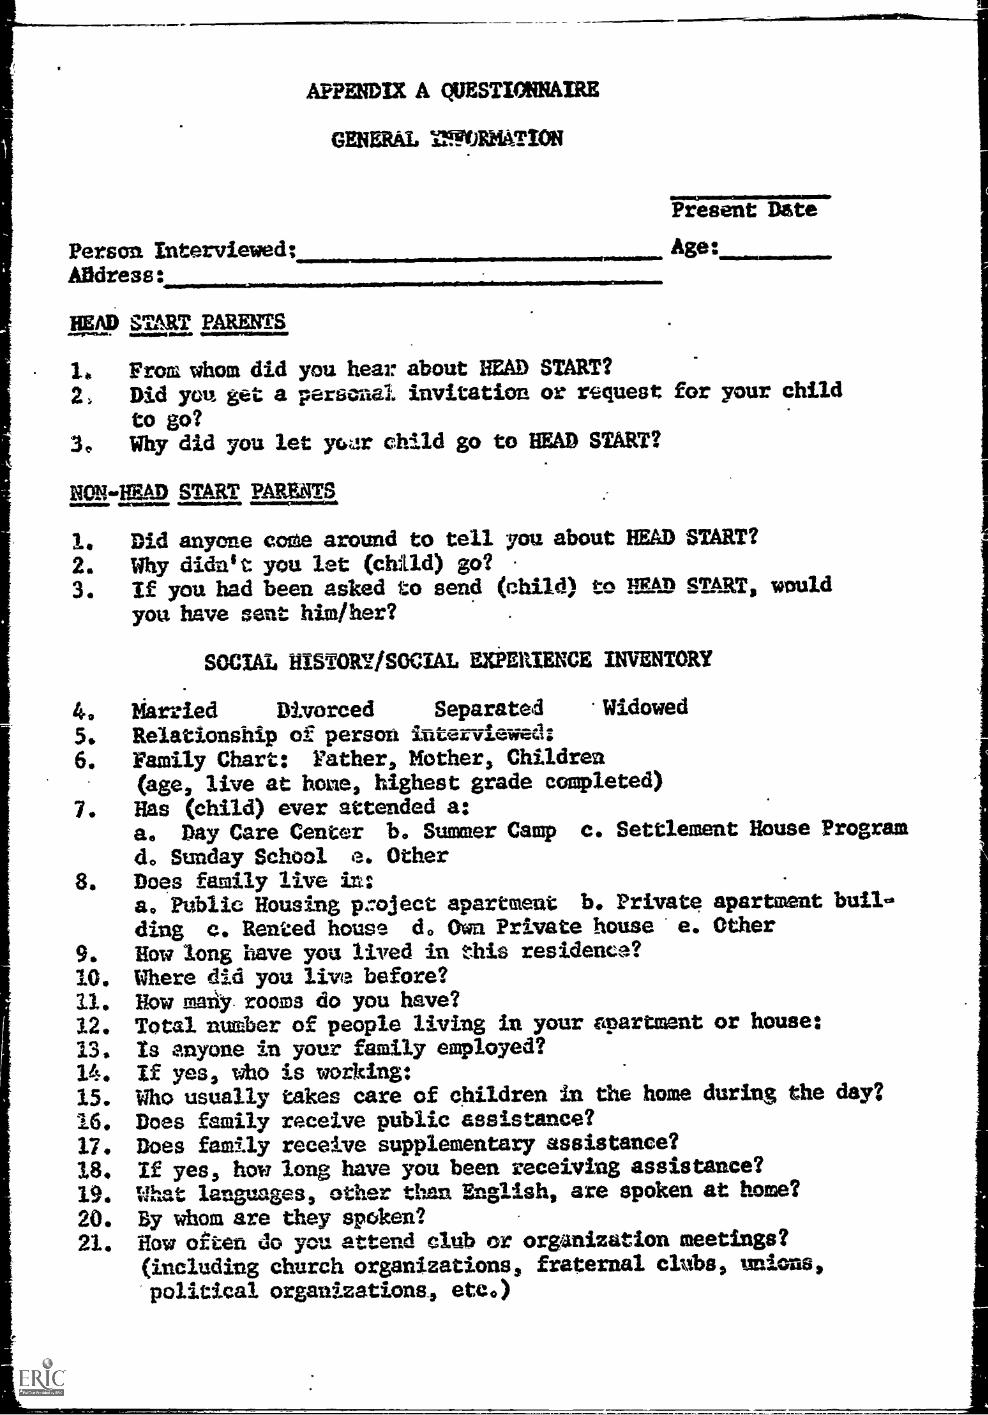
Person Interviewed:A0dress:
APPENDIX A QUESTIMNA/RE
GENERAL Y.4.1)1HAT/ON
Present Date
Age:
HEAD START PARENTS
1. From whom did you hear about HEAD START?
2; Did you get a personal invitation or request for your child
to go?3. Why did you let yGar child go to HEAD START?
NON-HEAD START PARENTS
1. Did anyone come around to tell you about HEAD START?
2. Why didn't you let (child) go?3. If you had been asked to send (child) to min START, would
you have sent him/her?
SOCIAL HISTORY/SOCIAL EXPERIENCE INVENTORY
4. Married Divorced Separated Widowed
5. Relationship of person Liter-viewed:
6. Family Chart: rather, Mother, Children(age, live at bone, highest grade completed)
7. Has (child) ever attended a:a. Day Care Center b. Summer Camp c. Settlement House Program
d. Sunday School e. Other8. Does family live in::
a. Public Housing voject apartment b. Private apartment buil.-
ding c. Rented house d. Own Private house e. Other
9. Hourlong have you lived in this residence?10. Where did you live before?U. How many roams do you have?12. Total number of people living in your apartment or house:
13. Is anyone in your family employed?14. If yes, who is working:15. Who usually takes care of children in the home during the day?
16. Does family receive public assistance?17. Does family receive supplementary assistance?
18. If yes, haw long have you been receiving assistance?
19. What languages, other than English, are spoken at home?
20. By whom are they spoken?21. How often do you attend club or organization meetings?
(including church organizations, fraternal clubs, unions,political organizations, etco)

22. h/w often does your husband attend club or organizatien meet-
in. s? (including church organizations, fraternal clubs, unions,
politica/ organizations, etc.)
23. Do you iauv c. a:
a. Radio b. T.V. c. Phonograph d Tape Recorder
24 On the average how many hours a day do you listen to
a. Radio b. T.T. c. Phonograph d, Tape Recorder
25. On the averase bow many hours a day does your husband listen to:
a. Radio b. T.V. c. Phonograph d. Tape Recorder
26. On the average how many hours a day does your child listen tot
a. Radio b. TwV. c. Phonograph d. Tape Recorder
27, How often do you go to the movies?
28. How often does your husband go to the movies?
29. How often does your child go to the movies.?
30. How frequently-do you read the newspapers?
31. How frequently does your husband read the newspapers?
32. How frequently do you do the following:
a. Attend sporting event b. Participate in sporting event
c. Read a bo It or magazine d. Go to visit friends or relatives
eu Entertain friends or relatives at home f. Eat in restaurants
g. Attend concerts, plays, or exhibitions h. Go to picnics,
outings, swimming i. Informal neighborhood group contacts
(meeting with friends on the street, town square, etc.)
33. How often does your husband do the following:
a. Attend sporting event b. Participate in sporting event
co Read a book or magazine d. Go to visit friends or relatives
co Entertaim friends or relatives at home f. Eat in restaurants
g. Attend concerts, plays, or exhibitions h. Go to picnics,
outings, swimming i. Informal neighborhood group contacts
(meeting with friends on the street, town square, etc.)
34. Do you usually vote in elections:
a. City b. county co State d. National
35. Does your husband vote in elections:
a. City b. County c. State d. National
36. How many times have you moved to a new town or city in the
last two years?
37. Hoer many times have you moved within the same town or city in
the last two years
330 Haw many trips of over 50 miles, aside from changing resi-
dence have you taken within the last two years for:
a. recreation or personal reasons b, business purposes
39. How many trips of over 50 miles, aside from changing resi-
dence, has your husband taken within the last two years for:
a. recreation Or personal reasons b. business purposes
40. Hove ycu ever traveled any distance more than 50 miles) by:
a. car b. bus c. train d. plane e. passenger boat
zef, Do you have any of the following hobbies?
a. Collecting stamps, coins, etc. b. gardening c. painting
d. sewing e, photography Zu playing musical instrument
g. other (please specify)

42. Does your husband have any of the following hobbies?
a. collecting coins, stamps, etc. b. gardening c. painting
d. carpentry ee photography f. automotive, electronic, ormechanical work go playing musical instrument h. fishing
or hunting i. other (please specify)
43. How many times in the past year has your child gone to a:
a. library bo small grocery store, butcher shop or produce
stand c. supermarket d. post office e. playground f. zoo
g. museum, art gallery, or exhibition h. airport I. railraad
station Fire Station -k. bank I. department store
E6 athletic event n. eaten in a restaurant o, parade p. circus
or fair q0 park r. beach, lake or pool s. car rides t. gas
station45. Does your child have, or has he had any of the following types
of pets?a,, dog b. eat c. bird d pet fish e. turtle f. hamster
g. other (please specify)
46. How many of the following are in the home?
a. toys or games b. books or children's magazines .c. child-
rens phonograph records d. crayons, papers, paints, etc.
47. Does your child have his own:a. radio b. phonograph
48. Your child shares his bedroom with how many other persons?
ae children b. adults
SOCIAL MOTIVATION-ASPIRATION SCALEINC(
49. Row much is your present family income per week?
50. How much has your family income generally I3een for the past
five years?51. How much would you like for your family income to be per week?
52. What is the highest family income you expect to ever have per
week?53. What is the lowest income you expect to ever have per week?
54. Now pleased are you with your present income?
a. very pleased b. somewhat pleased c. somewhat displeased
d. very displeased55. that income would you like for (child} to be raking by the
time he/she is 30? (per week)
56. What is the highest income you expect him/her.to have? (per week)57. What is the lowest income you expect him/her to ever have? (per
week)58. What income do you expect him/her to generally have from the
time he/she is 30 to 50 years old? (per week)
FRIERS59. How many close friends (other than your immediate family and
close relatives) do you have? (All friends wherever they live.)
60. How satisfied are you with the number of friends you have?
61. How many close friends do you have in this neighborhood?
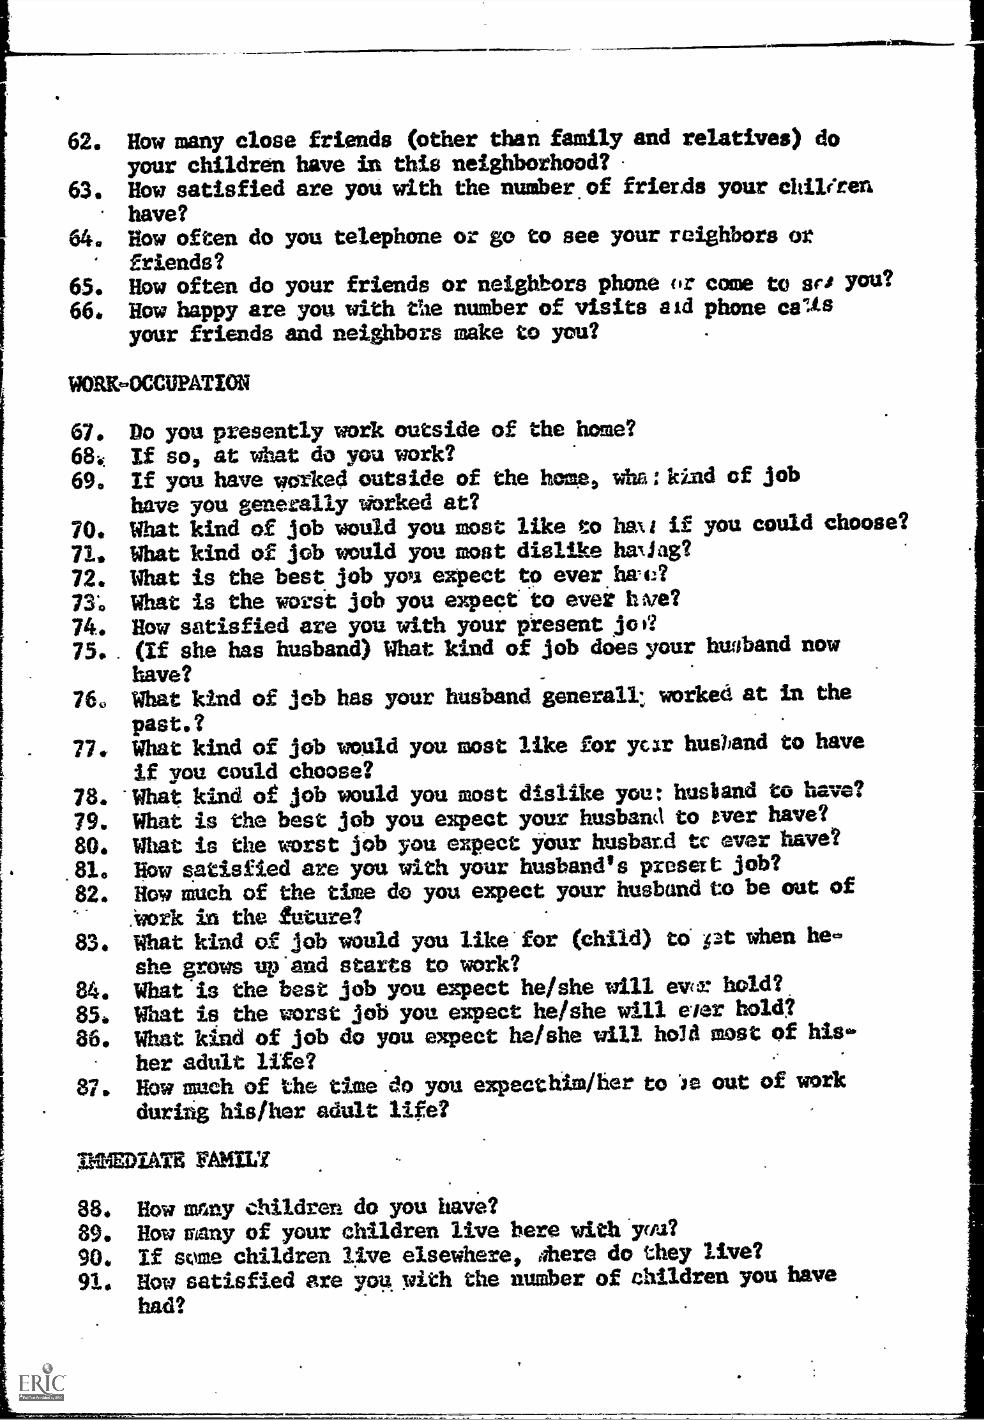
62. How many close friends (other than family and relatives) do
your children have in this neighborhood?
63. How satisfied are you with the number.of friends your chiletea
have?64. How often do you telephone or go to see your reighbors or
friends?65. How often do your friends or neighbors phone or come to sr, you?
66. How happy are you with the number of visits aid phone cets
your friends and neighbors make to you?
WORK OCCUPATION
67. Do you presently work outside of the home?
68: If so, at what do you work?
69. If you have worked outside of the home, whe: kind of job
have you generally worked at?
70. What kind of job would you most like to taxi if you could choose?
71. What kind of job would you most dislike hathig?
72. What is the best job you expect to everture?
73. What is the worst job you expect to ever hwe?74. How satisfied are you with your present joa
75. (If she has husband) What kind of job does your huaband now
have?760 What kind of Job has your husband general) : worked at in the
past.?77. What kind of job would you most like for ycax husband to have
if you could choose?
78. What kind of job would you most dislike you: husband to have?
79. What is the best job you expect your husband to ever have?
80. What is the worst job you expect your husband tc ever have?
81. How satisfied are you with your husband's preset job?
82. How much of the time do you expect your husband to be out of
,work in the future?83. What kind of job would you like for (child) to cat when he.-
she grows up'and starts to work?84. Ifiat'is the best job you expect he/she will ewr hold?
85* What is the worst job you expect he/she will ear hold?
86. What kind of job do you expect he/she will hold most of his
her adult life?87. How much of the time do you expecthimi/ber to )e out of work
duritig his/her adult life?
MEDIATE EMU
88. How many children do you have?
89. How many of your children live here with 'y(/.t?
90. If some children 2,ive elsewhere, hero do they live?
91. How satisfied are you with the number of children you have
had?
92. How close is your family?93. 'How happy is your family at present?94. How satisfied do you think your children are with you as
a mother?
CLOSE RELATIVES
95' How many brothers have you? How many sisters?96. Is your mother still living?97. Is your father still living?98. if not living with you, where does your mother live?
.99A If not living with you, where does your *her live?100. How often do you visit, phone, or write to your brother(s)
and/or siatee,p)?/04 How often do your brother(s) and/or sister(s) visit, phone
or write. to 'yon?102.. (To be asked if parent(s) do not live with respondent) :
How often do you visit, phone or write to your parents (ifthey live together)?
103. How often do you visit, phone, or write to your father?104. How close are (were, if deceased) 5iou to your mother?105. How close are (were, if deceased) you to your brother(s)
and/fir .sister(s)?106. How close are lwere) you to your father?107: How happy are you. about your closeness to your brother(s)
and/or sister(e)?108. How happy are you about your closeness to your mother?109. How happy are you about your closeness to your fatheeoramitimOU AVWTITAVVIIMU15130440461 rsz; .2.4614.06.S. 4~4'cadasimmillftt
110. What church, if any, do you belong to?111. How often to you go to church?112. How often do your children go to church?113. How often does your husband go to church?114. How. often do you feel you should go to church?1151 How often do you feel your husband sb.oulel go to church?116. How often do you feel your children should go to church?117. How s..tisfied are . you with the number of times you go' to
cb.urch?118. HOW satisfied are you with the number of times your husbiand
goes to church?119. How satisfied are you with the. number of times your children
go to: church?120. How close do you feel you are to God?121. How happy are you with your c/oseness to God?
GOVERMENT
122. Now much say do you feel you could have in what the localgovernment officials do if you really wanted to and tried?

123.
124.
125.0
126.
127.
How much say would you like to have in what local government
officials do?How satisfied are you with the influence you feel you could
have on government officials?
How much say do you feel poor people could have in what local
government official4 do if they wanted to and tried?
How much influence would you like for the poor people to be
able to have on local government officials?
How satisfied are you with the influence poor people can have
on local government officials?
EDUCATION
128. Haw Ear in school did you go?
129. How far in school.dld your husband go?
130. How far in school do you wish you had gone?
131. How.far in school do you wish your husband had gone?
132. How satisfied are you with the amount of schooling you have
had?133. How satisfied are
husband has had?
134. How far in school
135. How far in schoolANOMIE
136. On the whole, I am a religious person.
/37. There is. no use in a poor man voting because his vote doesn't
count anyway.138. The poor man has.little or no control over what happens to
his life.139. Government officials are interested only in pleasing people
who have money and social position.
140. The poor man has as much control as anyone else over what
happens to him in life.
141. Government officials are as interested in serving the poor
people as the better off people.
142. If you are born into a poor, family, there is no chance of
moving out of the poor and working class.
143. Poor kids aren't treated as fairly by school teachers as the
other kids are.
144. Even if you are born into a poor family, there are manyhonest and fair uays you can improve your position. in life
if you will only take advantage of them.
145. If you have a good enough education you can get ahead. whether
you were born into a poor family or not.146. With equal training and education, a poor boy would have
much less chance of getting a good job than would a boy
from a wealthier family.
147. Many people who are born poor can rise to positions of wealth
and power through their own honest abilities and efforts.
148. People who were born poor and have risen to positions of
you with the amount of schooling your
do you hope (child) will get?do you expect (child) will get?

wealth and power were either crooked or had the help of sorewealthy person.
149. Nowadays a person has to live pretty much for today and lettomorrow take care of itself.
150. This world is run by the few people in power, and there is notmuch the poor man can do about it.
151. To be successful, a businessman has to be crooked.152. Who you know Ls more important than what you know in getting
a good job.153. Children are amuisance to their parents.154: Things are getting better for the poor man.155. People like me can change the way things are if we make our-
selves heard.156. Most public officials are really interested in the problems
of the poor man.157. Planning only makes a person unhappy since your plans hardly
ever work out anyway.158. These days a person doesn't really know whom he can count on.159. The average poor man has a say in government decisions.160. Judges can be "fixed" for the right price.161. Its hardly fair to bring a child into the world with the
way things look.162. Politicians have to bribe people.163. In spite of what some people say, the condiaon of the poor
man is getting worse.164. This world could not run without the help of the poor man.
165. Most people don't really care what happens to the otherfellow.
166. In getting a good job, it's necessary to say you're betterthan you are/.
167. More and more I feel helpless in the face of what's happeningin the world today.
168. You sometimes can't help wondering wheher anything is worth-while anymore.
169. Most people in public office are not really interested in theproblems of the poor man.
Do you know anyone else in this block who has a child going to school
for the first time this September who was not in HEAD START?Do you think they would have sent him/her?
How well do you know the family?
Name
HowAddress Would send Would not well
known
Intervieweraw111101101111
,19
Date

TEE CHILD 006 TEST Ru
PREPAPATION dD PRGIMIZIESniabA4W..6"1116 1.0.0404.:0011
The final phase of th'e Teacher4upg-Paront inter-
actioa Study uva to test the children on vhom gamily
and public-school data were available. TC the child had
attended Head Starf- data on the Bead Stare: teadher sieve
included. 282 children ilere tc-Isted; but complete data
were available for only 160 of these.
The testing materials, described below, were de-
signed and pretested before use, A manual was prepared
for egch experimrter; demonstrations of., testins pioaee-
ures presented; and each experimenter spent a minium
of one week practicing administering the tests. Inasmach
as all statements by the agperimanter and all statements
by the respondents Imre taped, it was possible-to cheCk
WZ.4.21 C44%;3.2 trin.m.-4.4meatet until allthe vvvilnes44^^
were ready to administer the tests to meet the standardd
set.
TESTIG MATERIALSmor.wiwom=or...tea no. sametedueibahts.r...ftere**Amhow
The testias materials consisted of Smm. vovie Cam
of 13 briof situations, each-aimed at one or to thm-
retically relevant aspects of the childts behavlor. The
scenes and the ratioaale for the inclusion !ore:
C4) ::72alealaMeltE
Five scenes related to the elilAis conception o4
(Nt physical csusaiiq And to veW-lots to event that ran
counter to these conceptions.
<12) The first two scenes involved displacemmt and
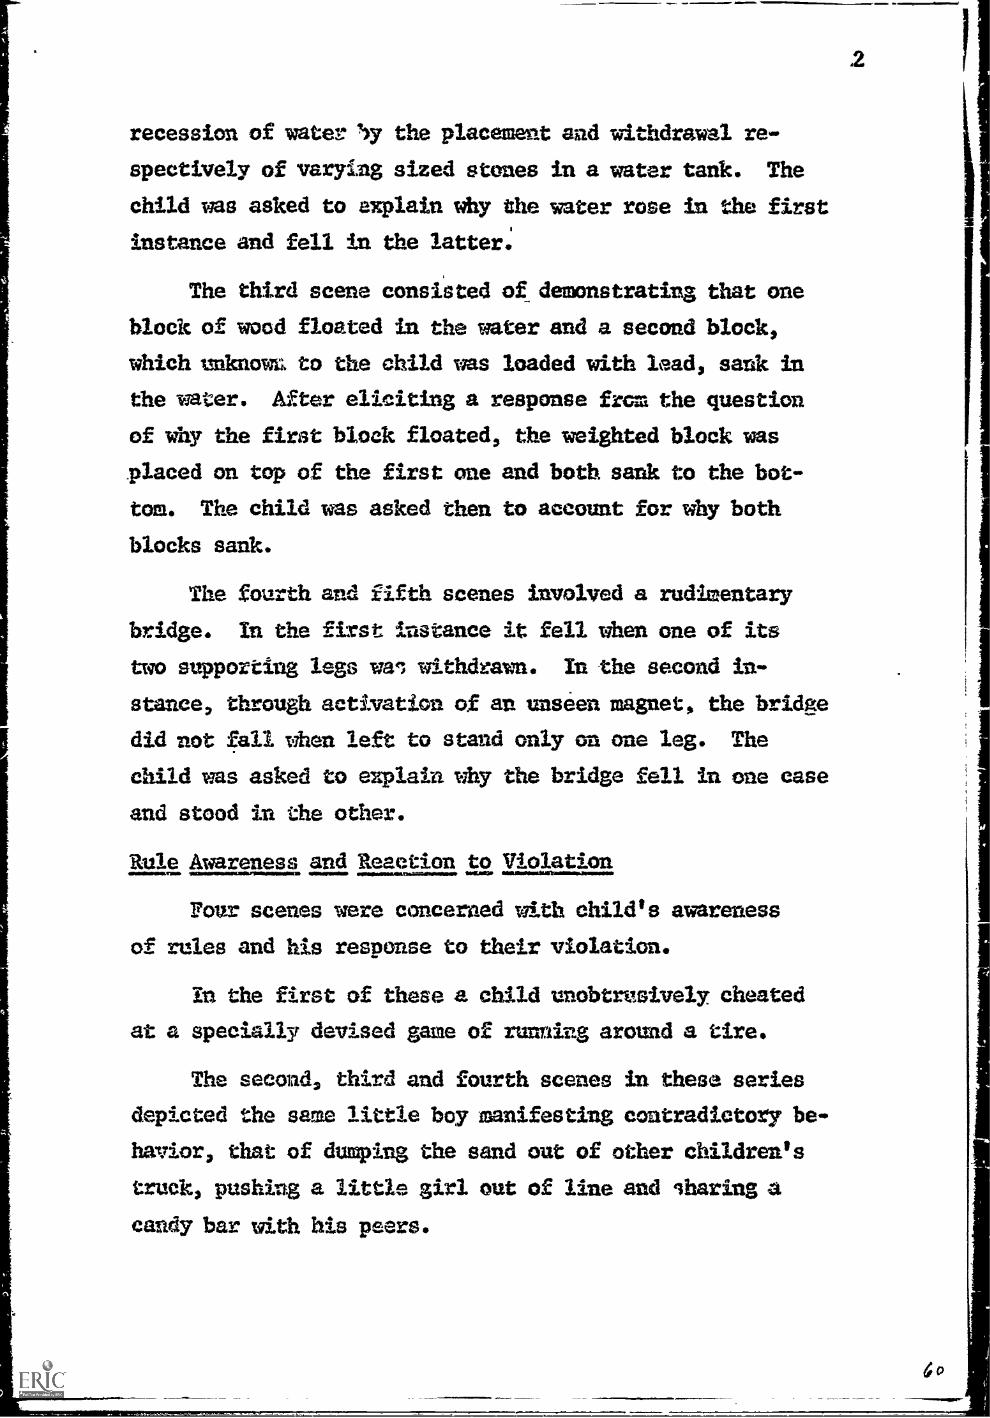
recession of water by the placement and withdrawal re-
spectively of varying sized stones in a water tank. The
child was asked to explain why the water rose in the first
instance and fell in the latter.
The third scene consisted of demonstrating that one
block of wood floated in the water and a second block,
which knom to the child was loaded with lead, sank in
the water. After eliciting a response frGm the question
of why the first block floated, the weighted block was
placed on top of the first one and both sank to the bot-
tom. The child was asked then to account for why both
blocks sank.
The fourth and fifth scenes involved a rudimentary
bridge. In the first instance it fell when one of its
two supporting legs waI withdrawn. In the second in-
stance, through activation of an unseen magnet, the bridge
did not fall when left to stand only on one leg. The
child was asked to explain why the bridge fell in one case
and stood in the other.
Rule Awareness and Reaction to ViolationwourrowsZsgooms. ONIUMENOMMSIMMINO
Four scenes were concerned with child's awareness
of rules and his response to their violation.
In the first of these a child unobtrusively cheated
at a specially devised game of running around a tire.
The second, third and fourth scenes in these series
depicted the same little boy manifesting contradictory be-
havior, that of dumping the sand out of other children's
truck, pushing a little girl out of line and Sharing
candy bar with his peers.
2
Go

These scenes yielded a measure of the child's aware-
ness of rules, his response to their violation and his
ability to account for the simultaneous possession of
positive and negative characteristics (bad-good boy) in
the same person.
Moral Absolutists
This was measured by two scenes both of which relate
to the immediate/y preceding ones. However, the atxn of
these two scenes were aimed at testing an assertion by
Piaget that children of ages comparable to those in this
study do not distinguish between intentionality aud ac-
cident in their evaluation. and "moral" response. Thus
in one scene er little boy was helping his mother clear
dinner dishes from the table when he clearly stubbed
his foot, fell and smashed the dishes. In the other
scene the same boy, when his mother turns her back, de-
liberately breaks the dishes by jerking them and the cloth
from the table.
The child is asked to give his interpretation of
the goodness-baeness of the two situations and to indi-
cate that should happen to the dish breaker in each in-
stance.
Awareness of Social Roles atd Reaction to their Violation
In the first of the two scenes aimed at assessing
this, a female teacher appears on the playground eating
an ice cream bar. She drops the ice cream in a sandbox
where children are playing and has a temper tantrum.
3

In the second scene a little boy gives a bottle filled
with milk to a father who quits sucking his thumb and, ly-
ing on his back begins to suck the bottle.
In addition to the 13 filmed scenes, the children res-
ponded to Card X from. the child's Rorschach test. Tuese
responses were scored to yield measures of a child's nov-
city, openness, etc., criteria that were thought to relate
to creative ability and abstractness.
Guided by the same theoretical rationale that resulted
in the testing materials, rating scales of 275 items were
constructed to be used in scoring the tape recorded responses
of the children to the movie scenes. The rating dimensions
were aimed at tapping the child's efficiency in communica-
tion, accuracy of descriptions of events before and after
the experimenters' statements, iaovelty of proposed solui-
tions, affect, punitiveness, oughtness of rules and roles,
Rnowledgeability, and ability to tolerate conflicting char-
acteristics in the same person.
judges were trained to make judgments of the child's
responses in pairs, it having been found in several of our
previous studies that both validity and reliability of the
scales were enhanced by two judges instead of one.
Reliability checks run before judging commenced were
.e.832.. .
plapsdent Variables
Of the original 275 items used for scoring the tapes
because of the homogeneity within our subject population

14
only 67 items had sufficient variant:, to be used in sub-
sequent analyses. These were factor analyzed using Tryon's
system of cluster analysis (Tryon & Bailey, 1965; Tryon
& Bailey, 1966). Five clusters were generated which ac-
counted for 67% of the initial communality and 89% of
the mean square of the raw correlation matrix. These fac-
tors were labeled Cognitive Attainment, (CA.); Role/Rule
AbsoluAisin MO; Punitiveness (P) ; Overall Oughtness (DO),
and Tendency to Perseverate (Ti'). They, their represeata
tive items, and factor coefficients are in Table 1.
Table I. Molt Nara
These factors and the child's ?Lg. were the dependent
variables used in subsequent analyses.
Inde endent Variables_
Four different sets of variables provided the data for
analysis. First, i4ormation regarding family status, and. . :
aspirations. These included nine factors, six, satisfaction
scores, five hope-expectancy scores and 3 additional fac-
tors listed under "Family" in Appendix A.
Second, a group of variables describing the child'
also listed in Appendix A.
Third, a set of variables describing the beliefs of
the Head Start teacher and/or those of.the teacher in whose
class the child was placed in the subsequent school year.
5

6
These beliefs, their assessment and description aredetailed in part one of this report,. "Teachers' beliefs,classroom atmosphere and student behavior." This samereport gives more detailed information on the set of 3factors describing the classroom atmosphere experiencedby the child listed last in Appendix A.
RESULTS
The initial approach to .the data was to use "t"tests and 3-way analyses of variance. The former 40proach yielded a wealth of significant "ells and thelatter(432)sets of 3 way analyses of variance which itwas virtually impossible to integrate. A step wisemultiple regression procedure (Efroymson., 1962; Draper &Smith, 1966) was selected to overcome both problems.Such a procedure (a) removed the variance from one (orwore) independent variables before ascertaining the"effects of another.; and (b) made it possible to evalu.ate the effects of all independent variables simultan-eously.
The correlation matrix for the independent (predictor)and dependent (criterion) variables is displayed in Table 2.
~1PWIIMPirtIANWANEMINIMMONIIIN~M~11141110ROWINKVIIII
table 2 !Mout Here

7
Three dependent variables yielded multiple R's both
significant (p K.01), and large enough (R k.30) to war-
rant further consideration. They were I.Q., Cognitive
attainment,* and Overall Oughtness.
Three independent variables produced a multiple R of
.39 and accounted for 15% of the variance on IA. The an-
alysis of: variance is summarised in Table 3.
Table 3 About Here
11111111MIIIMP
The data suggest that (a) Caucasian children who
(b) have a teacher who is 11110 :i resourceful and who (c)
came from a family with higher hopes, expectations, etc.,
with respect to the child's economic future (CEF), will. .
tend to have a higher.I.Q. than their counterparts. The
regression coefficients were: Ethnic status (-.34);
Resourcefulness (.18); and CEF (.17).
Two variables yielded a multiple R of .59 and.pre-
0.ceed 35% of the variance of Cognitive Attainment. The:
analysis of variance, is summarized in Table .4.
ti
Table 4 Abotit,Itece
momommumarivolimammemmilms.SS,
1".Q. included as predictor indepdndent varia4e,forc;-.1t.w.:1.= =Lab.% th-4a 11..,aclf.
, s't
** these regression coefficients and those listed subse-
quently were based on predictions to standardized scores.
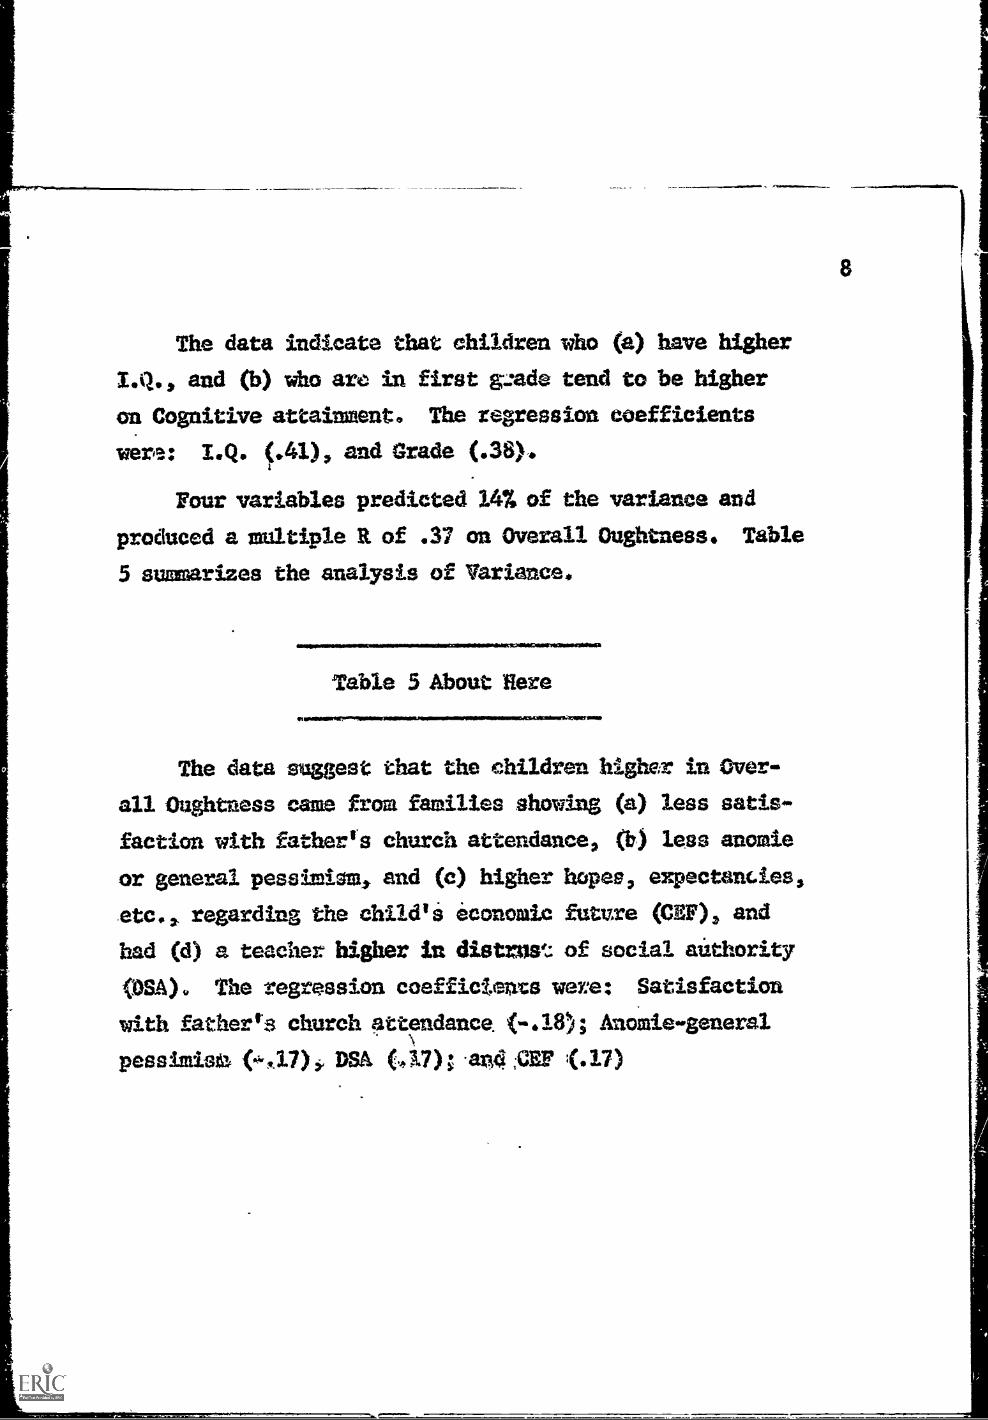
The data indicate that children who (a) have higherLg., and (b) who arc in first grade tend to be higheron Cognitive attainment. The regression coefficientswere: I.Q. (.41), and Grade (.38).
Four variables predicted 14% of the variance andproduced a multiple it of .37 on Overall Oughtness. Table5 summarizes the analysis of Variance.
VICIt*O11111111NIP
Table 5 About Here
The data suggest that the children higher in Over-all Oughtness came from families showing (a) less satis-faction with father's church attendance, (b) less anomieor general pessimism, and (c) higher hopes, expectancies,etc.,. regarding the child'i economic future (CHF), and
had (d) a teacher higher in distrust,: of social authority()SA). The regression coefficients were: Satisfactionwith fatherts church attendance. (-.18); Anomie-generalpessimisa DSA (.1.7); -and ;CEF (.13)
8
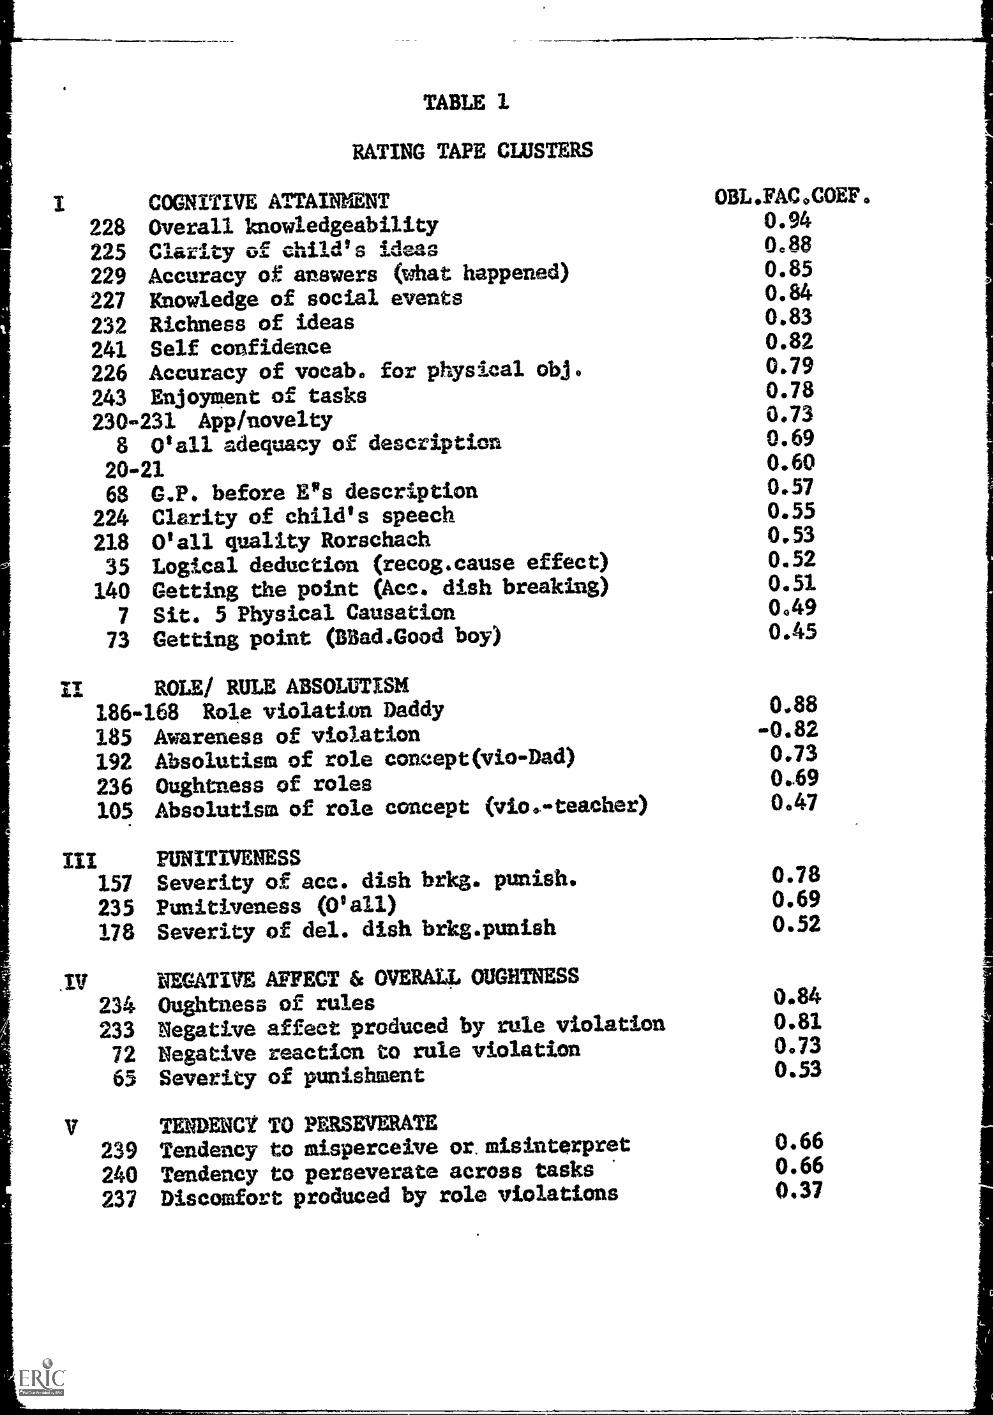
TABLE 1
RATING TAPE CLUSTERS
COGNITIVE ATTAINMENT228 Overall knowledgeability225 Clarity of child's ideas229 Accuracy of answers (what happened)
227 Knowledge of social events
232 Richness of ideas
241 Self confidence226 Accuracy of vocab. for physical obj.
243 Enjoyment of tasks230-231 App /novelty8 Wall adequacy of description
20-2168 G.P. before E"s description
224 Clarity of child's speech218 Wall quality Rorschach35 Logical deduction (recog.cause effect)
140 Getting the point (Ace. dish breaking)
7 Sit. 5 Physical Causation73 Getting point (aBad.Good boy)
..wdwawwx.mPiI.N.4NW''Nreql1.,,,,m.
II ROLE/ RULE ABSOLUTISM"-
186-168 Role violation Daddy185 Awareness of violation192 Absolutism of role concept(vio-Dad)
236 Oughtuess of roles105 Absolutism of role concept (vio.teacher)
III157235178
,IV
2342337265
V239240237
PUNITIVENESSSeverity of acc. dish brkg. punish.
Punitiveness (0' all)Severity of del. dish brkg.punish
NEGATIVE AFFECT & OVERALL OUGHTNESSOughtness of rulesNegative affect produced by rule violation
Negative reaction to rule violation
Severity of punishment
TENDENCY TO PERSEVERATETendency to misperceive or. misinterpret
Tendency to perseverate across tasks
Discomfort produced by role violations
OBL.FAC.COEF.0.940.880.850.840.830.820.790.780.730.690.600.570.550.530.520.510.490.45
0.88-0.820.730.690.47
0.780.690.52
0.840.810.730.53
0.660.660.37

SF1le
r.S.
.....S
IIS
"C
EA
EA
?GP
'FP'
.FR
EM
P .h
.SS
JOE
43G
!R
FC I
TC
NE
X-
HE
M. 1
13E
C .
it C
SHJ
h28
...:C
IFE
S
l
SIR
E13
-09
1SH
SE09
,08
44SM
IC14
0401
-04
t
SI-f
SC18
0502
0159
3CC
1903
.05
0376
.
52.
.
PESO
.25
-09
1004
1103
09
C.E
F13
0516
07-0
968
1403
.16
EA
0206
1913
06-0
109
3034
FGP
-04
1304
1107
0210
L15
00-0
6FP
R05
-05
1006
6146
5710
0211
02H
EFI
11-1
200
0216
06i 1
062
2131
1910
..
HE
CI
0801
0707
0409
I10
1639
21-0
7-0
630
HE
HW
13-0
312
0008
n03
12 -
1317
-13
-.02
1707
RE
M02
0614
6507
0212
1320
'32
-13
0619
2511
HE
CE
1503
3020
1008
0921
3568
-00
0624
2812
36FR
.02
-00
1304
-28
0923
3109
21-0
4-1
933
.-1
2-0
3-1
4-1
8E
MP
2104
1
1405
1304
1239
0620
0112
-34
1301
-13
1764
ASS
T16
0114
0112
03.
0636
0817
0608
3418
0315
23.
-67
73JO
S10
0501
0826
0822
3204
25-1
020
3008
2416
13-5
237
41C
O04
0405
'02
3523
3105
1902
0425
0601
-03
0005
-08
0907
01
MFC
-03
-06
1303
1220
0711
0205
-00
1619
0300
0503
-03
0701
0509
FCN
1002
0603
0202
0208
1600
0107
0303
0403
08-
0004
0210
:'.04
01
SEX
0904
0601
1615
0406
:24
0303
0407
2602
0607
0304
0301
1007
03
HS
05 -
1401
0107
0513
01 1
-07
12-0
703
.06
0808
03-0
400
0702
0204
11'
12O
f
1

4 red I.4 0 0 1Ii p..1 =I Dv, s.. Ix ird o z z tv tsi ,a Pr, tr4' p. D> C/3 CD CA 14 .0 0 P I 2 8 B43 Pla
14.1 0 Ii t"41 0 h3 . .......................- 3444.444....444MA
1 i 1 . 1 .1 t t.. iltii I I t
0 0 0 0 0 t0 -s
en 0 Q' 0 ba 0 0 1.1 1-: 0 0 -0 0 0 co N N 03 14,3 pa at, .01 0 In t%) N P. N to 43 kn N C0
ppi
I 1 I 1 1 1 e I 1 I i - 0 0 0 0 0 0 0 0 0 0 0 Pa 1.-1 0 I-1 P-3
. 0 0 0 0 0 'ftQl to a4 1" W tA IV P. 0 M CC; .P 0 02 0 1"4 6'14 a% o ....1 t"
tO -
1 1 i 1 1 1 1 1 3
P.3 0 0 0 Pa 0 0 0 0 0 Q 0 0 CD 0 0 I" 0 I" 0 Pal ti% IV 1" IV .P.. I" C412 0 144 W .P. M. fsa t..) 121 1" i" U1 0 th)
Ili
WWI.0.14. asemotry...~........... /ifs/ /1 1 ; a i
PA 0 o© C$ 0 0 0 0 0 C:3 P-1 to a o a, o o o 1-1 o N pa I..1 N in .4.1 0 0 in P-3 I-3 N N CO I-4 its 1-3 W 0 1" 14 W
- 11110010.611.~mnssumommiro.rumerOusl~aab...1Walailliamama I I i 1 1. 1 1 A 1 I 1 1 1
0 0 0 0 !"1 0 0 0 0 0 0 1" 0 0 0 0 0 ;" 0 0 1:0 1" VA ta CYN 0 IS?) 1..0 1" V .C.A3 kin Us N CA t.T1 CH N 0 t42 IV
VNIIMININOndell
SWNI
.4 ,
-
- 1 8 1 1 1 1 1 1 1 1 1 / I 1
. 001"1"121"00000'001"0W 01-1000 CA 02 t" 1" eV% 1.0 0 ;ea 'V 40 Lo 1%2 lia 1%2 `..t 43% IV IV Ch
V. f..
CO C
4.. iv tv Cl)
0 VI t g
* 1 i . I a" 1 I / 1 1 s i 1 .
0 til,$ I-3 0 I"' 0 1...2 0 1"4 0 0 0 1" 0 0 0 0 .0 1- 0 I" in amQ, iil in W N N in N W N :in *4 1" 1" 13 IV W 44 ch in
...,.... 1 s 1 t 1 t 1
o c):-.2 c:i 1-3 I%) 0 o o N Iv o 1-4 C t.) w tv t-4 0 0 an *4 t6,4 wo to o -P. o crt ta iis ..4 ul w o .P CA IS) CO 0 '0 ,..,..... I - I I I 1 t I I I
Co CD' tee' Jr& *N2 l 0 -'0 0 0 1" '0 0 I. 0 0 0 0 1" 0 I" .4444,...............44,12.....S0...C124.11.0.-11.11.._-.-#9...r_a **4 4` W 0 NI IV I-4 1-1 cn vi ..g........ I .
1 1 1 i i s I s 1 1 1 1
I" 0 I" 0 it" h..1 O) 0 0 I" 0 C:2 1" 0 1" IV h.' 0 lig t-.4 0 . . ....14,-.11244.W....0.-at......+` 144
. %JD CDs 1.`' " " H Ina 1'4 1-wl 414 Cr' I" C7%
II I s I it I 1 1 1 I t .0 0 1-4 p-a 1-0 0 0 0 0 0 Pa 0 0 re 0 0 0 NI a ©o .......................,..sa.....te.......sx.s...m.....sa.m.....m.........Ae I-I I-4 ...r.-
PIA a 1'4 Na II %.1" .. - 1,118 a e 1 -1--"e-T-".1---;---- '----- - - ----- q 0 0 hi+ 0 tc.' 1" 0 $ 0 0 0 Is" 0 0 0 0 PA .0 0 0
.. IV .I P. 404 0 /3 0 tit :"4 C' P.4 C1 %.3 f" P 1.2 LII tS3 0 ts) 44........,........................................4...................,,,.....,.........
P.:1 a 113
- iPAJ
eV
-
-
, aaa......
I C I I I sili i 0 C.1 I-1 0 0 INA C:.s" 0 CIS I-1 l-3 0 CI 0 1-3 N Pa I-3 PA 0 0 03 L/1 -ib*. N i-3 0 *+*3 N 0 VD CI% Pea 03 a -Pe 0 *6.3 V3 a% 0 t.0
I I e 1 . , .
1 1 I Cs 0 1-.1 P-1 P-1 1-.3 C% 0 Cs 0 C3 0 :Pa. C$ P-3 0 0 1.4
.. I-a 0
CI% to3 .P._ t.0 '''.1 CO 0 ...1=' N2 0 1- 0 IV Co 0 W P t411 0 .F. t.4 a 1 . 1 1 1 :e s I I 1
0 18-11-A0 I-10000000000 01-8001-4 413 4*. P% 0 0' iss Cr% 1.-3 GI 0% 1-.1 Ch Pri P AC1 1-.3 fo, CO CO Ale W ............-----...-44........................-111
1 S 1 I 11 ; ' I- 1 1 I P-3- 0 P-I 2.3 0 N 0 0 0 0 155 0 CI 0 .0 0 0 184 0 0 i" I" tit tit P. CO 0 .1" tit to-) ea 31 P''' W IV 1" 'ft.1 CO i's V2 0% 1.4
z..- MI t . 1 5 ' I I I I I ='!". 1" 0 1" ,igEZLI.Vcaii:1 LA-4 m a ice. g la lc: pa; a . v2 .1, a
.......................................
' . 0.1 .1411/4701110 ISW04./........,...sm. .
1 r I'* I s s I 1 i I I I 0 0 0 0 0 Pal 0 P-I 0 IV 1.4 0 IV 0 I" 1" 14 IV IV 0 O' W N3 g, ID .1' tit CA 0 ON 0 CI, i',,12 N V h3 in %/2 Ch IV to Stt.
1=1............. 133
11/80 ill 111S i e
0 0 0 pa esig 0 pa 1.4 pa ta i...3 0 0 t-i 0 IV IV 0 Iwa Ls) I" 1.83 I" Ui CO Ch I" 1'A 1%2 (V Ca ON 613 .4.3 N .44 .pb I3 cp ,g
in
...................... I s -7- 1 I I i 1 a 1 I
Cs 0 0 0 0 Y© 1.-1 o 1-2 p.4 o (o o o pa is= K1 to o 1" CI 0 0 P. IV tell CT Ch %Co tivt 'V 1" 0:$ to at p am a o ko tv
...weraftwrama....................
C/3 ?-3
......N.,...,......, , a . 1 I I I $ 1 .1 1 1 1
0 0 1-3 d2.0 0 es a 1-1 1" l'-4 1" 9. I-1 a o i-i - 1-1 tk) t-i o O V) CA tin 0F% 1" '.+1 12 P to IV 03 F° 0 1" C*,i N - N sP` CO to WI
.......01. CO
-- / I I I I II 1 I 0 0 0 0 0 0 0 18-3 P.3 0 0 CS 0 fra C:f ? )...3 Pa p.i o .1 hi pa N 144 N ON I-1 ir3 4 0 0 I-1 1" S.,1 ;.". 0 N W 0 N
______-........... - - . - ,...,............ r/111.1111t
CD CO 0 0 I" 0 1" 0 I" 0 0 0 c% 6 i..< a o a a a a Cie N2 %a PA 0 in 0 03 tin N W in 4:-. 0 ; ha 1,1.4 t--4 4:4. Ch 1.4 ko ... "
it 0 a r m
...........
. ..,... - - 3 1 a I I I I e I s 00P-30000000000000 <44 OP. 0
0-10
.4 toi 1.4 W 114 Cs% is, .F. Ca I-+ CA 00 ...1 1-.3 1" tie IQz! 0,F, CA 03 %Ca
i I 1 IIII ..................................
pa pa pa pa 0 0 -% pa pa 0 o o o e-o o a Nz 0 0 0 0 0:4 trs is) to v, NI 0 *4 ft... t%) 0 (40 0 Lo2 Ir..1 .4.15 t. s g. ,0 .
Weloloril OM

011M
VIII
MIN
INM
INIM
IN
Th3S
PS GR
D
ET
E
DFC
NS
40
OSA
FA MA
TG
P
AB
STR
DIC
T
RE
SO
PUN
IT
CA
RR
A
00 IQ P. TP
661
12 1
07-2
517
1-13
12 0
6Ir
1551
1
05 1
0 1-
2720
i12
1
-01
19 '-
1216
I 0
2 16
50i
si.1
.1 -
0902
E08
6274
03 0
1 1-
2102
1.0
612
02
i.06
.07
L02
27 1
06
344
3507
03
-26
07 f
.03
) 40
27
02 ,-
16 i-
0011
.i
0035
36I
1...
.
-41
14 !
19
16 0
9 1-
1 E
;784
06 i
06 i.
.09
1 09
/18
1 Q
i.09
081-
02 1
43
1-49
2817
11
051.
031
-02
141-
1604
09
171
091-
03.
43I-
41,
0503
w08
05(-
0202
I08
01.
01
-14
07 1
-01
2334
03
08
1329
02
04
1.7 41
-16
3204
-11
3121
04,
7811
.06
2711
34 3.4
06 02 13 09
0100
4414
21 0
703
. -06
-03
05 »
04 0
8
1
'
16 .1
z28
-1.
8
0114
1 02 02 -02
01*
0409
14 21 30 05 05 03 05 02
-.36 13
1-08 1.
9(-
5424
3 -
05$1
54
1-16
: .05
.09
22
001-
00f-
021
M02
.17-
030
41-1
.413
05 -
0309
031.
.01
05't0
7402
1 06
141
06:;:
10'
'
0222
.fi
04 4
733
.1
06 4
5 16
I 2
8 ;
.r
17I
03
t"95
I
i
I
0409
10
422
G9'
1
06
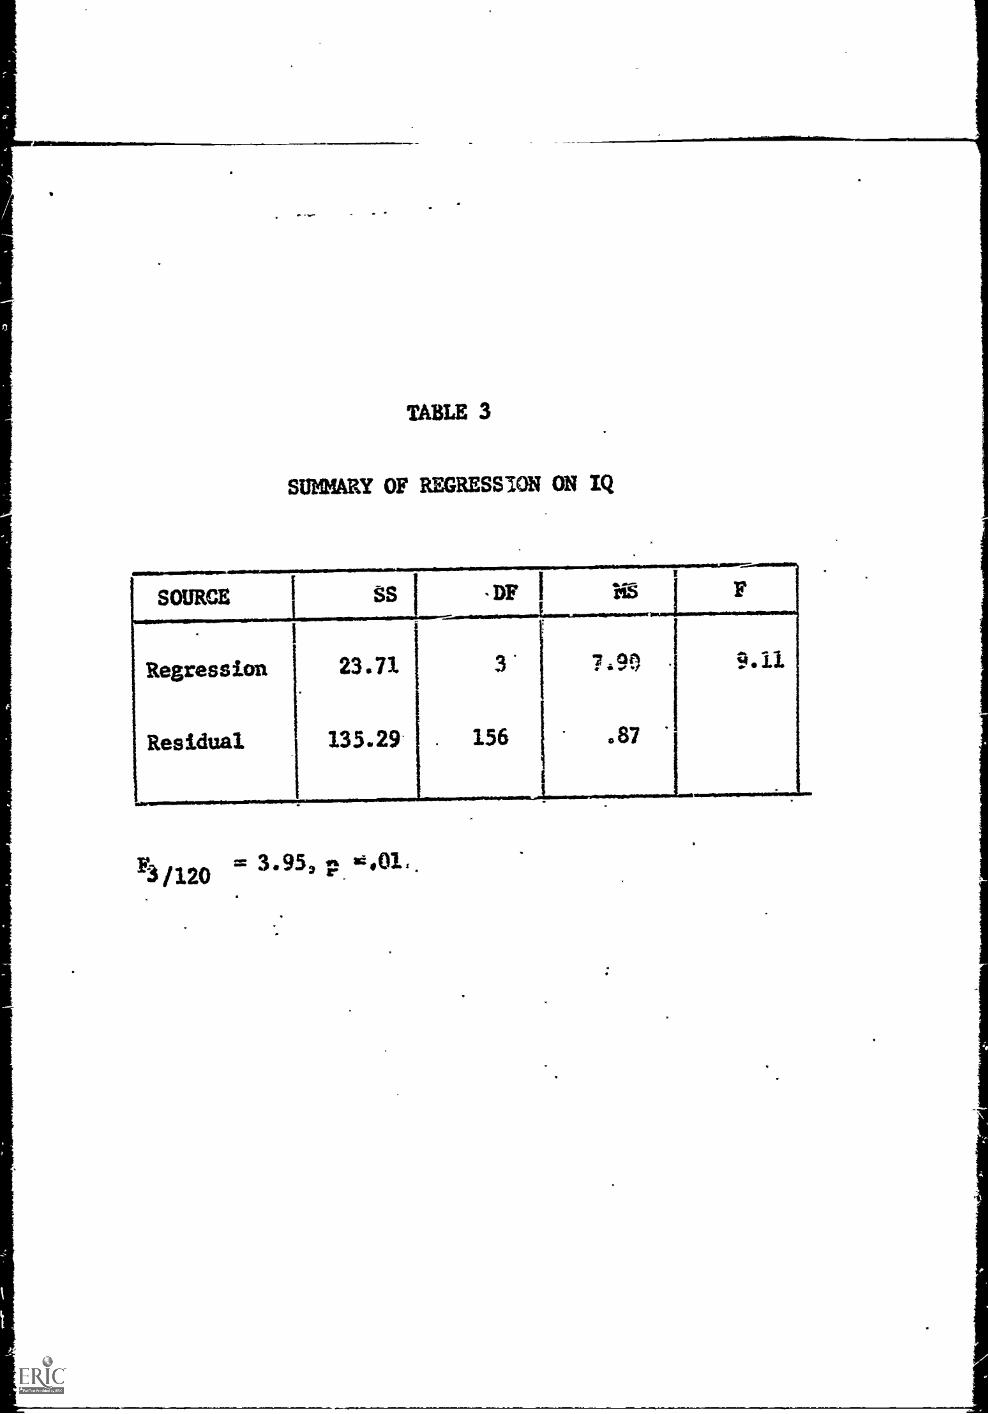
SUMMARY OF REGRESSION ON IQ
SOURCE SS -DF I VE F
Regression 23.71 3 7-0-11
**
9.11
Residual 135.29 . 156 18.f7
1
i.
F3 /120= 3.95, p
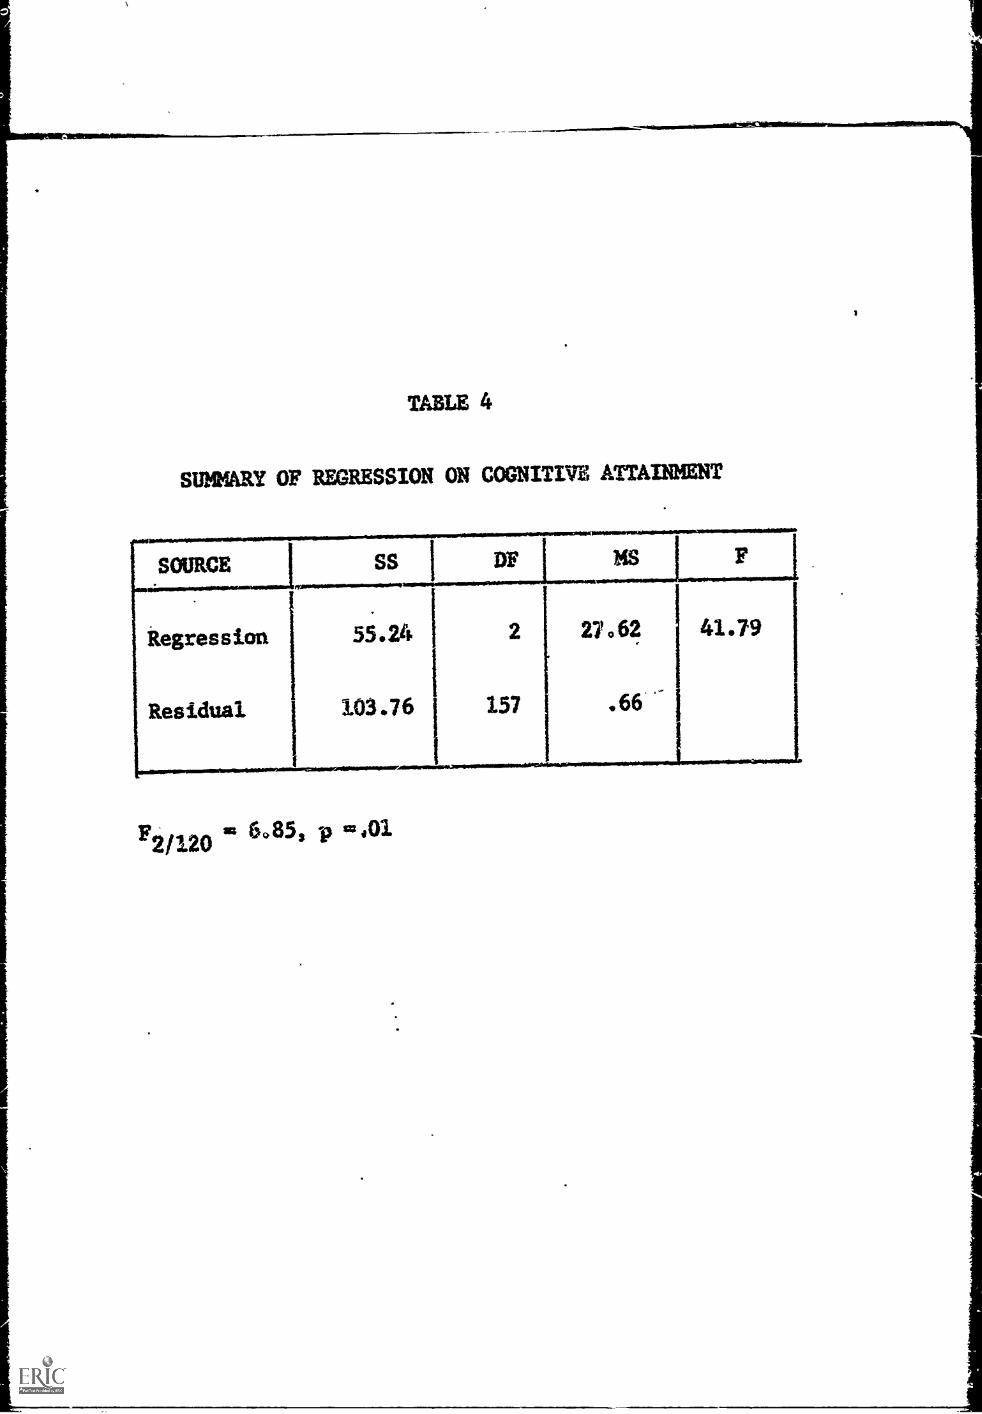
i
TABLE 4
SUMMARY OF REGRESSION ON COGNITIVE ATTAINMENT
SOURCE SS DF MS...1
270 62
.66 I
41.79
I
Regression
Residual
55.24
103.76
2
157
F21120a= 6.85, p =2.01

TABLE 5
SUMMARY OF ANALYSIS OF VARIANCE ON OVERALL OUGRTNESS
SOURCE SS 1 DF 3KS F
Regression 22.30 4 5.58 6.32
11
Residual 136.70 155 .88
I
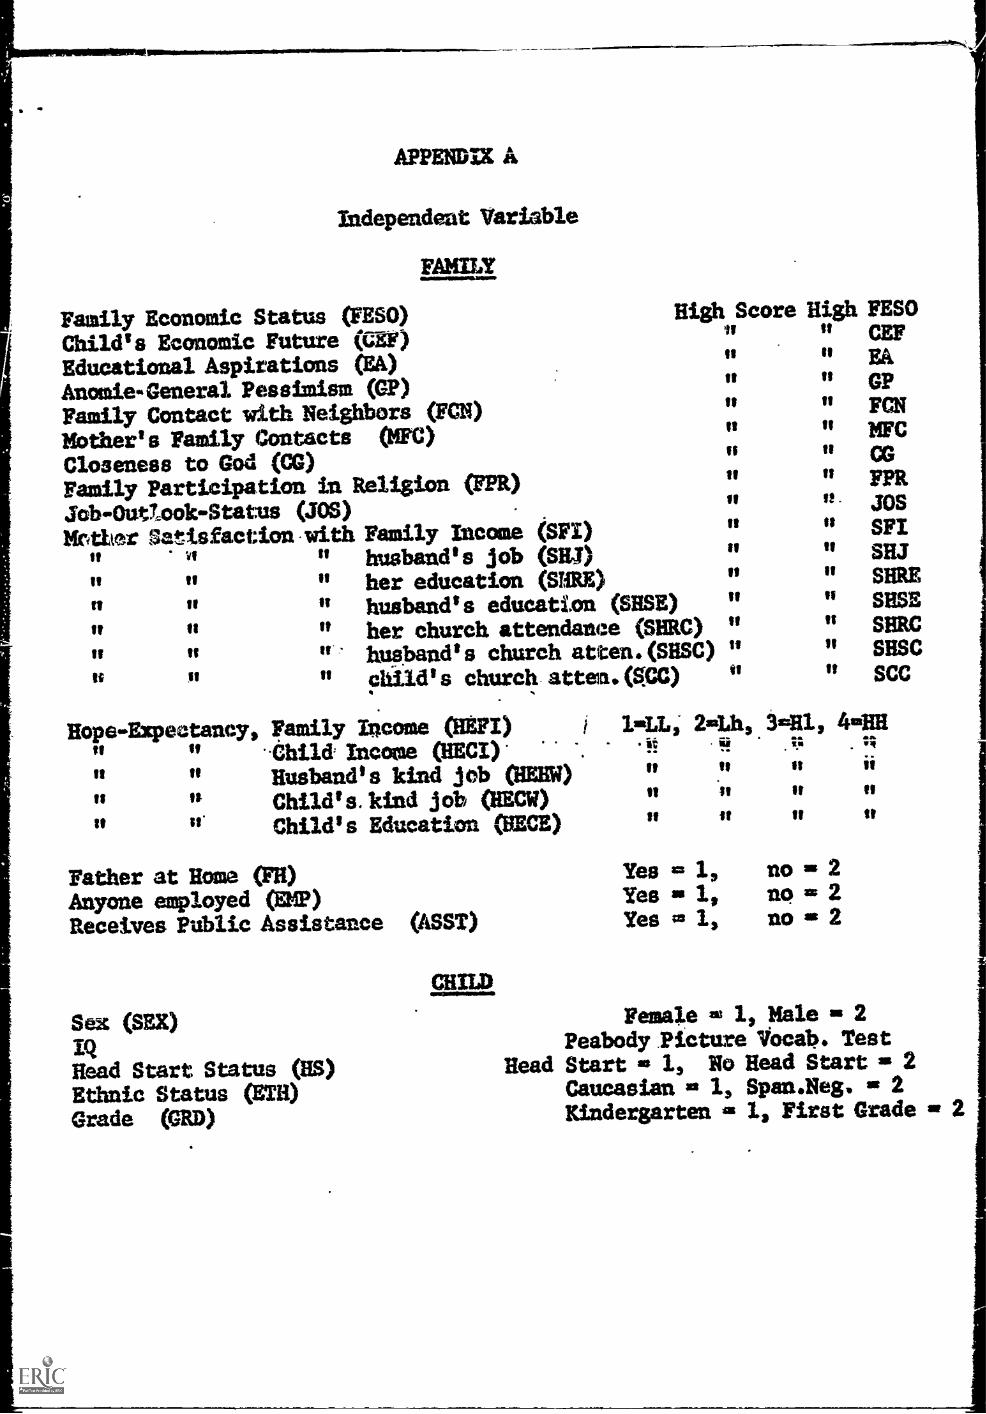
APPENDIX A
Independent Variable
FAMILY
Family Economic Status (FESO)Child's Economic Future (CEt)Educational Aspirations (EA)Anomie-General Pessimism (GP)Family Contact with Neighbors (FCN)Mother's Family Contacts (I )Closeness to God (CG)Family Participation in Religion (FPR)JobwOut7,.:ook-Statais (JOS)Mother Satisfaction with Family Income (WI)
" husband's job (SIMher education (SMRE)husband's education (SHSE)her church attendance (SHRC)husband' a church amen. (BIM)child's church atten.(MC)
vt
tt
ttis
ft
Ittt
ttIt'tt
High Score1t
tttttt
ttIftit
IfffIfIf
High FESOIf cm?
FAGPFCNMFCCGPPRJOSSFISHJSHRESHSESHRCSHSCSCC
tt
ft
tt
tttris
tt
tt.ft
tttt
Hope-Expectancy, ?gladly Income (1F31) 2'Lh, 3411, 414111tt " Child: Income (HECI) tt ii! .
tt Husband's kind job (BE EW) It It tt ii
0 Child's. kind job (RECW) tt It It It
Child's Education (HECE) u it u tttt
tt
Father at Home (FR)Anyone employed (EM!?)Receives Public Assistance (ASST)
CHILD
Sex (SEX)IQHead Start Status (HS)Ethnic Status (En)Grade (GRD)
Yes 1,Yes so 1,Yes m1,
no -2no xi 2no as 2
Female ai 1, Male as 2Peabody Picture locab, Test
Head Start la 1, No Head Start is 2Caucasian as 1, Spanaleg, is 2Kindergarten 411 I, First Grade as

APPENDIX A (Continued)
Head Start TeacherSystem - TT ;(;SS) Concrete cis 1,. Abstract = 3 or 4
Present TeacherSystem THE (PS) it It tt to It
Divine Fate Control °WC)Need for Simplicity-Consistency (SC)Ne.ed for Structure-Order (NS 0) -
Distrust of Social Authority OSA)Friendship Absolutism (FA)Moral Absolutism 04k) - -
General Pessimism (GP)Abstractues (AliSTR)Dictatorialness (DICT).Resourcefulness ('PESO)Punitiveness (P IT)