ecuador food processing sector report - usdagain.fas.usda.gov/recent gain publications/general...
TRANSCRIPT

Required Report - public distribution
Date: 3/6/2009
GAIN Report Number: EC9002
Ecuador
FOOD PROCESSING SECTOR
REPORT
Approved By:
Eugene Philhower
Prepared By:
Andres E. Barahona
Report Highlights: The Ecuadorian market for food processing ingredients offers significant opportunities for U.S. exporters. With rich agricultural resources and potential, the sector has a few larger industrial producers and many traditional processors. Consumption patterns are similar to elsewhere in Latin America with trends towards consumer ready food products and more nutritional and health awareness. Price and quality remain top considerations.
Post:
Quito
Commodities:
select

Author Defined:
Section I. Market Summary
Since the return to democracy in 1979, Ecuador has experienced a high degree of political
instability. Eleven presidents have announced and sometimes implemented a wide range of
economic policies aimed at improving living conditions and advancing economic progress.
Some policies have worked and some have not. All economic sectors have experienced some
degree of crisis. Natural disasters, from flooding to volcanoes, are frequent occurrences.
From 2000-2008, Gross Domestic Product (GDP) averaged an annual growth of 4.8%,
reflecting the dynamism of private consumption (3.7% growth on average), investment (with
average growth of 9.8% for the period) and exports (which have expanded on average each
year 18% since 2000).
Inflationary pressures have been reduced since the dollarization of the economy in 2000 which
eliminated currency risk. The annual inflation average declined consistently after 2001 until it
registered it lowest level in the year 2005 (2.1%), while in 2007 there was a slight increase
(3.3%) and in 2008 the inflation reached its highest level since the implementation of the
dollarization, getting near the two digit variation.
In the most recent years, production costs have stabilized, purchasing power of households
has improved and overall confidence in the financial system has increased. There is greater
access to credit boosting consumption and investment. In addition, strong external demand
has impacted positively on the growth of exports. This dynamism in economic activity was
reflected in the growth of imports, which in turn strengthened the productive sector in the
form of greater inputs of fuels, raw materials and capital goods.
GROSS DOMESTIC PRODUCT (GDP) GROWTH
YEAR GDP NON OIL GDP MANUFACTURING
SECTOR GDP
2001 5.34% 6.51% 4.89%
2002 4.25% 6.00% 2.53%
2003 3.58% 2.99% 4.59%
2004 8.00% 3.73% 3.23%
2005 6.00% 7.46% 9.24%
2006 3.90% 4.71% 8.54%
2007 2.65% 4.87% 4.63%
2008* 4.25% 4.08% 4.54%
AVERAGE GROW 4.74% 5.04% 5.27%
Source BCE

According to the classification by economic activity during the year 2008 the sector that
contributed the most to the growth in the non-oil activity in Gross Domestic Product (GDP) was
the commerce sector, followed by manufacturing sector despite that this sector has shown a
slowdown in growth from 8.54% in 2006 to 4.63% in 2007 and to 4.54% in 2008. Within the
manufacturing sector, the production of foodstuffs and beverages in 2007 represented
8.96.7% of net value added to the GDP, being the subsector with the largest share in the total
manufacturing value added (55.9%). [1]
One of the sectors that has experienced swings in growth is the Agricultural, Livestock,
Hunting and Forestry sector, which went from 5.09% in 2005 to just 2.14% in 2006, dropping
to 4.90% in 2007 and ending 2008 with 3.63%. The drop in 2008 is mainly explained by
climatic phenomena which reduced agricultural supply in year 2008 as some crops were
affected by drought and frost in the highland region and by floods in the coast region at the
beginning of the year.
According to the classification by economic activity by the Central Bank of Ecuador, the food
and beverage sector corresponds to the area of agriculture, livestock, hunting, forestry and
manufacture (which excludes oil refining). [2]
The main subsectors are:
Meat, meat products and sub products
Processed shrimp
Fish and other processed aquatic products
Preserved aquatic species
Crude and refined oils
Developed lacteal products
Milling products
Bakery products, noodles and pasta
Sugar and sugar cane
Developed cocoa products
Chocolates and confectionery products
Foodstuffs various
Participation of the sector in the Gross Domestic Product

According to information of the Central Bank of Ecuador, during the period 2000-2008, the
food and beverage sector has had the following participation in the GPD:
Gross Domestic Product (thousand of dollars)
Economic Activity 2001 2002 2003 2004 2005 2006 2007* 2008* 2009
(Projected) Meat and developed fish 611105 631253 722318 754176 904,068 1,034,264 1,090,123 1,134,818 1,163,188 Cereals and bakery 82261 81701 82764 86700 89,609 92,169 90,388 91,292 91,383 Sugar elaboration 92621 94389 96475 99333 106,023 109,268 111,513 115,416 115,416 Foodstuffs various 259454 264483 276318 285850 296,934 308,080 334,282 346,316 354,974 Beverages elaboration 88294 86105 77270 82750 86,558 90,016 102,870 106,882 108,271
Total Agro-Industrial GDP 1,133,735 1,157,931 1,255,145 1,308,809 1,483,192 1,633,797 1,729,176 1,794,724 1,833,233
Percentage Agro-Industrial GDP Grow 2.13% 8.40% 4.28% 13.32% 10.15% 5.84% 3.79% 2.15%
The percentage share of the sector in GDP, according to the same source, is reflected in the
table below:
Economic Activity 2001 2002 2003 2004 2005 2006 2007* 2008** 2009 (Projected)
Meat and developed fish 3.6 3.6 4 3.9 4.4 4.8 4.9 4.9 4.8 Cereals and bakery 0.5 0.5 0.5 0.4 0.4 0.4 0.4 0.4 0.4 Sugar elaboration 0.6 0.5 0.5 0.5 0.5 0.5 0.5 0.5 0.5 Foodstuffs various 1.5 1.5 1.5 1.5 1.4 1.4 1.5 1.5 1.5 Beverages elaboration 0.5 0.5 0.4 0.4 0.4 0.4 0.5 0.5 0.5
* The figures and percentages of years 2007 and 2008 are provisional.
According to the Ecuadorian Central Bank statistics on the added value by the sector, the food
and beverage sector contributed in 2008 with an aggregate value of $1,794,724 thousand
dollars, while the Agricultural, Livestock, Hunting and Forestry contributed with $2,427,721
thousand dollars.

Source: Análisis Semanal de Economía y Política del Ecuador
The grow of the agro-industrial sector has been decelerated since 2005 reaching only 3.8% in
2008 and showing a tendency of deceleration under the projections for 2009 to 2.1% as shown
in the graph above. The meat and developed fish subsectors are estimated to have the best
performance relatively compared with the other agro-industrial subsectors. The Sugar
subsector had no growth but even this estimate is optimistic since one of the largest sugar
mills is now in the hands of the government and it is not operating at full capacity.
While the sector is national in coverage in terms of production of inputs and product markets,
it should be made clear that primary products are generated in rural areas, while enterprises
that produce food and beverages which have undergone a process of transformation, are
mainly concentrated in the principal cities of the country. [3]
Register Food Manufacture Companies Sales Statistics
(Thousands of dollars)

Economic Activity
Number of
Register Companies
2006
Number of
Register Companies
2007
Net Sales 2006
Net Sales 2007
Meat, meat products and sub products
47 39 491,866,831 573,271,991
Fish and other processed aquatic products
82 82 1,177,768,323 1,182,653,039
Fruits and vegetables products
41 39 165,681,286 177,854,412
Animal and vegetable oils 37 39 586,047,380 848,372,001
Lacteal products 177 171 408,761,461 423,605,087
Milling products 48 51 210,653,387 207,816,860
Starch and starch products. 7 4 3,372,580 2,072,082
Bakery products 65 61 197,363,925 221,942,213
Sugar 10 8 283,137,798 294,594,013
Chocolate and confectionary products
24 24 136,684,279 157,524,171
Macaroni, noodle and pasta 21 20 57,988,383 53,327,929
Foodstuffs various 58 59 177,222,254 221,195,657
Alcoholic beverages; ethyl alcohol from fermented products
33 39 62,518,266 73,364,955
Wines 11 11 10,304,889 9,768,369
Malta beverages 3 2 287,315,125 331,019,512
Non-alcoholic beverages. Bottled mineral water
83 84 268,031,277 353,551,988
Information-December 2008
Source: Superintendencia de Compañías
NUMBER OF FOOD AND BEVERAGE MANUFACTURE COMPANIES IN 2007 BY SIZE
MICRO SMALL MEDIUM LARGE
Food and beverages 243 195 150 145
Meat, meat products and sub products 7 12 13 7
Fish and other processed aquatic products 23 8 18 33
Fruits and vegetables products 15 8 7 9
Animal and vegetable oils 3 2 12 22
Lacteal products 88 44 24 15
Milling products 14 10 16 11
Starch and starch products. 1 2 1 0
Bakery products 17 27 10 7
Sugar 0 1 0 7
Chocolate and confectionary products 4 10 4 6
Macaroni, noodle and pasta 4 7 6 3
Foodstuffs various 17 21 12 9
Alcoholic beverages; ethyl alcohol from fermented products
17 15 10 10
Non-alcoholic beverages. Bottled mineral water 33 28 17 6
DISTRIBUTION OF FOOD AND BEVERAGE MANUFACTURE COMPANIES IN 2007

Distribution of Companies by number Distribution of Companies by sales
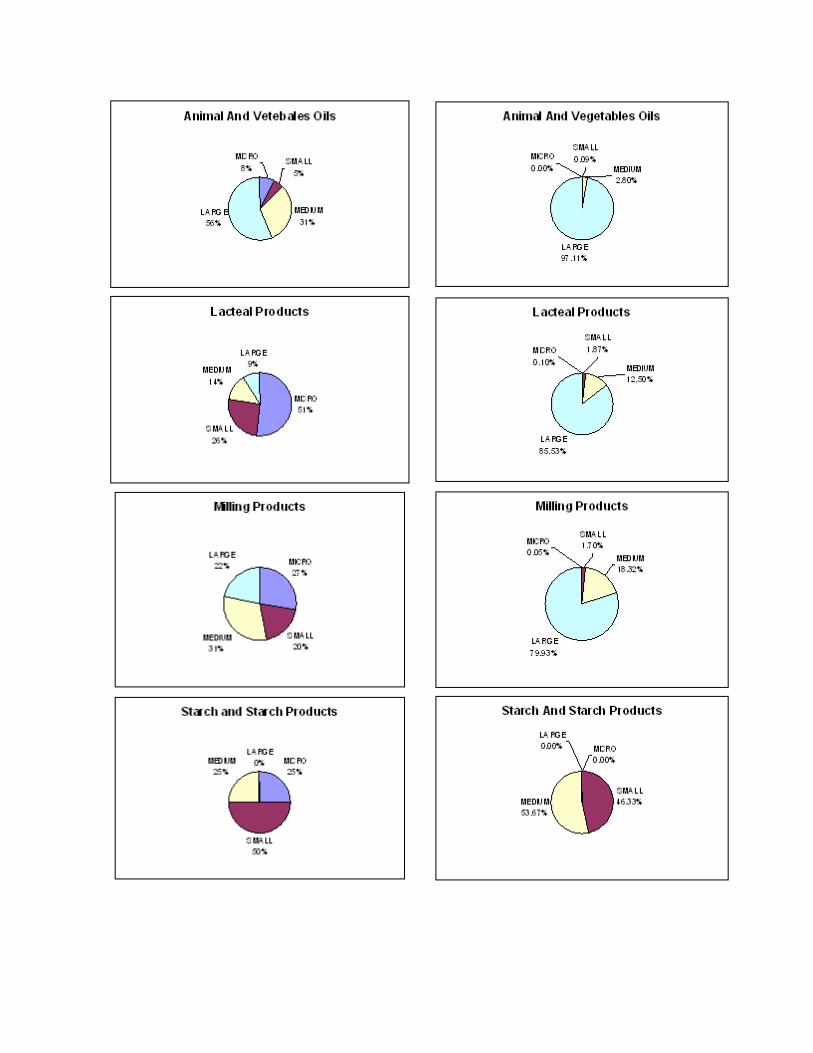


Source: Superintendencia de Compañías
Advantages and Challenges Facing U.S. Products in Ecuador
Advantages Challenges
The country's economy in 2009 will
grow by 3.2% according to
estimates from the Central Bank,
and agro-industry will contribute
with a 0.17% to that expansion.
Without a free trade
agreement, U.S. exports face
considerable tariff restrictions for
access to the Ecuadorian market.

Although restrictions to imports
have been placed, these mainly
affect final processed products. This
represents an opportunity for US
exporters of raw material and
ingredients for the food processing
sector since it is expected an
increase of local production.
The main trading partner of Ecuador
is United States.
Products that come from United
States are known from their quality.
The demand for low-calorie
products, energy, etc, has increased
in recent years, so this industry
must produce and import more.
The processes and
procedures for import in Ecuador
can be long and complicated.
Exporters of foodstuffs from
the United States are not as
aggressive in tracking sales as
those in Chile or other supplier
countries.
Nearly 65% of the
population belongs to the segment
of low-income and may not have
access to imported products.
American companies should
focus the issue of economies of
scale, since in some cases the
marketing conditions are too
complicated.
Prices of US products in some cases
may be higher than those of local
products or nearby countries.
Section II. Road Map for Market Entry
A. Entry Strategy
The producers and exporters of food ingredients from the United States who seek to
enter the Ecuadorian market may contact local food processors directly or work with
representatives, agents or distributors, to define the application and product type that
requires final users. Usually large companies import directly from foreign suppliers;
however small and medium-sized enterprises do not have the ability to purchase large
volumes and therefore negotiate with a representative or distributor. In the case of
large volumes, the establishment of a local subsidiary to guarantee services and quality
to clients may be justified.
United States foodstuffs are known for their high quality and excellent values; however
quality standards have risen in products around the world thanks to automation and
technology. Therefore to compete in Ecuadorian market where the purchasing power of
consumers is low, producers must also offer quality, competitive pricing or special
services such as improved care, warranties, adapting products and packaging to local
standards.
United Sates exporters who wish to enter in the food ingredient market of Ecuador must
be very aggressive and pro-active to promote good and solid relationships with their
clients through personal visits or referenced by distributors or customers. This is the
best way to maintain and increase sales. Additionally monitoring, support and constant
communication makes a difference compared to competitors in nearby countries who
generally offer better prices because of freight and products without tariff.
The correct payment method is important. Suppliers should avoid direct credit until the
clients demonstrate creditworthiness. Also cash payments can reduce costs of imports.
If letters of credit are used, it is recommended that they be confirmed and irrevocable
to secure the payment.
Exporting companies from the United States must understand the importance of
knowing the market, key contacts and become familiar with local laws and business
practices in Ecuador, for which the Foreign Agricultural Service (FAS) Office in U.S.
Embassy/Quito keeps lists of potential importers and can provide this information to
suppliers that wish to seek business opportunities in Ecuador.
Since 2005, the government has been providing credit for productive and commercial
activities, especially to the agricultural sector, micro entrepreneurs and merchants. One
of the most common programs provides up to an amount of $ 5,000 with a rate of
interest of 8% and a maximum term of three years. In addition, since April 2004, with
funds from the National Finance Corporation, credits have been delivered to small and
medium enterprises (SMEs) to the amount of USD 30,000 at the annual rate of 9%.
This variable represents an opportunity to enter or expand agribusiness, since the credit
can be used to purchase raw materials and inputs.
B. Market Structure

To the extent that the distribution channels for a product are well established, new entrants
must focus on the retail sector and seek to convince retailers to accept their products through
lower prices and increased profit margins, sharing costs of promotion, engaging in joint
promotional efforts at the point of sale, among others. When it is not possible to penetrate the
existing distribution channels, the new company acquires its own cost of distribution structure
and can still create new marketing systems and seize market share.
Distribution channels can be different between local and imported products and are changing
all the time, the purchase of raw materials and inputs for food processing represents a
significant portion of the cost of the final price of products. Local inputs can be purchased
directly from producers.
In general, food processing companies make purchases directly and not through brokers, so
they reach economies of scale and maximize profits but they are then responsible for the
logistics. In some cases, processors have an import broker, which represents one or more
foreign suppliers.
Companies with low sales volume who import directly face high costs as the conditions and
procedures for importing can be difficult. Therefore it is better to use a local wholesale to make
the import process and all the required procedures.
The food processing companies usually have their own distribution chain which contains
wholesalers, self-service, traditional retailers and to a lesser extent the institutional (HRI
catering). There is a small portion of companies that have outsourced the distribution to
certain provinces.
C. Company Profiles
The food and beverages processing companies have increased their production levels in
response to increased demand, coming from both population and income growth. Also,
conditions of the global market require permanent innovation, efficiency, competitiveness and
adoption of new technologies, all aimed at achieving greater efficiency and competitiveness
which would enable strict adherence to quality parameters.
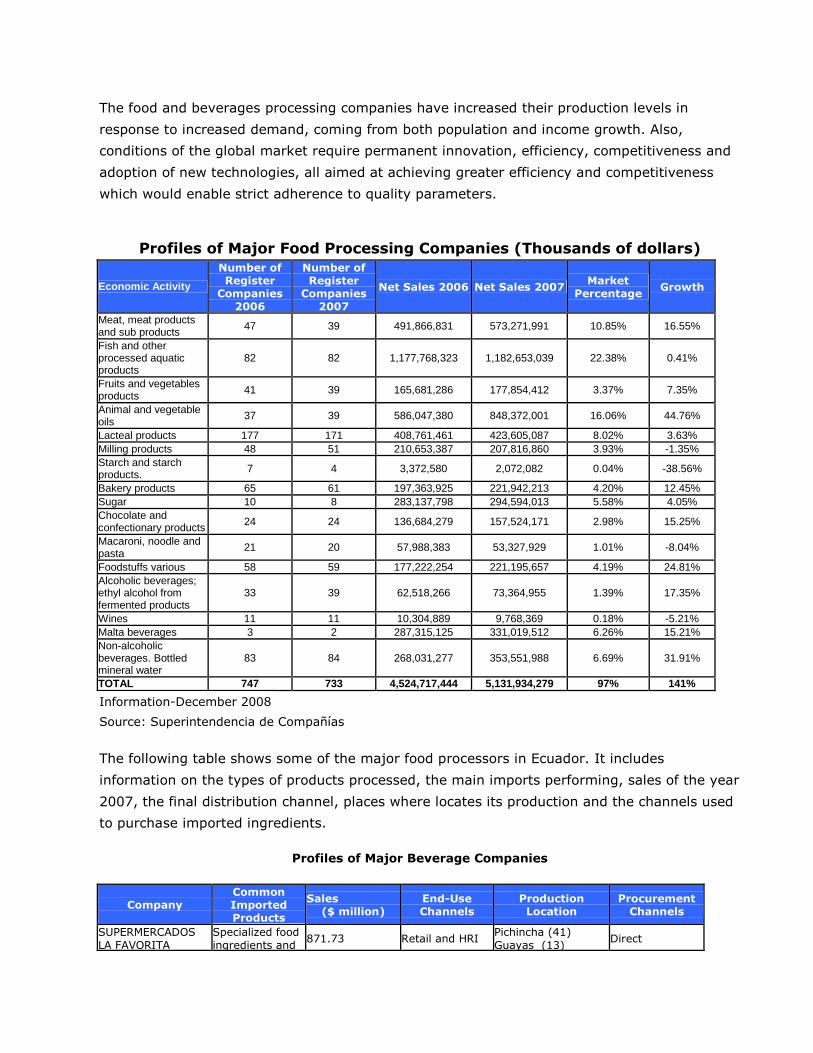
Profiles of Major Food Processing Companies (Thousands of dollars)
Economic Activity
Number of Register
Companies 2006
Number of Register
Companies 2007
Net Sales 2006 Net Sales 2007 Market Percentage
Growth
Meat, meat products and sub products 47 39 491,866,831 573,271,991 10.85% 16.55%
Fish and other processed aquatic products
82 82 1,177,768,323 1,182,653,039 22.38% 0.41%
Fruits and vegetables products 41 39 165,681,286 177,854,412 3.37% 7.35%
Animal and vegetable oils 37 39 586,047,380 848,372,001 16.06% 44.76%
Lacteal products 177 171 408,761,461 423,605,087 8.02% 3.63% Milling products 48 51 210,653,387 207,816,860 3.93% -1.35% Starch and starch products. 7 4 3,372,580 2,072,082 0.04% -38.56%
Bakery products 65 61 197,363,925 221,942,213 4.20% 12.45% Sugar 10 8 283,137,798 294,594,013 5.58% 4.05% Chocolate and confectionary products 24 24 136,684,279 157,524,171 2.98% 15.25%
Macaroni, noodle and pasta 21 20 57,988,383 53,327,929 1.01% -8.04%
Foodstuffs various 58 59 177,222,254 221,195,657 4.19% 24.81% Alcoholic beverages; ethyl alcohol from fermented products
33 39 62,518,266 73,364,955 1.39% 17.35%
Wines 11 11 10,304,889 9,768,369 0.18% -5.21% Malta beverages 3 2 287,315,125 331,019,512 6.26% 15.21% Non-alcoholic beverages. Bottled mineral water
83 84 268,031,277 353,551,988 6.69% 31.91%
TOTAL 747 733 4,524,717,444 5,131,934,279 97% 141%
Information-December 2008
Source: Superintendencia de Compañías
The following table shows some of the major food processors in Ecuador. It includes
information on the types of products processed, the main imports performing, sales of the year
2007, the final distribution channel, places where locates its production and the channels used
to purchase imported ingredients.
Profiles of Major Beverage Companies
Company Common Imported Products
Sales ($ million)
End-Use Channels
Production Location
Procurement Channels
SUPERMERCADOS
LA FAVORITA
Specialized food
ingredients and 871.73 Retail and HRI
Pichincha (41)
Guayas (13) Direct
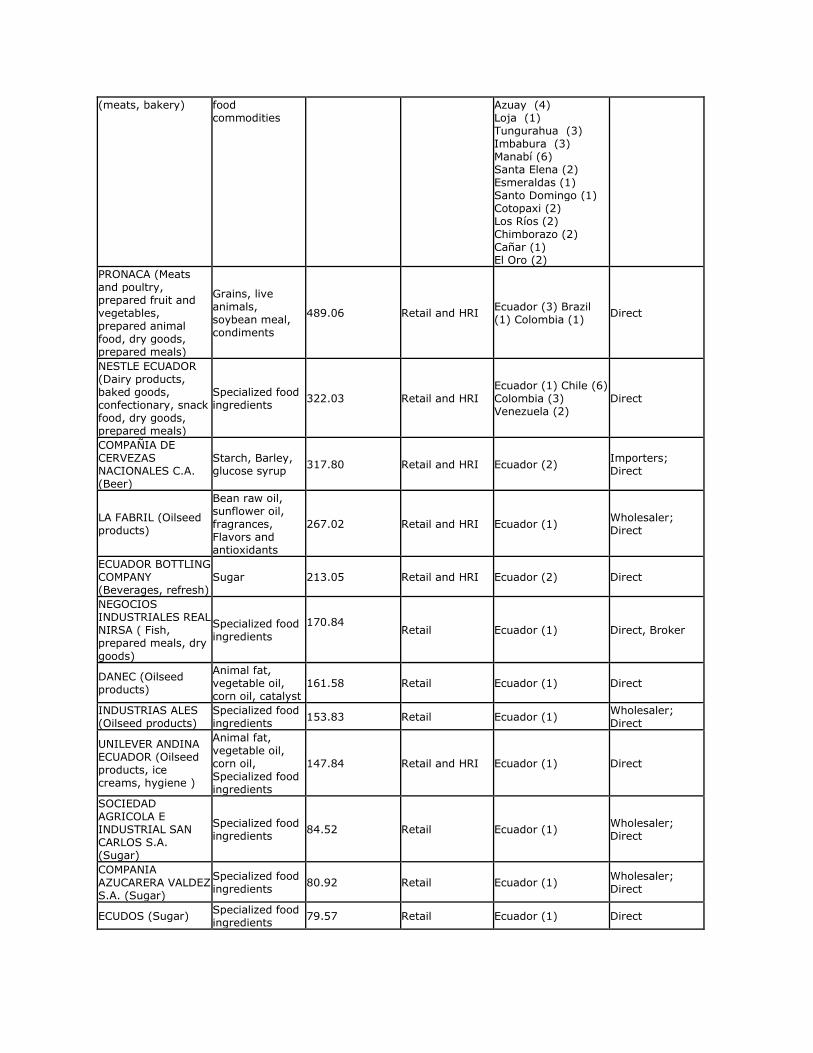
(meats, bakery) food commodities
Azuay (4) Loja (1) Tungurahua (3) Imbabura (3) Manabí (6) Santa Elena (2) Esmeraldas (1) Santo Domingo (1) Cotopaxi (2) Los Ríos (2) Chimborazo (2) Cañar (1) El Oro (2)
PRONACA (Meats and poultry, prepared fruit and vegetables, prepared animal food, dry goods, prepared meals)
Grains, live animals, soybean meal, condiments
489.06 Retail and HRI Ecuador (3) Brazil (1) Colombia (1)
Direct
NESTLE ECUADOR (Dairy products, baked goods, confectionary, snack food, dry goods, prepared meals)
Specialized food ingredients
322.03 Retail and HRI Ecuador (1) Chile (6) Colombia (3) Venezuela (2)
Direct
COMPAÑIA DE CERVEZAS NACIONALES C.A. (Beer)
Starch, Barley, glucose syrup 317.80 Retail and HRI Ecuador (2)
Importers; Direct
LA FABRIL (Oilseed products)
Bean raw oil, sunflower oil, fragrances, Flavors and antioxidants
267.02 Retail and HRI Ecuador (1) Wholesaler; Direct
ECUADOR BOTTLING COMPANY (Beverages, refresh)
Sugar 213.05 Retail and HRI Ecuador (2) Direct
NEGOCIOS INDUSTRIALES REAL NIRSA ( Fish, prepared meals, dry
goods)
Specialized food ingredients
170.84
Retail Ecuador (1) Direct, Broker
DANEC (Oilseed products)
Animal fat, vegetable oil, corn oil, catalyst
161.58 Retail Ecuador (1) Direct
INDUSTRIAS ALES (Oilseed products)
Specialized food ingredients 153.83 Retail Ecuador (1)
Wholesaler; Direct
UNILEVER ANDINA ECUADOR (Oilseed products, ice creams, hygiene )
Animal fat, vegetable oil, corn oil, Specialized food ingredients
147.84 Retail and HRI Ecuador (1) Direct
SOCIEDAD AGRICOLA E INDUSTRIAL SAN CARLOS S.A. (Sugar)
Specialized food ingredients
84.52 Retail Ecuador (1) Wholesaler; Direct
COMPANIA AZUCARERA VALDEZ S.A. (Sugar)
Specialized food ingredients 80.92 Retail Ecuador (1)
Wholesaler; Direct
ECUDOS (Sugar) Specialized food ingredients
79.57 Retail Ecuador (1) Direct

ECUAJUGOS (non-alcoholic beverages)
Specialized food ingredients
75.87 Retail and HRI Ecuador (1) Direct
INDUSTRIAS LACTEAS TONI S.A. (dairy products)
Specialized food ingredients 72.89 Retail Ecuador (1)
Wholesaler; Direct
INDUSTRIAL SURINDU S.A. (Baked goods, confectionary)
Molasses 59.83 Retail and HRI Ecuador (1) Direct
INDUSTRIAL MOLINERA (Dry goods: powdered wheat, oats)
Wheat, Oats 58.20 Retail Ecuador (2) Direct
CONFITECA (confectionary products)
(Sugar, gums, essence)
58.16 Retail Ecuador (1) Colombia (1), Peru (1)
Direct, broker
KRAFT FOODS ECUADOR S.A (beverages, cheese and dairy, convenient meals, snacks and cereals, grocery)
Specialized food ingredients and food commodities
50.45 Retail and HRI
Ecuador(1), Peru (1) Colombia (1) Venezuela (2)
Direct
PRODUCTOS NUTRITIVOS SUPAN TIOSA (bread baking)
Specialized food ingredients and flavors
37.37 Retail and HRI Ecuador (1) Direct
CERVECERIA ANDINA SA (Beer)
Starch, Barley, glucose syrup
26.08 Retail and HRI Ecuador (1) Importers; Direct
Source: Direct Investigation
Food processors are one of the most successful sectors of the economy, reflecting stability and
consistent demand, due to the variety of products, such as easy preparation, low in calories,
special for babies, and so on.
D. Sector Trends
The Food and Beverage sector has achieved a high level of industrialization among the large
processor. However, small processors continue to produce with traditional methods and the
lack of technological innovation is their biggest obstacle. Consumption of processed items has
become established as part of the food culture of the country. One of the main advantages of
Ecuador is the diversity of agricultural resources, which allow the creation of value-added
products for local consumption and for export.
The highest item in the household consumption is food and non-alcoholic beverages, reaching
during 2005 $ 62.2 million per month, of which 54% of people consume low in calories and
natural products, marking a new pattern in the lifestyle of Ecuadorians. [4]
SUPERMARKETS RETAIL CHAINS
In Ecuador, the big supermarket chains and hypermarkets, such as Supermercados la Favorita
(Supermaxi, Megamaxi, Akí), Importadora el Rosado (Hipermarket), Tiendas Industriales
Asociadas (TIA) and Supermercado Santa Isabel/Santa María, have high bargaining power as
buyers. In the period between 1999 and 2005, these companies doubled their number of
stores and tripled their nationwide sales. The large volume of purchases they made and the
high market share they have, allows them to exert strong influence in the market to the
disadvantage of small importers and distributors.
Supermarket La Favorita: With 55 years in the domestic market and 84 stores is the leading
marketer in the "retail” area and has underpinned its position in the slogan "the pleasure of
buying". Supermarket La Favorita has achieved according to the Superintendent Companies
during 2007 a level of sales of $ 871.73 million and expects to have closed 2008 with around
$1 billion in sales; it also participates in the industrial area with Profasa (meat) Agropesa
(slaughter), Maxipan (bakery), among others. Its main suppliers are Chile and the United
States and the major products sale in its stores are the ones of the basic food basket, fruits
and grains. This company is in constant search for foreign suppliers with experience in the
market area with Ecuador.
El Rosado: This firm was founded in Guayaquil by Alfredo Czarninski, who opened a store
called “Importadora El Rosado” the first self-service super market in Ecuador that nowadays is
called “Mi Comisariato” and it is the second largest supermarket chain in the country. Mi
Comisariato is the strongest retailer in the coastal area.
MEAT PRODUCTS AND SUBPRODUCTS
According to the national statistics, Ecuador has a population of approximately 5.5 million
cattle. However, its meat production is based on the exploitation not only of cattle, but also on
pigs and to a lesser extent sheeps; constituting domestic supply of red meat for direct
consumption and industrial production which presents an insignificant growth in relation to the
demand of livestock products for the domestic market and border trade.
Even though the pork industry is nation wide, it is poorly developed due to: high production
costs, competition for raw materials with the poultry industry, lack of breeding centers, little
technological innovation, and lack of training to small producers. This industry is also affected
by the introduction of similar products from neighboring countries, especially Peru, which has
tariff preferences to imports of raw materials for animal feed, situation that makes less
competitive the Ecuadorian products.
This sector is expected to grow by 2.5% during 2009 according to data from the Central Bank
of Ecuador.
Pronaca: Leader in the market due to product innovation and presentation; the company has

a growth between 15 and 20% annually. In addition to the packaged meat, eggs and
preserves, it is also a leader in the sale of packaged rice. Pronaca launched to the market a
new value-added meat product ready for consumption under the brand “Mr. Cook”. According
to the Superintendence of Companies, Pronaca has more than 45% of the market share of
chicken in Ecuador. Pronaca has entered the global market with palm oils and fish products
which have added value and are at the stage of internationalization through its subsidiaries in
Colombia and Brazil.
Agropesa: With the most modern slaughterhouse in Ecuador, it provides its production to its
supermarket chain “La Favorita”. In 2006 Agropesa production reached 14,311 tons of pork
and beef, increasing in 2007 15,333 tons. The annual sales increased 18.55% in 2007.
SUGAR INDUSTRY
The importance of the sugar agro-industry in the country is shown in its contribution to GDP,
reaching 1.4%. There are six sugar mills: San Carlos, Troncal, Valdez, Maria Isabel, IANCEM
and Monterrey but the first three companies represent 90% of national production.
Sugar cane is used to obtaining raw sugar, white sugar, refined sugar, alcohol, and molasses.
The production volumes have increased annually. The planted area increased from 60,180
hectares to 65,000 hectares between years 1996-2007. Sugar production reached 492,671 MT
in year 2007; this growth is mainly due to large investments made by sugar mills and the
sugar cane industry.
San Carlos: Founded in 1945 by Carlos Sarmiento Lora and María Cristina Palau, San Carlos
produced the first sugar sack (50 kilograms), and by the end of the year the production
reached 26,128 sacks. Currently, San Carlos produces white sugar, white special sugar, refined
sugar and raw sugar. During the 2007 harvest, San Carlos reached the national production
record with 171,480 tons of sugar produced.
Valdez: Valdez Sugar Mill was founded in 1884 by Rafael Valdez, in 1922 Mr. Valdez
constituted “Compañía Azucarera Valdez S.A”, few months later “Noboa” Corporation bought
the firm and since 1996 The Consortium Nobis has been running the company.
Nowadays the sugar mill can produce 8500 tons of sugar cane per day; from each ton 232
pounds of pure sugar can be produced. Valdez in 2007 produced 159,032 tons of sugar.
CONFECTIONERY PRODUCTS
This sector has sales of about $135.5 million a year. In 2007, exports reached $47.81 million and local confectionery

sales increased significantly to $87.7 million.
Companies of the sector demand innovation and dynamism increase, their main problem is
sugar price and that is why businessmen want to get the best profit margins in the purchase of
raw materials.
Nestlé: It is the main food company in the world, the number one trader of powdered dry
milk, condensed milk products, chocolate, confectionery and mineral water, and number three
coffee traders. With the acquisition of Gerber Products of Novartis, Nestle is the world's largest
manufacturer of nutritional products for small children, and will provide 79% of products for
infants in the United States. In Ecuador, leads sales of confectionery segment, its main
competition is Confiteca, La Universal, Cadbury Adams, Ferrero, Arcor and Carozzi.
Confiteca: It is the leader company in the sale of sweets, chewing gum and soothers with in
Ecuador, 30% of its production is exported to Colombia, 25% to Peru and 17% to 35 other
countries. Confiteca has entered in the production of gourmet chocolate and expects a growth
of 25%. Confiteca executives believe that Ecuador's image at the international level is a major
limiting factor in negotiations.
ALCOHOLIC BEVERAGES
The demand in the country for this type of beverages has increased and sales and distribution
have been continuous. The products in most demand are beer, brandy, rum, vodka, tequila,
whisky and champagne. According to the Central Bank of Ecuador, imports of liquor into
Ecuador in the last three years reached 89,824.38 tons (2006 – 2008). However, imports on
this segment will likely be affected by the recent implementation of a new 35% tariff on top of
the existing ones that will last for a year.
In the category of national alcoholic beverages, brand Zhumir has 40.3%; Cristal, Caña
Manabita, Quindiana and Frontera will compete for the remaining 22.7% of the market, and
Norteño, Tropico, Patito Seco, Ron Cartagena and Castillo are brands involved with 37. [5]
The annual average of consumption of beer per person in Ecuador is 28 liters, very low figure
when compared to France (41 liters per capita), United States (64), Switzerland (77),
Denmark and England (90). But this is a great space that can be exploited and generate
profits.
In Ecuador, in the market for beer is dominated by the two large multinationals National Beer
Company and AmBev Ecuador, controlled respectively by the multinational group SAB Miller
and the AmBev.
National Beer Company: with presence and dominance of the market since 1922, has a 90%
of the market share, generates 950 jobs in plants that operate in Quito and Guayaquil, as well
as 2900 working places for the distribution of their products (Pilsener, Pilsener Light Club,
Dorada and Chop). From year 2006, SAB Miller bought group Bavaria, capturing 94% of the
incomes of the Ecuadorian beer market. According to the Superintendence of Companies, in
year 2007 their sales were $317.80 million.
Beverage Company of the Ameritas AmBev: began its activities in Ecuador since year
2004, with presence in Brazil, Uruguay, Paraguay, Argentina, the Dominican Republic,
Venezuela, Peru and Guatemala. According to official figures in year 2006 captured 6% of beer
consumers. It is estimated that the presence of Ambev generates 350 jobs at its plant.
Moreover, its executives hope to seize 30% of the market with one of their star products:
Brahma, to that end, they hope to produce at its maximum capacity (900 thousand annually
hectoliters).
Destilería Zhumir: In 1982 this family firm changed its name into “Destiliría Zhumir”. Since
that time Zhumir has been working with high technology standards. Nowadays it has 6
production branches in the alcohol category, and in non-alcoholic products Destilería Zhumir
also produces Natural Water, Flavored Water and Mineral Water.
NON ALCOHOLIC BEVERAGES
The non alcoholic beverages market generates about $360 million per year. The key for this
sector is product diversification. Foreign firms seeking market niches in Ecuador have an
opportunity to exploit.
According to business reports, this sector has positive prospects for the future due to the
strong demand particularly during holidays. Additionally, there have been good incentives to
demand such as a good pricing policies, advertising campaigns and new products. [6]
The market for soft drinks, which generates around $10 million a month in Ecuador is disputed
mainly by four bottling companies: Ecuador Bottling Company (EBC), a distributor of Coca-
Cola, International and Ecuatoriana de Refrescos with their Pepsi product, National Bottling
Embona which is a producer and marketer of brands such as Tropical, Apple and Crush, and
Ajecuador with brands Big Cola and KR.
Although the consumer retains its preference for black soft drinks beverages, the competition
intensified in 2001 with the arrival of the Peruvian Ajegroup (Ajecuador), which shook the
market with low-budget brands (b-brands) such as Big Cola and Kola Real.
Ajegroup: Ajegroup is present in 12 countries and started in Ecuador in 2001. The Peruvian
bottler succeeded in attracting 14% of market, reaching sales of $31 million representing a

growth of 11% over the previous year. This forced Coca Cola, represented in the country by
Ecuador Bottling Company (EBC), and Pepsi represented by International and Ecuatoriana de
Refrescos, to launch products to market that can compete with the b-brands of Ajecuador.
Coca Cola: Dominates the Ecuadorian market with 60% market share with 3 plants (Quito,
Santo Domingo and Guayaquil). Its two liter Inca Kola has 47 percent market share. It star
products are Coca Cola, Fanta and Sprite. Its sales reached $213.05 million during year 2007.
The trend in the consumption of soft drinks in Ecuador varies by city and region, in
Esmeraldas, Quevedo, Cuenca, Riobamba and Ibarra, the highest percentage of consumers
prefer Coca Cola, while in Machala where Ajecuador has a plant, KR has positioned itself as the
market leader. The trend in Quito is consuming traditional products, and that is why black soft
drinks have half of the market.
REFRESHING AND NATURAL JUICES
In a market filled with soft drinks, energy drinks and many brands of bottled water, the
segment of juices and refreshments could not remain behind in the strong competition for
attracting the Ecuadorian consumers.
The trend of consumption of the Ecuadorians aims towards the natural and light drinks, that
not only quench their thirst, but also meet certain food and nutrition characteristics.
According to the study conducted by Pulse Ecuador, the market of natural juices expects to
catch the average consumption of bottled water that is 12.6 liters per year per person, who
spends between $ 9 and $ 12 monthly in the purchase of non soft drinks.
Ecuajugos: property of Nestlé, is the principal company of juices in Ecuador, invoiced $75.87
million in 2007, its leading product is Natura, and the flavors of preference are peach, mango,
blackberry and apple.
Quicornac: present on the Ecuadorian market from year 2000, is the second company inside
this category, its sales have doubled from year 2004 up to reaching $27.22 millions in 2007,
represents the brand of juices Sunny and expects to continue growing thanks to its new
product Sunny Light.
Industrias Lácteas Toni: manufacturer of Tampico juices in flavors such as Citrus Punch,
lemonade and blackberry that had great reception in the market. At first, sales of around 800
thousand monthly units were expected but they are now selling nearly 2 million units, which is
an increase between 10% and 12% in the manufacture of hydrating and low-calorie
beverages.

Sumesa: A Company once dedicated to the production of pasta, noodle and other products, in
2004, they acquired a new $2 million processing plant. The company expected to sell 7,000
packs of lemonades but more than 21,000 were sold, reflecting both the degree of satisfaction
of consumers towards natural drinks and that liquids are a market that still needs to be
exploited in Ecuador.
REHYDRATING AND ENERGY DRINKS
On the Ecuadorian market a considerable increase can observe every year in the offer of
rehydrating and energy drinks that, according to their producers were created to increase
physical resistance, provide faster reactions, major concentration, provide an effect of well-
being, stimulate metabolism and eliminate harmful substances to the organism. [7]
People who practice sports consume these drinks in order to increase their performance,
improve the recovery, maintain the health during the intense periods of exercise and reduce
the corporal fat, but there is not a scientific investigation about these benefits, so it is not
possible to assure them.
In the country are commercialized several energy drinks brands, Red Bull, Cult, Jordan, Bang,
Red Devil and Dynamita are some of the most known names. It is necessary to differ between
rehydrating and hydrating beverages. Rehydrating drinks as Gatorade, Sporade, Powerade,
Power Yus and Tesalia Sport, are products that contain glucose and electrolytes, that is to say
sodium and potassium, which they are elements that the body loses during the physical
activity or when it is submitted to intense heat. [8]
The Tesalia Springs Company is a major producer in this market with sales reaching sales $
42.93 million in 2007, it has introduced to the market prepared and hydrating juices under the
brands of Tesalia ICE and Sport, and thanks to its growth created “Aguas de la Sierra”
(Serrasa) which is in charge to commercialize all products.
BOTTLED WATER
The marketing of water is a profitable business and groups an approximate number of hundred
brands in the country; 66 % of the consumption is on the Coast, the production in the littoral
is distributed principally in the winter (February - April) since most of tourists go to this region.
[9]
The annual consumption of bottled water with small or individual presentations is 12, 6 liters per person, and the
consumption rises annually up to 30 liters per person when water is packed in large bottles of 20 liters, which are
distributed specially to companies, business and homes with a medium type of income. [10]

The existing rivalry in the industry of not alcoholic drinks represents an opportunity for this
business, although this is a consolidated industry where the number of competitors is very
limited, due to the big investments that are needed to enter to this type of industry.
Recent studies show that brands that are positioned for more than five years can sell monthly
near two million bottles. Both leaders of the sector are National Brewery and Ecuador Bottling
Company.
SEAFOOD AND CONSERVES
The Ecuadorian fishing sector represents the third item of income for the economy of the country; during 2007 the sales
of this sector reached $1.18 billion. Elaborated sea products represent 27.3 % of the total manufacturing sales. [11]
The main fishing products produce and packaged in Ecuador are tuna and shrimp. Of almost 4
millions of metric tons of tuna that are fished in the world, 2.5 millions are extracted in the
Pacific, Ecuadorian ships account for 23%, and the country cleans and package 44% in its
plants, making Ecuador the most important country in tuna fishing and processing. [12] Tuna
and shrimp that are exported principally to the markets of the United States and Europe,
report incomes of $ 891 million in 2007.
In economic terms, for the last two decades, shrimp exports represent an important item in
the exports of the Ecuador, in spite of the fact that the production of America represents less
than 30% of the world production. Ecuadorian product is recognized on international markets
by its quality and freshness. The Ecuadorian production of shrimp nowadays exceeds 115.000
MT per year. The industry is expected to reach the pre-1998 level reflecting its recovering from
the white spot disease that devastated the sector (1999-2003). [13]
100% of the shrimp processing plants comply with the national and international quality
standards including HACCP and the requirements of the buyers. Therefore, Ecuadorian shrimp
is competitive on the international markets. Nevertheless, the principal threat for the sector
consists of not having signed the Free Trade Agreement with The United States, since it might
lose the current market and the possibility of exporting new products as those of added value.
In addition it is needed to strengthen key aspects: the defense of national production with
juridical safety, tributary incentives, reduction of the cost of inputs and credit lines.
Negocios Industriales Real (NIRSA): Begun in 1957, it has been consolidated as one of
the principal producers and packagers of tuna. The company also has diversified its production
with: juices, rice, conserves of fruits, shrimp with value added like crispy coconut and skewers,
and conserves of meat with vegetables. For its shrimp processing plant NIRSA buys all the
inputs from the United States to assure the entry of its products with value added to this
country. The company seeks increase its sales and introduce its product “beef and onion stew”

to New York where the market of Ecuadorian emigrants is large.
FAT AND OIL
Since 1952, Ecuador produces palm oil for local consumption and exportation, although this
production is too risky because it requires a high investment. According to the National
Association of Palm Growers (ANCUPA) During 2008 the production of palm oil reached 2,075
MT producing 415 MT of crude oil, and 48% of this oil is designated to local consumption.
Nationwide, there are 35 extractors of oil; most transform it into vegetable oil and lard, while
at least four of these companies dedicate to the exportation of crude palm oil for the
production of biofuel and other uses. The extractors take advantage of the seed of the fruit in
order to obtain a component for the elaboration of lard, margarines and vegetable oils.
The investments that require this sector are very high besides the high risks and price of raw
materials that are involved in this industry. Based on data from ANCUPA, the local
consumption of oil has decreased 2% since 2006 and the price of the hundredweight depends
on the region where it is sold.
The extractor of palm “Agroindustrial Quininde (Aquisa)” was found in 1983, takes charge
delivering raw materials to four industries that operate in the country: La Fabril, Danec, Ales
and Epacem.
Unilever: In 1996, Unilever bought a local ice cream company and entered the Ecuadorian
market. Since then, they have introduced a number of new products in Ecuador, such as soap
and other oil base cleaning products. Nowadays this firm is the world biggest ice cream
manufacturer, margarine, tea, one of the three top producers of dry powder milk, soaps,
detergents, palm, almond and olive oil. Unilever sales in Ecuador reached $147.26 millions
during 2007.
La Fabril: found in 1935, made of 2 units of production: 60% dedicated to products of mass
consumption with brands like La Favorita, Clar, Criollo; and the 40% left, dedicated to the
industrial division that reaches 250 varieties that supply the producers of ice cream, chocolates
and others with oils and special fat; has achieved a continuous growth after the dollarization,
during 2007 sold more than $260 millions, besides the company has invested $ 20 millions
in a new refinery that will let it duplicate its capacity of production and sales.
Industrias Ales: with 63 years in the market, is one of the main companies in the line of oils,
lards and soaps not only national, but also in Venezuela, Mexico and Europe: since year 2000
has a strategic alliance with Procter & Gamble that allowed the company to give all its products
to its clients of different economics strata, achieving $153 million on sales during 2007.

Danec: has 32 years in Ecuador, its divisions are: industrial products (gives raw materials to
many industries), institutional (bakeries, hotels and restaurants); and the mass consumption
with brands like El Cocinero, Palma de Oro and Mazorca de Oro; The company seeks to satisfy
the new trends of the consumption therefore also produces oils of several mixtures combining
soy bean, corn and palm; additional elaborates products with low levels of calories as the
Sioma oil with high nutritional value. Its sales grew 44% during 2007 reaching $161 millions.
INDUSTRY OF CEREALS AND BAKERY
This industry represents a strong growth on the market of natural products and granola, The
principal export destinies of the Ecuadoriancereals and bakery products are Colombia
(49,96%), Brasil (20,74 %) and Venezuela (8,73 %) The principal companies of the sector
are: Surindu, Tiosa, Molinera Manta, Molinos Champion, Molinos del Ecuador and Molinos
Superior.
The sector of cereals has emphasis in two markets, the first one the industry of cereals of
consumption like processed rice, which has demonstrated big advances as for brand and
quality. Secondly the cereals for the breakfast where multinational companies, like Nestlé and
Kellogs lead the market.
There are two trends in the consumption of bread consumers are expecting a more
sophisticated food with more whole and multigrains. The importance of higher nutrition and
fiber is reflected in the increased consumption of whole grain breads. The bakery industry has
diversified its products launching new series with cereals and flavors; nevertheless the product
that generates major earnings is cookies.
Nourishing products Supan Tiosa: with 59 years in the market, is the biggest bakery
industry in Ecuador, elaborates 50 products of the brands: Supan, Di Milano, Braun and Grile,
supplier of the American chain McDonald’s in the country.
Grupo Moderna: since 1954 elaborates fresh and packed bread, its production is orientated in
70% to wholegrain bread and 30% to white bread following the world trends of consumption;
besides, it offers cakes and creams for other segments of market.
Schullo: leader in the elaboration of natural products since 1962, manufacturer of cereals,
granola, honey of bee, peanut butter and fiber cookies. Showed a supported growth from 2003
to 2007 of 80 % thanks to the trends of the consumers and expects to export its products to
Europe.
DAIRY PRODUCTS
Traditionally, milk production is concentrated in the Highlands region. The use and destination
of milk production in the country has had a consistent behavior with approximately 25% of the
gross production going to consumption for calves (self-consumption) with crude milk for
human and industrial consumption, represents 75% of the gross production. Fluid milk is
destined in 25 % for industrial elaboration (19% pasteurized milk and 6% for lacteal
elaborates), 75% among consumption and utilization of crude milk (39% in human direct
consumption and 35% for domestic industries of fresh cheeses), and approximately a 1% is
commercialized by Colombia in the border.
Ecuador produces approximately 4 million liters of milk dairy with the annual consumption of
100 liters per capita. According to industry estimates, less than 50% of the population
consumes dairy products, a condition similar to other countries in South America. The dairy
industry in Ecuador nowadays is influenced by the trend of consumption of the UHT milk in
case of multicaps polyethylene or long life "Type Sachet ", which do not need a cold chain. [14]
There are six big dairy industries in Ecuador, the biggest one is Nestlé DPA with a daily
production of 300 thousand liters of milk. Other important companies are: Andina with a daily
production of 110 thousand liters of milk; Nutrileche, a company located in the southern part
of Ecuador with a daily production of 140 to 160 thousand liters of milk; Reyleche and
Pasteurizadora Quito that produce each one daily 140 to 160 thousand liters of milk, and Tony
Yogurt located in Guayaquil also specialized in the elaboration of yogurt and beverages.
The possibility of growth for the Ecuadorian dairy processing industry is directly related,
according to different companies, to the expansion on consumption of processed dairy
beverages, since there is a big sector of the population that still consumes raw milk; in
addition the dairy industry has to give more emphasis in the processing, the quality and the
price of the product to have the aptitude to export when surpluses of raw material exist.
Andina: one of the most industrialized companies in Ecuador, with 25 years of experience, has
an approximately daily production of 110 thousand liters of milk, which are divided into UHT
milk in case and carton; whole milk; low-fat; light; and yogurt. This company belongs to the
loria Group from Peru with operations, Bolivia, Puerto Rico, Argentina and Colombia. The
company has ambitious plans for the Ecuadorian market like expanding the distribution as
much to the high income segments as to those of low income; looking for the necessary
permissions to process vegetable fat milk, with soy bean proteins, maltodextrina and ways to
offer them to accessible prices.
Pasteurizadora Quito: for 46 years has been a part of the dairy industry in the country. Its
principal product is VITA PREMIUM milk which has an 80% market share in Quito. The
company is certified under the ISO norm, and produces many different production lines
(pasteurized milk, yogurt of different flavors, fresh cheese, cream, sweet of milk, UHT milk in
sachet and brick, normal milk, low-fat with fiber, without lactose, and milk flavored with
chocolate, vanilla, orange and strawberry). The low-fat milk with fiber was a Light product,
developed by the company to satisfy the trend of Ecuadorian people interested in consume
products with added value that benefit their health.

Rey Leche: It is one of the biggest dairy Ecuadorian brands; Rey Leche is produced by
Agricola Ganadera Reyshaiwal S.A. This firm is not only specialized in milk production, it owns
other dairy products like Rey Queso, Rey Crema, Rey Yogurt. [15]
TONI: Toni was founded in 1978 under the Switzerland Toni’s technology. This firm specialized
in yogurt production not only produces diary products like milk, cheese and cream, it also
produces water, juices, jelly, tea and others. [16]
Alimec (Miraflores): This consortium was founded in 1999. It is formed by three firms;
McCormick specialized in species and flavorings, Emlacmi S.A. (Miraflores Dairies) and Zanzi
S.A, (Zanzibar Ice-cream). Under the Brand Miraflores it produces and commercializes Yogurt
and butter. [17]
Floralp: Since it was founded in 1964, Floralp has been producing dairy products. From its
annual sale 59% corresponds to cheese production and the 41% left corresponds to milk,
cream and butter production. Floralp distributes its products to self-services 40%, food
services (hotels, restaurants cafeterias) 49% and supermarkets 11%. [18]
Section III. Competition
Imports into Ecuador come from NAFTA with 23.45% of the total purchases); Asia with
represent 22.08%, CAN 12.87%, MERCOSUR 11.42 %, the rest of South America, thanks to
the increase of trade with Venezuela, 14.39%, and the countries of the European Union 8,85
%.
Source: BCE
Ecuador supports commercial agreements under free-trade zones or customs unions with the
countries of the CAN, Chile, MERCOSUR, it benefits from unilateral preferences with the United
States by the Law of Tariff Andean Preferences and Eradication of the Drug (ATPDEA) and
General System of Preferences (SGP), the European Union and Japan. Also it supports an
Agreement of Partial Scope in the frame of the ALADI with Mexico and Cuba. [19]
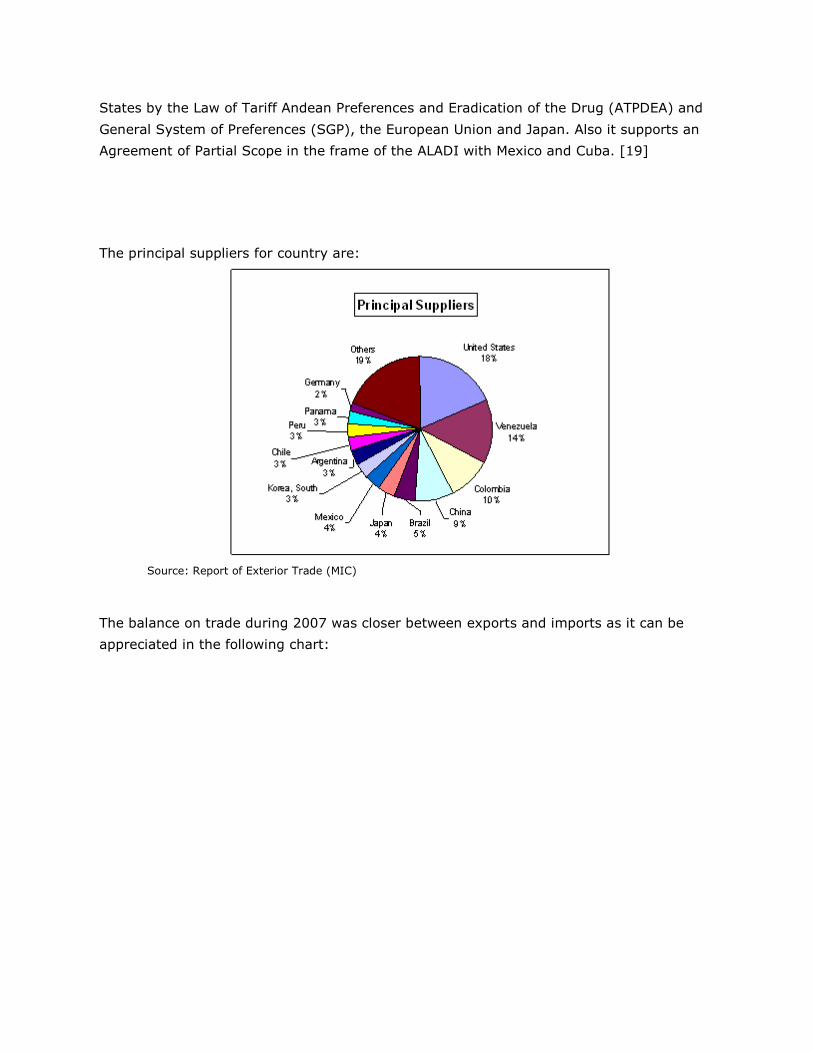
The principal suppliers for country are:
Source: Report of Exterior Trade (MIC)
The balance on trade during 2007 was closer between exports and imports as it can be
appreciated in the following chart:

During 2008 the county with the largest expansion on imports to Ecuador was Venezuela
moving from a 9% share of imports to 14% becoming the second largest counterpart after the
United States.
IMPORTS BY USE OR ECONOMIC DESTINY
(Thousand of dollars)
Raw Materials
Period Agricultural Industrial
2000 237,426 1,329,787
2001 254,890 1,548,687
2002 266,408 1,101,655
2003 288,572 1,745,779
2004 392,073 2,237,143
2005 401,107 2,540,026
2006 433,067 2,993,538
2007 580,098 3,514,610
*2008 624,463 3,166,075
Source: Customs Unique Document
Products of major importance in Ecuador are: wheat, cakes and other residues of the
extraction of soy bean oil, followed by other products of fish, by crustaceans and mollusks; and

of pre mix of dog and cat food, conditioned for retail sale.
Basically, the growth in imports reflects the success of dollarization as the average consumer
has acquired or perceives a purchasing power that remains stable and does not deteriorate as
in the past.
The Ecuadorian agricultural sector is highly protected and uncompetitive compared with the
ingredients for food processing from the United States and other countries. Due to market
access restriction, however, most of the raw materials used by the food industry are domestic
in origin.
The Council of Exterior Trade and Investments (COMEXI), at the suggestion of the Ministry of
Industries and Competitiveness, resolved to approve an import restriction that affects 78 tariff
codes related to the food and agricultural sector. This measure applies additional tariffs and
quotas on imports.
Products from the United States have important advantages in quality standards, registered
brands and presentation, but duties generally are higher than the products from Latin America,
therefore are less competitive. Products from the CAN (Colombia, Bolivia and Peru) are
competitive with regard to domestic production and do not promote trade or market growth
like products from the United States
Ecuadorian companies tend to import specialized ingredients of high technology and
innovation, such as: flavors, colorings, preserving, emulsifiers and others from the United
States and/or Europe, since in Ecuador there does not exist companies dedicated to the
elaboration of these products.
A brief review of imports by main product categories is presented below. The market shares
that are indicated in this section are based in imports from Ecuador during 2007.
Competitive Situation facing U.S. Suppliers in the Food Processing Sector in 2007
Product Category Major Import Supply
Sources in 2007 Strengths of Key Supply Countries
Advantages and Disadvantages of Local
Suppliers
Seafood Peru 90.81% Chile 3.78% Japan: 3.77%
Chile is the major supplier of sea products in South America
Ecuador is one of the most important tuna producers in Latin America
Non-alcoholic beverages
Colombia: 78.68% United States: 6.34% Mexico: 5.6%
Colombian products have more openness because their prices are accessible
The industry of drinks and refreshments has diversified for the revenue of International companies
Beer Colombia: 49.28% Mexico: 21.14%
Principal beer producers in Ecuador are Colombian
The principal trend of consumers is for national Brands

Brazil: 12.02% United States: 9.56%
and Brazilian
Oil seed products Argentina: 63.86% Peru: 28.46% Bolivia: 7.24%
Benefited by great International prices, by the double effect of high demand and low supply
National production is diverse and of high quality
Sugars
Colombia: 66.90% Peru: 6.61% United States: 5.75%
The Colombian industry of processed sugar has quality certifications and does not pay tariffs. The Brazilian sugar industry is one of the
strongest in the world.
National production of sugar is threatened by the strong imports of less price of other countries
Dairy products Chile: 49.12% Colombia: 21.99% United States: 21.45%
USA offers products that do not produce locally
National production is slightly competitive and is protected by the government
Baked goods
Per: 28.66% Colombia: 22.62% Mexico: 11.48% Chile: 10.36%
The prices at which these 3 countries offer their products are very competitive.
Ecuador counts with the presence of big companies dedicated to production
Milling products (flours)
Colombia: 85.16% United States: 13.56% China: 1.28%
The production of these countries is high and they do not pay tariff because they are members of the CAN
The prices of these products are governed by an oligopoly
Meat
Chile: 39.89% United States:25.57% Brazil: 22.13%
United States has technology, quality and sanitary certifications
Exist many informal companies that offer their products to low prices but without quality
Confectionery
Colombia: 64.82% Per: 8.23% Argentina: 7.65% United States: 4.62%
Production is massive and that is why prices are competitive
National industry is affected by high sugar prices
Prepared fruit and vegetables
Chile: 43.33% United States: 20.71% Colombia: 8.68%
USA products are of excellent quality, while the ones form Chile have competitive prices
The agricultural production of Ecuador is constant during all year, but the levels of technology are very low
Prepared animal food Chile: 53.44% Peru: 17.44% United States:11.84%
United States and Chile have specialized
industries and offer products that are not produced locally
The industry has diversified its production and nowadays offer competitive prices
Preparations of Food Miscellaneous
Colombia: 32.45% Chile: 28.42% United States: 16.42%
United States produce ingredients that do not exist in the region
National production is scanty and possesses deficiencies
Alcoholic Beverages Chile: 37.22% Colombia: 21.91% Mexico: 9.40%
United Kingdom and Chile are known for the quality of their products
Ecuadorian industry concentrates in products of low prices and quality too
Source: Statistics Central Bank of Ecuador, 2006
Section IV. Best Product Prospects

Source: Central Bank of Ecuador, 2006
It is possible to observe that in the category of import of nourishing ingredients, the strongest item during 2008
corresponds to fish and other processed aquatic products $226,843,000dollars, followed by animal and vegetable oils
$179,354,000 dollars and preparations of foodstuffs various $134,241,000 dollars, which demonstrates that the
Ecuadorian industry still has a low level of technology and needs imported products and ingredients from the relatively
higher technology suppliers in North America and Europe.
USE OF PRODUCTS/INDUSTRY
COUNTS OF CENTRAL BANK OF ECUADOR
Imports
2002 Imports
2007 CPCN Products Total Offer Total Offer Variation
(CIF) (CIF) (pc) 2002 (pc) 2007 157,924 275,519 27.0100 Chemical Basic products 227,741 370,796 62.81% 194,138 283,677 2.0100 Cereals 621,176 840,864 35.37% 905,374 1,856,881 27.0900 Other chemical Products 1,757,631 3,136,159 78.43% 93,577 256,673 15.0100 Crude oil, refined and fat 535,097 969,732 81.23%
103,995 203,011 20.0100 Other nourishing products 604,959 1,025,547 69.52%
88,939 120,509 4.0100 Other agricultural products 1,158,814 1,583,506 36.65%

30,871 58,524 21.0100 Alcoholic beverages 415,481 599,423 44.27%
32,135 43,632 19.0900 Chocolate and confectionery products 171,623 259,071 50.95%
19,033 43,632 17.0900 Bakery Products, noodles and pasta 325,581 467,075 43.46%
9,024 28,735 21.0900 Non alcoholic beverages 340,300 427,843 25.73% 15,336 7,194 18.0100 Sugar and sugar cane 235,155 304,594 29.53% 9,347 21,391 12.0100 Meat and meat products 1,086,256 1,474,960 35.78%
26,413 77,587 14.0100 Fish and other aquatic elaborated products 234,415 435,952 85.97%
7,301 18,054 20.0900 Elaborated coffee 156,945 253,605 61.59% 8,268 17,955 17.0100 Milling products 580,730 885,087 52.41%
12,591 19,444 5.0100 Cattle, alive animals and animal products 1,140,694 1,574,392 38.02%
9,165 15,578 6.0100 Forestry products 388,954 585,574 50.55%
8,493 9,529 16.0100 Elaborated lacteal products 401,936 540,603 34.50%
531 3,818 14.0900 Conserves of aquatic species 401,482 722,702 80.01%
1,367 3,330 19.0100 Elaborated cocoa 61,034 100,968 65.43%
438 2,604 8.0100 Alive fish, fresh and refrigerated 476,513 768,057 61.18%
173 403 13.0100 Elaborated shrimp 337,968 736,071 117.79%
23 1.0100 Banana, coffee, cocoa 1,291,857 1,855,574 43.64%
135,563 230,711 33.0100 Other manufactured products 1,049,138 1,710,267 63.02%
7.0100 Shrimp and larvas of shrimp 292,057 608,218 108.25%
594,581 Direct buying’s 405,229 594,581 46.73%
-477,639 998,220 Adjust CIF/ FOB
6,153,683 TOTAL 14,698,766 22,831,221 55.33%
Source: National Counts – Central Bank of Ecuador
A. Products Present in the Market Which Have Good Sales Potential
In general, products for the food processing industry with the best potential in the Ecuadorian
market for U.S. exporters are those that require of an advance technology of processing and
high quality, including: artificial flavors, colorings and chemical products, spices and others.
Also less sophisticated products like: wheat, flour of soy bean, yellow corn, mixtures, juices
and concentrates for fruit juices, syrup of glucose, some milk l derivatives like milk in powder,
whey of milk and lactose.
Food ingredients from the United States that have good market potential can be analyzed in
the following picture:
Product Category
Size of the market
2006 est.
Imports
2006
Imports growth
2002-06
Duty of Import
Limits for the
development of the market
Attractions of the Market for USA suppliers
Preparations of
1,025.547 134,241.77 98.65% 20% - Strong competition on the - Incipient industry

food miscellaneous
part of Chile and Colombia
in Ecuador
- High quality of products from United States - United States represents the 16% of imports (21,243.13 thousand USD)
Milling products and cereals
1,725.95
53,730.78
173.86%
20% - 30%
-Exist an oligopoly in this industry which imposes the price
-USA and Canada are the principal suppliers of cereals (37% and 40% respectively). National production is insufficient
Chocolate and confectionery products
259,071 57,963.18 70.28% 20% - 30%
- Colombia is one of the most important suppliers, with competitive prices
-United States brands are recognized in Ecuador - Sugar prices in Ecuador are very high
Bakery products, noodles and pasta
467,075 87,840.34 180.35% 30%
- Neighboring countries and members of the CAN, are the most important suppliers
- United Sates has specialized products that do not exist in the region. -Quality products are preferred.
Non alcoholic beverages
427,843
34465.69
235.76% 20% - 30%
-Colombia has an
important part of the Ecuadorian market
- National production is threatened by new brands and imports of low costs
Meat and meat products
1,474.960 22,121.70 222.55% 20% - 85%
-Ecuadorian production counts with sufficient technology -Restriction to Import meat and meat products from the United States.
- United States has products of high technology and quality -United States represents almost 29.41% of imports (6,506.51 thousand USD)
Dairy products 540,603 9,280.23 32.91% 54%
-Ecuadorian production is protected by the Government. - Neighboring countries are the principal suppliers
-United Sates has an specialized industry and has products that do not exist locally. - Strong presence of international industries
Source: National Counts – Central Bank of Ecuador
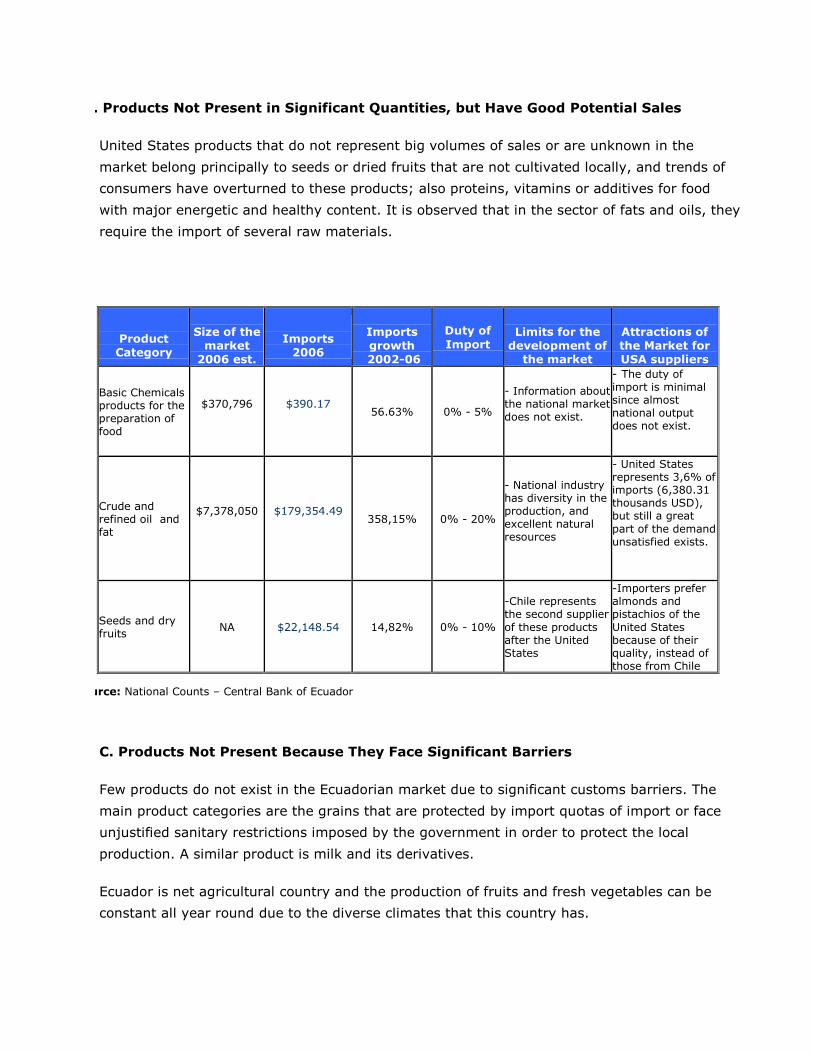
B. Products Not Present in Significant Quantities, but Have Good Potential Sales
United States products that do not represent big volumes of sales or are unknown in the
market belong principally to seeds or dried fruits that are not cultivated locally, and trends of
consumers have overturned to these products; also proteins, vitamins or additives for food
with major energetic and healthy content. It is observed that in the sector of fats and oils, they
require the import of several raw materials.
Product Category
Size of the
market 2006 est.
Imports
2006
Imports growth
2002-06
Duty of
Import
Limits for the
development of the market
Attractions of the Market for USA suppliers
Basic Chemicals products for the preparation of food
$370,796
$390.17
56.63% 0% - 5%
- Information about the national market does not exist.
- The duty of import is minimal since almost national output does not exist.
Crude and refined oil and fat
$7,378,050
$179,354.49
358,15% 0% - 20%
- National industry has diversity in the production, and excellent natural resources
- United States represents 3,6% of imports (6,380.31 thousands USD), but still a great
part of the demand unsatisfied exists.
Seeds and dry fruits NA
$22,148.54
14,82% 0% - 10%
-Chile represents the second supplier
of these products after the United States
-Importers prefer almonds and pistachios of the
United States because of their quality, instead of those from Chile
Source: National Counts – Central Bank of Ecuador
C. Products Not Present Because They Face Significant Barriers
Few products do not exist in the Ecuadorian market due to significant customs barriers. The
main product categories are the grains that are protected by import quotas of import or face
unjustified sanitary restrictions imposed by the government in order to protect the local
production. A similar product is milk and its derivatives.
Ecuador is net agricultural country and the production of fruits and fresh vegetables can be
constant all year round due to the diverse climates that this country has.
Competitiveness is very important with more than 70% of the price to the consumer of a
product in the international market corresponds to the DFI's costs (package, packing, freights,
assurances, taxes, rates for customs services, etc.), and it is possible to obtain in the external
marketing important economies to compete in better terms.
Section V. Post Contact and Further Information
If you have any questions or are seeking additional assistance, please contact the Foreign
Agricultural Service in Quito at the following address:
Av. Avigiras E12-170 y Av. Eloy Alfaro
Embassy of the United States of America
Quito, Ecuador
Tel: (593) 2 398-5247
(593) 2 398-5323
Fax: (593) 2 398-5100
E-mail: [email protected]
www.fas.usda.gov
www.usdaecuador.org
[1] Report to the National Congress to the Central Bank of Ecuador page 12 [2] Department of Commerce of Central Bank of Ecuador [3] Agroindustrial Development (MIC) [4] Publications made by Pulso Ecuador in the city of Quito, November 2005
[5] Geocyties 2005 [6] Seen of the Ecuadorian industry, May 2007 [7] Interactive New, 2006 [8] Chávez, 2005 [9] Ipsa Consulting [10] Edgardo Báez, president of the National Beer Company (CCN) 2004 [11] Acuacultura's National Chamber 2006 [12] United Nations Organization for the Agriculture and the Nourishment. [13] Magazine Vistazo , September 2007 [14] Estimations of the Ministry of Agriculture and Livestock 2005, http://www.industriaalimenticia.com [15] http://www.reyqueso.com [16] http://www.tonisa.com [17] Hrrp://www.alimec.com.ec [18] http://www.floralp-sa.com/ [19] Analysis of Exterior Trade, Ministry of Industries and Competitiveness, April 2007
