ectopic mineralization in the middle ear and chronic ... · 2
TRANSCRIPT

ECTOPIC MINERALIZATION IN THE MIDDLE EAR AND
CHRONIC OTITIS MEDIA WITH EFFUSION CAUSED BY RPL38-
DEFICIENCY IN THE TAIL-SHORT (Ts) MOUSE Konrad Noben-Trauth and Joseph R. Latoche
From Section on Neurogenetics, Laboratory of Molecular Biology,
National Institute on Deafness and Other Communication Disorders,
National Institutes of Health, Rockville, MD 20850, USA
Running Head: Rpl38-deficiency causes otitis media
Address correspondence to: Konrad Noben-Trauth, Ph.D., 5 Research Court, Rockville,
Maryland 20850. Fax: 301-435-4040; E-mail: [email protected]
Inflammation of the middle ear cavity (otitis media) and the abnormal deposition of bone at the
otic capsule are common causes of conductive hearing impairment in children and adults. While a host of
environmental factors can contribute
to these conditions, a genetic predisposition has an important role
as well. Here, we analyze the Tail Short (Ts) mouse, which harbors a
spontaneous semi-dominant
mutation that causes skeletal defects and hearing loss. By genetic means,
we show that the Ts phenotypes arise from an 18kb deletion/insertion
of the Rpl38 gene, encoding a ribosomal protein of the large
subunit. We show that Ts mutants
exhibit significantly elevated auditory-brain stem response (ABR)
thresholds and reduced distortion-product otoacoustic emissions
(DPOAEs), in the presence of normal
endocochlear potentials and typical inner ear histology suggestive of a
conductive hearing impairment. We locate the cause of the hearing
impairment to the middle ear,
demonstrating over-ossification at the round window ridge, ectopic
deposition of cholesterol crystals in
the middle ear cavity, enlarged
Eustachian tube, and chronic otitis
media with effusion all beginning at around three weeks after birth. Using specific antisera, we
demonstrate that Rpl38 is an ~8 kDa protein that is predominantly expressed in mature erythrocytes.
Finally, using an Rpl38 cDNA
transgene we rescue the Ts phenotypes. Together, these data
present a previously uncharacterized combination of interrelated middle
ear pathologies and suggest Rpl38-
deficiency as a model to dissect the causative relationships between neo-
ossification, cholesterol crystal deposition, and Eustachian tube in
the etiology of otitis media.
The otic capsule, also called the
cochlear capsule or bony labyrinth,
encloses the membranous inner ear. It
develops through condensation of
mesenchymal cells surrounding the otic
vesicle, which form a chondrified
capsule that ossifies during the late
embryonic and early postnatal period
(1). The bone of the mature otic
capsule, which constitutes the petrous
part of the temporal bone, consists of
the inner endosteal, the middle
endochondral, and the outer (facing the
middle ear cavity) periosteal layer (2).
Metabolically, this bone is largely inert
with an unusually low remodeling rate of
http://www.jbc.org/cgi/doi/10.1074/jbc.M110.184598The latest version is at JBC Papers in Press. Published on November 9, 2010 as Manuscript M110.184598
Copyright 2010 by The American Society for Biochemistry and Molecular Biology, Inc.
by guest on Novem
ber 7, 2017http://w
ww
.jbc.org/D
ownloaded from
2
<2% per year (3). Pathologic formation
of new bone is the hallmark of both
otosclerosis and labyrinthitis ossificans.
In otosclerosis, abnormal deposition of
bone occurs most often outside of the
otic capsule at the base and near the
oval and round windows (4). In contrast,
neo-ossification in labyrinthitis ossificans
manifests within the otic capsule and in
the membranous labyrinth (5). While
the causes of otosclerosis include
environmental and genetic factors (6,7),
labyrinthitis ossificans typically results
from an infection or chronic inflammation
(5,8).
Connected to the otic capsule is
the middle ear, whose skeletal
components are derived from the neural
crest that gave rise to the pharyngeal
arches and pouches (9). The
endodermal lining of first pharyngeal
pouch develops into the tubotympanic
recess that further differentiates into the
Eustachian tube and middle ear cavity
(10).
Otitis media (OM) refers to the
inflammation of the middle ear cavity. It
is classified based upon its clinical
severity and is the most common
childhood disease. More than 83% of
children have experienced at least one
episode of OM, while 46% of children
have had more than three incidents by
the age of three (11). Various stages of
OM can be diagnosed and include acute
otitis media (AOM), otitis media with
effusion (OME) and chronic suppurative
otitis media (CSOM). Children with
recurrent episodes of AOM and those
developing CSOM or OME have higher
risks of developing conductive and
sensorineural hearing loss (12-14).
There are multiple causes and risk
factors associated with OM, which can
include bacterial and viral infections,
craniofacial dysmorphologies, and
dysregulated immune responses (15).
There is also considerable evidence for
a genetic predisposition. For example, a
heritability study found strong genetic
contributions for the duration and
number of episodes of OM in
monozygotic twins and triplets (16). In
addition, genome-wide linkage scans
produced evidence for susceptibility loci
on chromosomes 17q12, 10q22.3 and
19q13 associated with chronic and
recurrent OM (17,18). Furthermore,
targeted and induced mutagenesis
identified mouse lines that model the
pathology of OME (Eya4tm1Jse) and
CSOM (Fbxo11A2288T and Evi1A1427T) (19-
21). In these models, mutations in the
transcription factor Eya4 and
ubiquitination factor Fxbo11 cause
dysmorphologies of the Eustachian tube
(ET), suggesting that impaired aeration
of the middle ear cavity and clearance of
the middle ear secretions is the
underlying cause of the OM.
Inflammation of the middle ear was also
observed in the ENU-induced Hush
Puppy mutant, in plasminogen-deficient
mice (Plgtm1Dco), and mice of the LP/J
inbred strain further underscoring the
diverse and complex etiology of otitis
media (22-25).
The Tail-short (Ts) mutation, first
described by Morgan, is characterized
by a shortened, kinked tail and reduced
body weight (26). Ts homozygotes are
embryonic lethal and die between
gestation day (E) 3.5 and E5.5 (27). Ts
heterozygotes undergo a transient
embryonic anemia, which is
accompanied by a protracted growth
and the formation of skeletal
abnormalities (28,29). The mutation
arose originally on the BALB/c
background, and has been crossed onto
C57BL/6, C56BR/a, and BALB/cSn
before it was made inbred to give rise to
by guest on Novem
ber 7, 2017http://w
ww
.jbc.org/D
ownloaded from

3
the TSJ/LeJ-Ts strain (www.jax.org).
The severity of the Ts allele varies on
different genetic backgrounds but even
on the most permissive strains 30% of
the Ts heterozygotes are perinatal lethal
(26,30). Skeletal deformities are known
to be accompanied by defects in the
inner ear in the mouse (31,32). To
determine the effect of Ts on the
perception and propagation of sound,
we set out to clone the Ts locus and
study the ear phenotype.
MATERIALS AND METHODS
Animals and Crosses - The
TSJ/Le and C3HeB/FeJ strains were
obtained from The Jackson Laboratory
(Bar Harbor, ME, USA) and Black Swiss
mice were purchased from Taconic. For
audiology, histology, and
immunochemistry TSJ/LeJ-Ts/+ (Ts/+ or
Ts) and TSJ/LeJ-+/+ (+/+) mice were
used. For the F2 linkage cross
reciprocal matings between TSJ/Le-Ts/+
and Black Swiss mice were used to
generate Ts/+ F1 heterozygotes
(TsJ/LeJ.BlackSwiss-Ts/+), which were
intercrossed to produce 1684 F2
progeny. For the rescue, transgenic
founders on the FVB/N background
were serially backcrossed to TSJ/Le-
Ts/+. Animal studies were conducted
according to guidelines of the National
Institutes of Health (ASP 1222).
Molecular genetics techniques - For genotyping of fluorescence-labeled
markers, 20-50ng of genomic DNA was amplified in a 10µl reaction containing
0.1µM each primer, 200µM dNTP,
10mM Tris-HCl, pH 8.3, 50mM KCl, 1.5 mM MgCl2, and 0.25 U AmpliTaq! DNA
polymerase (Applied Biosystems).
Reaction was incubated at 95°C for 1
min, then cycled 50 times through 95°C
for 45 sec, 55°C for 1 min, 72°C for 1
min, followed by a final extension at
72°C for 10 min. For electrophoresis, 1µl of amplified product was diluted 1:10
in formamide containing 0.1µl
GenScan! 500 ROX! size standard,
separated on a 3730 DNA Analyzer
(Applied Biosystems), and analyzed
using GenMapper software v3.1
(Applied Biosystems). Primer
sequences are available upon requests.
To screen the Ts interval for
large-scale insertions/deletions, forward
and reverse primers spanning the region
at 1kb intervals were synthesized, and all combinations were used in a 10 µl
reaction containing 50-100ng +/+ or
Ts/+ genomic DNA, using the Takara
Bio LA Taq DNA Polymerase kit
(Takara, Madison, WI). Amplification
was carried out at 94°C for 1 min, then
cycled 30 times through 94°C for 30 sec,
60°C for 30 sec, 72°C for 3 min,
followed by a final extension at 72°C for
7 min. The Ts deletion was detected
using forward-primer TsJ-27F
(CAAGACACATCTGGAGTCACAGGG)
and reverse-primers that included:
chr11-C31-r
(CCTGGAACTCATTATGTAGAGCAGC)
, chr11-C32-r
(ATGGTGCGTGCCTTAGGATGG),
chr11-C34-r
(AAGAGAGAAAGGAGTGGGACCTGG
G), chr11-C36-r
(GCAGCCTTTGTGAAGAAGCC), and
chr11-C38-r
(GCCCCACTATGGAGATTAGGAC). Ts
mice were genotyped by PCR on
genomic DNA using primer del-a-f
(GCTTTTGGAAACTCGGTCAC) and
del-b-r
(CCAGTTTCCTGTCTTTCCACG) flanking the deletion site in a 10µl
reaction using the Clontech cDNA PCR
polymerase mix.
by guest on Novem
ber 7, 2017http://w
ww
.jbc.org/D
ownloaded from

4
For DNA sequencing, PCR was performed in a 15µl reaction containing
50-100ng genomic DNA, 200µM dNTP,
2 µM each forward and reverse primers,
and 1x Advantage cDNA Polymerase
Mix (Clontech Laboratories, INC, Palo
Alto, CA). Amplification was carried out
following manufacturer!s instructions.
Reactions were treated with 1U shrimp
alkaline phosphatase (Roche) and 1U
exonuclease (New England BioLabs) at
37°C for 60 min and inactivated at 80°C
for 10 min. Sequencing of PCR
products was performed using BigDye™
Terminator v 3.1 and electrophoresed
on a 3730xl capillary sequencer (Applied
Biosystems). Sequence chromatograms
were analyzed using Sequencher v4.1.
Primer sequences are available upon
request.
Hearing tests - Hearing tests
were performed on mice anesthetized through intraperitoneal application of tribromoethanol (5.3mg/10g bodyweight). Auditory-evoked brain stem response (ABR) measurements were carried out using the computer-aided evoked potential system from Intelligent Hearing System (IHS; Miami, Florida). The Smart-EP version 10, modified for high frequency capability and coupled to high frequency transducers generated specific acoustic stimuli and to amplify, measure, and display the evoked brainstem responses of anesthetized mice. Subdermal needle electrodes were inserted at the vertex (active), ventrolaterally to the right ear (reference) and the left ear (ground). Specific acoustic stimuli were delivered to the outer ear canal through a plastic tube channeled from the high frequency transducers. Mice were presented with click stimuli and with 8-, 16-, and 32 kHz tone pips at varying intensity, from high to low (100-10 dB SPL) at a rate of 19.1 times/sec for a
total of 350 sweeps. Sound pressure level thresholds were determined for each stimulus frequency by identifying the lowest intensity producing a recognizable ABR pattern of the computer screen (at least two consistent characteristic wave forms).
Distortion-product otoacoustic emissions (DPOAEs) were measured using National Instruments (NI) LabView 8.6 software, operating an NI PCI-4461 Dynamic Signal Analyzer (DSA) sound card, to generate two pure tones, f1 and
f2, at the fixed f2/f1 ratio of 1.25, which
were emitted separately by two Clarion
SRU310H high frequency dome
tweeters placed in the outer ear canal at the presentation level of f2 = f1 (Sound Pressure Level). The f2 component was swept in 1kHz steps starting from f2 = 5 kHz to 55 kHz. Intensity levels sweeps ranged from 15 dB SPL up to 75 dB
SPL, in 10 dB increments. Sound
pressure levels were measured using an
Etymõtic-ER-10B+ microphone. The amplitude of the 2f1- f2 distortion product was plotted in dB SPL against the f2 frequency where the DP is
generated. Clarion speakers and
Etymõtic ER-10B+ microphone were
calibrated using a 1/4inch microphone
7016 (1/4inch pre amp 4016 and
microphone power supply PS9200,
AcoPacific). The AcoPacific 1/4inch
microphone 7016 was calibrated using a
QC-10 Sound Calibrator (Quest
Technologies).
The endocochlear potential (EP)
was measured via the round window.
Briefly, the tip of a small glass pipette
containing a silver/chloride electrode
bathed in 0.1M KCl was inserted
through the round window into the
endolymph using a remote controlled
motorized micromanipulator (PPM5000,
Piezo World Precision Instrument). The
electrode was connected to a Warner
by guest on Novem
ber 7, 2017http://w
ww
.jbc.org/D
ownloaded from

5
Dual Channel Differential Electrometer
(HiZ-223), which amplified and routed
the voltage difference (subdermal 1M
KCl reference electrode) to a PC-
controlled data acquisition system
(Digidata 1440A, Axon Instruments)
using AxoScope software, which
displayed the measured output. Data
were sampled at a rate of 10kHz for 60
sec. The glass electrode was prepared
using a Sutter Instrument (P-97
Flaming/Brown micropipette puller) and
measurements were performed in a
bench top faraday cage (TMC;
Technical Manufacturing Corporation).
Antibodies - Polyclonal rabbit Rpl38-
specific antisera were generated against
synthetic peptides (Pb863:
TARRKDAKSVKIKKNKDNV aa 14-32;
Pb865: LVITDKEKAEKLKQS aa 45-59)
and affinity purified. Anti-myc antibody
was obtained from OriGene.
Histology and immunohistochemistry - For gross morphology on plastic
sections, the ear was removed from the
temporal bone and dissected in PBS,
perfused with 4% paraformaldehyde and
kept in the same fixative at room
temperature for at least 12 hours.
Specimen were washed twice in PBS
and decalcified in 0.1M EDTA pH 7.0 in
PBS for three weeks. The ears were
then dehydrated with a graded series of
ethanol, infiltrated with JB-4 monomer
(Polysciences, INC.) and embedded for
mid-modiolar and saggital sections. Serial sections were cut at 4 µm
thickness using a tungsten carbide
disposable blade on a RM2265
microtome (Leica) and mounted on
Superfrost Plus microscope slides.
Sections were stained with 0.1 %
Toluidine Blue O, destained in 100%
EtOH, cleared in xylene, mounted in
Permount (Fisher), imaged on a
DM5000B microscope (Leica) and
photographed with a DFC500 digital
camera (Leica). Image levels were
adjusted with Adobe Photoshop
software. BioVis3D software was used
for 3D-reconstruction of serial sections.
For immunostaining of organ of
Corti whole mounts, cochlear ducts were
dissected in Leibovitz (Invitrogen) and
fixed in 4% paraformaldehyde (Electron
Microscopy Sciences) in PBS for 2 hr at
room temperature. The tectorial
membrane was removed and the tissue
was permeabilized in 0.5% TritonX-100
for 30 minutes at room temperature. It
was then washed three times in PBS for
10 minutes each and stored in blocking
solution (5% goat serum, 2% BSA in
PBS) at 4°C over night. Samples were
washed three times and incubated with
affinity-purified Pb863 or Pb865
antibodies (1:1000 in blocking solution)
for 2 hrs at room temperature, washed
in PBS and incubated with secondary
anti-rabbit IgG antibody (1:1000; Alexa
Fluor® 594 donkey; Invitrogen) for 1 hr
at room temperature. For visualizing the
stereociliary bundle, specimens were
dissected as described above and
stained with rhodamine phalloidin
(Invitrogen) diluted 1:100 in PBS for 30
minutes at room temperature. After
washing in PBS, the organ of Corti was
removed from the modiolus, mounted in
ProLong® Gold antifade reagent with
DAPI (Invitrogen) and imaged using a
Zeiss LSM confocal microscope.
To generate cryosections of
mouse cochlea, ears were fixed as
described above. Specimens were
washed twice in PBS and equilibrated in
a graded series of 5%, 10%, 15%, and
20% sucrose in PBS, then transferred to
a 2:1 mixture of 20% sucrose in
PBS:OCT Medium (Saukra, Torrance,
CA) and frozen over dry ice and ethanol,
then sectioned at 12 microns on a Leica
by guest on Novem
ber 7, 2017http://w
ww
.jbc.org/D
ownloaded from

6
cryostat (CM 3050S) and stored at -
80°C. For immunostaining, cryosections
were brought to room temperature in a
humidified chamber, then re-fixed in 4%
paraformaldehyde in PBS for 15
minutes, permeablized in 0.5% Triton X-
100 in PBS for 30 minutes, and stained
as described above.
For immunostaining on whole
blood, freshly drawn intra-cardial blood
was dispensed into EDTA-K2 coated
tubes (Terumo) and rotated for 30 min at room temperature. 50µl blood was fixed
at 1:2 dilution in 4% paraformaldehyde
(Electron Microscopy Sciences),
incubated for 10 min at room
temperature and spread onto
Superfrost®/Plus microscope slides
(Fisher Scientific). Slides were air-dried
and stored at 4°C until use. Cells were
post-fixed in 4% paraformaldehyde for
10 min at room temperature, washed in
PBS, permeabilized in 0.5% TritonX-100
for 30 min, blocked in 5% goat serum,
2% BSA in PBS for 30 minutes,
incubated with either Pb863 (1:200), or
Pb865 (1:200) diluted in blocking
solution for 60 minutes, washed and
stained with secondary anti-rabbit IgG
(1:1000; Alexa Fluor® 594 donkey;
Invitrogen) for 60 minutes, then washed
in PBS and mounted in ProLong® Gold
antifade reagent (Invitrogen) and
imaged on a Zeiss LSM 710 confocal
microscope.
Western blots - Freshly drawn
intra-cardial blood was dispensed into
EDTA-K2 coated tubes (Terumo) and
rotated for 30 min at room temperature.
Cells were diluted 1:15 in HBSS,
pelleted for 5 min a 3523 rcf at 4°C,
washed twice in HBSS, resuspended in 200 µl HBSS and frozen in -20°C until
use. Cochleae were dissected in PBS
and stored at -20°C until use.
For Western blot analyzes frozen
tissue was lysed in RIPA buffer (50mM
Tris/Hcl pH 7.5, 150mM NaCl, 1%
Triton-X 100, 0.5% Deoxycholate, 0.1%
SDS, 1mM phenylmethansulfonyl
fluoride (PMSF) in the presence of
Complete protease inhibitor cocktail
tablets (1/2 tablet/5ml buffer) (Complete,
Roche) using a motorized homogenizer.
Proteins were solubilized for 2 hours on
ice followed by centrifugation at 4°C at
20,000rcf for 30 minutes. Supernatant
was collected and stored in aliquots at –
20°C until use. Protein concentrations
were determined using Bradford assay
reagents (BioRad, CA). Frozen
solubilized protein extracts were thawed
on ice, diluted in Laemmli buffer (30mM
Tris/Hcl pH 6.8, 1% SDS, 12.5 %
glycerol, 0.01% bromophenol blue, 2.5% (v/v) "-mercaptoethanol), and denatured
at 70°C for 10 minutes. Proteins were
separated in 18% NuPAGE™
acrylamide Tris-Glycine gels (Invitrogen,
CA) at 150V for 90 min, then,
transferred onto PVDF membranes in
25mM Tris, 192mM glycine, 20% (v/v)
methanol using an electrophoretic
transfer cell (100V, 60 minutes). Rpl38
was detected with Pb863 and Pb865
antibody (1: 200 dilution) and alkaline-
phosphatase conjugated goat-anti rabbit
IgG (1:10,000; Bio Rad) using
chemiluminescence (Bio Rad, CA).
Protein lysates of HEK293T cells
transfected with and without myc-tagged
human Rpl38 (NP_001030335) were
obtained from OriGene. For the peptide
blocking, equal volumes of 10mg/ml
peptide and 1.3mg/ml Pb865 antibody
were mixed and incubated at room
temperature for 1 hr. For Western blot
hybridization and immuno-
histochemistry staining,
antibody/peptide aggregates were
diluted 1:200 in blocking solution.
by guest on Novem
ber 7, 2017http://w
ww
.jbc.org/D
ownloaded from

7
Transgenic rescue - Poly-A+
mRNA was extracted from wildtype and
Ts/+ P14 whole cochlea as described
and was reverse-transcribed using the
SuperScript® II RT System (Clontech).
Full-length RpL38 cDNA was amplified
using the forward primer RpL38-mRNA-
F4-EcoRI (ATGCGAATTCAGCTCTGTTCTTGAAA
AAGACT) and the reverse-primer
RpL38-mRNA-R2-HindIII (ATGCAAGCTTGTTTTTAATAGTCACA
CGCAGAGGGC), digested with EcoRI and HindIII, and cloned into pGEM-4Z
(construct named pRpL38.1). Coding
cDNA was amplified from pRpL38.1
using the forward-primer RpL38-
pBroad_F1
(ATGCGAATTCGTCGCCATGCCTCGG
AAAATTG) and the reverse-primer
RpL38-pBroad_r1
(GCATGAATTCTCATTTCAGATCCTTC
ACTGC) (each with engineered EcoRI restriction site) and cloned into pBroad3-
MCS (InvivoGen) under the control of
the constitutively active mouse ROSA26
promoter (construct named pRpL38.4).
The mROSA-RpL38-polyA transgene
was excised from pRpL38.4 using PacI, purified and microinjected into FVB/N
male pronuclei by the NEI Transgenic
Core Facility at NIH. Transgenic
animals were genotyped by PCR using
primers mROSA-Rpl38-F1
(AAGAAGAGGCTGTGCTTTGGG) and
Rpl38polyA-R1
(CACAGACAAGGAAAAGGCAGAG)
using FailSafe™ PCR system buffer G
following manufacturer!s instructions
(Epicentre Biotechnologies).
Statistical analyses - Unless
otherwise indicated groups of data were
compared using one-way ANOVA
followed by Bonferroni post-tests to
correct for multiple testing. GraphPad
Prism 4.0b software was used to
perform the statistics and to plot the
data.
RESULTS
Ts is an Rpl38 deletion mutation. Previous linkage analysis placed Ts to
position 73.5 cM on distal chromosome
11 (33,34). To further refine this
interval, we established an F2 linkage
intercross between the parental
TSJ/LeJ-Ts/+ and Black Swiss strains,
and produced 3368 meioses. The F2
progeny were classified as either tail-
short or normal-tailed based on their tail
morphology and genotyped at SSLP
markers D11Mit168, D11Mit128, D11Mit257, and D11Mit203. This
identified 88 recombination events and
placed Ts between D11Mit128 and
D11Mit257. Twenty-seven
recombinants within this interval were
further genotyped using additional SNP
markers, which ultimately refined the Ts
locus to a 0.2 cM interval between
D11Ntra3 and D11Ntra5 (supplemental
Fig. S1). This region contains 89,543 bp
and is bounded by the MMU11
nucleotides 114,506,775 and
114,596,318 (UCSC Genome Browser
on Mouse July 2007) (Fig. 1A). All
known and predicted exons of the three
genes within this interval (RpL38, Ttyh2,
and Dnaic2) were sequenced, but no
polymorphisms were detected between
the wildtype and Ts allele. To test for a
large-scale insertion and/or deletion
mutation, we employed a long-range
PCR scheme, which revealed the
absence of approximately 18kb of
genomic DNA on the Ts chromosome
(Fig. 1B). DNA sequence analysis of
PCR fragments, which were amplified
exclusively from the Ts chromosome,
demonstrated that 18,189 bp containing
the entire riboprotein gene RpL38 had
been deleted. Furthermore, the
by guest on Novem
ber 7, 2017http://w
ww
.jbc.org/D
ownloaded from

8
endogenous sequence was replaced
with a 657 bp insertion showing high
sequence identity to the gag/pro-pol-dUTPase genes of the endogenous
retrovirus MuERV-L (Fig. 1C) (35). PCR
analysis of genomic DNA obtained from
nine TSJ/Le-+/+ and 13 TSJ/Le-Ts/+
mice (including genomic TSJ/Le DNA
from The Jackson Laboratory) as well
as a number of common inbred strains
confirmed that the insertion/deletion
mutation is unique to the Ts
chromosome (Fig. 1D).
Elevated ABR thresholds and reduced DPOAEs in Ts. To determine
the auditory characteristics of Ts mice,
we measured the neural activity of the
cochlear nerve (determining thresholds
of auditory-brain stem evoked
responses (ABR)), ascertained the
functioning of sensory outer hair cells
(measuring distortion-product-
otoacoustic-emissions (DPOAEs)), and
tested the performance of the stria
vascularis (measuring the endocochlear
potential (EP)).
By employing a series of acoustic
stimuli covering a frequency band of six
octaves (1-32 kHz), we found a
significant increase in ABR thresholds in
Ts mice. At four weeks of age,
thresholds at the click and 8 kHz stimuli
were significantly increased in Ts/+
(n=12) compared to +/+ littermate
controls (n=6; Fig. 2A and B; Table 1).
The mean threshold difference at 16-
and 32 kHz between +/+ and Ts/+ mice
did not reach significance level, but the
variance differed significantly between
the two genotypes (p<0.001; Bartlett!s
test). Hearing loss at eight weeks of
age affected all test frequencies to a
similar degree with an average increase
of thresholds of 28 dB SPL (Fig. 2A;
Table 1). After eight weeks, ABR
thresholds at the click, 8- and 16 kHz
stimuli stagnated. At these stimuli, there
were no significant threshold differences
between 8- and 30-week-old and
between 30- and 52-week-old Ts mice.
Hearing thresholds at the 32 kHz,
however, differed between 8- and 52-
week-old Ts mice. However, there was
also a significant threshold increase at
the 32 kHz stimulus in 52-week-old +/+
animals (Fig. 2B). The increase of
thresholds in older +/+ mice is
presumably the result of the mixed
TSJ/LeJ genetic background.
We next measured DPOAEs. In
three-week-old Ts/+ mutants (n=24
ears) emissions at the L1=75 dB SPL
stimulus level were significantly reduced
over a wide range of test frequencies
(f2=10-50 kHz) compared to three-
week-old +/+ littermate controls (n=20
ears). Emission levels in +/+ ears were
slightly reduced compared to normal
hearing C3HeB/FeJ mice at four weeks
of age (n=12 ears), which was most
pronounced at the 45-54 kHz frequency
range (Fig. 2C). Comparison of
emission levels at the 16 kHz frequency
also showed significant reductions at
65-, 55-, and 45 dB SPL stimulus levels
between Ts/+ and +/+ mice (Fig. 2D).
Emission levels of Ts/+ mice at 12
(n=32 ears) and 48 (n=10 ears) weeks
of age were significantly reduced at the
16 kHz frequency being near noise floor
levels up to 75 dB SPL stimulus level
compared to age-matched +/+
littermates (n=28 and n=6 ears,
respectively) (Fig. 2E). These data
suggest that hearing impairment in Ts
mice starts at around three weeks of
age and is fully expressed by eight
weeks.
In 20 Ts/+ mutants, DPOAE loss
occurred in both ears, in nine mutants
one ear was affected and in four mice
both ears showed emissions greater
by guest on Novem
ber 7, 2017http://w
ww
.jbc.org/D
ownloaded from

9
than 20 dB SPL (16 kHz; L1=75dB
SPL). Penetrance of DPOAE loss in
Ts/+ ears was 74% (n=49/66; average
age: 13 weeks; age range: 3-48 weeks).
In age-matched +/+ littermates, five
animals showed unilateral hearing loss,
none exhibited reduced emission in both
ears and penetrance was 9% (n=5/54;
average age: 14 weeks; age range: 3-48
weeks). Despite the reduced
penetrance the phenotype/genotype
correlation was highly significant
(p<0.0001; Fisher!s test).
As DPOAEs depend to a large
extend on the electrochemical gradient
in the endolymph of the scala media, we
measured the endocochlear potential.
Starting at four and up to 48 weeks of
age Ts/+ mice had EPs that were in the
normal range and did not differ from the
EPs of +/+ littermates. The mean EP at
the round window averaged over all
age-groups in Ts/+ mice was 98.9 ± 7.3
mV (n=13) and the EP levels in +/+
littermates was 103 ± 6 mV (n=14;
p>0.05) (Fig. 2F) suggesting a normal
stria vascularis function in Ts.
Ectopic ossification and crystal deposition in the middle ear cavity. Histologic and morphologic inspection of
the Ts ear revealed a pathosis in the
middle ear. There, the first signs of a
phenotype were seen in three-week-old
ears as a locally restricted neo-
ossification at the otic capsule. In the
normal four-week-old cochlea, a thin
straight bony ridge-like elevation forms
at the lateral wall of the otic capsule that
reaches into the lumen of the middle ear
cavity and extends from the round
window up to the apex (Fig. 3A and B,
arrows +/+). This round window ridge is
mostly composed of endochondral bone
and emerges at the position where the
petrous bone of the cochlea adjoins the
tympanic bone of the surrounding dorsal
bulla (Fig. 3A and B, also 4E and F). A
bony elevation of similar anatomy is
present at the side of the oval window.
This oval window ridge forms the lateral
side of a groove that harbors the
tympanic tensor muscle (Fig. 3A). In Ts
cochleae, neo-ossification of the round
window ridge (here named "nøbben!; Norwegian for outcropping) was
detected three weeks after birth (n=12
ears), and became fully expressed by
12 weeks of age (n=26 ears; Fig. 3B;
arrows Ts/+). Histologic cross sections
revealed the massive formation of
endochondral bone extending into the
middle ear cavity that occasionally reached a height of ~300µm, compared
to the height of a normal round window ridge of ~150µm (n=12 ears; Fig. 3C
and D, Ts/+). Three-dimensional
reconstructions of one representative
ear using serial sections that covered a length of 350 µm, revealed a 1.5 fold
increase in the volume of the ectopic
endochondral bone in Ts/+ compared to
the normal round window ridge of a +/+
ear (Fig. 3E). The endosteal layer of the
otic capsule was of normal thickness in
Ts and the nøbben had no adverse
effect on the morphology of the
underlying cellular layers (i.e. spiral
fibrocytes and stria vascularis of the
inner ear) (Fig. 3C and D). Along with
this, we observed excess deposition of
fine crystals in the middle ear. In three-
week-old Ts cochleae (n=12 ears), large
aggregates of crystals were seen within
the round window and at the oval
window. The crystals surrounded, and
in some ears, completely covered the
stapes (Fig. 3F, also Fig. 3B and H;
arrowhead). Frequently, a sea of
crystals filled the entire cavity. Using
bright field and scanning electron
microscopy, the crystals differed in size
and had a flat and thin appearance (Fig.
by guest on Novem
ber 7, 2017http://w
ww
.jbc.org/D
ownloaded from
10
3G). Both, the bone and crystal
formation varied in their penetrance and
expressivity. In a total of 62 Ts/+ ears
(average age: 17 weeks; age range: 3-
48 weeks) penetrance of ossification
and crystal formation was 87% and
84%, respectively. In this population,
penetrance of DPOAE loss was 84%
and significantly correlated with the
ectopic ossification (p<0.0001) and
crystal formation (p<0.0001) (Fig. 3H
and I, Table 2). Similarly, the
association between nøbben (n=54) and
crystal formation (n=52) was significant
(p<0.0001).
No other gross morphological
defects were readily detected in the ears
of Ts mice. Most notably the middle ear
bones exhibited a normal morphology
although some signs of cellular debris
deposition could be seen on Ts stapes.
Cross sections of the cochlear duct of
eight-week-old Ts/+ mutants (n=5)
revealed a normal appearance of the
organ of Corti, the stria vascularis and
the spiral ganglion compared to age-
matched +/+ littermate control cochleae
(n=4). Furthermore, the cellular pattern
and hair cell planar polarity of the organ
of Corti were unaltered in Ts
(supplemental Fig. S2).
Chronic inflammation with effusion in Ts. The abnormal
mineralization of the middle ear cavity
was accompanied by a chronic
inflammation with effusion. In the
normal otic capsule, the periosteum
forms a thin cellular layer consisting of
osteoblasts, collagen fibers and
fibroblasts that covers the outer layer of
the bony cochlea. In Ts ears, starting at
two weeks of age, the periosteal layer
appeared dilated, swollen, and
delaminated from the underlying bone
(Fig. 4A and B). At three weeks, the
dilation and outward-growth of the
periosteum became more pronounced.
In addition, we noticed the appearance
of cellular debris-like aggregates in the
middle (Fig. 4C) and apical region (Fig.
4D) of the middle ear cavity. In twelve-
week-old Ts/+ ears (n=12), the
inflammation had progressed to a
chronic inflammation with effusion, as
evidenced by the eosinophilic serous
exudate (pus) in the middle cavity (Fig.
4E and F) and the abundance of cellular
aggregates and debris containing cells
typical of the monocyte-macrophage
lineage (Fig. 4G-J).
The space around the stapedial
footplate at the oval window was filled
with exudate, but the annular stapedial
ligament, which connects the footplate
with the oval window and is often the
site of otosclerotic plaques formation,
was normal in Ts (Fig. 4K).
Furthermore, the round window
membrane was normal despite massive
concentration of minerals, serofibrinous
precipitates, and cellular debris in the
round window (Fig. 4L and M). We did
not observe exudate or cellular infiltrates
in the endo- and perilymph of the inner
ear (Fig. 4F).
In 36-week-old Ts/+ ears (n=2),
the inflammation persisted as seen by
the dilated and delaminating periosteum
(Fig. 4N-P) and the cellular debris
around the round window (Fig. 4Q). In
the middle ear cavity near the round and
oval window, there were also large
aggregates of condensed mineralized
extracellular debris, with some
interspersed macrophages (Fig. 4R and
S). We furthermore observed node-like
cell masses near the round window
membrane and attached to the cochlear
wall. These nodes contained fibroblasts
and macrophages and presented with
randomly oriented spindle-shaped
cholesterol clefts (Fig. 4T, U).
by guest on Novem
ber 7, 2017http://w
ww
.jbc.org/D
ownloaded from

11
In a sample of five 56-week-old
Ts/+ mice, we found eight ears with pus
and crystal deposition in the middle ear
and around the stapes. In some
instances the debris around the stapes
had a red-like appearance indicative of
hemorrhage (Fig. 4V and W). Together,
these data suggest that the inflammation
is chronic and persists throughout the
life.
To ascertain the microbial status,
sterile aliquots of the middle ear fluid
were obtained and cultured on agar
plates for 48 hrs. Eight out of 16 Ts/+
ears of 4-, 16-, and 52-week-old mutants
showed sporadic growth of bacteria,
which were typed as Staphylococcus warneri, Staphylococcus xylosus,
Staphylococcus epidermis, and
Enterococcus faecalis. However, four
out of ten +/+ littermate control ears
showed similar growth characteristics
and bacterial type. In two 52-week-old
middle ears that were filled with fluid and
pus no bacteria could be isolated.
There was no clear correlation between
the presence of pus and bacterial
growth. Only eight out of 13 ears with
pus showed bacterial growth.
Perforation of the tympanic membrane –
a hallmark of suppurative chronic otitis
media – was not observed.
Enlarged Eustachian tube in Ts. Middle ear inflammation is often found in
connection with craniofacial deformities
that affect the shape of the Eustachian
tube. Serial cross sections through the
ventral tip of the middle ear revealed the
Eustachian tube at the anterior wall of
the middle ear as a hallow narrow
opening surrounded by the cartilaginous
segment (Fig. 5A). In ears at 3-, 4-, 12-,
and 36 weeks of age (n=5 ears) we
noted a wider opening of the ET in Ts/+
compared to their +/+ controls (n=4). In
mutant ears the opening was round and
wide, whereas in +/+ controls it
appeared stretched and tight. The
cross-sectional area at the opening was
on average 1.6 times larger in Ts/+ than
in +/+ ears. In one representative +/+
ear at three weeks of age, the perimeter
of the Eustachian tube at the opening measured 1,338 ± 38 µm (n= 5 sections)
and the cross-sectional area of the lumen measured 87,441 ± 10,234 µm2
(Fig. 5A andC). In the three-week-old
Ts/+ ear the Eustachian tube at the
opening was significantly larger with a perimeter of 1,564 ± 70 µm and the
cross-sectional area of 162,789 ± 13,943 µm2 (n=5 sections; p<0.001)
(Fig. 5B and D). Three-dimensional
reconstruction of serial sections of the
lateral portion of the Eustachian tube
revealed a 2.8 fold increase in volume in
the three-week-old Ts ear compared
with the +/+ control (Fig. 5A and B).
Aside from the ear phenotype, a
comprehensive phenotypic analysis
revealed abnormally shaped tails and
shortened noses. Among a series of
serological markers, organic phosphate
was significantly elevated in Ts with a
mean of 8.2 ± 1.23 mg/dL compared to
6.6 ± 0.85 mg/dL in +/+ littermates
(p=0.028; n=6). Body weight was
reduced in eight-week-old Ts with a
mean of 20 ± 3 g (n=17) compared to 24
± 3 g in +/+ mice (n=26; p<0.001). The
cellular hematology was normal
(supplemental Table S1).
Rpl38 expression and localization in cochlea and erythrocytes. To
determine the function of Rpl38 in the
ear, we generated polyclonal antisera
Pb863 and Pb865. To ascertain their
specificity, we probed protein lysates of
HEK293T cells transfected with myc-
tagged Rpl38. On Western blots, both
affinity-purified antisera recognized a
by guest on Novem
ber 7, 2017http://w
ww
.jbc.org/D
ownloaded from

12
distinct band of ~8 kDa in the
transfected, but not in the untransfected
lysate. The same ~8 kDa band was
also detected with the anti-myc antibody
(Fig. 6A). On protein extract of +/+ and
Ts/+ ears, Pb865 recognized a ~8 kDa
protein species with equal intensity in
both lysates. Likewise, the Rpl38
antibody showed strong reactivity with
protein lysates prepared from whole
blood cells (Fig. 6B). Quantitation of
staining intensities, controlled for equal
amounts of peripheral blood cell
numbers, protein concentration and anti-
actin staining, showed equal amounts of
Rpl38 being present in +/+ and Ts/+
whole blood cells (data not shown).
Preincubation of Pb865 with excess of
the synthetic peptide used to generate
the antibody, effectively blocked the
appearance of the ~8kDa band in ear
and blood protein extracts. In addition,
the peptide also blocked the binding of
the higher molecular weight bands
observed in the ear protein lysate (Fig.
6C). The higher molecular weight bands
in the ear lysate may represent native
complexes containing Rpl38 or
incompletely solubilized Rpl38 protein
aggregates.
To determine the tissue
distribution, we stained inner and middle
ear tissues with Pb865. In whole mount
preparations of the organ of Corti and
the stria vascularis at postnatal day (P)
5, we found clear and strong staining of
red blood cells in the vas spirale (the
blood vessel underlying the organ of
Corti) and in the vasculature of the stria
vascularis (Fig. 6D-F). In cryosections
of adult cochlear tissue, we found
abundant staining of blood cells in the
vas spirale (Fig. 6G) and in other blood
vessels of the membranous labyrinth
such as in the stria vascularis (Fig. 6H),
and the spiral limbus (data not shown).
In cryosections of adult middle ear,
staining of blood cells located within the
periosteal membrane and within the
vasculature of the bony labyrinth was
readily detected (Fig. 6I). There was no
difference in the staining between +/+
and Ts/+ ear tissue (data not shown)
and no other regions in the middle and
inner ear showed specific staining. On
adult blood spreads, staining was most
pronounced for mature non-nucleated
erythrocytes and was concentrated
around the plasma membrane. No
difference between +/+ and Ts/+ blood
spreads were noted (Fig. 6J and K) and
staining with a non-specific rabbit IgG
antibody did not produce any discernible
signal (Fig. 6M). In addition, the Pb865
staining in the stria vascularis and
erythrocytes was efficiently blocked by
the synthetic peptide specific for the
Pb865 epitope (Fig. 6M and N).
Rpl38 cDNA transgene rescues the Ts phenotype. The Ts mutation may
have eliminated or introduced regulatory
sequences not associated with Rpl38
function. To prove that the skeletal and
hearing phenotypes were directly
caused by the deletion, we generated a
transgenic mouse line expressing Rpl38
cDNA under the control of the ubiquitous
mouse ROSA26 promoter. In the N1
and subsequent N2 and F2 generations,
Ts/+ mice carrying the transgene (Ts/+
tg+, n=15) had a normal tail, whereas
Ts/+ mice without the transgene (Ts/+
tg-, n=11) exhibited the skeletal
phenotype typical of Ts mice (p<0.0001,
Fig. 7A, Table 3). No Ts/+ tg+ animal
with a Tail-short phenotype was
observed. Interestingly, all offspring of
the N1 generation regardless of their
genotype at Ts had normal hearing,
based upon their normal DPOAEs.
However, in the F2 and N2 generations,
the input/output function at f2 = 16 kHz
by guest on Novem
ber 7, 2017http://w
ww
.jbc.org/D
ownloaded from

13
and L1=55 dB SPL of Ts/+ tg- ears
(n=12) showed significantly reduced
emissions compared to +/+ tg+/- ears
(n=62). Interestingly, Ts/+ tg+ ears
showed significantly higher emission
levels compared to Ts/+ tg- ears
(p<0.001) (Fig. 7B, Table 3). Using
ABR, we found that hearing thresholds
were significantly lower in Ts/+ tg+ mice
(n=7) than in Ts/+ tg- mice (n=6;
p<0.01). In addition, hearing thresholds
in Ts/+ tg+ were not different from those
of normal hearing +/+ tg+/- mice (n=13;
p>0.05) (Fig. 7C, Table 3). DPOAE
levels and ABR thresholds in Ts/+ tg+,
Ts/+ tg-, and +/+ tg+/- mice slightly differ
from those of Ts/+ mice of the isogenic
TSJ/LeJ strain (Fig. 2A and D). We
attribute this better hearing to the mixed
TSJ.FVB genetic background.
Furthermore, whereas Ts/+ tg- ears
(n=6) demonstrated crystal deposition,
ossification and hemolysis, transgenic
Ts (Ts/+ tg+; n=8) and wildtype (+/+ tg(+/-); n=20) ears showed no signs of a
middle ear pathology. Together, the
data suggest that expression of Rpl38
on Ts/+ mutants rescued the skeletal
and hearing phenotypes.
DISCUSSION
In this study we found that the Ts
phenotypes are caused by a large-scale
deletion of the Rpl38 gene. The
mutation leads to ectopic ossification
and cholesterol crystal deposition in the
middle ear cavity, an enlarged
Eustachian tube, and chronic
inflammation with effusion that, together,
result in a conductive hearing loss
starting at around three weeks of age.
We provide compelling evidence
that the deletion of Rpl38 in the
heterozygous state causes the Ts
phenotypes. This is based on a high-
resolution genetic map, exon-
sequencing of the three genes in the
critical interval, perfect skeletal
phenotype/genotype correlation, and the
rescue of the skeletal and auditory
defects by an Rpl38-expressing
transgene. Deficiency of ribosomal
proteins is known to underlie Ts-like
phenotypes in Drosophila, mouse and
human. In D. melanogaster, a class of
more than 50 mutants – called minutes -
are homozygous lethal and
heterozygotes weight less, and are less
viable, all of which are hallmarks of Ts
(36). Minute mutants with characterized
mutations are haploinsufficient for a
riboprotein gene, and the phenotypes
are attributed to reduced rates of cell
proliferation caused by a reduction in the
maximal rate of protein synthesis (37).
In humans, haploinsufficient mutations
in RPS10, RPS19, RPS24, RPS26, RPL5, RPL11 underlie a condition
known as Diamond-Blackfan Anemia
(DBA), which also often includes mild
craniofacial and skeletal abnormalities
(38-43). Recently, a screen of
ribosomal genes in a large cohort of
individuals with DBA for mutations did
not reveal a mutation in RPL38 (39). In
addition, our own screen of a large
patient group with autosomal recessive
hearing loss did not uncover a mutation
(Richard Smith, Michael Hildebrand,
Konrad Noben-Trauth, unpublished
observations), suggesting that Rpl38
deficiency in humans may be embryonic
lethal or manifests in a different
pathological context.
Rpl38 is predominantly and
abundantly expressed in erythrocytes.
This observation does not exclude low-
level expression in other cell types as
one would expect for a ribosomal
protein, but rather points to an extra-
ribosomal function (44). A function for
by guest on Novem
ber 7, 2017http://w
ww
.jbc.org/D
ownloaded from

14
Rpl38 during erythropoiesis is
suggested by the anemia that is
observed in Ts embryos as early as
E9.0 (29). It is interesting to note that
~30% of heterozygotes die during the
perinatal period, which coincides with
the transition of erythropoiesis from the
liver to the bone marrow (45).
Interestingly, adult heterozygotes have
normal levels of red blood cells,
hemoglobin, hematocrit, and mean
corpuscular volume (MCV)
(supplemental Table S1) (28,29). Also,
osmotic fragility tests and cochlear blood
flow measurements by laser Doppler
flowmetry showed normal erythrocyte
function in Ts mice (our unpublished
observations). Furthermore, quantitative
comparison of Rpl38 protein levels
between Ts/+ and +/+ adult whole blood
did not reveal any significant
differences. In addition, Rpl38 mRNA
levels were not different between Ts/+
and +/+ in two-week-old cochleae
(supplemental Fig. S3). The apparent
lack of a gene dosage effect in postnatal
and adult Ts tissue may be due to
compensation at the transcriptional
level. A similar normalization effect of
Rps19 mRNA expression was recently
shown in Rps19+/- mice (46). Together,
these observations suggest that a major
effect of the Rpl38 deletion is realized as
anemia during the embryonic
development, which is overcome in the
adult. The ~70% of Ts/+ heterozygotes
that survive the embryonic anemia have
a normal life span and show very few
pathological features except for their
hearing loss. Interestingly, it appears
that the middle ear phenotype is
susceptible to stochastic factors and
genetic backgrounds. The middle ear
pathology is only ~80% penetrant and
TSJ.FVB-Ts/+ F1 (see above) and
TSJ.BlackSwiss-Ts/+ F1 hybrids
(unpublished observation) have normal
hearing, although they do exhibit the
skeletal defects. The effect of the
genetic background is also seen by the
elevated hearing thresholds in 52-week-
old +/+ and Ts/+, which is presumably
due the presence of the Cdh23ahl allele
(47). However, the precise role of the
Rpl38 deletion during erythropoiesis, in
adult erythrocytes, and its implication in
the middle ear phenotypes remains to
be determined. As extra-ribosomal
functions for ribosomal proteins have
been suggested in the past (48), the
ribosome-free erythrocyte provides an
excellent biochemical system to study
such a function for Rpl38.
The concomitant manifestation of
the nøbben, cholesterol crystals,
widened Eustachian tube and
inflammation currently prevents the
establishment of a clear chain of events.
However, there is some room for
speculations. Neo-ossification of the
cochlear bone is also a hallmark of
labyrinthitis ossificans (LO) (8) and the
Palmerston North (PN) autoimmune
mouse strain (49). In LO, the bone is
the late-stage result of an acute
bacterial meningitis and inflammation.
The ectopic bone is formed by
osteoblasts (osteoblastic-type) as found
in human temporal bones (50) or may
result from deposition of calcium salts
(calcospherite) by fibroblasts as
described in the gerbil model (51). In
both cases, the ectopic bone occurs as
an outgrowth of the endosteal layer,
without affecting the structure of the
endochondral bone. In the PN mouse,
the neo-ossification is due to abnormal
mineralization of connective tissue
triggered by hypertrophic fibroblasts
next to the bone of the modiolus (49).
Neo-ossification on the outside of the
cochlear wall was also described in the
by guest on Novem
ber 7, 2017http://w
ww
.jbc.org/D
ownloaded from

15
LP/J strain. There, deposition of new
bone occurred immediately apical to the
round window, around the stapedial
artery, and at the apex (24). However,
in Ts formation of new bone is only seen
on the outside of the cochlear wall and
restricted to the round window ridge.
The cause of this bone deposition is
unclear, but may involve the activation
of osteoblasts or fibroblasts at the
prospective round window ridge. It is
interesting to note that osteoblasts were
recently shown to form part of the
hematopoietic stem-cell niche (52) and it
is tempting to speculate that the same
molecular events that affect
erythropoiesis may also sensitize
osteoblasts. The initial trigger may
come from the increased organic
phosphate levels as measured in Ts
serum (53). This activation may be
most pronounced at the round window
ridge, where the petrous and tympanic
temporal bones form a contact point.
The involvement of the tympanic
temporal bone in nøbben formation
seems to be critical, as the oval window
ridge is unaffected. This activation may
lead to the increased deposition of new
endochondral bone, which is mostly
composed of calcium phosphate, which
is a major component of the bone
substance hydroxylapatite.
Alternatively, it is possible that the
nøbben is the result of a signalling
defect. Recently, ectopic bone
formation between the stapes and
styloid process was linked to disrupted
noggin/bone morphogenetic protein
(BMP) signaling interactions and
conductive hearing loss in Nog+/- mice
(54). Furthermore, the underlying
molecular events triggering the bone
remodeling in the ear might be related to
those causing the skeletal abnormalities
during development. The delamination
of the periosteum seen at two weeks of
age at the prospective round window
ridge might be the result of the neo-
ossification.
The crystals found in Ts ears
display a flat rhomboid-like shape and
are reminiscent to cholesterol crystals.
This is supported by the observation of
cholesterol granulomas in older Ts ears.
Cholesterol granulomas are an
inflammatory response to the presence
of foreign bodies i.e. cholesterol crystals
and consist of giant cells, macrophages,
foam cells and the histology shows
typical spindle-like clefts that were filled
with cholesterol before it was dissolved
during processing of the tissue (55).
Clinically, cholesterol crystals and
granulomas are associated with middle
ear inflammation, but they can also form
at other locations of the pneumatized
temporal bone, such as in the lateral
ventricle and mandible (56-58). There is
general agreement that cholesterol
crystals are the byproduct of cellular
degradation. Causes that are being
discussed include insufficient drainage,
hemolysis, pressure changes, and
obstruction of ventilation (55). We do
not observe hemorrhage in the 2- to 36-
week-old specimen. It was recently
shown that small amounts of cholesterol
crystals are sufficient to induce NLRP3
inflammasomes preceding
atherosclerotic plaques formation (59).
This indicates that cholesterol crystals
may at least in part induce the
inflammatory response in Ts. The
cholesterol crystals may initially derive
from the tissue breakdown occurring at
the round window ridge at two- to three
weeks of age.
The Eustachian tube (ET) plays a
critical role in draining and pressurizing
the middle ear and dysfunction of the ET
also represents a major cause of OM
by guest on Novem
ber 7, 2017http://w
ww
.jbc.org/D
ownloaded from

16
(60). Given the skeletal malformations
that are associated with Ts and in
particular the abnormalities in the nasal
region as also reported by Doel (29), it is
perhaps not surprising that the ET is
dysmorphic. Interestingly, in contrast to
the Fbxo11A2288T (Jeff) and Eya4tm1Jse
mutants, the ET in Ts appears widened.
The first signs of inflammation in Ts
were seen at two weeks of age by the
dilation and delamination of the
periosteum at the prospective round
window ridge. Over the next weeks the
inflammation worsened and progressed
to a chronic OME. Based upon the
histologic and audiologic data the
phenotype stabilized at around twelve
weeks of age. The dysmorphic
Eustachian tube may fail to sufficiently
drain the middle ear leading to a chronic
condition. In this context it should be
mentioned that the lumen of the ET in
+/+ mice was more likely to contain
cellular debris and clearing products
than in Ts ETs (preliminary
observations). The typical hallmarks of
CSOM, bacterial infection and
perforation of the eardrum are not seen.
The isolated bacteria are common
microbes of the skin flora, whereas
bacteria giving rise to CSOM include
Pseudominas aeruginosa,
Staphylococcus aureus, and
Streptococcus pyogenes, which were
not seen in Ts ears. We therefore think
that the microbes in Ts ears do not add
significantly to the inflammation.
Our auditory data suggest that
hearing loss in Ts is a conductive-type
hearing loss. This classification is
based on the significant middle ear
pathology in the presence of normal
endocochlear potentials and
unremarkable inner ear histology. A
progressive reduction of EPs (<80mV)
was measured in the Jeff mutant
(Fbxo11A2288T) adding a sensorineural
component to the hearing loss (61).
Mixed hearing loss is also seen in model
systems (experimentally induced
Streptococcus infections) and humans
and is due to a middle ear pathology
that has invaded the scala tympani
(14,62). In Ts, we attribute the loss of
DPOAEs and elevated hearing
thresholds to a mechanical defect in the
middle ear perhaps by changing the fluid
dynamics in the inner ear. It is
conceivable that the large cluster of
crystals and debris at the round window
membrane obstruct the perilymph in the
scala tympani, thereby adversely
affecting inner ear mechanics such as
the motion of the basilar membrane.
Similarly, large amounts of cholesterol
crystals and cellular debris may hinder
effective vibrations of the middle ear
bones.
REFERENCES
1. Sher, A. E. (1971) Acta Otolaryngol Suppl 285, 1-77
2. Hawke, M., and Jahn, A. F. (1975) Arch Otolaryngol 101(8), 462-464
3. Frisch, T., Sorensen, M. S., Overgaard, S., and Bretlau, P. (2000) The Annals of otology, rhinology, and laryngology 109(1), 33-39
4. Cureoglu, S., Schachern, P. A., Ferlito, A., Rinaldo, A., Tsuprun, V., and
Paparella, M. M. (2006) American journal of otolaryngology 27(5), 334-340
by guest on Novem
ber 7, 2017http://w
ww
.jbc.org/D
ownloaded from

17
5. Xu, H. X., Joglekar, S. S., and Paparella, M. M. (2009) Otol Neurotol 30(4), 579-
580
6. Ealy, M., and Smith, R. J. (2009) Hear Res
7. Thys, M., and Van Camp, G. (2009) Otol Neurotol 30(8), 1021-1032
8. Tinling, S. P., Nabili, V., and Brodie, H. A. (2005) The Annals of otology, rhinology, and laryngology 114(2), 161-166
9. Morris, K. A., Snir, E., Pompeia, C., Koroleva, I. V., Kachar, B., Hayashizaki, Y.,
Carninci, P., Soares, M. B., and Beisel, K. W. (2005) J Assoc Res Otolaryngol 6(1), 75-89
10. Park, K., Ueno, K., and Lim, D. J. (1992) American journal of otolaryngology
13(2), 93-100
11. Teele, D. W., Klein, J. O., and Rosner, B. (1989) J Infect Dis 160(1), 83-94
12. Brookhouser, P. E., Worthington, D. W., and Kelly, W. J. (1993) The Laryngoscope 103(4 Pt 1), 371-378
13. Munker, G. (1981) Advances in oto-rhino-laryngology 27, 138-143
14. Tos, M. (1989) Acta Otolaryngol Suppl 457, 87-93
15. Zheng, Q. Y., Hardisty-Hughes, R., and Brown, S. D. (2006) Brain Res 1091(1),
9-15
16. Casselbrant, M. L., Mandel, E. M., Fall, P. A., Rockette, H. E., Kurs-Lasky, M.,
Bluestone, C. D., and Ferrell, R. E. (1999) Jama 282(22), 2125-2130
17. Casselbrant, M. L., Mandel, E. M., Jung, J., Ferrell, R. E., Tekely, K.,
Szatkiewicz, J. P., Ray, A., and Weeks, D. E. (2009) BMC Med Genet 10, 85
18. Daly, K. A., Brown, W. M., Segade, F., Bowden, D. W., Keats, B. J., Lindgren, B.
R., Levine, S. C., and Rich, S. S. (2004) Am J Hum Genet 75(6), 988-997
19. Hardisty-Hughes, R. E., Tateossian, H., Morse, S. A., Romero, M. R., Middleton,
A., Tymowska-Lalanne, Z., Hunter, A. J., Cheeseman, M., and Brown, S. D.
(2006) Hum Mol Genet 15(22), 3273-3279
20. Parkinson, N., Hardisty-Hughes, R. E., Tateossian, H., Tsai, H. T., Brooker, D.,
Morse, S., Lalane, Z., MacKenzie, F., Fray, M., Glenister, P., Woodward, A. M.,
Polley, S., Barbaric, I., Dear, N., Hough, T. A., Hunter, A. J., Cheeseman, M. T.,
and Brown, S. D. (2006) PLoS Genet 2(10), e149
21. Depreux, F. F., Darrow, K., Conner, D. A., Eavey, R. D., Liberman, M. C.,
Seidman, C. E., and Seidman, J. G. (2008) J Clin Invest 118(2), 651-658
22. Eriksson, P. O., Li, J., Ny, T., and Hellstrom, S. (2006) Int J Med Microbiol 296(7), 501-509
23. Pau, H., Fuchs, H., de Angelis, M. H., and Steel, K. P. (2005) The Laryngoscope
115(1), 116-124
24. Steel, K. P., Moorjani, P., and Bock, G. R. (1987) Hear Res 28(2-3), 227-236
25. Zheng, Q. Y., Tong, Y. C., Alagramam, K. N., and Yu, H. (2007) Hear Res 231(1-
2), 23-31
26. Morgan, W. C. (1950) The Journal of heredity 41(8), 208-215
27. Paterson, H. F. (1980) The Journal of experimental zoology 211(2), 247-256
28. Brotherton, T. W., Chui, D. H., McFarland, E. C., and Russell, E. S. (1979) Blood
54(3), 673-683
29. Deol, M. S. (1961) J Embryol Exp Morphol 6(4), 78-95
by guest on Novem
ber 7, 2017http://w
ww
.jbc.org/D
ownloaded from

18
30. Ishijima, J., Yasui, H., Morishima, M., and Shiroishi, T. (1998) Genomics 49(3),
341-350
31. Curtin, J. A., Quint, E., Tsipouri, V., Arkell, R. M., Cattanach, B., Copp, A. J.,
Henderson, D. J., Spurr, N., Stanier, P., Fisher, E. M., Nolan, P. M., Steel, K. P.,
Brown, S. D., Gray, I. C., and Murdoch, J. N. (2003) Curr Biol 13(13), 1129-1133
32. Montcouquiol, M., Rachel, R. A., Lanford, P. J., Copeland, N. G., Jenkins, N. A.,
and Kelley, M. W. (2003) Nature 423(6936), 173-177
33. Hustert, E., Scherer, G., Olowson, M., Guenet, J. L., and Balling, R. (1996)
Mamm Genome 7(12), 881-885
34. Uchida, K., Koopman, P., Mita, A., Wakana, S., Wright, E., Kikkawa, Y.,
Yonekawa, H., Moriwaki, K., and Shiroishi, T. (1996) Mamm Genome 7(7), 481-
485
35. Benit, L., De Parseval, N., Casella, J. F., Callebaut, I., Cordonnier, A., and
Heidmann, T. (1997) Journal of virology 71(7), 5652-5657
36. Marygold, S. J., Roote, J., Reuter, G., Lambertsson, A., Ashburner, M., Millburn,
G. H., Harrison, P. M., Yu, Z., Kenmochi, N., Kaufman, T. C., Leevers, S. J., and
Cook, K. R. (2007) Genome Biol 8(10), R216
37. Saeboe-Larssen, S., Lyamouri, M., Merriam, J., Oksvold, M. P., and
Lambertsson, A. (1998) Genetics 148(3), 1215-1224
38. Draptchinskaia, N., Gustavsson, P., Andersson, B., Pettersson, M., Willig, T. N.,
Dianzani, I., Ball, S., Tchernia, G., Klar, J., Matsson, H., Tentler, D., Mohandas,
N., Carlsson, B., and Dahl, N. (1999) Nat Genet 21(2), 169-175
39. Doherty, L., Sheen, M. R., Vlachos, A., Choesmel, V., O'Donohue, M. F., Clinton,
C., Schneider, H. E., Sieff, C. A., Newburger, P. E., Ball, S. E., Niewiadomska,
E., Matysiak, M., Glader, B., Arceci, R. J., Farrar, J. E., Atsidaftos, E., Lipton, J.
M., Gleizes, P. E., and Gazda, H. T. (2010) Am J Hum Genet 86(2), 222-228
40. Farrar, J. E., Nater, M., Caywood, E., McDevitt, M. A., Kowalski, J., Takemoto, C.
M., Talbot, C. C., Jr., Meltzer, P., Esposito, D., Beggs, A. H., Schneider, H. E.,
Grabowska, A., Ball, S. E., Niewiadomska, E., Sieff, C. A., Vlachos, A.,
Atsidaftos, E., Ellis, S. R., Lipton, J. M., Gazda, H. T., and Arceci, R. J. (2008)
Blood 112(5), 1582-1592
41. Gazda, H. T., Grabowska, A., Merida-Long, L. B., Latawiec, E., Schneider, H. E.,
Lipton, J. M., Vlachos, A., Atsidaftos, E., Ball, S. E., Orfali, K. A., Niewiadomska,
E., Da Costa, L., Tchernia, G., Niemeyer, C., Meerpohl, J. J., Stahl, J., Schratt,
G., Glader, B., Backer, K., Wong, C., Nathan, D. G., Beggs, A. H., and Sieff, C.
A. (2006) Am J Hum Genet 79(6), 1110-1118
42. Gazda, H. T., Sheen, M. R., Vlachos, A., Choesmel, V., O'Donohue, M. F.,
Schneider, H., Darras, N., Hasman, C., Sieff, C. A., Newburger, P. E., Ball, S. E.,
Niewiadomska, E., Matysiak, M., Zaucha, J. M., Glader, B., Niemeyer, C.,
Meerpohl, J. J., Atsidaftos, E., Lipton, J. M., Gleizes, P. E., and Beggs, A. H.
(2008) Am J Hum Genet 83(6), 769-780
43. Gazda, H. T., and Sieff, C. A. (2006) Br J Haematol 135(2), 149-157
44. Warner, J. R., and McIntosh, K. B. (2009) Molecular cell 34(1), 3-11
45. Rifkind, R. A., Cantor, L. N., Cooper, M., Levy, J., Maniatis, G. M., Bank, A., and
Marks, P. A. (1974) Annals of the New York Academy of Sciences 241(0), 113-
118
by guest on Novem
ber 7, 2017http://w
ww
.jbc.org/D
ownloaded from

19
46. Matsson, H., Davey, E. J., Draptchinskaia, N., Hamaguchi, I., Ooka, A., Leveen,
P., Forsberg, E., Karlsson, S., and Dahl, N. (2004) Molecular and cellular biology
24(9), 4032-4037
47. Noben-Trauth, K., Zheng, Q. Y., and Johnson, K. R. (2003) Nat. Genet. 35, 21-23
48. Wool, I. G. (1996) Trends in biochemical sciences 21(5), 164-165
49. Khan, D. C., DeGagne, J. M., and Trune, D. R. (2000) Hear Res 142(1-2), 12-22
50. Kotzias, S. A., and Linthicum, F. H., Jr. (1985) The American journal of otology
6(6), 490-494
51. Nabili, V., Brodie, H. A., Neverov, N. I., and Tinling, S. P. (1999) The Laryngoscope 109(6), 931-935
52. Calvi, L. M., Adams, G. B., Weibrecht, K. W., Weber, J. M., Olson, D. P., Knight,
M. C., Martin, R. P., Schipani, E., Divieti, P., Bringhurst, F. R., Milner, L. A.,
Kronenberg, H. M., and Scadden, D. T. (2003) Nature 425(6960), 841-846
53. Beck, G. R., Jr. (2003) Journal of cellular biochemistry 90(2), 234-243
54. Hwang, C. H., and Wu, D. K. (2008) Hum Mol Genet 17(6), 844-853
55. Nager, G. T., and Vanderveen, T. S. (1976) The Annals of otology, rhinology, and laryngology 85(2 pt.1), 204-209
56. Grossi, P. M., Ellis, M. J., Cummings, T. J., Gray, L. L., Fukushima, T., and
Sampson, J. H. (2008) Journal of neurosurgery 108(2), 357-360
57. Jang, C. H., Kim, J. S., and Cho, Y. B. (2009) Yonsei medical journal 50(4), 585-
587
58. Sade, J., and Teitz, A. (1982) The American journal of otology 3(3), 203-208
59. Duewell, P., Kono, H., Rayner, K. J., Sirois, C. M., Vladimer, G., Bauernfeind, F.
G., Abela, G. S., Franchi, L., Nunez, G., Schnurr, M., Espevik, T., Lien, E.,
Fitzgerald, K. A., Rock, K. L., Moore, K. J., Wright, S. D., Hornung, V., and Latz,
E. (2010) Nature 464(7293), 1357-1361
60. Bluestone, C. R., and Klein, J. O. (2003) Otitis media and Eustachian tube
dysfunction. In: Bluestone, C. R. a. S. J. C. (ed). Pediatric Otolaryngology., Philadelphia, Pennsylvania
61. Hardisty, R. E., Erven, A., Logan, K., Morse, S., Guionaud, S., Sancho-Oliver, S.,
Hunter, A. J., Brown, S. D., and Steel, K. P. (2003) J Assoc Res Otolaryngol 4(2),
130-138
62. Ichimiya, I., Suzuki, M., Hirano, T., and Mogi, G. (1999) Hear Res 131(1-2), 128-
134
FOOTNOTES
We thank Harold Neely for excellent technical help. We thank Daniel Marcus for
advice in measuring endocochlear potentials and Glen Martin for help with the DPOAE
measurements. We thank our intra- and extramural colleagues for insightful
discussions throughout the course of this project and we acknowledge the excellent
expertise of Dr. Mark Bryant (NIH phenotyping service) and Dr. Eric Wawrousek (NEI
transgenic core facility). We also thank Xin-Xing Gu, Doris Wu, and Byung Yoon Choi
for their comments on the manuscript. This work was supported by the Division of
Intramural Research at the National Institutes of Health.
by guest on Novem
ber 7, 2017http://w
ww
.jbc.org/D
ownloaded from

20
FIGURE LEGENDS
Fig. 1. Molecular genetics of Ts. A. Genetic map of the Ts interval on distal
MMU 11. Shown is the genetic linkage map obtained from the F2 intercross at the distal
portion of mouse chromosome 11 (MMU 11), where location of genetic markers are
shown on the right, their genetic distance in cM shown on the left, followed by the
number of recombinants per meioses that separate each marker. The non-recombinant
critical Ts region is shown in red. B. Insertion/deletion PCR screen. A single forward
primer (F) and five progressively more distal located reverse primers (R31, -32, -34, -36,
-38) were predicted to produce products ranging from ~19.5 kb to ~21.0 kb. Instead,
products ranging from 1.5 kb to 3.0 kb were observed exclusively from Ts/+ DNA
template, indicating the absence of approximately 18kb of genomic DNA on the Ts
chromosome. Shown is a Sybr-green stained 2% agarose gel separating the amplified
products. C. Physical map of the Ts critical region. From top to bottom is shown the
genetic region on chromosome 11 defined by markers D11Ntra3 and D11Ntra5 with
their physical location given on the top in kb. Filled ovals represent the approximate
locations of recombination events and the red box indicates the location of the Ts critical
interval. The arrow marks the position and orientation of Rpl38 (ribosomal protein L38), Ttyh2 (tweety homolog 2), and Dnaic2 (dynein, axonemal, intermediate chain 2).
Sequencing chromatogram of the PCR fragment amplified from the Ts chromosome.
Bases shaded in red represent the insertion sequence. D. Verification/Genotyping
PCR scheme. PCR primers flanking the Ts mutation (a and b), within the deleted region
(a! and b!), and within the insertion (c and d) were generated. All +/+ DNAs tested (n=9)
yielded only fragments a+a! and b+b!, while all Ts/+ DNAs tested (n=13) yielded a+b,
a+a!, b+b!, a+c, and d+b.
Fig. 2. Audiologic characteristics of Ts. A, B. Shown are ABR thresholds in dB
SPL of +/+ (A) and Ts/+ (B) mice at 4-, 8-, 30-, and 52 weeks of age. Thresholds for
click (triangle), 8- (diamond), 16- (circle) and 32 kHz (square) are given as the mean ±
SD (see also Table 1). C. Shown are DPOAE amplitudes at the 2f1-f2 frequency and
L1=75 dB relative to the noise floor of +/+ (blue circle), Ts/+ (red circles) and
C3HeB/FeJ (green circle) mice at three weeks of age. Mean values ± SEM of 20 +/+,
24 Ts/+ and 12 C3HeB/FeJ ears are plotted. X-axis shows f2 sweep frequency. D.
Shown are DPOAE amplitudes at the f2=16kHz frequency for input levels (L1) ranging
from 35 to 75 dB SPL. Mean values ± SEM of 20 +/+ (blue bars), 24 Ts/+ (red bars) are
shown. ***, p<0.001; *, p<0.05, n.s.=not significant. E. Shown are DPOAE amplitudes
at the f2=16kHz frequency for input levels (L1; X-axis) of +/+ (left panel) and Ts/+ (right
panel) at 3- (circle), 12- (square), and 48 weeks of age (diamond). Output level in dB
SPL relative to noise floor of the 2f1-f2 frequency (Y-axis) is plotted against input L1
levels (X-axis). The data are given as mean ± SEM; n=number of ears tested. F. Given
are endocochlear potentials of +/+ (blue label) and Ts/+ (red label) mice at the indicated
age (X-axis). Each circle refers to one measurement and the mean ± SD across all
ages is given for +/+ and Ts/+ mice. Values are given in microvolt (mV). A
representative read-out for each genotype is given as inset.
by guest on Novem
ber 7, 2017http://w
ww
.jbc.org/D
ownloaded from
21
Fig. 3. Ectopic ossification and cholesterol crystal deposition in the middle ear.
A. Images of plastic-embedded tolouidine-stained cross sections through the mouse
temporal bone at four weeks of age. Bone of the ventral bulla (vb, black arrow) is
indicated. Location of the round window ridge (green arrow) and oval window ridge
(black arrow) is indicated; oc, otic capsule; ttm, tympanic tensor muscle; scale bar =
100µm. B. Photographs of the cochlea of +/+ and Ts/+ mice at three and 12 weeks of
age are shown. Location of round window ridge in +/+ (green arrows) and in Ts/+ (red
arrows) is shown. Black arrowhead points to the round window. Note crystal deposition
in the round window of Ts/+ ears, but not in +/+ ears; scale bar = 500µm. C. Images of
paraffin-embedded hematoxylin & eosin-stained cross sections through the round
window ridge in +/+ and Ts/+ ears at 12 weeks of age. vb, ventral bulla; pe, periosteum;
eb, endochondral bone; el, endosteal layer; sl, spiral ligament; mec, middle ear cavity;
tb, tympanic part of temporal bone; scale bar = 100µm. D. Images of plastic-embedded
tolouidine-stained cross sections through the round window ridge of a Ts/+ ear at eleven
weeks of age (nøbben). sv, stria vascularis; sl, spiral ligament; sm, scala media;
endochondral bone; el, endosteal layer; scale bar = 50µm. E. Three-dimensional
reconstruction of the round window ridge in +/+ (left) and Ts/+ (right) mice at eleven
weeks of age. Inset shows a representative cross section used for the reconstruction.
Arrows point to the corresponding location of the round window ridge in the section and
three-dimensional model; scale bar = 50µm. F. Photographs of the round (left and
middle panel) and oval (right panel) window in +/+ (left panel) and Ts/+ (middle and right
panel). Note the excessive crystal deposition at the round (middle) and around the
ossicles at the oval (right) window (arrow head); scale bar = 500µm. G. Bright field (left)
and scanning electron microscope (right) image of crystal deposits isolated from the
round window of Ts/+ ears; scale bar = 100 and 50µm. H. Photographs of cochlea of
+/+ and Ts/+ mice showing crystal deposition at the round window (black arrow head)
and nøbben formation (red arrow) as function of DPOAE levels. Emission levels are
given in dB SPL at f2 = 16 kHz input frequency and L1 = 75 dB SPL input level. Mean ±
SD are given for number (n) of ears tested. Note the normal round window ridge and no
crystal deposition in Ts/+ ears with normal DPOAEs; scale bar = 500µm. I. Input/output
function of DPOAEs at f2 = 16 kHz of +/+ (n=62) and Ts/+ (n=62) ears showing two
discrete classes of phenotypes in each genotype. Average age of +/+ mice was 16
weeks (range: 3-48) and Ts/+ mice was 17 weeks (range: 3-48). Output levels in dB
SPL relative to noise floor on Y-axis, and L1 input levels at the X-axis. Symbols
represent mean ± SEM.
Fig. 4. Inflammation of the middle ear cavity. Inset top left shows the mouse ear
indicating the plane of the section (dashed line) corresponding with the figure (A-W); v,
ventral; p, posterior. A-D. Images of plastic-embedded tolouidine-stained cross sections
of two-week-old +/+ (A) and Ts/+ (B) and three-week-old Ts/+ (C, D) ears; green arrow,
periosteum; pink arrow, cellular debris; red arrow, nøbben; scale bar (A, B) 400µm;
(C,D) 200µm. E-H. Images of paraffin-embedded hematoxylin & eosin-stained cross
sections of 12-week-old +/+ (E, G) and Ts/+ (F, H) ears; red arrow, round window ridge;
pink arrow, cellular debris; red star, exudate; scale bar (E, F) 400µm; (G,H) 100µm. I. Image of plastic-embedded tolouidine-stained cross section of 12-week-old Ts/+; red
arrow points to cellular debris and fibrinous aggregates at the opening of the Eustachian
by guest on Novem
ber 7, 2017http://w
ww
.jbc.org/D
ownloaded from

22
tube; scale bar = 200µm. J. Image of paraffin-embedded hematoxylin & eosin-stained
cross section of 12-week-old Ts/+ showing high-magnification of (H) of cellular
aggregates and eosinophilic exudates in the middle ear; green arrow points to a
macrophage with vacuolated cytoplasm (also inset left bottom); scale bar = 20µm. K.
Image of paraffin-embedded hematoxylin & eosin-stained cross section of 12-week-old
Ts/+ showing middle ear space around the stapedial footplate (sf); red star, eosinophilic
exudate; black arrow points to the annular stapedial ligaments; white box shows
enlarged annular stapedial ligament; scale bar = 100µm. L, M. Images of plastic-
embedded tolouidine-stained cross sections of 12-week-old +/+ (L) and Ts/+ (M)
showing the middle ear at the round window; arrows point to the round window
membrane (rwm). Also, note the cellular aggregates and fibrinous precipitate in the
middle ear cavity (mec), but not in the scala tympani (st); scale bar = 100µm. N-U.
Shown are images of plastic-embedded tolouidine-stained cross sections of 36-week-
old +/+ (N) and 36-week-old Ts/+ (O-U) ears. Note the dilated (O) and delaminated (P)
periosteum along the ventral bulla and the cell debris at the round window membrane.
Also shown is a mineral aggregate (R; arrow) over the round window ridge and a
magnification in (S) with arrows pointing to macrophages. In (T) is shown a cholesterol
granuloma in the middle ear cavity located at the otic capsule and the round window
membrane. Yellow arrows in (T) and (U) point to cholesterol clefts; scale bar (R)
200µm; (T) 100µm; (N-Q,U) 50µm; (S) 40µm. V,W. Shown are photographs of the
inside of the ventral bulla of a 78-week-old +/+ (V) and 56-week-old Ts/+ (W) ear. Note
the pus (black arrow) and crystals with signs of hemorrhage (white star) in the Ts
specimen; scale bar 1mm. mec, middle ear cavity; vb, ventral bulla; oc, otic capsule;
ttm, tympanic tensor muscle; ET, Eustachian tube; sm, scala media; pe, periosteum; sf,
stapedial foot plate; st, scala tympani; rwm, round window membrane.
Fig. 5. Enlarged Eustachian tube in Ts. A, B. Three-dimensional reconstructions
of the Eustachian tube of a three-week-old +/+ (A) and Ts/+ (B) ear based on serial
sections. Representative sections are shown in the middle and right panel. The lumen
of the Eustachtian tube is outlined by the white lines. Orientation and location of
sections on the respective 3D model are shown as arrow and arrowhead. MEC, middle
ear cavity; ET, Eustachian tube; ca, cartilaginous tissue; m, medial; d, dorsal. Scale bar = 50 µm. Volume of ET in Ts/+ measured 50,489,630 µm3 and in +/+ it was 17,418,522
µm3. C, D. Graphs showing perimeter (B) and cross-sectional area (D) of ET in Ts/+
and +/+; n=5 serial sections. *** p<0.001.
Fig. 6. Tissue expression and immuno localization of Rpl38. A-C. Western blots
of protein extracts from HEK293T cells (A) and tissue extracts of adult +/+ and Ts/+
mice (B) in the presence (+) and absence (-) of Pb863-specific peptide (C). Left side of
each panel indicates the molecular weight in kilo Dalton (kDa). A. Membranes stained
with Pb863, Pb865, and anti-my antibody of HEK293T cells transfected and non-
transfected with a mouse RPL38-myc fusion construct. Black dot indicates Rpl38-
specific band present in the transfected but not in untransfected lysate. B. Western blot
of protein extract from the ear and blood of +/+ and Ts/+ mice blotted with Pb865 and ß-
actin antibody. Arrowhead indicates the ~8kDa Rpl38 protein band. Arrows point to
higher molecular weight bands in ear lysate. Protein lysates were also hybridized with
by guest on Novem
ber 7, 2017http://w
ww
.jbc.org/D
ownloaded from

23
ß-actin antibody to control for equal loading. C. Ear and blood protein lysates were
incubated with Pb865 in the presence (+) and (-) absence of Pb865 specific peptide.
Note that both the ~8kDa and higher molecular weight protein species are effectively
blocked by the peptide. Membranes were hybridized with ß-actin antibody to control for
equal transfer efficiency. D-N. Shown are confocal images of cochlear coil (D, E) and
stria vascularis (F) whole mount preparations, cryosections of organ of Corti (G), stria
vascularis (H), otic capsule (I), and blood spreads (J, K) stained with the Pb865
antibody (red channel). E-I and L-N , counterstained with DAPI (blue channel); E, F,
counterstained with phalloidin (green channel); L, staining with non-specific rabbit IgG
antibody. J. Inset shows high-magnification of Z-stack of Rpl38-positive erythrocyte
showing staining near the plasma membrane. White arrows (D-N) point to Rpl38-
positive staining and arrowhead in (L) points to non-staining erythrocytes. M,N, Staining
of stria vascularis (M) and blood spread (N) with Pb865 in the absence (-) and presence
(+) of Pb865-specific peptide. Note that Pb865 staining is blocked in the presence of
competing peptide. pe, periosteum; eb, endochondral bone; el, endosteal layer; sl,
spiral ligament; MEC middle ear cavity. Scale bars: E,F, 10µm; G,H, 20µm; I, 50µm;
J,K,N, 5µm; L, M, 20µm.
Fig. 7. Transgenic rescue of Rpl38 deficiency. A. Number of mice with a Ts/+
genotype as function of normal and short tail in the presence (+) or absence (-) of the
transgene (tg). Right panel shows representative X-ray photographs of the tail
morphology in transgene-positive (left) and transgene-negative (right) Ts/+ animal;
scale bar = 1cm. B. DPOAE emission levels in dB SPL relative to noise floor of the 2f1-
f2 frequency at f2=16 kHz and L1=55 dB SPL input; bars are mean ± SEM; ***, p<0.001;
n.s.=not significant. C. ABR thresholds in dB SPL at click stimulus; bars are mean ±
SD; **, p<0.01; n.s.=not significant.
by guest on Novem
ber 7, 2017http://w
ww
.jbc.org/D
ownloaded from

24
Table 1 • Hearing thresholds in +/+ and Ts/+ mice.
Wks Genotype Click 8 kHz 16 kHz 32 kHz N 4 +/+ 35 ± 3 25 ± 6 12 ± 3 38 ± 4 6
Ts/+ 62 ± 21 45 ± 17 27 ± 15 56 ± 13 12
p < 0.01 < 0.05 n.s. n.s.
8 +/+ 36 ± 8 26 ± 4 20 ± 9 35 ± 5 6
Ts/+ 74 ± 8 70 ± 12 53 ± 18 78 ± 12 10
p < 0.001 < 0.001 < 0.001 < 0.001
30 +/+ 42 ± 6 37 ± 8 21 ± 9 60 ± 14 7
Ts/+ 72 ± 22 63 ± 21 44 ± 24 80 ± 17 14
p < 0.01 < 0.05 < 0.05 n.s.
52 +/+ 54 ± 14 55 ± 9 29 ± 10 91 ± 2 5
Ts/+ 65 ± 26 69 ± 19 43 ± 25 95 ± 4 8
p n.s. n.s. n.s. n.s.
Thresholds are given as mean ± S.D. in dB SPL; wks, weeks of age; n.s., not
significant; kHz, kiloHertz; N, number of animals tested.
by guest on Novem
ber 7, 2017http://w
ww
.jbc.org/D
ownloaded from

25
Table 2 • Penetrance of DPOAE levels and ectopic mineralization in Ts mice.
DPOAE Ossification Crystals
+ - % + - % p + - % p +/+ 55 7 11 1 61 2 0 62 0
Ts/+ 10 52 84 54 8 87 <0.0001 52 10 84 <0.0001
Number of ears that express (+) or do not express (-) the trait. %, penetrance; p,
Fisher!s test.
by guest on Novem
ber 7, 2017http://w
ww
.jbc.org/D
ownloaded from

26
Table 3 • Skeletal and auditory phenotypes in Rpl38 transgenic Ts mice.
+/+ tg+/- Ts/+ tg+ Ts/+ tg- p
Skeletal normal tail 41 15 0 < 0.0001
short tail 0 0 11
DPOAE 16 kHz 35 ± 7 n=64 30 ± 15 n=16 11 ± 14 n=12 < 0.001
ABR click 32 ± 4 n=22 31 ± 4 n=7 40 ± 9 n=6 < 0.01
Number of tails and ears that express the indicated phenotype are given as mean ± SD.
p, ANOVA test. Ts, Tail-short; tg, transgene; kHz, kiloHertz.
by guest on Novem
ber 7, 2017http://w
ww
.jbc.org/D
ownloaded from
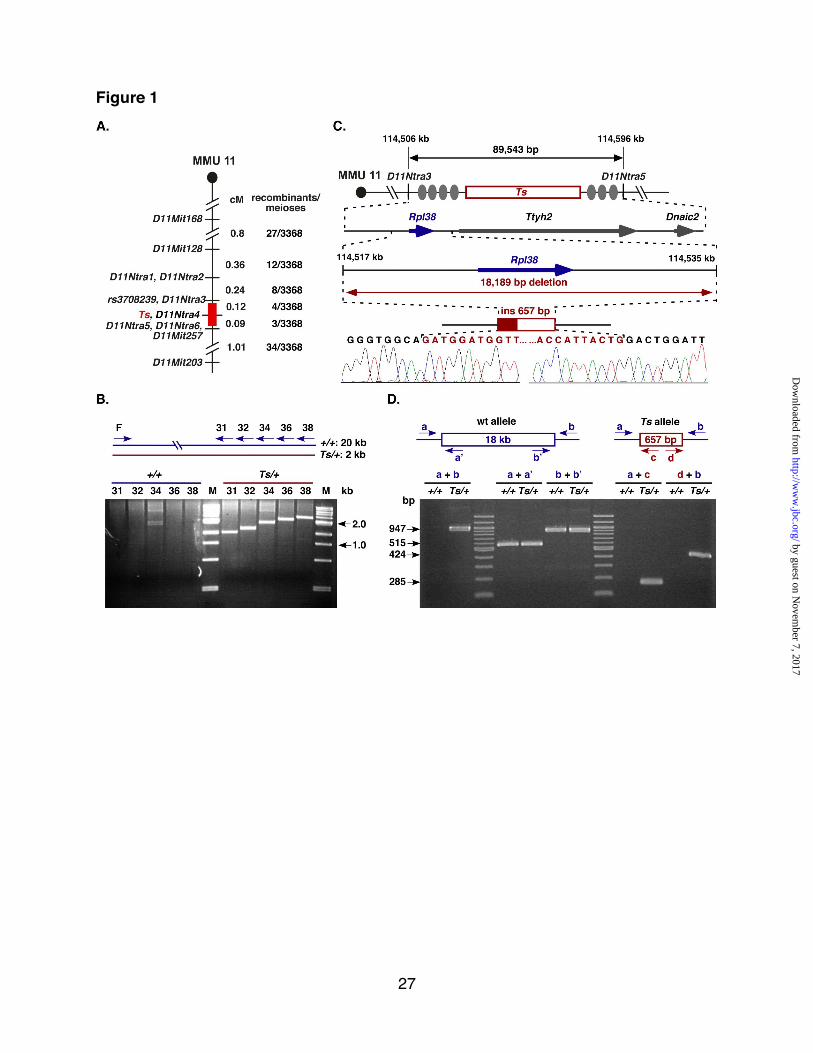


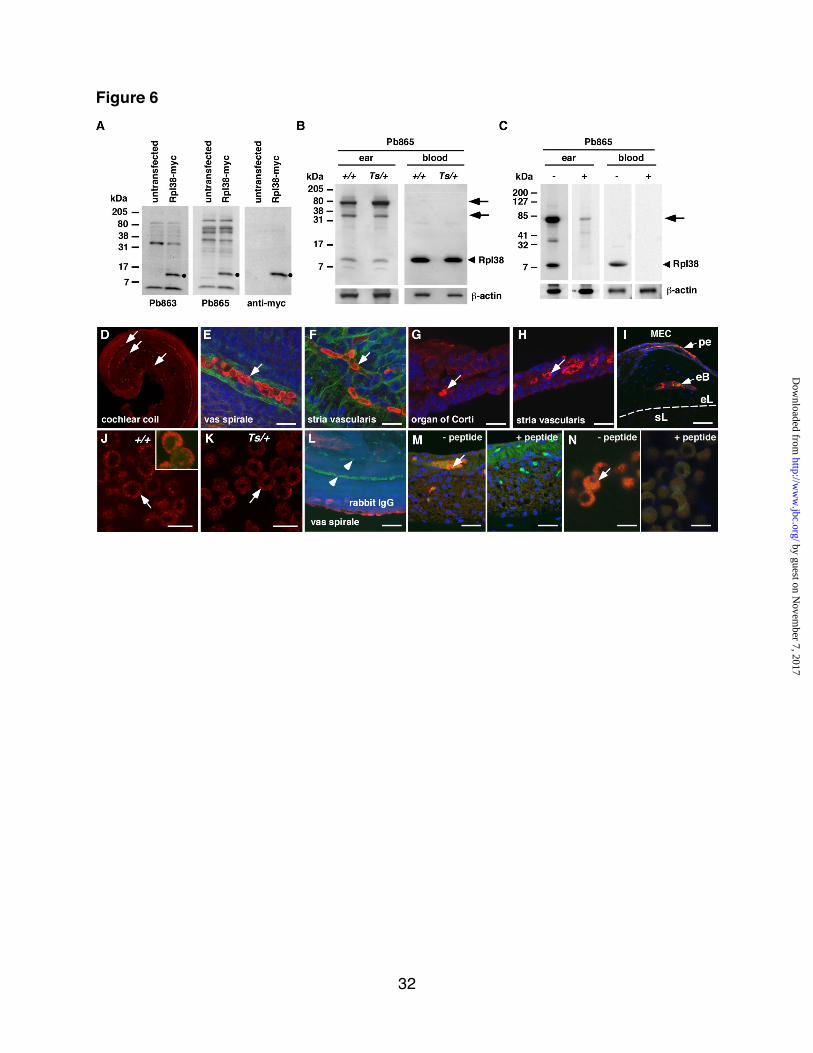


Konrad Noben-Trauth and Joseph R. Latocheby RPL38-deficiency in the tail-short (Ts) mouse
Ectopic mineralization in the middle ear and chronic otitis media with effusion caused
published online November 9, 2010J. Biol. Chem.
10.1074/jbc.M110.184598Access the most updated version of this article at doi:
Alerts:
When a correction for this article is posted•
When this article is cited•
to choose from all of JBC's e-mail alertsClick here
by guest on Novem
ber 7, 2017http://w
ww
.jbc.org/D
ownloaded from