economy 2030 (let’s just round up from 2022…) where we’ve been; where we’re going. kara...
TRANSCRIPT

Economy 2030(Let’s just round up from 2022…)
Where we’ve been; where we’re going.
Kara MarkleyRegional Economist
U.S. Bureau of Labor StatisticsJuly 29, 2014
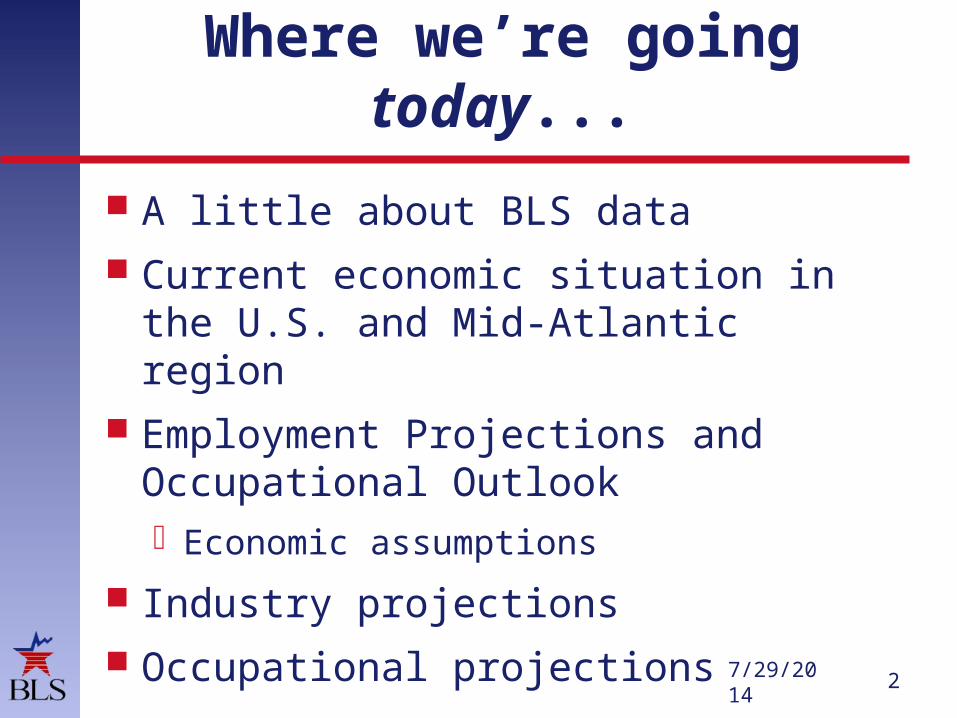
Where we’re going today...
A little about BLS data Current economic situation in the
U.S. and Mid-Atlantic region Employment Projections and
Occupational Outlook Economic assumptions
Industry projections Occupational projections
7/29/2014
2
About the BLS
3
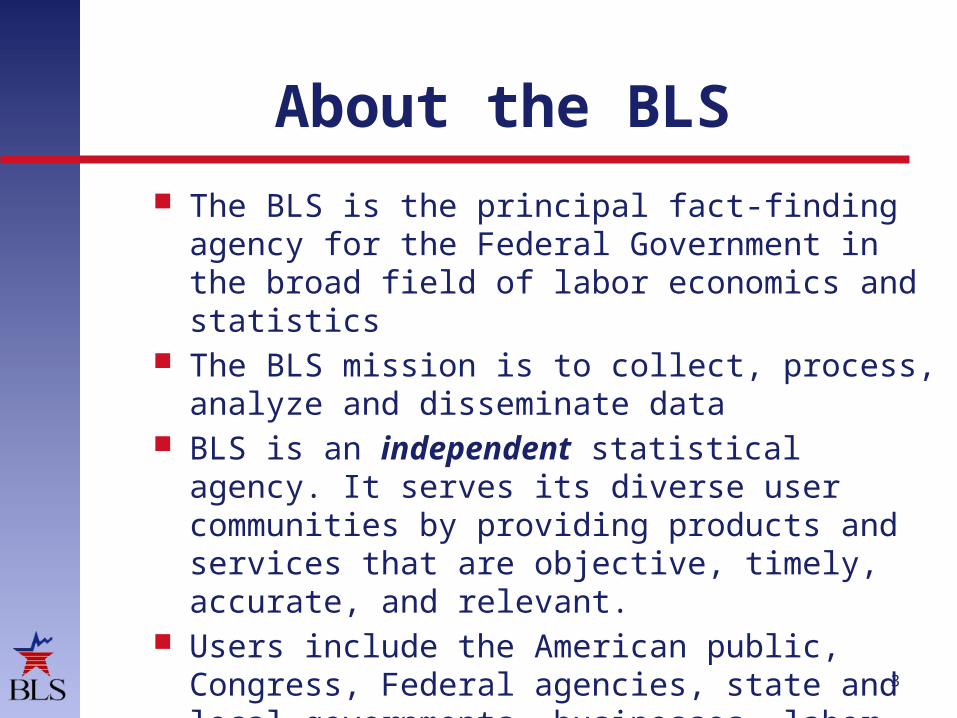
The BLS is the principal fact-finding agency for the Federal Government in the broad field of labor economics and statistics
The BLS mission is to collect, process, analyze and disseminate data
BLS is an independent statistical agency. It serves its diverse user communities by providing products and services that are objective, timely, accurate, and relevant.
Users include the American public, Congress, Federal agencies, state and local governments, businesses, labor organizations

Voluntary Cooperation
Nearly all of our surveys are voluntary Confidentiality is as important to the
Bureau as it is to respondents We do our best to reduce respondent
burden Without the cooperation of the people who
participate in its surveys—people like you—the Bureau of Labor Statistics could not provide high-quality information about the economy to you
We greatly appreciate the cooperation of our survey respondents. Thank You!! 4

Employment National, state, and metropolitan area
employment data comes from the Current Employment Statistics (CES), collected from business establishments.
National employment levels released with the Employment Situation on the first Friday of the month.
Available by industry.
5
Unemployment rates
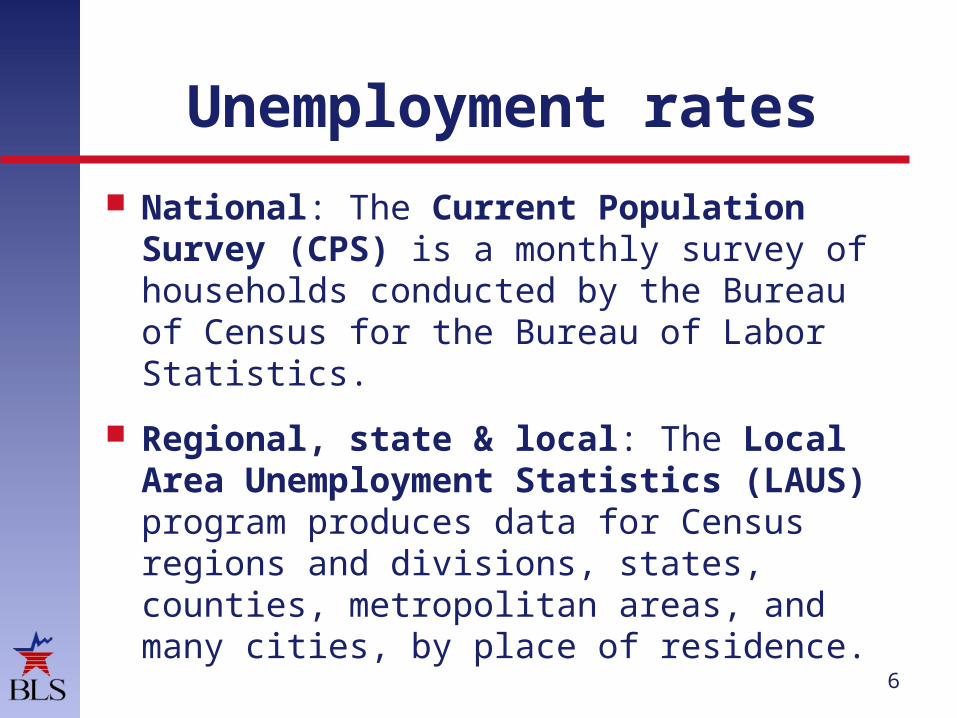
National: The Current Population Survey (CPS) is a monthly survey of households conducted by the Bureau of Census for the Bureau of Labor Statistics.
Regional, state & local: The Local Area Unemployment Statistics (LAUS) program produces data for Census regions and divisions, states, counties, metropolitan areas, and many cities, by place of residence.
6

Unemployment rates by state:May 2014
Data are seasonally adjusted

Unemployment rates in the United States and Mid-Atlantic states: May 2011-2014
Data are seasonally adjusted

Unemployment rates for major age-sex groups, 2004-2014
Data are seasonally adjusted

Unemployment rates by race and ethnicity, 2004-2014
Data are seasonally adjusted

Unemployment rates for persons 25 years and older by educational
attainment, 2004-2014
Data are seasonally adjusted

Employment Total nonfarm, 1-year and 5-year net change,
Mid-Atlantic states
Data are not seasonally adjusted
12

Employment: Percent change in total nonfarm,
United States and Mid-Atlantic states
Data are not seasonally adjusted
13

Data are not seasonally adjusted
14
Employment: Net change by industry supersector,
Delaware

Employment: Net change by industry supersector,
District of Columbia
Data are not seasonally adjusted
15

Data are not seasonally adjusted
16
Employment: Net change by industry supersector,
Maryland

Data are not seasonally adjusted
17
Employment: Net change by industry supersector,
Pennsylvania

Data are not seasonally adjusted
18
Employment: Net change by industry supersector,
Virginia

Data are not seasonally adjusted
19
Employment: Net change by industry supersector,
West Virginia

Employment Projections
10-year projections made every 2 years
2012-22 projections cover over 800 occupations and 300 industries
BLS projections prepared at the national level only
20

Projections Uses
Career counselors and students making career choice decisions
Mid-career jobseekers looking to switch occupations
Education and training officials making decisions on policy, funding, and program offerings
Researchers interested in how the economy is changing
21

Employment Projections Products
Occupational Outlook Handbook
Occupational Outlook Quarterly
Long-term employment projections by industry and occupation
Technical materials—replacement rates, education and training categories, and more
22

Employment Outlook: 2012-22
Assumptions: Labor Force
and Economic Conditions
23

In the future, we see…
The economy will grow at a slower rate over the period 2012-2022.
The number of people over the age of 65 will increase by 38.7 percent, while the total population increases by 10.1 percent.
Housing availability will average 1.6 million per year over the decade.
Investment in computers and software will increase by 109 percent. 24

Population and Labor Force
Population aged 16 and over Labor Force
217.6
144.9
243.3
155.0
265.3
163.5
25
Millions of persons
2002
2002
2012
2012
Projected 2022
Projected 2022
Data Source :U.S. Census Bureau and Bureau of Labor Statistics
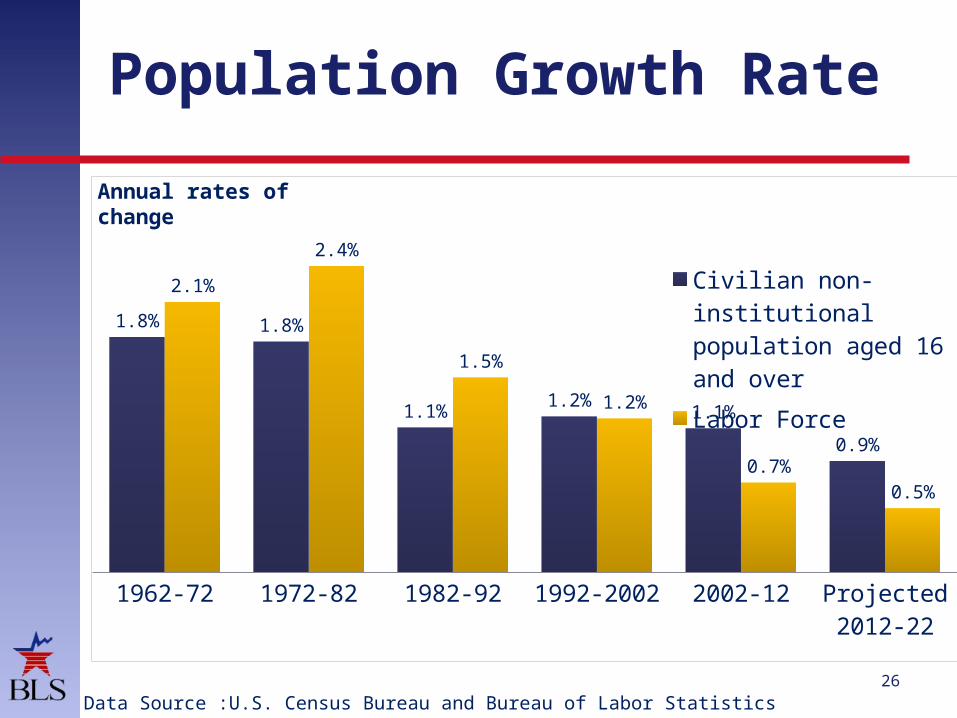
Population Growth Rate
1962-72 1972-82 1982-92 1992-2002 2002-12 Projected 2012-22
1.8% 1.8%
1.1%1.2%
1.1%
0.9%
2.1%
2.4%
1.5%
1.2%
0.7%0.5%
Civilian non-institu-tional population aged 16 and over
Labor Force
26
Annual rates of change
Data Source :U.S. Census Bureau and Bureau of Labor Statistics

Labor Force Participation Rates
1962 1972 1982 1992 2002 2012 Pro-jected 2022
0
20
40
60
80
100
82.0
70.2 67.6
58.863.7
61.6
37.9
57.756.0
27
Percent
Total
Men
Women

Labor Force Share by Age Group
28
15%
22%
25%
23%
14%2002
14%
22%
21%
23%
21% 2012
11%
23%
21%
19%
26%
Projected2022
16 to 2425 to 3435 to 4445 to 5455 and older
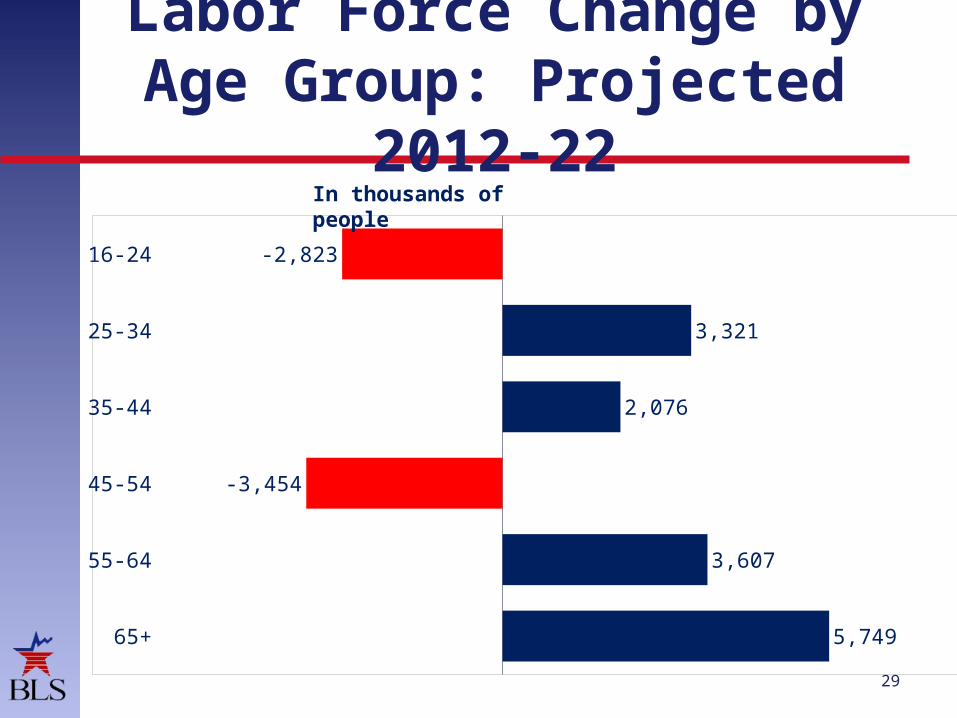
Labor Force Change by Age Group: Projected
2012-22
16-24
25-34
35-44
45-54
55-64
65+
-2,823
3,321
2,076
-3,454
3,607
5,749
29
In thousands of people
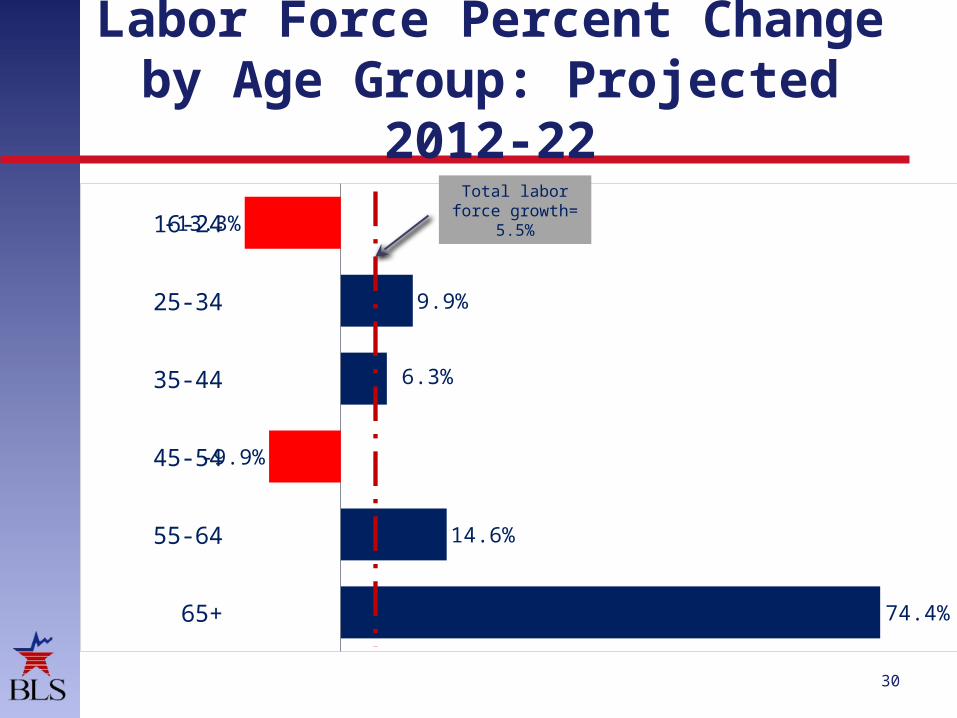
Labor Force Percent Change by Age Group:
Projected 2012-2216-24
25-34
35-44
45-54
55-64
65+
-13.3%
9.9%
6.3%
-9.9%
14.6%
74.4%
30
Total labor force growth= 5.5%

Unemployment Rate
31
1962
1963
1964
1965
1966
1967
1968
1969
1970
1971
1972
1973
1974
1975
1976
1977
1978
1979
1980
1981
1982
1983
1984
1985
1986
1987
1988
1989
1990
1991
1992
1993
1994
1995
1996
1997
1998
1999
2000
2001
2002
2003
2004
2005
2006
2007
2008
2009
2010
2011
2012
Assumption2022
0%
4%
8%
12%
5.4%

Employment
2002 2012 Projected 2022
131.0
134.4
149.8
32
Millions of jobs
Nonagricultural Wage and Salary Employment

Total Nonagricultural Wage and Salary
Employment
33
120
125
130
135
140
145
150
155
Actual and projected (1.1% annual growth rate, 2012-22)With no recession (0.8% annual growth rate, 2007-22)
In millions
NOTE: The interim years between 2012 and the 2022 projection point expressed by a straight dashed line are not projected values.

Employment Outlook: 2012-22
Industry Employment
34
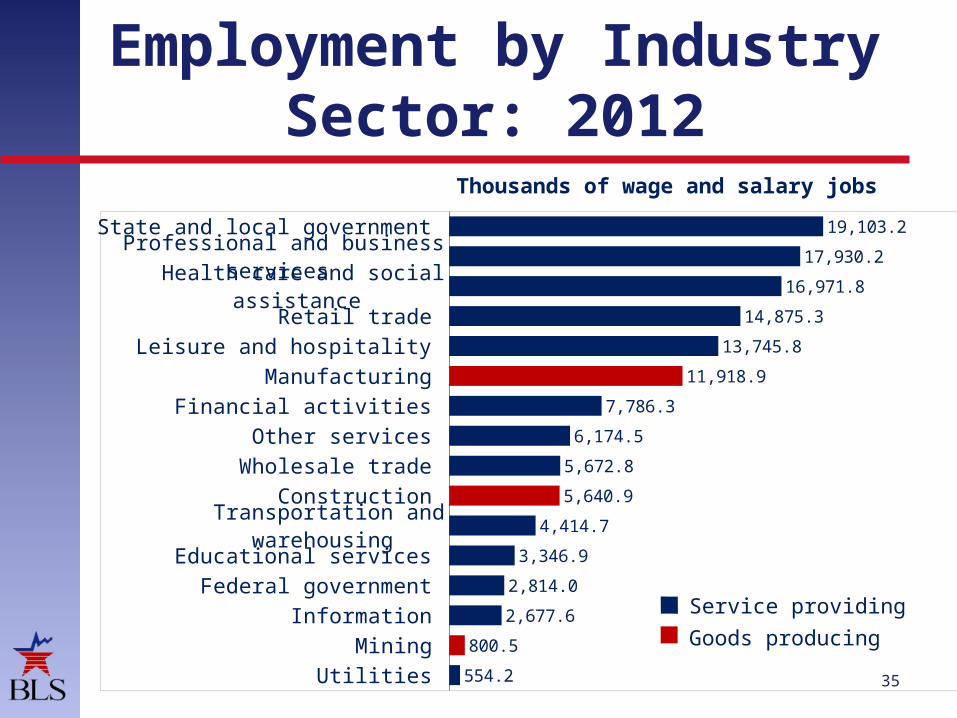
Employment by Industry Sector: 2012
State and local government Professional and business
services Health care and social assis-tance
Retail trade Leisure and hospitality
Manufacturing Financial activities
Other services Wholesale trade
Construction Transportation and warehousing
Educational services Federal government
Information Mining
Utilities
19,103.2
17,930.2
16,971.8
14,875.3
13,745.8
11,918.9
7,786.3
6,174.5
5,672.8
5,640.9
4,414.7
3,346.9
2,814.0
2,677.6
800.5
554.2 35
Thousands of wage and salary jobs
Service providing
Goods producing

Employment Change by Industry Sector: Projected
2012-22
Health care and social assistance Professional and business services
Construction Leisure and hospitality
Retail trade State and local government
Financial activities Educational services
Other services Wholesale trade
Transportation and warehousing Mining
Utilities Information
Federal government Manufacturing
4,994.1
3,482.8
1,622.1
1,289.2
1,090.9
929.0
751.0
675.3
648.9
470.4
327.3
121.2
-56.4
-65.2
-407.5
-549.536
Thousands of wage and salary jobs
Service providing
Goods producing
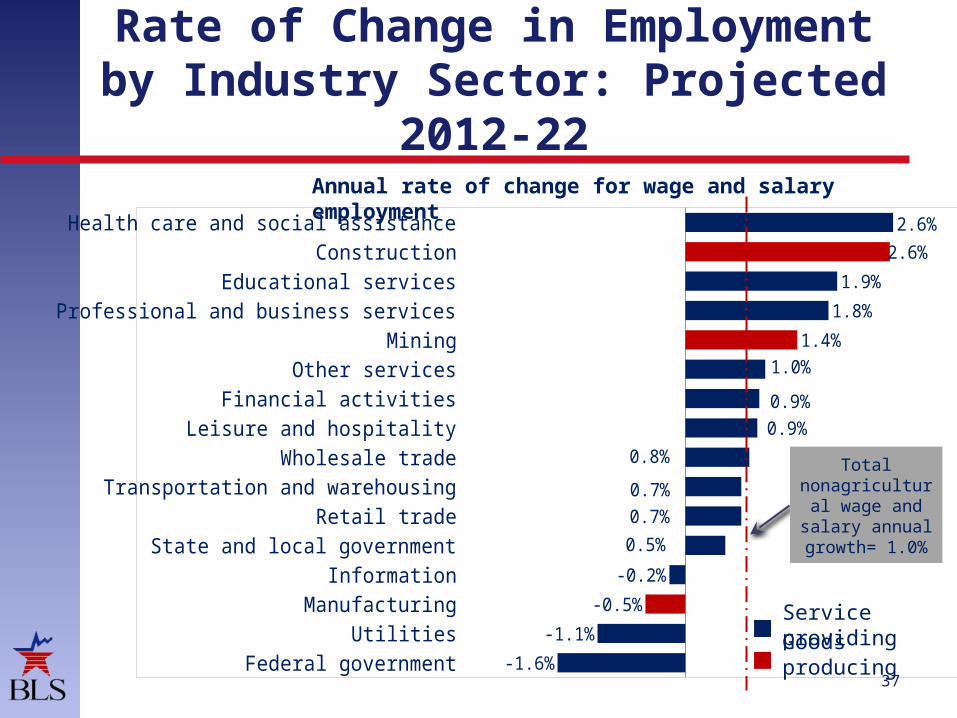
Rate of Change in Employment by Industry Sector: Projected
2012-22
Health care and social assistance Construction
Educational services Professional and business services
Mining Other services
Financial activities Leisure and hospitality
Wholesale trade Transportation and warehousing
Retail trade State and local government
Information Manufacturing
Utilities Federal government
2.6%
2.6%
1.9%
1.8%
1.4%1.0%
0.9%0.9%
0.8%
0.7%0.7%
0.5%
-0.2%
-0.5%
-1.1%
-1.6%37
Annual rate of change for wage and salary employment
Service providingGoods producing
Total nonagricultura
l wage and salary annual growth= 1.0%

Employment Outlook: 2012-22
Occupational Employment
38
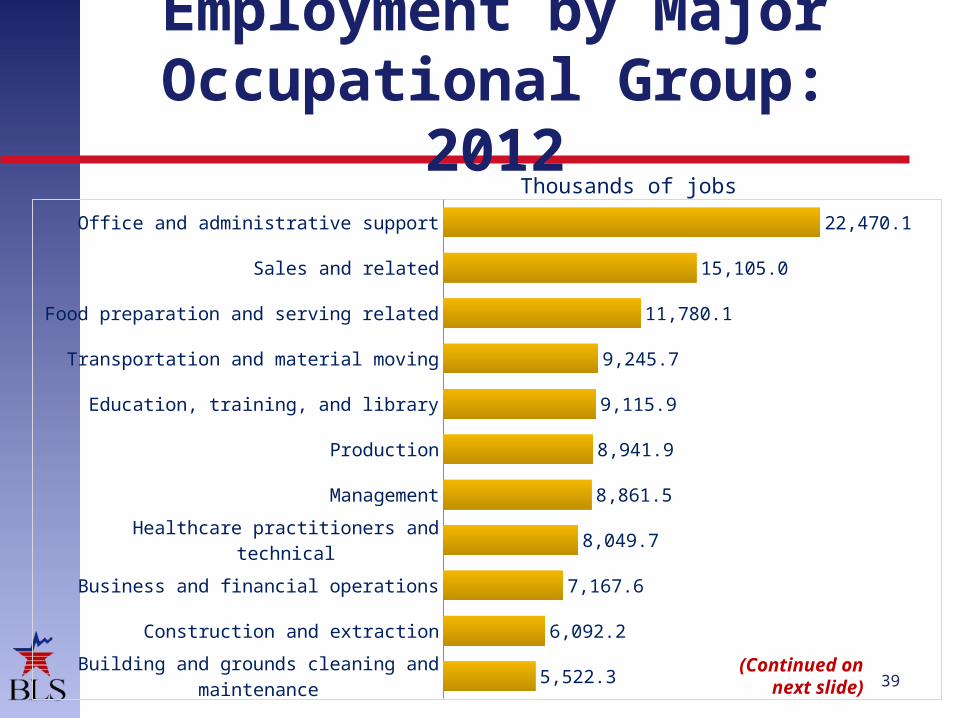
Employment by Major Occupational Group:
2012Office and administrative support
Sales and related
Food preparation and serving related
Transportation and material moving
Education, training, and library
Production
Management
Healthcare practitioners and technical
Business and financial operations
Construction and extraction
Building and grounds cleaning and main-tenance
22,470.1
15,105.0
11,780.1
9,245.7
9,115.9
8,941.9
8,861.5
8,049.7
7,167.6
6,092.2
5,522.3 39
Thousands of jobs
(Continued on next
slide)

Employment by Major Occupational Group:
2012Installation, maintenance, and repair
Personal care and service
Healthcare support
Computer and mathematical
Protective service
Arts, design, entertainment, sports, and media
Architecture and engineering
Community and social service
Life, physical, and social science
Legal
Farming, fishing, and forestry
5,514.8
5,375.6
4,110.2
3,814.7
3,325.3
2,570.9
2,474.5
2,374.7
1,249.1
1,247.0
947.2 40
(Continued)
Thousands of jobs

Percent Change vs. Numeric Change
41
Audiologists
Retail salespersons
33.6%
9.8%
Percent employment growth in two occupations, projected 2012-22
Audiologists
Retail salespersons
4.3
434.7
Numeric employment growth in two occupations, projected 2012-22, in thousands

Percent Change vs. Numeric Change
Number of Instagram followers Alicia Keys:
1,000,000 Henry: 10
Numeric increase Alicia Keys: 50,000 Henry: 5
Percentage increase Alicia Keys: 5% Henry: 50%
Let’s look at this concept using Instagram:
(Continued on next
slide)
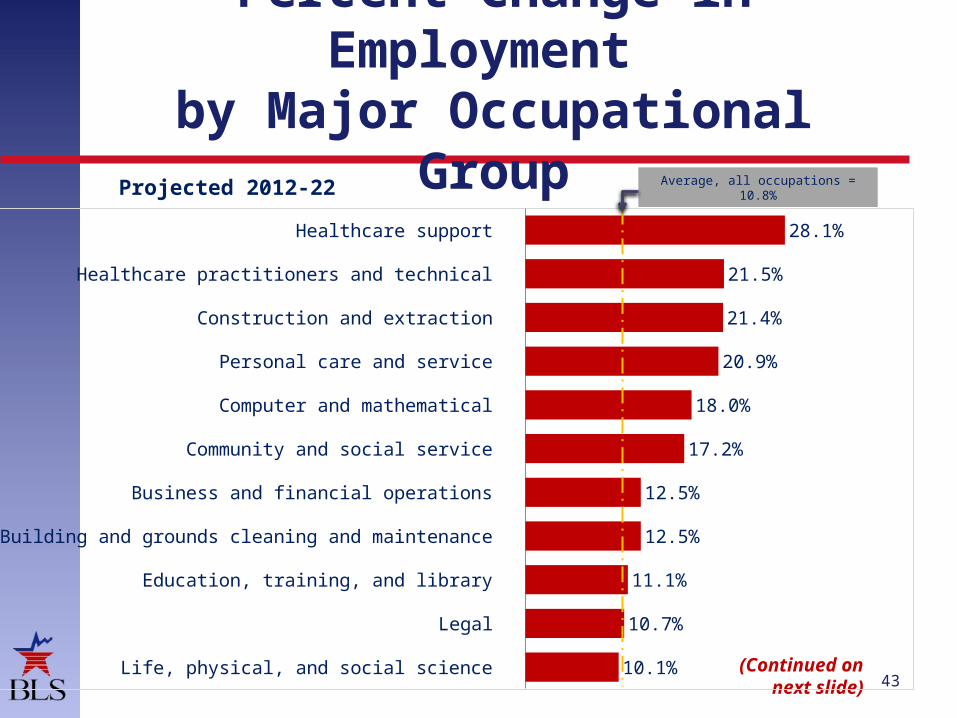
Percent Change in Employment
by Major Occupational Group
Healthcare support
Healthcare practitioners and technical
Construction and extraction
Personal care and service
Computer and mathematical
Community and social service
Business and financial operations
Building and grounds cleaning and maintenance
Education, training, and library
Legal
Life, physical, and social science
28.1%
21.5%
21.4%
20.9%
18.0%
17.2%
12.5%
12.5%
11.1%
10.7%
10.1%43
Projected 2012-22 Average, all occupations = 10.8%

Percent Change in Employment
by Major Occupational Group
Installation, maintenance, and repair
Food preparation and serving related
Transportation and material moving
Protective service
Architecture and engineering
Sales and related
Management
Arts, design, entertainment, sports, and media
Office and administrative support
Production
Farming, fishing, and forestry
9.6%
9.4%
8.6%
7.9%
7.3%
7.3%
7.2%
7.0%
6.8%
0.8%
-3.4%44
Projected 2012-22
Average, all occupations = 10.8%
(Continued)
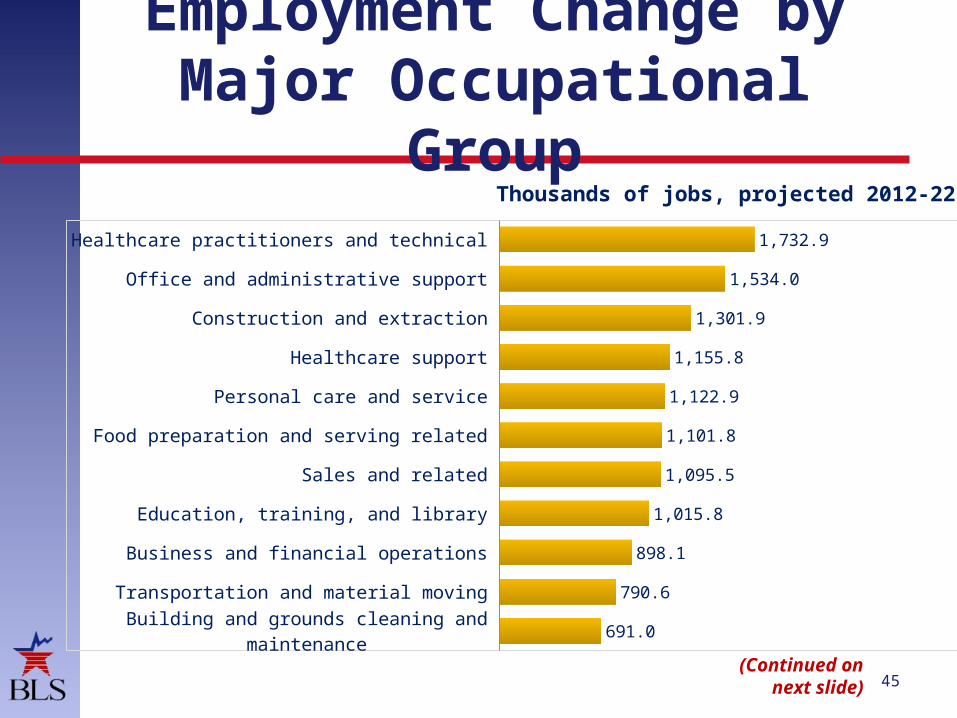
Employment Change by Major Occupational
GroupHealthcare practitioners and technical
Office and administrative support
Construction and extraction
Healthcare support
Personal care and service
Food preparation and serving related
Sales and related
Education, training, and library
Business and financial operations
Transportation and material moving
Building and grounds cleaning and main-tenance
1,732.9
1,534.0
1,301.9
1,155.8
1,122.9
1,101.8
1,095.5
1,015.8
898.1
790.6
691.0
45
Thousands of jobs, projected 2012-22
(Continued on next
slide)

Employment Change by Major Occupational
GroupComputer and mathematical
Management
Installation, maintenance, and repair
Community and social service
Protective service
Arts, design, entertainment, sports, and media
Architecture and engineering
Legal
Life, physical, and social science
Production
Farming, fishing, and forestry
685.8
636.6
531.2
408.8
263.0
180.6
179.6
132.9
125.7
75.6
-32.246
Thousands of jobs, projected 2012-22(Continued)

Fastest Growing Occupations
47
Percent change, projected 2012-22
Median annual wages, May 2012
$83,580
$19,910
$20,820
$39,170
$45,430
$65,860
$28,220
$53,240
$56,800
$52,160
Industrial-organizational psychologists
Personal care aides
Home health aides
Insulation workers, mechanical
Interpreters and translators
Diagnostic medical sonographersHelpers--brickmasons, blockmasons,
stonemasons, and tile and marble set-ters
Occupational therapy assistants
Genetic counselors
Physical therapist assistants
53.4%
48.8%
48.5%
46.7%
46.1%
46.0%
43.0%
42.6%
41.2%
41.0%
Median annual wages, May 2012
$19,910
$65,470
$21,110
$20,820
$18,260
$24,420
$32,410
$30,580
$22,320
$29,990
Thousands of jobs, projected 2012-22
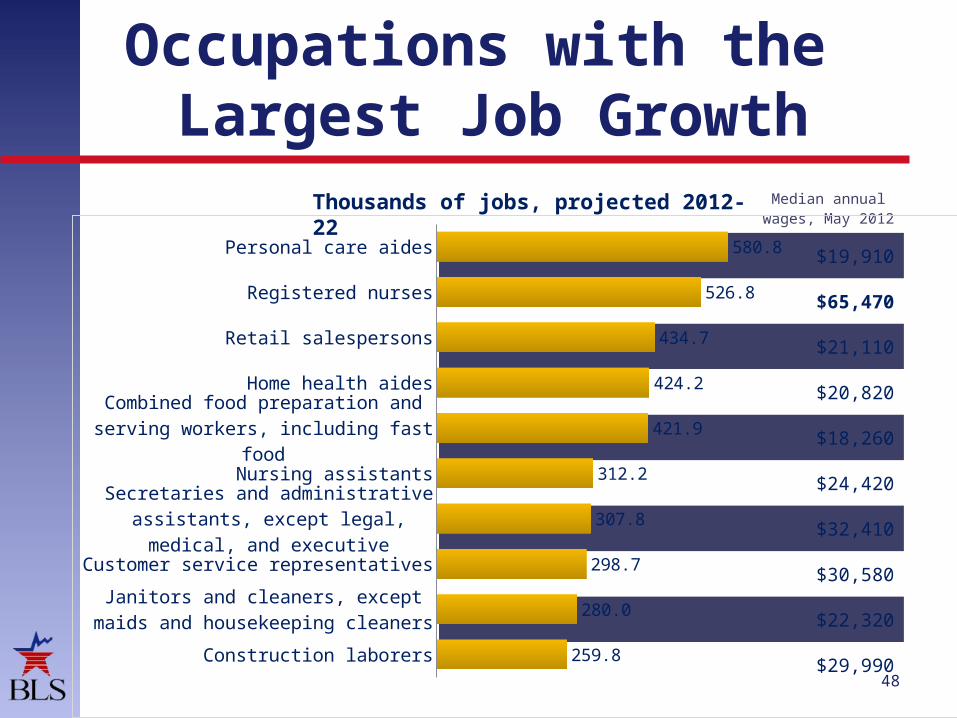
Occupations with the Largest Job Growth
Personal care aides
Registered nurses
Retail salespersons
Home health aides
Combined food preparation and serv-ing workers, including fast food
Nursing assistantsSecretaries and administrative assis-tants, except legal, medical, and ex-
ecutiveCustomer service representatives
Janitors and cleaners, except maids and housekeeping cleaners
Construction laborers
580.8
526.8
434.7
424.2
421.9
312.2
307.8
298.7
280.0
259.8
48

Fastest Declining Occupations
49
Percent change, projected 2012-22
Median annual wages, May 2012
$35,250
$44,920
$24,310
$53,090
$32,880
$53,090
$33,020
$24,050
$56,490
$19,830
Fallers
Locomotive firers
Shoe machine operators and tenders
Postal service clerks
Log graders and scalersPostal service mail sorters, pro-
cessors, and processing machine operators
Semiconductor processors
Textile cutting machine setters, operators, and tenders
Postal service mail carriers
Motion picture projectionists
-43.3%
-42.0%
-35.3%
-31.8%
-31.6%
-29.8%
-27.1%
-27.1%
-26.8%
-26.5%
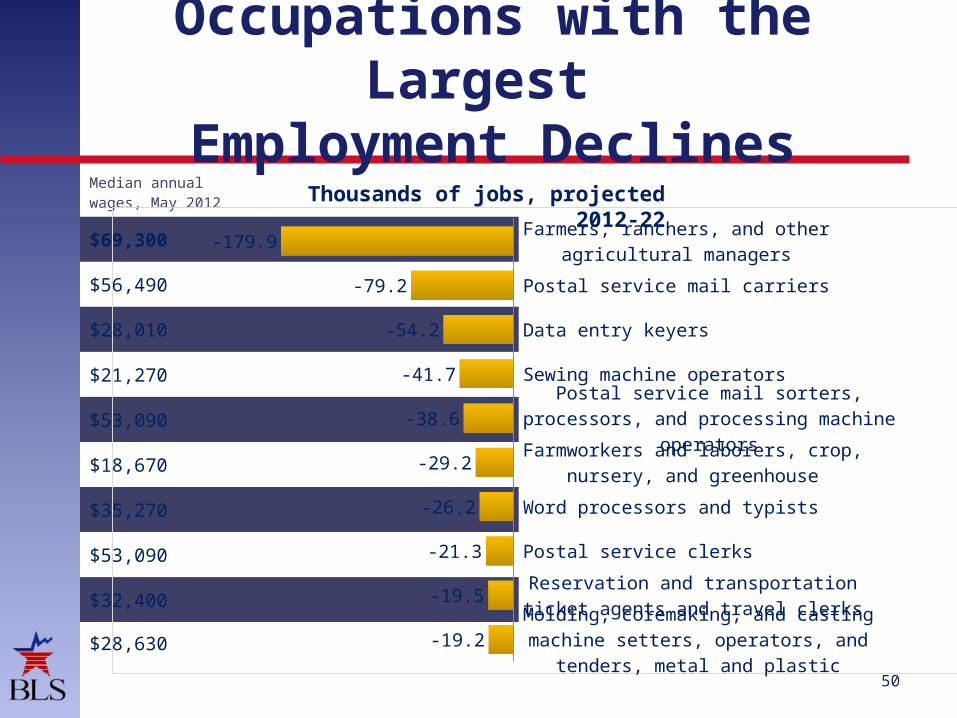
Occupations with the Largest
Employment Declines
50
Thousands of jobs, projected 2012-22
Median annual wages, May 2012
$69,300
$56,490
$28,010
$21,270
$53,090
$18,670
$35,270
$53,090
$32,400
$28,630
Farmers, ranchers, and other agricultural managers
Postal service mail carriers
Data entry keyers
Sewing machine operators
Postal service mail sorters, processors, and processing machine operators
Farmworkers and laborers, crop, nursery, and greenhouse
Word processors and typists
Postal service clerks
Reservation and transportation ticket agents and travel clerks
Molding, coremaking, and casting machine setters, operators, and ten-
ders, metal and plastic
-179.9
-79.2
-54.2
-41.7
-38.6
-29.2
-26.2
-21.3
-19.5
-19.2

Education and Training Classification
51
Consists of three categories of information for each occupation:
Typical education needed for entry
Work experience in a related occupation
Typical on-the-job training needed to attain competency in the occupation
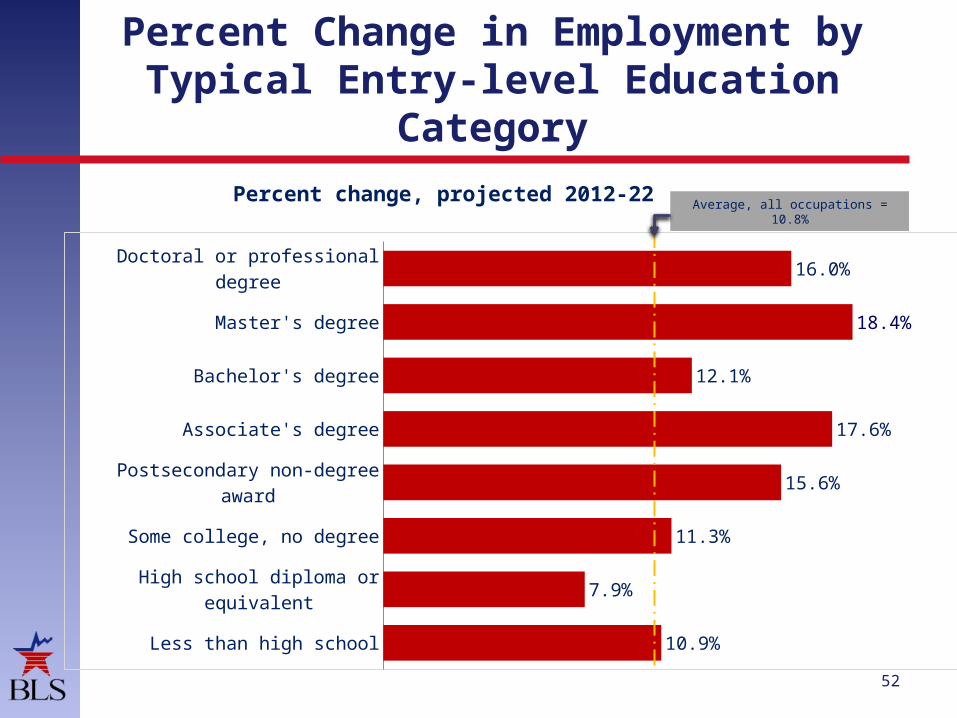
Percent Change in Employment by Typical Entry-level Education
Category
Doctoral or professional degree
Master's degree
Bachelor's degree
Associate's degree
Postsecondary non-degree award
Some college, no degree
High school diploma or equiva-lent
Less than high school
16.0%
18.4%
12.1%
17.6%
15.6%
11.3%
7.9%
10.9%
52
Percent change, projected 2012-22Average, all occupations = 10.8%

Employment Change by Typical Entry-level Education
Category
Doctoral or professional degree
Master's degree
Bachelor's degree
Associate's degree
Postsecondary non-degree award
Some college, no degree
High school diploma or equivalent
Less than high school
638.4
448.5
3,143.6
1,046.0
1,337.1
225.0
4,630.8
4,158.4
53
Thousands of jobs, projected 2012-22

W TMedian annual
wages, May 2012
N N $113,530
N N $79,860
<5 N $81,140
N I/R >=$187,200
N N $116,670
N N $64,290
N N $145,240
N I/R $172,020
N I/R $67,650
N N $73,660
Thousands of jobs, projected 2012-22
Doctoral or Professional Degree Occupations with the Largest Job
Growth
Lawyers
Physical therapists
Health specialties teachers, postsecondary
Physicians and surgeons, all other
Pharmacists
Postsecondary teachers, all other
Dentists, general
Family and general practitioners
Clinical, counseling, and school psychologists
Business teachers, postsecondary
74.8
73.5
68.6
65.3
41.4
32.2
20.6
18.1
16.4
15.2
54

W TMedian annual
wages, May 2012
N N $49,830
N N $89,960
N I/R $40,080
N N $90,930
N N $75,400
N N $53,610
N N $69,870
<5 N $64,850
5+ N $86,490
N N $33,880
Thousands of jobs, projected 2012-22
Master’s Degree Occupations with the Largest Job Growth
Healthcare social workers
Nurse practitioners
Mental health counselors
Physician assistants
Occupational therapists
Educational, guidance, school, and vocational counselors
Speech-language pathologists
Nursing instructors and teachers, postsecondary
Education administrators, post-secondary
Rehabilitation counselors
39.2
37.1
36.7
33.3
32.8
31.2
26
24
23.5
23.4
55
W TMedian annual
wages, May 2012
<5 N $95,440
N I/R $53,400
N N $63,550
N N $90,060
<5 N $78,600
N N $60,300
N N $79,680
N N $99,000
N M $82,790
N I/R $53,430
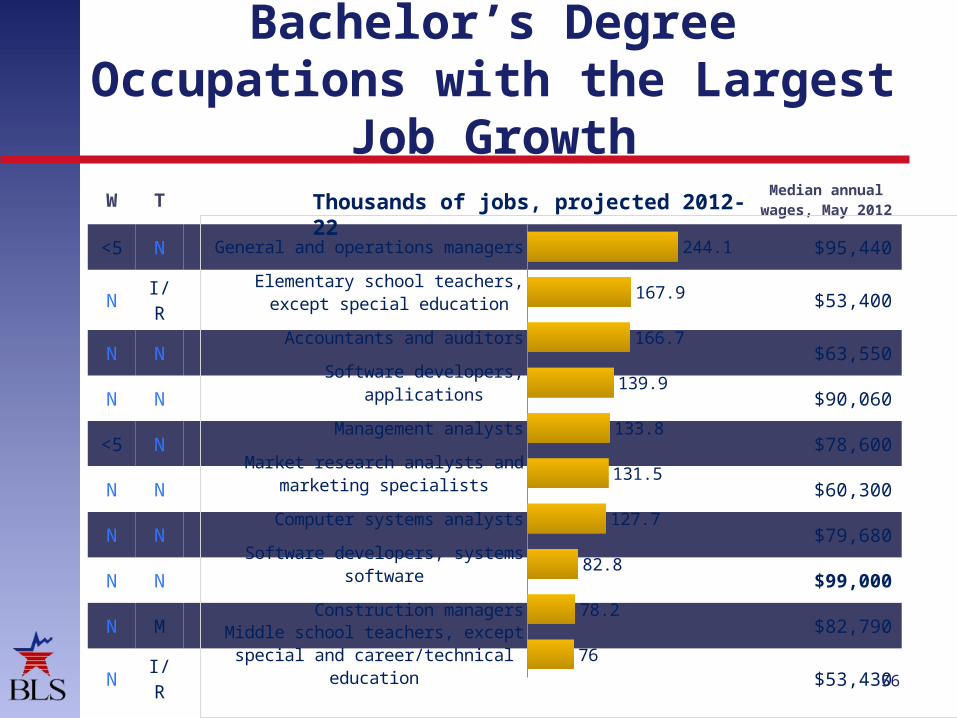
Thousands of jobs, projected 2012-22
Bachelor’s Degree Occupations with the Largest
Job Growth
General and operations managers
Elementary school teachers, except special education
Accountants and auditors
Software developers, applications
Management analysts
Market research analysts and market-ing specialists
Computer systems analysts
Software developers, systems software
Construction managers
Middle school teachers, except special and career/technical education
244.1
167.9
166.7
139.9
133.8
131.5
127.7
82.8
78.2
76
56

W TMedian annual
wages, May 2012
N N $65,470
N N $24,420
N S $38,200
N N $41,540
N N $29,370
N N $22,700
N N $27,130
N N $34,500
N N $70,210
N L $43,640
Thousands of jobs, projected 2012-22
Associate’s Degree or Postsecondary Non-degree Award Occupations with the
Largest Job Growth
Registered nurses
Nursing assistants
Heavy and tractor-trailer truck drivers
Licensed practical and licensed vocational nurses
Medical assistants
Hairdressers, hairstylists, and cosmetologists
Preschool teachers, except special education
Dental assistants
Dental hygienists
Heating, air conditioning, and re-frigeration mechanics and installers
526.8
312.2
192.6
182.9
162.9
77.6
76.4
74.4
64.2
55.9
57

W TMedian annual
wages, May 2012
N S $32,410
N S $30,580
N A $39,940
N M $35,170
N M $31,350
N S $19,510
N S $27,470
<5 N $49,330
N S $25,990
N M $54,230
Thousands of jobs, projected 2012-22
High School Diploma Occupations with the Largest Job
Growth
Secretaries and administrative assistants, except legal, medical, and executive
Customer service representatives
Carpenters
Bookkeeping, accounting, and auditing clerks
Medical secretaries
Childcare workers
Office clerks, general
First-line supervisors of office and administrative support workers
Receptionists and information clerks
Sales representatives, wholesale and manufactur-ing, except technical and scientific products
307.8
298.7
218.2
204.6
189.2
184.1
184.1
171.5
135.9
132
58

W TMedian annual
wages, May 2012
N S $19,910
N S $21,110
N S $20,820
N S $18,260
N S $22,320
N S $29,990
N S $23,890
N S $19,570
<5 M $22,030
N S $23,570
Thousands of jobs, projected 2012-22
Less Than High School Occupations with the Largest Job
Growth
Personal care aides
Retail salespersons
Home health aides
Combined food preparation and serving workers, including fast food
Janitors and cleaners, except maids and housekeeping cleaners
Construction laborers
Laborers and freight, stock, and material movers, hand
Maids and housekeeping cleaners
Cooks, restaurant
Landscaping and groundskeeping workers
580.8
434.7
424.2
421.9
280
259.8
241.9
183.4
150.1
139.2
59

Occupational Outlook Handbook
60
www.bls.gov/ooh

Education pays…
Doctoral degree
Professional degree
Master's degree
Bachelor's degree
Associate degree
Some College, no degree
High school diploma
Less than high school diploma
$1,623
$1,714
$1,329
$1,108
$777
$727
$651
$472
61
Median weekly earnings, 2013
Series12.2
2.3
3.4
4.0
5.4
7.0
7.5
11.0
Unemployment rate, 2013
Average, all occupations = $827Average, all occupations = 6.1NOTE: Data for persons
aged 25 and over.

Mid-Atlantic Information Office
Economic Analysis & Information215-597-DATA (597-3282)
Mid-Atlantic Information Office Web sitewww.bls.gov/ro3
Information requests by [email protected]
Information requests by fax215-861-5720
7/29/2014
62

Contact Information
Kara MarkleyRegional Economist
U.S. Bureau of Labor Statisticswww.bls.gov/ro3215-861-5603