economies ofscale in cable television: a multiproduct · pdf fileeconomies ofscale in cable...
TRANSCRIPT

3
Economies of Scale in Cable Television:
A Multiproduct Analysis
ELIM.NOAM
CONTENTS
1. Research IssueII. The Model
III. DataA. Labor InputsB. Capital InputsC. Programming InputsD. OutputsE. Other Variables
IV. ResultsV. Conclusion
1. THE RESEARCH ISSUE
This study is an investigation of the economies of scale in cable television operations. The results are intended as an empirical contribution tothe question of whether competition among rival cable television operators is likely, an issue of significant interest for regulatory policy towards the new medium.
The study proceeds by specifying a multiproduct function, and incorporates the effects of regulation in the multi-equation model. The statistical estimation is based on data for all 4,800 U.S. cable systems inoperation in 1981.
The U.S. television industry is presently undergoing rapid change.Where once there was a limit on viewing options imposed by the scar-
94 Eli M. Noam
city of electromagnetic spectrum, confining most viewers to a handfulof channels, cable television is emerging as "the television of abundance" (Sloan Commission 1971). Yet ironically, the market structure of"abundant" cable television may be more restrictive than that of"scarce" broadcast television, since the present franchising system hasled to the establishment of parallel local franchises, one for each franchise area. This raises concern about a cable operator's ability, if leftunconstrained by competition or regulation to charge monopolisticprices to subscribers, and, more significantly, to control the content of a
large number of program channels. A variety of policy proposals havetherefore been made, seeking to reach some form of either conductregulation, public ownership, common carrier status, or competitivemarket structure. The latter approach, in particular, has been taken bythe Federal Communications Commission, whose philosophy it is topermit entry and encourage inter-media competition between cable andother video technologies 1
A second and distinct competitive approach is to rely on intramedium competition among cable companies. In New York State, forexample, a governor's bill, based on recommendations by Alfred Kahnand Irwin Stelzer had sought to open each cable franchise area to additional cable companies, thereby reducing their local economic power.The likelihood of such entry, however, isbased on the assumption thatmore than one cable company could successfully operate in a territory.But such competition is normally not likely to be sustainable, absentcollusion, if cable exhibits strong economies of scale and economies ofscope, i.e., cost advantages of size and of diversified production.
The question of cable television's economies of scale also has implications on the scope of local regulation (Schmalensee 1979) and onthe treatment of the medium as a "public utility," issues that have arisenin a number of court cases.? (In one decision, for example, the courtdeclared that "CATV is not a natural monopoly. Thus, the scope ofregulation which is necessary in the natural monopolies is not herenecessary ... (and) CATV is not a public utility ... (Greater Freemont, Inc. v. City ojFreemont, 1968)." Information on scale elasticitiesis also important in assessing the likelihood of future consolidationsinto regional or national cable systems, finding the economically mostefficient subdivision of large cities Into franchise zones," and in analyzing the price structure of cable television."
Economies ofScale in Cable Television 95
Despite the relevance of the question of cable television economies ofscale and scope, it has not received much empirical investigation."Previous studies of cable television have typically centered on questionsof demand analysis and of audience diversion. Most are dated, sincetheir impetus was the 1966 FCC rules restricting CATV (Mitre 1974;cnc 1972; Mitchell and Smiley 1974;"Crandall and Fray 1974; Noll etal. 1973; Panko et al. 1975). As pointed out in an article jointly authoredby a comfortable majority of the economists engaged in cable televisionresearch (Besen et al. 1977): "All of these 'models are synthetic andeclectic, drawing their cost data for the specific components of a systemfrom engineering specification and field experience; no satisfactorydata set exists from which to estimate econometric cost or productionfunctions" (p. 66)6
Since that observation, several empirical studies on the demand forpay-cable services were undertaken (Bloch and Wirth 1982; Dunmoreand Bykowsky 1982; Smith and Gallagher 1980). However, no comparable research on the production side was undertaken, with the recentexception of Owen and Greenhalgh (1983).
The Owen and Greenhalgh study, though it also relies on a costfunction approach, is empirically based on figures from the applicationsby competing franchise bidders in 34 cities. As the authors themselvesnote, these figures do not represent actual operational data, but ratherpromises, possibly based on some form of "gamesmanship," and including those made by losing and therefore possibly inefficient bidders.furthermore, no capital measures are available. Nevertheless, theOwen-Greenhalgh study is a great improvement over the previous stateof knowledge. Webb (1983) also includes a brief and simple estimationof economies of scale, but the magnitudes of the elasticities are so vast(in the order of 4 to 10) as to be unpersuasive.
II. THE MODEL
Economies of scale and natural monopoly are closely related but notidentical concepts." Baumol (1977) together with Bailey and Willig(Baumol et aI., 1977), formalized the analysis of these terms for themultiproduct case, defining natural monopoly as "[a]n industry in

96 Eli M. Noam
which multifirm production is more costly than production by a monopoly (subadditivity of the cost function)." Accordingly, to establish anatural monopoly anywhere along an output ray, it is necessary andsufficient to demonstrate strict ray sub additivity, i.e., that the costs ofjoint production by one firm are less than the cost of separate production by several firms for any scale of output mix Q. The existence ofsubadditivity is difficult to prove.s However, a number of conditionsexist that are sufficient-though not necessary-for ray subadditivity.Among these is the proposition that increasing returns to scale up tooutput combination Q imply decreasing ray average costs and ray subadditivity up to Q. Hence, a showing of increasing returns to scale forthe output range below Q would demonstrate a natural monopoly alongthat output ray.?
For purposes of analysis and estimation, consider the multiproductcost function of i, uniquely corresponding to the production functionunder duality assumptions,
(I) C, ~ /; (P, . . ..p"; Q\ . . ..Qq; Mml
where C, are total costs of production, Qq is the output vector, Pi are theprices for input factors i, assumed to be independent of output of thesystem, and Mm are a set of other variables that may affect cost. Underthe assumption of cost-minimization, we have from Shepherd's lemmaan identity of the cost-price elasticities Ecp; with the share of each inputfactor in total cost, i.e.,
P·X· alnC(2) s, ea T = alnPi = E CPi
where Xi is the quantity of input i, (The estimation of these cost-shareequations jointly with the cost function increases the degrees of freedom and the statistical weight of an empirical estimation.)
Furthermore, let the cost functionfbe given by the translog function,a second-order logarithmic approximation to an arbitrary twice-differentiable transformation surface (Griliches and Ringstad 1971; Jorgensonet al. 1971). The translog function imposes no restrictions of productionsuch as homogeneity, homotheticity, or unitary elasticities of factorsubstitution, and is hence, convenient for testing the existence of theseproperties.P A major problem with the application of a multiproductspecification of a cost function is that if even one of the products has the
Economies ofScale in Cable Television 97
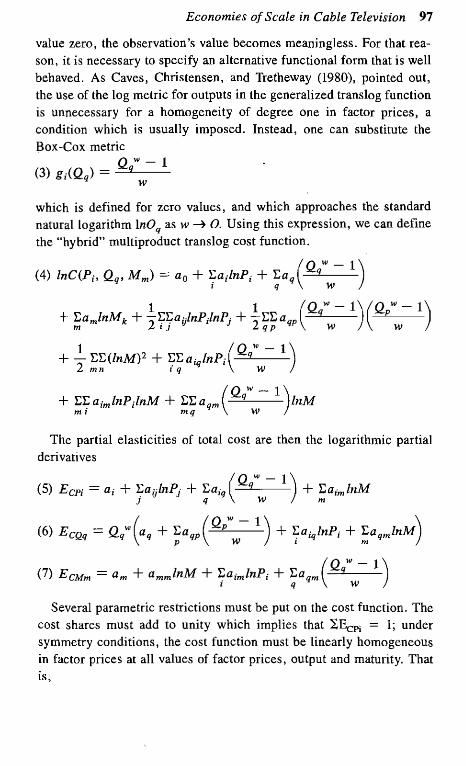
value zero, the observation's value becomes meaningless. For that reason, it is necessary to specify an alternative functional form that is wellbehaved. As Caves, Christensen, and Tretheway (1980), pointed out,the use of the log metric for outputs in the generalized translog functionis unnecessary for a homogeneity' of degree one in factor prices, acondition which is usually imposed. Instead, one can substitute theBox-Cox metric
QW-l(3) gi(Qq) = q w
which is defined for zero values, and which approaches the standardnatural logarithm InOq as w --? O. Using this expression, we can definethe "hybrid" multiproduct translog cost function.
The partial elasticities of total cost are then the logarithmic partialderivatives
(Q W- I )
(5) E CPi = a, + EaijlnPj + Ea,q q + Ea,mlnMJ q W m
(6) E CQq = Qqw(aq + ;:aqp(Qpww- 1) + '7 aiqlnPi + ~aqmlnM)
Several parametric restrictions must be put on the cost function. Thecost shares must add to unity which implies that SECPi = 1; undersymmetry conditions, the cost function must be linearly homogeneousin factor prices at all values of factor prices, output and maturity. Thatis,
98 Eli M. Noam
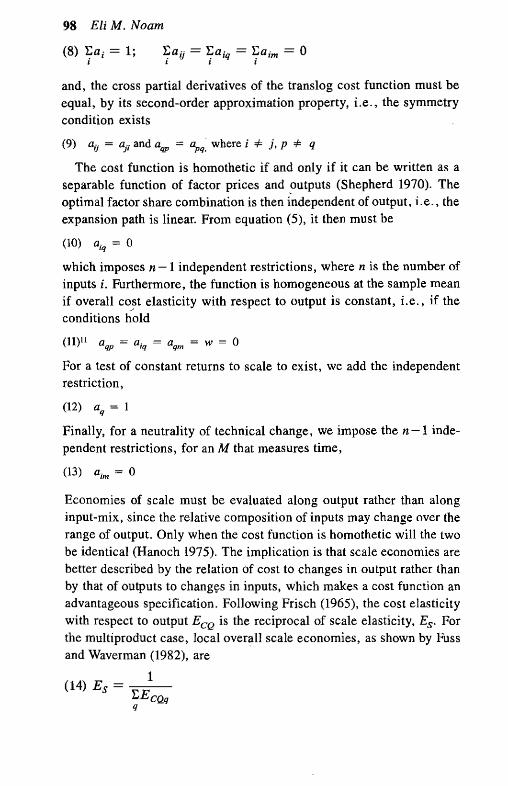
(8) Ea, = 1;,and, the cross partial derivatives of the translog cost function must beequal, by its second-order approximation property, i.e., the symmetrycondition exists
(9) aiI = aji" and aqp = apq, where i *' i. P *" q
The cost function is homothetic if and only if it can be written as aseparable function of factor prices and .outputs (Shepherd 1970). Theoptimal factor share combination is then independent of output, i.e., theexpansion path is linear. From equation (5), it then must be
(10) aiq = 0
which imposes n -1 independent restrictions, where n is the number ofinputs i, Furthermore, the function is homogeneous at the sample meanif overall co;;t elasticity with respect to output is constant, i.e., if theconditions hold
(H)!' aqp = aiq = aqm = w = 0
For a test of constant returns to scale to exist, we add the independentrestriction,
(12) aq = 1
Finally, for a neutrality of technical change, we impose the n-I independent restrictions, for an M that measures time,
(13) aim ~ 0
Economies of scale must be evaluated along output rather than alonginput-mix, since the relative composition of inputs may change over therange of output. Only when the cost function is homothetic will the twobe identical (Hanoch 1975). The implication is that scale economies arebetter described by the relation of cost to changes in output rather thanby that of outputs to chang"," in inputs, which makes a cost function anadvantageous specification. Following Frisch (1965), the cost elasticitywith respect to output ECQ is the reciprocal of scale elasticity, Es. Forthe multiproduct case, local overall scale economies, as shown by Fussand Waverman (1982), are
1(14) e, = -;;-EE~
CQqq
Economies ofScale in Cable Television 99
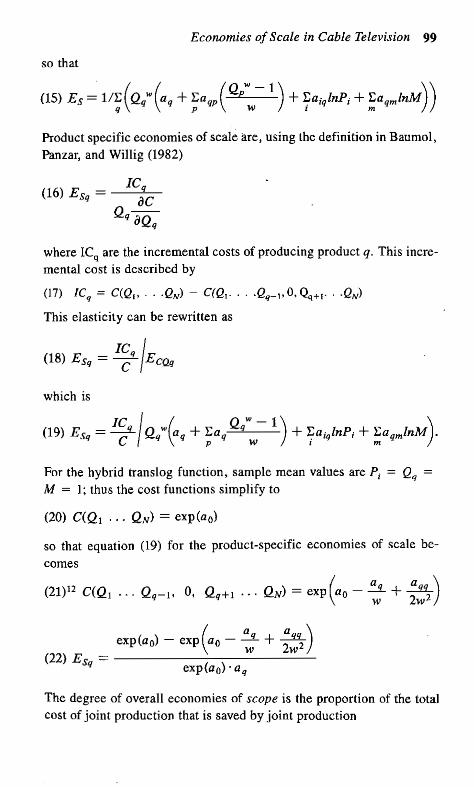
so that
Product specific economies of scaleare , using the definition in Baumol,Panzar, and Willig (1982)
_ IC q(16) E s q - oC
a,oQq
where ICq are the incremental costs of producing product q. This incremental cost is described by
(17) ICq = c(Q" .. ·QN) - C(Q, . . ..Qq_" 0, ~+,.. ·QN)
This elasticity can be rewritten as
( IC:q I18) E s q = C E CQq
which is
For the hybrid translog function, sample mean values are Pi = Qq =
M = I; thus the cost functions simplify to
so that equation (19) for the product-specific economies of scale becomes
(21)12 C:(Q, ... Qq-l' 0, Qq+l ... QN) = exp (ao - ~ + ;:~)
exp(ao) - exp(ao - ~ +~)(22) E sq = ( )expao 'a q
The degree of overall economies of scope is the proportion of the totalcost of joint production that is saved by joint production

100 Eli M. Noam
At the sample mean, we observe that the product-specific cost functionc, (Qq! is
~Na INN~
(24) Cq(Qq)=C(O,O .. :,Qq, ..O)=expao- E --G-+-2
EEag,ev« w 2w g s
g,S'*q
Therefore, equation (23) becomes
(N ( N a I NN ))Eexp ao - E ---L + -22 EEa g, - exp(ao)q g W W gs
exp(ao)
In order to solve this equation, it is necessary to observe, for eachproduct, the costs of separate and independent production. Since this isnot feasible in the case of cable television, a test for economies of scopemust proceed differently. As Panzar and Willig (l977a) have shown, itis a sufficient condition for economies of scope for the twice differentiable multiproduct cost function to have cost complementarities ofthe form
which can be expressed by
Atthe sample mean of the hybrid translog cost function, this conditionis met when aqag < - a qg for each combination of outputs q andg, withq i= g.
If some but not all products can be observed at the zero output level,product-specijic-rather than overall-economies of scope can also bemeasured. These are defined as the degree of cost reduction due to thejoint rather than separate production of q together with the other N - Iproducts.
Economies ofScale in Cable Television 101
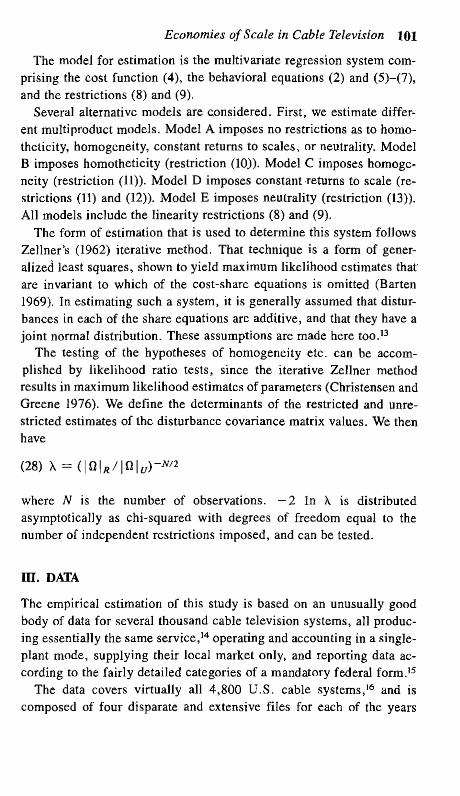
The model for estimation is the multivariate regression system comprising the cost fnnction (4), the behavioral equations (2) and (5)-(7),
and the restrictions (8) and (9).Several alternative models are considered. First, we estimate differ
ent multiproduct models. Model A imposes no restrictions as to homotheticity, homogeneity, constant returns to scales, or neutrality. ModelB imposes homotheticity (restriction (10)). Model C imposes homogeneity (restriction (11)). Model D imposes constantreturns to scale (restrictions (II) and (12)). Model E imposes neutrality (restriction (13)).All models include the linearity restrictions (8) and (9).
The form of estimation that is used to determine this system followsZellner's (1962) iterative method. That technique is a form of generalized least squares, shown to yield maximum likelihood estimates that'are invariant to which of the cost-share equations is omitted (Barten1969). In estimating such a system, it is generally assumed that disturbances in each of the share equations are additive, and that they have ajoint normal distribution. These assumptions are made here too.P
The testing of the hypotheses of homogeneity etc. can be accomplished by likelihood ratio tests, since the iterative Zellner methodresults in maximum likelihood estimates of parameters (Christensen andGreene 1976). We define the determinants of the restricted and unrestricted estimates of the disturbance covariance matrix values. We thenhave
where N is the number of observations. - 2 In A is distributedasymptotically as chi-squared with degrees of freedom equal to thenumber of independent restrictions imposed, and can be tested.
m. DATA
The empirical estimation of this study is based on an unusually goodbody of data for several thousand cable television systems, all producing essentially the same service.!" operating and accounting in a singleplant mode, supplying their local market only, and reporting data according to the fairly detailed categories of a mandatory federal form.P
The data covers virtually all 4,800 U.S. cable systems.t" and iscomposed of four disparate and extensive files for each of the years
t02 Eli M. Noam
1978 to 1981 for technical, programming, financial, local community,and employment information. The financial data includes both balancesheet and income figures .17
All variables are standardized around the sample mean in order toovercome the problem of arbitrary scaling that can become an issue intranslog functions.w
A. Labor Inputs'?
The factor quantity is the number of full-time employees (with parttimers added at half value). Its cost is the average salary of employees,weighted according to their classification by nine job categories (professionals, technicians, unskilled laborers, etc.).
B. Capital Inputs
Accounting data for different classes of assets is reported to the FCC inbook value form. Although the great bulk of assets in the cable television industry have been acquired within the past decade, thus limitingthe extent of inflationary distortion, it was considered prudent to revalue these assets. To do so, the study took advantage of a highlydetailed engineering study, commissioned by the federal government,on the cost and pattern of investment in the construction of cable systems. In that report, the required iuvestment flow in a medium-sizedcable system over a period of ten years was calculated.?" We assumethat this time distribution of investment over the first ten years holdsproportionally for all systems, with investment in the eleventh year andfurther years identical to that of the tenth year in real terms, and that thecost of acquiring capital assets required in a cable television systemincreases at the rateof a weighted index of communications andutilitiesequipment.?'
For each observation, we know the first year of operation and theaggregate historical value ofcapital assets. It is then possible to allocatecapital investments to the different years and different types of investment, and to inflate their value to the prices of the observation year. Theinput price PK of this capital stock K is determined by its opportunitycost in a competitive environment, consisting of potential returns r on
Economies ofScale in Cable Television 103
equity E and payments for debt D, with an allowance for the deductibility of interest expense (tax rate = t)22
The required return on equity is determined according to the riskpremium p required above the return on risk-free investments, RF ; thatis, rE = RF + p. Ibbotson and Sinquefield (1979) found p for theStandard & Poor 5000 to be 8.8 for the period 1926-1977. Hence, usingthe capital asset pricing model (Sharpe 1964; Lintner 1965), an estimateof 13 for a specific firm is 8.8 times 13, where 13 is the measure ofnondiversifiable (systematic) risk. The average 13 for cable companieslisted by Moody's is, for 1980, 13 = 1.42, resulting in a risk premium of12.49 percent over the treasury bill rate 2 3
For ":» the return on long-term debt, the following method was employed: for each observation it was determined, using several financialmeasures, what its hypothetical bond rating would have been, based ona company's financial characteristics. These "shadow" bond ratings for
.each observation were then applied to the actual average interest ratesexisting in the observation years for different bond ratings (Moody's1981). This procedure is novel, but is based on a series of previousstudies in the finance literature of bond ratings and their relation tofinancial ratios.24
Tax rate w is defined as the corporate income tax rate (federal andaverage net state). Debt is defined as long term liabilities.
C. Programming Inputs
The third production factor of the model is the input of programming. Acable system that carries no communications messages would be of nointerest to subscribers. Therefore, cable operators supply programs inaddition to providing the communication wire. These programs are notproduced or generated by the operators; with trivial exceptions.P programming is supplied by broadcasters and program networks.w Program costs are both direct and indirect. Direct costs are the outlays forprogram services, for example to pay-TV networks and to supplierssuch as Cable News Network (CNN), which charge operators according
104 Eli M. Noam
to the number of their subscribers, plus the cost of program importationand its equipment. Direct costs, however, are only part of the programming cost; indirect costs that must also be considered are the foregonenet earning from advertising. For example, CNN is able to sell some ofits "air" time to advertisers. This time is in effect a compensation in
kind by the cable operator to CNN lor the supply of the program.Similarly, local broadcasters are carried by cable for free, and theprogramming cost of these "must carry" to cable operators, too, is theforegone earnings, largely in advertising revenues.s?
Direct costs are reported to the FCC and are available. Included arealso such capital cost as those of origination studios and signal importation equipment and cost to carriers. The indirect cost of foregone advertising revenue is defined as the potential minus the actual advertisingrevenue obtained by cable operators net of cost. Actual figures arereported to the FCC; potential revenues are estimated by reference tothe average net advertising revenue in television broadcasting perhousehold/and viewing time.28 The unit price of programming inputs istheir total divided by the number of program hours and channels.
It is one of the convenient properties of cable television that it usesvery little in inputs beyond those of capital, labor, and programming. Itdoes not use raw materials of intermediate inputs to speak of, apart fromprogramming. Even its energy requirements are quite small, in theorder of .7 percent of total expenses, if capital expenses are included(Weinberg 1972, tables C-I and C-2). Office supplies, telephone,postage, insurance etc. add another 1.8 percent of costs that includecapital inputs. For consistent treatment of inputs and outputs, this smallresidual input is added to the inputs K, L, and P; since one cannotdetermine for what the residual input is a substitute, we prorate K, L,and P.
D, Outpnts
Costs and revenues in cable television are nearly entirely for subscription rather than actual use ', Pay-per-view billing systems are rare, and intheir absence there are only negligible marginal costs to the operator fora subscriber's actual viewing of the channels. Interactive communications services, though maybe ~f future importance, are very rare at

Economies ofScale in Cable Television 105
present. Advertisements, similarly, are largely supplied by programproviders as part of an exchange arrangement; as discussed above, theyare an input. Hence, the number of actual and potential subscribers-asopposed to their viewing-are the measures of the operator's outputs.
Cable television operators' major outputs then are of the followingdimensions: (a) basic service subscriptions; (b) pay-TV service subscriptions; and Cc) the size of the market developed, measured by thenumber of potential subscribers that are reached. The latter is reflectedby the number of "homes passed" by cable. The larger this number, themore subscribers can be potentially enrolled. Cable trunk lines orfeeder lines pass their house; only drops need to be added for theirinclusion as paying customers ,29
E. Other Variables
M, maturity in operation, is one variable that is introduced to allow forthe period that a cable operator had to improve operations and to establish itself in the local market. It is defined by the number of years ofactual operation.
This variable may be thought of as if it were an output factor. Quitepossibly, it is substitutable for the more conventional input factors ofcapital and labor, reflecting improvements in productivity of a firmwhose experience shifts the cost function downwards. The variable alsoallows to reflect different technological vintages, and a possible tightening of franchise contract requirements over time. There is no clear-cutrelation of time and size per se. Old systems include both the smallestbackwoods operators and the largest, due to the time available forpenetration.
Two additional variables are introduced in order to adjust for differences in the cable systems that may affect costs of production andability to attract subscribers. The density of population has a role indetermining cost. The further houses are from each other physically, themore capital and labor inputs must go into reaching each. To allow fordensity variations, we define D as the length of cable trunk lines perhousehold passed. The resultant ratio is used as a proxy for density.P?
A third variable is the number E of video channels offered by a cableoperator. Clearly, the more channels offered, the more inputs are re-

106 Eli M. Noam
quired. At the same time, one would expect subscription outputs to beaffected positively, ceteris paribus. since the cable service is morevaried and hence probably more attractive to potential subscnbers."
rv, RESULTS
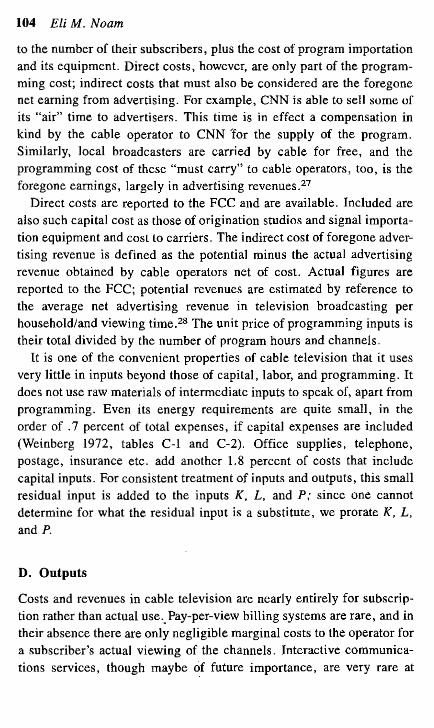
Table 3.1 represents the parameter estimates for the five models (A-E),for the multiproduct specification, for the year 1982.
The system has a good fit, with system R2 values above .97 for themodels. Similarly, the coefficients are generally significant at the .05level, and common parameters are of similar size. High R2 values arefound for the cost share equations, when these are estimated separately.P
Overall elasticity of scale is calculated, using equation (14), as Es =
1.096. That is, a 10 percent increase in size is associated with a unit costdecrease of about I percent.
We are also able to calculate, using equation (19), measures for theproduct-specific economies of scale for the three outputs. They are:
Es (Homes passed) = ·1.020Es (Basic subscriptions) = 1.054Es (Pay SUbscriptions) = 1.072
Economies of scale are thus observed for two outputs-basic andpay subscriptions. However, for "Homes passed," these are relativelysmall; it may be recalled that this output description refers to a physical measure, namely the extent of the cable network in accessing amarket.P
The implication from this result is that scale economies do not appearto exist primarily in the technical distribution aspects of cable television, as reflected by "Homes passed." Instead, they are observed for theoutput definitions that include a strong element of marketing success.
It is particularly interesting to observe that the overall economies ofscale are larger than the product-specific economies of scale. There arethen economies to joint production, or of "scope. "
It is, however, one thing'to observe that economies of scope mustexist, and quite another to actually apply the equations of the analyticalpart to their estimation in order to get a specific number. As discussedabove, one cannot, at least for cab'1e television, observe zero productionlevels or stand-alone production for separate products except-rarely-
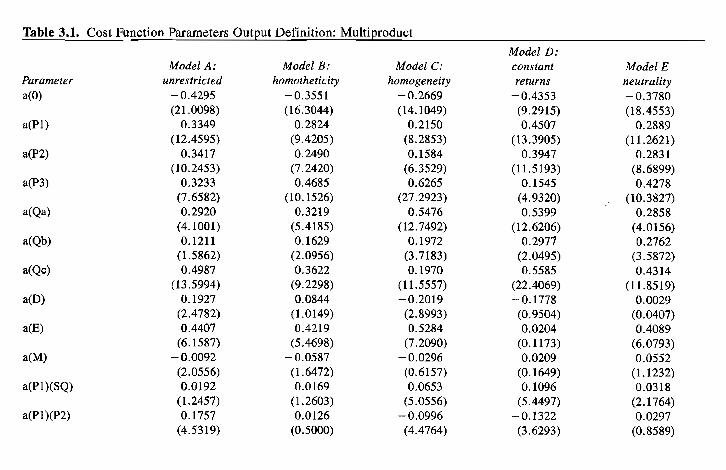
Table 3.1. Cost Function Parameters Output Definition: Multiproduct
Model D:Model A: Model B: Model C: constant Model E
Parameter unrestricted homotheticity homogeneity returns neutralitya(O) -0.4295 -0.3551 -0.2669 - 0.4353 -0.3780
(21.0098) (16.3044) (14.1049) (9.2915) (18.4553)a(PI) 0.3349 0.2824 0.2150 0.4507 0.2889
(12.4595) (9.4205) (8.2853) (13.3905) (11.2621)a(P2) 0.3417 0.2490 0.1584 0.3947 0.2831
(10.2453) (7.2420) (6.3529) (11.5193) (8.6899)a(P3) 0.3233 0.4685 0.6265 0.1545 0.4278
(7.6582) (10.1526) (27.2923) (4.9320) (10.3827)a(Qa) 0.2920 0.3219 0.5476 0.5399 0.2858
(4.1001) (5.4185) (12.7492) (12.6206) (4.0156)a(Qb) 0.1211 0.1629 0.1972 0.2971 0.2762
(1.5862) (2.0956) (3.7183) (2.0495) (3.5872)a(Qc) 0.4987 0.3622 0.1970 0.5585 0.4314
(13.5994) (9.2298) (11.5557) (22.4069) (11.8519)aID) 0.1927 0.0844 -0.2019 -0.1778 0.0029
(2.4782) (1.0149) (2.8993) (0.9504) (0.0407)aCE) 0.4407 0.4219 0.5284 0.0204 0.4089
(6.1587) (5.4698) (7.2090) (0.1173) (6.0793)a(M) -0.0092 -0.0587 -0.0296 0.0209 0.0552
(2.0556) (1.6472) (0.6157) (0.1649) (1.1232)a(PI)(SQ) 0.0192 0.0169 0.0653 0.1096 0.0318
(1.2457) (1.2603) (5.0556) (5.4497) (2.1764)a(Pl)(P2) 0.1757 0.0126 -0.0996 -0.1322 0.0297
(4.5319) (0.5000) (4.4764) (3.6293) (0.8589)
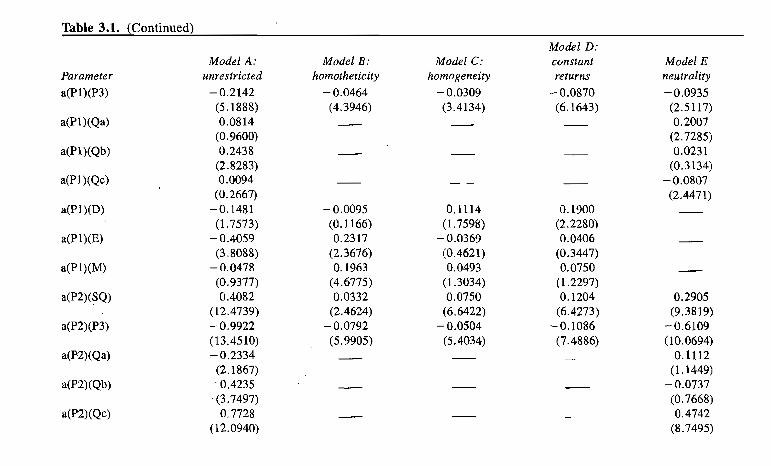
Table 3.1. (Continued)-- -- -
Model D:Model A: Model B: Model C: constant Model E
Parameter unrestricted homotheticity homogeneity returns neutrality
a(PI)(P3) -0.2142 -0.0464 -0.0309 -0.0870 -0.0935(5.1888) (4.3946) (3.4134) (6.1643) (2.5117)
a(PI)(Qa) 0.0814 -- - -- 0.2007(0.9600) (2.7285)
a(PI)(Qb) 0.2438 - - -- 0.0231(2.8283) (0.3134)
a(PI)(Qc) 0.0094 - - -- -0.0807(0.2667) (2.4471)
a(PI)(D) -0.1481 -0.0095 0.1114 0.1900(1.7573) (0.1166) (1.7598) (2.2280)
a(PI)(E) -0.4059 0.2317 -0.0369 0.0406(3.8088) (2.3676) (0.4621) (0.3447)
a(PI)(M) -0.0478 0.1963 0.0493 0.0750(0.9377) (4.6775) (1.3034) (1.2297)
a(P2)(SQ) 0.4082 0.0332 0.0750 0.1204 0.2905(12.4739) (2.4624) (6.6422) (6.4273) (9.3819)
a(P2)(P3) -0.9922 -0.0792 -0.0504 -0.1086 -0.6109(13.4510) (5.9905) (5.4034) (7.4886) (10.0694)
a(P2)(Qa) -0.2334 - - - 0.1112(2.1867) (1.1449)
a(P2)(Qb) . 0.4235 - - -- -0.0737. (3.7497) (0.7668)
a(P2)(Qc) 0.7728 - - - 0.4742(12.0940) (8.7495)
a(P2)(D) -0.2435 -0.2612 -0.0077 0.0252(2.2640) (2.7856) (0.1290) (0.2989)
a(P2)(E) -0.5717 0.3377 0.0485 0.0625(3.8874) (3.0053) (0.6524) (0.5585)
a(P2)(M) 0.3278 0.2077 -0.0280 0.0314(4.7756) (3.3537) (0.8139) (0.5559)
a(P3)(SQ) 0.6032 0.0628 0.0406 0.0314 0.3522(12.5321) (7.8259) (14.8110) (0.5559) (9.1544)
a(P3)(Qa) 0.1520 -0.3120(1.1172) (2.5455)
a(P3)(Qb) -0.6674 0.0505(4.7819) (0.4287)
a(P3)(Qc) -0.7823 -0.3935(9.8163) . (6.0579)
a(P3)(D) 0.3916 0.2708 -0.1037 -0.2152(2.9928) (2.2879) (3.5403) (2.8686)
a(P3)(E) 0.9776 -0.5694 -0.0115 -0.1031(5.4791) (3.8618) (0.3923) (1.3260)
a(P3)(M) -0.2800 -0.4041 -0.0213 -0.1065(3.7788) (5.8027) (1.1789) (2.3104)
a(Qa)(SQ) 0.1509 0.2967 0.1634(0.9408) (I.7608) (1.0060)
a(Qa)(Qb) -0.5721 -0.7997 -0.4138(1.6672) (2.2508) (1.2027)
a(Qa)(Qc) -0.1156 0.0691 0.2345(0.9659) (1.6512) (2.0869)
a(Qa)(D) 0.2968 0.4290 0.2673(1.2781) (1.7567) (1.1416)

Table 3.1. (Continued)- - - -
Model D:Model A: Model B: Model C: constant Model E
Parameter unrestricted homothetictty homogeneity returns neutrality
a(Qa)(E) 0.0502 -0.0498 - - -0.4212(0.1517) (0.1501) (1.2502)
a(Qa)(M) 0.0305 0.0410 - - -0.2483(0.1895) (0.2419) (1.5042)
a(Qb)(SQ) -0.0337 0.0334 - - -0.3023(3.3132) (0.4302) (3.3153)
a(Qb)(Qc) 0.2981 -0.2418 - - -0.2545(2.4572) (5.5954) (2.3535)
a(Qb)(D) -0.5525 -0.5936 - - -0.4203(2.2777) (2.3360) (1.7505)
a(Qb)(E) -0.5389 0.2512 - - 0.3580(1.6146) (0.7674) (1.0777)
a(Qb)(M) -0.0251 0.0802 - - 0.2326(0.1617) (0.4982) (1.4746)
a(Qc)(SQ) 0.0319 0.0292 - - 0.1710(9.4927) (4.1997) (6.0260)
a(Qc)(D) -0.2008 -0.1169 - - 0.0794(1.9116) (1.2390) (2.1344)
a(Qc)(E) -0.5338 0.5509 - - 0.1880(3.7968) (4.4980) (5.1626)
a(Qc)(M) 0.2751 0.3351 - - 0.0190(4.2650) (5.3635) (0.9946)
a(D)(SQ) -0.0316 0.0862 0.0972 0.1290 0.0117(0.3699) (0.9853) (2.0793) (1.0478) (0.1594)

a(D)(E) 0.5141 0.4598 0.4015 0.9788 0.3799(2.0282) (1.7958) (2.7186) (2.4377) (1.6409)
a(D)(M) 0.1819 0.2374 0.1653 0.2217 0.1005(1.5034) (1.8710) (1.5121) (0.7486) (0.8209)
a(E)(SQ) 1.0449 -0.1151 0.1148 0.5262 0.2549(4.8100) (0.5416) (0.6843) (1.1270) (1.4826)
a(L)(M) 0.5639 -0.0926 0.4372 1.1679 0.6205(3.0229) (0.4949) (2.8572) (2.8955) (3.3830)
(M)(SQ) 0.1849 0.0779 0.1309 0.3789 0.2041(3.7133) (1.4725) (2.9945) (3.4417) (44.0412)
R2 0.9771 0.9816 0.9707 0.8714 0.9772

112 Eli M. Noam
for pay TV subscriptions, because no CATV operation is conceivablewithout homes passed and basic subscribers. And cable systems without TV tend to be small, outmoded, unrepresentative. If one reliessolely on extrapolation, in these circumstances a method of dubiousvalidity, the calculated overall economies of scope are 2.699. No claimof validity is attached to the scope figure.
The product-specific scale elasticity measures listed above also provide another insight. Since they are the ratios of average to marginalcost, their value being generally above unity reflects marginal costs thatare below average costs. This suggests that in a hypothetical competitive environment, when subscriber prices are driven to marginal cost,total costs will not be recovered.
It is also interesting to look at the estimates for the effects of operational maturity M. This factor, it may be recalled, measures the effectsof experience in operation. We find the elasticity of costs with respect tosuch maturity to be ECM = - .01, suggesting a downward shift of thecost function with experience, with inputs and outputs held even.
It should be noted that the maturity effect M actually embodies twoseparate effects, that of experience, given a technology, and that ofchanges in the technology itself. Conceptually, it is the difference between a movement along a curve, and the shift of the curve. The separation of these effects is an item for further research.
A look at the other control variables is interesting, too. Here, we canobserve that the coefficient for density (trunk length/homes passed) hasa value of .19, with a good statistical significance. That is, costs aredeclining with density, which is an expected result, though its magnitude is not particularly great. Furthermore, cost savings decline withdensity and there are diminishing economies to density. This wouldconfirm the observation that in highly dense inner city franchise areascosts increase again.
The number of channels, E, on the other hand, is associated withincreasing cost; this, too, is as intuitively expected. Here, cost increases rise with channels, implying increasing marginal cost of channel capacity beyond the mean.
V. CONCWSION
This study of the U.S. cable industry, using 1981 data from the morethan 4,800 American cable companies, shows that economies of scale

Economies ofScale in Cable Television 113
exist in the current range of production. On the other hand, fairly smallreturns to scale are observed for the separate output measure "Homespassed," which is largely a transmission definition of output. This suggests that the cost advantages of size are not derived primarily by thetechnical distribution network, but rather by a larger operator's greaterability to package and sell his services more effectively to potentialbasic and pay subscribers.
While this paper deals with scale economies of cable, such conditionsare not the only factor pertinent to entry. Theoretically, it is for examplepossible that several rivals coexist in a market, even in the presence ofsubadditivity, if they enter into some form of oligopolistic agreement toassure their mutual survival. However. such interaction is less likelywith a single incumbent, as is the case in cable television. A hostileentry.>' on the other hand, is costly: since many of the cable companiesoperate multiple systems across the country, a hostile entry would undernormal circumstances invite retaliation or a protective price cut(Milgrom and Roberts 1982).
The likelihood of competitive entry could also be affected by sunkcost of the incumbent cable operator. Sunk cost-the difference between the ex ante cost of investment. and its ex post sale value-maypermit strategic investment behavior in order to create entry barriers(Dixit 1979; Spence 1977). It differentiates the cost of incumbents fromthose of contestants, and imposes an exit cost on a contestant. Kniepsand Vogelsang (1982) have shown that entry and a multifirm equilibrium may stiII be possible in a sunk cost situation under Cournotassumptions, provided demand is high relative to cost, but that under aBertrand behavioral assumption entry can be deterred if a sufficientlyhigh share of cost is sunk. It is not clear which of the assumptions betterreflects a hypothetical oligopolistic interaction in cable television, oreven if one can accept the simplistic assumption of invariable post-entrybehavior.P As an empirical matter, it is very hard to assess the existence
of sunk cost and to separate it from good will in cable television,although there are indications of its existence. In a sale of cable assets,the physical cable network may be acquired by other communicationcarriers as a broadband transmission facility,36 possibly as a "by-pass"to telephone companies, but such use is only beginning, and probablynot profit-generating for some time. In any event, it has been shown(Panzar and WiIlig 1977b) that competitive entry can be deterred wheresunk costs are zero, if average cost is continuously diminishing; in the
114 Eli M. Noam
presence of sunk costs this result should hold all the more.Beyond the theoretical arguments, there is also the reality of competi
tive entry, or rather the lack thereof. In practice there are no secondentrants, apart from minor cream skimming instances. Competitive cable television services (known in the industry as "overbuilds") exist inless than 50 franchises out of 4,800 and are usually caused by disputesabout the scope of the initial franchise award. Of these operations, onlythose in Allentown, Pennsylvania, and Phoenix, Arizona, are of appreciable size. (1. Smith 1984). Despite rivalry, subscriber rates in Allentown are above the national average. "Where cities have tried to spurcompetition during refranchising by inviting competitive bidding, theyhave been unable to inspire even a nibble of interest from any companies other than the incumbent operator." (Stoller 1982:36)
The rivalry among cable operators is thus primarily for the right offirst entry. Being first assures a head start and thus advantages of someeconomies of larger size; this, together with the likely existence of sunkcosts, the ability of the incumbent to cut prices fairly rapidly, andconsumers' conservative adjustment to new offerings.V violates thecriteria for actual or potential contestability.
If the estimation results are accepted, their implications are that largecable corporations have cost advantages over smaller ones when theyfunction as more than a mere distributor. Under the results, a puredistribution network with no programming or marketing role, such as apassive common carrier, is likely to have some but not large cost advantage over potential rivals. The imposition of such a pure transmissionstatus would therefore be doubly injurious to the cable television industry (which strenuously opposes it): it would not only eliminate operators' control over and profit from nontransmission activities such asprogram selection, but it would also reduce the cost-advantage protection of incumbents against entry.
On the other hand, the conclusions require a reassessment of the proseparations argument. That position, held by institutions as disparate asthe Nixon White House. and the American Civil Liberties Union, isnormally presented as one of protection against a vertical extension ofthe natural monopoly in one stage of production (transmission) upstream into other stages such as program selection.· The implications ofour estimation, however, do not support the view that such advantagesare primarily derived from a naturally monopolistic distribution stage.
Economies of Scale in Cable Television 115
Instead, the cost advantages appear to lie in the economies of scope (ofintegration) which provide cable television firms with some protectionagainst rivalry in the distribution phase of their operations by othercable entrants. There are therefore some efficiency losses in operationsassociated with a separation policy; which must be weighed against thegreater competitiveness in program supply.
Notes
1. For example, conventional commercial television, subscription television(STV), direct broadcast satellites (DBS), or multipoint distribution (MDS) (FCC19801).
2. In Community Communications Co. v. City of Boulder, (1981), the city'smoratorium on expansion had been challenged by the local cable company. "TheCity concluded that cable systems are natural monopolies. Consequently, theCity became concerned that CCC, because of its headstart, would always be theonly cable operator in Boulder if allowed to expand, even though it might not bethe best operator Boulder could otherwise obtain ..." Yet the factual issue ishotly disputed, as a dissenting judge notes: "the city's sole defense is to pretenddisingeniously and contrary to the extensive, uncontradicted testimony and thefindings of the trial judge, ... that cable television is a natural monopoly."
3. An example for the present ad hoc approach to this question is the cableplan for New York City. In that two-volume report, which recommends severalfranchise areas, the entire analysis of economies of scale consists of the following nonsequitur: "there were only twelve-of more than 4,000 operating cablesystems in the United States-which served more than 50,000 subscribers. Unquestionably, this is an acceptable minimum for the size of a franchise area.Moreover, economies of scale would also exist for smaller franchise areas."Arnold and Porter, (1982:1:135).
4. If average costs fall continuously, marginal costs are below average cost,and at a nondiscriminatory price P = MC, a cable company will operate at aloss. (Scherer 1980). If prices are regulated at a uniform level P = AC, there areno losses, but allocative inefficiency exists, since some consumers are left without service who would have been willing to pay above marginal cost. A set ofdiscriminatory prices is therefore most likely.
5. Examples of research on scale economies exist for other industries; inparticular, for electric generation, Christensen and Greene (1976), Gollop and

116 Eli M. Noam
Roberts (1981), Nerlove (1968), Belinfante (1978), Dhrymes and Kurz (1964).For telephone service, the controversy over the nature of telecommunications hassparked studies in the United States and Canada, including Vinod (1972); Sudit(1973); Dobell et al. (1972); Fischelson (1977); Eldor et al. (1979). Recentnoteworthy treatments have been Nadiri and Schankerman (1981), and Denny etal. (l981a, b). In a multi-product setting, such work has included Fuss andWaverman's (1981) study of telephone service, Caves et al. (1980). For a reviewof this and related literature, see Bailey and Friedlaender (1982).
6. More precisely, earlier attempts at cost studies of cable television havebeen chapters in two doctoral dissertations on the economics of Canadian television (Good 1974; Babe 1975), which include simple regressions of cost per sizefor several Canadian systems and which come-to conclusions that are contradictory to each other.
7. The concept of natural monopoly, introduced (with a different terminology) by John Stuart Mill (1848), and refined by Richard R. Ely (1937:628), hasbeen used as a prime argument for regulation. "Natural monopoly is traditionallythe classic case for extensive regulation" (Kaysen and Turner 1959:14-18),though others disagree (Posner 1969; Lowry 1973). Kahn, in his treatise onregulation (1971:2:119-23), properly distinguishes the case of natural monopolyfrom one of mere duplication of facilities, an insufficient condition. He describes the "critical and-if properly defined-all-embracing characteristic ofnatural monopoly (as) an inherent tendency to decreasing unit cases over theentire range of the market." Kahn lists factors that make a natural monopolylikely: large fixed investments; a fixed and essentially immovable connectionbetween suppliers and customer; a nonstorable type of service; obligation ofinstantaneous supply; wide fluctuations in demands for service. Of these, all butthe last appear to apply to cable television. Schmalensee (1979) extends thisanalysis to distribution networks and shows that continually decreasing costs oftransmission can be treated in the same way as Kahn's decreasing unit costs. Onthe regulation of natural monopolies, see Demsetz (1968), Posner (1969, 1970),and Comanor and Mitchell (1970).
8. "Unfortunately, the intuitive appeal of the subadditivity concept is counterbalanced by its analytical elusiveness ... there apparently exist no straightforward mechanical criteria that permit us to test whether or not a particular function is subadditive." (Baumol et al. 1982:170.) One insight of the multiproductanalysis is that the multiproduct firm may enjoy economies of scope with orwithout economies of scale.
9. Propositions 7D2 and 7Dl (Baumol et al. 1982:175).10. Furthermore, as Diewert (1976) has demonstrated, a Divisia index of total
factor productivity that is based on a translog function is exact rather thanapproximate. The cost function is generally superior in allowing for an endogeneity of inputs when nonconstant returns exist; Belinfante (1978). The choiceamong flexible functional forms is discussed by Berndt and Khaled (1979).
11. The imposition of w = 0 leads to a general multiproduct cost function,and this is reasonable. For the concept of homogeneity to be meaningful, all
Economies ofScale in Cable Television 117
output quantities must be able to vary, and none can be restricted to zero,obviating the need for the transform (3).
12. Without the hybrid specification, an equation of type (21) could not benumerically expressed in translog form.
13. The parameter w is found by minimizing the residual sum of squares02(W). (Madalla, 1977:315).
14. Reporting is according to local operations; national cable companies(Multiple Systems Operators, or MSOs) must therefore report their differentoperations separately.
15. These reports are likely to be fairly accurate due to cable companies'vulnerability to FCC charges of misreporting in a period in which they areactively seeking new franchises.
16. Cable franchise areas are not identical with communities, since mostcities subdivide their area into different franchise zones; subscriber size for acable operation---once one goes beyond small communities-therefore does notnecessarily correlate with community size. This holds even more for the majormedia market-size definition of population. Variations in system size are therefore not systematically related to different forms of urban governance, regulation, or number of other media outlets.
17. Cable Bureau, (1981). To assure confidentiality, financial data had beenaggregated in the publicly available FCC documents; particularly detailed subaggregations-for each state according to seven size categories, and with manysuch categories of financial information-had been made specially available tothe author.
18. On the statistical aspects of this scaling, which is widespread in translogestimations, see Denny and Fuss (1977).
19. All input prices are assumed to be independent of production level. furthermore, input prices are not controlled by cable operators. This seems unexceptional in light of the mobility of capital and labor. For programming, somemarket power will exist in the future if cable should become a dominant medium.As an advertising outlet, cable television has no particular market power. Whilesome input prices may be lower for multiple system operators, there is nosystematic relation between size and MSO status. TCI, the largest MSO in thecountry, consists primarily of small and medium wired systems.
20. The study looks into hundreds of items of equipment, different techniquesfor laying cable, etc. Its use here is for the relative distribution of capitalinvestments over time (Weinberg 1972:128).
21. The formula employed is: Current Value = Book Value X TM ; where TMis the adjustment factor
ME EJRs + I
i=O
TM = - - - - -
118 Eli M. Noam
with M = age (in years) of system; I = annual capital investment for a cableoperation in year i; R = inflation adjustment factor for years S+i of cableoperation; S = starting year. The inflation adjustment is defined such that R1980
= 1.00. R inflates the investment of earlier years, i.e .• reflects on how much aone-dollar investment in year X would cost in today's prices. No deflator/inflatordata are directly available for cable television. We therefore use those of tworelated industries, communications equipment and public utilities. Both deflatorseries are available from survey data by the Bureau of Economic Analysis, U.S.Department of Commerce. We use Weinberg (1972) to obtain the shares incapital of, first, headend, amplifiers, and customer converters, which is theweight applied to the series of communications, and second, the share of transmission system, which is the weight applied to the utilities series. The result is aweighted aggregate index. Investment figures are available before depreciation,permitting a calculation of depreciation from asset life figures (Weinberg 1972)rather than relying on divergent company depreciation accounting procedures.
22. There is no evidence that tax rates, or investment cycles, are systematically different by subscriber size.
23. There is no reason to assume that f3 is functionally related to subscribersize.
24. Such models exist since 1966 (Horrigan), and have been refined by Pogueand Saldofsky (1969), Pinches and Mingo (1973, 1975) and Altman and Katz(1976). The model used here is taken from the Kaplan and Urwitz survey (1979,table 6, model 5) which determines bond rating with a fairly high explanatorypower (R2 = .79). The financial variables used in that model are: (a) "cash flowbefore tax/interest charges; (b) long-term debt/net worth; (c) net income/totalassets; (d) total assets; (e) subordination of debt. Bond ratings ranging fromAAA (model values ~ 9) to C (:::::;; 1) can then be obtained for each observationpoint by substitution of the appropriate financial values. Bond rates are thosereported by Moody's (1981). For low ratings, no interest rates are reported by theservices. For the lowest rating (C), the values estimated by an investment bankerspecializing in cable television were used (4 percent above prime); for the nexthigher ratings, interest rates were reduced proportionally until the reported ratings were reached.
25. Usually restricted to a studio for a low budget public-access channel, andof an automated news/weather display.
26. It would be faulty to view the quantity of programs themselves as theoutputs of a cable operator rather than as inputs. Neither are they produced byoperators, as mentioned, nor are they sold on a quantity basis. Under the presently existing subscription based system of revenue generation (as opposed to theembryonic pay-per-view system), programs serve as an incentive to buy subscriptions, not as the product itself.
27. There are constraints on the operator's choice of programming; a certainnumber of channels are mandated ("must carry") of broadcasters; public access,leased access, and governmental channels. This may distort inputs.

Economies ofScale in Cable Television 119
28. Calculated by dividing total TV advertising billing (McCann-Erickson, asreported in Television Digest 1980:76a) by a number of households (Arbitron, asreported in Television Digest 1980:104a), and by viewing time. Nielsen figuresfor average weekly viewing of TV households is 42.6 hours; of cable households, 51.7 hours (A.C. Nielsen 1981): TV advertising revenues per householdviewing hour is found at close to 5.5 'cents. This figure is adjusted for cablesubscribers' viewing hours.
29. Owen and Greenhalgh (1982) similarly used "homes passed" as an output.30. The density variable can correct for different transmission requirements
(ducts in central cities; poles in suburban and rural areas). The flexible translogspecification permits a U-shaped relation of cost and density, which one wouldintuitively expect.
31. Channels are not outputs; they serve to generate the revenue producingsubscriptions. However, the specifications of the main equation permits an interpretation of channel capacity as an output.
32. There is a possibility that some cable systems are backwards or old; thetime variable "experience" can allow for the latter; to correct for the former->and to test its validity-the model was also used with all 12-channel systems(likely to be the most "backward") excluded. The results were substantiallysimilar, alleviating the concern.
33. The definition of output-specific economies of scale is particularly important in the analysis of an industry with the technological characteristics of cabletelevision, where outputs are not necessarily changed along a ray, i.e., by equalproportions. For example, if two cable companies serve an area that has previously been served by only one firm, their technical outputs "homes passed" or"channels provided" are, let us assume, as large for each separate firm as theyhad been for the monopolist. However, their outputs "basic subscribers" and"pay subscribers" are smaller than before, since they now share the market.Multifirm rivalry would normally not be substainable if product-specific economies of scale for these products existed over the range of production of the otheroutputs.
34. Most cable franchises are, by their terms, not exclusive.35. Once a more realistic variable post-entry strategic behavior is introduced,
the sustainability of a single firm monopoly is subject to a variety of assumptions.
36. In 1977 the Chase Manhattan Bank analyzed the cost differences betweentelephone and cable transmission and concluded in an intraoffice memo: "Evenwith the higher installation cost which is due to them (Manhattan Cable) havingto run cable into both sites and cable into the buildings, the cost saving over NewYork Telephone for the first year is $10,000 and $15,000 every year after. Thereare several other advantages in using Manhattan cable: 1) fast response to servicecalls, 2) use of modems with up-to-date technology, 3) very low cost for installation for any additional circuits required at these sites since buildings will becabled" (Kalba 1977).

120 Eli M. Noam
37. For example, a study commissioned by the National Cable TelevisionAssociation found that an above average proportion of customers of both subscription (i.e., pay) television (STV) and of cable television remain with theprevious system after the introduction of a new one (Pottle and Bortz 1982).