economics working paper series a multi · pdf fileeconomics working paper series . ... a...
TRANSCRIPT

1
ECONOMICS WORKING PAPER SERIES
A MULTI-MODE PARTIAL EQUILIBRIUM MODEL OF TRADE IN PROFESSIONAL SERVICES
Tamar Khachaturian
David Riker
Working Paper 2016-11-A
U.S. INTERNATIONAL TRADE COMMISSION
500 E Street SW
Washington, DC 20436
November 2016
Special thanks to Zeynep Akgul, Ross Hallren, and Martha Lawless for comments and assistance with this working paper.
Office of Economics working papers are the result of ongoing professional research of USITC Staff and are solely meant to represent the opinions and professional research of individual authors. These papers are not meant to represent in any way the views of the U.S. International Trade Commission or any of its individual Commissioners. Working papers are circulated to promote the active exchange of ideas between USITC Staff and recognized experts outside the USITC and to promote professional development of Office Staff by encouraging outside professional critique of staff research.

2
A Multi-Mode Partial Equilibrium Model of Trade in Professional Services Tamar Khachaturian and David Riker Office of Economics Working Paper 2016-11-A November 2016
ABSTRACT
We develop a partial equilibrium analysis of trade in services based on the theoretical model
with firm heterogeneity and multiple modes of supply in Helpman, Melitz, and Yeaple (2004).
We calibrate the model to the U.S. markets for architectural and engineering services and legal
services, and then we estimate the economic impact of reducing fixed costs of supplying U.S.
markets for these two types of professional services through cross-border trade and affiliate
transactions. For example, we estimate that 50 percent reductions in the fixed costs of trade in
these professional services would have large effects on the value of cross-border imports into
the U.S. market and on foreign affiliate purchases in the U.S. market but would have only small
effects on the sales of domestic producers and on overall prices of the services in the U.S.
market. The modeling framework can be easily reapplied to other national markets and other
types of services (or goods) with multiple modes of supply if industry data are available.
Tamar Khachaturian
Office of Industries, Services Division
David Riker
Office of Economics, Research Division

3
1. Introduction
Partial equilibrium modeling is a popular tool in trade policy analysis. Because of its relatively
narrow focus on particular industries, partial equilibrium analysis is especially useful for
quantifying the economic impact of industry-specific changes in trade policy. 1 Even so, partial
equilibrium models are rarely used to analyze trade in services. To address this analytical gap, we
develop a set of partial equilibrium models of trade in services.
Developing an economic model of trade in services is not simply a matter of reapplying the
standard partial equilibrium framework to a new set of products, because there are distinctive
characteristics of trade in services that need to be built into the model. First, the international
provision of services occurs through several alternative modes of supply, captured in trade
statistics such as cross-border trade and foreign affiliate transactions.2 Second, there are often
significant fixed costs of entering different national markets. Third, the services of each provider
are usually highly differentiated products. And, finally, although there are no tariffs or freight
charges on cross-border trade in services, there can be significant non-tariff barriers to trade.
The Helpman, Melitz, and Yeaple (HMY) model of cross-border trade and horizontal foreign direct
investment is well-suited for analyzing trade liberalization in services industries.3 The model
includes heterogeneity in the productivity of service providers from each country, alternative
modes for supplying foreign markets, and fixed costs that are barriers to each mode of supply.
Helpman, Melitz, and Yeaple derive closed-form solutions for the values of cross-border exports
1 In contrast, it can be challenging to capture the fine details of trade policy changes using general equilibrium models that include the entire economy but rely on highly aggregated data. 2 Cross-border trade roughly corresponds to mode 1 (cross-border supply), mode 2 (consumption abroad), and mode 4 (temporary movement of natural persons), while foreign affiliate transactions roughly correspond to mode 3 (commercial presence) in the General Agreement on Trade in Services (GATS) framework for services trade. Francois and Hoekman (2010) discuss the differences between the modes. Van der Marel and Shepherd (2013) provide evidence of inter-modal switching in trade in services. 3 Helpman, Melitz, and Yeaple did not originally apply their model to services industries. Their empirical analysis only includes manufacturing industries. Riker (2015) applies the HMY framework to services industries, but his data are not disaggregated by category of service.

4
and foreign affiliate sales, based on specific functional forms that represent consumer preferences,
trade costs, and the distribution of productivity levels across individual firms. There is a large
literature that empirically tests – and generally supports – the predictions of the HMY model,
including Girma, Kneller, and Pisu (2005) for U.K. firms, Tomiura (2007) for Japanese firms, Yeaple
(2008) for U.S. firms, and Engel and Procher (2012) for French firms.
In this paper, we use a partial equilibrium version of the HMY model to simulate the impact of trade
liberalization in two professional services industries that supply services in foreign markets
through multiple modes of delivery: architectural and engineering services and legal services. In
our specific applications, we estimate the effect of reducing fixed costs of exporting into the United
States and the incremental fixed costs of foreign affiliate provision of two categories of professional
services in the United States. We estimate that 50 percent reductions in the fixed costs of trade in
these professional services would have large effects on the value of cross-border imports into the
U.S. market and on foreign affiliate purchases in the U.S. market, but would have only small effects
on the sales of domestic producers and on overall prices of the services in the U.S. market.4 Holding
the incremental fixed costs of foreign affiliate provision constant, a 50 percent reduction in the
fixed costs of exporting into the U.S. market would increase cross-border imports by approximately
52 percent (architectural and engineering services) and 28 percent (legal services), and would
reduce average prices prevailing in the respective industries by 0.19 and 0.04 percent. Holding the
fixed costs of exporting into the United States constant, we estimate that a 50 percent reduction in
the incremental fixed costs of foreign affiliate provision would increase foreign affiliate purchases
in the U.S. by 26 percent (architectural and engineering services) and 28 percent (legal services),
and would reduce average prices prevailing in the respective industries by 0.18 and .007 percent.
4 The hypothetical 50 percent reductions in the fixed costs of trade are meant to illustrate the potential effects of liberalization and are not associated with specific policy changes that have occurred or are proposed.

5
The contribution of this paper is that it demonstrates a practical way to quantify the impact of
reducing barriers to trade in two professional services industries, using a partial equilibrium
version of the HMY model. The estimation utilizes data on all of the different modes of service
provision within an integrated modeling framework. The model’s modest data requirements also
accommodate the limitations in available data on services.
The rest of the paper is organized into six sections. Section 2 provides an overview of the
international supply of the two types of professional services. Section 3 summarizes the HMY
model. Section 4 discusses the data that we use to calibrate the parameters of the models to the U.S.
market. Section 5 reports estimates of the impact of a 50 percent reduction in fixed costs associated
with international trade in architectural and engineering services. Section 6 reports estimates of
the impact of a 50 percent reduction in fixed costs associated with trade in legal services. Section 7
draws conclusions and recommends directions for future research.
2. Trade in Architectural and Engineering Services and Legal Services
The economic models in this paper focus on U.S. inbound trade in professional services.5 The
models are based on information from the International Services database of the U.S. Bureau of
Economic Analysis (BEA) on U.S. foreign affiliate transactions and cross-border trade in 2012, by
category of service and by partner country, and data from the 2012 Economic Census on total U.S.
revenues of service providers in the United States, by category of service.6 Table 1 summarizes
these data for 2012.
In addition to this information on trade and foreign affiliate sales of architectural and engineering
services and legal services, there is considerable evidence that there are barriers to the foreign
5 The modeling framework could be easily reapplied to other national markets and other types of services with multiple modes of supply if industry data are available. 6 Grimm and Krishnan (2014) describe the BEA data.

6
provision of these services, in the U.S. market and abroad, as described below based on the OECD
Services Trade Restrictiveness Index (STRI).7 We expect that partial or complete elimination of
these barriers will have economically significant effects on both modes of supply.
2.A. Architectural and Engineering Services
Architects and engineers provide services related to the construction and design of buildings and
other infrastructure, as well as the design of industrial procedures and production processes. In
foreign markets, these services are supplied through multiple modes of delivery.8 Due to
technological advances, cross-border supply (or mode 1 supply), and specifically the digital
delivery of services, for example, supplying architectural designs or engineering plans abroad via e-
mail) is a growing area of trade, with U.S. cross-border exports and imports of architectural and
engineering services experiencing 8.7 and 10 percent average yearly growth from 2006-2014,
respectively.9 Cross-border supply is often complemented by trade in the form of “movement of
person” or mode 4 trade, when architects and engineers travel to provide services in foreign
markets. For example, architectural designs provided through cross-border delivery might also
warrant the architect visiting the project site to implement and manage the project. Finally, mode 3
trade, the supply of architectural and engineering services through the establishment of a
commercial presence (e.g., a foreign affiliate), is an alternative and possibly complementary mode
of supply, allowing companies to provide services throughout various phases of projects in host
countries. Architectural and engineering services supplied by U.S.-owned foreign affiliates (foreign
affiliate sales) grew by 14.7 percent between 2006 and 2012, while purchases from U.S. affiliates of
7 The OECD STRI reflects policies in place in 2013. 8 Unless otherwise noted, this paragraph is based on Grosso et al., (2014), 10-12. 9 BEA Interactive Data Table 2.1 (accessed September 15, 2016). These are all available years of data. BEA data on cross-border trade roughly corresponds to modes 1, 2 and 4 (cross-border supply, consumption abroad, and the presence of natural persons) while BEA data on foreign affiliate transactions roughly corresponds to mode 3 (commercial presence) in the GATS modes of supply framework for services trade. See Koncz et al., (2006), 39-40.
7
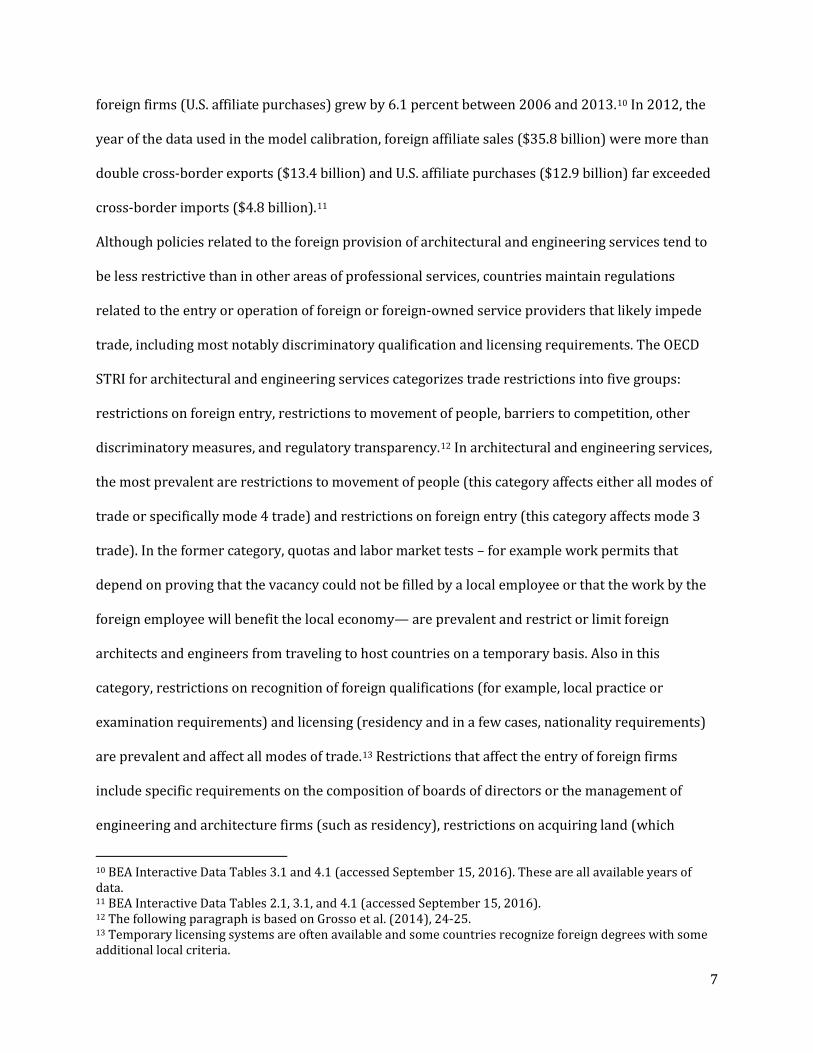
foreign firms (U.S. affiliate purchases) grew by 6.1 percent between 2006 and 2013.10 In 2012, the
year of the data used in the model calibration, foreign affiliate sales ($35.8 billion) were more than
double cross-border exports ($13.4 billion) and U.S. affiliate purchases ($12.9 billion) far exceeded
cross-border imports ($4.8 billion).11
Although policies related to the foreign provision of architectural and engineering services tend to
be less restrictive than in other areas of professional services, countries maintain regulations
related to the entry or operation of foreign or foreign-owned service providers that likely impede
trade, including most notably discriminatory qualification and licensing requirements. The OECD
STRI for architectural and engineering services categorizes trade restrictions into five groups:
restrictions on foreign entry, restrictions to movement of people, barriers to competition, other
discriminatory measures, and regulatory transparency.12 In architectural and engineering services,
the most prevalent are restrictions to movement of people (this category affects either all modes of
trade or specifically mode 4 trade) and restrictions on foreign entry (this category affects mode 3
trade). In the former category, quotas and labor market tests – for example work permits that
depend on proving that the vacancy could not be filled by a local employee or that the work by the
foreign employee will benefit the local economy— are prevalent and restrict or limit foreign
architects and engineers from traveling to host countries on a temporary basis. Also in this
category, restrictions on recognition of foreign qualifications (for example, local practice or
examination requirements) and licensing (residency and in a few cases, nationality requirements)
are prevalent and affect all modes of trade.13 Restrictions that affect the entry of foreign firms
include specific requirements on the composition of boards of directors or the management of
engineering and architecture firms (such as residency), restrictions on acquiring land (which
10 BEA Interactive Data Tables 3.1 and 4.1 (accessed September 15, 2016). These are all available years of data. 11 BEA Interactive Data Tables 2.1, 3.1, and 4.1 (accessed September 15, 2016). 12 The following paragraph is based on Grosso et al. (2014), 24-25. 13 Temporary licensing systems are often available and some countries recognize foreign degrees with some additional local criteria.

8
affects construction services directly and the architectural and engineering services indirectly), and
in some cases foreign equity restrictions for non-locally licensed architects. The remaining
restrictions affect the use of professional titles (e.g., titles of “architect” or “engineer”), prices, and
advertising architectural services.
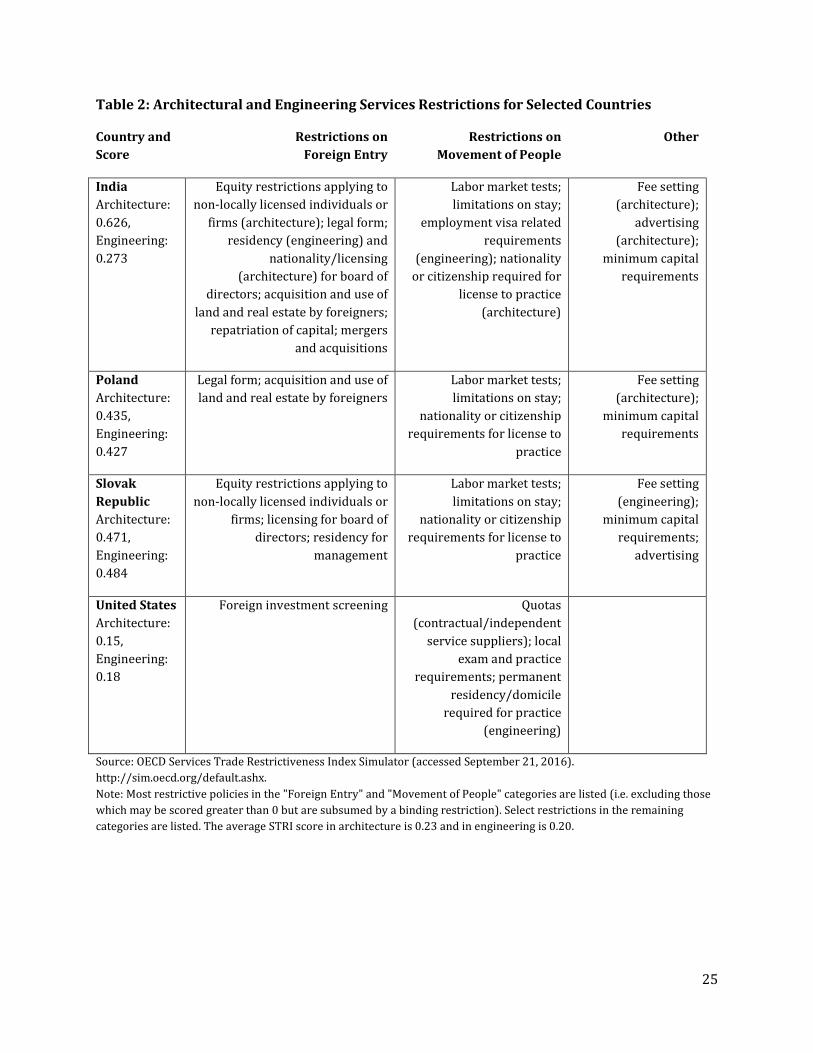
Table 2 summarizes the most restrictive measures that apply to select countries with above
average architectural and engineering services STRI scores, as well as the United States. For
example, Poland restricts allowable legal forms for architecture and engineering firms, conditions
employment and residency permits on either proving positive local impacts or that the vacancy
could not be filled locally, and maintains that providers of architectural and engineering services
must be members of national associations that, in turn, require EU citizenship. The STRI scores for
the United States are much lower than their counterparts in the other countries, and this suggests
fewer or less intense restrictions on trade in these services. 14
2.B. Legal Services
International trade in legal services typically involve foreign lawyers providing legal services in
their home country law, international law, or third country law. Host country law is normally
subject to local requalification or restricted from trade. However, with the growing significance of
foreign affiliates of law firms established abroad and supplying multi-jurisdictional advice to their
local clients’ international business dealings, providing host country law is an increasingly
important area of international trade.15 It is reported that supplying services via the establishment
of a commercial presence (mode 3) and via the movement of people (mode 4) are the preferred
modes of delivery in foreign markets.16 In 2012, U.S. cross-border exports ($8.3 billion) exceeded
foreign affiliate sales ($5.1 billion) of legal services and cross-border imports ($2 billion) exceeded
U.S. affiliate purchases ($0.13 billion) of legal services. Cross-border imports have also grown at a
14 For architectural, engineering, and legal services, the OECD STRI scores for the United States are based on policies in effect in the state of New York and may not reflect policies of other states. 15 Grosso et al. (2014), 7-8. 16 As indicated above, part of mode 4 is captured in the data on cross-border trade.

9
faster average annual rate than U.S. affiliate purchases (7.7 percent from 2006 to 2014 versus 1.8
percent from 2006 to 2013). However, foreign affiliate sales have grown at a faster average annual
rate than cross-border exports of legal services in recent years (11.9 percent from 2006 to 2013
versus 7.4 percent from 2006 to 2014).17
Policies related to the foreign provision of legal services tend to be the most restrictive among
professional services.18 The STRI for legal services is categorized into the same five groups as
architectural and engineering services. Also like architectural and engineering services, the most
prevalent are restrictions to movement of people and restrictions on foreign entry. Notably, in the
former category, nationality and/or residency requirements to practice law, along with lack of
recognition of foreign qualifications, are significant impediments and affect all modes of trade.19 In
this same category, quotas and labor market tests are also prevalent and restrict or limit foreign
attorneys from traveling to host countries on a temporary basis. When applicable, the category of
restrictions affecting foreign entry differentiates between firms practicing international versus
domestic law. For example, countries commonly restrict ownership of law firms to locally-qualified
lawyers only in domestic law practice. Other prevalent restrictions in this category include local
qualifications for a majority of the board of directors/equity partners/managers and limits on
commercial association between locally and non-locally licensed attorneys.20 Restrictions in other
categories relate to fee-setting and advertising.
Table 3 presents the most restrictive measures that apply to select countries with above average
legal services STRI scores, as well as the United States. In the two cases where trade is completely
17 BEA Interactive Data Tables 2.1, 3.1, and 4.1 (accessed September 15 and 22, 2016). These are all available years of data. 18 The following paragraph is based on Grosso et al. (2014), 9-10 and OECD (2016), 2. 19 Some countries have implemented limited-licensing schemes which circumvent the necessity to be licensed in the host country and allow foreign attorneys to practice in their qualified areas of law (typically known as foreign legal consultants). Temporary practice rules adopted by some jurisdictions are considered an additional avenue for foreign attorneys to be able to practice law. 20 Restrictions on commercial association can impede the ability of foreign firms to partner with or employ local lawyers as an avenue to provide host country law to their clients, without the need to requalify in local markets.

10
restricted, nationality or residency restrictions apply to either or both domestic and international
law practice and a temporary licensing system is not in place. In India, which has one of the most
restrictive scores, legal services can only be provided by Indian citizens. Foreign law firms are not
permitted to establish businesses and non-locally licensed attorneys cannot invest in law firms in
India. Additionally, Indian law firms cannot commercially associate or partner with non-locally
licensed attorneys and foreign law firms cannot hire local attorneys for the purpose of providing
host country legal advice. Again, the STRI score for the United States is much lower than for
counterparts in the other countries, and this suggests fewer or less intense restrictions on trade in
these services.21
3. HMY Framework
In this section, we derive an economic model of foreign affiliate sales and cross-border exports of
services, based on a partial equilibrium version of the HMY framework.22 Then we derive formulas
for calculating the impact of reducing the fixed costs of trade in these services.
Each of the partial equilibrium models is narrowly focused on a single category of services. Labor is
the only factor of production and, following Helpman, Melitz, and Yeaple (2004), we assume that
the wages in each country are equalized by international trade in other sectors of the economy, and
to simplify the notation, we set these wages equal to one in all countries.23 Providers of the services
vary in their productivity. There are jn firms headquartered in each country j , and the unit labor
requirement of each firm, a , is drawn from a distribution with cumulative distribution function
( )G a . The firms provide services that are differentiated from the services provided by other firms 21 See above footnote 14. 22 For the purposes of the model, cross-border exports refer to all trade that does not involve setting up a foreign affiliate. 23 It is straightforward to relax this simplifying assumption about wages while still treating wages as exogenous variables in the partial equilibrium model, though this complicates the notation and increases the data requirements of the model.

11
within their category, and they engage in monopolistic competition. The parameter ε is the
constant elasticity of substitution between different varieties of services within the category.
The HMY model includes three costs of serving a foreign market. The first is a variable cost of cross-
border exports from country i to country j , ijτ , that has an iceberg form. This is an ad valorem
trade cost that increases the marginal cost of supplying market j across the border by
( )1 100ijτ − × percent. The second is a fixed cost of exporting from country i to country j , equal to
Xijf units of labor. The third is a fixed cost incurred when a firm from country i establishes a
foreign affiliate in country j . Following Helpman, Melitz, and Yeaple (2004), we represent this
third cost in terms of the incremental fixed cost of foreign affiliate sales relative to cross-border
exports.24 This incremental fixed cost is equal to Pijf units of labor. The model also includes fixed
costs of producing in country j to supply the domestic market, equal to Djf units of labor.
Equation (1) represents the profits of a firm with unit labor requirement a in country j from
serving its domestic market.
( ) ( )1
111
j jDj Dja E P a f
εε επ β
ε ε
−− = − −
(1)
Following the notation in Helpman, Melitz, and Yeaple (2004), jE represents the aggregate
expenditure level in country j , β is the constant expenditure share of the services category, and
jP is a CES price index for the services category in country j .25
Equation (2) is the profits of a firm in country i from exporting its service to country j .
24 This is the cost of establishing foreign affiliate production, in excess of the cost of gaining market access. 25 The HMY framework assumes that there are constant expenditure shares, corresponding to Cobb-Douglas preferences across categories of services.
12
( ) ( ) ( )1
1 111
j jXij ij Xija E P a f
εε εεπ β τ
ε ε
−− − = − −
(2)
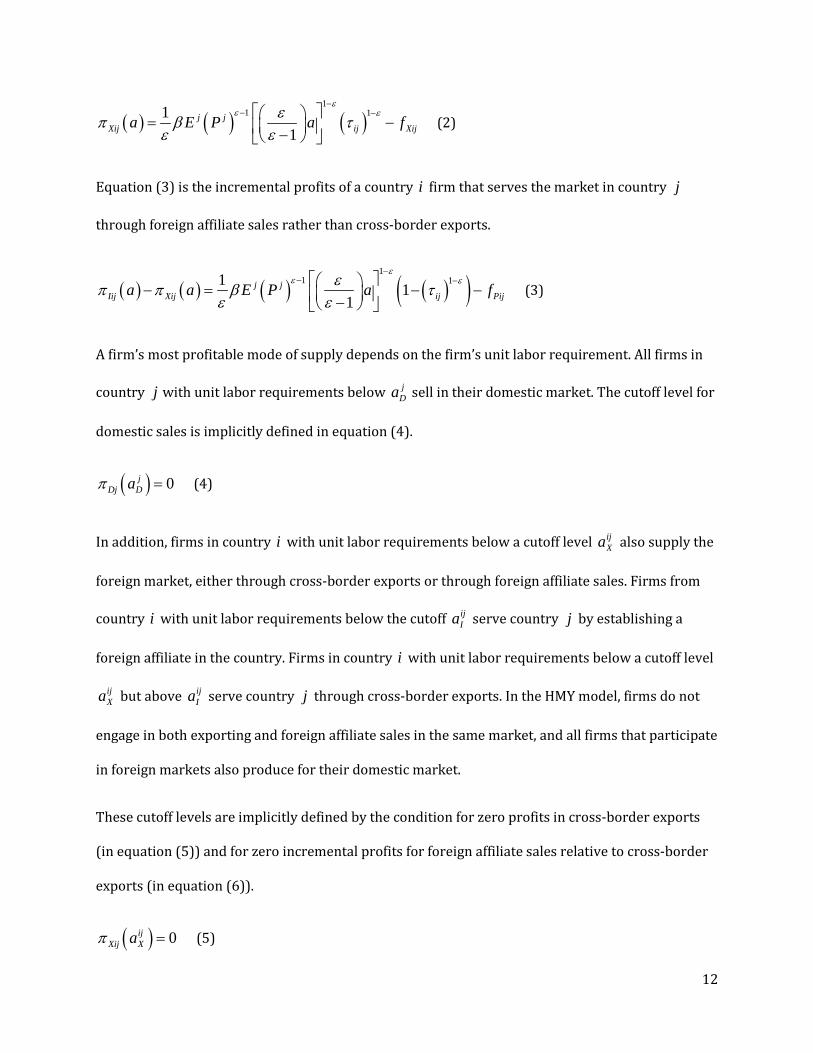
Equation (3) is the incremental profits of a country i firm that serves the market in country j
through foreign affiliate sales rather than cross-border exports.
( ) ( ) ( ) ( )( )1
1 11 11
j jIij Xij ij Pija a E P a f
εε εεπ π β τ
ε ε
−− − − = − − −
(3)
A firm’s most profitable mode of supply depends on the firm’s unit labor requirement. All firms in
country j with unit labor requirements below jDa sell in their domestic market. The cutoff level for
domestic sales is implicitly defined in equation (4).
( ) 0jDj Daπ = (4)
In addition, firms in country i with unit labor requirements below a cutoff level ijXa also supply the
foreign market, either through cross-border exports or through foreign affiliate sales. Firms from
country i with unit labor requirements below the cutoff ijIa serve country j by establishing a
foreign affiliate in the country. Firms in country i with unit labor requirements below a cutoff level
ijXa but above ij
Ia serve country j through cross-border exports. In the HMY model, firms do not
engage in both exporting and foreign affiliate sales in the same market, and all firms that participate
in foreign markets also produce for their domestic market.
These cutoff levels are implicitly defined by the condition for zero profits in cross-border exports
(in equation (5)) and for zero incremental profits for foreign affiliate sales relative to cross-border
exports (in equation (6)).
( ) 0ijXij Xaπ = (5)

13
( ) ( ) 0ij ijIij I Xij Ia aπ π− = (6)
According to Helpman, Melitz, and Yeaple (2004), i ij ijD X Ia a a> > . The most productive firms
establish foreign affiliates, while the least productive firms only serve their domestic market.
Equations (1) through (6) imply that the relative cutoff levels are determined by all four types of
costs.
11 1ij
XijXj
D Dj ij
faa f
ε
τ
− =
(7)
( )( )1
11 1 11ij
PijIijj
D Dj
faa f
ε ε ετ− − −
= −
(8)
We assume that the magnitudes of the different types of fixed costs ensure that ij ij iI X Da a a< < .
Equations (9), (10), and (11) represent the equilibrium value of foreign affiliate sales ( ijA ), cross-
border exports ( ijX ), and domestic shipments ( jS ) that are associated with the cutoff unit labor
requirements defined by equations (4), (5) and (6).
( ) ( )1
1 1
0
1
ijIa
j jij iA n E P a dG a
εε εεβ
ε
−− − = − ∫ (9)
( ) ( ) ( )1
1 1 1 1
ijX
ijI
aj j
ij i ija
X n E P a dG aε
ε ε εεβ τε
−− − − = − ∫ (10)
( ) ( )1
1 1
0
1
jDa
j jj jS n E P a dG a
εε εεβ
ε
−− − = − ∫ (11)

14
Equation (12) is the country j CES price index for the category of services.
( ) ( ) ( ) ( )
11
11 1 1
0 0 01
hj hj jI X Da a a
jh h hj j
h j h j
P n a dG a n a dG a n a dG aε
εε ε εε τε
−−− − −
≠ ≠
= + + − ∑ ∑∫ ∫ ∫ (12)
The variable h in equation (12) is an index of all countries other than j .
If the productivity of individual firms has a Pareto distribution with shape parameter 1 0k ε> − > ,
as in Helpman, Melitz, and Yeaple (2004), then ( ) ( ) ( ) ( ) ( ) ( )( )2
1
1 112 11
ck k
c
ka dG a c ck
ε εε
ε− − − −− = −
− −∫
for a lower boundary 1c and an upper boundary 2c . In this case, we can rewrite equations (9)
through (12) in terms of the cutoff levels jDa , ij
Xa , and ijIa .
( ) ( ) ( ) ( )1
1 1
1 1kj j ij
ij i IkA n E P a
k
εε εεβ
ε ε
−− − − = − − −
(13)
( ) ( ) ( ) ( ) ( ) ( ) ( )( )1
1 1 11
1 1k kj j ij ij
ij i ij X IkX n E P a a
k
εε ε εε εβ τ
ε ε
−− − − − −− = − − − −
(14)
( ) ( ) ( ) ( )1
1 1
1 1kj j j
j j DkS n E P a
k
εε εεβ
ε ε
−− − − = − − −
(15)
( ) ( ) ( ) ( ) ( ) ( ) ( ) ( )( ) ( ) ( )1 1
1 11 1 1 11
1 1k k k kj hj hj hj j
h I h hj X I j Dh j h j
kP n a n a a n ak
ε εε ε ε εεε τε ε
− −− − − − − − − −−
≠ ≠
= + − + − − − ∑ ∑ (16)
We can further rewrite equations (13) through (16) in terms of the relative cutoff levels ijIj
D
aa
and
ijXj
D
aa
.

15
( )1
kij
j Iij i j
D
aA n Za
ε− −
=
(17)
( )( ) ( )1 1
1
k kij ijj X I
ij i ij j jD D
a aX n Za a
ε εε
τ− − − −
− = − (18)
jj jS n Z= (19)
To simplify the notation in equations (17) through (19), we defined the common term
( )
( )( ) ( ) 1
1 1 11
k k khj hj hjj j I X I
h h hj jj j jh j h jD D D
a a aZ E n n na a a
ε ε εε
β τ
−− − − − − −
−
≠ ≠
= + − + ∑ ∑ (20)
Finally, we can substitute equations (7) through (8) into equations (17), (18), and (20).26
( )
( )( )( )
111 1 1 1
kk
Pijjij i ij
Dj
fA n Z
f
εεε ε ετ
− −− −
− − − = −
(21)
( )( ) ( ) ( )
( )( )( )
1 11 11 11 1 11 1
k kk k
Xij Pijjij i ij ij
Dj ij Dj
f fX n Z
f f
ε εε εε εε ε ετ τ
τ
− − − −− − − −
− −− − −
= − −
(22)
( )
( )( )( )
( )( ) ( ) ( )
( )( )( )
11 1 1
11 11 1 11 1 11 11 1 1
k k kkk k
Pij Xhj Phjj jh hj h hj hj j
h j h jDj Dj hj Dj
f f fZ E n n n
f f f
ε ε εεε εε ε εε ε εε εβ τ τ τ
τ
−− − − − − −
− −− − − −− − −− − −− −
≠ ≠
= − + − − +
∑ ∑
(23)
26 Equation (19) still applies.

16
Finally, we calculate the impact of reducing the two types of fixed costs of trade on foreign affiliate
sales, cross-border exports, domestic sales, and prices in country j by totally differentiating the
equations of the model. 27 The notation V̂ represents the proportional change in variable V .
( ) ( )( )1 1 ˆ ˆ ˆIA P k aε ε= − + − − (24)
( ) ( )( ) ( )
( )
( )
1
1 1
11 1
1
ˆ ˆ
1
ˆ ˆ
k
I
XX Ik k
I I
X X
aa
X P k a aa aa a
ε
ε εε ε
− −
− − − −
= − + − − − − −
(25)
( ) ( )( )1 1 ˆ ˆ ˆDS P k aε ε= − + − − (26)
( )( )
( )
( ) ( )
1
1 1
1 1 11
1 1
ˆ ˆ ˆ ˆ ˆ
k
I
XA I X X X I A X Dk k
I I
X X
ak a
P m a m a m a m m aa aa a
ε
ε ε
εε
− −
− − − −
− − = + − + − − − − −
(27)
In equation (27), Xm and Am are the market shares for cross-border imports and foreign affiliates
purchases in the market. Assuming that ˆ 0,Df =
11
ˆ ˆˆI Pa f Pε
= + − (28)
11
ˆ ˆˆX Xa f Pε
= + − (29)
ˆˆDa P= (30)
27 Because these calculations focus on a single market (the United States) and aggregate all other countries, we omit the ij subscripts to simplify the notation in equations (24) through (30). In this case, A is U.S. purchases from U.S. affiliates of foreign firms, and X is cross-border imports into the U.S. market.

17
Equations (28) through (30) indicate that the reductions in the two types of fixed costs affect
market outcome through adjustments on extensive margins. There is no adjustment on the
intensive margins, because wages and variable trade costs remain constant in the partial
equilibrium framework. The participation of domestic firms, domestic affiliates of foreign firms, and
exports of foreign firms on the market adjusts to reductions in fixed costs, including induced
adjustments in the price index for the market.28 When either of the types of fixed costs decline,
there is an increase in the number of foreign firms participating in the market and a reduction in
the number of domestic firms. Since the new entrants are more productive than the firms that exit,
the price index for the market declines.
These equations provide estimates of the effects of reductions in If and Xf on foreign affiliate
purchases, cross-border imports, domestic sales, and prices in the U.S. market. The equations utilize
data on the market shares of imports to the U.S. market and foreign affiliate purchases in the U.S.
market, as well as the shape parameter of the distribution of productivities, the elasticity of
substitution among varieties, the relative magnitude of the two types of fixed costs, and the
magnitude of the variable trade costs.
4. Calibration of the Parameters of the PE Model
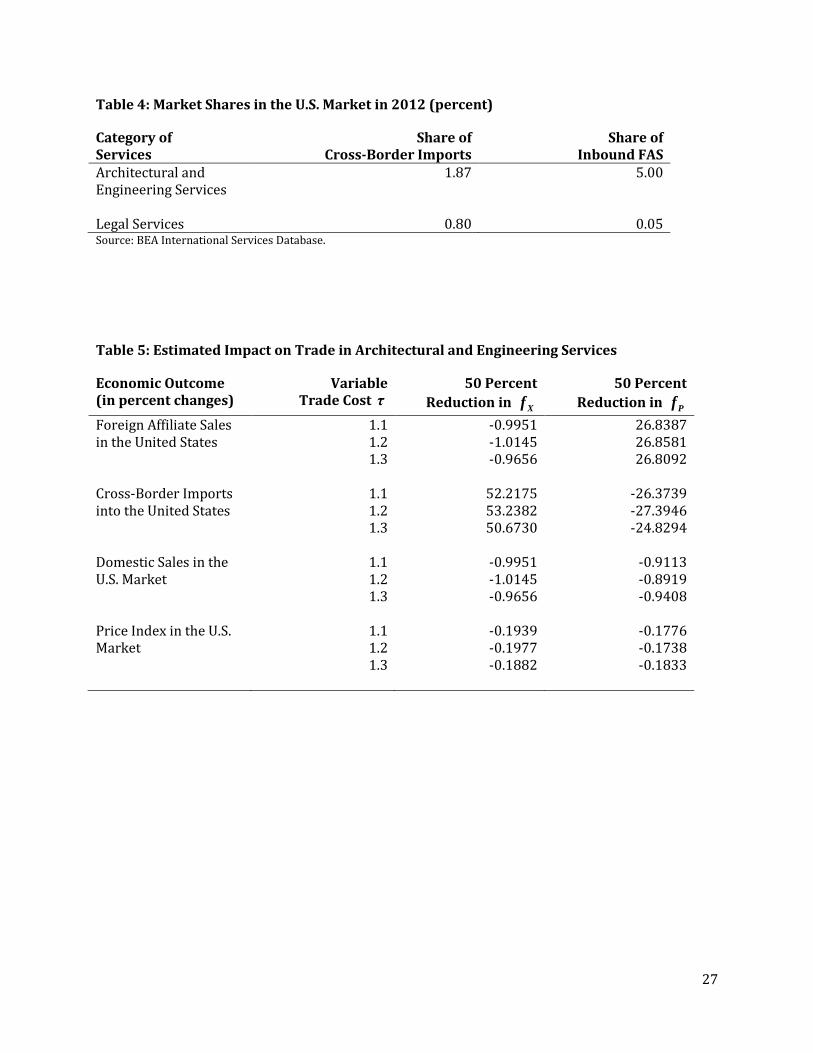
Table 4 reports the market shares for cross-border imports and foreign affiliate purchases in the
U.S. market, Xm and Am . The denominator for these share calculations, total consumption of
services in the U.S. market, is calculated as the sum of total revenue of service providers in the
28 This can be illustrated as shifts in the cutoff productivity levels in Figure 1 in Helpman, Melitz, and Yeaple (2004).

18
United States, from the 2012 Economic Census, minus cross-border exports from the United States
plus cross-border imports into the United States, from the BEA data in Table 1.29
Zhai (2008) estimates that ε (the elasticity of substitution) for all services is equal to 4.3, based on
evidence that mark-up ratios in these industries are approximately 30 percent. Di Giovanni,
Levchenko, and Rancière (2011) estimate that 1
kε −
is equal 1.155 in professional services
industries, based on a large sample of non-exporting French firms. Together, these estimates from
the literature imply the k (the shape parameter in the Pareto distribution of productivities) is
equal to 5.1315 = 1.155 * (4.3-1).
Next, we calibrate P
X
ff
for the U.S. market using the equations of the model. Equation (31) is
implied by equations (21) and (22).
( )
( )( )( )
( )
( )( )
( )( )( )
11
1 1 11
111 1 1 1
1
1 1
kk
P
XAk
kkXP
X
ffm
mff
εε
ε ε εε
εεε ε ε ε
τ τ
ττ
− −− −
− − −−
− −− −− − − − −
−
= − −
(31)
Inverting equation (31),
( )( )( )
( )
( )( )
1111 11 1 111 1
k kkP A A
X X X
f m mf m m
εεεε εε ε εετ τ
τ
−−− −− − −− − − −−
= − + (32)
Finally, we estimate the effects of the reductions in fixed costs for several different values of
variable trade costs parameter, τ , ranging from 1.1 to 1.3.
29 Domestic sales of foreign-owned affiliates in the United States (or foreign affiliate purchases) are included in the Census revenue statistics.

19
5. Estimated Impact on Trade in Architectural and Engineering Services
First, we estimate the effects of reducing fixed costs of exporting to the United States (a reduction in
Xf ) and the incremental fixed costs of foreign affiliate provision in the United States (a reduction in
Pf ) on international trade in architectural and engineering services. Table 5 reports that a 50
percent reduction in Xf (holding Pf fixed) would increase cross-border imports into the United
States by approximately 52 percent. It would reduce the price index for the services category by
approximately 0.19 percent. This would benefit consumers in the United States but would also
reduce the demand for services supplied through the other modes of supply. Domestic sales and
foreign affiliates purchases in the United States would both decline by approximately 1 percent.
Separately, Table 5 reports that a 50 percent reduction in Pf (holding Xf fixed) would increase
foreign affiliate purchases of the services in the United States by 26 percent. It would reduce the
price index for the services category by approximately 0.18 percent. This would benefit consumers
in the United States but would also reduce the demand for services supplied through the other
modes. Domestic sales in the United States would decline by approximately 1 percent, and cross-
border imports would decline by approximately 26 percent.
The effects of simultaneously reducing both types of fixed costs is simply the sum (or net) of the
effects in the two columns for each row in Table 5, because the estimated impacts are based on
linear equations (24) through (30). In this case, there would be a net increase in foreign affiliate
purchases and cross-border imports and a net decrease in domestic sales and the price index for
the range of values of τ that we considered.

20
6. Estimated Impact on Trade in Legal Services
Finally, we estimate the effects of reducing fixed costs of exporting to the United States (a reduction
in Xf ) and the incremental fixed costs of foreign affiliate provision in the United States (a reduction
in Pf ) on international trade in legal services. Table 6 reports that a 50 percent reduction in Xf
(holding Pf fixed) would increase cross-border imports into the United States by approximately 28
percent. It would reduce the price index for the services category by approximately 0.04 percent.
This would benefit consumers in the United States but would also reduce the demand for services
supplied through the other modes. Domestic sales and foreign affiliate purchases in the United
States would both decline by 0.23 percent.
Separately, Table 6 reports that a 50 percent reduction in Pf (holding Xf fixed) would increase
foreign affiliate purchases of the services in the United States by approximately 28 percent. It will
reduce the price index for the services category by approximately 0.001 percent.30 This would
benefit consumers in the United States but would also reduce the demand for services supplied
through the other modes. Domestic sales in the United States would decline by approximately 0.007
percent, and cross-border imports would decline by approximately 0.8 percent. The smaller effects
in table 6 reflect the very small share of foreign affiliate purchases and cross-border imports into
the U.S. market for legal services, as reported in table 4. In fact, all of the differences in the estimates
in table 6, relative to table 5, are due to the differences in these market shares.
7. Conclusions
This paper extends conventional partial equilibrium models used in trade policy analysis to address
trade in services, rather than trade in goods, and to incorporate alternative modes of supplying 30 This small effect reflects the very small share of foreign affiliate sales in the U.S. market for legal services, as reported in table 4.
21
services to foreign markets. The HMY model provides an excellent framework for this analysis, with
its tractable equations and reasonable data requirements.
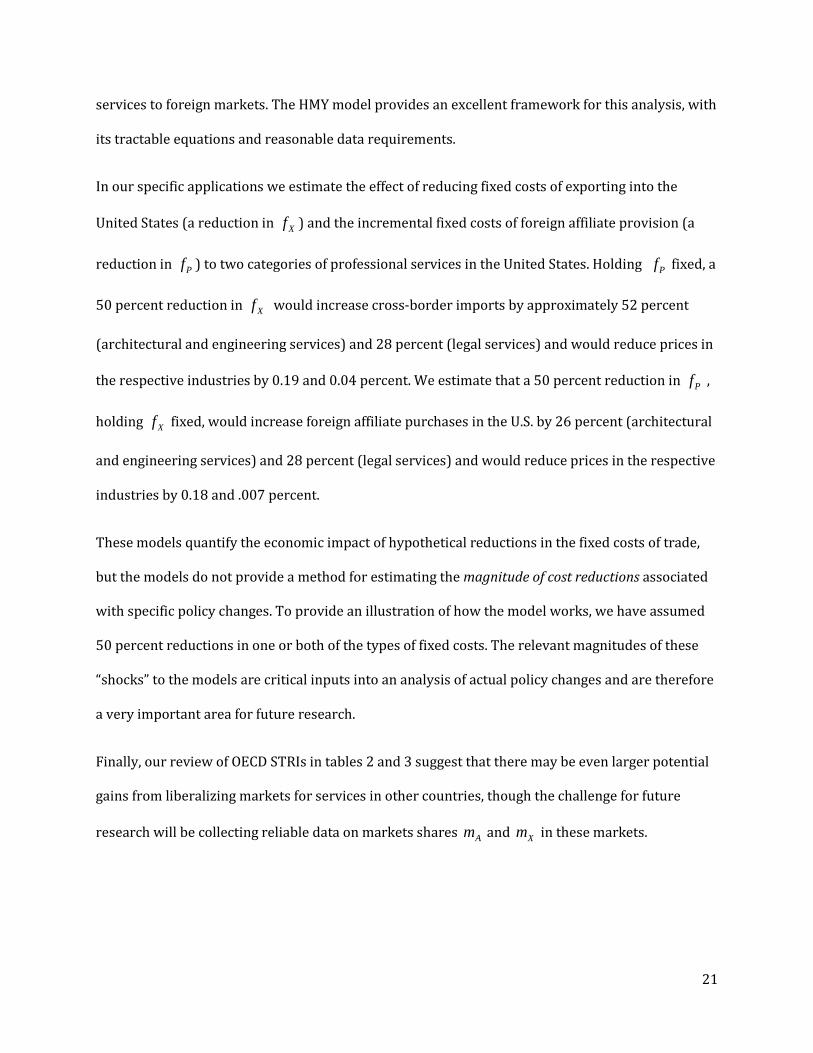
In our specific applications we estimate the effect of reducing fixed costs of exporting into the
United States (a reduction in Xf ) and the incremental fixed costs of foreign affiliate provision (a
reduction in Pf ) to two categories of professional services in the United States. Holding Pf fixed, a
50 percent reduction in Xf would increase cross-border imports by approximately 52 percent
(architectural and engineering services) and 28 percent (legal services) and would reduce prices in
the respective industries by 0.19 and 0.04 percent. We estimate that a 50 percent reduction in Pf ,
holding Xf fixed, would increase foreign affiliate purchases in the U.S. by 26 percent (architectural
and engineering services) and 28 percent (legal services) and would reduce prices in the respective
industries by 0.18 and .007 percent.
These models quantify the economic impact of hypothetical reductions in the fixed costs of trade,
but the models do not provide a method for estimating the magnitude of cost reductions associated
with specific policy changes. To provide an illustration of how the model works, we have assumed
50 percent reductions in one or both of the types of fixed costs. The relevant magnitudes of these
“shocks” to the models are critical inputs into an analysis of actual policy changes and are therefore
a very important area for future research.
Finally, our review of OECD STRIs in tables 2 and 3 suggest that there may be even larger potential
gains from liberalizing markets for services in other countries, though the challenge for future
research will be collecting reliable data on markets shares Am and Xm in these markets.

22
References Borchert, Ingo, Batshur Gootiiz, and Aaditya Mattoo (2014): “Policy Barriers to International Trade in Services: Evidence from a New Database.” World Bank Economic Review 28: 162-188.
Di Giovanni, Julian, Andrei A. Levchenko, and Romain Rancière (2011): “Power Laws in Firm Size and Openness to Trade: Measurement and Implications.” Journal of International Economics 85: 42-52.
Engel, Dirk and Vivien Procher (2012): “Export, FDI and Firm Productivity.” Applied Economics 44: 1931-1340.
Francois, Joseph and Bernard Hoekman (2010): “Services Trade and Policy.” Journal of Economic Literature 48: 642-692.
Girma, Sourafel, Richard Kneller, and Mauro Pisu (2005): “Exports versus FDI: An Empirical Test.” Review of World Economics/WeltwirtschaftlichesArchiv 141(2): 193-218.
Grimm, Alexis N. and Charu S. Krishnan (2014): “International Services: Trade in Services in 2013 and Services Supplied through Affiliates in 2012.” Survey of Current Business, October, 1-25.
Grosso, Geloso M., et al. (2014): "Services Trade Restrictiveness Index (STRI): Construction, Architecture and Engineering Services." OECD Trade Policy Papers, No. 170, OECD Publishing, Paris.
Grosso, Geloso M., et al. (2014): "Services Trade Restrictiveness Index (STRI): Legal and Accounting Services". OECD Trade Policy Papers, No. 171, OECD Publishing, Paris.
Helpman, Elhanan, Marc J. Melitz, and Stephen R. Yeaple (2004): “Export Versus FDI with Heterogeneous Firms.” American Economic Review 94(1): 300-316.
Koncz, Jennifer, Michaell Mann, and Erin Nephew (2006): “U.S. International Services: Cross-Border Trade in 2005 and Sales Through Affilates in 2004.” Survey of Current Business, October, 18-74.
Markusen, James (2002): Multinational Firms and the Theory of International Trade. Cambridge and London: MIT Press.
Melitz, Marc J. (2003): “The Impact of Trade on Aggregate Industry Productivity and Intra-Industry Reallocations.” Econometrica 71: 1695-1725.
OECD (2016): “STRI Sector Brief: Legal Services.”
Riker, David (2015): “The Impact of Restrictions on Mode 3 International Supply of Services.” Journal of International and Global Economic Studies 8(1): 1-20.
Tomiura, Eiichi. (2007): “Foreign Outsourcing, Exporting, and FDI: A Productivity Comparison at the Firm Level.” Journal of International Economics 72: 113-127.

23
Yeaple, Stephen R. (2009): “Firm Heterogeneity and the Structure of U.S. Multinational Activity.” Journal of International Economics 78: 206-215.
Van der Marel, Erik and Ben Shepherd (2013): “Services Trade, Regulation and Regional Integration: Evidence from Sectoral Data.” World Economy 36: 1393-1405.
Zhai, Fan (2008): “Armington Meets Melitz: Introducing Firm Heterogeneity in a Global CGE Model of Trade.” Journal of Economic Integration 23(3): 575-604.

24
Table 1: U.S. Trade in Certain Professional Services in 2012 (in billions of US dollars)
Category of Services
Cross-Border Exports
Cross-Border Imports
Outbound FAS
Inbound FAS
Architectural and Engineering Services
13.411 4.807 35.780 12.874
Legal Services 8.280 2.033 5.125 0.134
Source: BEA International Services Database.
25
Table 2: Architectural and Engineering Services Restrictions for Selected Countries
Country and Score
Restrictions on Foreign Entry
Restrictions on Movement of People
Other
India Architecture: 0.626, Engineering: 0.273
Equity restrictions applying to non-locally licensed individuals or
firms (architecture); legal form; residency (engineering) and
nationality/licensing (architecture) for board of
directors; acquisition and use of land and real estate by foreigners;
repatriation of capital; mergers and acquisitions
Labor market tests; limitations on stay;
employment visa related requirements
(engineering); nationality or citizenship required for
license to practice (architecture)
Fee setting (architecture);
advertising (architecture);
minimum capital requirements
Poland Architecture: 0.435, Engineering: 0.427
Legal form; acquisition and use of land and real estate by foreigners
Labor market tests; limitations on stay;
nationality or citizenship requirements for license to
practice
Fee setting (architecture);
minimum capital requirements
Slovak Republic Architecture: 0.471, Engineering: 0.484
Equity restrictions applying to non-locally licensed individuals or
firms; licensing for board of directors; residency for
management
Labor market tests; limitations on stay;
nationality or citizenship requirements for license to
practice
Fee setting (engineering);
minimum capital requirements;
advertising
United States Architecture: 0.15, Engineering: 0.18
Foreign investment screening Quotas (contractual/independent
service suppliers); local exam and practice
requirements; permanent residency/domicile
required for practice (engineering)
Source: OECD Services Trade Restrictiveness Index Simulator (accessed September 21, 2016). http://sim.oecd.org/default.ashx. Note: Most restrictive policies in the "Foreign Entry" and "Movement of People" categories are listed (i.e. excluding those which may be scored greater than 0 but are subsumed by a binding restriction). Select restrictions in the remaining categories are listed. The average STRI score in architecture is 0.23 and in engineering is 0.20.

26
Table 3: Legal Services Restrictions for Selected Countries
Country and Score
Restrictions on Foreign Entry
Restrictions on Movement of People
Other
India Legal: 0.946
No foreign equity in law firms and restrictions on ownership by non-
locally licensed attorneys (both domestic and international); prohibitions on commercial association and hiring local
lawyers
Labor market tests; limitations on stay;
Citizenship required for practice (both domestic and
international law)
Advertising prohibited (non- discriminatory)
Korea Legal: 0.475
Restrictions on ownership by lawyers (Korean law firms,
domestic law); certain commercial association
restrictions; board of directors and managers must be lawyers in Korean law firms (domestic law);
local office for foreign legal consultants; repatriation of
profits
Limitation on stay; residency for foreign legal
consultants; domicile requirement for domestic
and international law; education and practice
requirements for domestic law; lack of temporary
licensing
Poland Legal: 1.000
Restrictions on ownership by non-locally licensed attorneys
(both domestic and international); legal form; certain
restrictions on commercial association; board of directors
and managers must be licensed lawyers; establishment
requirements for host country law
Labor markets tests; limitations on stay;
domicile requirements for host country law;
recognition of foreign qualifications based on
reciprocity (international law) and/or
education/practice in Poland (domestic law); lack
of temporary licensing
Advertising restrictions;
minimum capital requirements
United States Legal: 0.16
Licensing requirements for board of directors and managers
(domestic law); foreign investment screening; local office
requirements for nonresident attorneys
Quotas (contractual/independent
service suppliers); local exam requirements
(domestic law); lack of temporary licensing
Source: OECD Services Trade Restrictiveness Index Simulator (accessed September 21, 2016). http://sim.oecd.org/default.ashx. Note: Most restrictive policies in the "Foreign Entry" and "Movement of People" categories are listed (i.e. excluding those which may be scored greater than 0 but are subsumed by a binding restriction); in the case of India, many scored measures are not listed as they are not applicable since foreign law firms are not permitted to establish in India. Select restrictions in the remaining categories are listed. The average STRI score in legal services is 0.36.
27
Table 4: Market Shares in the U.S. Market in 2012 (percent)
Category of Services
Share of Cross-Border Imports
Share of Inbound FAS
Architectural and Engineering Services
1.87 5.00
Legal Services 0.80 0.05 Source: BEA International Services Database.
Table 5: Estimated Impact on Trade in Architectural and Engineering Services
Economic Outcome (in percent changes)
Variable Trade Cost τ
50 Percent Reduction in Xf
50 Percent Reduction in Pf
Foreign Affiliate Sales in the United States
1.1 1.2 1.3
-0.9951 -1.0145 -0.9656
26.8387 26.8581 26.8092
Cross-Border Imports into the United States
1.1 1.2 1.3
52.2175 53.2382 50.6730
-26.3739 -27.3946 -24.8294
Domestic Sales in the U.S. Market
1.1 1.2 1.3
-0.9951 -1.0145 -0.9656
-0.9113 -0.8919 -0.9408
Price Index in the U.S. Market
1.1 1.2 1.3
-0.1939 -0.1977 -0.1882
-0.1776 -0.1738 -0.1833

28
Table 6: Estimated Impact on Trade in Legal Services
Economic Outcome (in percent changes)
Variable Trade Cost τ
50 Percent Reduction in Xf
50 Percent Reduction in Pf
Foreign Affiliate Sales in the United States
1.1 1.2 1.3
-0.2292 -0.2282 -0.2271
27.7434 27.7423 27.7412
Cross-Border Imports into the United States
1.1 1.2 1.3
28.4257 28.2981 28.1584
-0.9116 -0.7840 -0.6443
Domestic Sales in the U.S. Market
1.1 1.2 1.3
-0.2292 -0.2282 -0.2271
-0.0066 -0.0077 -0.0088
Price Index in the U.S. Market
1.1 1.2 1.3
-0.0447 -0.0445 -0.0443
-0.0013 -0.0015 -0.0017