economics: the introduction - kopykitab. distinguish between economic and non-economic ......
TRANSCRIPT


5
ECONOMICS: THE INTRODUCTION
Key Points
1. Growth Oriented Definition
In the words of Samuelson, ‘Economics is the study of how man and societychoose, with or without the use of money, to employ scarce productive resources,which would have alternative uses, to produce various commodities over time anddistribute them for consumption now and in the future among various people.
The definition of economics which is mainly used by many of the economists:
Economics is the study of how people and society choose to employ scarceresources that could have alternative uses in order to produce various commoditiesthat satisfy their wants and to distribute them for consumption among variouspersons and groups in society.
2. Consumer – One who consumes goods and services for the satisfaction ofone’s wants.
3. Producer – One who produces goods and services for the generation ofincome.
4. Service holder – One who work for some other person and get paid for it inthe form of salary or wages.
5. Service provider- One who provides some kind of service to other forpayment.
6. Meaning of Statistics in plural sense – It is a collection of numerical facts.
7. Meaning of Statistics in Singular Sense – It deals with the collection,presentation, analysis and interpretation of quantitative information.
8. Definition of statistics in Plural Sense – It means aggregate of facts affectedto a marked extent of multiplicity of causes numerically expressed,enumerated or estimated according to reasonable standard of accuracy,collected in a systematic manner for predetermined purpose and placed inrelation to each other.
6
9. Economic activity – Activities undertaken for monetary gain or to earnincome.
10. Non -Economic activities- Activities which are not concerned with money
11. Economic activities are divided into five parts:a] Consumption b] Production c] Distribution d] Investment e] Exchange
12. Consumption: In consumption, we study wants, their origin, nature andcharacteristics and the laws governing them.
13. Production: It refers to all activities which are undertaken to produce goodsand services for generation of income and satisfaction of wants.
14. Distribution: Economic activity which studies how income generated fromthe production process is distributed among the factors of production.
15. Investment: It means the increase in the capital stock of the economy.
16. Exchange; Exchange is a process which is concerned with sale and17. Purchase of commodities.18. Data: Economic facts in terms of numbers.19. Importance of Statistics:20. Statistics is widely used in many fields.a] Importance to the Government – Statistics is used in administration and efficientfunctioning of departments. It collects data to fulfill its welfare objectives.b] Importance of Statistics in Economics:1] Statistics helps in making economic laws like law of demand andconcept of elasticity.2] It helps in understanding and solving economic problem.3] It helps in studying market structure.
(1 mark each)
Q. Define statistics.
Ans.Statistics deal with collection, presentation, analysis and interpretation of thequantitative information.
Q. Define investment.

7
Ans. It means the increase in the capital stock of the economy.Q. What is meant by distribution?
Ans. It refers to all activities which are undertaken to produce goods and servicesfor generation of income and satisfaction of wants
Q. Define the term scarcity as used in economics?
Ans.Scarcity means limited resources in relation to its demand.
(3 mark each)
Q. Economic problem is the cause of Scarcity. How? Meaning
1mark Examples 2 marks
Ans.Due to limited resources and unlimited wants,economic problem
arises. We face various form scarcity in our daily life.Examples
Q. Give the meaning of an economic activity?
Hints:Meaning (1mark), Explanation (2 marks)
Q. Distinguish between economic and non-economic activities.
Hints:Meaning(1mark) Examples (2 marks)
M.C.Q’s
Q. Which data is a statistics?
a) A cow has 4 legs.
b) Birth rate in India is 18 per thousand compared to 8 per
thousand in USA.

8
c) Ram has 200 rupees in his pocket.
Ans b)
Q. Who said “statistics may be defined as the collection,
presentation, analysis and interpretation of numerical data.”?
a) Lovitt
b) Seligman
c) Croxton and Cowden
Ans c)
Q. Who wrote ‘Principle of Economics’?
a) Adam Smith
b) Alfred Marshall
c) Prof. Samuelson
Ans b)
Chapter 2: COLLECTION OF DATAKey points1. Collection of data is the first important aspect of statistical survey.
2. Data – Information which can be expressed in numbers.
3. Two sources of data – Primary & Secondary Primary data – data collected byinvestigator himself.

9
Secondary data – data collected by someone and used by the investigator.
4. Difference between Primary and Secondary Dataa] Primary data is original data collected by the investigator while secondary datais already existing and not original.b] Primary data is always collected for a specific purpose while secondary data hasalready been collected for some other purpose.c] Primary is costlier or is more expensive whereas secondary data is lessexpensive.
5. Methods / Sources of Collection of Primary Data:a] Direct Personal Interview – Data is personally collected by the interviewer.b] Indirect Oral Investigation – Data is collected from third parties who haveinformation about subject of enquiry.c] Information from correspondents – Data is collected from agents appointed inthe area of investigation.d] Mailed questionnaire – Data is collected through questionnaire [list ofquestions] mailed to the informant.e] Questionnaire filled by enumerators – Data is collected by trained enumeratorswho fill questionnaires.f] Telephonic interviews – Data is collected through an interview over thetelephone with the interviewer.
6. Pilot Survey – Try-out of the questionnaire on a small group to find its shortcomings.Questionnaire – A list of questions with space for answers.
7. Qualities of a good questionnaire:a] A covering letter with objectives and scope of survey.b] Minimum number of questions.c] Avoid personal questions.d] Questions should be clear and simple.e] Questions should be logically arranged.
8. Difference between census method and sampling method.
Census Method1) Every unit of population studied2) Reliable and accurate results3) Expensive method4) Suitable when population is of homogenous nature

10
Sampling Method1) Few units of population are studied2) Less Reliable and accurate results3) Less expensive method4) Suitable when population is of heterogeneous nature
9. Personal Interview Method :Advantages1) Highest response rate2) Allows all types of questions3) Allows clearing doubts regarding questionsDisadvantages1) Most expensive2) Informants can be influenced3) Takes more timeMailed Questionnaire Method:Advantages1) Least expensive2) Only method to reach remote areas3) Informants can be influencedDisadvantages
1) Long response time2) Cannot be used by illiterates.3) Doubts cannot be cleared regardingquestionsTelephonic Interview Method:Advantages1) Relatively low cost2) Relatively high response rate3) Less influence on informantsDisadvantages1) Limited use2) Reactions cannot be watched3) Respondents can be influencedCensus Method – Data collected from each and every unit of population.Sample Method – Data is collected from few units of the population and result isapplied to the whole group.Universe or population in statistics – Total items under study.Sample is a section of population from which information is to be obtained.

11
Sources of Secondary Data:1. Published Source – Government publications, Semi-government publicationsetc.2. Unpublished Source – Census of India [They are collected by the organizationsfor their own record]
Sampling Methods: 1] Random sampling 2] Non-random sampling
1. Random Sampling – It is a sampling method in which all the items have equalchance of being selected and the individuals who are selected are just like the oneswho are not selected.
2. Non-random sampling – It is a sampling method in which all the items do nothave an equal chance of being selected and judgment of the investigator plays animportant role.
Types of Statistical errors:1] Sampling errors 2] Non-sampling errorsSampling Error: It is the difference between sample value and actual value of acharacteristic of a population.Non-sampling errors: Errors that accurate the stage of collecting data.Types of non-sampling errors:a] Errors of measurement due to incorrect response.b] Errors of non-response of some units of the sample selected.c] Sampling bias occurs when sample does not include some members of the targetpopulation.Census of India – It provides complete and continuous demographic record ofpopulation.National Sample Survey Organization – It conducts national surveys on socio-economic issues.Sarvekshana – Quarterly journal published by NSSO.1 mark question:1. What are the main sources of data?
Ans Primary&Secondary2. Name 2 sources of errors in data collection.Ans.: 1] Sampling errors 2] Non-sampling errors3.What is pilot survey?Ans-Pilot Survey – Try-out of the questionnaire on a small group to find its shortcomings4. Define sampling error.
12
Sampling Error: It is the difference between sample value and actualvalue of a characteristic of a population.5. Name 2 examples of secondary data.1. Published Source – Government publications, Semi-government publicationsetc.2. Unpublished Source – Census of India [They are collected by the organizationsfor their own record].
3 mark questions:1. Which of the following methods give better results and why ?a] sample b] census[Hint: depends on survey objective; census useful when population size is small]2. Which of the following errors is more serious and why?a] Sampling error b] Non sampling error[Hint: Non sampling errors are more serious as sampling errors can be minimizedby taking a larger sample]3. Distinguish between primary data and secondary data.4 mark questions:1. Which of the following methods gives better results and why?a] Census b] Sample2. Write four differences between census and sample methods.3. What are the advantages of mailing questionnaire?4. Distinguish between random and non random sampling.6 mark questions:1. Write 3 advantages and disadvantages each of indirect oral investigation.
2. Distinguish between:a] Primary data and Secondary datab] Census method and Sample method
3. Distinguish between primary data and secondary data. Which data is morereliable and why?
4. What do you mean by questionnaire? State five principles which should befollowed while drafting a good questionnaire.
5. Discuss the method of collecting data through questionnaires filled byenumerators. Also give its two merits and two demerits.
Chapter 3: Organization of Data

13
KEY POINTS
1. Classification of Data: The process of grouping data according to theircharacteristics is known as classification of data.
2. Objectives of Classification:a] To simplify complex datab] To facilitate understandingc] To facilitate comparisond] To make analysis and interpretation easy.e] To arrange and put the data according to their common
characteristics.3. Classification of Data:
a) Chronological classification:-Data are classified either in ascending or in descending order
with reference to time such as years, quarters, months,weeks etc.b) Spatial classification:-
Data are classified with reference to geographical locations suchas countries, states, cities, districts etc.
c) Qualitative classification:-Data are classified on the basis of attributes like sex, literacy,religion, education etc.
d) Quantitative classification:-Data are classified on the basis of some characteristics whichcan be measured like height, weight, age, income, marks of thestudents.
4. Statistical Series: Systematic arrangement of statistical data.Statistical Series:Individual Series and Frequency SeriesRaw data ,Individual series and Discrete Series, Continuous seriesInclusive series Exclusive seriesA. On the basis of individual units :
The data can be individually presented in two forms:i] Raw data: Data collected in original form.ii] Individual Series: The arrangement of raw data individually. Itcan be expressed in two ways.
a] Alphabetical arrangement : Alphabetical orderb] Array: Ascending or descending order.
B. On the basis of Frequency Distribution:Frequency distribution refers to a table in which observed values ofa variable are classified according to their numerical magnitude.i. Discrete Series: A variable is called discrete if the variable can
take only some particular values.

14
ii. Continuous Series: A variable is called continuous if it can takeany value in a given range.
In constructing continuous series we come across terms like:a] Class : Each given internal is called a class e.g., 0-5, 5-10.b] Class limit: There are two limits upper limit and lower limit.
c] Class interval: Difference between upper limit and lower limit.d] Range: Difference between upper limit and lower limit.e] Mid-point or Mid Value: Upper limit + Lower limit
2f] Frequency: Number of items [observations] falling within a
particular class.i] Exclusive Series: Excluding the upper limit of these classes, all the
items of the class are included in the class itself. e.g., :-
Marks 0-10 10-20 20-30 30-40Students-2 5 2 1
ii] Inclusive Series: Upper class limits of classes are included in therespective classes.
e.g.:-Marks 0-9 10-19 20-29Students 2 5 2
Open End Classes : The lower limit of the first class and upper limit ofthe last class are not given.
Marks - Below 20 , 20-30 , 30-40 , 40-50 ,50 and aboveStudents - 7 6 1 2 5
(1 mark questions):-1. What is meant by classification of data?Ans. The process of grouping data according to their characteristics is knownas classification of data.2. What is meant by discrete series?Ans. A variable is called discrete if the variable can take only some particularvalues.3. What is meant by inclusive series?
Ans. Upper class limits of classes are included in the respective classes.(3 mark questions):-
1. Distinguish between Exclusive series and inclusive series.2. Distinguish between discrete series and continuous series.
(4 mark questions):-1. Construct a frequency distribution table for the following marks of 30
students in the form of a 4 continuous series according to exclusivemethod.

15
12, 33,23 ,25 ,18 ,35, 37 ,49 ,54 ,5137, 15, 37,15 ,33 ,42, 45 ,47 ,55 ,6965, 63, 46, 29, 18, 37, 46, 59 ,29 ,35Hints: Class–Interval:0-10,10-20……
PRESENTATION OF DATA
Tabular Presentation, Diagrammatic Presentation: (i) Bar Diagramsand (ii) Pie Diagrams, Graphical Presentation: (histogram, polygonand ogive), Arithmetic line graphs (time series graph)
After data have been collected and organized, they need to be put ina compact and presentable form. Because, the presented data could bemade usable readily and are easily comprehended. There are four ways ofpresenting data such as:
1. Textual Presentation
2. Tabular Presentation
3. Diagrammatic Presentation
4. Graphic Presentation
KEY POINTS:
1. Textual Presentation: In textual presentation, data are described withintext. When the quantity of data is not too large this form of presentation ismore suitable.
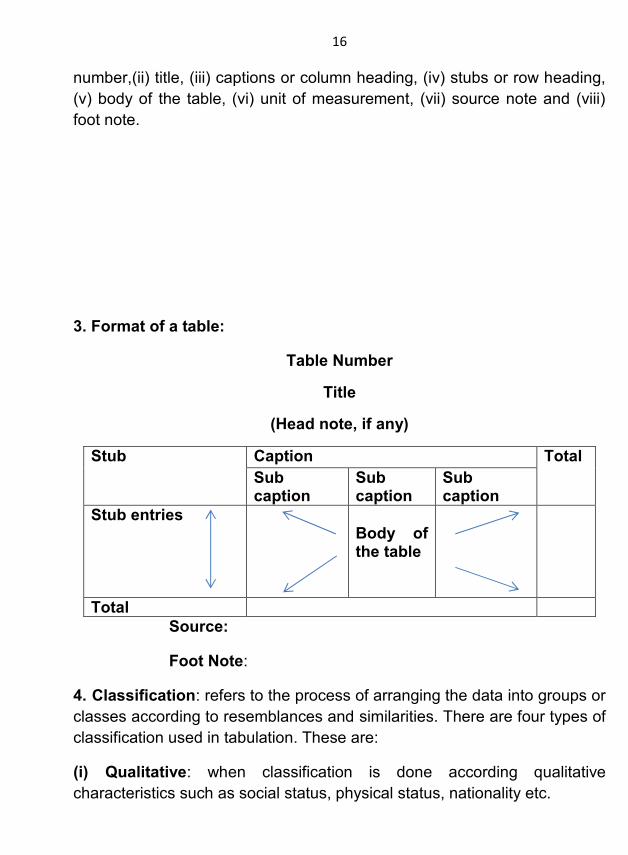
2. Tabular Presentation: refers to the process of presenting data orderly inthe form of rows and columns. The tabulated data can be easilyunderstood and interpreted. Different parts of the table are: (i) table
16
number,(ii) title, (iii) captions or column heading, (iv) stubs or row heading,(v) body of the table, (vi) unit of measurement, (vii) source note and (viii)foot note.
3. Format of a table:
Table Number
Title
(Head note, if any)
Stub Caption TotalSubcaption
Subcaption
Subcaption
Stub entriesBody ofthe table
TotalSource:
Foot Note:
4. Classification: refers to the process of arranging the data into groups orclasses according to resemblances and similarities. There are four types ofclassification used in tabulation. These are:
(i) Qualitative: when classification is done according qualitativecharacteristics such as social status, physical status, nationality etc.

17
(ii) Quantitative: the data are classified on the basis of characteristicswhich are quantitative in nature such as age, height, production, incomeetc.
(iii) Temporal: data are classified according to time such as hours, days,weeks, months,and years.
(iv) Spatial or Geographical Classification: when the data is classifiedaccording to geographical location or region such as city, districts, states orcountries etc.
5. Bar Diagram: comprises of a group of equispaced and equiwidthrectangular bars for each class or category of data. Height or length of thebars reads the magnitude of data. The lower end of the bar touches thebase line such that the height of a bar starts from the zero unit.
Types of Bar Diagrams: (i) Simple Bar Diagram, (ii) Multiple Bar Diagramand (iii) Component Bar Diagram.
6. Pie Diagram: is a component diagram, i.e., a circle whose area isproportionally divided among the components it represents. It is called apie chart. The circle is divided into as many parts as there are componentsby drawing straight lines from the centre to the circumference. Pie chartsare usually are not drawn with absolute values of a category. The values ofeach category are first expressed as percentage of the total value of all thecategories.
7. Frequency diagram: Data in the form of grouped frequencydistributions are represented by frequency diagrams like histogram,frequency polygon, frequency curve and ogive.
(i) Histogram: A histogram is a two dimensional diagram. It is a set ofrectangles with bases as the intervals between class boundaries (along X-axis) and with areas proportional to the class frequency. If the classintervals are of equal width the area of the rectangles are proportional totheir respective frequencies. A histogram is never drawn for a discretevariable/data. The difference between diagram and histogram is that thespacing and the widths of bars are all arbitrary. It is the height and not thewidth or area of the bars of the bar that really matters. In histogram no

18
space is left in between two rectangles but in bar diagram space must beleft between consecutive bars. The width of a histogram is as important asits height.
(ii) Frequency polygon: A frequency polygon is a plane bounded bystraight lines, usually four or more lines. It can be fitted to a histogram forstudying the shape of the curve. The method of drawing a frequencypolygon is to join the midpoints of the topside of the consecutive rectanglesof the histogram. Broken lines or dots may join the two ends with the baseline. The total area under the curve represents the total frequency orsample size.
(iii) Frequency curve: is obtained by drawing a smooth freehand curvepassing through the points of the frequency polygon as closely as possible.
(iv) Ogive or Cumulative Frequency Curve: As there are less than CFand more than CF, accordingly there are two ogives for any groupedfrequency distribution data. For less than ogive the CFs are plotted againstthe respective upper limits of the class intervals whereas for more thanogives the CFs are plotted against the respective lower limits of the classintervals. The intersection point of two ogives gives the median.
8. Arithmetic line or time series graph: In this graph, time is plottedalong X-axis and the value of the variable (time series data) along Y-axis. Aline graph by joining these plotted points is called arithmetic line graph. Ithelps in understanding the trend in a long term time series data.
9. False Base Line: Acut made between zero and lowest value to indicatethe value of the origin on vertical and horizontal axis is known as false baseline.
MODEL QUESTIONS WITH ANSWER:
1. Data represented through a histogram can help in finding graphically the:
(a) Median (b) Mode (c) Mean (d) All ofthese
2. Ogives can be helpful in locating graphically:

CBSE Study Material For Class 11Economics
Publisher : Faculty Notes Author : Panel Of Experts
Type the URL : http://www.kopykitab.com/product/9842
Get this eBook
50%OFF