economics revision kit by harold
TRANSCRIPT

Economics
SUBJECT NO. 3
Revision Kit
STRATHMORE UNIVERSITY
DISTANCE LEARNING CENTRE
P.O. Box 59857, 00200, Nairobi, KENYA. Tel: +254 (020) 606155 Fax: +254 (020) 607498 Email: [email protected]
Copyright ALL RIGHTS RESERVED. No part of this publication may be reproduced, stored in a retrieval system or transmitted in any form or by any means, electronic, mechanical, photocopying, recording or otherwise without the prior written permission of the copyright owner. This publication may not be lent, resold, hired or otherwise disposed of by any way of trade without the prior written consent of the copyright owner. © THE REGISTERED TRUSTEES STRATHMORE EDUCATION TRUST 1992

STRATHMORE UNIVERSITY ● REVISION KIT
ii
Acknowledgment
We gratefully acknowledge permission to quote from the past examination papers of the following bodies: Kenya Accountants and Secretaries National Examination Board (KASNEB); Chartered Institute of Management Accountants (CIMA); Chartered Association of Certified Accountants (ACCA). We would like to extend our sincere gratitude and deep appreciated to Mr. Andrew Tanui for giving his time, expertise and valuable contribution in the initial preparation of this revision kit. He holds the following academic honors, Bachelor of Arts (Economics) University of Nairobi.

iii
ECONOMICS
Contents Acknowledgment ............................................................................................................................................................. ii Part I: Introduction ....................................................................................................................................................... v
Approach To Examinations ......................................................................................................................................... vi Syllabus ....................................................................................................................................................................... vii Topical Guide to Past Paper Questions ....................................................................................................................... xi
Part II: Revision Questions and Answers ................................................................................................................... 1 Questions................................................................................................................................................................... 1 Answers ................................................................................................................................................................... 11
Part III: Comprehensive Mock Examinations ....................................................................................................... 140 Questions - Mocks ................................................................................................................................................ 140 Answers - Mocks .................................................................................................................................................. 148

STRATHMORE UNIVERSITY ● REVISION KIT
iv
Introduction v
ECONOMICS
Part I: Introduction
Although the economic orientation keeps changing, the underlying concept remains the same. This revision kit is in recognition of the fundamental principle that economics is a development and learning is a process. It is absolutely necessary to have a systematic approach to studies, right up to the examination. A proper examination strategy is required irrespective of the mode of study.
The purpose of this booklet is to assist accounting students revise economics in preparation for the
KASNEB Examinations. It is not intended to be a perfect substitute of either the Distance Learning Centre
study pack or other economics reference textbooks. This kit serves no new purpose in that a serious student
ought to look at examination papers for the past few sittings and whether compelled or not write out the
answers to some of the questions in order to gain practice in self-expression.
To assist the candidate in the mastery of the subject, the explanation of questions is devoid of any economics
jargon – the language used in explaining concepts is as simple and practical as possible, and with a view to
enabling candidates to easily articulate economic issues.
Part II consists of past examination questions and model answers. The purpose of this part is to enable a
candidate appreciate the scope required in responding to specific questions in an examination context. It also
demonstrates the variety of questions and the probable layout of the expected examination paper. The way
questions have been arranged (in each topic) is not in absolute disregard for consistency but rather with a
deliberate view to avoiding monotony while maintaining the necessary state of mental activity during revision.
Part III of the booklet consists of three sets of examination questions and model answers. It is intended to
illustrate to the candidate the type of questions likely to appear in the examination in future. Each question
paper should be done under strict examination conditions. It is not advisable to refer to these examination
papers at any time before one is duly prepared to attempt them. The scope of the model answers provided is
sufficient.

Topical guide to Past Paper Questions
STRATHMORE UNIVERSITY ● REVISION KIT
vi
Approach To Examinations
General Examination Techniques
The structure of the paper is such that it consists of eight questions and the candidate is usually required to
answer any five in exactly three hours.
On the general trend, the examiner has been deviating slightly from the common theory questions, with
much emphasis on questions of mathematical nature. However, application of the knowledge of the topics is
necessary other than just the mechanics of the calculations alone.
To be able to tackle an examination effectively, much concern should be on the following key areas:
i. A candidate must read through the whole of the question paper, noting the specific questions one is capable and expects to answer. Choice should be made wisely as it will ultimately determine the overall marks earned.
ii. Instructions must be followed – a candidate should answer what is required and not what he knows about a topic or concept.
iii. As a general rule, a candidate should divide up his time as equally as may be between all the five questions. To be time conscious, one should not spend more that 1.8 minutes (1 minute 48 seconds) per mark awarded.
iv. Where a question is of a mathematical nature, one should remember to write the formula first before actually using it to work out what is required.
v. If a question is expressly divided into separate sub-sections, each of the sub-sections must be answered separately and if the sub-sections are numbered or lettered, the answer must be numbered or lettered in the same manner. A question may be divided into phases even though numbers or letters are not used. Each part must be answered independently, and the answer must be modeled to conform to the question to avoid irrelevance.
vi. The question of presentation is the candidate’s challenge. Independent points should be explained in distinct paragraphs and the candidate’s handwriting must be legible to allow the examiner to see how the subject has been treated.
vii. In answering a question, a candidate must give as much detail as possible. As much as possible, the candidate should define concepts and preferably use diagrammatic illustrations even when it is not expressly asked for. Though it is at time possible to respond to a question in a couple of sentences this may not be sufficient.
viii. Abbreviations of technical words and other concepts or expressions may only be used subsequent to writing such words in full – for example, Marginal Rate of Technical Substitution of Labour for Capital (MRTSLK).

Introduction vii
ECONOMICS
Syllabus
PAPER NO. 3 ECONOMICS
OBJECTIVE
To develop the candidate’s understanding and ability to apply, analyse, and interpret the fundamental principles of economics in relation to the business environment both in the domestic and global economies. 3.0 SPECIFIC OBJECTIVES
A candidate who passes this subject should be able to: • understand the fundamental principles of micro and macro economics • apply basic mathematical and graphical techniques to analyze economic relationships and issues
and interpret their results • suggest possible policy related recommendations to economic problems.
CONTENT
3.1 Introduction to Economics
• Meaning and scope of economics • The methodology of economics and its basic concepts • Economic description and analysis • Economic goals and problems • Scarcity, choice, opportunity cost and production possibility frontiers and curves • Economic systems • Specialization and exchange
3.2 Elementary Theories of Demand and Supply
3.2.1 Demand analysis
• Definition and theoretical basis of demand • Factors influencing demand • Types of demand • Individual demand versus market demand • Movement along and shifts of demand curves • Exceptional demand curves 3.2.2 Supply analysis
• Definition and theoretical basis of supply • Factors influencing supply • Individual versus market supply curves • Movement along and shifts of demand curves
Syllabus
STRATHMORE UNIVERSITY ● REVISION KIT
viii
3.2.3 Determination of equilibrium price
• Interaction of supply and demand, equilibrium price and quantity • Stable versus unstable equilibrium • Effects of shifts in demand/supply on equilibrium • Application of price mechanism for example price control, producer surplus, consumer
surplus, taxes and subsidies • Equilibrium prices of a perfect competitor, monopolist and oligopolist.
3.2.4 Elasticity of demand and supply
• Definition of elasticity • Factors influencing elasticity • Measurement of elasticity for example point, arch, unitary cross • Types of elasticity, for example income elasticity • Application of elasticity in management and economic policy decisions.
3.2.5 The Theory of consumer Behaviour:
• Approaches to the theory of consumer choice-cardinal versus ordinal approach • Utility analysis, Marginal Utility (MU), Diminishing Marginal Utility (DMU) • Indifference curve analysis • Budget line and its economic interpretation • Consumer equilibrium – effects of changes in prices and incomes on consumer equilibrium • Substitution and income effects of price change • Measurement and estimation of demand functions
3.3 The Theory of Production
• Factors of pruoduction • Demand and supply of factors of production • Production function analysis • Short run analysis • Total product, average and marginal products • Stages of production and the law of variable proportions: long run analysis returns to scale,
isoquants • Technological change • Measurement and estimation of production functions • Production under conditions of perfect competition, monopolistic competition, monopoly,
and oligopoly.
3.3.1 The theory of cost
• Short run cost analysis and size of the firm: total cost, fixed cost, average cost, variable cost and marginal cost
• Long run cost analysis and economies of scale • Least cost factor combination and expansion curve
Introduction ix
ECONOMICS
3.3.2 The profit maximization and equilibrium of the firm
• Rules for profit maximization and cost minimization. • Necessary and sufficient conditions for profit maximization.
3.4 National Income
• Definition of national income • Circular flow of income • Concepts of national income; Gross Domestic Product (GDP), Net National Product
(NNP) and disposable income • Approaches to measuring national income • Problems of measurement • Uses of national income accounts and their limitations • Analysis of consumption, saving and investment and their interaction in a simple economic
model • Determination of equilibrium income • The multiplier and accelerator concepts • Fluctuations in national income and the business cycle
3.5 Money and Banking
3.6.1 Money
• The nature and functions of money • Demand and supply of money • Theories of the demand for money • The quantity theory, the Keynesian liquidity preference theory
3.6.2 The banking system • The role of Central Bank; traditional and changing role in a liberalized economy, (such as
financial sector reform, exchange rate reform) • The role of commercial banks and non-bank financial institutions in the economy • Monetary policy; definition, objectives instruments and limitations • Determination of interest rates and their effects on the level of investment, output, inflation
and employment
3.7 Labour and Unemployment
• Population size and demographic trends • The demand for and supply of labour • Wage determination, policy and theories • Trade unions and employer associations • Collective bargaining • Types and causes of unemployment • Control measures of unemployment • Relationship between unemployment and inflation.
Syllabus
STRATHMORE UNIVERSITY ● REVISION KIT
x
3.8 Public Finance
• Public expenditure • Budget surpluses and deficits – causes of budget deficits, implications on macro fundamentals • Fiscal policy; definition, objectives in a liberalized economy, tools of fiscal policy: national debt
management, budgeting and planning, fiscal reforms • Harmonization of fiscal and monetary policies: monetary – fiscal policy mix • Economic governance and transparency • Economic policy and inflation: types and causes of inflation, impact of inflation on the economy,
control measures of inflation
3.9 International Trade and Finance
• Theory of comparative advantage • Multilateral trade systems and WTO • International trade arrangements and agreements. Regional integral organizations, commodity
agreements and their relevance to Less Developed Countries (LDCs) • Balance of trade • Balance of payments • Terms of trade • Exchange rates devaluation, currency depreciation and appreciation and other balance of
payments adjustment processes • International Financial Institutions: external debt problem, structure and functions of
international financial institutions, structural adjustment Programmes (SAPs), socio-economic – political impacts of SAPs in LDCs, borrowing mechanisms from World Bank, IMF and other multilateral agencies.

Introduction xi
ECONOMICS
Topical Guide to Past Paper Questions
Below is an outline of the major topics of the syllabus and an assortment of questions that have featured in
the past CPA examinations. The questions and answers are provided in PART II of the Kit.
Topic Questions in CPA Past Papers
3.1 Introduction to Economics Questions 1 & 2
3.2 Demand, Supply and Determination of Price Questions 3, 4, 5 & 6
3.3 Elasticity of Demand and Supply Questions 7, 8, 9, 10, 11, 12 & 13
3.4 The Theory of Consumer Behaviour Questions 14, 15, 16 & 17
3.5 The Theory of Production:
Questions 18, 19 & 25
Question 21
Question 20
Question 22 & 26
Question 23 & 24
3.51 Factors of Production
3.52 Product Market (Market Structure)
3.53 Factor Market (Factor Combination)
3.54 Theory of Cost
3.55 Profit Maximization
3.6 National Income Questions 27 & 28
3.7 Money and Banking Questions 29, 30 & 31
3.8 Labour and Unemployment Question 32
3.9 Public Finance Questions 33, 34 & 35
3.10 International Trade and Finance Question 36
Note:
From the CPA sittings, there have been more questions from topics 3.3, 3.4, 3.5 and 3.6. As would be expected in any examination, there is a lot of emphasis on the above topics. These are pet topics for any examiner and the candidate is expected to be familiar with all manner of approaches to examination questions in these areas.

Revision Questions and Answers 1
ECONOMICS
Part II: Revision Questions and Answers
QUESTIONS
3.1 INTRODUCTION TO ECONOMICS QUESTION ONE Write short notes on the following fundamental concepts: a) Scarcity and Choice (5 marks) b) Opportunity cost (5 marks) c) Production possibility frontier (5 marks) d) Positive and normative economics (5 marks)
(Total: 20 marks) QUESTION TWO a) Using specific examples, explain ‘Ceteris Paribus’ as used in economics (6 marks) b) i) Why is the consumer said to be sovereign (4 marks)
ii) What factors limit this sovereignty? (10 marks)
(Total: 20 marks) 3.2 DEMAND, SUPPLY AND DETERMINATION OF (EQUILIBRIUM) PRICE QUESTION THREE a) Clearly explain the distinction between supply, demand and equilibrium price. (8 marks) b) State and briefly explain any four main factors that may cause a fall in the supply of a good in the
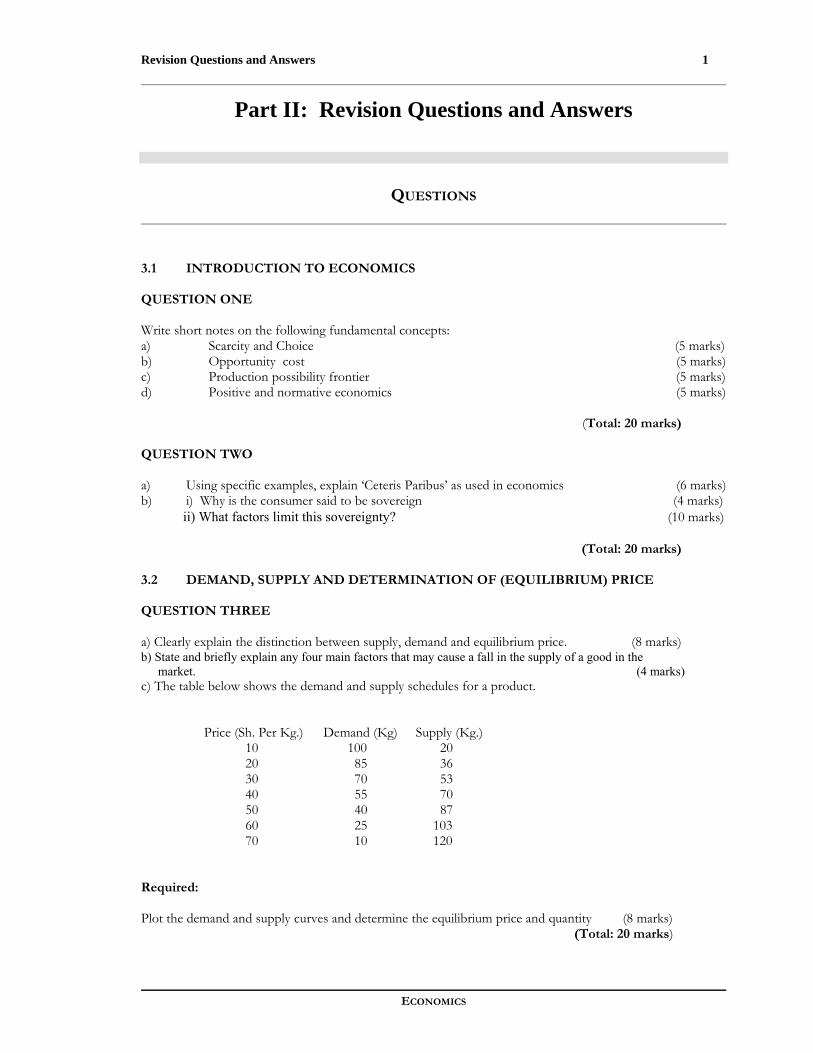
market. (4 marks) c) The table below shows the demand and supply schedules for a product.
Price (Sh. Per Kg.) Demand (Kg) Supply (Kg.) 10 100 20 20 85 36 30 70 53 40 55 70 50 40 87 60 25 103 70 10 120
Required: Plot the demand and supply curves and determine the equilibrium price and quantity (8 marks)
(Total: 20 marks)
Questions
STRATHMORE UNIVERSITY ● REVISION KIT
2
QUESTION FOUR a) Write short notes on Market Equilibrium. (6 marks)
b) Using the following demand and supply functions of a commodity x, compute the equilibrium price and quantity.
Qd = 100 - 2P Qs = 40 + 4P (4 marks) c) Ceteris paribus, use diagrams to illustrate and explain the effects on the values in (b) from: i) a fall in price of x’s substitute. (4 marks) ii) a simultaneous increase in input prices and a rise in the consumer’s income. (6 marks) (Total: 20 marks) QUESTION FIVE The following economic functions have been derived by the Finance Manager of the Kenya Tea Limited:
Qa = 3p2 – 4p and Qb = 24 – p2; where p represents price and Q is quantity
Required: a) i) Which of the two functions represents a demand curve, supply curve and why? (4 marks)
ii) At what values of price and quantity is the market in equilibrium? (6 marks)
b) Explain, with the aid of a diagram, the effect on the demand and supply functions indicated in (a) above of a simultaneous decrease in cost of production and an increase in the price of a complementary good. (10 marks)
(Total: 20 marks) QUESTION SIX
a) i. Give the meaning of the term ‘ Price Control’ (2 marks) ii. Explain the circumstances under which price control is considered necessary. (4 marks)
b) i. With the aid of well-labeled diagrams, distinguish between price floors and price ceilings. (6 marks) ii. What are the major consequences of each of the price control measures? (8 marks)
(Total: 20 marks) 3.3 ELASTICITY OF DEMAND AND SUPPLY QUESTION SEVEN
a) Distinguish between own-price elasticity of demand and cross- elasticity of demand (10 marks) b) Briefly discuss the factors which affect the own price elasticity of demand (4 marks) c) Discuss the usefulness of these parameters in management and economic policy decision-making.
(6 marks) (Total: 20 marks)

Revision Questions and Answers 3
ECONOMICS
QUESTION EIGHT
a) Define elasticity of supply and briefly explain any five factors that influence the elasticity of supply. (10 marks)
b) Explain why elasticity of supply for agricultural commodities is low. (6 marks) c) The demand for a commodity is twenty units when the prevailing market price equals eighty shillings
per unit. However, when the price per unit rises to one hundred shillings, the quantity demanded rises to thirty units.
Required: Calculate both arc and point elasticities of this commodity (4 marks) (Total: 20 marks)
QUESTION NINE
(a) (i) Define the term cross price elasticity of demand and clearly explain its value for substitutes and complementary commodities (5 marks) (ii) Use the data in the table below to compute income elasticity of demand through the arc elasticity method:
Quantity (Units)
Income (Shs)
Price (Shs)
100 5000 16 120 6000 16
(2 marks)
(b)Discuss any three practical applications of the concept of elasticity of demand in management and economic policy decision making (6 marks)
(c) (i) The demand for a commodity is five units when the price is sh. 1,000 per unit. When price per unit falls to Sh. 600 the demand rises to six units.
Compute the point and arc elasticity of demand (4 marks) (ii) State the main determinants of elasticity of demand (3 marks)
(Total: 20 marks) QUESTION TEN
a) Given that:
QX = 9 – ½ P2 QY = 8P + ½ P2
Required:
i) Identify which of the two functions is a demand and a supply function. (4 marks) ii) Compute the point elasticity of demand and the point elasticity of supply at the equilibrium position.
(6 marks) b) With the aid of diagrams, explain the importance of the concept of elasticity of supply. (10 marks)

Questions
STRATHMORE UNIVERSITY ● REVISION KIT
4
QUESTION ELEVEN Given the following table:
PX PY PZ PW QX QY QZ QW Y 10 8 12 10 30 15 20 20 1000012 8 12 10 26 15 20 20 1000014 8 12 10 22 15 20 20 1000016 8 12 10 24 15 20 20 1000016 8 12 10 26 18 18 18 1200016 10 12 10 28 16 16 18 1200016 12 12 10 30 14 16 18 1200016 12 12 12 30 14 14 21 12000
Where: PX: Price of good X QX: Quantity demanded of X PY: Price of good Y QY: Quantity demanded of Y PW: Price of good W QZ: Quantity demanded of Z PZ: Price of good Z QW: Quantity demanded of W Y: Consumer’s income Required: (a) What type of goods are X, Y, Z & W and why? (8 marks) (b) Identify substitutes and complements and justify your answer. (4 marks) (c) If there is a successful advertising campaign that convinces consumers to buy more of commodity Y, what would the effect of this be on consumption of commodities X and Z? (8 marks) (Total: 20 marks) QUESTION TWELVE
The managing director of My Kori-Lima Movie Theatre Ltd has hired you as a consultant to advise on the ticket – pricing strategy. As a basis for your recommendations you consider historical ticket sales data which seems to suggest the following ticket – sales elasticities: Own – price elasticity = -0.05 Refreshment price elasticity = -0.12 Nairobi Population elasticity = +0.65 Advertising elasticity = +0.70 (a) The managing director is contemplating a moderate increase in ticket prices in order to increase revenue.
Explain whether this is a good idea. (5 marks) (b) The managing director is also contemplating a moderate increase in the advertising budget in order to
increase revenue. Is this a good idea? Explain. (5 marks) (c) How would you characterize the relationship between tickets and refreshments? (5 marks) (d) If the population of Nairobi increased from 120,000 to 122,400 people in the next year, what would be
the resulting impact on ticket demand? Assume all other factors are held constant. (5 marks) (Total: 20 marks)

Revision Questions and Answers 5
ECONOMICS
QUESTION THIRTEEN
Given the following demand function QX = 100 – 2P2 (a) Calculate the price elasticity of demand when price is Ksh. 2 and when price is Ksh. 6 (8 marks) (b) Calculate the price elasticity of demand in the price range Ksh. 3 and Ksh. 5 (5marks) (c) If the current prevailing price is Ksh. 5 what advice would you give to the producer in order to increase
his revenue, and why? (7 marks)
3.4 THE THEORY OF CONSUMER BEHAVIOUR
QUESTION FOURTEEN
(a) Define marginal utility and clearly explain the oxiom of diminishing marginal utility. (6 marks) (b) Illustrate and explain the following:
(i) Consumer equilibrium under the cardinalist approach (7 marks) (ii) Consumer equilibrium under the ordinalist approach (7 marks)
(Total: 20 marks)
QUESTION FIFTEEN (a) (i) What is an indifference curve? (2 marks)
(ii) Explain the main characteristics of indifference curves (6 marks) (b) (i) Briefly explain two exceptions to the definition of an indifference curve. (4 marks) (ii) Explain any four uses of indifference curve analysis. (8 marks) Total: 20 marks
QUESTION SIXTEEN
(a) (i) Define an indifference curve (2 marks)
(ii) Illustrate and clearly explain the nature of indifference curves for perfect substitutes and for
complementary goods (7 marks)
(b) Explain the property of convexity to the origin of an indifference curve ( 4 marks)
(c) Using the cardinalist approach of consumer behaviour, distinguish between income and substitution
effects of a price rise for a normal good (7 marks)
(Total: 20 marks) QUESTION SEVENTEEN (a) State the law of diminishing marginal utility (2 marks) (b) If Mrs Breader views butter and margarine as perfect substitutes, draw a set of indifference curves that describe her preference for these two commodities ( 3 marks) (c) The utility (U) obtained by Olympia by consuming food (F) and shelter (S) is given by utility function U = FS
(i) Draw the indifference curves associated with utility levels of 12 and 24 utiles. (4 marks)
(ii) If food costs Sh. 100 per unit and shelter Sh. 300 per unit and Olympia’s monthly income equals Sh. 1,200 to be spent entirely on these two commodities use graphical methods to determine the Utility maximizing choice of food and shelter for this household (6 marks)

Questions
STRATHMORE UNIVERSITY ● REVISION KIT
6
(iii) Calculate the marginal rate of substitution when Olympia spends the Sh. 1,200 budget by
purchasing three units of each. (3 marks) (iv) Illustrate the effect on the optimal choice in (ii) above when Olympia’s income rises to Sh. 3,600 (2 marks) (Total: 20 marks) 3.5 THE THEORY OF PRODUCTION QUESTION EIGHTEEN
(a) What are factors of production? (6 marks) (b) Explain the meaning of mobility of factors of production. To what extent are factors of production mobile. (7 marks) (c) (i) State the aspects of significance of factor mobility (3 marks) (ii) What policy recommendations would you suggest to reduce regional development imbalances if any in developing countries? (4 marks) (Total: 20 marks) QUESTION NINETEEN
(a) What are the main factors of production? (4 marks) (b) (i) Define the term ‘production function’ (2 marks) (ii) What determines the supply and demand of the factors of production that you have identified in (a)
above? (14 marks) (Total: 20 marks) QUESTION TWENTY
(a) (i) State the law of variable proportions (2 marks) (ii) What key assumptions underlie this law? (6 marks) (b) Discuss fully the three main stages associated with the law (12 marks) (Total: 20 marks) QUESTION TWENTY-ONE
(a) What is ‘Oligopoly’? (2 marks) (b) Using a well illustrated diagram, explain why prices are ‘sticky’ downwards under an oligopolistic market structure (12 marks) (c) Using a well-illustrated diagram, show that a monopolist can make losses in the short-run even when MC = MR (6 marks) (Total: 20 marks) QUESTION TWENTY-TWO
(a) What is meant by economies and diseconomies of scale? (6 marks) (b) Write explanatory notes on the various types of internal and external economies of scale. (14 marks) (Total: 20 marks) QUESTION TWENTY-THREE
(a) Differentiate between economies of scale and returns to scale (4 marks) (b) Given a firm’s demand function Q – 90 +2P = 0 and its average cost function AC = Q2 – 8Q + 57 + 2/Q, determine the level of output which maximizes profits (NB: only the first order condition is required). (8 marks)

Revision Questions and Answers 7
ECONOMICS
(c) (i) Explain why a firm in perfect competition may continue in the production of goods which it can only sell at a loss and why it cannot continue doing this indefinitely. (4 marks) (ii) Illustrate and explain the short-run supply curve of a firm in perfect competition (4 marks) (Total: 20 marks) QUESTION TWENTY-FOUR
A monopoly firm is faced with the following demand function
P = 13 – 0.5Q The Marginal Cost function for the firm is given by 3 + 4Q and the total fixed cost is 4. Determine:
a) The profit maximizing output. (6 marks) b) The level of supernormal profit if any. (3 marks) c) The output level at the break-even point. (2 marks) A firm operating in a perfectly competitive market has to sell all its output at the price of Sh.10 per unit. Its marginal cost function is given by Q + 4 and the total fixed cost is 1. Determine:
d) The profit maximizing output level. (6 marks) e) The level of supernormal profit if any. (3 marks) (Total: 20 marks) QUESTION TWENTY-FIVE
a) Explain what is meant by the terms transfer earnings and economic rent of a factor of production.(4 marks) b) Using well labelled diagrams, illustrate cases when the total factor payments may equal to economic rent,
or transfer earnings or shared between the two. (6 marks) c) i) Briefly explain and illustrate quasi-rent. (4 marks) ii) Discuss some of the economic implications of a rising trend in the rural-urban migration and offer
policy recommendations to reverse it. (6 marks) (Total: 20 marks) QUESTION TWENTY-SIX
The total cost equation in the production of bacon at some hypothetical factory is C = 1000 + 100Q – 15Q2 + Q3 Where C = Cost measured in shillings, while Q = quantity measured in kilogrammes. a) Compute the total and average costs at output level of 10 and 11 kilogrammes. (6 marks) b) What is the Marginal cost of the 12th Kilogramme? (4 marks) c) Explain the shape and relationship between AC,AVC,MC and AFC curves using relevant diagrams.(10 marks) (Total: 20 marks)
Questions
STRATHMORE UNIVERSITY ● REVISION KIT
8
3.6 NATIONAL INCOME
QUESTION TWENTY-SEVEN
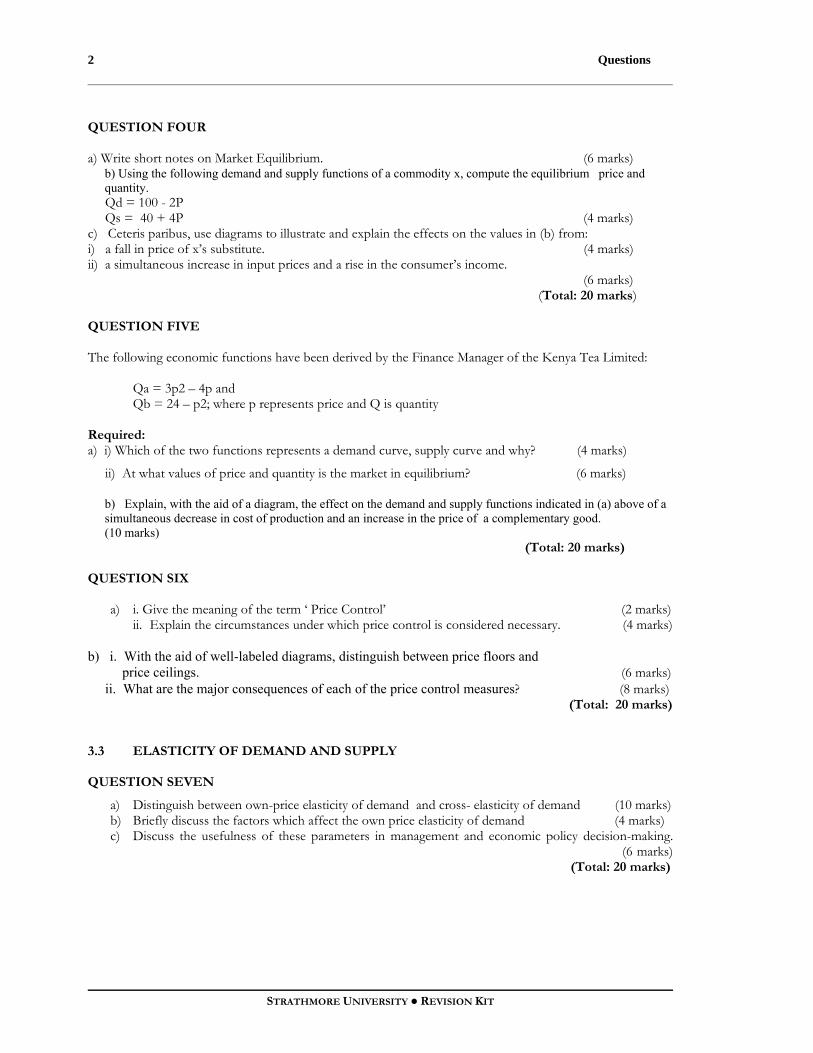
(a) Assume the following information represents the National Income Model of an ‘Utopian’ economy. Y = C + I + G C = a + b(Y – T) T = d + tY I = IO G = GO
Where a > O; O < b < 1 d > O; O < t < 1 T = Taxes I = Investment G = Government Expenditure
i) Explain the economic interpretation of the parameters a,b,d and t. (4 marks) ii) Find the equilibrium values of income, consumption and taxes. (8 marks)
b) Discuss the three approaches used in measuring the national income of a country and show why they give the same estimate. (8 marks)
(Total: 20 marks) QUESTION TWENTY-EIGHT
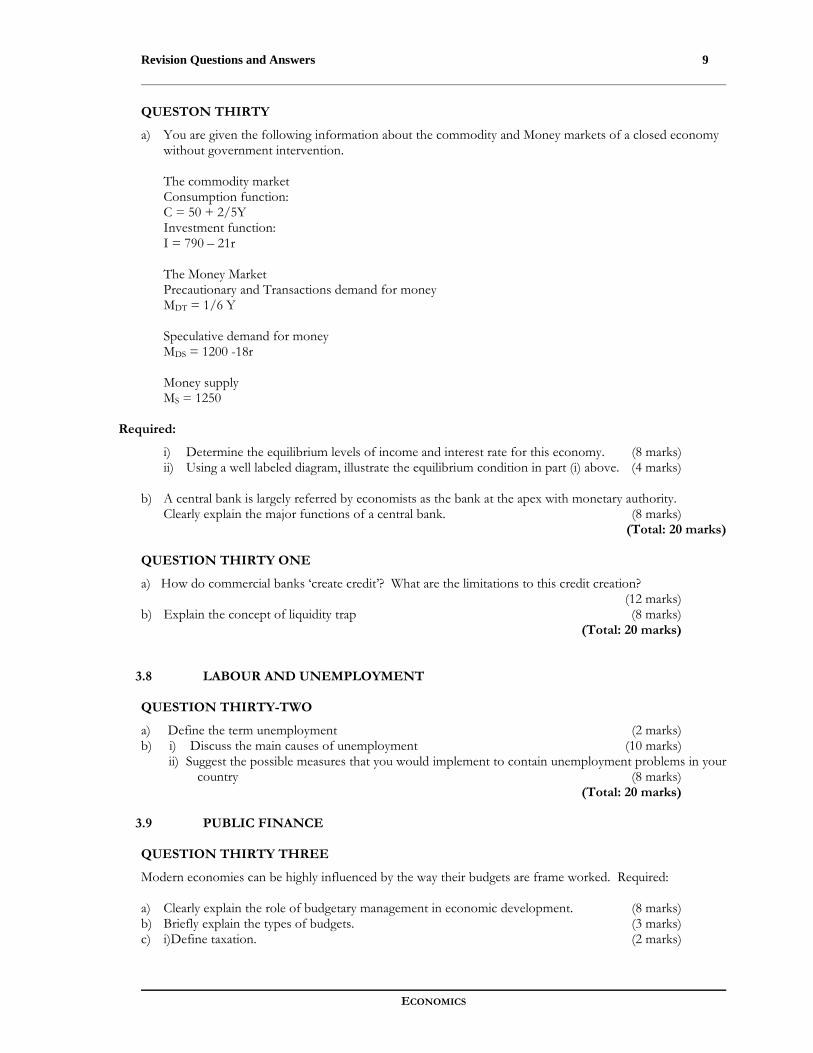
a) Why is it important to estimate National Income of a Country? What difficulties do economists encounter while carrying out such a task particularly in developing countries? (10 marks)
b) The table below represents economic transactions for country XYZ in billions of shillings: Total output Intermediate purchases Agriculture 30 10 Manufacturing 70 45 Services 55 25
Required: i) Calculate the Gross National Product of this economy using the value added approach. (3 marks) ii) If depreciation and indirect taxes equal 8 billion and 7 billion shillings respectively, find the Net Domestic
Product both at Market prices and at factor cost. (4 marks) c) Briefly explain the multiplier and accelerator principles. (3 marks)
(Total: 20 marks) 3.7 MONEY AND BANKING
QUESTION TWENTY-NINE
a) Define Money and outline its major functions. (8 marks) b) Explain the various motives of holding money. (6 marks) c) What are the likely effects of an expansionary monetary policy in an economy. (6 marks) (Total: 20 marks)
Revision Questions and Answers 9
ECONOMICS
QUESTON THIRTY
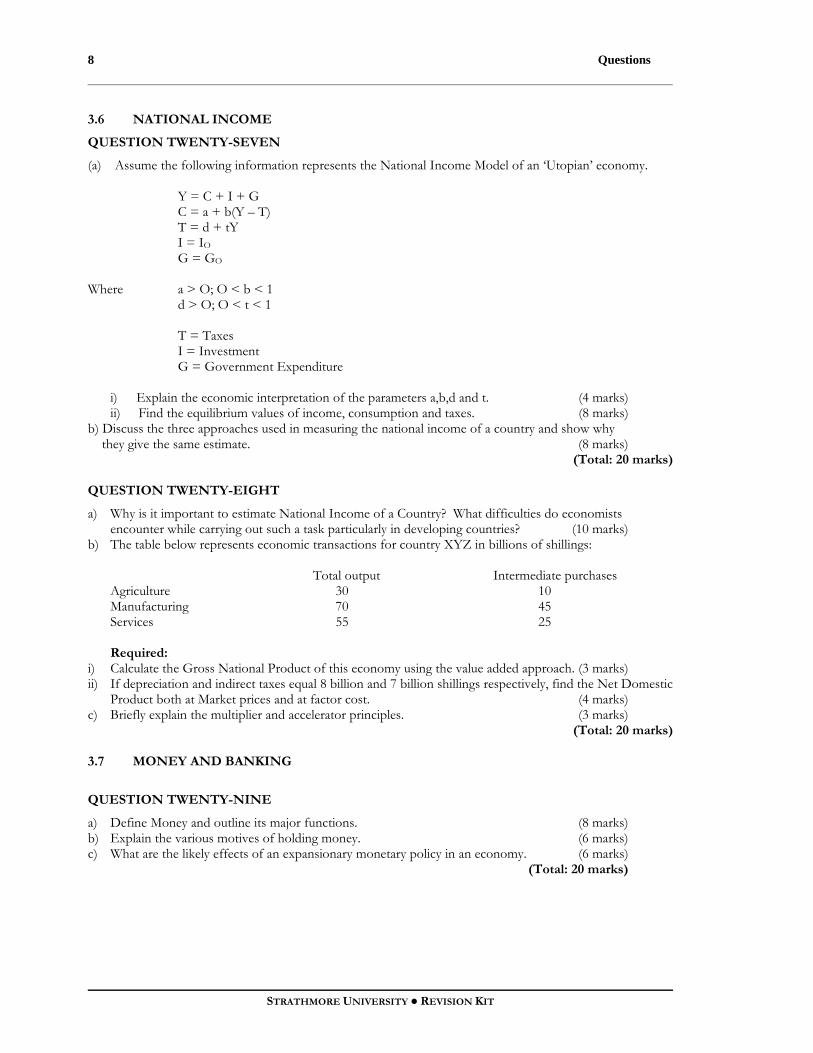
a) You are given the following information about the commodity and Money markets of a closed economy without government intervention.
The commodity market Consumption function: C = 50 + 2/5Y Investment function: I = 790 – 21r The Money Market Precautionary and Transactions demand for money MDT = 1/6 Y Speculative demand for money MDS = 1200 -18r Money supply MS = 1250
Required:
i) Determine the equilibrium levels of income and interest rate for this economy. (8 marks) ii) Using a well labeled diagram, illustrate the equilibrium condition in part (i) above. (4 marks)
b) A central bank is largely referred by economists as the bank at the apex with monetary authority. Clearly explain the major functions of a central bank. (8 marks)
(Total: 20 marks) QUESTION THIRTY ONE
a) How do commercial banks ‘create credit’? What are the limitations to this credit creation? (12 marks) b) Explain the concept of liquidity trap (8 marks) (Total: 20 marks)
3.8 LABOUR AND UNEMPLOYMENT QUESTION THIRTY-TWO
a) Define the term unemployment (2 marks) b) i) Discuss the main causes of unemployment (10 marks) ii) Suggest the possible measures that you would implement to contain unemployment problems in your
country (8 marks) (Total: 20 marks)
3.9 PUBLIC FINANCE QUESTION THIRTY THREE
Modern economies can be highly influenced by the way their budgets are frame worked. Required: a) Clearly explain the role of budgetary management in economic development. (8 marks) b) Briefly explain the types of budgets. (3 marks) c) i)Define taxation. (2 marks)

Questions
STRATHMORE UNIVERSITY ● REVISION KIT
10
(ii) Clearly explain the principle functions of taxation. (7 marks)
(Total: 20 marks) QUESTION THIRTY-FOUR
a) Clearly explain the meaning of deficit financing of the national budget. (4 marks) b) To what extent can an economy be supported by deficit – financing? (10 marks) c) Explain what fiscal policy entails. (6 marks)
(Total: 20 marks) QUESTION THIRTY-FIVE
a) Define inflation. (2 marks) b) What are the major causes of inflation? (10 marks) c) Explain the economic effects of a high rate of inflation. (8 marks)
(Total: 20 marks) 3.10 INTERNATIONAL TRADE AND FINANCE QUESTION THIRTY-SIX
a) What is meant by the term international trade? (4 marks) b) In the context of international trade, explain the concept of comparative advantage with specialization.
(10 marks) c) Define and briefly explain Balance of Payments (BOP). (6 marks)
(Total: 20 marks)

Revision Questions and Answers 11
ECONOMICS
ANSWERS
3.1 INTRODUCTION TO ECONOMICS
Question 1
a) Scarcity being the central economic problem is defined as the inadequacy/ insufficiency/ inability of (economic) resources or goods and services available to fully satisfy unlimited wants. Human wants are people’s desires for goods and services (backed by the ability to pay) and the circumstances that enhance their material well-being. Human wants are, therefore, the varied and insatiable desires of human beings that provide the driving force of economic activity. Scarcity is a relative concept relating the availability of resources or goods and services to their abilities to satisfy the unlimited wants, that is, relating people’s wants to the means available to satisfy them. Scarcity s therefore not the same as ‘few’ resources.
Resources are the means or ingredients or inputs available for producing the goods and services that are used to satisfy wants.
Since resources are scarce (limited in supply) it implies that such resources have alternative uses and command a non-zero price. Thus, scarce resources are known as economic resources and goods and services made available (produced) by utilizing such resources are referred to as economic goods and services.
A resource be it Land, Capital, Labour or Entrepreneurial ability, can be put to alternative uses (used to satisfy a variety of human wants) e.g. in terms of Land, a plot can be used for various purposes with a view to satisfying wants on it; one can construct residential houses, commercial buildings, an educational center or undertake some farming activity. Moreover, income is not readily and sufficiently available to satisfy all wants like food, clothing, basic education, medical care, shelter, security, entertainment and many others. Most people would probably like to have more of many goods of relatively better quality than they have at present: larger houses perhaps in which to live, better furnished with the latest labour-saving devices such as electric cookers, washers, refrigeration; more visits to theatre, more travel, the latest self-actualisation car models, radios and television sets, and largely exhibit an apparently insatiable desire for designer clothes.
Scarcity is a feature of all strata of society, the affluent and the lower income bracket since it is human nature to want more than one can have.
Choice is (may be) defined as the power of discretion, that it, the ability and freedom to select from alternatives or simply as the act or decision of selecting from competing alternatives. Choice arises due to scarcity of resources with such resources having competing alternative uses and therefore cannot satisfy all human wants pertaining to them at the same time. Choice is made between alternatives depending on scale of preference which differ between an individual consumer, producer (firm/investor) or government; determined by the view to maximize satisfaction, return and equity in provision (especially) of public and merit goods respectively. A rational consumer chooses those goods (and services) from which maximum satisfaction is derived; for an investor, choice is made of those ventures, which yield the highest possible return at least cost; a government that embraces the dictates of good governance would

Answers
STRATHMORE UNIVERSITY ● REVISION KIT
12
seek to ensure equity in distribution of the scarce resources by prioritizing between alternatives, for instance, choosing to spend more on public goods (such as physical infrastructure – roads and other qualitative aspects like Law and order) and merit goods (such as education and health); resource owners, on their part, choose where to hire out their factor services in order to maximize their factor incomes – an owner of residential houses may decide to convert them into offices if the rental income from offices is relatively higher.
Economic Units: • Consumer • Producer • Resource owner • Government
The basis of choice:
• To maximize utility • To maximize profits • To maximize returns on factors owned. • To maximize equity
Overall choices are made by economic units which include the consumer, producer, resource owner and the government with a view to maximizing utility, profits, returns on factors owned and equity in provision of public and merit goods respectively.
While making a choice, the tendency would be to either opt for one alternative and none of the other or both alternatives with more of one and less of the other.
b) The opportunity cost of an action is the value of the benefit expected from the next best foregone
alternative. It is a derivative concept which arises due to the scarcity of resources (for production) or goods and services (for consumption) which necessitates the making of choice between competing alternative uses – where more of a commodity is produced or consumed by reducing the production or consumption of another.
From the standpoint of an entrepreneur, the opportunity cost of deciding to organize land, labour and capital in the manufacture of fertilizer in a factory is the value of organizing the same resources in establishing and running a private school; a farmer with one acre of land may choose to either produce maize, wheat or barley whose return/incomes are 50,000 shillings, 60,000 shillings and 40,000 shillings respectively – the opportunity cost of producing wheat in this case, would be the value of the maize output which is the next best alternative forgone (i.e. Sh.50,000). If all the land is devoted to production of wheat then no other crop can be produced on the same piece of land – the farmer can decide to reduce the acreage under wheat in order to produce another crop like maize, in which case, the opportunity cost of this portion of maize is the value of the specific units of wheat foregone.
A CPA course student could have Sh.200 and requires both economics and FA I text books, each costing Sh.200. This amount (Sh.200) is certainly not enough (such that the two items are mutually exclusive) and therefore calls for the student to choose between the two alternatives, that is, to either buy the economics textbook and forego the FA text book or vice versa. Assuming the student opts to buy the economics textbook, the opportunity (economic) cost is the value of the benefit forgone by not buying the FA textbook.
Accounting profit net of opportunity cost gives economic profit, opportunity cost being an implicit cost.

Revision Questions and Answers
ECONOMICS
13
Opportunity cost can be illustrated by way of a diagram using a production possibility curve/ frontier which is concave to the origin denoting increasing opportunity cost as shown below:
Agricultural product (A)
(tones) P A1
A2 0 M1 M2 P Manufactured product (M): (tones)
Fig 1.1 Illustration of opportunity cost
Given that PP represents the production possibility curve, to increase production of M from M1 to M2 units the producer has to reduce production of A from A1 to A2 units; thus, the opportunity cost of production of (M1M2) units of M is the value of (A1A2) units of A foregone.
If resources were limitless (abundantly available) no action would be at the expense of another since all actions (alternatives) would be satisfied simultaneously and opportunity cost would be zero. Similarly, if resources had only one use there would be no opportunity cost since there will be no competing alternative uses.
c) Production possibility curve (PPC) is the locus of combinations of two commodities whose production
fully and efficiently utilizes the available resources and technology in a given period of time. It shows the maximum output a county can produce with its present productive capacity of land, labour, capital and entrepreneurial ability. It is also a graphical representation of the basic concepts of the discipline of economics, that is, scarcity, choice and opportunity cost: scarcity is implied by the unattainable combinations beyond the boundary; choice is denoted by the extent of the possibility of selection from the attainable points on the boundary; opportunity cost is depicted by the downward sloping nature (negative) of the production possibility curve. PPC is concave to the origin denoting increasing opportunity cost and the marginal rate of transformation (MRT) given by the absolute value of the slope of the PPC, which is due to the use of less and less suitable resources (resources are not equally efficient) and increased competition for resources which creates an upward pressure on factor rewards (prices measured in terms of the quantity of the other product given up), for example, an increase in wages to attract more or retain the same amount of labour or increase in rent in order to access and put more land into use.
Another reason for increasing opportunity cost is the Law of diminishing returns. This is because
resources are not used in the same fixed proportion or intensity in the production of all commodities. This means that as a nation produces more of a commodity, it must utilize resources that become progressively less efficient or less suited for the production of that commodity. As a result the country

Answers
STRATHMORE UNIVERSITY ● REVISION KIT
14
must give up more and more of the second commodity to release just enough resources to produce each additional unit of the first commodity.
A Production Possibility Frontier (PPF) actually stands for the extent of a country’s productive capacity in terms of the utilization of the available resourses and technology.
Units of commodity A: (eg tones of
Coffee) P • B •A •D •G • F 0 P1 Units of Commodity M: (Guns) Fig 1.2: Production Possibility Curve
The slope of the production possibility curve (pp1) at point B<at D<at F and at any of the points along the curve, the absolute value of the slope is equal to marginal rate of transformation which is also the opportunity cost.
Marginal rate of transformation (MRT) refers to the amount/quantity of one commodity given up for a
unit increase in production of another commodity while fully and efficiently utilizing the available resources; MRT is therefore the rate of ‘transforming’ one product into another through resource relocation measured by the absolute value of the slope of the ppc which increases downwards from left to right along the curve.
Points along (on) the ppc such as B, D and F represent the maximum possible output of commodities A
and M with a given resource base and technology. Points within/inside the ppc, for example A, are feasible/attainable only that resources are not fully and efficiently utilized, that is, resources are either underutilized or some are not utilized at all.
Points outside/beyond the ppc such as G represent combinations of commodities A and M which are
not achievable with the economy’s present productive capacity – can only be attained by increasing the resource base of aspects like labour force, stock of capital and technical progress. Taking a simple economy in which only two categories of goods A (agricultural) and M (manufactured) are produced, a country would have three possibilities:
1. To devote all resources to production of A and none of M (point P), 2. To devote all resources to production of M and none of A (point P1) or 3. To allocate resources to the production of both A and M (Points B, D & F)
However, because of the need for variety and a wider scope of choice to the consumer with a view to maximization of satisfaction and the avoidance of the negative effects of overspecialization, a country
Revision Questions and Answers
ECONOMICS
15
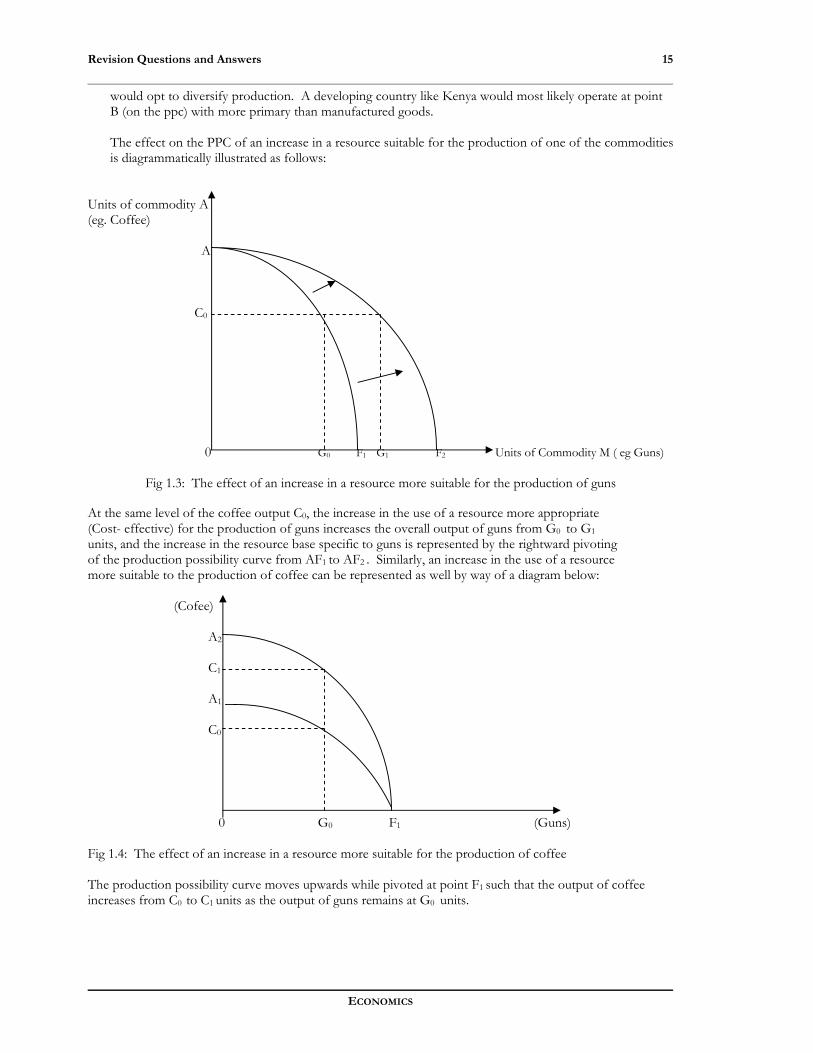
would opt to diversify production. A developing country like Kenya would most likely operate at point B (on the ppc) with more primary than manufactured goods.
The effect on the PPC of an increase in a resource suitable for the production of one of the commodities is diagrammatically illustrated as follows:
Units of commodity A (eg. Coffee) A C0
0 G0 F1 G1 F2 Units of Commodity M ( eg Guns)
Fig 1.3: The effect of an increase in a resource more suitable for the production of guns
At the same level of the coffee output C0, the increase in the use of a resource more appropriate (Cost- effective) for the production of guns increases the overall output of guns from G0 to G1
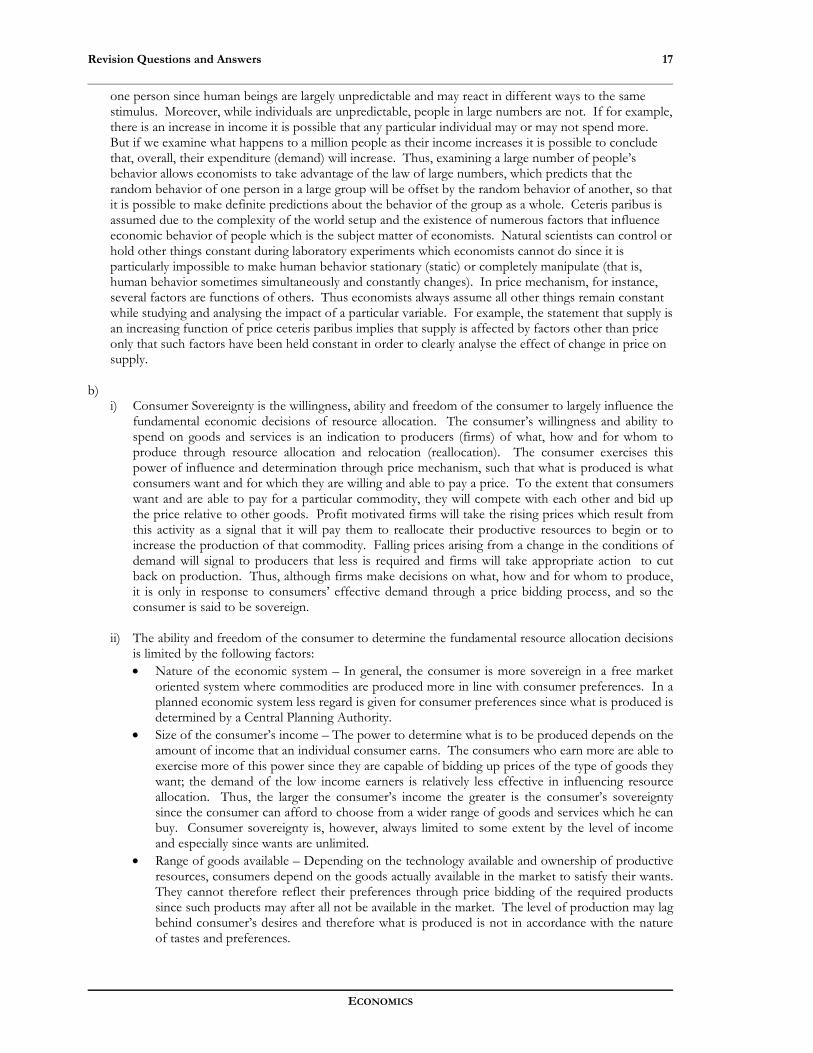
units, and the increase in the resource base specific to guns is represented by the rightward pivoting of the production possibility curve from AF1 to AF2 . Similarly, an increase in the use of a resource more suitable to the production of coffee can be represented as well by way of a diagram below: (Cofee) A2 C1 A1 C0 0 G0 F1 (Guns) Fig 1.4: The effect of an increase in a resource more suitable for the production of coffee The production possibility curve moves upwards while pivoted at point F1 such that the output of coffee increases from C0 to C1 units as the output of guns remains at G0 units.

Answers
STRATHMORE UNIVERSITY ● REVISION KIT
16
d) In society, people tend to vary in their ideas and views. They are influenced differently by different
events in different situations. Similarly, such events may or may not happen as expected and their explanations may or may not be by reference to facts. Based on this knowledge, economists have come up with two approaches to the study of economics: normative and positive economics. Economists differentiate between positive and normative economics on the basis of whether the users of economic theory are concerned with causal relationships only or whether they intend some kind of intervention in economic activity to alter the course of that activity
Positive Economics:
A positive statement is that which can be explained by reference to facts. Positive economics is concerned with the objective statements based on facts, circumstances and relationships in an economy, that is, objective consideration of what is happening or bound to happen with due reliance on prior evidence. It is therefore based on predetermined theories and principles (tested against evidence) of the discipline, for example, what is the effect of a reduction in the standard Value Added Tax (VAT) rate on government revenue or how does the public service early retirement programme affect government spending or how does a higher level of unemployment affect inflation or how does VAT on spare parts affect usage or how does the roads maintenance levy affect demand for diesel? Positive economics is supposed to be completely objective, limited to the cause-and-effect relationships of economic activity; it is concerned with the way economic relationships are.
Normative Economics:
A normative statement involves ethics and value judgments whose explanations are based on deeply held values or morals. It is concerned with expressions of value judgment(s) as to what one would like to happen (what ought to be). These judgments can be argued about but they cannot be settled by referring to predetermined principles which give predictable results (science) or reference to facts. Economists, for instance, may argue about the type of economic system or the standard of living in society they would like to see which is all about what ought to be and usually settled by choice; for example, should a free port encourage beneficial increase in economic activity or should government spending on defence increase or decrease and by what percentage or does taxation allocate resources more efficiently? All these questions have no predetermined answers and are therefore subject to value judgments and discussions.
Value judgments must necessarily be made; that is, possible objectives to be achieved must be ranked, and choices made among these objectives. Economic policymaking – conscious intervention in economic activity with the intent of altering the course that it will take – is essentially normative in nature. But if economic policy making is to be effective in improving economic performance, it must be rooted in sound positive economic analysis. Policy makers should be cognizant of the full range of consequences of the policies they recommend.
Question 2
a) ‘Ceteris Paribus’ is a Latin expression which means all other things remaining constant. It is an essential
component of a scientific method. If, for example, we wish to examine the effect of price on demand we do not simultaneously change other factors or variables like incomes, tastes, etc. Therefore, when formulating economic principles it is important to measure (determine) the effect of change in one variable while holding other variables constant – care is taken to always state that such and such will happen, ceteris paribus.
However, this principle presents particular problems in the social science (economics) because, whereas in the natural sciences laboratory experiments can be undertaken, it is not possible with human society (human behavior, etc). It can therefore be argued that since economics is concerned with human behavior, it is impossible to reach any firm conclusions. This may be so if we consider the behavior of
Revision Questions and Answers
ECONOMICS
17
one person since human beings are largely unpredictable and may react in different ways to the same stimulus. Moreover, while individuals are unpredictable, people in large numbers are not. If for example, there is an increase in income it is possible that any particular individual may or may not spend more. But if we examine what happens to a million people as their income increases it is possible to conclude that, overall, their expenditure (demand) will increase. Thus, examining a large number of people’s behavior allows economists to take advantage of the law of large numbers, which predicts that the random behavior of one person in a large group will be offset by the random behavior of another, so that it is possible to make definite predictions about the behavior of the group as a whole. Ceteris paribus is assumed due to the complexity of the world setup and the existence of numerous factors that influence economic behavior of people which is the subject matter of economists. Natural scientists can control or hold other things constant during laboratory experiments which economists cannot do since it is particularly impossible to make human behavior stationary (static) or completely manipulate (that is, human behavior sometimes simultaneously and constantly changes). In price mechanism, for instance, several factors are functions of others. Thus economists always assume all other things remain constant while studying and analysing the impact of a particular variable. For example, the statement that supply is an increasing function of price ceteris paribus implies that supply is affected by factors other than price only that such factors have been held constant in order to clearly analyse the effect of change in price on supply.
b)
i) Consumer Sovereignty is the willingness, ability and freedom of the consumer to largely influence the fundamental economic decisions of resource allocation. The consumer’s willingness and ability to spend on goods and services is an indication to producers (firms) of what, how and for whom to produce through resource allocation and relocation (reallocation). The consumer exercises this power of influence and determination through price mechanism, such that what is produced is what consumers want and for which they are willing and able to pay a price. To the extent that consumers want and are able to pay for a particular commodity, they will compete with each other and bid up the price relative to other goods. Profit motivated firms will take the rising prices which result from this activity as a signal that it will pay them to reallocate their productive resources to begin or to increase the production of that commodity. Falling prices arising from a change in the conditions of demand will signal to producers that less is required and firms will take appropriate action to cut back on production. Thus, although firms make decisions on what, how and for whom to produce, it is only in response to consumers’ effective demand through a price bidding process, and so the consumer is said to be sovereign.
ii) The ability and freedom of the consumer to determine the fundamental resource allocation decisions
is limited by the following factors: • Nature of the economic system – In general, the consumer is more sovereign in a free market
oriented system where commodities are produced more in line with consumer preferences. In a planned economic system less regard is given for consumer preferences since what is produced is determined by a Central Planning Authority.
• Size of the consumer’s income – The power to determine what is to be produced depends on the amount of income that an individual consumer earns. The consumers who earn more are able to exercise more of this power since they are capable of bidding up prices of the type of goods they want; the demand of the low income earners is relatively less effective in influencing resource allocation. Thus, the larger the consumer’s income the greater is the consumer’s sovereignty since the consumer can afford to choose from a wider range of goods and services which he can buy. Consumer sovereignty is, however, always limited to some extent by the level of income and especially since wants are unlimited.
• Range of goods available – Depending on the technology available and ownership of productive resources, consumers depend on the goods actually available in the market to satisfy their wants. They cannot therefore reflect their preferences through price bidding of the required products since such products may after all not be available in the market. The level of production may lag behind consumer’s desires and therefore what is produced is not in accordance with the nature of tastes and preferences.

Answers
STRATHMORE UNIVERSITY ● REVISION KIT
18
Different consumers have very different individual tastes and preferences and it is difficult for the available range of goods and services to satisfy all the consumers.
• Government policy – The consumption of certain goods may be prohibited by the government irrespective of the level of effective demand for them. The government usually prohibits production or sale of certain products in public interest e.g. harmful drugs, pornographic materials/literature. In this case, the consumer has no price bidding process power to influence and determine production and distribution. Government intervention is also looked at in terms of providing merit goods. The fact that the government needs to intervene to provide essential goods and services attests to the fact that the complete reliance on consumer preferences especially in a market oriented economy would lead to the under provision of certain essential goods and services.
• Advertising and other persuasive promotion activities and salesmanship – In the words of a Harvard Professor, Prof. J. K. Galbraith, advertising of especially large corporations not only entices consumers to use the products of these corporations but also creates new wants. Real desires of consumers are modified by the highly persuasive nature of advertising and salesmanship – in some cases, such consumers tend to purchase the advertised products according to the advertising claims which may not be directly compatible with the actual buyer benefits particularly in terms of the quality of content. The sovereignty of the consumer is limited in this context since effective demand is diverted from some goods to others (through resource reallocation) through the powerful influence of advertising.
• Conventions of Society (perceptions and norms) – Where the general human behavior is dictated by the conventions of society an individual sovereignty is limited. This is common with clothing and religion. E.g. wearing of trousers by women, which is against the Islamic religion – such that women have no effective demand that will influence the production of such items irrespective of their desires.
• Peer pressure/habit/addiction – Individual consumers have different habits and are often reluctant to change. Thus, for example, individual consumers tend to get attached to particular supplies and particular products (brand loyalties) and are reluctant to change. Similarly, addiction to certain products like cigarettes and alcohol whose consumption is recurrent and the consumers become almost completely incapable of departure. Even where change is as a virtue of necessity, it is almost impossible due to this addictive nature of products. Accordingly, a consumer in this state has a limited sovereignty in determining the production of goods other than the addictive goods. Moreover, such consumers cannot perhaps cause a reduction in production of such goods since their demand is always effective.
• Standardisation of goods – Production of standardized goods tends to be relatively cheaper to manufacturers. Therefore, consumers may not influence what is to be produced as the standards (in terms of type, content, design, etc.) are already set by manufacturers.
• Existence of monopolies – A monopoly is said to exist where there is a single supplier of a commodity with no close substitute. This monopoly power limits the ability of the consumer to determine the type, quantity, quality and price of a commodity.
3.2 DEMAND, SUPPLY AND DETERMINATION OF (EQUILIBRIUM) PRICE
Question 3
a) Ceteris paribus, supply is defined as the quantity of goods (and services) which producers (suppliers) are willing and able to offer for sale at alternative prices per unit of time; it is represented in table form as a supply schedule or graphically as a supply curve.
Supply is an increasing function of (own) price such that more of a commodity is supplied at higher than at lower prices. This direct relationship between supply and own price of a commodity is represented by an upward sloping supply curve illustrated below:
Revision Questions and Answers
ECONOMICS
19
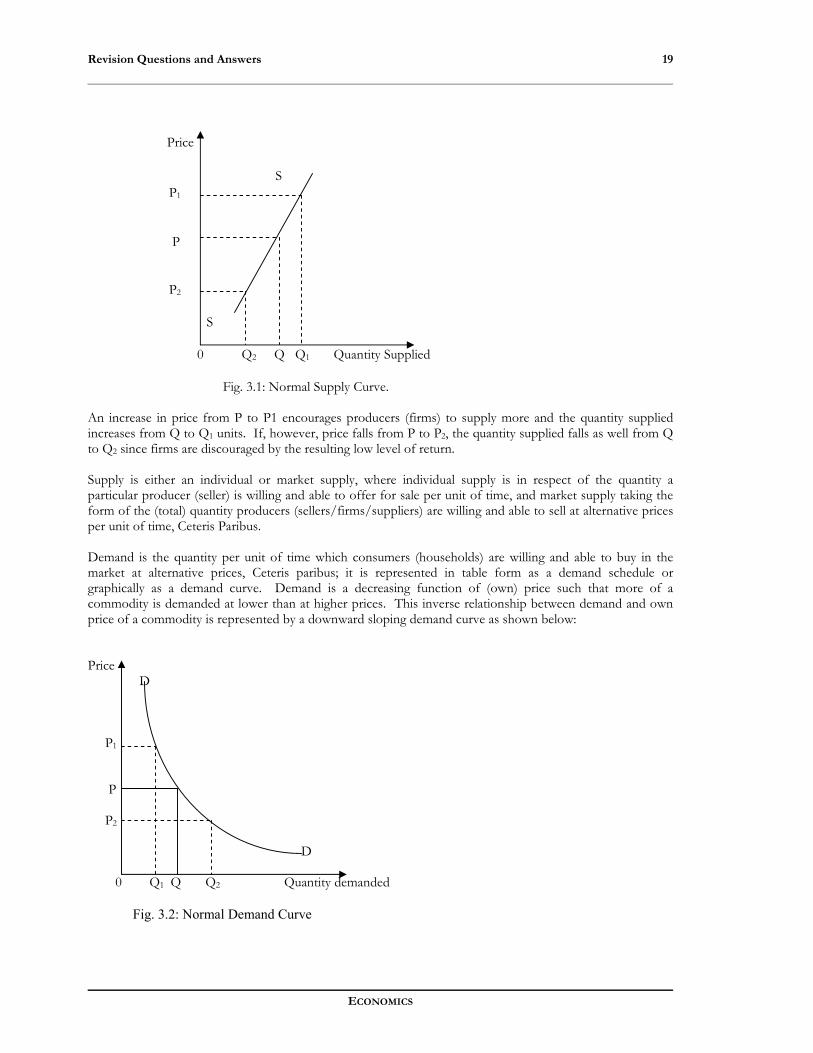
Price S P1 P P2 S 0 Q2 Q Q1 Quantity Supplied
Fig. 3.1: Normal Supply Curve. An increase in price from P to P1 encourages producers (firms) to supply more and the quantity supplied increases from Q to Q1 units. If, however, price falls from P to P2, the quantity supplied falls as well from Q to Q2 since firms are discouraged by the resulting low level of return. Supply is either an individual or market supply, where individual supply is in respect of the quantity a particular producer (seller) is willing and able to offer for sale per unit of time, and market supply taking the form of the (total) quantity producers (sellers/firms/suppliers) are willing and able to sell at alternative prices per unit of time, Ceteris Paribus. Demand is the quantity per unit of time which consumers (households) are willing and able to buy in the market at alternative prices, Ceteris paribus; it is represented in table form as a demand schedule or graphically as a demand curve. Demand is a decreasing function of (own) price such that more of a commodity is demanded at lower than at higher prices. This inverse relationship between demand and own price of a commodity is represented by a downward sloping demand curve as shown below: Price D P1 P P2 D 0 Q1 Q Q2 Quantity demanded
Fig. 3.2: Normal Demand Curve

Answers
STRATHMORE UNIVERSITY ● REVISION KIT
20
An increase in price from P to P1 discourages consumption and the quantity demanded reduces from Q to Q1
units. If, however, price falls from P to P2, the quantity demanded increases from Q to Q2 units. Demand is either an individual or market demand. An individual demand is the quantity of a commodity that a particular consumer is willing and able to buy at alternative prices per unit of time, Ceteris paribus; market demand is the quantity of a commodity that consumers are willing and able to buy at alternative prices per unit of time, other things remaining constant. Equilibrium price is the market price determined by the free interaction of the market forces of supply and demand. Once this price level is achieved there is no tendency for it to change and the market clears. Equilibrium price is determined at the intersection point of the supply and demand curves (equilibrium point), such that the quantity of a commodity at this point is called the equilibrium quantity. The determination of the equilibrium price and quantity is diagrammatically demonstrated as shown below: Price (P) S D P1 Pe e P2 D S 0 Qd1Qs2 Qe Qs1 Qd2 Quantity (Q) Fig. 3.3: Market Equilibrium. Pe is the equilibrium price and Qe the equilibrium quantity. At the price P1 there is excess supply over demand represented by (Qs1 - Qd1) units which creates a downward pressure on price to fall in order for suppliers to dispose of the surplus. At P2 there is excess demand over supply represented by (Qd2 – Qs2) units which results in an upward pressure on price to increase. Overall, the tendency is towards Pe and Qe, and any prices and quantities other than Pe and Qe are known as disequilibrium prices and quantities. b) Some of the main factors that may cause a fall in the supply of a commodity include:
1. Increase in cost of production: An increase in factor prices, for instance, tends to increase the cost of production which reduces the ability of firms to maintain or even expand their scale of production leading to a fall in supply.
2. Inappropriate technology: since production depends on the method(s) used, the decision to use less mechanization than before, for example in agriculture, reduces the utilization of large pieces of land and thus the supply of a product reduces.
3. Unfavourable natural events: In the event of unfavourable factors such as drought, pests or even deteriorating soil fertility, the supply of a commodity tends to fall.
Revision Questions and Answers
ECONOMICS
21
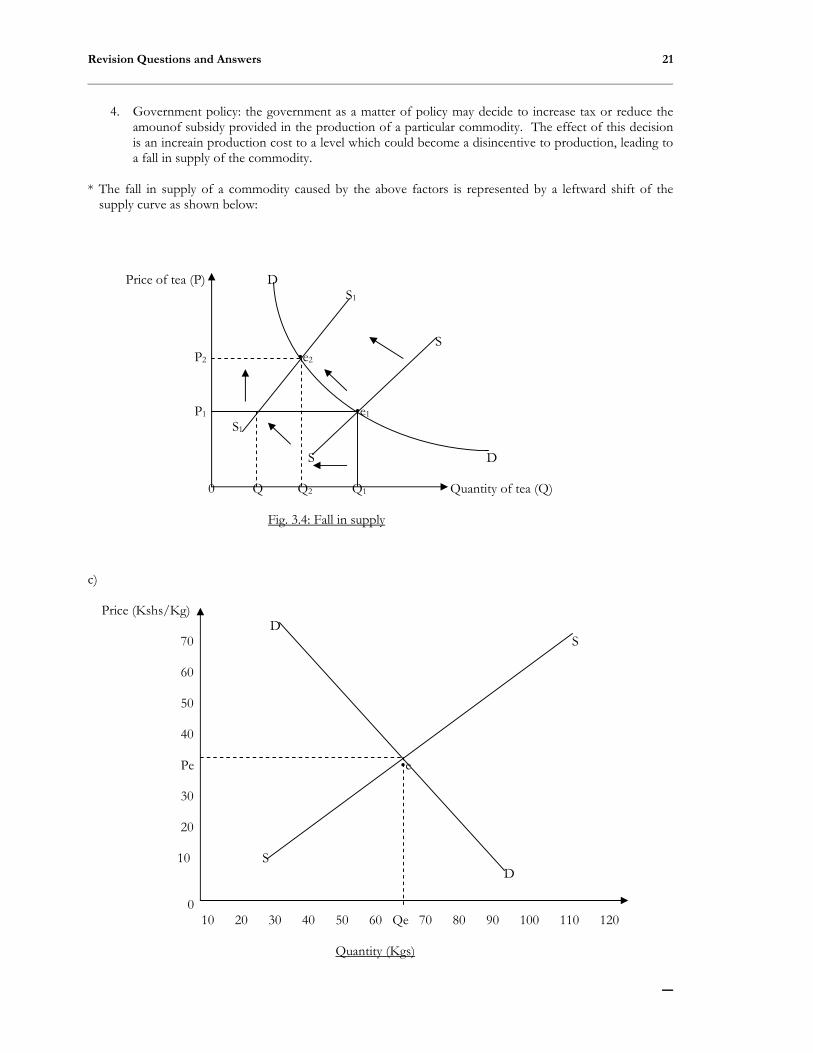
4. Government policy: the government as a matter of policy may decide to increase tax or reduce the
amounof subsidy provided in the production of a particular commodity. The effect of this decision is an increain production cost to a level which could become a disincentive to production, leading to a fall in supply of the commodity.
* The fall in supply of a commodity caused by the above factors is represented by a leftward shift of the
supply curve as shown below: Price of tea (P) D S1 S P2 •e2
P1 •e1 S1 S D 0 Q Q2 Q1 Quantity of tea (Q)
Fig. 3.4: Fall in supply c) Price (Kshs/Kg) D 70 S 60 50 40 Pe •e 30 20 10 S D 0 10 20 30 40 50 60 Qe 70 80 90 100 110 120 Quantity (Kgs)
Answers
STRATHMORE UNIVERSITY ● REVISION KIT
22
Scale: Vertical axis: 1cm rep. Ksh 10 Horizontal axis: 1 cm rep. 5 Kgs. Pe = Ksh. 35 SS: Supply curve Pe: Equilibrium price e: Equilibrium point Qe = 62 Kgs DD: Demand curve Qe: Equilibrium quantity
Question 4
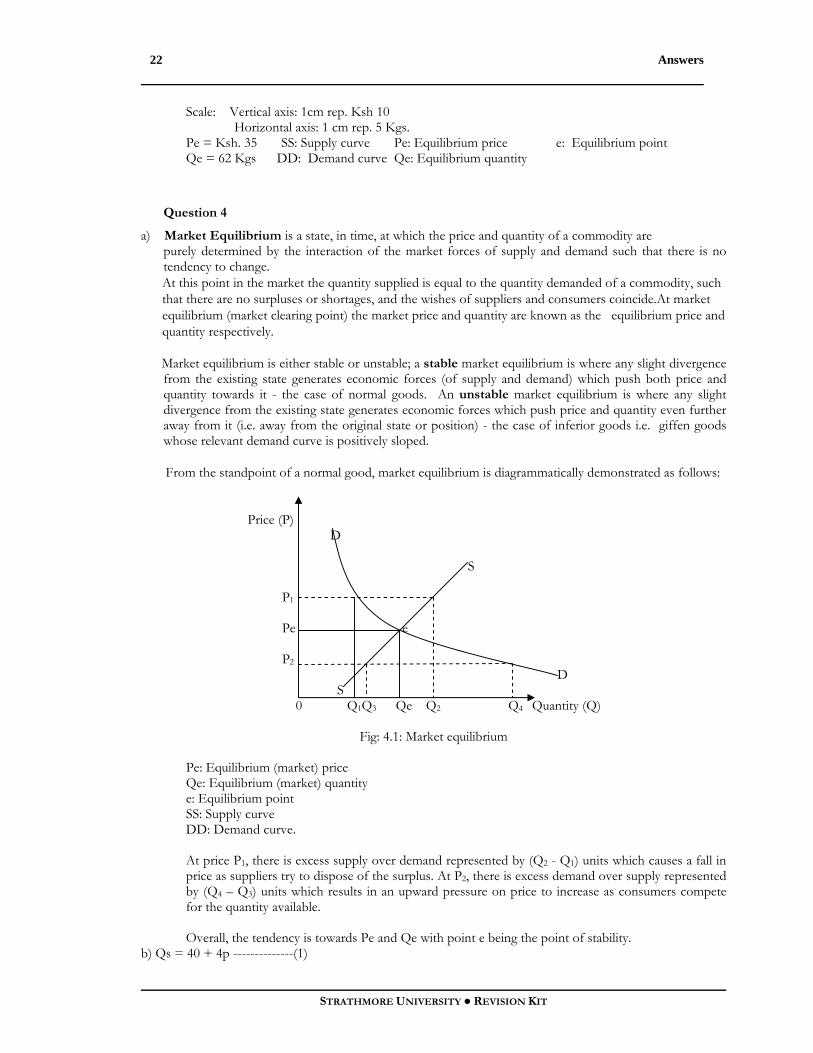
a) Market Equilibrium is a state, in time, at which the price and quantity of a commodity are purely determined by the interaction of the market forces of supply and demand such that there is no tendency to change. At this point in the market the quantity supplied is equal to the quantity demanded of a commodity, such that there are no surpluses or shortages, and the wishes of suppliers and consumers coincide.At market equilibrium (market clearing point) the market price and quantity are known as the equilibrium price and quantity respectively.
Market equilibrium is either stable or unstable; a stable market equilibrium is where any slight divergence from the existing state generates economic forces (of supply and demand) which push both price and quantity towards it - the case of normal goods. An unstable market equilibrium is where any slight divergence from the existing state generates economic forces which push price and quantity even further away from it (i.e. away from the original state or position) - the case of inferior goods i.e. giffen goods whose relevant demand curve is positively sloped.
From the standpoint of a normal good, market equilibrium is diagrammatically demonstrated as follows:
Price (P) D S P1 Pe e P2 D S 0 Q1Q3 Qe Q2 Q4 Quantity (Q)
Fig: 4.1: Market equilibrium
Pe: Equilibrium (market) price Qe: Equilibrium (market) quantity e: Equilibrium point SS: Supply curve DD: Demand curve.
At price P1, there is excess supply over demand represented by (Q2 - Q1) units which causes a fall in price as suppliers try to dispose of the surplus. At P2, there is excess demand over supply represented by (Q4 – Q3) units which results in an upward pressure on price to increase as consumers compete for the quantity available.
Overall, the tendency is towards Pe and Qe with point e being the point of stability.
b) Qs = 40 + 4p --------------(1)

Revision Questions and Answers
ECONOMICS
23
Qd = 100 - 2p ----------------(2) At equilibrium, Qs = Qd therefore 40 + 4P = 100 – 2P 4P – 2P = 100 – 40 6P = 60 P = (60/6) PX = 10 QS = 40 + 4P but P = 10 therefore QS = 40 + 4(10) = 80 units of X Qd = 100 – 2P but again P = 10 therefore Qd = 100 – 2(10) = 80 units of X Thus, Q = QS = Qd = 80 units of X D S Price of X 10 •e S D 0 80 Quantity of X Fig. 4.2: Equilibrium price and quantity of x c) i) Substitutes being alternatives in consumption, a fall in price of x’s substitute reduces the demand for commodity x, represented by a downward shift of the demand curve as shown below: Price of X D S (Kshs) D1 10 •e1 Pe • e2 D S D1 0 Qd Qe 80 Quantity of X
Fig. 4.3: Effect on equilibrium price and quantity of a fall in price of x’s substitute

Answers
STRATHMORE UNIVERSITY ● REVISION KIT
24
A fall in price of x’s substitute reduces the demand for x from 80 to Qe units represented by the downward shift of the demand curve from DD to D1D1 and the movement along the supply curve from the equilibrium point e1 to e2. Effectively, there occurs excess supply (surplus) over demand equivalent to (80 - Qd) units at the original equilibrium price of Sh.10. This surplus creates a downward pressure on price to fall which again discourages suppliers who then supply less of x, eventually establishing a new equilibrium point e2 with a fall in equilibrium price from Sh.10 to Sh.Pe and equilibrium quantity from 80 to Qe units of x.
ii) A simultaneous increase in input prices and a rise in consumer’s income, assuming that x and its substitute are normal goods: An increase in input prices (being a condition of supply) will lead to a rise in production cost of
commodity x, causing its supply to fall - represented by a leftward shift of the supply curve. An increase in consumer’s income (being a condition of demand) increases the demand for x due to increase in purchasing power (real income of the consumer) - denoted by an upward shift of the demand curve. Overall, the equilibrium price of x will no doubt increase (above Sh.10) but whether the equilibrium quantity will increase, decrease or remain constant depends on the magnitudes of increase in input prices and consumer’s income. In theory, three cases are in perspective:
• Case one: where the magnitude of increase in input prices exceeds that of increase in consumer’s
income, the equilibrium quantity of x falls below 80 units. • Case two: where the magnitude of increase in consumer’s income exceeds that of increase in input
prices, equilibrium quantity increases beyond 80 units of x. • Case three: where the magnitudes are the same/equal then, ideally, the equilibrium quantity remains
constant at 80 units of x. However, since the direction of change in price is NOT in doubt (that is, it has to increase) and assuming
the normality of good x and rationality of the consumer, equilibrium quantity would fall below 80 units of x (case one) as illustrated below:
D1 Price of X (Kshs) S1 D S P1 . e1 10 • e D1 S1 D S 0 QS Q1 80 Qd Quantity of X Fig. 4.4: Effect of an increase in input prices and consumer’s income on the equilibrium price and quantity of
commodity x.

Revision Questions and Answers
ECONOMICS
25
The supply curve shifts leftwards from ss to s1s1 in a larger magnitude than the upward shift of the demand curve from DD to D1 D1. At the original (initial) equilibrium price of Sh.10, there is an excess demand over supply represented by (Qd - Qs) units arising from increase in purchasing power and fall in the quantity of x available in the market; eventually, the equilibrium price of commodity x increases from 10 to P1 while the quantity falls from 80 to Q1 units.
Question 5
Qa = 3P2 – 4P ------------- (1) Qb = 24 - P2 ------------- (2) (a) (i) Because of the exponential nature of the functions, the 1st step of distinction is to find the 1st order
derivatives of the functions such that: dQa = 6P – 4 dP = -4 + 6P ------ (3) dQb = -2P ------------ (4) dP NB: There are four approaches/alternatives of distinction:- 1) Direction of change between Q & P given by the signs of the coefficient of the independent variable (P):
Its positive for supply functions since supply is an increasing function of price; negative for demand functions since demand is a decreasing function of price. Therefore since the co-efficient of the independent variable (P) in function Qa = 3p2 – 4P given by its derivative (dQa/dP = -4 + 6P) is positive (i.e. +6) then this function (Qa = 3P2 – 4P) represents a supply curve. Similarly, dQb/dP = - 2P with – 2 being the coefficient of P thus function Qb = 24 – P2 represents the demand curve.
2) X & Y intercepts:
For supply functions the Y intercept is negative and X intercept is positive; for demand functions its positive for theY intercept and negative for the X intercept.
3) Random table/Schedule:
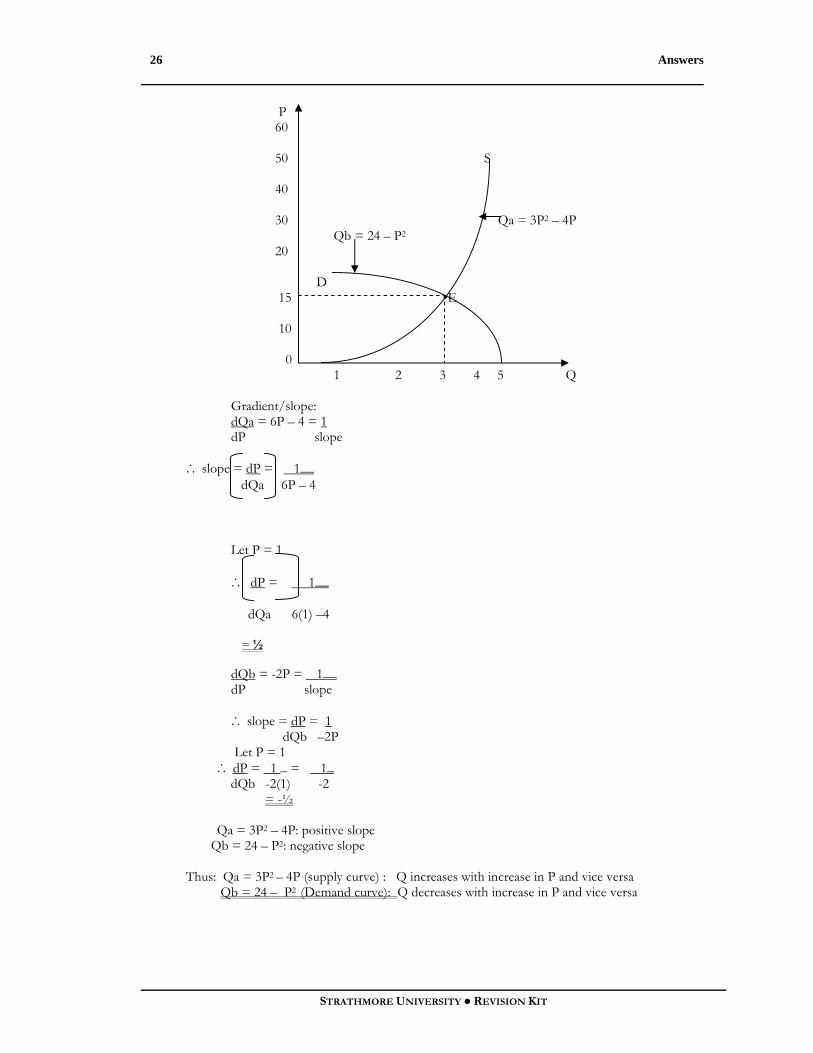
Random (P): 1 2 3 4 5Qa = 3P2 – 4P -1 4 15 32 55Qb = 24 – P2 23 20 15 8 -1
Answers
STRATHMORE UNIVERSITY ● REVISION KIT
26
P 60 50 S 40 30 Qa = 3P2 – 4P Qb = 24 – P2 20 D 15 •E 10 0 1 2 3 4 5 Q
Gradient/slope: dQa = 6P – 4 = 1 dP slope
∴ slope = dP = 1__ dQa 6P – 4
Let P = 1
∴ dP = 1__
dQa 6(1) –4 = ½
dQb = -2P = 1__ dP slope
∴ slope = dP = 1 dQb –2P
Let P = 1 ∴ dP = 1 _ = 1_ dQb -2(1) -2 = -½ Qa = 3P2 – 4P: positive slope Qb = 24 – P2: negative slope Thus: Qa = 3P2 – 4P (supply curve) : Q increases with increase in P and vice versa Qb = 24 – P2 (Demand curve): Q decreases with increase in P and vice versa

Revision Questions and Answers
ECONOMICS
27
ii) At equilibrium: Qa = Qb 3P2 – 4P = 24 – P2 3P2 – 4P + P2 – 24 = 0 a + b = 1 4P2 - 4P – 24 = 0 ab = - 6 P2 – P – 6 = 0 6 = 2 x 3 P2 + 2P – 3P – 6 = 0 P(P + 2 ) – 3 (P + 2) = 0 (P – 3) (P + 2) = 0 Case (1) : p – 3 = 0 P = 3 Case (2): P + 2 = 0 P = - 2 but P≠ -ve Thus P = Ksh. 3
Qa = 3P2 – 4P ------- (1) 3(3)2 – 4(3)
(27 – 12) = 15
Qb = 24 – P2 ----------- (2) 24 – (3)2 (24 – 9) = 15 ∴ Q = 15 units
b) Explaining with the aid of diagrams the effect on the demand and supply functions indicated in (a)
above of a simultaneous fall in costs of production and an increase in the price of a complementary good.
Complementary goods are goods which are used jointly (eg cars and petrol) such that the demand for one is a decreasing function of the price of another implying that the cross elasticity of demand (for complementary goods) is negative.
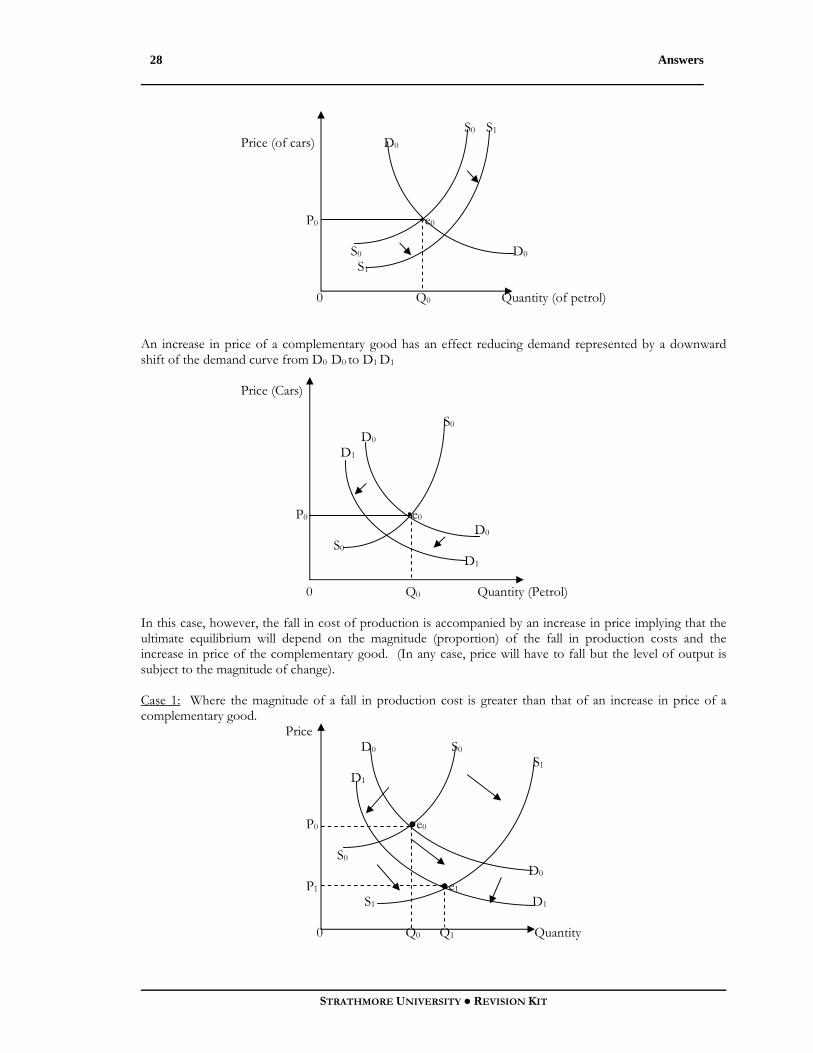
PA (Cars) D P2 P1 D 0 q2 q1 QdB (Petrol) Decrease (fall) in cost of production has an effect of reducing the final product prices by increasing supply represented by a downward and to the right shift of the supply curve (from S0S0 to S1 S1 )
Answers
STRATHMORE UNIVERSITY ● REVISION KIT
28
S0 S1 Price (of cars) D0 P0 •e0 S0 D0 S1 0 Q0 Quantity (of petrol) An increase in price of a complementary good has an effect reducing demand represented by a downward shift of the demand curve from D0 D0 to D1 D1 Price (Cars) S0 D0 D1 P0 •e0 D0 S0 D1 0 Q0 Quantity (Petrol) In this case, however, the fall in cost of production is accompanied by an increase in price implying that the ultimate equilibrium will depend on the magnitude (proportion) of the fall in production costs and the increase in price of the complementary good. (In any case, price will have to fall but the level of output is subject to the magnitude of change). Case 1: Where the magnitude of a fall in production cost is greater than that of an increase in price of a complementary good. Price D0 S0 S1 D1 P0 ●e0 S0 D0 P1 ●e1 S1 D1 0 Q0 Q1 Quantity
Revision Questions and Answers
ECONOMICS
29
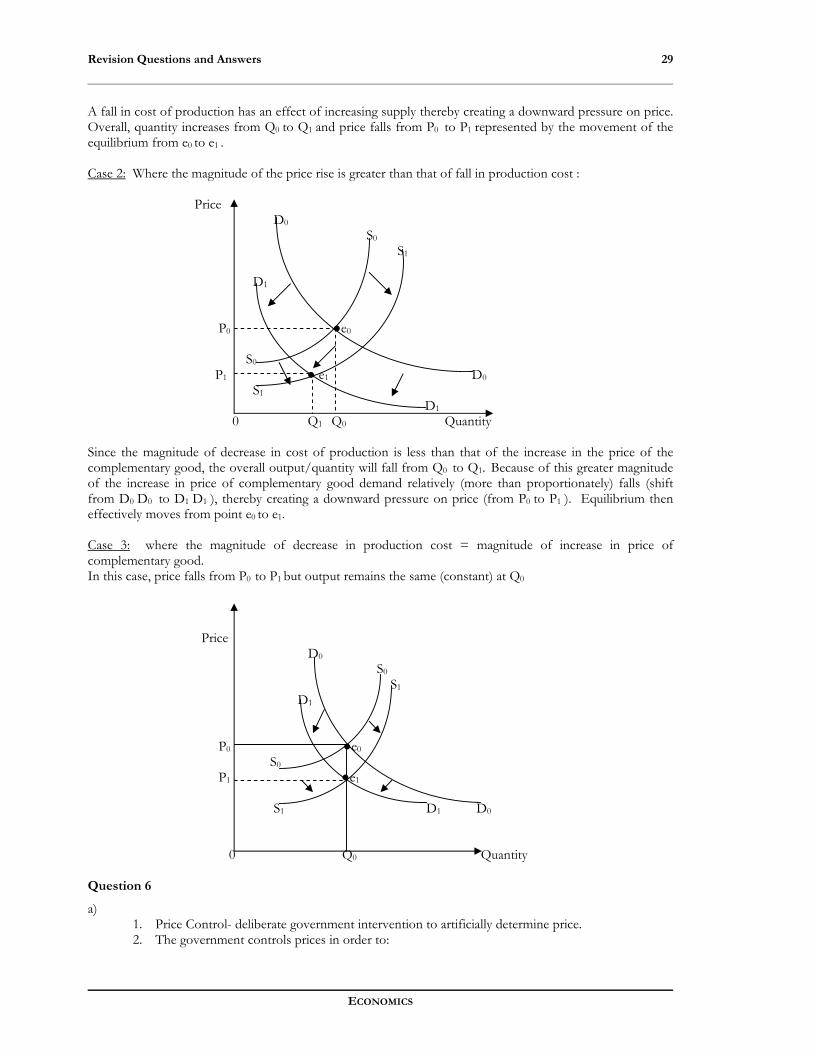
A fall in cost of production has an effect of increasing supply thereby creating a downward pressure on price. Overall, quantity increases from Q0 to Q1 and price falls from P0 to P1 represented by the movement of the equilibrium from e0 to e1 . Case 2: Where the magnitude of the price rise is greater than that of fall in production cost : Price D0 S0 S1 D1 P0 ●e0 S0 P1 ● e1 D0 S1 D1 0 Q1 Q0 Quantity Since the magnitude of decrease in cost of production is less than that of the increase in the price of the complementary good, the overall output/quantity will fall from Q0 to Q1. Because of this greater magnitude of the increase in price of complementary good demand relatively (more than proportionately) falls (shift from D0 D0 to D1 D1 ), thereby creating a downward pressure on price (from P0 to P1 ). Equilibrium then effectively moves from point e0 to e1. Case 3: where the magnitude of decrease in production cost = magnitude of increase in price of complementary good. In this case, price falls from P0 to P1 but output remains the same (constant) at Q0 Price D0 S0 S1 D1 P0 ●e0 S0 P1 ●e1 S1 D1 D0 0 Q0 Quantity Question 6
a) 1. Price Control- deliberate government intervention to artificially determine price. 2. The government controls prices in order to:
Answers
STRATHMORE UNIVERSITY ● REVISION KIT
30
• Stabilize prices and supplies of essential commodities • Reduce income inequalities by balancing welfare through imposition of minimum wages • Control the exploitative/ unscrupulous practices of natural monopolies and or those
created by government policies. • Promote self-sufficiency in domestic production of goods and services. • Direct investment by increasing relative profitability while restricting competitors
because any prices, other than the legislated prices, are not allowed. • Protect the purchasing power of consumers especially the low-income earners. • Protect domestic industries against the highly competitive foreign influence-the infant
industry argument. • Generate a conducive and selective political support base- industrial peace, minimal or
absence of food riots and other forms of insecurity.
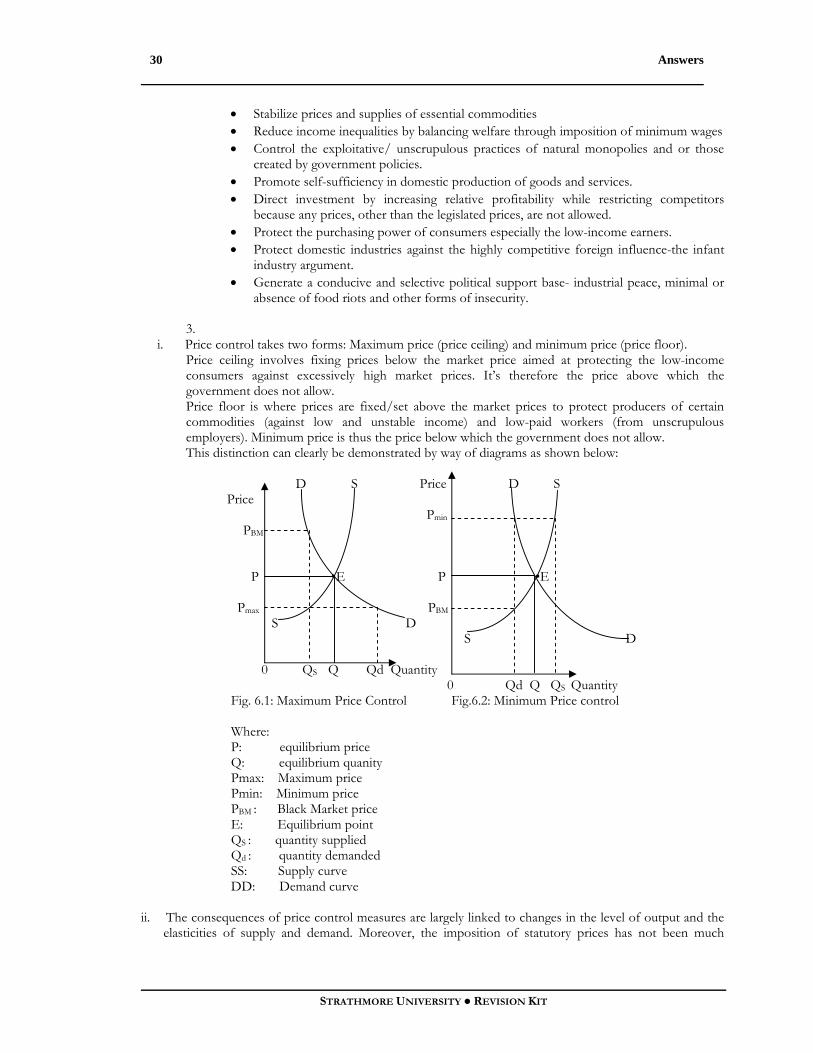
3. i. Price control takes two forms: Maximum price (price ceiling) and minimum price (price floor).
Price ceiling involves fixing prices below the market price aimed at protecting the low-income consumers against excessively high market prices. It’s therefore the price above which the government does not allow. Price floor is where prices are fixed/set above the market prices to protect producers of certain commodities (against low and unstable income) and low-paid workers (from unscrupulous employers). Minimum price is thus the price below which the government does not allow.
This distinction can clearly be demonstrated by way of diagrams as shown below: D S Price D S Price Pmin PBM P •E P •E Pmax PBM S D S D 0 QS Q Qd Quantity 0 Qd Q QS Quantity Fig. 6.1: Maximum Price Control Fig.6.2: Minimum Price control
Where: P: equilibrium price Q: equilibrium quanity Pmax: Maximum price Pmin: Minimum price PBM : Black Market price E: Equilibrium point QS : quantity supplied Qd : quantity demanded SS: Supply curve DD: Demand curve
ii. The consequences of price control measures are largely linked to changes in the level of output and the
elasticities of supply and demand. Moreover, the imposition of statutory prices has not been much

Revision Questions and Answers
ECONOMICS
31
effective in achieving the intended objectives and the following explanations are supportive of this argument:
Maximum price Control (Price ceilings):
• Institutionalized excess demand over supply of a commodity, which largely translates into inflation and structural unemployment. In the diagram 6.1 above, excess demand is given by Qd-Qs.
• Scope for a black market- this involves selling a product at a price other than the legislated/statutory price (in an illegal market) preferably to those willing to pay higher prices e.g. out put Qs at price PBM as shown in Fig 6.1 above.
• Hoarding and smuggling of products to other countries where prices are relatively high. This will further create artificial shortages
• Disincentive to investment as producers are not allowed to maximize their profits and may opt to invest in industries whose product prices are not controlled, usually non-essential commodities could be produced in place of necessities.
• Waste of resources by the government through policing efforts in trying to ensure adherence to statutory prices.
• Loss of foreign exchange arising from importation of essential commodities whose domestic supply is insufficient. This foreign exchange could otherwise be used to import capital inputs necessary for economic growth and development.
• Sale by discrimination and rationing of the scarcely available commodities-selling to relatives/ close associates or even subjecting consumers to unnecessary purchase of non-essentials as a pre-requisite to getting essential commodities. This practice is largely among retailers especially in rural areas where market information is inadequate. Rationing implies consumption of less than the amount required. It could also mean going without, a situation, which may lead to such events as food riots and starvation.
Minimum price control (price floors):
• Institutionalized excess supply over demand for a commodity. In Fig. 6.2, the quantity supplied is Qs while the amount demanded is Qd. Thus the excess supply is represented by Qs – Qd
• Increase or distortion on government spending programmes arising form establishment of buying agencies such as the NCPB, which may not be efficient/cost-effective. It may also require the setting up of costly storage facilities in the name of buffer stocks so that goods are released to the public at subsidized prices in the event of a shortage.
• Dumping – a kind of price discrimination whereby the government buys and exports the surplus of a commodity at lower prices. This is done especially where the cost of storage is prohibitively high. Since the acquisition price (minimum price) is relatively higher than the dumping price, the government is in effect making a ‘loss’
• Black marketing also arises due to demand deficiency resulting from higher prices (minimum price) and the inability of the government to buy the whole amount of excess output. This coupled with the perishable nature of products makes producers resort to prices lower than the statutory minimum price, such as PBM in figure 6.2.
As we have seen, both maximum and minimum price controls produce problematic consequences and may result in a less efficient allocation of resources than might be expected to arise from the operation of a free market. However, where there are specific problems affecting particular groups in the economy, such controls might be justified on equitable grounds.
3.3 ELASTICITY OF DEMAND AND SUPPLY
Question 7
a) Distinguishing own-price elasticity of demand and cross elasticity of demand: Own-price elasticity of demand:

Answers
STRATHMORE UNIVERSITY ● REVISION KIT
32
Elasticity is the ratio of the relative change of a dependent variable to changes in other independent variables. Own price elasticity of demand is a measure of the extent to which quantity demanded of a commodity responds to changes in the commodity ‘s own price (ceteris paribus). Price elasticity of demand (Ped) is calculated using the following general formula: Ped = Proportionate change in quantity demanded
Proportionate change in price If a proportionate change in price causes a more than proportionate change in quantity demanded, demand is said to be price elastic. The value of elasticity in this case is greater than one, that is, E0 > 1 for example in the case of luxury goods. If a proportionate change in price causes a less than proportionate change in quantity demanded, demand is said to be price inelastic. The absolute value of price elasticity of demand in this case is less than one, that is, E0 < 1 for example in the case of necessities. To demonstrate this consider the table below which shows the demand schedules for commodities X and Y. Commodity X Commodity Y Prices sh/unit Quantity demanded/week Prices sh/unit Quantity
demanded/week 20 100 20 100 10 300 10 120
For commodity X, when the price falls from shs 20 to shs 10 per unit, quantity demanded will increase from 100 to 300 units
Price elasticity of demand = Proportionate change in quantity demanded
Proportionate change in price Proportionate change in quantity demanded = ∆ in quantity demanded X 100 Initial quantity = 200 x 100 = 200% 100 Proportionate change in price = ∆ in price x 100 Initial price = -10 x 100 = -50% 20 ∴ ED = 200% = -4 - 50%
ED = 4, so demand is price elastic.
For commodity Y, when price falls from shs 20 to sh. 10, quantity demanded will increase from 100 to 120 units.
∴ PED = 120 – 100/100 x 100 = 20%/-50% 10 –20/20 x 100 = -0.4 Thus PED = 0.4; demand is price inelastic The value of price elasticity of demand is negative because of the inverse relationship between price and quantity demanded, that is if price falls, quantity demanded increases and if price increases quantity demanded falls. However, in this case, the absolute value is considered since the interest is on the extent of change and not direction of change.
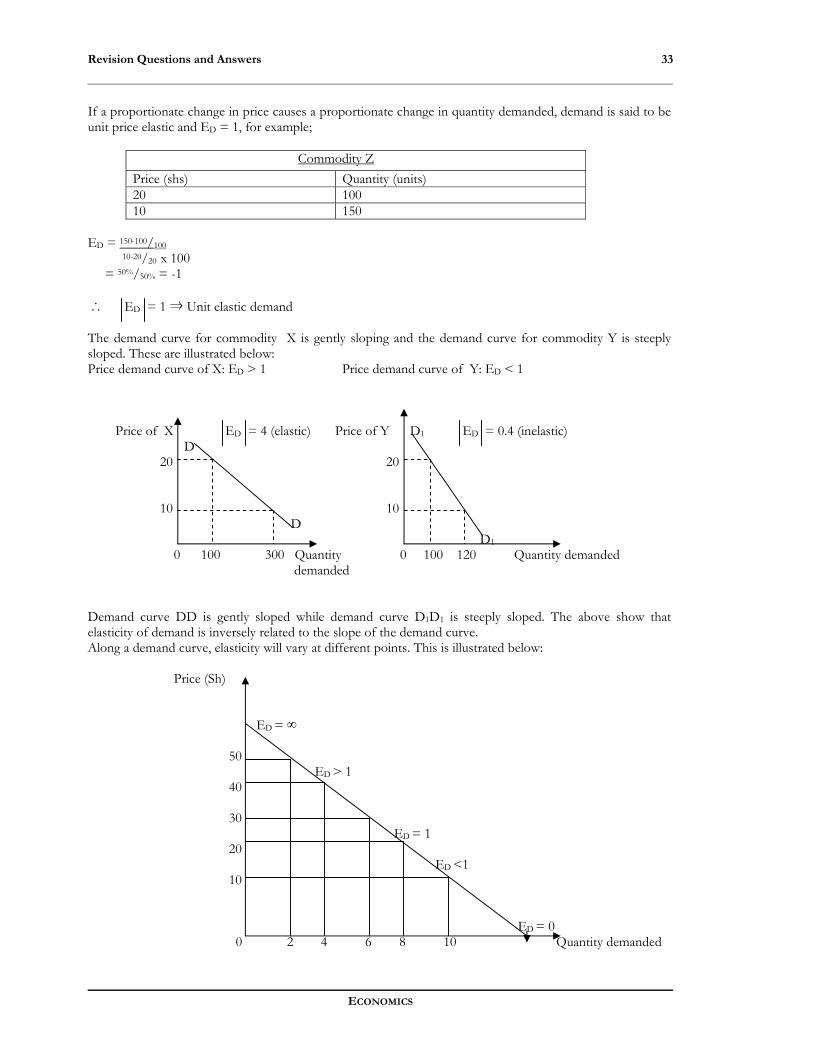
Revision Questions and Answers
ECONOMICS
33
If a proportionate change in price causes a proportionate change in quantity demanded, demand is said to be unit price elastic and ED = 1, for example;
Commodity Z Price (shs) Quantity (units) 20 100 10 150
ED = 150-100/100 10-20/20 x 100 = 50%/50% = -1 ∴ ED = 1 ⇒ Unit elastic demand The demand curve for commodity X is gently sloping and the demand curve for commodity Y is steeply sloped. These are illustrated below: Price demand curve of X: ED > 1 Price demand curve of Y: ED < 1 Price of X ED = 4 (elastic) Price of Y D1 ED = 0.4 (inelastic) D 20 20 10 10 D D1 0 100 300 Quantity 0 100 120 Quantity demanded demanded Demand curve DD is gently sloped while demand curve D1D1 is steeply sloped. The above show that elasticity of demand is inversely related to the slope of the demand curve. Along a demand curve, elasticity will vary at different points. This is illustrated below: Price (Sh) ED = ∞ 50 ED > 1 40 30 ED = 1 20 ED <1 10 ED = 0 0 2 4 6 8 10 Quantity demanded

Answers
STRATHMORE UNIVERSITY ● REVISION KIT
34
When price falls from sh.50 to sh.40: ED = 4 – 2 x 100 2 100% 40 – 50 x 100 -20% 50 ∴ ED = 5; demand is price elastic When price falls from sh. 20 to sh. 10: ED = 10 – 8 x 100 8 = 25% 10 – 20 x 100 - 50% 20 = -0.5 ∴ ED = 0.5; therefore demand is price inelastic At higher prices, demand is more price elastic than at lower prices. Price elasticity of demand is not the same at all prices since it does not depend on the slope but upon proportionate changes in price and quantity. However, there are three cases where price elasticity of demand is the same at all prices. These are illustrated below: (a) (b) (c) PX D PX PX D ED = 0 ED = ∞ ED = 1 D D (Rectangular hyperbola) D D 0 QX 0 QX 0 QX Perfectly price Perfectly price Unit price inelastic demand elastic demand elastic demand a) Represents perfectly price inelastic demand. Quantity demanded does not change as price changes. This is
the case of an absolute necessity that is consumed in fixed amounts for example, insulin for diabetes or number of exercise books used by a student.
b) Represents perfectly price elastic demand. Price is the same at all levels of demand for example a demand curve facing a perfectly competitive market of a firm.
c) Represents unit price elastic demand. Quantity demanded changes at the same proportion as price at all price levels.
Price elasticity of demand can be measured in two ways, that is, point elasticity of demand and arc elasticity of demand. Point elasticity of demand is a measure of price elasticity at a particular point on the demand curve. It is valid for very small changes in price. For a straight-line demand curve, point elasticity can be found using the following formula: Point ED = Δ Q/Q = Δ Q • P
Δ P/P Δ P Q
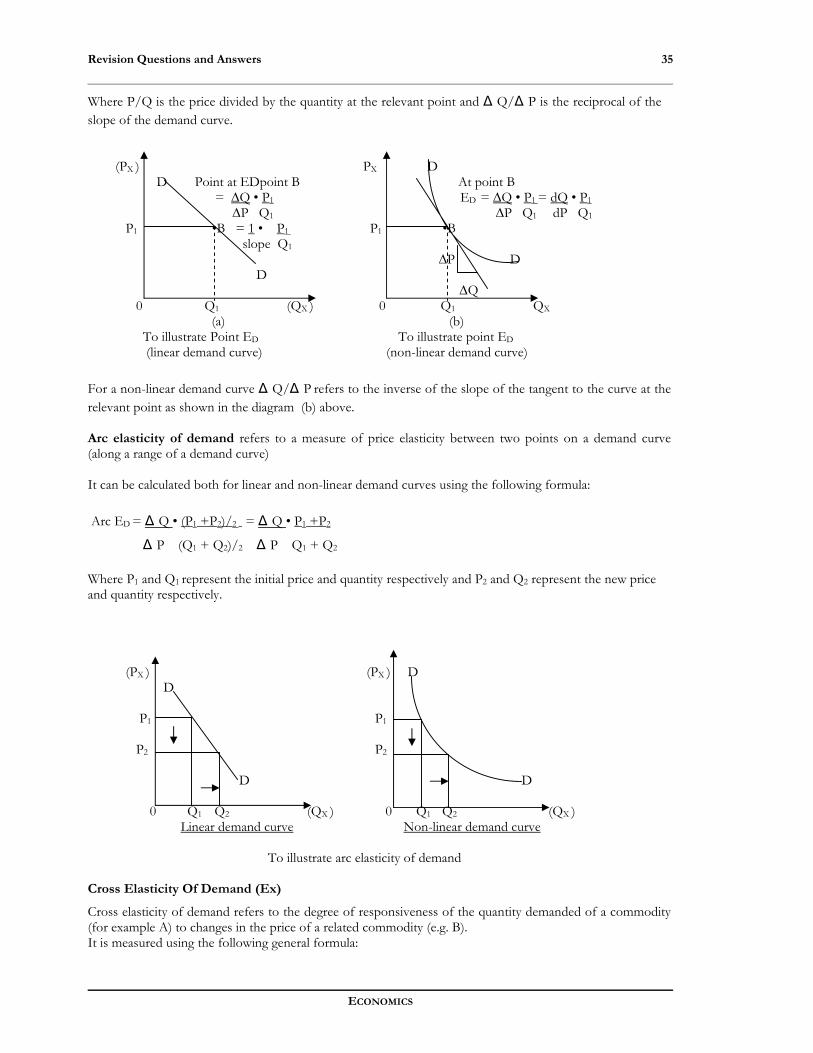
Revision Questions and Answers
ECONOMICS
35
Where P/Q is the price divided by the quantity at the relevant point and Δ Q/Δ P is the reciprocal of the slope of the demand curve. (PX ) PX D D Point at EDpoint B At point B = ∆Q • P1 ED = ∆Q • P1 = dQ • P1 ∆P Q1 ∆P Q1 dP Q1 P1 •B = 1 • P1 P1 •B slope Q1 ∆P D D ∆Q 0 Q1 (QX ) 0 Q1 QX
(a) (b) To illustrate Point ED To illustrate point ED (linear demand curve) (non-linear demand curve) For a non-linear demand curve Δ Q/Δ P refers to the inverse of the slope of the tangent to the curve at the relevant point as shown in the diagram (b) above. Arc elasticity of demand refers to a measure of price elasticity between two points on a demand curve (along a range of a demand curve) It can be calculated both for linear and non-linear demand curves using the following formula: Arc ED = Δ Q • (P1 +P2)/2 = Δ Q • P1 +P2
Δ P (Q1 + Q2)/2 Δ P Q1 + Q2 Where P1 and Q1 represent the initial price and quantity respectively and P2 and Q2 represent the new price and quantity respectively. (PX ) (PX ) D D P1 P1 P2 P2 D D 0 Q1 Q2 (QX ) 0 Q1 Q2 (QX ) Linear demand curve Non-linear demand curve To illustrate arc elasticity of demand Cross Elasticity Of Demand (Ex)
Cross elasticity of demand refers to the degree of responsiveness of the quantity demanded of a commodity (for example A) to changes in the price of a related commodity (e.g. B). It is measured using the following general formula:
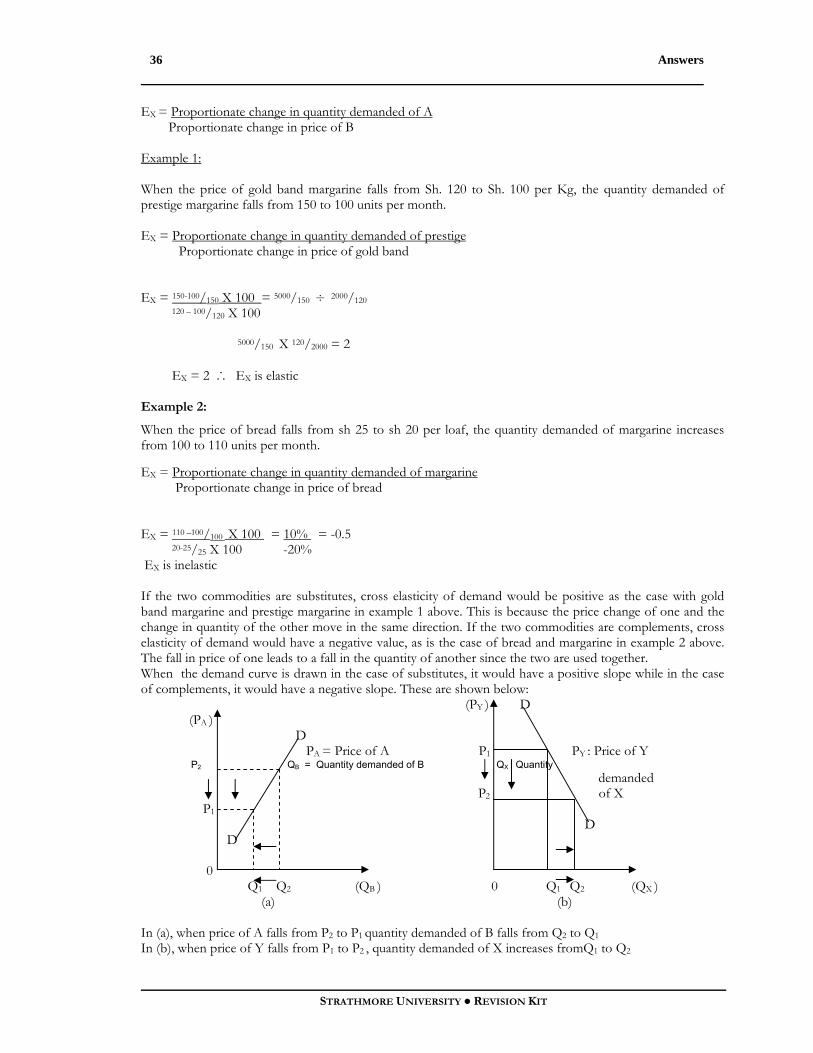
Answers
STRATHMORE UNIVERSITY ● REVISION KIT
36
EX = Proportionate change in quantity demanded of A Proportionate change in price of B Example 1: When the price of gold band margarine falls from Sh. 120 to Sh. 100 per Kg, the quantity demanded of prestige margarine falls from 150 to 100 units per month. EX = Proportionate change in quantity demanded of prestige Proportionate change in price of gold band EX = 150-100/150 X 100 = 5000/150 ÷ 2000/120 120 – 100/120 X 100 5000/150 X 120/2000 = 2 EX = 2 ∴ EX is elastic Example 2:
When the price of bread falls from sh 25 to sh 20 per loaf, the quantity demanded of margarine increases from 100 to 110 units per month. EX = Proportionate change in quantity demanded of margarine Proportionate change in price of bread EX = 110 –100/100 X 100 = 10% = -0.5 20-25/25 X 100 -20% EX is inelastic If the two commodities are substitutes, cross elasticity of demand would be positive as the case with gold band margarine and prestige margarine in example 1 above. This is because the price change of one and the change in quantity of the other move in the same direction. If the two commodities are complements, cross elasticity of demand would have a negative value, as is the case of bread and margarine in example 2 above. The fall in price of one leads to a fall in the quantity of another since the two are used together. When the demand curve is drawn in the case of substitutes, it would have a positive slope while in the case of complements, it would have a negative slope. These are shown below: (PY ) D (PA ) D PA = Price of A P1 PY : Price of Y P2 QB = Quantity demanded of B QX : Quantity demanded P2 of X P1 D D 0 Q1 Q2 (QB ) 0 Q1 Q2 (QX ) (a) (b) In (a), when price of A falls from P2 to P1 quantity demanded of B falls from Q2 to Q1 In (b), when price of Y falls from P1 to P2 , quantity demanded of X increases fromQ1 to Q2

Revision Questions and Answers
ECONOMICS
37
Cross elasticity of demand measures the degree of substitutability and complementarity between different commodities. The higher the positive value of EX, the higher the degree of substitutability. The higher the negative value of EX, the higher the degree of complementarity between the two commodities. The main determinant of cross elasticity of demand is the nature of the two commodities. If two commodities can satisfy equally well the same need, then cross elasticity would be high. If the commodities are not related, EX would be zero. Cross elasticity of demand can be computed using the following formulae: Point Ex This measures EX at a particular point Point EX = Δ QA• PB where Δ QA is the inverse of the slope of the demand curve
Δ PB QA Δ PB Arc EX This measures cross elasticity over a range of the demand curve. Arc EX = Δ QA• (PB1 + PB2)/2
Δ PB (QA1 + QA2)/2 ∴ Arc EX = Δ QA • PB1 + PB2
Δ PB QA1 + QA2 b) Factors which affect the own-price elasticity of demand: Own price elasticity of demand refers to the degree of responsiveness of the quantity demanded of a
commodity to changes in the commodity’s own price. The following factors affect price elasticity of demand:
i. Availability of substitutes:
The greater the number of substitutes available for a commodity over a relevant price range, the greater would be its elasticity of demand. This is because consumers can switch consumption to the substitutes in the event of an increase in the price of the commodity. The consumer has a wide variety to choose from for example, the range of bar soaps in the market (ED is greater than one). If perfect substitutes of a commodity are available, its demand is likely to be highly elastic. If no substitutes are available for a commodity, its demand would be price inelastic since the consumer has no choice.
ii. Proportion of income spent on commodity
Where the proportion of income spent on a commodity is very small, its demand would be price inelastic for example matchboxes and salt. On the other hand, if the proportion of income spent on the commodity is high, demand would be price elastic for example demand for cars will be sensitive to changes in price. Thus, for instance, an increase in price of a matchbox by 30% will not have the same effect on quantity demanded as a 30% increase in the price of a car or television set.
iii. Time
Over time, consumers’ demand patterns are likely to change. If the price of a good increases like the price of meat, initially, there will be very little change in demand since consumers’ take time to adjust their buying habits in response to the change in price. This means that demand is inelastic in the short run and elastic in the long run.
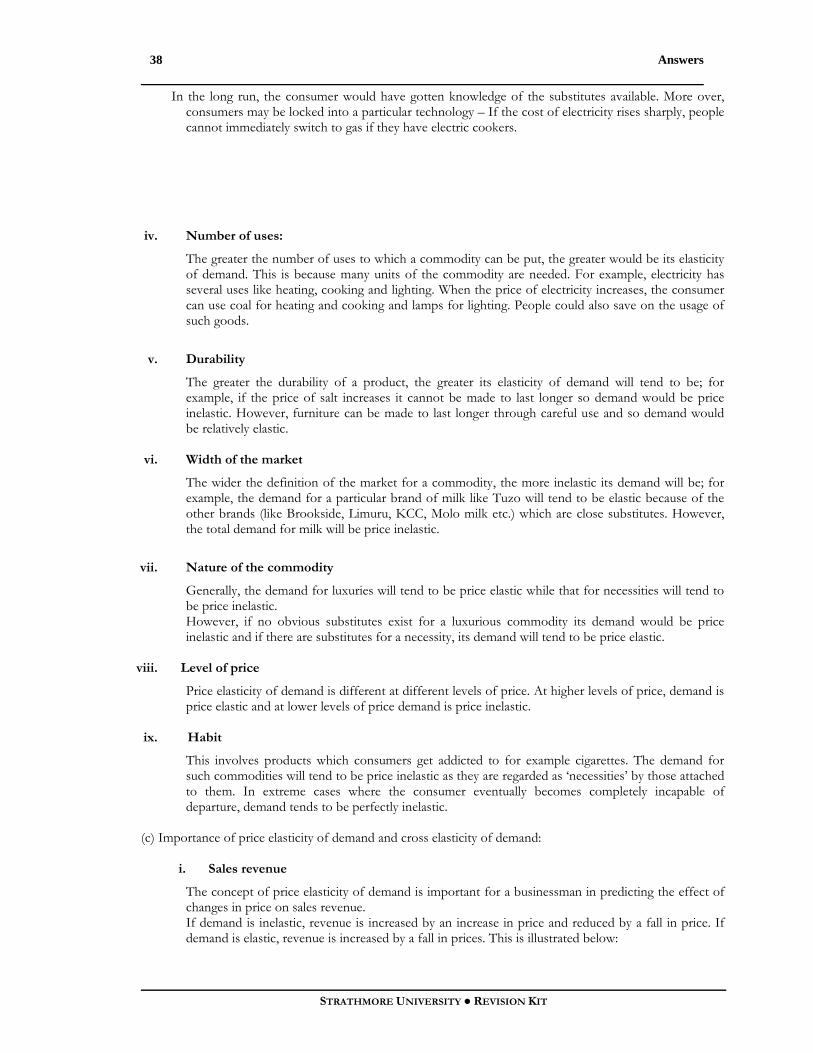
Answers
STRATHMORE UNIVERSITY ● REVISION KIT
38
In the long run, the consumer would have gotten knowledge of the substitutes available. More over, consumers may be locked into a particular technology – If the cost of electricity rises sharply, people cannot immediately switch to gas if they have electric cookers.
iv. Number of uses:
The greater the number of uses to which a commodity can be put, the greater would be its elasticity of demand. This is because many units of the commodity are needed. For example, electricity has several uses like heating, cooking and lighting. When the price of electricity increases, the consumer can use coal for heating and cooking and lamps for lighting. People could also save on the usage of such goods.
v. Durability
The greater the durability of a product, the greater its elasticity of demand will tend to be; for example, if the price of salt increases it cannot be made to last longer so demand would be price inelastic. However, furniture can be made to last longer through careful use and so demand would be relatively elastic.
vi. Width of the market
The wider the definition of the market for a commodity, the more inelastic its demand will be; for example, the demand for a particular brand of milk like Tuzo will tend to be elastic because of the other brands (like Brookside, Limuru, KCC, Molo milk etc.) which are close substitutes. However, the total demand for milk will be price inelastic.
vii. Nature of the commodity
Generally, the demand for luxuries will tend to be price elastic while that for necessities will tend to be price inelastic. However, if no obvious substitutes exist for a luxurious commodity its demand would be price inelastic and if there are substitutes for a necessity, its demand will tend to be price elastic.
viii. Level of price
Price elasticity of demand is different at different levels of price. At higher levels of price, demand is price elastic and at lower levels of price demand is price inelastic.
ix. Habit
This involves products which consumers get addicted to for example cigarettes. The demand for such commodities will tend to be price inelastic as they are regarded as ‘necessities’ by those attached to them. In extreme cases where the consumer eventually becomes completely incapable of departure, demand tends to be perfectly inelastic.
(c) Importance of price elasticity of demand and cross elasticity of demand:
i. Sales revenue
The concept of price elasticity of demand is important for a businessman in predicting the effect of changes in price on sales revenue. If demand is inelastic, revenue is increased by an increase in price and reduced by a fall in price. If demand is elastic, revenue is increased by a fall in prices. This is illustrated below:

Revision Questions and Answers
ECONOMICS
39
(PX ) (PX ) elastic demand D1 inelastic demand D PED > 1 PED <1 P2
X X P1 Y Y D D1 0 Q2 Q1 (QX ) 0 Q2 Q1 (QX )
To illustrate elasticity and sales revenue Curve DD represents elastic demand curve while curve D1D1 represents inelastic demand curve. An increase in the price of X from P1 to P2 will reduce the quantity demanded in both cases from Q1 to Q2. The revenue lost due to the fall in quantity demanded is Y in both cases while the gain in revenue as a result of higher prices is X. In the case of elastic demand, Y (the fall in revenue due to fall in quantity demanded) is greater than X ( the gain in revenue) – The net effect is a fall in total revenue. In the case of inelastic demand, X (the gain in revenue) is greater than the loss in revenue (Y) hence the total net effect is an increase in total revenue. A fall in price will have the opposite effect in both cases. Alternatively, a combined diagram can be used to illustrate the concept of elasticity of demand and sales revenue by taking into account the perception that demand is more elastic at higher prices and relatively inelastic and lower prices. Price (P) D P2 X1 P1 Y1 P0 X P Y D 0 Q2 Q1 Q0 Q Quantity Demanded (Qd )
To illustrate elasticity of demand and sales revenue

Answers
STRATHMORE UNIVERSITY ● REVISION KIT
40
The upper portion of the demand curve (DD) is more elastic and an increase in price from P1 to P2 reduces the quantity demanded from Q1 to Q2 units. In this case, Y1 (the fall in revenue due to a fall in quantity demanded) is greater than X1 (the gain in revenue arising from the increase in price) – the net effect is a fall in total revenue. The lower part of the demand curve (DD) is relatively inelastic and an increase in price from P to P0 reduces the quantity demanded from Q to Q0 units; Effectively, X (the gain in revenue) is greater than Y (the loss in revenue) and the net effect is an increase in total revenue.
ii. Tax shifting
Tax shifting refers to the transfer of the money burden of taxation by the producer (on whom the tax is imposed) to the consumer in form of increased product prices. The extent to which this can be done depends on the price elasticity of demand of the commodity in question. This is illustrated below:-
S1 (PX ) PX D1 S1 S S PX : Price of X D Pt ●A QX : Quantity of X Pt ●A P1 ●B D P1 ●B S1 ●C S1 ●C S D1 0 Qt Q1 (QX ) S 0 Qt Q1 (QX )
a) Elastic demand b) Inelastic demand
DD and D1D1 represent elastic and inelastic demand curves respectively. The equilibrium price P1 determined by the intersection of the initial supply curve (SS) with the respective demand curve. Suppose there is an imposition of an indirect tax on the producer, the effect would be a fall in supply shown by the leftward shifting of the supply curve SS to S1S1 since the cost of production will increase. A new equilibrium price would be established at Pt. The vertical distance between the two supply curves at any given point represents the unit tax. So, AC is the unit tax. Out of this, the consumer pays AB in form of increased product prices and the producer bears BC which represents the unshifted tax burden. This distribution of tax between the producer and consumer is referred to as the effective incidence of tax. In the case of elastic demand, AB < BC while in the case of inelastic demand AB> BC thus it is when price elasticity of demand is low that the firm can transfer most of the money burden and when demand is perfectly price inelastic, the consumer bears the whole tax burden and when demand is perfectly price elastic, the producer bears all the tax burden.

Revision Questions and Answers
ECONOMICS
41
This is illustrated below: (PX ) S1 (PX ) D S ● A S1 S S1 D D ●C S1 S S D 0 (Qx ) 0 (Qx ) AC (total unit tax) is borne None of the burden goes to the consumer by the consumer (total tax is borne by the producer) Perfectly price inelastic demand Perfectly price elastic demand
iii. Consumption pattern
If the government wants to discourage the consumption of a particular commodity through taxation, this policy will only be effective if the price elasticity of demand for the product is high. This is shown by the initial diagrams (a) and (b) in part (ii). If price elasticity is high, the producer bears most of the tax burden and therefore reduces production. Similarly, the government can encourage consumption and production of inelastic demand goods by reducing taxes while increasing provision of subsidies.
iv. Devaluation
Price elasticity of demand is relevant in a country considering devaluation as a means of rectifying its balance of payment problems, that is, an unfavorable balance of payment position. Devaluation refers to the cheapening of the value of a country’s currency in terms of a foreign currency in a fixed exchange rate regime/system. This would reduce export and increase import prices.
This would improve the balance of payment situation if the demand for both exports and imports is highly price elastic since the quantity demanded would respond significantly to changes in price. However, if the demand for both imports and exports is low, the balance of payments position would not improve; thus if demand for both imports and exports is price inelastic, a country would not consider devaluation as a means of rectifying (improving) its BOP position.
v. Fluctuation of Agricultural Product Prices
The more inelastic the demand for agricultural products are the more widely prices will fluctuate with changes in output from period to period. This is illustrated by the diagram below:

Answers
STRATHMORE UNIVERSITY ● REVISION KIT
42
D1 DD: Elastic demand curve Price (PX ) D1 D1 : Inelastic demand curve S1 PX : Price of X D S QX: Quantity of X S2 SS: Initial supply curve P2 P1 Pe ●e P3 P4 S1 S S2 D1 D 0 Qe Quantity (QX )
Fig: To illustrate the relevance of PED and the degree of price fluctuations particularly for primary (agricultural) products.
The equilibrium position is established when price is Pe. When there is a fall in supply due to a poor harvest arising from poor weather conditions, supply curve would shift leftwards to S1S1. Price increases to P1 and to P2 for elastic and inelastic demand respectively. This shows that the more inelastic demand is, the wider the fluctuations as a result of a change in supply. When there is an increase in supply, for elastic demand price would fall by a smaller extent than in the case of inelastic demand; that is, the rightward shift of the supply curve from SS to S2S2 would result in price P3 and P4 for the elastic demand DD and inelastic demand D1D1 respectively.
The demand for agricultural products tends to be price inelastic because of the following:
1) They constitute a small portion of manufactured (finished) products and therefore little
is spent on them; for example, the demand for rubber is mainly from the motor vehicle industry where rubber is for tyres which form a relatively small part of the total cost.
2) A big proportion of agricultural commodities is in form of foodstuffs whose demand is price inelastic (and are mostly necessities)
vi. Protection policy
The concept of cross elasticity of demand is useful to the government in predicting the effects of its protection policy; for example, if the government imposes a tariff on an imported commodity like clothes with the intension of protecting the local industry, in this case textile industry, then the local and imported products must be close substitutes ( EX, is very high) for the government to achieve its objectives. If the imported commodity is of a relatively higher quality, then the imposition of the tariff will not achieve its end since people will still buy the imported products. The degree of substitutability is low.
vii. Competition and pricing
If a firm is in a competitive industry, there would be a high cross elasticity between its products and those of other firms. For such a firm, it may be beneficial to lower prices in order to attract consumers from other firms. This is because the price elasticity of demand for its products is very elastic due to the availability of substitutes.

Revision Questions and Answers
ECONOMICS
43
Question 8
a) Elasticity of supply is defined as a measure of the degree of responsiveness of the quantity supplied of a commodity to changes in price.
ES = Percentage change in quantity supplied OR ES = Proportionate change in quantity supplied
Percentage change in price proportionate change in price ES = Δ QS/QS
Δ P/P = Δ QS · P = 1 x P
Δ P QS gradient QS
Because of the direct relationship between price and quantity supplied (according to the law of supply), price elasticity of supply ranges from zero to infinity. Factors affecting elasticity of supply:
1. The adjustment time: Given that it takes time for firms to adjust the quantities they produce, the supply is likely to be more elastic the longer the period of time under consideration. In the momentary period, supply cannot be increased even if there is a substantial rise in price. In the short-run, supply can be increased by employing more variable factors of production. In the long-run, the quantities of all factors of production can be increased.
2. The availability of spare capacity: If fixed factors of production are being used to the fullest extent, however great the increase in price, the supply will be inelastic. If however, a firm is operating below capacity and there are unemployed resources, supply will be elastic.
3. The level of unsold stocks: If suppliers are holding large stocks, supply will be elastic and an increase in demand can be met by running down stocks. If on the other hand stocks are depleted it may be difficult to increase output and supply will then be inelastic. It follows therefore that the higher the level of unsold stocks the more elastic will be the supply.
4. The ease with which resources can be shifted from one industry to another, that is, factor mobility: in both the short and long run, in the absence of excess capacity and unsold stocks, an increase in supply necessitates the shifting of factors of production from one use to another. This may be costly because the prices of factors may have to be raised to attract them to move and because of barriers to the mobility of labour.
5. The availability of variable factors of production: If variable factors of production are not easily available, then supply will be inelastic even if the firm has spare capacity in its fixed factors of production. A firm should be able to employ variable factors of production easily and combine these with spare fixed factors that are available before the supply becomes elastic.
(b) Elasticity of supply for agricultural products is low due to: (i) Perishable nature of products – most agricultural products are perishable and cannot therefore be
stored for long and especially since storage facilities would be very expensive to establish and maintain.
(ii) Gestation period (the period between planting and harvest) – once planted, agricultural products take time to mature and become ready for harvest; thus supply tends to be relatively inelastic during this period in that the quantity of a product cannot be increased.
(iii) Inelasticity of demand – Since agricultural products are used in small quantities as inputs (raw materials) in manufacturing processes, they are purchased in small quantities; thus production may not always be sufficient to achieve the required periodic level of supply.

Answers
STRATHMORE UNIVERSITY ● REVISION KIT
44
(c) Demand Schedule Price Quantity 10 x 180 Point Ed = ∆Q . P (Sh) (Units) 20 50 ∆P Q 80 20 = (1800) = 1.8 = (10 x 80) 100 30 1000 20 20 ∴ Arc Ed = 1.8 (elastic) = (800/400) =2 Arc Ed = ∆Q . P1 + P2 ∴ Point Ed = 2 (elastic) ∆P Q1 + Q2 = (30 – 20) . (80 + 100) (100 – 80) (20 + 30) NB: In both cases P.E.D is positive and elastic implying that the commodity is either an inferior (giffen) good or ostentatious good.
Question 9
(a) (i) Cross price elasticity of demand is defined as a measure of the degree of the responsiveness of the quantity demanded of one commodity to changes in price of another related commodity, which is either a substitute or complementary good.
It’s given by dividing the proportionate or percentage change in quantity demanded of one
commodity by the proportionate or percentage change in price of another related commodity such that:
XEd = ∆QA . PB
∆PB QA Where A & B are either substitutes or complementary goods.
Cross elasticity of demand is positive and negative for substitutes and complementary goods respectively. It is positive for substitutes since they are used alternatively such that an increase in price of one causes an increase in the quantity demanded of the other, that is, the quantity demanded of one is an increasing function of the price of the other eg. tea and coffee. D Price of tea P2 P1 D 0 q1 q2 Quantity of coffee demanded
Fig 9.1: Substitutes An increase in price of tea from P1 to P2 increases the quantity of coffee demanded from q1 to q2
Cross elasticity of demand is negative for complementary goods since they are used jointly/together such that the quantity demanded of one (eg. petrol) is a decreasing function of the price of the other (eg cars)
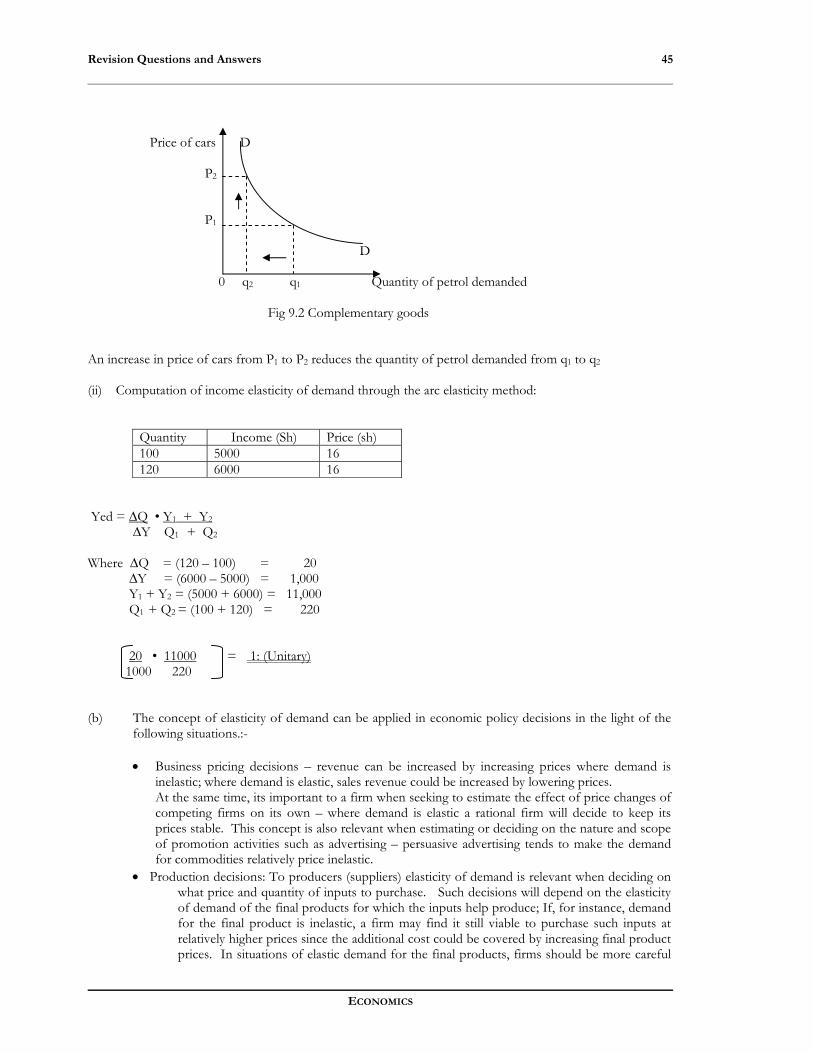
Revision Questions and Answers
ECONOMICS
45
Price of cars D P2 P1 D 0 q2 q1 Quantity of petrol demanded
Fig 9.2 Complementary goods An increase in price of cars from P1 to P2 reduces the quantity of petrol demanded from q1 to q2 (ii) Computation of income elasticity of demand through the arc elasticity method:
Quantity Income (Sh) Price (sh) 100 5000 16 120 6000 16
Yed = ∆Q • Y1 + Y2
∆Y Q1 + Q2 Where ∆Q = (120 – 100) = 20 ∆Y = (6000 – 5000) = 1,000 Y1 + Y2 = (5000 + 6000) = 11,000 Q1 + Q2 = (100 + 120) = 220 20 • 11000 = 1: (Unitary) 1000 220 (b) The concept of elasticity of demand can be applied in economic policy decisions in the light of the
following situations.:-
• Business pricing decisions – revenue can be increased by increasing prices where demand is inelastic; where demand is elastic, sales revenue could be increased by lowering prices. At the same time, its important to a firm when seeking to estimate the effect of price changes of competing firms on its own – where demand is elastic a rational firm will decide to keep its prices stable. This concept is also relevant when estimating or deciding on the nature and scope of promotion activities such as advertising – persuasive advertising tends to make the demand for commodities relatively price inelastic.
• Production decisions: To producers (suppliers) elasticity of demand is relevant when deciding on what price and quantity of inputs to purchase. Such decisions will depend on the elasticity of demand of the final products for which the inputs help produce; If, for instance, demand for the final product is inelastic, a firm may find it still viable to purchase such inputs at relatively higher prices since the additional cost could be covered by increasing final product prices. In situations of elastic demand for the final products, firms should be more careful
Answers
STRATHMORE UNIVERSITY ● REVISION KIT
46
in making input purchases, at least ensuring that input prices are comparatively low because any attempt to recover such costs, by increasing prices, tends to reduce sales and thereby necessitating a price reduction inorder to survive the competitive market ( the decision becomes self defeating)
• Government policy orientation from the standpoint of:
Estimation of revenue from indirect taxes – Those commodities which are highly price inelastic in demand should be taxed more (eg alcohol and cigarettes). The government should however take into account the need not to tax (or tax less) necessities such as food products/services whose demand is inelastic as well; tax on such basic and most essential goods/services tends to have negative welfare implications.
Protectionism: It’s in the interest of most governments to protect their domestic Industries against unfavourable external competition (largely because of the state of unequal footing between domestic and foreign industries producing virtually the same or close substitute products) by imposing tariffs on imports. This policy can be effective only where the domestic demand for both local and foreign substitutes is highly price elastic; an increase in import prices by the amount of a tariff should be sufficient to deter or discourage domestic demand for them, at least in favour of domestic substitutes (assuming that the quality and other buyer benefits of the products remain the same.)
Discouraging consumption of certain products or services Price controls/minimum wage guidelines Regulation of farmer’s incomes especially during bumper harvest. Devaluation policy.
(c) (i) Computation of point and arc elasticity of demand: Demand Schedule Price (P) Quantity (Q) 1000 5 600 6
Ped = ∆Q • P ⇒ (1/-400 •1000/5) = -0.5 ∴ Ped = 0.5 < 1 : inelastic ∆P Q
Aed = ∆Q • P1 + P2 ⇒ (1/-400 • 1600/11) = -0.36 ∴ Aed = 0.36 : inelastic
∆P Q1 + Q2
(ii) Main determinants of elasticity of demand:
• Availability of substitutes • Nature of the commodity i.e. luxury, necessity or habit-farming/addictive etc • Proportion of income spent on a commodity • Durability • Possibility of postponed use • Number of uses • Time – SR and LR • Price (initial price level)
Question 10
a) i) Point εd and point εs at Equilibrium position (E): QX = 9 – ½P2 QY = 8P + ½ P2

Revision Questions and Answers
ECONOMICS
47
P 1 2 3 4
QX 8.5 7 4.5 1
QY 8.5 18 28.5 40
F.O.C
dQX = -P ⇒ demand function denoted by the negative sign of the independent variable dP (P) i.e QX is an inverse function of P. dQY = 8 + P ⇒ Supply function denoted by the positive sign of the independent variable dP (P) i.e QY is a direct function of P.
ii) At Equilibrium QY = QX 8P + ½P2 = 9 – ½P2 8P + P2 – 9 = 0
P2 + 8P – 9 = 0 P2 – P + 9P – 9 =0 P(P – 1) + 9(P – 1) = 0 (P – 1)(P + 9) = 0 Case 1: P – 1 = 0 P = 1 Case 2: p + 9 = 0 P = -9 ∴ P = sh. 1 QX = 9 – ½ (1)2 = (9 – ½ ) = 8.5 OR QY = 8(1) + ½ (1) 2
= (8 + ½ ) = 8.5 ∴ Q = 8.5 units Pεd = ∆Q . P ∆P Q but ∆QX = -P
∆P
but P = 1
∴ ∆QX = -1 ∆P
thus, Pεd = -1 (1 ) = -0.1176 = -0.12
8.5 Pεd = 0.12 (Price inelastic demand)

Answers
STRATHMORE UNIVERSITY ● REVISION KIT
48
D PεS = ∆QY • P (P) S ∆P Q Q X = 9 - ½P2 but ∆QY = 8 + P ∆P QY = 8P + ½P2 but p = 1 1 ●E ∴ ∆QY = (8 + 1) = 9 S ∆P D Thus PεS = 1 = +1.059 = +1.06 0 8.5 (Q)
8.5 PεS = 1.06 ⇒ Supply is price elastic
b) Illustration and explanation of the importance of the concept of elasticity of supply:
• Tax shifting – sharing of the tax burden between producers and consumers. • Fluctuation of agricultural product prices. • Opportunity cost of supply eg. risk of loss of revenue where supply is price inelastic • Export promotion by devaluation etc.
If supply is more price elastic, an increase in demand will benefit both producers and consumers.
The consumer will pay a relatively lower price and the supplier will supply a relatively higher quantity.
D1 S2 Price (P) P1 D S1 P2 Pe S1 D1 S2 D 0 Qe Q1 Q2 Quantity (Q)
An increase in demand is represented by the rightward shifting of demand curve from DD to D1 D1.
S1 represents elastic supply curve and S2 represents inelastic supply curve. When demand increases the price will be at OP1 and quantity supplied at OQ1
In the case of elastic supply curve, the price will be at OP2 and quantity supplied at OQ2. Thus in the case of elastic supply curve, consumers pay a relatively lower price of OP2 and producers supply a relatively higher quantity at OQ2.
NB: If supply is inelastic, an increase in demand will not benefit both suppliers and consumers since price will be high (at P1) for consumers and suppliers will not be able to adequately increase their output..
Transfer/shifting or sharing of the tax burden/money – valuable tax: \

Revision Questions and Answers
ECONOMICS
49
Price elastic Supply Price inelastic supply Price S1 S1 (P) D S D S P1 ●A P1 ●A S1 P ●B P ●B ●C S1 D ●C D 0 Q1 Q Quantity S 0 Q1 Q (Q)
A tax imposed will lead to a fall in supply represented by a leftward shifting of the supply curve. From the diagrams above, the unit tax is AC AB represents that portion of the tax which is paid by consumers while BC represents that portion which is paid by producers. In the case of a price elastic supply curve, AB is greater than BC. In the case of a price inelastic supply curve, AB is less than BC. Thus the shifting of tax (transfer of money valuable tax) to consumers is more effective in the case of price elastic than inelastic supply. - Fluctuation of agricultural product prices:
Agricultural products/commodities tend to be supply inelastic (especially in the SR) because production cannot be increased once a crop has been planted and most (of such commodities) are perishable. Inelastic supply tends to cause more fluctuation in prices than elastic supply.
Price (P) S1 S4
S3 S2 D
P1 P4 P3
LS P0
P2 LS D
0 Q1 Q0 Q2 Quantity (Q)

Answers
STRATHMORE UNIVERSITY ● REVISION KIT
50
From the above diagram, the quantity expected to be supplied by farmers in the Long run (LR) is shown by the supply curve LS which intersects with the demand curve to establish an equilibrium price PO and the quantity QO. Suppose the actual supply is (finally) less at Q1 (due to unfavourable weather etc) the prices will fluctuate highly to P1 from P0. If however supply increases to Q2 prices will fluctuate from P0 to P2. If the commodity being supplied is more inelastic shown by the supply curve S4 price will fluctuate less to P4. Moreover, if the supply is relatively more price elastic as shown by the supply curve S3, price will fluctuate even lesser from PO to P3 etc.
Thus, elasticity of supply is relevant in explaining fluctuation of prices of agricultural products and seeking to establish appropriate government intervention policies with a view to price stability. - Producers risk losing revenue if supply is price inelastic
Implication of the nature of supply curve
Elastic Supply P S P2 P1 S 0 Q1 Q2 QS
• A lot of goods in stock for release to the market. • Products (goods) in question are relatively durable (not highly perishable). • The productive capacity can be increased within a short span of time eg. time taken to
produce is relatively shorter; It also suggests a greater factor mobility (resources are readily available for production).
• A slight change (eg increase in price from (P1 to P2) causes a more than proportionate change (eg increase in quantity supplied from Q1 to Q2 ).
Inelastic supply: S P P2 P1 S 0 Q1Q2 QS
Revision Questions and Answers
ECONOMICS
51
• Depicts the perishable nature of goods. • Limited stock • Production capacity can only be increased within a longer period of time (LR) i.e. more. • Time is required to change the amount of supply.
A slight change (eg increase in price from P1 to P2) causes a less than proportionate change
(increase in quantity supplied from Q1 to Q2 ).
NB: In both cases, the amount of revenue derived by suppliers from sales is subject to the nature of elasticity of demand. - Export promotion by devaluation:
Elasticity of supply assists the government in determining the impact of devaluation on export volumes and revenue in terms of foreign exchange. Devaluation being the reduction of the value of a domestic currency relative to a foreign or foreign currencies, makes imports expensive and exports relatively cheaper with a view to improving BOP position. Even where the elasticity of demand for both exports and imports is high, it would still be a sufficient condition for the government to look into the nature of elasticity of supply in order to estimate the impact of devaluation on exports and BOP position. Supply should therefore be elastic if the policy of devaluation is to be effective; elastic in the sense that it should be possible to increase the productive capacity of export commodities within the time frame supportive of devaluation. It implies that as exports become cheaper due to devaluation with the foreign demand (for these exports) increasing, the productive capacity should make possible the availability of (more) export goods compatible with the increase in demand; Without which devaluation policy becomes ineffective.
Question 11
(a) Determining the type of goods X, Y, Z and W really are and why : The basis of determination is either own price elasticity of demand or income elasticity of demand of
the commodity OR simply looking at the direction of change in the quantity demanded as own price changes at constant income or demand for a commodity as income changes at constant own price.
Approach:

Answers
STRATHMORE UNIVERSITY ● REVISION KIT
52
Commodity X: PX QX Income (Y) PX QX Income (Y)
10 30 10000 16 24 10000 12 26 10000 16 26 12000 An increase in price from Ksh (10 to 12) An increase in income from Ksh (10,000 to at constant income of Kshs.10,000 leads to a 12,000) at a constant price of 16 leads to an fall in quantity demanded from (30 to 26) increase in demand from (24 to 26) units; units. Therefore, the quantity demanded therefore the demand increases with increase decreases with increase in price implying in income implying that demand is an that demand is a decreasing function of increasing function of income which is no own price which effectively proves that X doubt an indication of a normal good. is a normal good. Ped =∆Q/∆P • P/Q Yed = ∆Q/∆Y • Y/Q ∆Q = (26 – 30) = -4 ∆Q = (26 – 24) = 2 ∆P = (12 – 10) = 2 ∆Y = 12000 – 10000) = 2000 P = 10 Q = 24 Q = 30 Y = 10000 ∴ Ped = (-4/2 x 10/30) = - 2/3 ∴ Yed = (2/2000 x 1000/24) = (10/24) = 5/12 Or Or Ped =Proportionate or % change in quantity demanded Yed = Proportionate or % change in demand Proportionate or % change in own price Proportionate or % change in income 26 – 30 x 100 26 – 24 x 100 30____ 24_____ 12 – 10 x 100 12,000 – 10,000 x 100 10 10,000 = -2/3 = 25/3/20 = 25/3 x 1/20 = 5/12 Ped is –ve: X is a normal good Yed is +ve: X is a normal good

Revision Questions and Answers
ECONOMICS
53
Price of X D Income (Y) Angel’s curve 12 12,000 10,000 10 8,000 D 4,000 0 26 30 Quantity demanded Fig 11.1: Normal demand curve 0 24 26 Quantity of X (QX) Fig 11.2: Income demand curve for a normal good Commodity Y: PY QY Income (Y) PY QY Income (Y) 8 18 12000 8 15 10000 10 16 12000 8 18 12000 An increase in price from Ksh.(8 to 10) at An increase in income from Ksh constant income of 12000 causes the (10000 to 12000) at constant price of quantity demanded to fall from (18 to 16) units 8 increases the demand for commodity implying that Y is a normal good. Y from (15 to 18) units, indicating that Y, like X, is a normal good. Ped = ∆QY/∆PY • PY/QY Yed = ∆Q/∆Y • Y/Q where Y stands of Income 16 – 18 x 8/18 18 – 15 x 8/15 10 – 8 12000 – 10000 = -(2/2 x 8/18) = -4/9 = -2.25 = 3/2000 x 10000/15 = 1 OR Ped = 16 – 18 x 100 = -100/9/25 OR 18 – 15 x 100/12000 – 10000 x 100 18______ = -(100/9 x 1/25) 15 10000 10 – 8 x 100 = -4/9 = -2.25 = (3/15 x 100)/20 = 1 8 Income Angel’s curve PY (Y) D
10 12000 10000 8 D 0 16 18 QY 0 15 18 QY

Answers
STRATHMORE UNIVERSITY ● REVISION KIT
54
Commodity Z: Commodity W: PZ QZ Income (Y) PW QW Income (Y) 12 20 10000 10 20 10000 12 18 12000 10 18 12000 An increase in income from 10000 to 12000 at Again, commodity W is an inferior good constant price of 12 leads to a fall in demand but of a giffen nature since when price from (20 to 18) units. It therefore follows increases from 10 to 12 at constant income that the demand for commodity Z is a of 12000, the quantity demanded is also decreasing function of income, implying that Z increasing from (18 to 21) units. is an inferior good; an inferior good is that good whose demand is a decreasing function Yed = ∆Q/∆Y • Y/Q of consumer’s income i.e. whose purchases is = (-2/2000 x 10000/20) = -½ due to the consumer’s present inability to The income elasticity of demand (Yed) afford close substitutes. is -ve
The income elasticity of demand for inferior goods is negative. PW QW Income (Y) 10 18 12000 Confirmation: 12 21 12000 Yed = ∆Q/∆Y • Y/Q = (-2/2000 x 10000/20) = -½ Ped = ∆Q/∆P • P/Q OR (18 – 20 x 100)/(12000 – 10000 x 100) = (3/2 x 10/18) = 5/6 20 10000 =-½ Yed is indeed –ve and therefore Z is an inferior good. Income PW
(Y) D Angel’s curve 12
12000 10 D 10000 0 18 21 QW 0 18 20 QZ Since Yed is –ve and Ped is +ve then commodity W is an inferior good Fig 11.5: Income demand curve for an inferior largely of a giffen nature. Giffen goods good are goods that are inferor which also form a substantial portion of the consumer’s budget (income). As the price of a giffen good falls, more of the consumer’s income (money) is released to buy more (superior) substitutes; as price increases, households have to revert more income (money) to the purchase (consumption) of these goods.

Revision Questions and Answers
ECONOMICS
55
(b) Identifying substitutes and complements with justified answers:
• Relationship between X and Y: The relationship is determined by looking at the cross elasticity of demand of the commodities X and Y as worked out below:
PX PY QX QY 16 10 28 16 16 12 30 14
Xed = ∆QX /∆PY • PY/QX ∆QX = (30-28) = 2 ∆PY = (12-10) = 2 PY = 10; QX = 28 Xed = (2/2 X 10/28) = 5/14
Since Xed is +ve, X and Y are substitutes implying that an increase in price of commodity Y (from 10 to 12) increases the quantity demanded of commodity x (from 28 to 30 units); the demand curve for substitutes is therefore positively sloped denoting a direct relationship between the price of commodity Y and the quantity of X demanded e.g tea and coffee.
Price of Y (PY) D 12 10 D 0 28 30 Quantity demanded of X (QX ) Fig 11.6: Substitutes
Relationship between Y and Z: PY PZ QY QZ 8 12 18 18 10 12 16 16 Xed = ∆QZ/∆PY • PY/QZ ∆QZ = (16-18) = -2 ∆PY = (10-8) = 2 PY = 8; QZ = 18 Xed = (-2/2 X 8/18) = -4/9

Answers
STRATHMORE UNIVERSITY ● REVISION KIT
56
PY D 10 ● 8 ● D 0 16 18 QZ Fig 11.7: Complements Since Xed is –ve, Y and Z are complements implying that an increase in price of Y (from 8 to 10) decreases the quantity demanded of commodity Z (from 18 to 16 units); the demand curve for complements is therefore negatively sloped implying (in this case) that the demand for Z is a decreasing function of the price of Y e.g. car and petrol. Relationship between Z and W: PZ PW QZ QW 12 10 16 18 12 12 14 21 Xed = ∆QZ/∆PW . PW/QZ ∆QZ = (14-16) = -2 ∆PW = (12-10)= 2 PW = 10; QZ = 16 Xed = (-2/2 X 10/16) = -5/8 PW D 12 10 D 0 14 16 QZ Fig 11.8: Complements When the price of W increases from 10 to 12, the quantity demanded of W increases from 18 to 21 since it’s an inferior good and at the same time the quantity demanded of Z falls from 16 to 14 yet the price of Z remains constant at 12. Z is therefore a superior complement of W Since Xed is –ve, W and Z are complementary goods such that an increase in price of W from 10 to 12 reduces the quantity of Z demanded from (16 to 14) units. (c) Effect of a successful advertising campaign that convinces consumers to buy more of Y on:
(i) Consumption of Commodity X: Since X and Y are substitutes, a positive (effective) advertising campaign that leads to more consumption commodity Y reduces the consumption of X (particularly because X and Y are
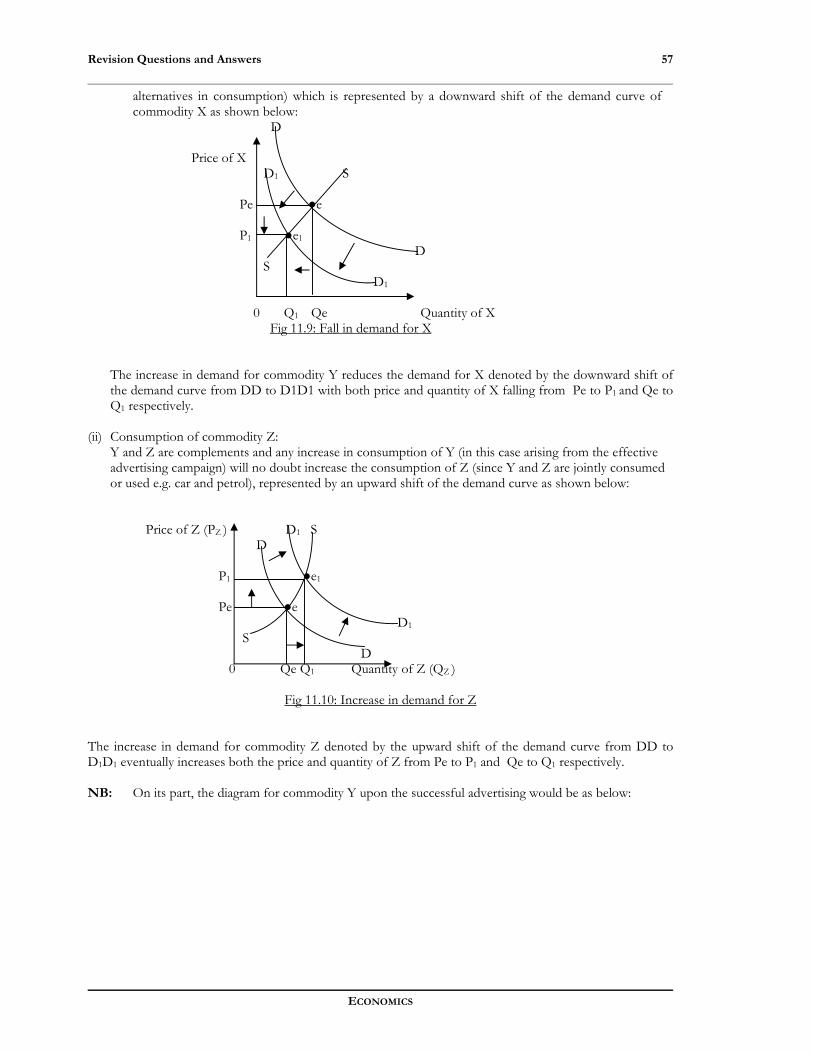
Revision Questions and Answers
ECONOMICS
57
alternatives in consumption) which is represented by a downward shift of the demand curve of commodity X as shown below: D Price of X D1 S
Pe ●e P1 ●e1 D
S D1 0 Q1 Qe Quantity of X Fig 11.9: Fall in demand for X
The increase in demand for commodity Y reduces the demand for X denoted by the downward shift of the demand curve from DD to D1D1 with both price and quantity of X falling from Pe to P1 and Qe to Q1 respectively.
(ii) Consumption of commodity Z: Y and Z are complements and any increase in consumption of Y (in this case arising from the effective
advertising campaign) will no doubt increase the consumption of Z (since Y and Z are jointly consumed or used e.g. car and petrol), represented by an upward shift of the demand curve as shown below:
Price of Z (PZ ) D1 S D P1 ●e1 Pe ●e D1 S D 0 Qe Q1 Quantity of Z (QZ )
Fig 11.10: Increase in demand for Z The increase in demand for commodity Z denoted by the upward shift of the demand curve from DD to D1D1 eventually increases both the price and quantity of Z from Pe to P1 and Qe to Q1 respectively. NB: On its part, the diagram for commodity Y upon the successful advertising would be as below:

Answers
STRATHMORE UNIVERSITY ● REVISION KIT
58
D1 Price of Y S D P1 ●e1 Pe ●e D1 S D 0 Qe Q1 Q2 Quantity of Y
Fig 11.11: Increase in demand for Commodity Y NB: More on the relationship between W and Z:
Borne of contention:- Some students argue that when the price of W increases from 10 to 12, the quantity demanded of W increases from 18 to 21 since it’s an inferior good and at the same time the quantity demanded of Z falls from 16 to 14 yet the price of Z remains constant at 12, therefore Z is a superior substitute of W.
• Basis of determination/confirmation of the relationship between commodities/goods: 1. Direction of change in quantity demanded of one good due to change in the quantity demanded
of another; if the quantity demanded of W increases while that of Z falls the immediate necessary condition of reasoning/decision/conclusion would be that W and Z are substitutes, which may infact be untrue.
2. Direction of change in quantity demanded of one good (e.g Z) as a result of change in price of another (related) good (e.g. W)
3. Computation of cross elasticity of demand. In the 1st case (i), it’s possible for the quantity demanded of one good to fall not strictly because of an increase in the quantity demanded of another related good but indeed as a result of an increase in price (of the commodity whose quantity demanded has actually increased). This is exactly what is manifested in the relationship between W and Z above. Therefore, to be able to confirm the actual relationship between goods, it’s important to consider alternatives (ii) and (iii) especially (ii) which serves as the sufficient condition for determination. By working out the cross elasticity of demand of W and Z (in our case) one should be able to realize that it’s indeed a negative value (i.e. –5/8), implying that W and Z are infact complements and NOT substitutes. Moreover, it should be clear that the direction of change in the quantity demanded of a good due to change in its own price depends on the nature of the good itself. Question 12 (a) Own-price elasticity of demand is defined as a measure of the degree of responsiveness of the quantity
demanded of a commodity (tickets) to changes in price (of the commodity). Own-price elasticity of demand is negative(-ve) implying that demand is a decreasing function of price,
that is, an increase or decrease in price causes a decrease or increase in the quantity of video tickets

Revision Questions and Answers
ECONOMICS
59
demanded. The absolute value of the own-price elasticity of demand is far less than one (0.05) suggesting that demand is highly inelastic.
It therefore means that an increase in ticket prices will no doubt reduce the demand for tickets but in a
much lesser proportion such that the overall ticket sales revenue increases.
Clearly, other things remaining constant, the managing director’s contemplation of a moderate increase in ticket prices in order to increase sales is indeed rational, prudent and therefore a good idea.
Price (tickets) D Where DD: Demand Curve P: Price Q: Quantity Demanded P2 : Increase in price : Decrease in quantity P1 demanded. D 0 q2 q1 Quantity Demanded (tickets)
Fig 12.1: A highly inelastic demand for tickets The magnitude of increase in price is much greater than that of the fall in quantity of tickets demanded such that: Pεd = dQ • P = -0.05 dp Q (b) Advertising elasticity is again, less than one and positive (+0.70) implying that demand is inelastic and an
increasing function of advertising i.e. an increase in advertising increases demand but less than proportionately; overall, revenue is expected to increase.
Advertising being the whole process or set of informative, educative, entertaining and persuasive
promotional activities aimed at largely influencing consumer perception and demand, the managing Director’s contemplation of a moderate increase in the advertising budget would be a good idea if such an increase is commensurate with increase in revenue: assuming that other factors are held constant.
Advertising Cost D (budget) C2 X C1 D Y 0 Q1 Q2 Quantity demanded of tickets
Fig 12.2: Effect of an increase in advertising budget on demand for tickets

Answers
STRATHMORE UNIVERSITY ● REVISION KIT
60
Where X>Y and price is low the advertising budget should not be increased since the quantity demandedincreases by a smaller proportion (which when multiplied by a lower price gives a relatively lower revenue).
(c) Refreshment price elasticity, first and foremost, implies that refreshments are for sale:; and that the
price of movie per person is the per unit price of tickets. Refreshment price elasticity (-0.12) is with a negative sign implying that the demand for refreshments is a reducing function of refreshment price. The absolute value (0.12) is less than one(1) implying that the demand for refreshments is inelastic, that is, an increase or decrease (change) in refreshment prices causes a less than proportionate decrease or increase (change) in the quantity of refreshment (items) demanded.
Tickets (movie) and refreshments can be consumed jointly though they are not necessarily complementary, since utility (satisfaction) can still be derived from an exclusive consumption (Movie/tickets).
Complementary goods are those goods which the demand for one is a decreasing function of the price
of the other, such that no utility/satisfaction can be derived by exclusively consuming either of them eg. car and petrol.
Therefore, tickets and refreshments can partly be looked at as complementary but only to the extent to
which they are jointly consumed. Importantly, its possible to have two categories of consumers: those watching movies while taking refreshments and thus basing their decision on both ticket and refreshment prices; others (consumers) satisfied with just watching movies without taking any refreshments, their decision being restricted to ticket price (only).
However, the inelastic nature of demand for both tickets and refreshments (according to the historical ticket – sales data) implies that any ticket buyer would want to have at least some refreshments, such that the cross elasticity of demand is negative (and inelastic) denoting complementarity (which is low in this case – not perfect complements). Therefore, to the extent that tickets and refreshments are complementary, the relationship can be represented by way of a diagram as below: Price
(Tickets) D
P1 P P2
D 0 R1 R R2 Quantity demanded
(refreshments) Fig 12.3: Complementarity of goods
Assuming that P = 5 P1 = 10 R = 100 R1 = 80 Xεd = dR • P dP R ⇒ -20 • 5 = -0.2 5 100 Xεd = 0.2 Implication: (-) : complementarity

Revision Questions and Answers
ECONOMICS
61
( 0.2 < 1): inelastic demand. d) Nairobi population elasticity is positive and less than one (+0.65) implying that demand for tickets is an
increasing function of population, and that demand is inelastic. If the population of Nairobi increased from 120,000 to 122,400 people (by 2%) the demand for tickets is
expected to increase but less than proportionately. Assuming that the aim of Olympic Movie Theatre Ltd is to maximize sales revenue, its wish would be for
the Nairobi population to increase even more. This direct relationship between population and ticket sales/demand may hypothetically be illustrated as
follows:
Population D DD: Demand Curve 122,400 120,000 D
0 2000 2030 Quantity Demanded (tickets)
Fig: 12.4: Effect of change in population on ticket sales.
If Nairobi population increases by 2% (from 120,000 to 122,400), the quantity of tickets demanded would increase by less than 2%, say 1.5% (from 2000 to 2030).
Assuming all other factors are held constant, the increase in Nairobi population would benefit Olympic Movie Theatre Ltd and especially since the change in population, in the first place, is exogenous to (independent of) company operations.
NB: The nature of the demand curve (DD) above is such that it slopes upwards from either the
Origin (zero) or slightly above the origin (as shown on the diagram above.) This is because of two possibilities:
• At zero: No people no ticket sales – (the most obvious!) • Above zero: It requires a certain level of population for theatre activities to thrive (become cost-
effective). Overall, it’s possible to have a large population which is theatre – insensitive (or otherwise incapable) or a comparatively smaller population that is highly responsive to theatre (theatre fans). More on part (d) Population elasticity = Percentage change in quantity demanded of tickets Percentage change in population Percentage change in population = Change in population x 100 Original population 122,400 – 120,000 x 100
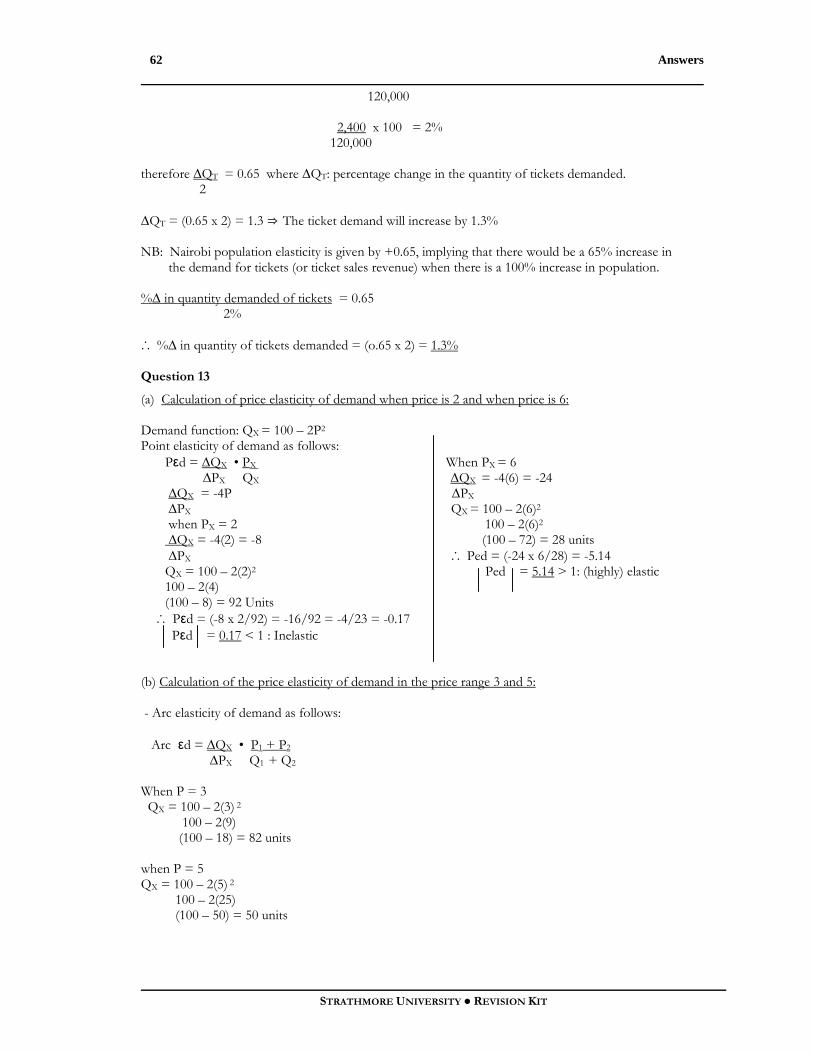
Answers
STRATHMORE UNIVERSITY ● REVISION KIT
62
120,000 2,400 x 100 = 2% 120,000 therefore ∆QT = 0.65 where ∆QT: percentage change in the quantity of tickets demanded. 2 ∆QT = (0.65 x 2) = 1.3 ⇒ The ticket demand will increase by 1.3% NB: Nairobi population elasticity is given by +0.65, implying that there would be a 65% increase in the demand for tickets (or ticket sales revenue) when there is a 100% increase in population. %∆ in quantity demanded of tickets = 0.65 2% ∴ %∆ in quantity of tickets demanded = (o.65 x 2) = 1.3% Question 13
(a) Calculation of price elasticity of demand when price is 2 and when price is 6: Demand function: QX = 100 – 2P2 Point elasticity of demand as follows: Pεd = ∆QX • PX When PX = 6 ∆PX QX ∆QX = -4(6) = -24 ∆QX = -4P ∆PX ∆PX QX = 100 – 2(6)2 when PX = 2 100 – 2(6)2
∆QX = -4(2) = -8 (100 – 72) = 28 units ∆PX ∴ Ped = (-24 x 6/28) = -5.14 QX = 100 – 2(2)2 Ped = 5.14 > 1: (highly) elastic 100 – 2(4) (100 – 8) = 92 Units ∴ Pεd = (-8 x 2/92) = -16/92 = -4/23 = -0.17 Pεd = 0.17 < 1 : Inelastic (b) Calculation of the price elasticity of demand in the price range 3 and 5: - Arc elasticity of demand as follows: Arc εd = ∆QX • P1 + P2 ∆PX Q1 + Q2 When P = 3 QX = 100 – 2(3) 2 100 – 2(9) (100 – 18) = 82 units when P = 5 QX = 100 – 2(5) 2 100 – 2(25) (100 – 50) = 50 units

Revision Questions and Answers
ECONOMICS
63
Demand schedule
PX QX 5 50 3 82 ∆QX = (82 – 50) = (32) ∆PX 3 – 5 -2 ∴ Arc εd = 32 5 + 3 -2 50 + 82 -16 ( 8) = -128 = -32 132 132 33 = -0.969 Arc εd = 0.97<1: inelastic (c) Pεd = ∆QX • PX
∆PX QX QX = 100 - 2 P2 Where PX = 5, QX = 50 ∆QX = -4P = -20 at P = 5 ∆PX
∴ Pεd = (-20 x 5/50) = -2
Pεd = 2 > 1 : price elastic demand Advice:
• The demand for commodity X is (price) elastic implying that any change in price causes a more than proportionate change in quantity demanded (and revenue from sales which is the product of the price and quantity of X purchased).
• An increase in price of commodity X, in this case, will more than proportionately reduce the quantity demanded and revenue; a fall in price would more than proportionately increase the quantity demanded and revenue from sales.
• Accordingly therefore, since the producer of commodity X seeks to maximize sales (and profits) it would be very much advisable to either reduce the price or maintain it stable at 5 but NOT increasing it above 5.
• A diagram can also be used to clearly demonstrate to the producer the impact of a price change on sales revenue where demand is price elastic.
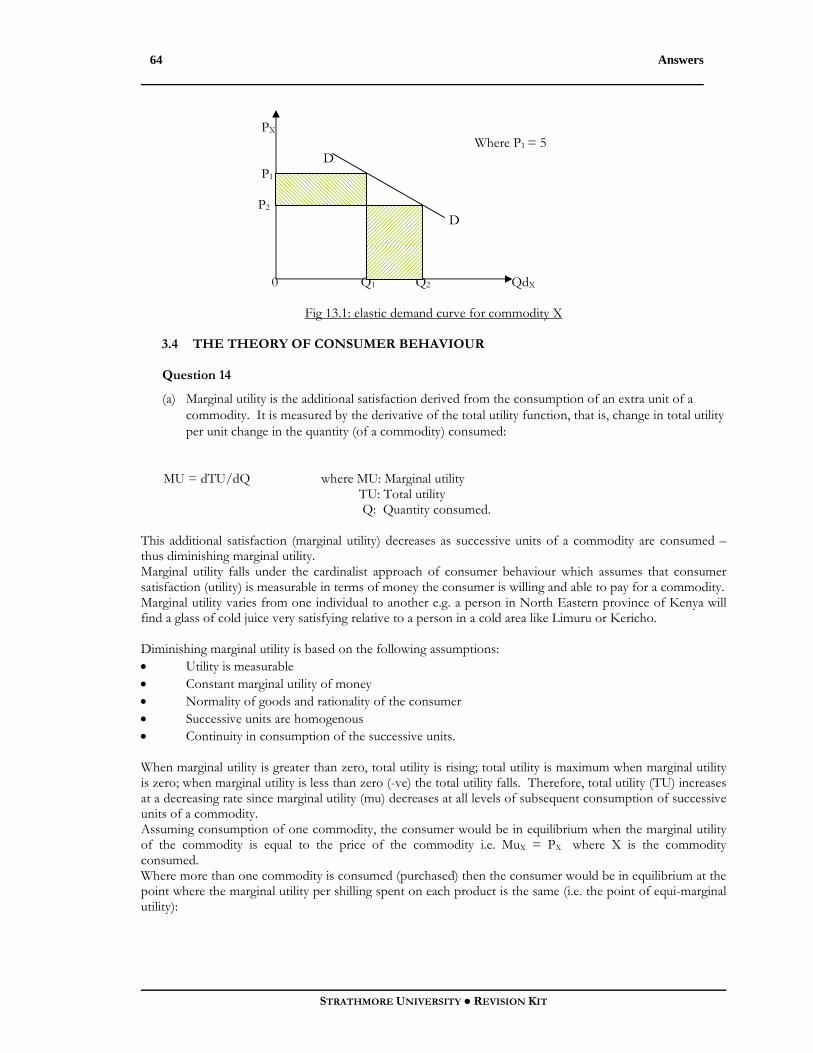
Answers
STRATHMORE UNIVERSITY ● REVISION KIT
64
PX Where P1 = 5 D P1 P2 D 0 Q1 Q2 QdX
Fig 13.1: elastic demand curve for commodity X 3.4 THE THEORY OF CONSUMER BEHAVIOUR
Question 14
(a) Marginal utility is the additional satisfaction derived from the consumption of an extra unit of a commodity. It is measured by the derivative of the total utility function, that is, change in total utility per unit change in the quantity (of a commodity) consumed:
MU = dTU/dQ where MU: Marginal utility
TU: Total utility Q: Quantity consumed. This additional satisfaction (marginal utility) decreases as successive units of a commodity are consumed – thus diminishing marginal utility. Marginal utility falls under the cardinalist approach of consumer behaviour which assumes that consumer satisfaction (utility) is measurable in terms of money the consumer is willing and able to pay for a commodity. Marginal utility varies from one individual to another e.g. a person in North Eastern province of Kenya will find a glass of cold juice very satisfying relative to a person in a cold area like Limuru or Kericho. Diminishing marginal utility is based on the following assumptions: • Utility is measurable • Constant marginal utility of money • Normality of goods and rationality of the consumer • Successive units are homogenous • Continuity in consumption of the successive units. When marginal utility is greater than zero, total utility is rising; total utility is maximum when marginal utility is zero; when marginal utility is less than zero (-ve) the total utility falls. Therefore, total utility (TU) increases at a decreasing rate since marginal utility (mu) decreases at all levels of subsequent consumption of successive units of a commodity. Assuming consumption of one commodity, the consumer would be in equilibrium when the marginal utility of the commodity is equal to the price of the commodity i.e. MuX = PX where X is the commodity consumed. Where more than one commodity is consumed (purchased) then the consumer would be in equilibrium at the point where the marginal utility per shilling spent on each product is the same (i.e. the point of equi-marginal utility):

Revision Questions and Answers
ECONOMICS
65
MUx/Px = MUy/Py =MUn/Pn Where X: Commodity X Y: Commodity Y n: Commodity n Marginal Utility (MUX ) 0 X1 Units of X(QX ) MU
Fig 14.1: Diminishing Marginal Utility
Units of commodity X (QX)
Total Utility (TUX )
Marginal Utility (MUX )
0 0 - 1 10 10 2 18 8 3 24 6 4 28 4 5 29 1 6 29 0 7 27 -2
(b)(i) Consumer equilibrium under the cardinalist approach:
The cardinalist approach of consumer theory assumes measurable utility in monetary terms such that the consumer is in equilibrium when marginal utility derived from the consumption of a commodity is equal to the unit price of the commodity, that is, MUX = Px. Where there are more than one commodities, the condition for the equilibrium of the consumer is the equality of the ratios of the marginal utilities of the respective commodities to their prices i.e.
MUX = MUY = MUn PX PY Pn The marginal utility per shilling spent on all commodities is the same.
Assuming one commodity (X), a fall in price distorts the equilibrium of the consumer which becomes Mux>Px; to go back to equilibrium the consumer should reduce the marginal utility of X by consuming more of X pursuant to the oxiom of diminishing marginal utility.
Assuming commodities X and Y, consumer equilibrium is attained where MUX = MUY: where MUx & MUy: marginal utilities of commodities X and Y PX PY respectively.

Answers
STRATHMORE UNIVERSITY ● REVISION KIT
66
Px & Py : Prices of commodities X and Y respectively.
If for instance, the price of X falls, Mux/Px>Muy/Py and to go back to equilibrium, Muy should be increased by consuming less of commodity Y or increasing the consumption of X in order to reduce Mux again pursuant to the law of diminishing marginal utility.
Therefore, as the price of a commodity (x) increases, the consumer’s marginal utility falls such that the consumer is now willing and able to purchase relatively less units of X (in order to increase utility) thereby reducing the quantity demanded of commodity X. If however, the price of X falls, Mux increases and therefore the consumer would be willing and able to buy more of X hence increasing the quantity demanded of X. Thus a normal demand curve is based on the law of diminishing marginal utility.
(ii) Consumer equilibrium under the ordinalist approach:
Consumer equilibrium refers to a specific point in consumption of (two) goods from which the consumer derives maximum satisfaction subject to a given budget constraint (determined by the consumer’s income and commodity prices). This equilibrium point is achieved at the point of tangency of a budget line to the highest possible indifference curve; at this point, the slope of the indifference curve (i.e. marginal rate of substitution – MRS) is equal to the slope of the budget line (i.e. relative commodity prices) Thus, at equilibrium MRSxy = Px/Py. Indifference curve – defined as the locus of possible combinations of two commodities their consumption from which the consumer derives the same level of satisfaction. Such curves are negatively sloped, do not intersect and convex to the origin. Budget line – refers to the locus of combinations of two goods whose purchase exhausts the consumer’s budget constraint (money outlay).
Units of Units of Y Commodity Y I/PY
A I I/PX 0 Units of Commodity X 0 B Units of X
Fig 14.2: Indifference Curve Fig: 14.3: Budget line At the point of tangency, the consumer is said to be in equilibrium as shown below:

Revision Questions and Answers
ECONOMICS
67
Units of Commodity Y
A Ye ● e I3 I2 I1 B 0 Xe Units of Commodity X Fig : 14.4: Consumer equilibrium
Point (e) is consumer equilibrium point where the slope of the budget line (AB) (Px/Py) is equal to the slope of the indifference curve (I2) (MRSXY) with Xe of X and Ye of Y. The indifference curve (I2) has its maximum convexity at point (e) denoting diminishing marginal rate of substitution.
The indifference curve (I1) is attainable but inefficient since it does not maximize satisfaction, that is, consumer’s income is not fully utilized. Similarly, indifference curve (I3) is NOT attainable with the present level of income and commodity prices. It is therefore at the point of tangency (e) that the consumer maximizes satisfaction by fully spending the disposable income on Xe of X and Ye of commodity Y, given the prices of X and Y. Question 15
(a)(i) An indifference curve is the locus of all possible combinations of two commodities their consumption from which the consumer derives the same level of satisfaction.
Units of Y U 0 Units of X
Fig 15.1: An Indifference curve (ii) The main characteristics of indifference curves:
• Negatively sloped: Indifference curves slope downwards from left to right implying that
more of one commodity is consumed by reducing the consumption of the other commodity while deriving the same level of satisfaction, that is, marginal rate of substitution (MRS).
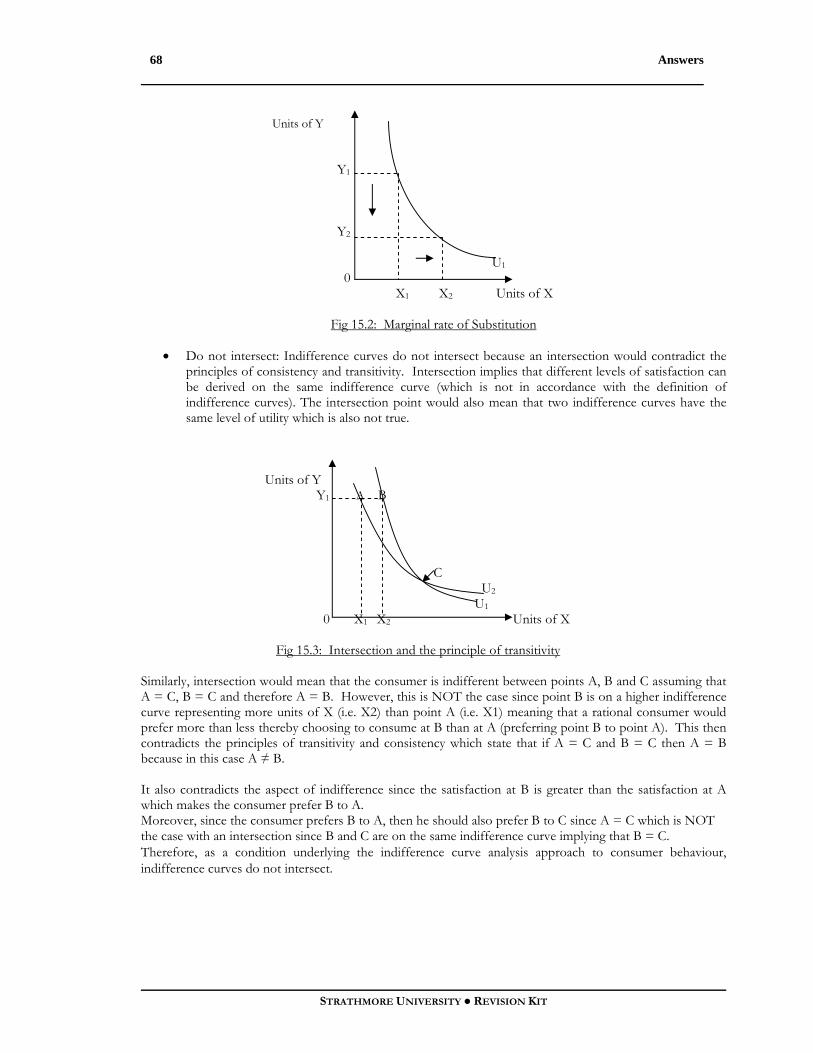
Answers
STRATHMORE UNIVERSITY ● REVISION KIT
68
Units of Y Y1 Y2 U1 0 X1 X2 Units of X
Fig 15.2: Marginal rate of Substitution
• Do not intersect: Indifference curves do not intersect because an intersection would contradict the principles of consistency and transitivity. Intersection implies that different levels of satisfaction can be derived on the same indifference curve (which is not in accordance with the definition of indifference curves). The intersection point would also mean that two indifference curves have the same level of utility which is also not true.
Units of Y Y1 A B C U2 U1 0 X1 X2 Units of X
Fig 15.3: Intersection and the principle of transitivity
Similarly, intersection would mean that the consumer is indifferent between points A, B and C assuming that A = C, B = C and therefore A = B. However, this is NOT the case since point B is on a higher indifference curve representing more units of X (i.e. X2) than point A (i.e. X1) meaning that a rational consumer would prefer more than less thereby choosing to consume at B than at A (preferring point B to point A). This then contradicts the principles of transitivity and consistency which state that if A = C and B = C then A = B because in this case A ≠ B. It also contradicts the aspect of indifference since the satisfaction at B is greater than the satisfaction at A which makes the consumer prefer B to A. Moreover, since the consumer prefers B to A, then he should also prefer B to C since A = C which is NOT the case with an intersection since B and C are on the same indifference curve implying that B = C. Therefore, as a condition underlying the indifference curve analysis approach to consumer behaviour, indifference curves do not intersect.

Revision Questions and Answers
ECONOMICS
69
NB: Consistency and transitivity of choice: It’s assumed that given preferences, a consumer should be consistent in such a way that once A is chosen or preferred to B in one period he should not choose bundle B over A in another period when both A and B are available. Similarly, it’s assumed that consumer’s choice is characterized by transitivity, that is, if A is preferred to B and B to C then A should be preferred to C.
• Convex to the origin: Indifference curves are convex to the origin denoting diminishing marginal rate of substitution of one commodity for another since commodities are close but not perfect substitutes such that as more of one commodity is consumed it becomes increasingly difficult to give up more units of the other while deriving the same level of satisfaction. Marginal rate of substitution is the amount of one commodity that the consumer is just willing and able to give up for an additional unit of another commodity while deriving the same level of satisfaction.
Units of Y
Y 1 •A Decreasing at a Diminishing MRSXY decreasing rate
Y2 •B
Y3 •C Y4 D Y5 •E U3
0 X1 X2 X3 X4 X5 Units of X Increasing at a Constant rate
Fig 15.4: Diminishing Marginal rate of Substitution
• Indifference map:- the distance from the origin of indifference curves represents different levels of satisfaction; those further away from the origin represent higher levels of satisfaction.
Units of Commodity Y
Where: Satisfaction on U4 <U5 <U6 Y3 ●C Y2 ●B U6 Y1 ●A U5 U4 0 X1 X2 X3 Units of Commodity X
Fig 15.5: Indifference Map
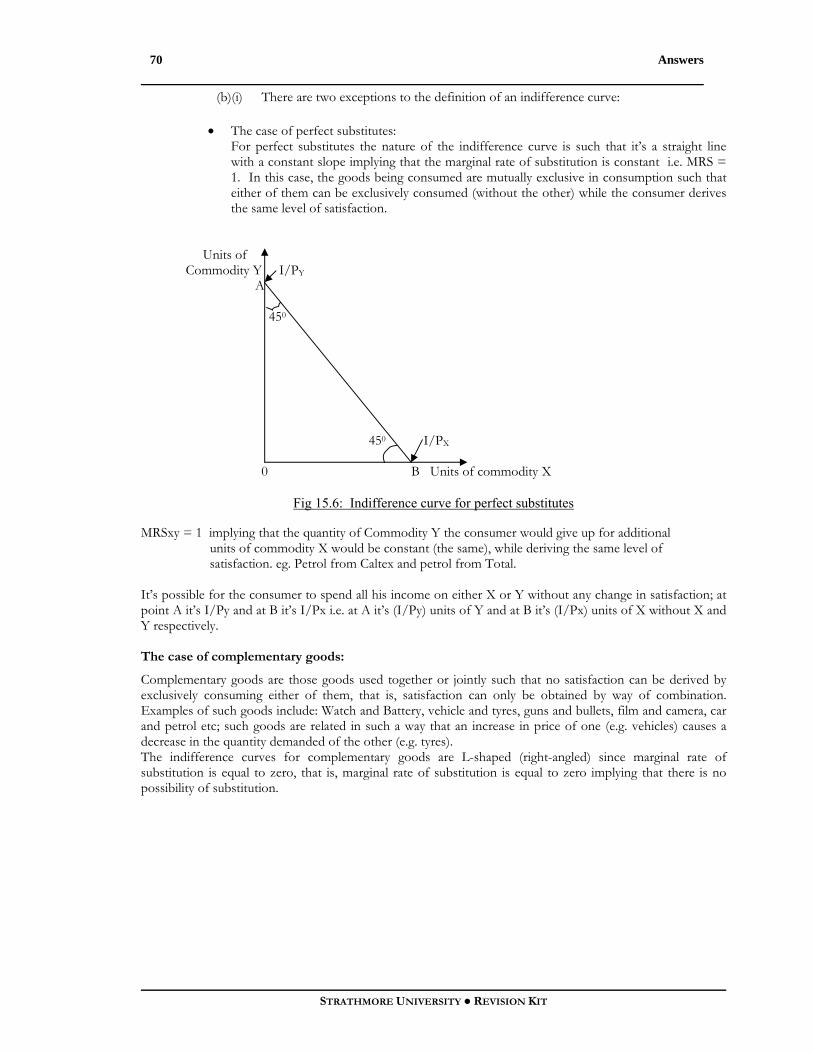
Answers
STRATHMORE UNIVERSITY ● REVISION KIT
70
(b)(i) There are two exceptions to the definition of an indifference curve:
• The case of perfect substitutes: For perfect substitutes the nature of the indifference curve is such that it’s a straight line with a constant slope implying that the marginal rate of substitution is constant i.e. MRS = 1. In this case, the goods being consumed are mutually exclusive in consumption such that either of them can be exclusively consumed (without the other) while the consumer derives the same level of satisfaction.
Units of Commodity Y I/PY
A 450 450 I/PX
0 B Units of commodity X
Fig 15.6: Indifference curve for perfect substitutes MRSxy = 1 implying that the quantity of Commodity Y the consumer would give up for additional units of commodity X would be constant (the same), while deriving the same level of satisfaction. eg. Petrol from Caltex and petrol from Total. It’s possible for the consumer to spend all his income on either X or Y without any change in satisfaction; at point A it’s I/Py and at B it’s I/Px i.e. at A it’s (I/Py) units of Y and at B it’s (I/Px) units of X without X and Y respectively. The case of complementary goods:
Complementary goods are those goods used together or jointly such that no satisfaction can be derived by exclusively consuming either of them, that is, satisfaction can only be obtained by way of combination. Examples of such goods include: Watch and Battery, vehicle and tyres, guns and bullets, film and camera, car and petrol etc; such goods are related in such a way that an increase in price of one (e.g. vehicles) causes a decrease in the quantity demanded of the other (e.g. tyres). The indifference curves for complementary goods are L-shaped (right-angled) since marginal rate of substitution is equal to zero, that is, marginal rate of substitution is equal to zero implying that there is no possibility of substitution.

Revision Questions and Answers
ECONOMICS
71
Units of Y (eg Vehicles) Where MRSXY = 0 Y3 e1 Y2 U2 e Y1 U1 0 X1 X2 X3 Units of X (eg tyres) Fig 15.7: Indifference curves for complementary goods The consumer on indifference curve U1 is able to consume (combine) Y1 units of commodity Y and X1 units of commodity X at point e; any additional consumption of X from, say, X2 to X3 (while keeping the consumption of Y constant) will NOT yield the consumer any higher satisfaction, that is, utility remains the same. It also means that utility can only be increased by increasing the consumption of both commodities X and Y as shown by the shift of the indifference curve upwards and to the right from U1 to U2; Again any increase in the consumption of Y from say Y2 to Y3 (while maintaining the consumption of X constant) will NOT in any way change the utility level of the consumer. To increase utility, the consumer must increase the consumption of both commodities. NB: For perfect substitutes there is no diminishing marginal rate of substitution while complementary goods have no possibility of substitution at all. (ii) Some Applications Of Indifference-Curves Analysis
1) The leisure-income trade-off and the need for overtime rates higher than the normal wage rate Indifference-curves analysis may be used to explain why firms must pay higher rates for overtime work.
We first derive the income-leisure curve of an individual consumer. This curve shows different combinations of income, earned by working, and leisure time. Assume that we measure money income on the vertical axis and leisure time on the horizontal axis. Assume further that the maximum time available for either leisure or work is 0Z hours a day. The individual can either use all the 0Z hours for leisure, in which case he earns zero income, or he can choose to work all the 0Z hours and earn a maximum money income 0M (given the current market wage rate w) or he can use part of the 0Z hours for leisure (e.g. 0A) and the remaining (AZ) hours for work, in which case he would earn 0M1 income.
Income Income M slope = w I4 M1 H I3 I2 I1 0 A Z Leisure 0 Leisure Leisure Work Fig 15.8: Income – leisure constraint Fig 15.9: Income-leisure trade-off

Answers
STRATHMORE UNIVERSITY ● REVISION KIT
72
Income Slope = w1> w M2 e1 I4 M1 e I3 slope = w 0 L2 L1 Z Leisure Figure 15.10 The line MZ is the income-leisure curve, which shows how much time of his leisure an individual must give up if he wants to earn a certain income. The slope of the income-leisure line is equal to the market wage rate. We may next construct the indifference map of the individual, which shows the ranking of his preferences as between income and leisure. Each indifference curve shows various combinations of income and leisure which yield the same level of satisfaction (utility) to the individual. The indifference curves have the usual properties: they are convex to the origin, they do not intersect and they show a higher level of satisfaction the further away from the origin they are. The individual’s equilibrium is determined by the point of tangency of his income-leisure line with the highest possible trade-off curve (Point e in figure 15.10). Given the wage rate w, the individual maximizes his utility by working L1Z hours, earning income 0M1 and using the remaining time (0L1) for leisure. If firms want more hours of work they will have to pay a higher hourly rate than the normal w in order to give an incentive to the individual to reduce his leisure time. An increase in the overtime rate is depicted by a leisure-income line which is steeper to the left of e (figure 15.10). With higher overtime payment the individual will be induced to give up some of his leisure time because in this way he will reach a higher indifference curve. The income-leisure line becomes kinked at e, and the new equilibrium of the individual is at e1 on indifference curve I4, showing that he will increase his working hours (by L1L2) and earn a higher income (OM2>OM1). 2) Evaluation of alternative government policies using indifference-curves analysis
Indifference curves may be used to evaluate the effects of alternative government policies. For example, assume that the government considers either the adoption of a food subsidization policy for pensioners or granting a supplementary income to them.

Revision Questions and Answers
ECONOMICS
73
Y Income C Cost of supplementary income A e3 Z ●e1 e2 L ● Cost of subsidy ●M I2 I1 K ●N
0 X1X3 X2 B D B1 X food
Fig 15.11 Which of these measures costs less to the government (and hence to the tax payer)? What are the effects of these policies on the demand patterns of a pensioner? Such questions may be answered by using indifference-curves analysis. We will illustrate the way in which the above information may be obtained, assuming for simplicity that there is a single pensioner and two commodities, x(food) and y (money income). The initial equilibrium of the pensioner is at point e1 where his budget line, AB is tangent to indifference curve I1: he consumes 0X1 units of food, paying ZA of his income and have OZ income left over to spend on other commodities. The goal of the government is to make it possible for the pensioner to move to the higher level of welfare (satisfaction) denoted by the indifference curve I2. The effects of the food subsidy. Assume that the government gives food coupons to the pensioner which allow him to buy food at half the market price. Following this measure the budget line of the pensioner shifts to AB1 which is tangent to I2 at point e2. At his new equilibrium position the pensioner buys OX2 units of food, paying for this quantity AL of his income. If there was no food subsidy the pensioner would have to spend AK of his income to buy OX2 units of food. Since he pays only AL, the difference LK = (AK – AL) must be paid to the food producers by the government. Thus, if the government adopts the food subsidy policy we have the following effects: (a) the cost to the government (and to the taxpayer) is LK. (b) the market price of food is not affected by this policy, so that other consumers continue to pay the original price. (c) the government is certain that the pensioners will consume more food. This effect may be particularly desirable (as a subsidiary goal of the government) if there are surpluses of food. Actually it is often the case that food subsidies are designed in such a way as to benefit not only the consumers but also the producers of foodstuffs. (d) the assistance to pensioners via the food subsidy imposes a certain pattern of consumption, a certain choice of spending their income. The effects of a supplementary income policy. Assume that the government considers granting to the pensioner a supplementary income which will enable him to reach the higher welfare level implied by indifference curve I2. To find the amount of such a supplementary income we simply draw a budget line (CD), parallel to the original budget line (AB) and tangent to I2 (at point e3). The pensioner will now buy OX3 units of food. The cost to the government of the supplementary income policy is equal to CA, which (in our example) is smaller than the cost of the food subsidy policy. Furthermore the quantity of food in this case (OX3) is smaller than the quantity which would be bought under a food subsidy programme (OX2).

Answers
STRATHMORE UNIVERSITY ● REVISION KIT
74
Comparing the two alternative policies we observe that both policies achieve the government’s goal of enabling the pensioner to reach the higher welfare state implied by I2. But the food subsidy programme is more costly (in our example) than the supplementary income policy. In fact if the government were to give to the pensioner the cost of the subsidy in the form of supplementary income, the pensioner would attain a higher level of satisfaction (an indifference curve above I2). However, the consumption of food will be greater in the case of the food subsidy policy. Which one of these alternative policies the government will adopt depends not only on the above considerations, but also on the other goals of the government and the indirect effects of each policy. For example, if there is a surplus food production the government may adopt the more costly subsidization policy which apart from increasing the welfare of the consumer, also benefits the producers by reducing or even eliminating the surplus. Furthermore, supplementary incomes policies are in general more inflationary than price subsidies to specific individuals (especially if there is a surplus of the subsidized commodities). Increasing the incomes of some groups of ‘needy’ consumers may lead to increases of the market prices of commodities for all consumers, thus decreasing their welfare. The above discussion illustrates how indifference-curves analysis may give insight into the implications of selective government measures, and thus help efficient policy formulation. 3 Indifference – curve analysis and the theory of exchange Indifference –curves analysis may be used to explain why exchange of commodities among individuals (or
groups of individuals, countries, regions, and so on) take place. Under certain conditions, exchange of commodities leads to an increase in the welfare of at least one individual without any reduction in the welfare of the other so that the overall welfare which can be enjoyed from a given bundle of commodities is increased.
4. Indifference-curves analysis of the cost of living
Indifference-curve analysis and the theory of revealed preference can be used to establish whether, over a period of time during which both money incomes and prices have been changing, the consumer is better or worse off. The assumption underlying the discussion is that the consumer spends all his money income in all time periods, that is, he chooses a point on his budget line in any particular period.
5. Classification of goods • Perhaps the most important theoretical contribution of the indifference curve analysis approach is the
establishment of a better criterion for the classification of goods into substitutes and complements. Hicks suggested measuring the cross elasticity after compensating for changes in real income. Thus, according to Hicks, goods X and Y are substitutes if, after compensating for the change in real income (arising from the change in the price of X) a decrease in the price of X leads to a decrease in the quantity demanded of Y. Although this criterion is theoretically correct, it still requires knowledge of the individual preference functions which cannot be statistically estimated.
• Use of indifference comes also allows for the classification of goods into normal, inferior or giffen. For normal goods both income and substitution effects of a price change are positive such that the total price effect is positive. For inferior goods, the income effect is negative but the substitution effect is positive and relatively greater than the negative income effect such that the total price effect remains positive.
However, for giffen goods the negative income effect is overwhelming on the positive substitution effect such that the total price effect is negative. This is the source of regression of the demand curve.
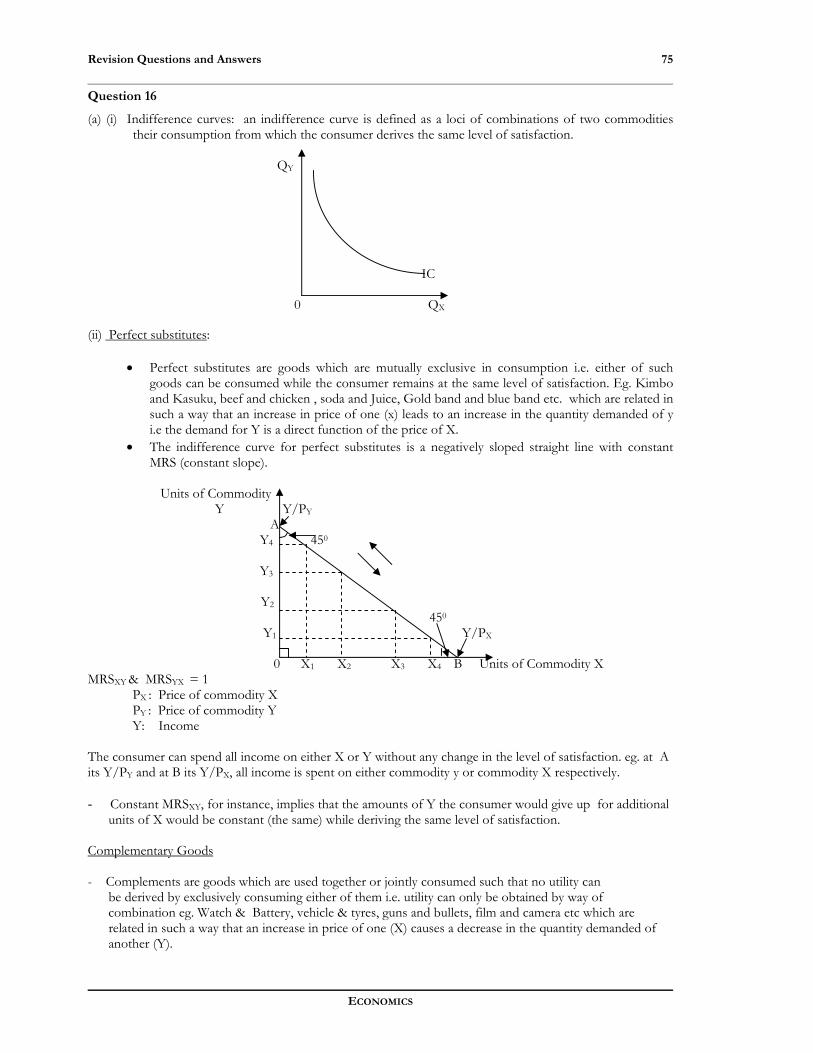
Revision Questions and Answers
ECONOMICS
75
Question 16
(a) (i) Indifference curves: an indifference curve is defined as a loci of combinations of two commodities their consumption from which the consumer derives the same level of satisfaction.
QY IC 0 QX (ii) Perfect substitutes:
• Perfect substitutes are goods which are mutually exclusive in consumption i.e. either of such goods can be consumed while the consumer remains at the same level of satisfaction. Eg. Kimbo and Kasuku, beef and chicken , soda and Juice, Gold band and blue band etc. which are related in such a way that an increase in price of one (x) leads to an increase in the quantity demanded of y i.e the demand for Y is a direct function of the price of X.
• The indifference curve for perfect substitutes is a negatively sloped straight line with constant MRS (constant slope).
Units of Commodity Y Y/PY A Y4 450 Y3 Y2 450 Y1 Y/PX 0 X1 X2 X3 X4 B Units of Commodity X MRSXY & MRSYX = 1 PX : Price of commodity X PY : Price of commodity Y Y: Income The consumer can spend all income on either X or Y without any change in the level of satisfaction. eg. at A its Y/PY and at B its Y/PX, all income is spent on either commodity y or commodity X respectively. - Constant MRSXY, for instance, implies that the amounts of Y the consumer would give up for additional units of X would be constant (the same) while deriving the same level of satisfaction. Complementary Goods - Complements are goods which are used together or jointly consumed such that no utility can be derived by exclusively consuming either of them i.e. utility can only be obtained by way of combination eg. Watch & Battery, vehicle & tyres, guns and bullets, film and camera etc which are related in such a way that an increase in price of one (X) causes a decrease in the quantity demanded of another (Y).
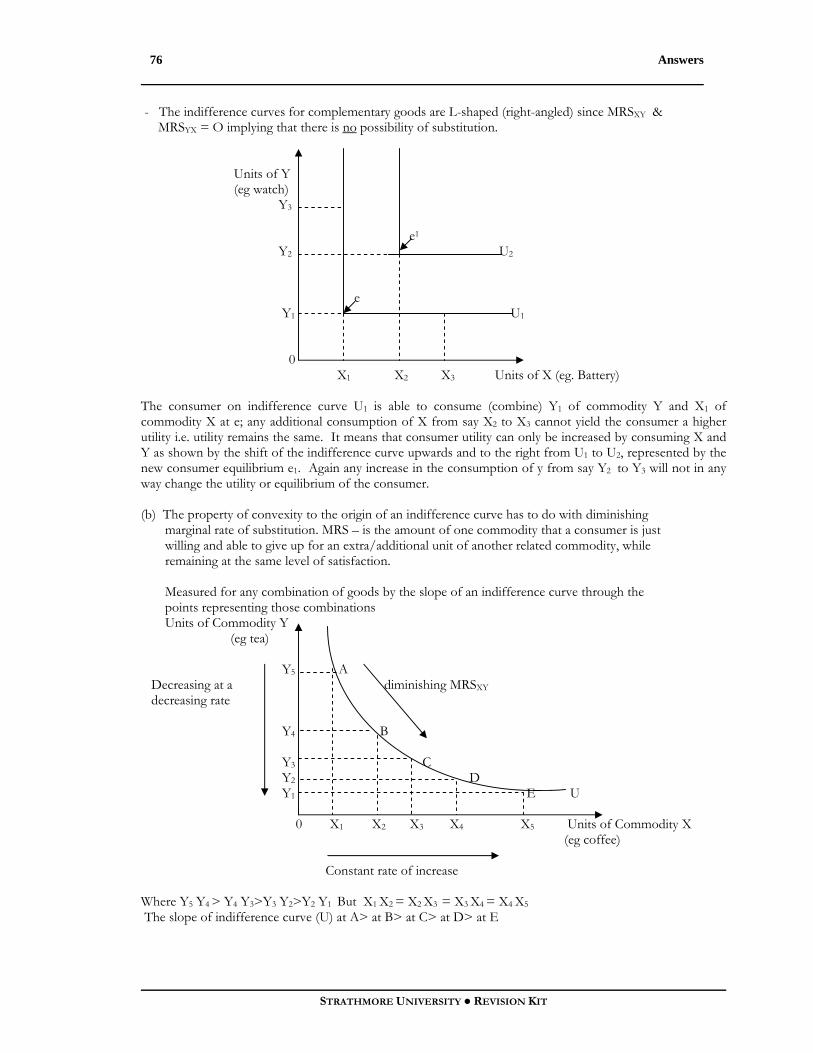
Answers
STRATHMORE UNIVERSITY ● REVISION KIT
76
- The indifference curves for complementary goods are L-shaped (right-angled) since MRSXY & MRSYX = O implying that there is no possibility of substitution. Units of Y (eg watch) Y3 e1 Y2 U2 e Y1 U1 0 X1 X2 X3 Units of X (eg. Battery) The consumer on indifference curve U1 is able to consume (combine) Y1 of commodity Y and X1 of commodity X at e; any additional consumption of X from say X2 to X3 cannot yield the consumer a higher utility i.e. utility remains the same. It means that consumer utility can only be increased by consuming X and Y as shown by the shift of the indifference curve upwards and to the right from U1 to U2, represented by the new consumer equilibrium e1. Again any increase in the consumption of y from say Y2 to Y3 will not in any way change the utility or equilibrium of the consumer. (b) The property of convexity to the origin of an indifference curve has to do with diminishing marginal rate of substitution. MRS – is the amount of one commodity that a consumer is just willing and able to give up for an extra/additional unit of another related commodity, while remaining at the same level of satisfaction. Measured for any combination of goods by the slope of an indifference curve through the points representing those combinations Units of Commodity Y (eg tea) Y5 A Decreasing at a diminishing MRSXY decreasing rate Y4 B Y3 C Y2 D Y1 E U 0 X1 X2 X3 X4 X5 Units of Commodity X (eg coffee) Constant rate of increase Where Y5 Y4 > Y4 Y3>Y3 Y2>Y2 Y1 But X1 X2 = X2 X3 = X3 X4 = X4 X5 The slope of indifference curve (U) at A> at B> at C> at D> at E

Revision Questions and Answers
ECONOMICS
77
MRSXY decreases from left to right along the indifference curve (U) because of the law of diminishing marginal rate of substitution i.e as more units of X are consumed it becomes increasingly difficult to forgo Y i.e it becomes increasingly difficult to substitute X for Y since the two commodities are close but NOT perfect substitutes. Points A to E represent the same level of satisfaction arising from consumption of X and Y assuming that X and Y are close but not perfect substitutes. To consume at point B, for instance, an extra unit of X is obtained (X2 ) by giving up (Y5 Y4 ) units of Y; at point C (Y4 Y3 ) units of Y is given up for an extra unit of X (X3 ) consumed etc where Y4 Y3 < Y5 Y4 units of Y given up, implying that less and less units of Y is given up for an extra unit of X due to diminishing marginal rate of substitution of X for Y since the two commodities though close are not perfect substitutes. Units of Commodity Y C A Y2 e2 Y3 ●e3 e1 Y1 I1 I2 0 X3 X2 B1 X1 D B Units of Commodity X
Fig 16.4: Income and Substitution of a price rise for a Normal Good NB: Slope of AB1 = slope of CD since AB1//CD; the two budget lines representing the current relative prices of X and Y. The original consumer equilibrium point is at e1 with X1 of X and Y1 of Y. The movement from consumer equilibrium point e1 to e3 is due to the overall price effect which comprises both income and substitution effects. Income effect is the change in the quantity demanded of a commodity arising from the change in the real income (purchasing power) of the consumer, relative prices remaining constant. Substitution effect refers to the change in the quantity demanded of a commodity due to change in the relative prices, real income (purchasing power) of the consumer remaining constant. The original budget line AB pivoted at point A rotates inwards along the X – axis to AB1 due to the price rise of commodity X. This rotation is due to the total price effect (represented by the movement from consumer equilibrium point e1 to e3 ) which comprises both income and substitutions effects. To be able to distinguish between the impact of change in real income (income effect) and that of substitution (substitution effect) on the quantity demanded (on consumer expenditure programme), a compensating variation budget line CD tangent to the original indifference Curve I1 at point e2 and parallel to the budget line AB1 is introduced on the assumption that accompanying the price rise is a compensating variation of money income (eg a downward adjustment of tax or provision of a subsidy) such that the real income of the consumer remains unchanged (income effect is held constant) and thereby enabling for the
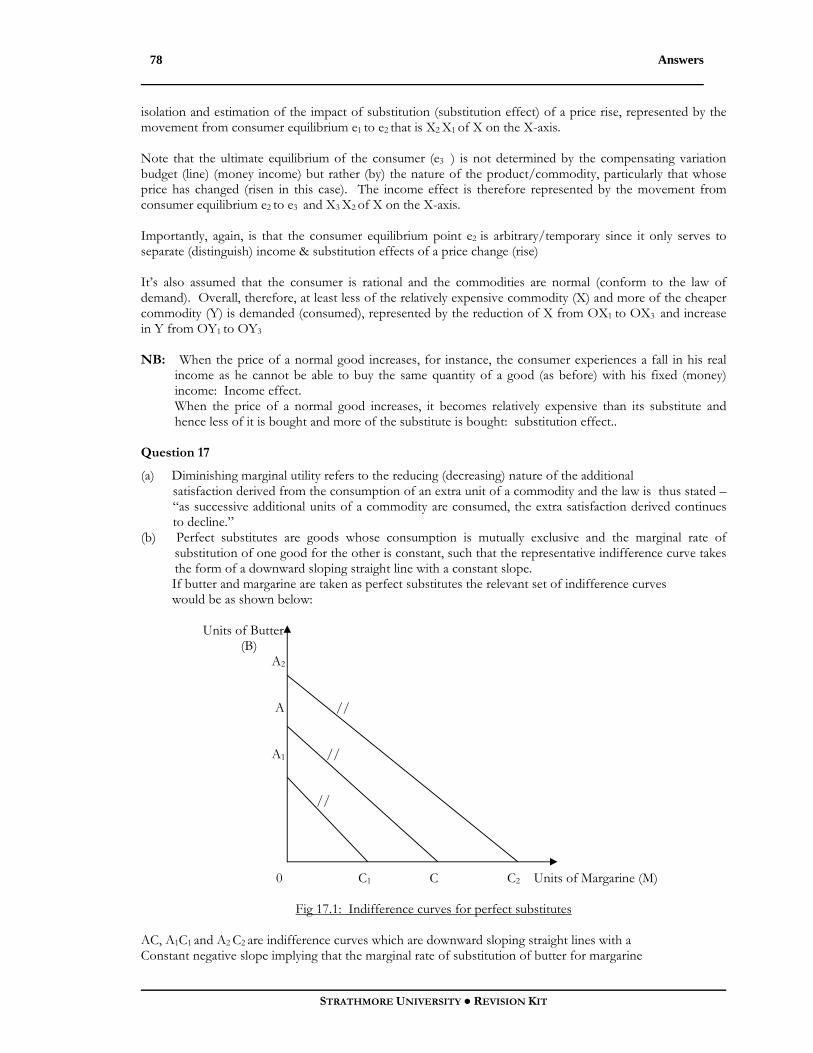
Answers
STRATHMORE UNIVERSITY ● REVISION KIT
78
isolation and estimation of the impact of substitution (substitution effect) of a price rise, represented by the movement from consumer equilibrium e1 to e2 that is X2 X1 of X on the X-axis. Note that the ultimate equilibrium of the consumer (e3 ) is not determined by the compensating variation budget (line) (money income) but rather (by) the nature of the product/commodity, particularly that whose price has changed (risen in this case). The income effect is therefore represented by the movement from consumer equilibrium e2 to e3 and X3 X2 of X on the X-axis. Importantly, again, is that the consumer equilibrium point e2 is arbitrary/temporary since it only serves to separate (distinguish) income & substitution effects of a price change (rise) It’s also assumed that the consumer is rational and the commodities are normal (conform to the law of demand). Overall, therefore, at least less of the relatively expensive commodity (X) and more of the cheaper commodity (Y) is demanded (consumed), represented by the reduction of X from OX1 to OX3 and increase in Y from OY1 to OY3 NB: When the price of a normal good increases, for instance, the consumer experiences a fall in his real
income as he cannot be able to buy the same quantity of a good (as before) with his fixed (money) income: Income effect. When the price of a normal good increases, it becomes relatively expensive than its substitute and hence less of it is bought and more of the substitute is bought: substitution effect..
Question 17
(a) Diminishing marginal utility refers to the reducing (decreasing) nature of the additional satisfaction derived from the consumption of an extra unit of a commodity and the law is thus stated – “as successive additional units of a commodity are consumed, the extra satisfaction derived continues to decline.”
(b) Perfect substitutes are goods whose consumption is mutually exclusive and the marginal rate of substitution of one good for the other is constant, such that the representative indifference curve takes the form of a downward sloping straight line with a constant slope.
If butter and margarine are taken as perfect substitutes the relevant set of indifference curves would be as shown below: Units of Butter (B) A2 A // A1 // //
0 C1 C C2 Units of Margarine (M)
Fig 17.1: Indifference curves for perfect substitutes AC, A1C1 and A2 C2 are indifference curves which are downward sloping straight lines with a Constant negative slope implying that the marginal rate of substitution of butter for margarine

Revision Questions and Answers
ECONOMICS
79
(MRSbm ) and margarine for butter (MRSmb ) is equal to one (i.e. MRSbm & MRSmb = 1), that is, B and M are mutually exclusive in consumption (total income can be spent on either B or M while deriving the same level of satisfaction). (c) (i) NB: This part of the question is improper at least to the extent that there is a conflict of distinction between the cardinalist and ordinalist approaches to consumer behaviour. To use
indifference curves (oridnalist approach) to represent quantitative utility levels is against the principle of separation (of approaches) in consumer theory.
However, by violating this principle (which should not be the case) the indifference curves at U =
12 and U = 24 utils would be as follows: U = FS
Utility level of 12 Utils Utility level of 24 Utils Food (F) Shelter (S) Food (F) Shelter (S)
1 12 1 24 2 6 2 12 3 4 3 8 4 3 4 6 6 2 5 4
12 1 8 3 12 2 24 1
Food (F) (F) 24 - x 12 10 18 - 8 12 - x x 6 4 6 - x x U24 x x x U24 2 x U12 x x U12 0 2 4 6 8 10 12 (S)
0 6 12 18 24 Shelter (S)
Figs 17.2: Indifference Curves In this case, the scaler of the upward shift (i.e. from U12 to U24 ) is 2 while that of the downward shift (i.e. from U24 to U12 ) is ½. (ii) PF = Sh. 100 where PF : Price per unit of food PS = Sh. 300 PS : Price per unit of shelter Y = Sh. 1,200 Y : Income Y = Pf Qf + PS QS
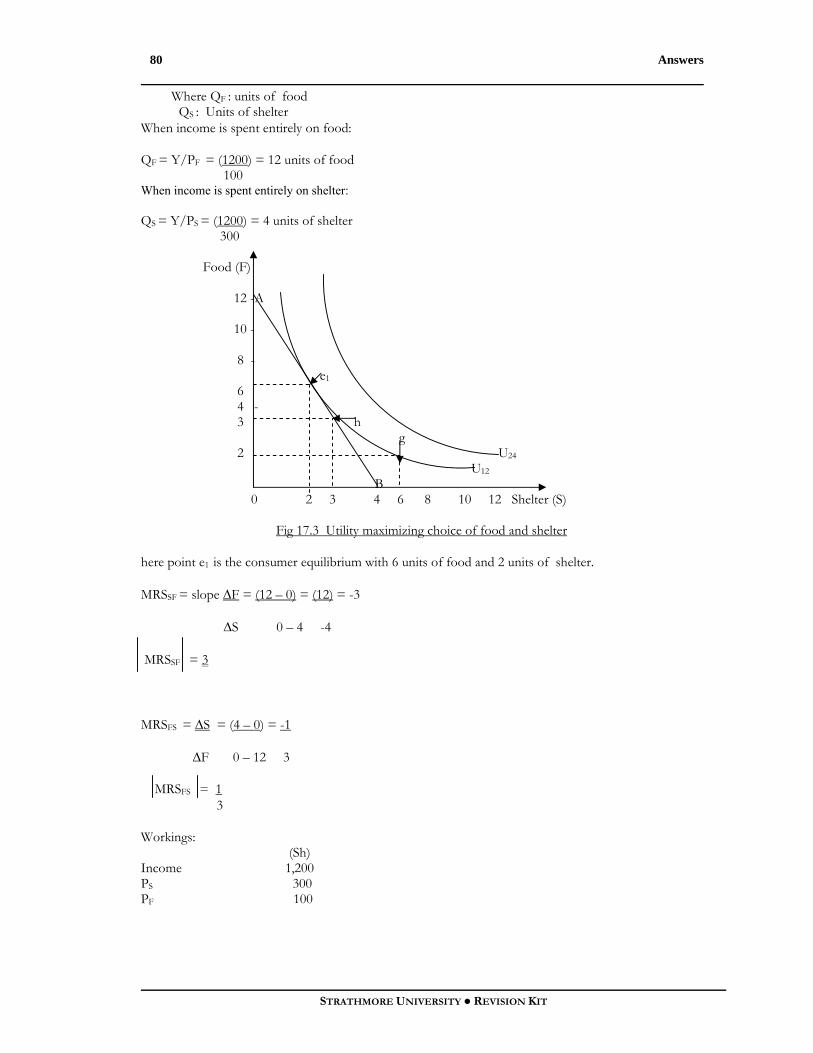
Answers
STRATHMORE UNIVERSITY ● REVISION KIT
80
Where QF : units of food QS : Units of shelter When income is spent entirely on food:
QF = Y/PF = (1200) = 12 units of food 100 When income is spent entirely on shelter: QS = Y/PS = (1200) = 4 units of shelter 300 Food (F) 12 -A 10 - 8 - e1 6 4 - 3 h g 2 U24 U12 B 0 2 3 4 6 8 10 12 Shelter (S)
Fig 17.3 Utility maximizing choice of food and shelter here point e1 is the consumer equilibrium with 6 units of food and 2 units of shelter.
MRSSF = slope ∆F = (12 – 0) = (12) = -3
∆S 0 – 4 -4
MRSSF = 3
MRSFS = ∆S = (4 – 0) = -1
∆F 0 – 12 3
MRSFS = 1 3
Workings: (Sh) Income 1,200 PS 300 PF 100
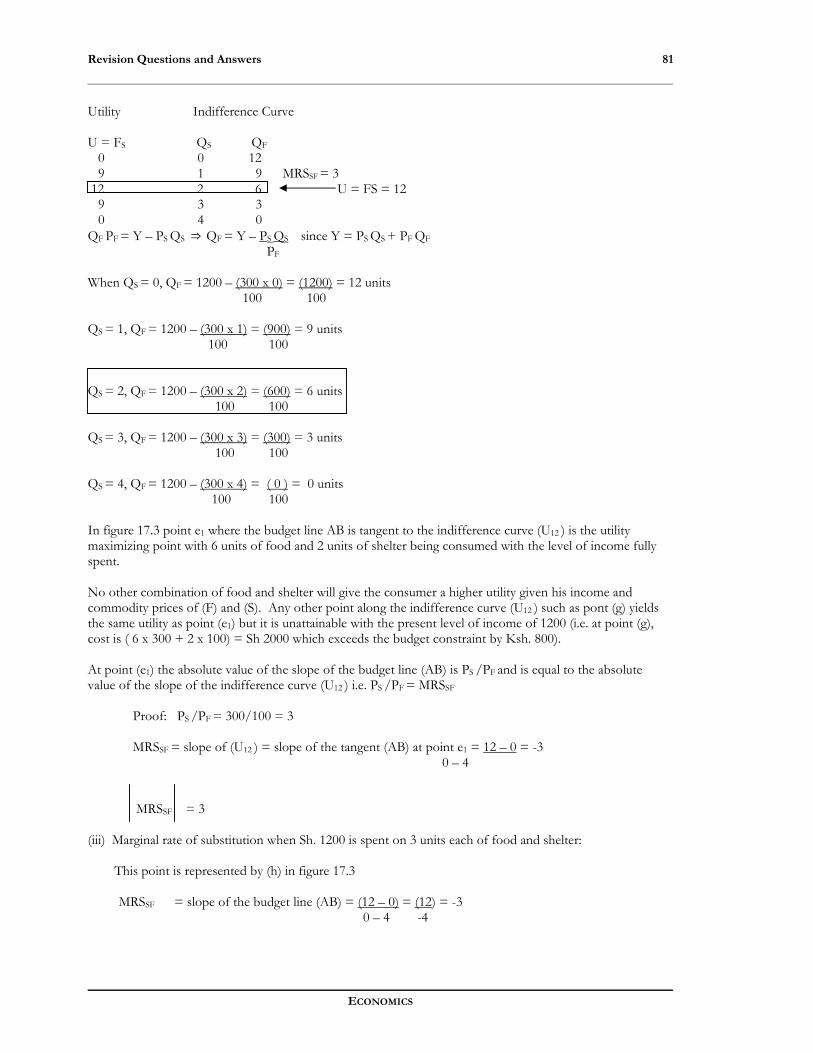
Revision Questions and Answers
ECONOMICS
81
Utility Indifference Curve U = FS QS QF
0 0 12 9 1 9 MRSSF = 3 12 2 6 U = FS = 12 9 3 3 0 4 0 QF PF = Y – PS QS ⇒ QF = Y – PS QS since Y = PS QS + PF QF PF When QS = 0, QF = 1200 – (300 x 0) = (1200) = 12 units 100 100 QS = 1, QF = 1200 – (300 x 1) = (900) = 9 units 100 100 QS = 2, QF = 1200 – (300 x 2) = (600) = 6 units 100 100
QS = 3, QF = 1200 – (300 x 3) = (300) = 3 units 100 100 QS = 4, QF = 1200 – (300 x 4) = ( 0 ) = 0 units 100 100 In figure 17.3 point e1 where the budget line AB is tangent to the indifference curve (U12 ) is the utility maximizing point with 6 units of food and 2 units of shelter being consumed with the level of income fully spent. No other combination of food and shelter will give the consumer a higher utility given his income and commodity prices of (F) and (S). Any other point along the indifference curve (U12 ) such as pont (g) yields the same utility as point (e1) but it is unattainable with the present level of income of 1200 (i.e. at point (g), cost is ( 6 x 300 + 2 x 100) = Sh 2000 which exceeds the budget constraint by Ksh. 800). At point (e1) the absolute value of the slope of the budget line (AB) is PS /PF and is equal to the absolute value of the slope of the indifference curve (U12 ) i.e. PS /PF = MRSSF
Proof: PS /PF = 300/100 = 3
MRSSF = slope of (U12 ) = slope of the tangent (AB) at point e1 = 12 – 0 = -3 0 – 4
MRSSF = 3 (iii) Marginal rate of substitution when Sh. 1200 is spent on 3 units each of food and shelter:
This point is represented by (h) in figure 17.3 MRSSF = slope of the budget line (AB) = (12 – 0) = (12) = -3 0 – 4 -4

Answers
STRATHMORE UNIVERSITY ● REVISION KIT
82
MRSSF = 3 implying that Olympia has to give up 3 units of food in order to obtain an additional unit of shelter MRSFS = ∆S/∆F = ( 4 – 0 ) = -1 0 – 12 3 MRSFS = 1/3 implying that for every additional unit of food, Olympia gives up 1/3 units of shelter. (iv) Effect of a rise in income to Sh. 3,600: PF = Sh. 100 P S = Sh. 300 MRS FS = 1/3 This means that to acquire an extra unit of food 1/3 units of shelter must be given up in order for the consumer to remain at the same level of utility. Thus if 1/3 unit of Shelter given up 1 unit of food then 1 unit of shelter given up (1 x 1) = 3 units of food acquired 1/3 0 3 6 9 12 15 18 21 24 27 30 33 36
S 12 11 10 9 8 7 6 5 4 3 2 1 0
U = FS 0 33 60 81 96 105 108 105 96 81 60 33 0
OR
F 36 33 30 27 24 21 18 15 12 9 6 3 0
S 0 1 2 3 4 5 6 7 8 9 10 11 12
U = FS 0 33 60 81 96 105 108 105 96 81 60 33 0

Revision Questions and Answers
ECONOMICS
83
Utility
U = FS
Units of Food
(F)
Units of Shelter
(S)
0 0 12
33 3 11
60 6 10
81 9 9
96 12 8
105 15 7
108 18 6
105 21 5
96 24 4
81 27 3
60 30 2
33 33 1
0 36 0
Since Y = PS QS + PF QF
QF = Y - PS QS PF
When QS = 0, QF = 3600 – (300 x 0) = (3600) = 36 units 100 100
QS = 1, QF = 3,600 – (300 x 1) = (3300) = 33 units 100 100
QS = 2, QF = 3600 – (300 x 2) = (3000) = 30 units
100 100
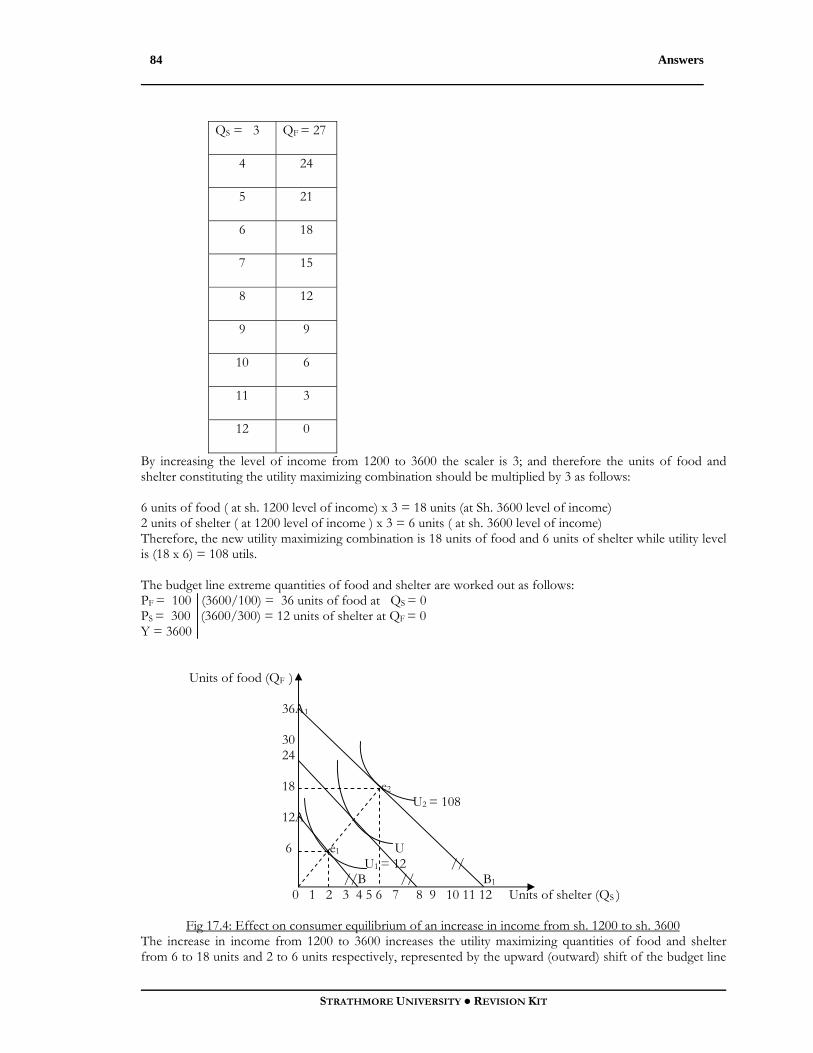
Answers
STRATHMORE UNIVERSITY ● REVISION KIT
84
QS = 3 QF = 27
4 24
5 21
6 18
7 15
8 12
9 9
10 6
11 3
12 0
By increasing the level of income from 1200 to 3600 the scaler is 3; and therefore the units of food and shelter constituting the utility maximizing combination should be multiplied by 3 as follows: 6 units of food ( at sh. 1200 level of income) x 3 = 18 units (at Sh. 3600 level of income) 2 units of shelter ( at 1200 level of income ) x 3 = 6 units ( at sh. 3600 level of income) Therefore, the new utility maximizing combination is 18 units of food and 6 units of shelter while utility level is (18 x 6) = 108 utils. The budget line extreme quantities of food and shelter are worked out as follows: PF = 100 (3600/100) = 36 units of food at QS = 0 PS = 300 (3600/300) = 12 units of shelter at QF = 0 Y = 3600 Units of food (QF ) 36A1 30 24 18 e2 U2 = 108 12A 6 e1 U U1 = 12 // //B // B1 0 1 2 3 4 5 6 7 8 9 10 11 12 Units of shelter (QS )
Fig 17.4: Effect on consumer equilibrium of an increase in income from sh. 1200 to sh. 3600 The increase in income from 1200 to 3600 increases the utility maximizing quantities of food and shelter from 6 to 18 units and 2 to 6 units respectively, represented by the upward (outward) shift of the budget line
Revision Questions and Answers
ECONOMICS
85
from AB to A1 B1 and the indifference curve from U1 to U2 ; effectively, consumer equilibrium changes from e1 to e2 . 3.5 THE THEORY OF PRODUCTION
Question 18
(a) Factors of production: Production:- any activity (economic or otherwise) that makes possible the availability of goods and services with a view to satisfaction of human material wants.
Factors of production: Economic means/resources/inputs whose combination makes possible the availability of (economic) goods and services aimed at satisfying human material wants.
Basically four:- Land Primary – not as a result of a production process
Labour Capital Entrepreneurial ability Secondary - arise from an economic process/system/activity
Land:- primary natural resources over which people have the power of ownership , control and disposal, and can be used to yield income or organize/carry out economic activities – gift of nature whose supply is fixed (no production cost) and whose reward is rent; include soil, rivers/lakes, mineral deposits, forests etc: owners of land can only improve on its quality since supply is fixed. Distinguishing characteristics: (i) fixed in supply (ii) no production costs; land provides the site on/at which production takes place. Labour:- human physical or mental effort directed to the production of goods and services; its reward is wages/salaries. It has got three distinguishing characteristics from the other factors: (i) What is paid for/bought is the services NOT labour or labour force. (ii) Its both a factor of production and the end to which production is under taken. (iii) Cannot be separated from the owner/labour. Capital:- Stock of wealth or goods which are not required for their own sake but for further production of other goods i.e. any produced producer goods (any product of land and labour which is reserved for further production) eg. fixed capital such as machinery, buildings, vehicles; working/circulating capital like stock of raw materials & work-in progress; reward – interest.
Entrepreneur: - the organizing aspect of resource combination in a production process which
involves risking of capital and decision making/organization/combination in anticipation of demand; entrepreneurial ability refers to the organizational skills which combine all the other factors of production (resources) for productive use; Its reward is profit . An entrepreneur is easily identified in small businesses through his role but in large businesses his function could be split between several managers and shareholders. Some economists look at enterprise not as a separate factor of production but as a specialized form of labour (consider self-employment or private practice.)
Factors of production are either versatile or specific, indicating that they have numerous uses or just one use respectively; complementary as well; sometimes substitutable. (b) Extent of factor mobility: - Definition of factor mobility as the ease with which a factor of production can be transferred from one area/place/location or form of employment to another.

Answers
STRATHMORE UNIVERSITY ● REVISION KIT
86
Factor mobility takes two forms: Geographical mobility:- ease with which a factor of production can be transferred from one place of employment to another eg. from Nairobi to Nakuru. Occupational mobility:- ease with which a factor of production can be transferred from one form of employment to another eg. from medicine to accountancy or teaching. The extent of factor mobility cannot be generalized because it differs depending on the nature of the various factors of production; therefore explained by looking at each factor independently as follows:
ix. Land: • Geographically immobile – can’t be physically moved from one place to another; • Occupationally mobile – can be put to different/alternative uses eg. Grazing, • Plantation agriculture, building construction (residence) etc. • Limited occupational mobility, however, eg mountainous areas of land which are • Only used for a specific purpose or purposes like tourist attraction etc. • Land is for all practical purposes geographically immobile and therefore one • Can only sell land in one area to be able to buy another piece in another different
area or improve the quality of an existing piece of land. ii) Capital:
Both fixed/physical and working/circulating capital whose extent of mobility depends on their form/nature (of capital) as reflected in the following examples:
Heavy machinery such as blast furnaces and railway lines are both geographically and occupationally immobile. A railway for instance is possible to dismantle and physically transfer to another site (region) but the exercise is prohibitively expensive in terms of overwhelming costs thus making relocation cost-ineffective – hence geographically immobile. Vehicles: both geographically and occupationally mobile – can be physically moved (driven) from one place to another or used multipurposely, say as a public transport means (PSV) or for transportation of goods. Buildings:- geographically immobile but occupationally mobile – cannot physically move or transfer a building (intact) from one place to another but is can be used multipurposely , at one time as a clinic and another time as probably a classroom. Combine harvesters and petrol tankers: geographically mobile but occupationally immobile since they are designed for a specific use.
iii) Labour:
• Human physical and/or mental effort devoted to production of goods and services aimed at satisfying human material wants.
• Highly geographically mobile but relatively less occupationally mobile due to specialization. Eg. The case of medical doctors etc.
• Horizontal and vertical forms of occupational mobility – in terms of remuneration or status or both eg. Horizontally as an accounts clerk in one firm and becoming the same clerk in another firm or vertically as an accounts clerk to becoming a senior accountant with the same firm.
• Barriers to geographical mobility:- movement cost, shortage of housing, education of children, social and family ties etc.
• Barriers to occupational mobility:- personal talents, cost and length of training, availability of capital, regulation, social class etc.
iv) Entrepreneurship:-
• Organization/management/decision – making aspect of aresource, that is, the means of combining other resources/inputs with a view to profit

Revision Questions and Answers
ECONOMICS
87
• Highly mobile in both senses since functions are common(similar) across the board i.e.
taking up risk by raising capital,organization of other factors of production, decision-making and assumption of both profits/losses arising therefrom.
(c) (i) The significance of factor mobility:- Mobility enables different factor combinations to be used. Thus, for example, more labour and capital can only be used if either of these factors is mobile to facilitate a change in the production technique. This enables producers to search for a least cost method of production. Mobility of factors of production facilitates the movement of factors of production from surplus to deficit areas. This signifies that if factors are sufficiently mobile, unemployment will be avoided in surplus areas while production will be enhanced in deficit areas. This leads to a more efficient utilization of resources. Mobility of factors of production enables the benefits of economic growth to be spread throughout a country. Thus, for example, many industries are located in urban areas primarily because of the urban market and economies of scale. If industries can be encouraged to locate in rural areas through incentives then the benefits of industrial development in a particular country can be spread more evenly. Mobility of factors of production enables the transfer of expertise to areas where it is efficient. Thus, for example, in the event of mobility experienced managers can contribute to the development of aspects of the firm lacking in managerial expertise and can even in some cases transfer their skills internationally. The possibility of vertical occupational mobility of labour can have motivational effects in that if workers perceive chances of being promoted for outstanding work, they are in general likely to be much more efficient at their work thus contributing to the overall efficiency of their business enterprise. Mobility may be significant in that if workers are occasionally allowed to perform different tasks and are capable of performing them, then they are less likely to experience the monotony often associated with specialization with its accompanying negative effects. Factor mobility is significant in production in that factors of production that are immobile occupationally in that they have no alternative use have no opportunity cost and are therefore not considered by economists as scarce resources. Therefore, simply stated, the above aspects of significance of factor mobility is as below:
i. Unemployment ii. Income distribution iii. Regional disparities iv. Flexibility in production v. Utilization of the otherwise idle resources vi. Incentive to investment – minimization of losses while maximizing profits.
(ii) Regional imbalance is the uneven distribution of economic resources between different regions of a particular country..
The policy recommendations to reduce regional development imbalance would include:
• Industrial decentralization. • Human resource mobility and development – regional human resource development initiatives and
participatory change in terms of cultural aspects like cattle rustling etc. • Infrastructure – the aspect of accessibility that is to allow for efficient utilization of potential
resources eg in the agricultural rural sector. • Comprehensive development plans and strategies. • Security, law and order eg. The influx of refugees in areas sucha s the North eastern Province (NEP).
Answers
STRATHMORE UNIVERSITY ● REVISION KIT
88
• Non-governmental initiatives and support systems eg. Micro-financing of the community
development projects. • Factor rewards’ differentials eg. Difference in wage compensation between different regions –
allowances for those working in designated hardships areas etc. Question 19
(a) The main factors of production: Factors of production are the economic means (economic resources or inputs) whose combination makes possible the availability of economic goods and services aimed at satisfying human material wants. These factors of production take four different types, that is, Land, Labour, Capital and entrepreneur. Land:- It is a primary natural resource over which people have the power of ownership, control and disposal, and can be used to yield income or carrying out economic activities. Land is a gift of nature whose supply is for all practical purposes fixed (no production cost) and whose reward is rent. It includes soil, mineral deposits and forests.
Labour: Labour is the human physical and mental effort devoted to the production of goods and services. It is a primary resource whose factor reward is wages (salaries) Capital: Capital is the stock of wealth or goods which are not required for their own sake but for further production of other goods. Capital is either fixed such as machinery, buildings, motor vehicles; or working capital like stock of raw materials and work-in-progress. The factor reward for capital is interest.
Entrepreneur: Is the organizing aspect of resource combination in a production process. It involves risking of capital and decision-making in anticipation of demand.
Entrepreneurial ability refers to the organizational skills which combine all other factors of production (resources) for productive use. The reward for entrepreneurship is profit.
(b) (i) A function is a mathematical relationship in which the values of a single dependent variable is
determined by the value of one or several independent variables. A production function is therefore a purely technical relationship in which the level of output is determined by the factor inputs. A production function thus represents a purely technical relation which connects factor inputs and outputs.It describes the laws of proportion, that is, the transformation of factor inputs into products (outputs) at any particular time period. The production function represents the technology of a firm, an industry, or the economy as a whole. The production function includes all the technically efficient methods of production.
(ii) Determinants of supply and demand of factors of production: Labour:- Supply factors:
• Population size and structure – the working population • Wage rate (remuneration) • Mobility • Education system – time • Length of the working week (working days per week) • Extent of barriers to entry into a particular profession or occupation eg ICPAK
Revision Questions and Answers
ECONOMICS
89
• Political and economic stability • Opportunity cost – leisure and work
Demand factors:
• Efficiency/productivity • Wage rate • Technology • Availability of the other factors of production • Demand for the goods that labour help produce (final goods) • Mobility
Capital:- Supply factors:
• Availability of credit • Technical progress • Domestic savings • Level of output of goods and services • External borrowing – banks, grants, gifts.
Demand factors:
• Cost of capital (interest rate) • Marginal productivity/efficiency of capital • Demand for the final product • Stage of development (level of technology required) • Level of anticipated output
Land:- Supply of land is for all practical purposes fixed – reclamation may be made but this does not constitute any real increase in the supply of land i.e. more land can only be brought into use or increasing its productivity.
Demand factors:
• Cost of land – rent etc. • Number of alternative uses • Population size/growth rate • Productivity
Entrepreneurship:
• The supply of entrepreneurship depends on a country’s human resource development
through education, specialized training, experience etc. • The demand for entrepreneurship is determined by the level of economic activities in a
country.
NB: The supply and demand of factors of production depend on the specific nature and aspects of a particular factor itself.

Answers
STRATHMORE UNIVERSITY ● REVISION KIT
90
Question 20
(a) (i) The law of diminishing returns or variable proportions states that “as successive and equally efficient units of a variable factor of production are added to a given quantity of a fixed factor in the short-run and at constant technology, the total output/product (TP) will initially increase at an increasing rate upto a point/level where it starts increasing at a diminishing rate and eventually declines”. This means that the first unit of the variable factor of production will contribute most to the total product and that each successive unit will contribute less than the one before. So marginal product (MP) and average product (AP) of the variable factor will start falling as diminishing returns set in but MP will fall faster than AP. (ii) The law of variable proportions is based on the following assumptions:
• Equally efficient successive units of a variable factor • Short-run – it operates within the short-run where at least one factor of production is fixed. • Constant technology i.e. there should be no changes in production techniques. • There must be a variable factor of production as well.
Total product is the total output arising from factor combination in a production process in the short-run. Marginal product is the ratio of change in total product to the change in the units of the variable factor of production or change in total product per unit change in the variable factor of production: MP = ∆TP/∆L where L represents labour. Average product is the total product per unit of the variable factor: AP = TP/L where L stands for labour. (b) Diminishing returns takes the following four stages of production:
• Increasing returns • Decreasing returns • Constant returns • Negative returns.
However, it’s usually explained in terms of the three main stages:
I – Increasing returns II – Decreasing/diminishing returns III – Negative returns
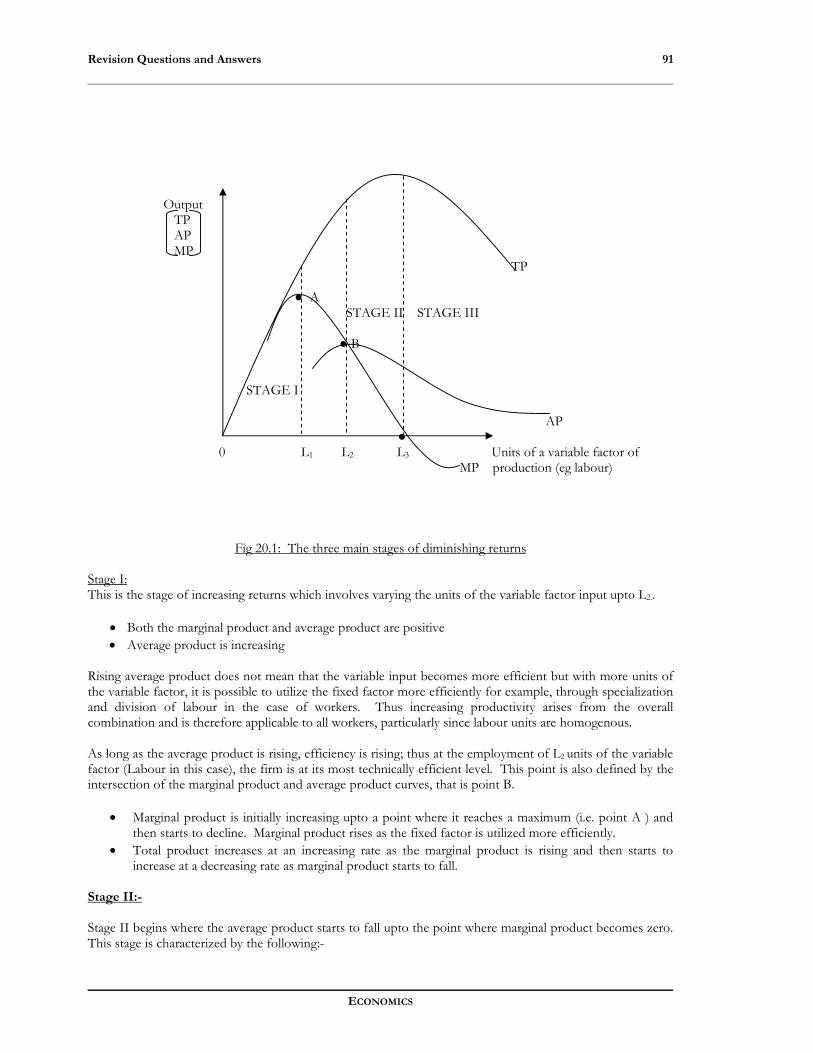
Revision Questions and Answers
ECONOMICS
91
Output
TP AP MP TP ● A STAGE II STAGE III ● B STAGE I AP ● 0 L1 L2 L3 Units of a variable factor of MP production (eg labour)
Fig 20.1: The three main stages of diminishing returns Stage I: This is the stage of increasing returns which involves varying the units of the variable factor input upto L2..
• Both the marginal product and average product are positive • Average product is increasing
Rising average product does not mean that the variable input becomes more efficient but with more units of the variable factor, it is possible to utilize the fixed factor more efficiently for example, through specialization and division of labour in the case of workers. Thus increasing productivity arises from the overall combination and is therefore applicable to all workers, particularly since labour units are homogenous. As long as the average product is rising, efficiency is rising; thus at the employment of L2 units of the variable factor (Labour in this case), the firm is at its most technically efficient level. This point is also defined by the intersection of the marginal product and average product curves, that is point B.
• Marginal product is initially increasing upto a point where it reaches a maximum (i.e. point A ) and then starts to decline. Marginal product rises as the fixed factor is utilized more efficiently.
• Total product increases at an increasing rate as the marginal product is rising and then starts to increase at a decreasing rate as marginal product starts to fall.
Stage II:- Stage II begins where the average product starts to fall upto the point where marginal product becomes zero. This stage is characterized by the following:-
Answers
STRATHMORE UNIVERSITY ● REVISION KIT
92
• Both marginal product and average product are declining, with marginal product falling much faster. • Declining average product indicates decreasing returns and thus decreasing efficiency. This comes
about because each additional unit of the variable factor has less and less of the fixed factor to work with.both marginal product and average product are positive.
• Total product is increasing at a decreasing rate and thus stage II is the stage of diminishing returns Stage III:- Stage III begins where marginal product becomes negative such that the total product begins to fall as well. AP continues to fall but remains positive. This is the stage of extreme inefficiency where factors of production are probably getting into each other’s way, that is, at this stage the use value ( according to the labour theory of value) is less than the exchange value of labour (i.e. price/wage rate is greater than the productivity/return) Firms will thus find stage economically efficient because marginal product and average product are positive and declining. Additional units of the variable factor of production will increase total product at this stage. The law of variable proportions does not take into account the aspect of cost of production. The only relevant cost is that of labour, the cost of the fixed factor is irrelevant as this is a S-R model. Therefore, in order to determine the most profitable way of combining factors of production prices and productivity of the factors must be considered. So far, the emphasis has been on the physical productivity of the variable factor (eg labour) although entrepreneurs are more concerned with economic efficiency and they will therefore measure output and input in monetary terms. Inputs will be measured as costs and output as revenue.
The concern/objective is the maximization of the difference between cost and revenue and NOT the productivity (in terms of the physical aspect of output) of the variable factor, especially if its relatively cheaper. The law of diminishing returns is important in that it is seen to operate in practical situation where its conditions are fulfilled. Thus, in a number of developing countries with peasant agricultural economies, population is increasing rapidly on relatively fixed land, and with unchanging traditional methods of production. Consequently, productivity in terms of output per head is declining and in some cases total productivity is falling. Also the law is relevant in explaining the least-cost-factor-combination aspect of a production process, which is achieved when a firm maximizes the productivity of the most expensive factor of production. Productivity is measured in terms of output per unit of a factor. Thus, if the variable factor is the most expensive, the firm should employ it until the AP is at the maximum. However, if the fixed factor is most expensive the firm should employ the variable factor up to the level where TP is at its maximum.
Question 21
a) Oligopoly refers to a market structure dominated by a few large firms. These few firms account for the whole output of the industry for example banks and newspaper companies. In this market structure, the number of firms is small enough for each seller to take account of the actions of the other sellers in the market, that is, if one firm changes its price or non-price strategies its rivals will react. This is referred to as oligopolistic interdependency. This then means that each oligopolist formulates his policies with an eye to their effect on its rivals.
Some of the factors responsible for oligopoly are:
• In some industries, low production costs cannot be achieved unless a firm is producing an output
equal to a substantial portion of the total available market, so consequently the number of firms will tend to be rather small
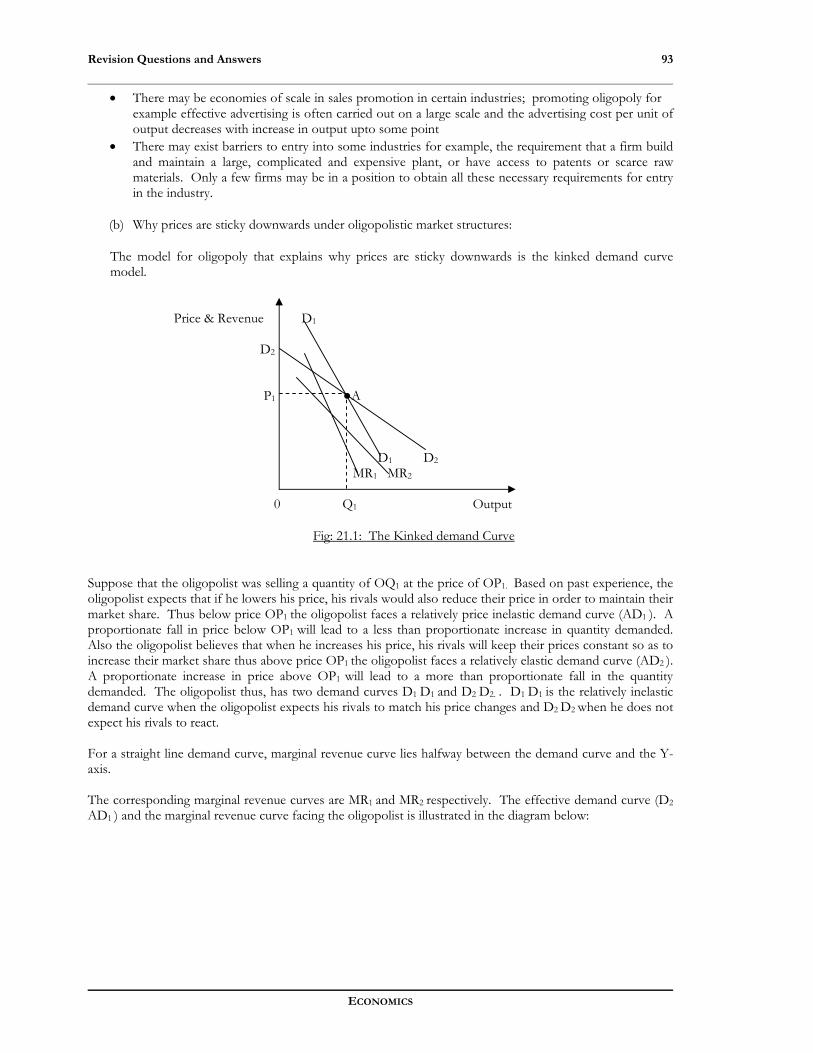
Revision Questions and Answers
ECONOMICS
93
• There may be economies of scale in sales promotion in certain industries; promoting oligopoly for example effective advertising is often carried out on a large scale and the advertising cost per unit of output decreases with increase in output upto some point
• There may exist barriers to entry into some industries for example, the requirement that a firm build and maintain a large, complicated and expensive plant, or have access to patents or scarce raw materials. Only a few firms may be in a position to obtain all these necessary requirements for entry in the industry.
(b) Why prices are sticky downwards under oligopolistic market structures:
The model for oligopoly that explains why prices are sticky downwards is the kinked demand curve model.
Price & Revenue D1
D2 P1 ●A D1 D2 MR1 MR2 0 Q1 Output
Fig: 21.1: The Kinked demand Curve
Suppose that the oligopolist was selling a quantity of OQ1 at the price of OP1. Based on past experience, the oligopolist expects that if he lowers his price, his rivals would also reduce their price in order to maintain their market share. Thus below price OP1 the oligopolist faces a relatively price inelastic demand curve (AD1 ). A proportionate fall in price below OP1 will lead to a less than proportionate increase in quantity demanded. Also the oligopolist believes that when he increases his price, his rivals will keep their prices constant so as to increase their market share thus above price OP1 the oligopolist faces a relatively elastic demand curve (AD2 ). A proportionate increase in price above OP1 will lead to a more than proportionate fall in the quantity demanded. The oligopolist thus, has two demand curves D1 D1 and D2 D2. . D1 D1 is the relatively inelastic demand curve when the oligopolist expects his rivals to match his price changes and D2 D2 when he does not expect his rivals to react. For a straight line demand curve, marginal revenue curve lies halfway between the demand curve and the Y-axis. The corresponding marginal revenue curves are MR1 and MR2 respectively. The effective demand curve (D2
AD1 ) and the marginal revenue curve facing the oligopolist is illustrated in the diagram below:

Answers
STRATHMORE UNIVERSITY ● REVISION KIT
94
Cost & Revenue D2 MR2 MC2 P1 ●A MC1 ●C
●D D1 MR1 0 q1 Output (Q) Fig 21.2: To illustrate the effective demand curve and marginal revenue curve in Oligopoly
The effective demand curve is D2 AD1 . It is referred to as a kinked demand curve since it is kinked at point A. The effective marginal revenue curve is given by D2 CDMR1 with a discontinuity between C and D. Since the firm is at equilibrium with the output of Oq1 and price Op1, marginal cost curve cuts (intersects) the marginal revenue curve somewhere in the area of discontinuity. Changes in the firm’s marginal cost are possible (from MC1 to MC2 ) which will not induce the firm to change its price. Also possible are the changes in the market demand which shift the demand curve in and out without affecting the height of the kink. In short, changes in costs and revenue over a certain range will not affect the equilibrium price. The firm can easily reduce the price but it is very hard to increase the price since if it increases, it will lose a big proportion of its market share. The price therefore remains sticky once reduced, that is, all other firms will follow suit and reduce but none will increase the price. (c) A monopolist making losses: A monopolist is a single seller in any market. The seller constitutes the industry and there are no close substitutes for the product and there exists barriers to entry in the industry. In the short run, a monopolist can make a loss even when he is producing where MR = MC. This is illustrated below:
Cost & Revenue SMC SATC C ●B P1 ●A ●e AR=D MR 0 X1 Output (Q)
Fig 21.3: Loss – making in monopoly

Revision Questions and Answers
ECONOMICS
95
A monopolist faces a downward sloping demand curve since he is a price maker and quantity setter. The AR curve is the Demand curve. Since the curve (AR) is downward sloping, MR will always be less than price since the firm must reduce the price of all units of output, not just the extra unit in order to sell that extra unit.The monopolist is at equilibrium where MC = MR. This is at the output level of OX1. . The price charged by the monopolist is OP1 and the average cost is OC. Since the average cost is greater than the average revenue at equilibrium the firm makes a loss. Total Cost is defined by OX1 BC while total revenue is the area OX1 AP1 . The firm thus makes a loss equal to P1 ABC, the shaded area. Whether the monopolist making a loss will continue production depends on whether he covers the average variable cost or not. This is illustrated below: MC ATC Cost & Revenue
C ●B
P1 ●A
AVC
C1 ●W ●e AR MR 0 X1 Output (Q)
Fig 21.4: A monopolist covering average variable cost
The shaded area is the loss. However, in order to minimize losses, the firm will continue production since AR is greater than average variable cost (AR>AVC). If AR is less than AVC, the firm does not cover its variable cost and will therefore minimize losses by shutting down production. MC
Cost & Revenue ATC C2 ●B AVC C1 ●W P1 ●A ●e AR MR
0 X1 Output (Q) Fig 21.5: A monopolist not covering average variable cost
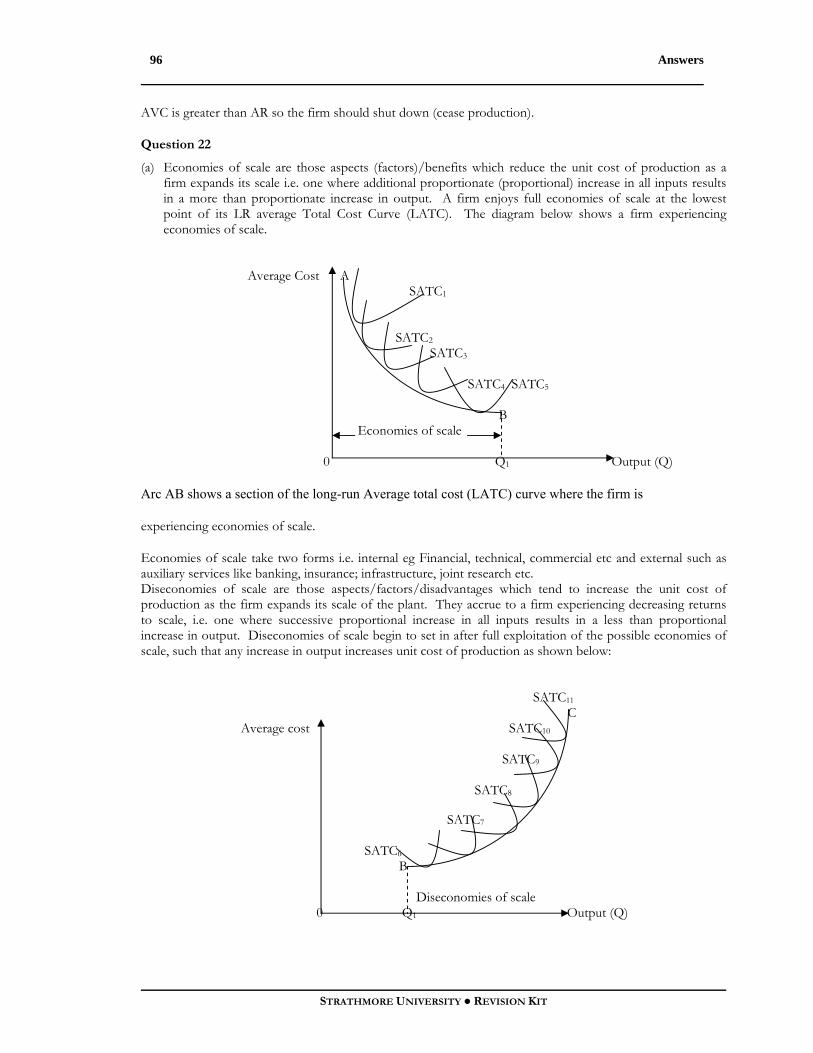
Answers
STRATHMORE UNIVERSITY ● REVISION KIT
96
AVC is greater than AR so the firm should shut down (cease production).
Question 22
(a) Economies of scale are those aspects (factors)/benefits which reduce the unit cost of production as a firm expands its scale i.e. one where additional proportionate (proportional) increase in all inputs results in a more than proportionate increase in output. A firm enjoys full economies of scale at the lowest point of its LR average Total Cost Curve (LATC). The diagram below shows a firm experiencing economies of scale.
Average Cost A SATC1 SATC2 SATC3 SATC4 SATC5 B Economies of scale 0 Q1 Output (Q) Arc AB shows a section of the long-run Average total cost (LATC) curve where the firm is
experiencing economies of scale.
Economies of scale take two forms i.e. internal eg Financial, technical, commercial etc and external such as auxiliary services like banking, insurance; infrastructure, joint research etc. Diseconomies of scale are those aspects/factors/disadvantages which tend to increase the unit cost of production as the firm expands its scale of the plant. They accrue to a firm experiencing decreasing returns to scale, i.e. one where successive proportional increase in all inputs results in a less than proportional increase in output. Diseconomies of scale begin to set in after full exploitation of the possible economies of scale, such that any increase in output increases unit cost of production as shown below: SATC11 C Average cost SATC10 SATC9 SATC8 SATC7 SATC6 B Diseconomies of scale 0 Q1 Output (Q)
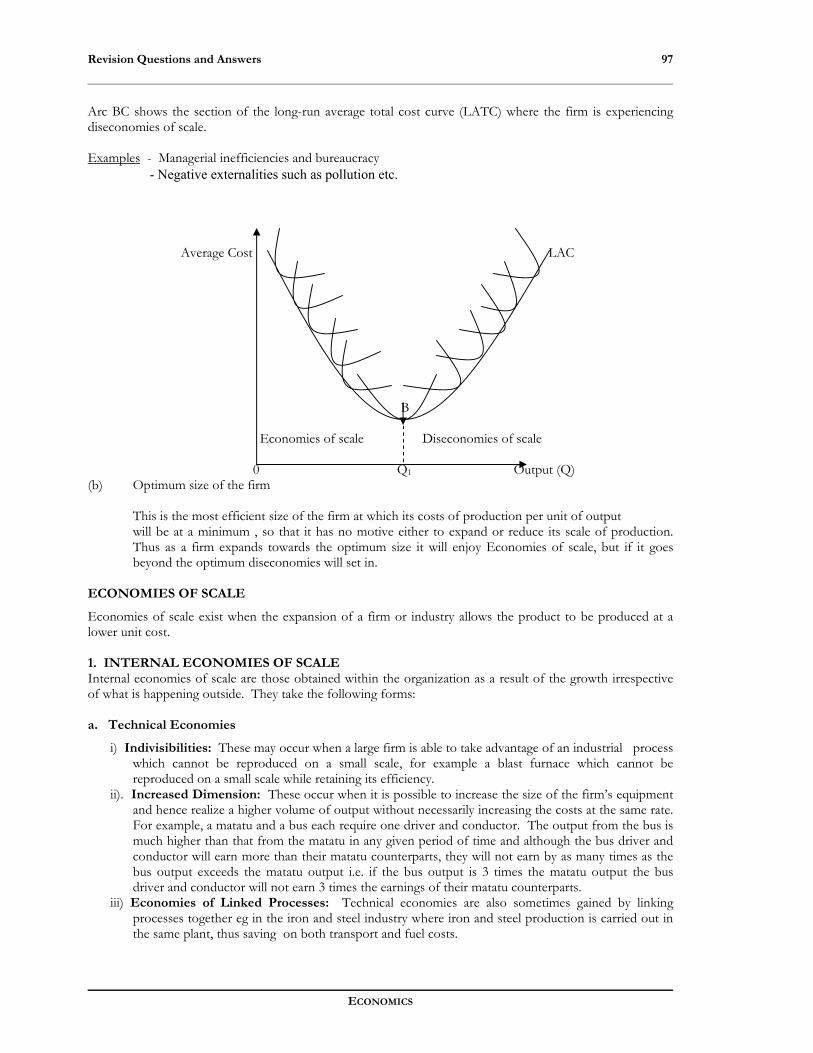
Revision Questions and Answers
ECONOMICS
97
Arc BC shows the section of the long-run average total cost curve (LATC) where the firm is experiencing diseconomies of scale. Examples - Managerial inefficiencies and bureaucracy - Negative externalities such as pollution etc.
Average Cost LAC B Economies of scale Diseconomies of scale 0 Q1 Output (Q) (b) Optimum size of the firm This is the most efficient size of the firm at which its costs of production per unit of output
will be at a minimum , so that it has no motive either to expand or reduce its scale of production. Thus as a firm expands towards the optimum size it will enjoy Economies of scale, but if it goes beyond the optimum diseconomies will set in.
ECONOMIES OF SCALE
Economies of scale exist when the expansion of a firm or industry allows the product to be produced at a lower unit cost. 1. INTERNAL ECONOMIES OF SCALE Internal economies of scale are those obtained within the organization as a result of the growth irrespective of what is happening outside. They take the following forms: a. Technical Economies
i) Indivisibilities: These may occur when a large firm is able to take advantage of an industrial process which cannot be reproduced on a small scale, for example a blast furnace which cannot be reproduced on a small scale while retaining its efficiency.
ii). Increased Dimension: These occur when it is possible to increase the size of the firm’s equipment and hence realize a higher volume of output without necessarily increasing the costs at the same rate. For example, a matatu and a bus each require one driver and conductor. The output from the bus is much higher than that from the matatu in any given period of time and although the bus driver and conductor will earn more than their matatu counterparts, they will not earn by as many times as the bus output exceeds the matatu output i.e. if the bus output is 3 times the matatu output the bus driver and conductor will not earn 3 times the earnings of their matatu counterparts.
iii) Economies of Linked Processes: Technical economies are also sometimes gained by linking processes together eg in the iron and steel industry where iron and steel production is carried out in the same plant, thus saving on both transport and fuel costs.

Answers
STRATHMORE UNIVERSITY ● REVISION KIT
98
iv) Specialization: Specialisation of labour and machinery can lead to the production of better quality output and higher volume of output.
v) Research: A large firm will be in a better financial position to devote funds to research and improvement of its product than a small firm.
b) Marketing Economies
i) The buying advantage: A large-scale organization may buy its materials in bulk and therefore get preferential treatment and buy at a discount more easily than a small firm.
ii) The packaging advantage: It is easier to pack in bulk than in small quantities and although for a large firm the packaging costs will be higher than for small firms, they will be spread over a large volume of output and the cost per unit will be lower.
iii) The selling advantage: A large-scale organization may be able to make fuller use of sales and distribution facilities than a small-scale one. For example, a company with a large transport fleet will probably be able to ensure that they transport mainly full loads, whereas a small
business may have to hire transport or dispatch partloads. c) Organizational:
As a firm becomes larger, the day-to –day organizations can be delegated to office staff, leaving managers free to concentrate on the important tasks. When a firm is large enough to have a management staff they will be able to specialize in different functions such as accounting, law and market research.
d) Financial Economies:
A large firm will have more assets than a small firm. Hence, it will find it cheaper and easier to borrow money from financial institutions like commercial banks than a small firm.
e) Risk-bearing Economies
All firms run risks, but risks taken in large numbers become more predictable. In addition to this, if an organization is so large as to be a monopoly, this considerably reduces its commercial risks.
f) Overhead Processes:
For some products, very large overhead costs or processes must be undertaken to develop a product, for example an airliner. Clearly, these costs can only be justified if large numbers of units are subsequently produced.
g) Diversification:
As the firm becomes very large it may be able to safeguard its position by diversifying its products, processes, markets and the location of the production.
2. EXTERNAL ECONOMIES
These are advantages enjoyed by a large size firm when a number of organizations group together in an area irrespective of what is happening within the firm. They include:
a) Economies of concentration: When a number of firms in the same industry band together in an
area they can derive a great deal of mutual advantage from one another. Advantages might include a pool of skilled workers, a better infrastructure (such as transport, specialized warehousing, banking etc) and the stimulation of improvements. The lack of such external economies is a serious handicap to less developed countries.
b) Economies of information: Under this heading, we could consider the setting up of specialist research facilities and the publication of specialist journals.
b) Economies of disintegration: This refers to the splitting off or subcontracting of specialist processes. A simple example is to be seen in the high street of most towns where there are specialist photocopying firms.
c)

Revision Questions and Answers
ECONOMICS
99
It should be stressed that what are external economies at one time may be internal at another. To use the last example, small firms may not be able to justify the cost of a sophisticated photocopier but as they expand there may be enough work to allow them to purchase their own machine.
Diseconomies of Scale:
Diseconomies of scale occur when the size of a business becomes so large that, rather than decreasing, the unit cost of production actually becomes greater. Diseconomies of scale flow from administrative rather than technical problems.
a) Bureaucracy: As an organization becomes larger there is a tendency for it to become more
bureaucratic. Decisions can no longer be made quickly at the local levels of management. This may lead to loss of flexibility.
b) Loss of control: Large organizations often find it more difficult to monitor effectively the performance of their workers. Industrial relations can also deteriorate with a large workforce and a management which seems remote and anonymous.
Question 23
(a) Economies of scale and returns to scale:
Economies of scale are the forces causing a firm’s long-run average cost to decrease as its output level and size of the plant are increased; usually thought to be (i) increasing possibilities of division and specialization of labour and (ii) greater possibilities of using more efficient technology, that is, using advanced technological development and/or larger machines. Returns to scale are the benefits that accrue to a firm from changing the proportions in which factors of production are combined. A rational firm will always seek to maximize profits by minimizing costs: the least-cost factor combination Returns to scale are basically concerned with the physical input and output relationships. If, for example, the input of factors of production were to increase by 100% and output by 150%, increasing returns to scale will be realized. Conversely, if inputs were to be increased by 100% but output increases by less than 100% then a firm would be experiencing decreasing returns to scale. Increasing returns to scale should lead to decreasing costs. Confusion frequently arises between economies of scale and returns to scale. Economies of scale reduce the unit cost of production as the scale of production is increased, while returns to scale are largely looked at in terms of the physical input and output relationships in the long-run when all factors of production are variable.
Bulk-buying, for example, may be a cost economy to a business (firm) but it does not involve returns to scale since no change in the input-output relationship is involved.
Generally, returns to scale are the technical aspects of the economies of scale.
(b) Demand function: Q – 90 + 2P = 0
NB: Recall that TR = P.Q OR TR = AR.Q in perfect competition where AR = P. ∴ Express P in terms of Q in the demand function as follows:
Q – 90 + 2P = 0
2P = 90 – Q
P = 45 – ½ Q ------------------(i)

Answers
STRATHMORE UNIVERSITY ● REVISION KIT
100
TR = P.Q = Q(45 – ½ Q)
TR = 45Q – ½ Q2 -------------------(ii)
MR = dTR = 45 – Q ------------------- (iii)
dQ
AC = Q2 – 8Q + 57 + 2/Q
TC = AC.Q = (Q2 – 8Q + 57 + 2/Q)Q
Q3 – 8 Q2 + 57Q + 2 ----- (iv)
MC = dTC = 3 Q2 – 16Q + 57 -----------(v)
dQ
Since the first order condition (FOC) provides that profit maximization is at MR = MC level of output, then 45-Q = 3Q2 – 16Q + 57
3Q2 – 16Q + 57 – 45 + Q = 0
3Q2 – 15Q + 12 = 0 --------------- (vi) → Q2 - 5Q + 4 = 0
Q2 – Q – 4Q + 4 =0
Q(Q-1) –4(Q-1) = 0
(Q – 4) (Q – 1) = 0
Case (i): Q – 4 = 0
Q = 4 units
Case (2): Q – 1 = 0
Q = 1 unit
Revision Questions and Answers
ECONOMICS
101
Factorization method:
3Q2 – 12Q – 3Q + 12 = 0
3Q(Q – 4) –3(Q – 4) = 0
(3Q-3)(Q-4) = 0
Therefore two alternatives exist i.e.:
(i) 3Q – 3 = 0
3Q = 3
Q = (3/3) = 1 unit of output
(ii) Q – 4 = 0
Q = (0 + 4) = 4 units of output
Formula method:
3Q2 – 15Q + 12 = 0
3/3Q2 – 15/3Q + 12/3 = 0/3
Q2 - 5Q + 4 = 0
Q = -b± √ b2 – 4ac_____
2a
= -(-5) ± √ (-5)2 – (4)(1)(4)
2(1)
= 5 ± √ 25 – 16______ 2 = 5 ± √ 9___ 2 = 5 ± 3 2 Case (1) where 3 is positive:
Q = (5 + 3) = (8)
2 2
∴ Q = 4 units of output
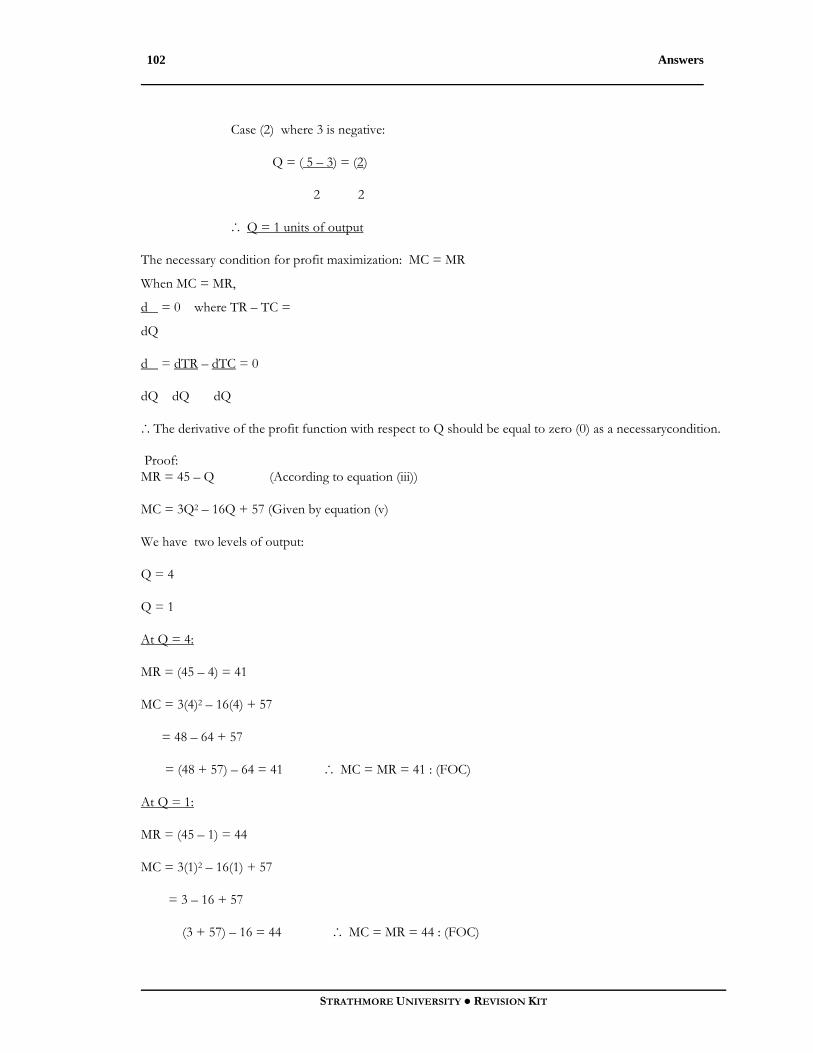
Answers
STRATHMORE UNIVERSITY ● REVISION KIT
102
Case (2) where 3 is negative:
Q = ( 5 – 3) = (2)
2 2
∴ Q = 1 units of output
The necessary condition for profit maximization: MC = MR
When MC = MR,
d� = 0 where TR – TC = �
dQ
d� = dTR – dTC = 0
dQ dQ dQ
∴ The derivative of the profit function with respect to Q should be equal to zero (0) as a necessarycondition.
Proof: MR = 45 – Q (According to equation (iii))
MC = 3Q2 – 16Q + 57 (Given by equation (v)
We have two levels of output:
Q = 4
Q = 1
At Q = 4:
MR = (45 – 4) = 41
MC = 3(4)2 – 16(4) + 57
= 48 – 64 + 57
= (48 + 57) – 64 = 41 ∴ MC = MR = 41 : (FOC)
At Q = 1:
MR = (45 – 1) = 44
MC = 3(1)2 – 16(1) + 57
= 3 – 16 + 57
(3 + 57) – 16 = 44 ∴ MC = MR = 44 : (FOC)

Revision Questions and Answers
ECONOMICS
103
From the above computations, both levels of output (Q = 4 & Q = 1) fulfill the necessary condition for profit maximization. Thus which level of output actually maximizes profit is determined by performing the second order condition (SOC) which is the sufficient condition for profit maximization. This is done as follows: The second derivative is obtained by differentiating the first derivative (i.e. the MR and MC functions as given in equations (iii) and (v) respectively) with respect to Q or differentiating the profit function with respect to Q. By differentiating the MR & MC functions with respect to Q, the sufficient condition requires that the value obtained for MR is less than the value obtained for MC, that is, R11 (Q) < C11 (Q)
Proof:
R = R1 (Q) = 45 – Q
dMR = R11 (Q) = -1
dQ
MC = C1 (Q) = 3Q2 – 16Q + 57
dMC = C11 (Q) = 6Q – 16
dQ
At Q = 4, C11 (Q) = 6(4) – 16 = (24 – 16) = 8
At Q = 1, C11 (Q) = 6(1) – 16 = (6 – 16) = -10
From the above computations, it is now evidently clear (proved) that
R11 (Q) <C11 (Q) at Q = 4 ∴ profits are maximized at Q = 4
Units of output (SOC):
d2 � ≡ �II (Q) = RII (Q) - C1I (Q)
d2Q
< 0 if R1I (Q) <CII (Q)
Thus for an output level Q such that R1 (Q) = C1 (Q), the satisfaction of the second order condition RII (Q) < CII (Q) is sufficient to establish it as a profit – maximizing output. Economically, this would mean that if the rate of change of MR is less than the rate of change of MC at the output level where MC = MR, then that output will maximize profit.

Answers
STRATHMORE UNIVERSITY ● REVISION KIT
104
(c) (i) A perfectly competitive market is the one where prices of commodities are set by the forces of
demand and supply. All the firms in the industry are price takers and the goods produced are homogenous. In this market structure, firms incur average fixed cost and average variable costs. A firm may continue production of goods even though it can sell at a loss if it can cover its average variable costs. By producing more, it will minimize its losses.
This is illustrated below:
Cost & Revenue SMC SATC A ●B SAVC P2 ●e1 AR2 = MR2 = P2 P1 e2 AR1 = MR1 = P1 P3 e3 AR3 = MR3 = P3 0 Q3 Q1 Q2 Output Level (Q)
Fig 23:1: A loss making firm is perfect competition covering its average variable costs
A firm in perfect competition will maximize its profit at the point where marginal revenue = marginal cost i.e. MR = MC. Suppose that the price set by the forces of demand and supply is P2. The firm’s Average revenue = Marginal revenue = P2 i.e. AR = MR = P2 . The profit maximizing output will be Q2 at the position where MC = MR. The firm will be earning a revenue equal to the area of OQ2 e1 P2 but the average cost it incurs will be represented by the area OQ2 BA which is greater than the revenue it earns; thus it will be making losses represented by the shaded area (P2 e1 BA). Although the firm is incurring losses it is able to cover its average variable cost and so it would continue production because by doing so it will be minimizing its losses. Therefore, it will profit the firm to continue operation though incurring losses because by doing so the losses will eventually be completely minimized (relatively minimized). Assume that the price was to fall from P2 to P1 the firm will be at equilibrium at the point where MC = MR. At this point, it is producing an output of OQ1 . This output will be earning revenue represented by the area OQ1 e2 P1 but at this point it is still making losses because the average total cost is higher. Though incurring losses, the firm is at the point where it is just covering its average variable cost. This point is called the shutdown point because below this price (OP1 ) it would benefit the firm to quit production. However, at this point the firm could decide to either close down or continue production because it just covers it coverage variable costs.
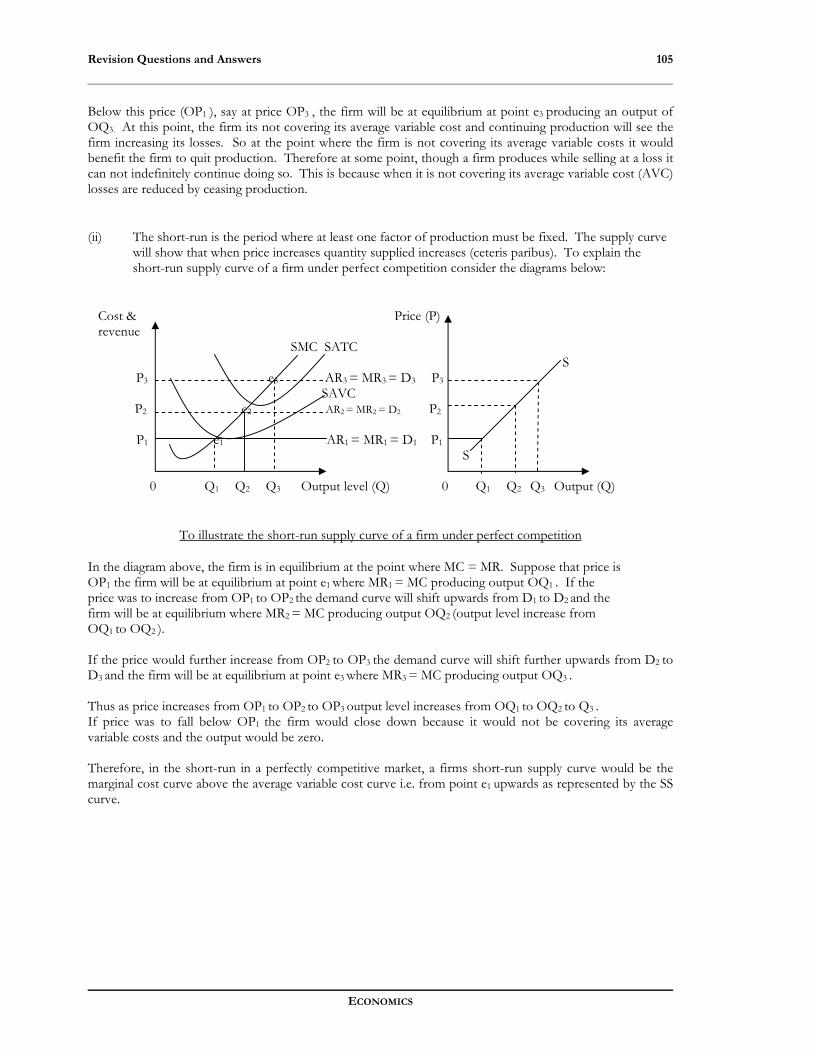
Revision Questions and Answers
ECONOMICS
105
Below this price (OP1 ), say at price OP3 , the firm will be at equilibrium at point e3 producing an output of OQ3. At this point, the firm its not covering its average variable cost and continuing production will see the firm increasing its losses. So at the point where the firm is not covering its average variable costs it would benefit the firm to quit production. Therefore at some point, though a firm produces while selling at a loss it can not indefinitely continue doing so. This is because when it is not covering its average variable cost (AVC) losses are reduced by ceasing production.
(ii) The short-run is the period where at least one factor of production must be fixed. The supply curve will show that when price increases quantity supplied increases (ceteris paribus). To explain the short-run supply curve of a firm under perfect competition consider the diagrams below:
Cost & Price (P) revenue SMC SATC S P3 e3 AR3 = MR3 = D3 P3 SAVC P2 e2 AR2 = MR2 = D2 P2 P1 e1 AR1 = MR1 = D1 P1 S 0 Q1 Q2 Q3 Output level (Q) 0 Q1 Q2 Q3 Output (Q)
To illustrate the short-run supply curve of a firm under perfect competition
In the diagram above, the firm is in equilibrium at the point where MC = MR. Suppose that price is OP1 the firm will be at equilibrium at point e1 where MR1 = MC producing output OQ1 . If the price was to increase from OP1 to OP2 the demand curve will shift upwards from D1 to D2 and the firm will be at equilibrium where MR2 = MC producing output OQ2 (output level increase from OQ1 to OQ2 ). If the price would further increase from OP2 to OP3 the demand curve will shift further upwards from D2 to D3 and the firm will be at equilibrium at point e3 where MR3 = MC producing output OQ3 . Thus as price increases from OP1 to OP2 to OP3 output level increases from OQ1 to OQ2 to Q3 . If price was to fall below OP1 the firm would close down because it would not be covering its average variable costs and the output would be zero. Therefore, in the short-run in a perfectly competitive market, a firms short-run supply curve would be the marginal cost curve above the average variable cost curve i.e. from point e1 upwards as represented by the SS curve.
Answers
STRATHMORE UNIVERSITY ● REVISION KIT
106
Question 24
P = 13 – 0.5Q MC = 3 + 4Q TFC = 4 a) Profit maximizing output:
p = 13 – 0.5Q OR AR .Q TR = P.Q = (13 – 0.5Q)Q and P = AR TR = 13Q – 0.5Q2 therefore TR = (13 – 0.5Q)Q MR = dTR = 13 – Q TR = 13Q – 0.5Q2 dQ OR TR = 13Q – 0.5Q2 AR = 13 – 0.5Q Slope of MR = 2 slope of AR Therefore MR = 13 – 0.5(2)Q MR = 13 –Q � maximized at MC = MR: 3 + 4Q = 13 – Q
5Q = 10 Q = 10 = 2 5 ∴ Q = 2 units b) Supernormal profit occurs where
TR > TC TR = 13Q – 0.5Q2 but Q = 2 13(2) – 0.5 (2)2 26 – 0.5 (4) (26 – 2) = 24
OR p = 14 – 0.5Q but Q = 2
P = 13 – 0.5(2) = 12 TR = P.Q = (12 x 2) = 24
Therefore TR = 24
TC = ∫MC + K
TC = ∫ )(MC dQ but MC = 3 + 4Q Therefore TC = 3Q + 2Q2 + K but TFC = 4
TC = 4 + 3Q + 2Q2 but Q = 2 4 + 3(2) + 2(2)2 = (4 + 6 + 8) = 18
Therefore TC = 18
Therefore Supernormal � = (TR – TC) = ( 24 – 18) = 6

Revision Questions and Answers
ECONOMICS
107
c) At Break-even point TC = TR
TR = 13Q – 0.5Q2 TC = 4 + 3Q + 2Q2 Thus, 4 + 3Q + 2Q2 = 13Q – 0.5Q2
2.5Q2 – 10Q + 4 = 0 ⇒5Q2 – 20Q + 8 = 0
Q = -b ± acb 42 -
2a a = 2.5 10 ± 40100 −
b = -10 5 c = 4 10 ± 60
5 (10 + 7.75) = 17.75 = 3.55 units 5 5
OR (10 – 7.75) = (2.25) = 0.45 units
5 5 d) In a perfectly competitive market,
TR = P.Q = 10Q ; MR = dTR = 10 dQ
MC = Q + 4
Therefore The � maximizing output level would be at MC = MR Q + 4 = 10 therefore Q = (10 – 4) = 6 units e) The level of supernormal profit
� = TR – TC TR = P.Q = 10Q = 10 (6) = 60 TC = ∫MCdQ but MC = Q + 4 Therefore TC = ½ Q2 + 4 Q + K ½ (6)2 + 4(6) + 1
½ (36) + 24 + 1 (18 +25) = 43
therefore � = (60 – 43) = 17
P = AR = MR = 10
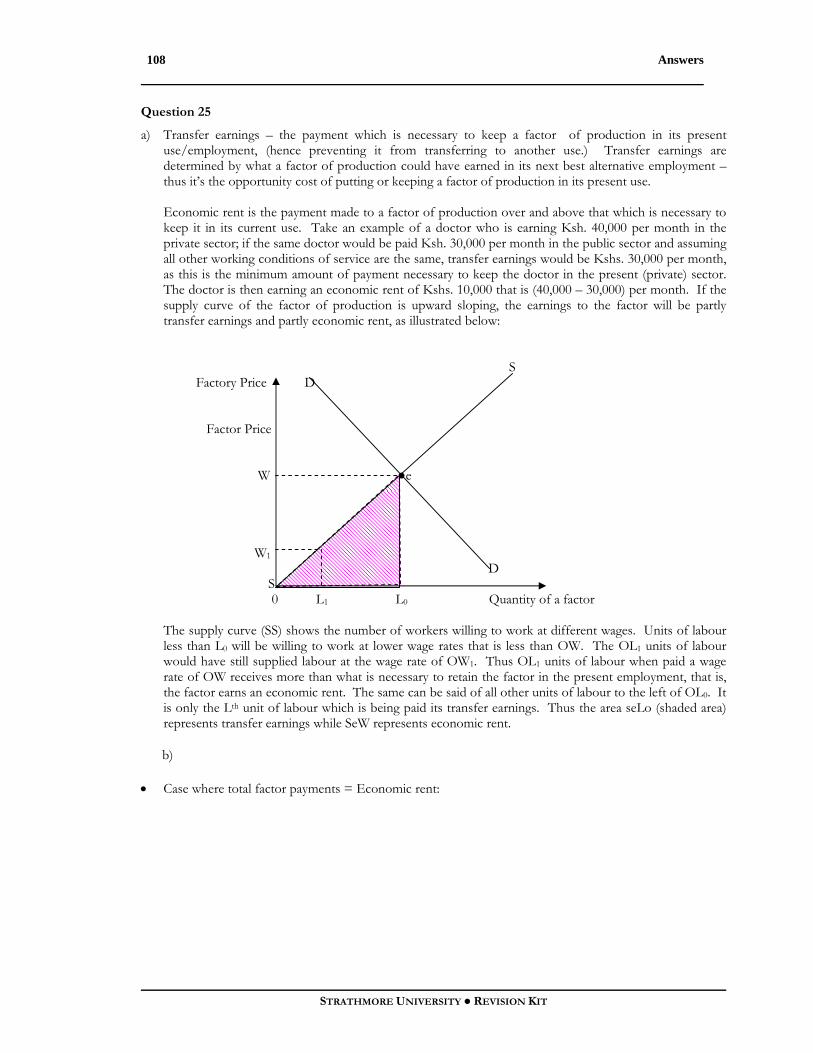
Answers
STRATHMORE UNIVERSITY ● REVISION KIT
108
Question 25
a) Transfer earnings – the payment which is necessary to keep a factor of production in its present use/employment, (hence preventing it from transferring to another use.) Transfer earnings are determined by what a factor of production could have earned in its next best alternative employment – thus it’s the opportunity cost of putting or keeping a factor of production in its present use.
Economic rent is the payment made to a factor of production over and above that which is necessary to
keep it in its current use. Take an example of a doctor who is earning Ksh. 40,000 per month in the private sector; if the same doctor would be paid Ksh. 30,000 per month in the public sector and assuming all other working conditions of service are the same, transfer earnings would be Kshs. 30,000 per month, as this is the minimum amount of payment necessary to keep the doctor in the present (private) sector. The doctor is then earning an economic rent of Kshs. 10,000 that is (40,000 – 30,000) per month. If the supply curve of the factor of production is upward sloping, the earnings to the factor will be partly transfer earnings and partly economic rent, as illustrated below:
S Factory Price D Factor Price W ●e W1 D S 0 L1 L0 Quantity of a factor
The supply curve (SS) shows the number of workers willing to work at different wages. Units of labour less than L0 will be willing to work at lower wage rates that is less than OW. The OL1 units of labour would have still supplied labour at the wage rate of OW1. Thus OL1 units of labour when paid a wage rate of OW receives more than what is necessary to retain the factor in the present employment, that is, the factor earns an economic rent. The same can be said of all other units of labour to the left of OL0. It is only the Lth unit of labour which is being paid its transfer earnings. Thus the area seLo (shaded area) represents transfer earnings while SeW represents economic rent.
b)
• Case where total factor payments = Economic rent:
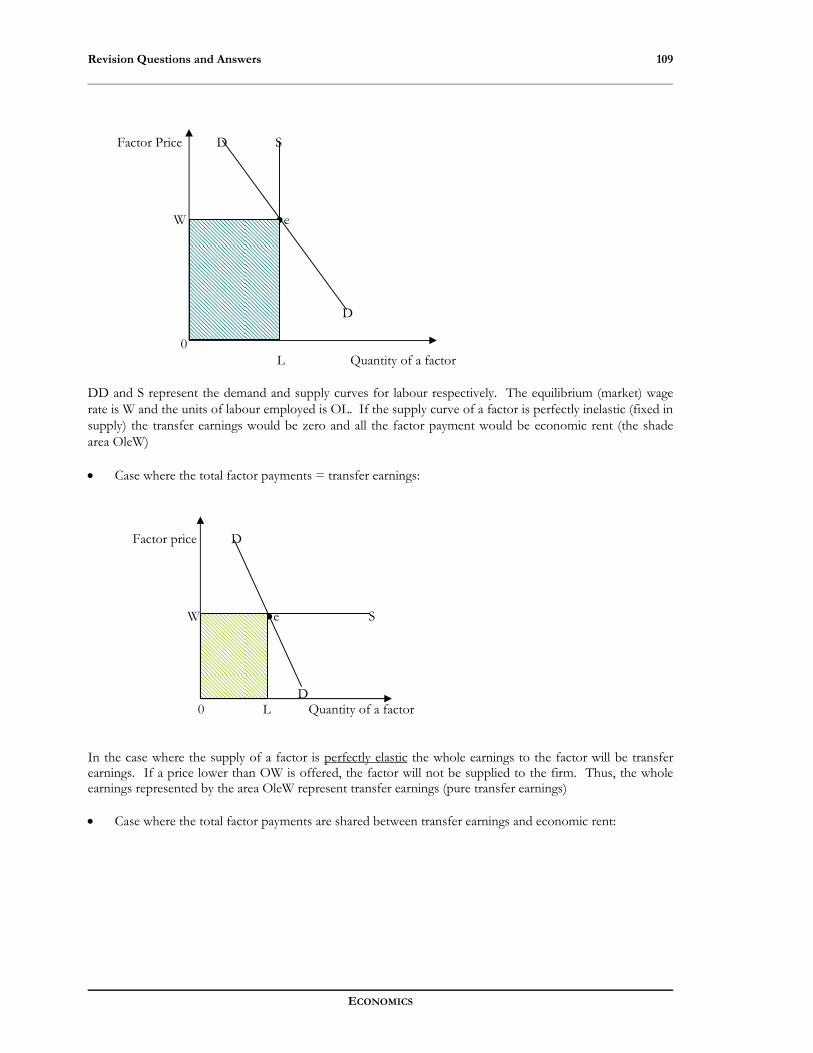
Revision Questions and Answers
ECONOMICS
109
Factor Price D S W ●e D 0 L Quantity of a factor
DD and S represent the demand and supply curves for labour respectively. The equilibrium (market) wage rate is W and the units of labour employed is OL. If the supply curve of a factor is perfectly inelastic (fixed in supply) the transfer earnings would be zero and all the factor payment would be economic rent (the shade area OleW)
• Case where the total factor payments = transfer earnings:
Factor price D W ●e S D 0 L Quantity of a factor
In the case where the supply of a factor is perfectly elastic the whole earnings to the factor will be transfer earnings. If a price lower than OW is offered, the factor will not be supplied to the firm. Thus, the whole earnings represented by the area OleW represent transfer earnings (pure transfer earnings) • Case where the total factor payments are shared between transfer earnings and economic rent:

Answers
STRATHMORE UNIVERSITY ● REVISION KIT
110
D S Factor Price W •e W1 S D 0 L1 L Quantity of a factor
DD and SS represent the demand and supply curves for labour respectively. The equilibrium wage rate is W and the labour force employed is OL units. The area OleW represents the total earnings to the factor. The supply curve (SS) shows the number of workers willing to work at different wage rates. Units of labour less than L will be willing to work at lower wage rates less than OW. OL1 units of labour would have still supplied labour at the wage rate OW1. Thus OL1 units of labour when paid a wage rate of OW receive more than what is necessary to keep the factor in the present employment (that is the factor earns an economic rent). The same can be said of all other units of labour to the left of OL. It is only the Lth unit of labour which is paid transfer earnings. Thus the area SeLO (shaded area) represents transfer earnings while SeW represent economic rent, which is a surplus (producer surplus). The steeper the supply curve the more economic rent would be earned.
c) I) Quasi-Rent:
These are factor rewards which are economic rent in the short-run and transfer earnings in the long-run. This is an amount earned by factors of production (other than land) in the short run when its not possible to increase their supply. May be defined as the payment made to a factor of production in the short run. This is when the supply of the factor of production is less elastic than in the long-run because in the long run it can be transferred to an alternative use. Increased earnings in an occupation, for example, may lead to people undertaking the necessary training in order to qualify for that occupation, thus reducing earnings in the long-run. Therefore, quasi-rent may be defined as the amount earned only during the period which elapses before supply increases.

Revision Questions and Answers
ECONOMICS
111
Wage Rate (W) D SR supply curve LR Supply curve W ●z X D ●Y 0 L Units of Labour
Fig: Quasi-rent
In the figure, the area WXZ is the economic rent for labour. The area YLZ represents the transfer earnings. The equilibrium (market) wage is OW and the number of workers (or hours worked) is OL. The part of labour earnings which is economic rent in the short-run (SR) but transfer earnings in the long-run (LR) is the quasi-rent and is represented by the shaded area OXZY.
ii) Rural-Urban migration refers to the physical movement of people from the rural to urban centers of a country with a view to securing perceived opportunities, especially employment.Nearly all countries experience this movement at varying degrees. Those affected in this movement tend to be mainly the young and educated, especially due to the highly increasing rates of population and unemployment. The migrants perceive high chances of getting jobs in urban centers than in rural areas, and this creates the impetus to migrate. In most countries, urban centers are very distinct from rural areas in terms of industrial location; the concentration of production units in urban areas coupled with the white-collar job orientation arising from the type of education systems, makes the young and educated increase their propensity to migrate in order to get jobs. Rural-urban migration has both positive and negative consequences in the country depending on either the area of origin or destination. A few years ago, rural-urban migration was viewed as a natural process in which surplus labour was gradually withdrawn from the rural sector to provide needed manpower for the urban industrial growth. The process was deemed socially beneficial since human resources were being shifted from locations where their marginal products were assumed to be zero to places where the marginal products were to be not only positive but also rapidly increasing as a result of fast capital accumulation and technical progress. Further, those involved were assumed to be remitting part of their incomes to their rural relatives which was to work towards increasing the living standards of the rural population.
In contract of this view point, it is now abundantly clear from the experience in developing countries that the rates of rural-urban migration continue to exceed the rates of urban job creation. It has infact surpassed the capacity of both industry and urban social services to effectively absorb this labour. Thus, migration is viewed as the major contributing factor to the ubiquitous phenomenon of urban surplus labour and a force which continues to exacerbate the already high urban unemployment problems caused by the growing economic and structural imbalances between urban and rural areas.
Rural-urban migration disproportionately increases the urban job seekers who are young, energetic and educated while heavily depleting the rural country side of valuable human capital necessary for enhanced rural resource utilization. This is infact why most resources in rural areas remain either underutilized or completely unutilized. Consider the large pieces of land which have not been brought to any meaningful
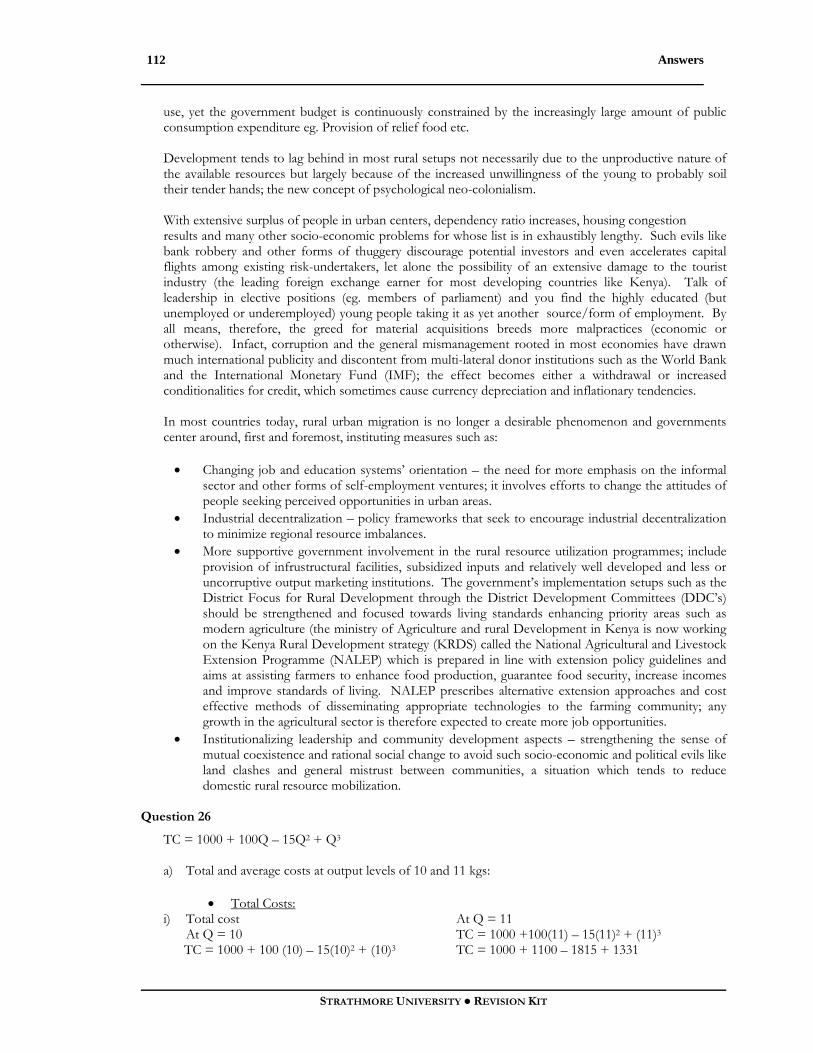
Answers
STRATHMORE UNIVERSITY ● REVISION KIT
112
use, yet the government budget is continuously constrained by the increasingly large amount of public consumption expenditure eg. Provision of relief food etc.
Development tends to lag behind in most rural setups not necessarily due to the unproductive nature of the available resources but largely because of the increased unwillingness of the young to probably soil their tender hands; the new concept of psychological neo-colonialism.
With extensive surplus of people in urban centers, dependency ratio increases, housing congestion results and many other socio-economic problems for whose list is in exhaustibly lengthy. Such evils like bank robbery and other forms of thuggery discourage potential investors and even accelerates capital flights among existing risk-undertakers, let alone the possibility of an extensive damage to the tourist industry (the leading foreign exchange earner for most developing countries like Kenya). Talk of leadership in elective positions (eg. members of parliament) and you find the highly educated (but unemployed or underemployed) young people taking it as yet another source/form of employment. By all means, therefore, the greed for material acquisitions breeds more malpractices (economic or otherwise). Infact, corruption and the general mismanagement rooted in most economies have drawn much international publicity and discontent from multi-lateral donor institutions such as the World Bank and the International Monetary Fund (IMF); the effect becomes either a withdrawal or increased conditionalities for credit, which sometimes cause currency depreciation and inflationary tendencies.
In most countries today, rural urban migration is no longer a desirable phenomenon and governments center around, first and foremost, instituting measures such as:
• Changing job and education systems’ orientation – the need for more emphasis on the informal
sector and other forms of self-employment ventures; it involves efforts to change the attitudes of people seeking perceived opportunities in urban areas.
• Industrial decentralization – policy frameworks that seek to encourage industrial decentralization to minimize regional resource imbalances.
• More supportive government involvement in the rural resource utilization programmes; include provision of infrustructural facilities, subsidized inputs and relatively well developed and less or uncorruptive output marketing institutions. The government’s implementation setups such as the District Focus for Rural Development through the District Development Committees (DDC’s) should be strengthened and focused towards living standards enhancing priority areas such as modern agriculture (the ministry of Agriculture and rural Development in Kenya is now working on the Kenya Rural Development strategy (KRDS) called the National Agricultural and Livestock Extension Programme (NALEP) which is prepared in line with extension policy guidelines and aims at assisting farmers to enhance food production, guarantee food security, increase incomes and improve standards of living. NALEP prescribes alternative extension approaches and cost effective methods of disseminating appropriate technologies to the farming community; any growth in the agricultural sector is therefore expected to create more job opportunities.
• Institutionalizing leadership and community development aspects – strengthening the sense of mutual coexistence and rational social change to avoid such socio-economic and political evils like land clashes and general mistrust between communities, a situation which tends to reduce domestic rural resource mobilization.
Question 26
TC = 1000 + 100Q – 15Q2 + Q3
a) Total and average costs at output levels of 10 and 11 kgs:
• Total Costs: i) Total cost At Q = 11 At Q = 10 TC = 1000 +100(11) – 15(11)2 + (11)3 TC = 1000 + 100 (10) – 15(10)2 + (10)3 TC = 1000 + 1100 – 1815 + 1331

Revision Questions and Answers
ECONOMICS
113
TC = 1000 + 1000 – 1500 + 1000 TC = 1616 TC = 1500
ii) Total fixed cost (TFC)
TC = TFC + TVC TC = 1000 + 100 – 15Q2 + Q3 TFC does not vary with output (same at all levels of output) So when Q = 0 TC = TFC = 1000 When Q = 10 When Q = 11
TFC = 1000 TFC = 1000
iii) Total variable cost (TVC)
TC = TFC + TVC TVC = TC – TFC TVC = 1000 + 100Q – 15Q2 + Q3 – 1000 TVC = 100Q – 15Q2 + Q3
When Q = 10 when Q = 11
TVC = 100(10) – 15(10)2 + (10)3 TVC = 100(11) – 15(11)2 + (11)3 TVC = 1000 – 1500 + 1000 TVC = 1100 – 1815 = 1331 TVC = 500 TVC = 616 • Average Costs: i) Average Total Cost (ATC) Average Total cost is the total cost per unit of output, that is, TC Q
ATC = 1000 + 100Q – 15Q2 + Q3
Q
ATC = 1000 + 100 – 15Q + Q2 Q
When Q = 10 when Q = 11 ATC = 1000 + 100 – 15(10) + (10)2 ATC = 1000 + 100 – 15(11) + (11)2 10 11
ATC = 100 + 100 – 150 + 100 ATC = 90.9 + 100 – 165 + 121 ATC = 150 ATC = 146.9
ii) Average fixed cost (AFC)
Average fixed cost is Total fixed cost per unit of output Symbolically, AFC = TFC Q TFC = 1000 so AFC = 1000 Q When Q is 10 when Q = 11 AFC = 1000 = 100 AFC = 1000 = 90.9 10 11
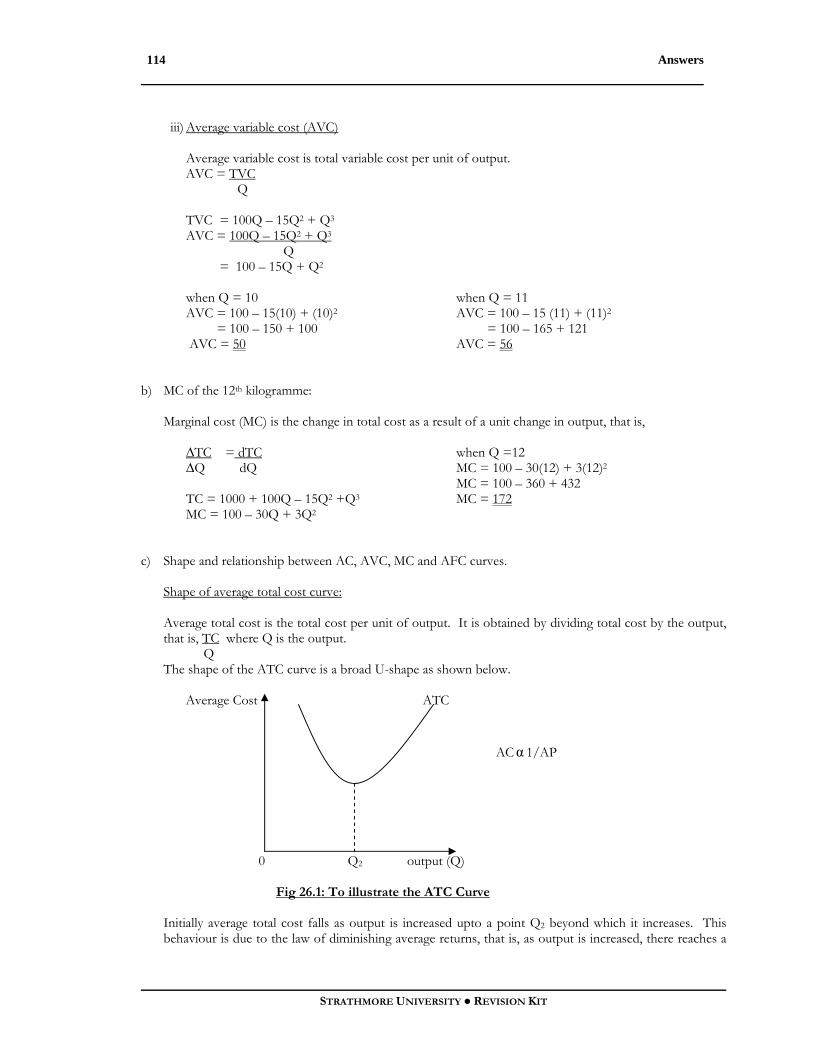
Answers
STRATHMORE UNIVERSITY ● REVISION KIT
114
iii) Average variable cost (AVC) Average variable cost is total variable cost per unit of output. AVC = TVC Q TVC = 100Q – 15Q2 + Q3
AVC = 100Q – 15Q2 + Q3
Q = 100 – 15Q + Q2
when Q = 10 when Q = 11 AVC = 100 – 15(10) + (10)2 AVC = 100 – 15 (11) + (11)2 = 100 – 150 + 100 = 100 – 165 + 121 AVC = 50 AVC = 56
b) MC of the 12th kilogramme:
Marginal cost (MC) is the change in total cost as a result of a unit change in output, that is,
∆TC = dTC when Q =12 ∆Q dQ MC = 100 – 30(12) + 3(12)2 MC = 100 – 360 + 432 TC = 1000 + 100Q – 15Q2 +Q3 MC = 172 MC = 100 – 30Q + 3Q2
c) Shape and relationship between AC, AVC, MC and AFC curves.
Shape of average total cost curve:
Average total cost is the total cost per unit of output. It is obtained by dividing total cost by the output, that is, TC where Q is the output. Q
The shape of the ATC curve is a broad U-shape as shown below.
Average Cost ATC
ACα 1/AP 0 Q2 output (Q)
Fig 26.1: To illustrate the ATC Curve Initially average total cost falls as output is increased upto a point Q2 beyond which it increases. This behaviour is due to the law of diminishing average returns, that is, as output is increased, there reaches a

Revision Questions and Answers
ECONOMICS
115
certain level, where average returns start to diminish. Average total cost falls as Average product increases and Average total costs increase as Average product falls. Average variable cost curve (AVC): Average variable cost is the total variable cost per unit of output, that is, TVC . Q This curve is U shaped because of the law of diminishing average returns. AVC Average Cost ACα 1/AP 0 Q1 Output
Fig 26.2: To illustrate AVC Curve
AVC initially falls as Average product increases upto a certain output level (Q1) beyond which it increases. (As AVC increase Average product is falling)
Average fixed cost curve: Average fixed cost is the total fixed cost per unit of output and it is obtained by dividing the total fixed cost by the output, that is, AFC = TFC Q Average fixed cost has the shape of a rectangular hyperbola. It approaches both axes asymptotically as shown below:
Average cost AFC 0 Output (Q) Fig 26.3: To illustrate the AFC curve
Average fixed cost falls as output increases since increasing output means the total fixed cost (constant) borne by each output level diminishes.
Marginal cost curve:

Answers
STRATHMORE UNIVERSITY ● REVISION KIT
116
Marginal cost refers to the change in total cost as a result of a unit change in output. MC = ∆TC = dTC ∆Q dQ
The marginal cot curve is U-shaped because of the law of diminishing returns. Average MC Cost MC α 1 MP 0 Q3 Output (Q)
Fig 26.4: To illustrate the MC curve Initially, marginal cost falls with increase in output as marginal product increases but only upto a certain output level Q3 beyond which it starts to increase as marginal returns start diminishing.
MC AC ATC MC ●B AVC ●A AFC 0 X1 X2 Output
Fig 26.5: To illustrate the relationship between AC,AVC, MC and ATC curves
i) Relationship between AVC and ATC:
TC = TFC + TVC TC = ATC = TFC + TVC Q Q TC = ATC = TFC + TVC Q Q Q ATC = AFC + AVC
Average variable cost forms part of average total cost.

Revision Questions and Answers
ECONOMICS
117
Average variable cost curve reaches its minimum before the average total cost curve, that is, the minimum of the average total cost curve is to the right of the minimum of the average variable cost curve.
The two curves do not start to increase at the same output level. This is because the Average total cost also includes average fixed cost. When AVC reaches its minimum and starts to increase, this increase is more than offset by the full in average fixed cost (AFC falls continuously as output increases) so that Average total cost still falls. However, after OX2, the rise in Average variable cost more than offsets the fall in average fixed cost so that average total cost increases.
Between the output level of OX1 and OX2 the fall in Average fixed cost more than offsets the rise in average variable cost. However, beyond OX2 the rise in AVC is greater than the fall in AFC. ii) Relationship between MC and ATC:
The MC curve cuts the ATC curve from below at its minimum point. This relationship is summarized as follows:
• When the slope of ATC is less than zero, ATC will be greater than MC, that is, so long as ATC is falling, it will be greater than MC.
• When the slope of ATC is greater than zero, (ATC increasing) MC will be greater than ATC. • When the slope of the ATC curve is zero, MC will be equal to ATC. (Point B) iii) Relationship between MC and AVC:
The MC curve cuts the AVC curve from below at its minimum point. This relationship is summarized as follows:
• When the slope of AVC curve is less than zero (negative), AVC will be greater than MC, that is, so long as AVC is falling MC will be less than AVC.
• When the slope of AVC curve is greater than zero (positive), MC will be greater than AVC, so long as AVC is rising MC will be above it.
• When the slope of AVC curve is zero, MC will be equal to AVC (Point A). 3.6 NATIONAL INCOME
Question 27
Y = C + I + G where a > 0; 0 < b < 1 C = a + b(Y – T) d > 0; 0 < t < 1 T = d + tY T = Taxes I = IO I = Investment G = GO G = Government Expenditure
(a) (i) Economic interpretation of the parameters a, b, d and t:
a: autonomous consumption expenditure, that is, consumption that is independent of consumer’s income.
b: marginal propensity to consume (mpc) which refers to the amount of the consumer’s extra income devoted to consumption. It’s usually a fraction and less than 100%.
d: autonomous tax, that is, the amount that is independent of income paid as tax.
t: marginal propensity to tax, which refers to that portion of extra income paid as tax. It’s normally in form of a fraction and, again, less than 100%.
Answers
STRATHMORE UNIVERSITY ● REVISION KIT
118
(i) NB: The word ‘value’ in Mathematics refers to a number or quantity represented by a letter: find the
value of x. Clearly then, it is not possible to work out values for Y, C and T since the National Income Model (provided) is presented by way of letters but lacking in figures.
Therefore these equilibria can only be approached as follows: Y = C + I + G C = a + b(Y – T) T = d + tY Y = a + b(Y – T) + IO + GO C = a + b[Y – (d + tY)] T = d + t(a – bd + IO + GO) Y = a + b[Y - (d + tY)] + IO + GO = a + b(Y – d – tY) 1 – b(1 – t)
a + b(Y – d – tY) + IO + GO a + by – bd – btY Y = a + by – bd – btY +IO + GO a – bd + by – btY Y – bY + btY = a – bd + IO + GO a – bd + Y(b – bt) Y(1 – b + bt) = a – bd + IO + GO a – bd +(b – bt)Y Y = a – bd + IO + GO But Y = a – bd + IO + GO 1 – b + bt 1 – b(1 – t)
Y = a – bd + IO + GO C = a – bd +(b – bt) ( a – bd + IO + GO) 1 – b(1 – t) 1 – b ( 1 – t) (b) Three alternatives to the measurement/estimation of National Income:
• Income • Expenditure • Output/product/value added
Income Approach: taken from the perspective of factor incomes i.e. wages/salaries (labour), interest (capital) rent (land) and profit (enterpreneurship) excluding transfer payments. Adjustments would necessarily include the Net factor income from abroad and depreciation. Expenditure Approach: Looked at in terms of aggregate demand taking the form of the equation Y ≡ E = C + I + G + (x – m) Where c: consumption – expenditure on consumer goods. I: Capital formation / accumulation
G: Government expenditure – in terms of what it costs the government to provide goods and services. X: Exports – expenditure by foreigners on domestic goods sold abroad. M: Imports – expenditure on goods and services purchased from abroad.
Again adjustment would include the Net factor income from abroad and depreciation.
Output/value Added Approach: from the stand point of sectoral output (e.g mining, agriculture, fishing, forestry, manufacturing and even the service industry like banking, insurance etc) contribution summed up (put together)
• Also in terms of additional worth (value) to a product in a production process.
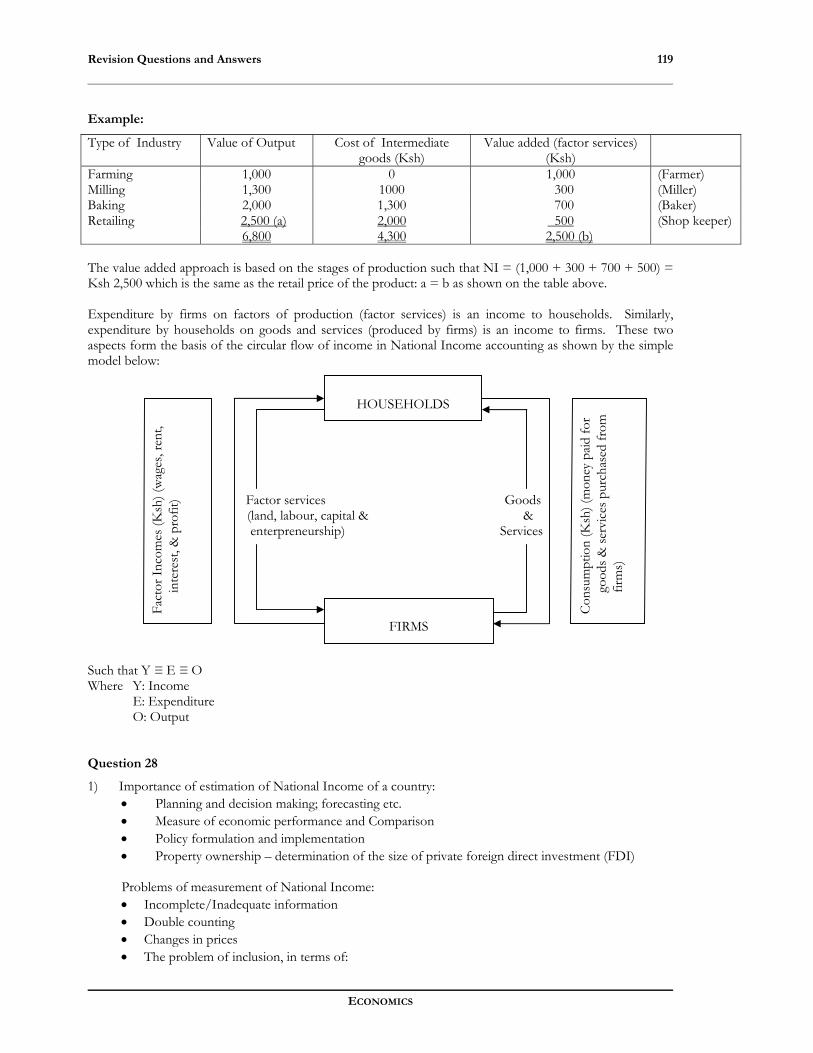
Revision Questions and Answers
ECONOMICS
119
Example:
Type of Industry Value of Output Cost of Intermediate goods (Ksh)
Value added (factor services) (Ksh)
Farming 1,000 0 1,000 (Farmer) Milling 1,300 1000 300 (Miller) Baking 2,000 1,300 700 (Baker) Retailing 2,500 (a) 2,000 500 (Shop keeper) 6,800 4,300 2,500 (b) The value added approach is based on the stages of production such that NI = (1,000 + 300 + 700 + 500) = Ksh 2,500 which is the same as the retail price of the product: a = b as shown on the table above. Expenditure by firms on factors of production (factor services) is an income to households. Similarly, expenditure by households on goods and services (produced by firms) is an income to firms. These two aspects form the basis of the circular flow of income in National Income accounting as shown by the simple model below: Factor services Goods (land, labour, capital & & enterpreneurship) Services Such that Y ≡ E ≡ O Where Y: Income E: Expenditure O: Output Question 28
1) Importance of estimation of National Income of a country: • Planning and decision making; forecasting etc. • Measure of economic performance and Comparison • Policy formulation and implementation • Property ownership – determination of the size of private foreign direct investment (FDI)
Problems of measurement of National Income: • Incomplete/Inadequate information • Double counting • Changes in prices • The problem of inclusion, in terms of:
HOUSEHOLDS
FIRMS
Fact
or In
com
es (K
sh) (
wag
es, r
ent,
inte
rest
, & p
rofit
)
Cons
umpt
ion
(Ksh
) (m
oney
paid
for
good
s & se
rvice
s pur
chas
ed fr
om
firm
s)

Answers
STRATHMORE UNIVERSITY ● REVISION KIT
120
- Subsistence output (income) - Intermediate goods - Housing i.e. rent on owner – occupiers - Public Services provided by the government - Foreign payments i.e. net income from abroad - Illegal activities eg. smuggled output - Revaluation of assets.
NB: Briefly explain each of these problems; 2) i) Computation of GDP using the Value added approach: Sector Total Output Intermediate Purchases Value Added Agriculture 30 10 (30 –10) = 20 Manufacturing 70 45 (70 – 45) = 25 Services 55 25 (55 – 25) = 30 Total Value Added: GDP (at factor cost) 75 billion
ii) NDP(MP) = GDP(FC) + Indirect taxes - Depreciation = (75 + 7 – 8) = (82 – 8) = 74 billion NDP(FC) = NDP( MP) – Indirect taxes = (74 – 7) = 67 billion c) The Multiplier: In his theory Keynes asserted that consumption is a function of income, and so it follows that a change
in investment, which we may call ∆I, meaning an increment in I will change Y by more than ∆I,. For while the initial increase in Y, ∆Y, will equal to ∆I, this change in Y will itself produce a change in C, which will increase Y still further. The final increase in income thus exceeds the initial increase in investment expenditure which is therefore magnified or “multiplied”. This process is called the multiplier process. The Operation of the “Multiplier” The Multiplier can be defined as the coefficient (or ratio) relating a change in GDP to the change in autonomous expenditure that brought it about. This is because the Multiplier can be defined as the coefficient (or ratio) relating a change in GDP to the change in autonomous expenditure that brought it about. This is because a change in expenditure, whatever its source, will cause a change in national income that is greater than the initial change in expenditure. For example, suppose there is an autonomous increase in investment which comes about as a result of decisions by businessmen in the construction industry to increase in investment which comes about as a result of decisions by businessmen in the construction industry to increase the rate of house building by, say, 100 houses each costing ₤1,000 to build, investment will increase by ₤100,000. Now this will be paid out as income to workers of all kinds in the building industry, to workers in industries which supply materials to the building industry and others who contribute labour or capital or enterprise to the building of the houses; these people will turn wish to spend these incomes on a wide range consumer goods and so on. There will thus be a series of further rounds of expenditure, or Secondary Spending in addition to the initial primary spending which constitutes further increase in GDP.

Revision Questions and Answers
ECONOMICS
121
This is because those people whose incomes are increase by the primary increase in autonomous expenditure will, through propensity to consume spend part of their increase in their incomes. Put differently therefore an increase in autonomous expenditure creates a multiplied effect on the GDP through the Expenditure – Income – Expenditure cycle.
How and where does the Multiplier Stop The multiplier concept can erroneously give the impression that an initial increase in autonomous spending would lead to an indefinite increase in GDP. This does not happen because each secondary round of increased expenditure gets progressively smaller, which is explained by the fact that the Marginal Propensity to spend the national income is less than one. This is the ratio which scales down each successive round of expenditure and causes the GDP to converge to a new equilibrium level. Suppose in our example, an average of three fifths of any increase in income is spent by the people receiving it: The Marginal Propensity to consumer or save will be 3/5 and 2/5 respectively. Since ∆I, = 100,000, the increase in Y converge at the level 250,000. This is because for any value z between 0 and 1, the series
1 + z + z2 + z3 + ………..
tends to the value 1 In our example we have the series (in thousands)
1-Z. 100 + 60 + 36 + 21.6 + …… OR 100 { 1 + (3/5) + (3/5) + (3/5) + ……} which thus equals: 100 = 1 = 100 1_ = 250 1 – 3 2 5 5 This result can be generalized , using our notation, as ∆I ● 1___ = ∆I ● 1_ = ∆Y 1 - ∆C ∆S ∆Y ∆Y
Dividing by ∆I we obtain ∆Y = 1 = 1
∆I 1 - ∆C ∆S ∆Y ∆Y
The ratio, ∆Y of the total increase in income to the increase in investment which produce it ∆I is known as the MULTIPLIER k. If we write c for ∆C and s for ∆S we have ∆Y ∆Y
k = ∆Y = 1 = 1 ∆I 1 – c s The multiplier is thus the reciprocal of the MPS (Marginal Propensity to Save).

Answers
STRATHMORE UNIVERSITY ● REVISION KIT
122
Relevance Of Multiplier
The Keynesian Model of the Multiplier however is a Short Run Model which puts more emphasis on consumption than on savings. It is not a long run model of growth since savings are the source of investment funds for growth. It is appropriate for mature capitalist economies where there is excess capacity and idle resources, and it is aimed at solving the unemployment problem under those conditions – (i.e. problem of demand deficiency with the level of investment too low, because of lack of business confidence, to absorb the high level of savings at full employment incomes.
It is not a suitable model for a developing economy because: 1. In less developed economies exports rather than investment are the key injections of autonomous
spending. 2. The size of the export multiplier itself will be affected by the economies dependence on two or three
export commodities. 3. In poor but open economies the savings leakage is likely to be very much smaller , and the import leakage
much greater than in developed countries. 4. The difference, and a fundamental one, in less developed countries is in the impact of the multiplier on
real output, employment and prices as a result of inelastic supply. The Accelerator:
Suppose that there is a given ratio between the of output Yt at any time t, and the capital stock required to produce it Kt and that this ratio is equal to α hence: Kt = α Yt The coefficient α is the capital – output ratio, α = K/Y and is called the accelerator co-efficient. If there is an autonomous increase in investment, ∆I this through the multiplier process will lead to increased employment resulting in overall increase in income, ∆Y. This may lad to further investment called induced investment in the production of goods and services. This process is called acceleration. The ratio of induced investment to the increase in income resulting from an initial autonomous increase in investment is called the accelerator. Thus if the induced investment is denoted by ∆I1, and the accelerator by β, then: ∆I1 = β, ∆I1 = β∆Y ∆Y Thus another way of looking at the accelerator is as the factor by which the increase income resulting from an initial autonomous increase in investment is multiplied by to get the induced investment. From the Keynesian model ∆Y = ∆I • 1/S, we can write ∆I1 = β ∆I • 1/S Thus, the higher the multiplier and the higher the accelerator, the high will be the level of induced investment from an initial autonomous increase.

Revision Questions and Answers
ECONOMICS
123
3.7 MONEY AND BANKING Question 29
a) Money is defined as anything that is legal and capable of effecting transactions. Functions of Money:
i) Medium of exchange: Money facilitates the exchange of goods and services in the economy.
Workers accept money for their wages because they know that money can be exchanged for all the different things they will need. Use of money as an intermediary in transactions therefore, removes the requirement for double coincidence of wants between transactions. Without money, the world’s complicated economic systems which is based on specialization and the division of labour, would be impossible. The use of money enables a person who receives payment for services in money to obtain in exchange for it, the assortment of goods and services from the particular amount of expenditure which will give maximum satisfaction.
ii) Unit of account: Money is a means by which the prices of goods and services are quoted and accounts kept. The use of money for accounting purposes makes possible the operation of the price system and automatically providing the basis of keeping accounts, calculating profit and loss, costing etc. It facilitates the evaluation of performance and forward planning. It also allows for the comparison of the relative values of goods and services even without an intention of actually spending (money) on them eg. “window shopping”.
iii) Store of Wealth/value: The use of money makes it possible to separate the act of sale from the act of purchase. Money is the most convenient way of keeping any form of property which is surplus to immediate use; thus in particular, money is a store of value of which all assets/property can be converted. By refraining from spending a portion of one’s current income for some time, it becomes possible to set up a larger sum of money to spend later (of course subject to the time value of money). Less durable or otherwise perishable goods tend to depreciate considerably over time and owners of such goods avoid loss by converting them into money.
iv) Standard of deferred payment: Many transactions involve future payment eg. hire purchase, mortgages long term construction works and bank credit facilities. Money thus provides the unit in which given stability in its value, loans are advanced/made and future contracts fixed. Borrowers never want money for its sake, but only for the command it gives over real resources. The use of money again allows a firm to borrow for the payment of wages, purchase of raw materials or generally to offset outstanding debt obligations; with money borrowing and lending becomes much more easier, convenient and satisfying. Its about making commerce and industry possible viable. Only money, of all possible assets, can be converted into other goods immediately and without cost.
b) Liquidity preference as applied to an individual refers to the desire to hold one’s assets as money
rather than as income-earning assets. Liquidity preference therefore involves a loss of the income it might otherwise have earned. There are two schools of thought to explain liquidity preference, namely the Keynesian Theory and Monetarist Theory. According to Lord John Maynard Keynes, there are three motives of holding money:
The Transaction Motive
A certain amount of money is needed for everyday requirements, the purchase of food and clothing and other ordinary expenses. How much is necessary to hold for these purposes will depend on 3 factors.
• A person’s income • The interval between one pay-day and the next • Habit
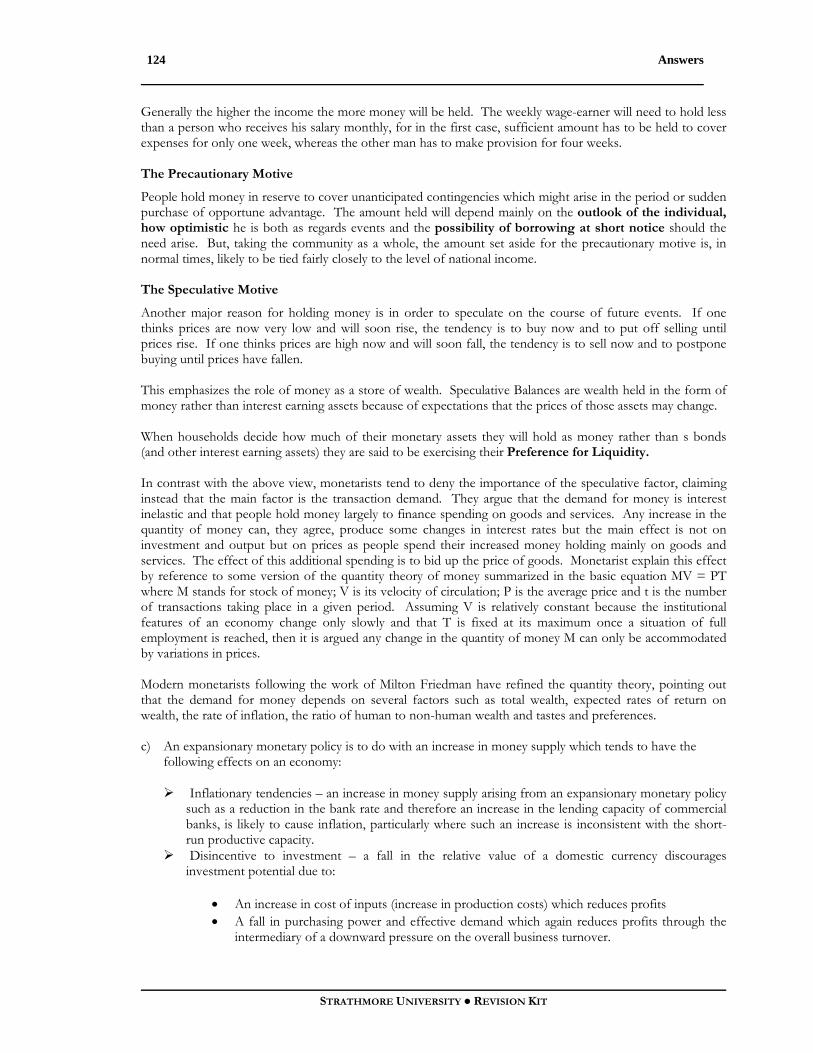
Answers
STRATHMORE UNIVERSITY ● REVISION KIT
124
Generally the higher the income the more money will be held. The weekly wage-earner will need to hold less than a person who receives his salary monthly, for in the first case, sufficient amount has to be held to cover expenses for only one week, whereas the other man has to make provision for four weeks.
The Precautionary Motive
People hold money in reserve to cover unanticipated contingencies which might arise in the period or sudden purchase of opportune advantage. The amount held will depend mainly on the outlook of the individual, how optimistic he is both as regards events and the possibility of borrowing at short notice should the need arise. But, taking the community as a whole, the amount set aside for the precautionary motive is, in normal times, likely to be tied fairly closely to the level of national income.
The Speculative Motive
Another major reason for holding money is in order to speculate on the course of future events. If one thinks prices are now very low and will soon rise, the tendency is to buy now and to put off selling until prices rise. If one thinks prices are high now and will soon fall, the tendency is to sell now and to postpone buying until prices have fallen.
This emphasizes the role of money as a store of wealth. Speculative Balances are wealth held in the form of money rather than interest earning assets because of expectations that the prices of those assets may change.
When households decide how much of their monetary assets they will hold as money rather than s bonds (and other interest earning assets) they are said to be exercising their Preference for Liquidity.
In contrast with the above view, monetarists tend to deny the importance of the speculative factor, claiming instead that the main factor is the transaction demand. They argue that the demand for money is interest inelastic and that people hold money largely to finance spending on goods and services. Any increase in the quantity of money can, they agree, produce some changes in interest rates but the main effect is not on investment and output but on prices as people spend their increased money holding mainly on goods and services. The effect of this additional spending is to bid up the price of goods. Monetarist explain this effect by reference to some version of the quantity theory of money summarized in the basic equation MV = PT where M stands for stock of money; V is its velocity of circulation; P is the average price and t is the number of transactions taking place in a given period. Assuming V is relatively constant because the institutional features of an economy change only slowly and that T is fixed at its maximum once a situation of full employment is reached, then it is argued any change in the quantity of money M can only be accommodated by variations in prices.
Modern monetarists following the work of Milton Friedman have refined the quantity theory, pointing out that the demand for money depends on several factors such as total wealth, expected rates of return on wealth, the rate of inflation, the ratio of human to non-human wealth and tastes and preferences. c) An expansionary monetary policy is to do with an increase in money supply which tends to have the
following effects on an economy:
Inflationary tendencies – an increase in money supply arising from an expansionary monetary policy such as a reduction in the bank rate and therefore an increase in the lending capacity of commercial banks, is likely to cause inflation, particularly where such an increase is inconsistent with the short-run productive capacity.
Disincentive to investment – a fall in the relative value of a domestic currency discourages investment potential due to:
• An increase in cost of inputs (increase in production costs) which reduces profits • A fall in purchasing power and effective demand which again reduces profits through the
intermediary of a downward pressure on the overall business turnover.
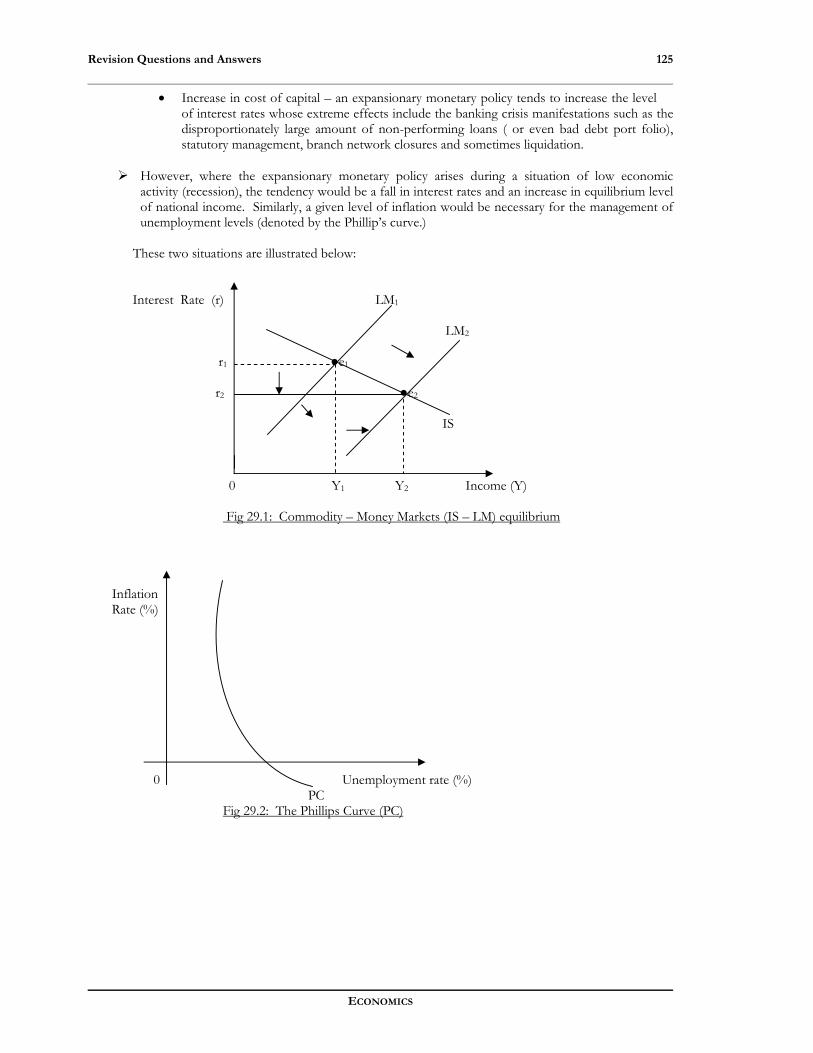
Revision Questions and Answers
ECONOMICS
125
• Increase in cost of capital – an expansionary monetary policy tends to increase the level of interest rates whose extreme effects include the banking crisis manifestations such as the disproportionately large amount of non-performing loans ( or even bad debt port folio), statutory management, branch network closures and sometimes liquidation.
However, where the expansionary monetary policy arises during a situation of low economic
activity (recession), the tendency would be a fall in interest rates and an increase in equilibrium level of national income. Similarly, a given level of inflation would be necessary for the management of unemployment levels (denoted by the Phillip’s curve.)
These two situations are illustrated below:
Interest Rate (r) LM1 LM2
r1 ●e1
r2 ●e2 IS
0 Y1 Y2 Income (Y)
Fig 29.1: Commodity – Money Markets (IS – LM) equilibrium
Inflation Rate (%) 0 Unemployment rate (%) PC
Fig 29.2: The Phillips Curve (PC)
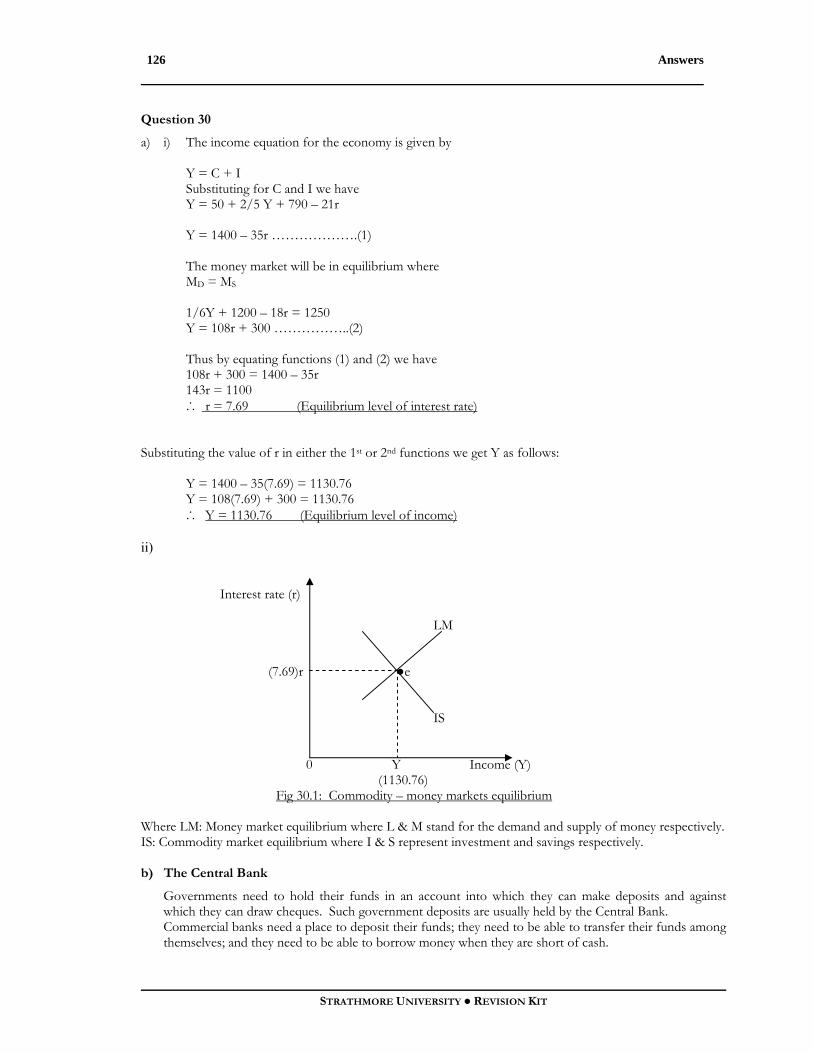
Answers
STRATHMORE UNIVERSITY ● REVISION KIT
126
Question 30
a) i) The income equation for the economy is given by Y = C + I Substituting for C and I we have Y = 50 + 2/5 Y + 790 – 21r Y = 1400 – 35r ……………….(1)
The money market will be in equilibrium where MD = MS
1/6Y + 1200 – 18r = 1250 Y = 108r + 300 ……………..(2)
Thus by equating functions (1) and (2) we have 108r + 300 = 1400 – 35r 143r = 1100 ∴ r = 7.69 (Equilibrium level of interest rate)
Substituting the value of r in either the 1st or 2nd functions we get Y as follows:
Y = 1400 – 35(7.69) = 1130.76 Y = 108(7.69) + 300 = 1130.76 ∴ Y = 1130.76 (Equilibrium level of income)
ii)
Interest rate (r) LM (7.69)r ●e IS 0 Y Income (Y) (1130.76)
Fig 30.1: Commodity – money markets equilibrium Where LM: Money market equilibrium where L & M stand for the demand and supply of money respectively. IS: Commodity market equilibrium where I & S represent investment and savings respectively. b) The Central Bank
Governments need to hold their funds in an account into which they can make deposits and against which they can draw cheques. Such government deposits are usually held by the Central Bank. Commercial banks need a place to deposit their funds; they need to be able to transfer their funds among themselves; and they need to be able to borrow money when they are short of cash.
Revision Questions and Answers
ECONOMICS
127
The Central Bank accepts deposits from the commercial banks and will on order transfer these deposits among the commercial banks. Consider any two banks A and B. On any given day, there will be cheques drawn on A for B and on B for A. If the person paying and the person being paid bank with same bank, there will be a transfer for money form the account or deposit of the payee. If the two people do not bank with the same, such cheques end up in the central bank. In such cases, they cancel each other out. But if there is an outstanding balance, say in favour of A then A’s deposit with the central bank will go up and B’s deposit will go down. Thus the central bank acts as the Clearing House of commercial banks.
In most countries the central bank has the sole power to issue and control notes and coins. This is a function it took over from the commercial banks for effective control and to ensure maintenance of confidence in the banking system. Commercial banks often have sudden needs for cash and one way of getting it is to borrow from the central bank. If all other sources failed, the central bank would lend money to commercial banks with good investments but in temporary need of cash. To discourage banks over-lending, the central bank will normally lend to the commercial banks at high rate of interest which the commercial bank passes on to the borrowers at an even higher rate. For this reason, commercial banks borrow from the central bank as the lender of the last resort.
The Central Bank acts as the Government’s representative in international financial negotiations eg. with international organizations like the World Bank, the International Monetary Fund, The Donor Consultative Meeting, The Paris Club etc. It is responsible for the sale of Government Securities or Treasury Bills, the payment of interests on them and their redeeming when they mature. The central bank is also responsible for the implementation of monetary policies.Monetary policy is the regulation of the economy through the control of the quantity of money available and through the price of money i.e. the rate of interest borrowers will have to pay. Expanding the quantity of money and lowering the rate of interest should stimulate spending in the economy and is thus expansionary, or inflationary. Conversely, restricting the quantity of money and raising the rate of interest should have a restraining, or deflationary effect upon the economy
Question 31
a) Commercial banks ‘create’ credit through a process known as credit creation. Credit creation is defined as a process by which commercial banks advance loans from deposits net of a statutory cash ratio requirement. This involves lending out money (from deposits) at an interest. This is because banks know from experience that only a fraction of its deposits will be demanded in cash at any particular time. Thus, the ability of banks to create deposit money depends on the fact that bank deposits need to be only fractionally backed by notes and coins.
Because banks do not need to keep 100 percent reserves, they can use some of the money deposited to purchase income-yielding investments. The multiple expansion of credit arises from the re-deposit (created deposit) of money which has been borrowed. Nevertheless, banks cannot distinguish between their initial deposits and created deposits.
Assuming a 10 percent cash ratio, banks are then able to repeat the process of lending out nine-tenths and retaining one-tenths.
In a more realistic situation, what is usually found is where the bank receiving the new deposit is one of several independent banks. Thus, the bank will not seek immediate expansion of deposits to the number of times the cash ratio by extending loans. To be taken into account is the fact that borrowers will use the money (credit) advanced to them to pay for goods and services or repay debts; they will therefore be writing cheques out to other individuals who may have accounts in other banks. The bank can thus

Answers
STRATHMORE UNIVERSITY ● REVISION KIT
128
expect to lose cash to other banks. Either the borrowers will withdraw cash directly, with which to pay individuals who then deposit this cash with other banks, or if they pay by cheque these cheques will be deposited with other banks, and the other banks themselves present them for cash at the first bank.
The amount of credit that banks can make is largely subject to the variable reserve requirement (cash and liquidity ratios) which shows the relationship between the cash/reserve assets retained against total liabilities. This can be expressed in the formula:
D = 1 C r
Where D is the amount of bank deposits, r is the cash ratio, C is the cash held by banks and 1/r is the bank/credit creation multiplier. Taking an arbitrary cash ratio of 10 percent and an initial deposit of Ksh. 10,000 the amount of bank deposit is given by:
D = 1/0.1 (10,000) = Kshs. 100,000
The effect of any additional deposit of cash into the system upon the level of deposits can be given by the formula:
∆D = 1∆C r
where ∆D is the effect upon total deposits as the result of a change in cash deposits, ∆C.
Example:
TCC = C – C r Where C: Initial cash deposit r: Cash ratio D: Total Deposit Tcc: Total credit created At D = 10,000 r = 10% Tcc = (10,000) – 10,000 10% ∴ Tcc = 90,000 D = C = (10,000) = 100,000 r 0.1
Therefore out of the initial deposit of 10,000 the bank can create credit to a maximum of 90,000. The process stops where the total deposit (arising from the multiplicity of the initial deposit) is equal to the sum of the total loan and total cash maintained by the bank in accordance with the cash ratio requirement.

Revision Questions and Answers
ECONOMICS
129
Deposit Cash Ratio
(10%) Loan (90%)
(Sh) (Sh.) (Sh.) 10,000 1,000 9,000 9,000 900 8,100 8,100 810 7,290
- - - - - -
-___ -__ -__ 100,000 10,000 90,000
Some other limitations to credit creation may be by way of: • The availability (supply) of collateral security – bank credit is largely in form of secured loan that is, banks
have to take something in return, such as title deeds, an insurance policy or bill of exchange, as a security in case the loan is not repaid. The availability of such assets large influence (through the intermediary of demand) the ability of banks to make loans.
• Monetary authority’s (central bank’s) intervention through such other requirements as the deposit protection fund (DPF) and the sale of treasury bills (TBS) at high interest return. Speculators in the stock market will then invest more in such securities than they save, thereby constraining the ability of commercial banks to make more credit.
• Nature of political and economic atmosphere and thus the level of savings – in case of insecurity and exchange rate instability, for instance, the tendency is for people to withdraw large amounts of money and banking it elsewhere, most likely in foreign accounts; potential savers will again be discouraged by the impact of inflation. This situation is an example of an election period such as Kenya’s (1197) where there are frequent calls for comprehensive political and economic reforms.
• Inefficient credit management by commercial banks themselves - lending on grounds which are not purely on business terms may lead to large amounts of bad debts. This reduces the profitability and additional lending money. In fact (some) banks have been known to increase their base lending rates in order to compensate for he debts written off. The effect being a reduction in demand for credit which is again constraining on the credit creation process.
b) Liquidity trap:
Refers to the minimum rate of interest payable to persons to persuade them to part with money in terms of savings or investment i.e. interest being the payment for the loss of liquidity. It inversely relates the speculative demand for money to the interest rate (as a return). This concept is derived from the Keynesian Theory (monetary theory of interest) of speculative demand for money. It states that the rate of interest is determined by the supply of money (savings) and the desire to hold one’s wealth in money/cash (demand for money). It looks at money as a store of value (in itself), that is, money is held as an asset in preference to income- yielding assets such as a government bond. Lord John Maynard Keynes (1936) explains the speculative demand for money in terms of the buying and selling of government securities or treasury bills (TBS) on which the government pays a fixed rate of interest. Its assumed that the speculative demand for money is interest elastic such that the demand curve slopes downwards from left to right. At the liquidity trap point, the demand cure is perfectly elastic implying that any interest rate below the persuasive minimum interest rate represents an absolute preference for liquidity situation i.e. no spectacular will be willing to (part with money) invest in government securities.

Answers
STRATHMORE UNIVERSITY ● REVISION KIT
130
Interest rate r2
r1
Liquidity trap r0 L
0 L2 L1 L0 Liquidity preference
Fig 31.1: Liquidity trap
The demand for money is high when the interest rate is low and low when interest rate is high. At r2 its L2 and at r1 its L1 and vice versa. 3.8 LABOUR AND UNEMPLOYMENT Question 32
a) Unemployment generally refers to a state/situation where factors of production (resources) are readily available and capable of being utilized at the ruling market returns/rewards but they are either underemployed or completely unengaged. When referring to labour, unemployment is considered to be a situation where there are people ready, willing and able to work at the going market wage rate but they cannot get jobs. This definition focuses only on those who are involuntarily not employed.
b) 1. All countries suffer unemployment but most developing countries experience it at relatively higher
degree and the following can be some of the types and causes:
i) Transitional unemployment:- Transitional unemployment is that situation which prevails due to some temporary reasons. The main reasons for this type of unemployment are:
• Turnover unemployment: Some individuals leave their present jobs and make efforts to
secure better ones and in this way they remain unemployed for sometime. • Casual unemployment: Casual workers are employed for a specific job and when the job is
completed such workers become eventually unemployed eg. shipping and building construction workers.
• Seasonal unemployment: some industries for instance have seasonal demand and their products are manufactured for a specific period of time ( a specific period of the year). The workers of such industries remain unemployed for that time eg. ice factories may remain closed during winter.
ii) Structural Unemployment: caused by structural changes such that there exist:
• Cyclical unemployment: During depression, prices are too low and profit margins remain distinctively low. In this case, investment decreases and unemployment increases.
• Technological Unemployment (due to inappropriate technology): Technology is not inappropriate per se but in relation to the environment in which it is applied. In most developing countries, most of their (current) production structures tend to be labour

Revision Questions and Answers
ECONOMICS
131
saving (capital – Intensive), which is not appropriate since these countries experience high labour supply. Capital-labour ratios tend to be high implying that less labour is absorbed compared to capital in production ventures, thereby causing unemployment.
• Industrial change: the establishment (entry) of new industries decreases the demand for the products of existing industries eg. the rapid increase in the demand for Japanese industrial products is one reason for greater unemployment in some European countries.
• Keynesian Unemployment: According to Keynesian theory of income and employment, unemployment occurs due to lack of effective demand. If effective demand is less, production of goods and services will fall, which will further result in the unemployment of labour. Another feature of Keynesian unemployment is that unemployment of labour is associated with unemployed capital such as plant and machinery which tend to be idle during depression.
• Urban unemployment: Due to availability of more facilities in urban areas, more and more people tend to move to these areas. The employment opportunities available are not sufficient to absorb all those people settled in the urban areas. This kind of unemployment is therefore due to rural-urban migration.
• Disguised unemployment: a situation where some people are employed apparently, but the total production (output) would still remain the same even if such people are withdrawn from the present jobs. In most developing countries, this type of unemployment is estimated at 20 to 30% (especially in the public sector) and measures should be taken to employ such people in other sectors of the economy to enhance productivity.
iii) Insufficient capital: Shortage of capital is a hindrance to the establishment of more industries
and other productive investment and in this regard more employment opportunities are not created.
iv) Nature of education system: Education systems for most developing countries are white – collar
oriented yet the nature of productive capacities of their economies are not sufficiently supportive. Moreover, inadequate education and training facilities render most people unable to secure those job opportunities that require high skills and specialized training.
v) Rapidly increasing population: The population growth rate far exceeds the amount of job
opportunities that an economy can generate. Thus in summary, some of the causes of unemployment can be said to include: • Rapidly increasing population • Inappropriate technology • Insufficient capital base • Demand deficiency/structural changes • Presence of expatriates • Education systems – white – collar orientation • Rural-Urban migration • One person for more than one job • Corruption and general mismanagement • Inadequate knowledge on market opportunities.
2. The measures appropriate as remedies for unemployment will clearly depend on the type and cause
of the unemployment. Such measures take the form of demand side (demand management) and supply side policies aimed at increasing aggregate demand and the economy’s potential rate of output respectively.
Some of these measures include:

Answers
STRATHMORE UNIVERSITY ● REVISION KIT
132
• Decentralisation of industries: Industries should be encouraged to establish in different regions of a
country through enhanced provision of incentives such as tax relief, free room for expansion, security and improvement of the infrastructure. This helps reduce rural-urban migration and urban unemployment.
• Use of monetary and fiscal policies: The government can use fiscal and monetary policies (to influence activities) to create more employment opportunities by way of selective credit to those projects that have potential capacities to absorb more labour (supporting declining industries with public funds, cutting taxation etc)
• Population growth control through family planning education programmes: This will then become a long-term remedial measure to the problem of unemployment.
• Provision of more education and training facilities including retraining schemes to keep workers who want to acquire new skills to improve their mobility.
• Changing the attitude towards work i.e. eliminating the white-collar mentality and creating positive attitudes towards the mainstay (economic) activities such as agriculture and other technical vocational jobs.
• Moving towards greater investment in research and development …greater use of natural resources. • Increasing information dissemination on labour market opportunities – Kenya has made some
progress in this regard by making it known through the print media the existence of off-shore employment opportunities (done by the Directorate of Personnel Management (DPM)
• Assistance with family relocation to reduce structural unemployment. This is done by giving recreational facilities, schools and improving the quality of life in general in other parts of the country, and even the provision of financial assistance to cover the cost of movement and home purchase.
• Special employment assistance for teenagers many of whom leave school without having studies work-related subjects and with little or no work experience.
3.9 PUBLIC FINANCE Question 33 a) The budget is a summary statement indicating the estimated amount of revenue that the government
requires and hopes to raise. It also indicates the various sources from which the revenue will be raised and the projects on which the government intends to spend the revenue in a particular financial year. The budget in Kenya is presented to parliament by the Minister for Finance around mid June. In the budget, the Minister reviews government revenue and expenditure in the previous financial year. The minister presents tax proposals i.e. how he intends to raise the proposed revenue from taxation for parliament to approve.
The budget fulfills three main functions:
• To raise revenue to meet government expenditure
The government of a country provides certain services such as administration, defence, law and order environmental services and economic services. Also it must meet charges on the public debt. Sufficient revenue must be raised to pay for this
• It is a means of redistributing wealth
In many countries a situation has arisen where a small proportion of the population own a more than proportionate share of the nations wealth, while the majority of the population own only a small proportion of it. One method of redressing such inequalities of wealth is through a progressive system of taxation on income and capital. A progressive system is one whereby the wealthy people do not only pay more tax than the poor, but also pay a greater proportion of their income or wealth.
Revision Questions and Answers
ECONOMICS
133
• To control the level of economic activity
The government uses the budget to implement fiscal policy, i.e. the regulation of the economy through governments spending and taxes.
b) A budget takes any of the following forms:
1. Deficit budget If the proposed expenditure is greater than the planned revenue from taxation and miscellaneous receipts, this is a budget deficit. The excess of expenditure over revenue will be met through borrowing both internally through the sale of Treasury Bills and externally from other organizations.
2. Balanced budget
If the proposed expenditure is equal to the planned revenue from taxation and other miscellaneous receipts this is a balanced budget. Usually, balanced budgets are not presented for unless the expenditure is very limited it would mean the government would have to over-tax the population which can create disincentives. It is to avoid this that the tax revenue is supplemented by borrowing.
3. Surplus budgets
If the proposed expenditure is less than the planned revenue from taxation and other miscellaneous receipts, this is a surplus budget. Usually, surplus budgets are not presented for they are deflationary and can create unemployment as the government takes out of the economy more than its put back.
c) i) Taxation is the process of imposing compulsory contribution on the private sector to meet the
expenses which are incurred for a common good, that is, transfer payment process from the private sector (including the public) to the government with a view to financing public expenditure (such as provision of public and merit goods).
ii) The functions of taxation can be discussed from the activities of the government and what it is meant to achieve. These are:
a) Raise revenue
The revenue is required to pay for the goods and services which the government provides. These goods are of two types – public and merit goods. Public goods, such as defence and police are consumed collectively and no one can be prevented from enjoying them if he wishes to do so. These goods have to be provided by governments. Merit goods such as education and medical care, could be and often are provided privately but not necessarily in the amounts considered socially desirable and hence governments may subsidize the production of certain goods. This may be done for a variety of reasons but mainly because the market may not reflect the real costs and benefits of the production of a good. Thus public transport may be subsidized because the market does not take account of all the costs and benefits of the public transport system.
b) Economic stability
These are imposed to maintain economic stability in the country. During inflation, the government imposes more taxes in order to discourage the unnecessary expenditure of the individuals. During deflation, taxes are reduced in order to enable the individuals to spend more money. In this way the increase or decrease in taxes helps to check the big fluctuations in the prices and maintain economic stability.
c) Fair redistribution of income
A major function of taxation is to bring about some redistribution of income. First, tax revenue provides the lower income groups with benefits in cash and king. Second, the higher income groups, through a system of progressive taxation, pay a higher proportion of their income in tax than do the less well –off members of society.

Answers
STRATHMORE UNIVERSITY ● REVISION KIT
134
d) Pay interest on National debt
Taxes are also levied by the government to pay interest on national debt. e) Optimum allocation of resources
Taxes are also imposed to allocate resources of the country for optimum use of these resources. The amounts collected by the Government from taxes are spent on more productive projects. It means the resources are allocated to achieve the maximum possible output in the given circumstances.
f) Protection policy
Taxes are also imposed to give protection to those commodities which are produced in the country. The government thus imposes heavy taxes, the individuals are induced to buy local products.
g) Social welfare
The government imposes taxes on the production of those commodities which are harmful to human health e.g. excise duty on wines, cigarettes etc.
NB: When taxes are imposed certain conditions must be fulfilled. These conditions are known as
Principles or canons of taxation. According to Adam Smith who first studied the principles of taxation these are equity, certainty, economy, and convenience.
Question 34
a) A national budget is a quantitative financial statement outlining ways in which governments plan to raise revenue and to spend it. Such a budget may be surplus, balanced or deficit in nature. Whenever expenditure exceeds revenue, a financing deficit may then be operated deliberately.
b) Government expenditure refers to government outlays, in terms of recurrent and development expenditure in a given financial year. If resources are less than expenditure requirements the external and internal borrowing may be relied upon to supplement available resource. Whenever long term borrowings only partially cover the excess of state spending over current revenues, a deficit remains to be financed by other means such as short term borrowing from the Central Bank and commercial banks. It is this borrowing from the domestic banking systems which is known as deficit financing. Such borrowings are then used to balance the budget. Deficit financing is residual items representing the part of current and capital spending which can not be met by current receipts and long term borrowing. Accurate control of such financing is difficult as it requires accurate predictions of revenues and expenditure which is difficult to do. As an example revenues depend on taxation of imports and exports among other things. Given the volatility of the world markets, it is difficult to forecast reliably export and import revenues. Unpredictability in export proceeds transmit instability/unpredictability to the ability to import thus making it difficult to estimate receipts from import duties. Quite often, there is systematic bias in budget estimates – under estimating current spending and over estimating receipts thereby underestimating the financing gap. For this reason many government run financing deficits with total spending exceeding the value of current and long term borrowing from abroad. Borrowing from abroad is mostly non inflationary as foreign exchange brings command over a large supply of imported goods and services. The same applies to long term borrowing from local residents as it is matched by reductions in the purchasing power of general public. Short term borrowing from the Central bank and commercial banks has expansionary effects on money supply and total demand. Deficit financing tends to increase the supply of money by the amount of the deficit. It also leads to secondary increases in money supply by increasing the case base of the banking system and its ability to lend to the private sector. In view of the above, if the volume of deficit financing can spark off inflation, budget proposals should cut down on short term borrowing from the banking system. This calls for reducing recurrent and development expenditure (in a way not to disorganize government activities and compromise future growth and availability of commodities).
Revision Questions and Answers
ECONOMICS
135
Deficit financing can also be limited through increasing income tax (which may discourage voluntary saving and affect long term investment and growth). Indirect taxes can be used but they may raise prices and worsen inflation. In conclusion, the economy can be supported by deficit financing to the extent that the expansionary effect of money supply is not necessarily inflationary.
c) Fiscal policy refers to the manipulation of government revenue and expenditure to achieve policy
objectives associated with:
• Moderating resources allocation and adjusting price mechanisms in favour of the satisfaction of public wants by encouraging socially optimal investments as well as increasing rate of investment;
• Redistributing wealth and income; • Guiding the national economy in terms of growth and stability; • Increasing employment opportunities; • Counteracting inflation; and • Improving the balance of payments.
The usefulness of fiscal policy is often limited by: • Structural constraints in the economies; and • Observed conflicts of objectives between long term growth and short term stability; social welfare
and economic growth; income distribution and growth and personal freedom and social control.
Basically, fiscal policy can be applied in many ways to influence the economy. For example the government can increase its own expenditure which it can finance by raising taxes, by borrowing from non bank members of the public and/or borrowing from the Central and Commercial banks. Borrowing from the non bank members of the public often raises interest rates and reduces availability of credit to the private sector forcing a reduction in the sectors of consumption and investment expenditures. Borrowing from the Central Bank increases money supply and may give rise to inflation and balance of payments problems.
Taxes can be used to change the effective demand in the economy and to affect consumption of certain commodities.
Difficulties in using fiscal policy There are several problems involved in implementing fiscal policy. They include:
• Theoretical problems • Monetarists and the Keynesians do not seem to agree on the efficacy of fiscal policy. Monetarists
claim that budge deficits (or surpluses) will have little or no effect upon real national income while having adverse effects upon the rate of interest and upon prices.
The Net Effects Of The Budget
• Unlike simple Keynesian view that various types of budgets have different effects, the empirical evidence is that the net effects of taxes and government expenditure are influenced by the marginal propensities to consume of those being taxed and governments expenditure.
The Inflexibility Of Government Finances Much of the government’s finances is inflexible. One of the reasons for this is that the major portion of almost any departments budget is wages and salaries, and it is not possible to play around with these to suit the short-run needs of the government.
Answers
STRATHMORE UNIVERSITY ● REVISION KIT
136
Question 35
a) Inflation may be defined as a persistent rise in the general level of prices or alternatively as a fall in the value of money over a given period of time. Any increase in the quantity of money, however small, can be regarded as inflationary.
Inflation can also be regarded as a situation where the volume of purchasing power is persistently running
ahead of the output of goods and services, so that there is a continuous tendency for prices (both of commodities and factors of production) to rise because the supply of goods and services and factors of production fails to keep pace with demand for them (persistent/creeping inflation).
Inflation can also mean runaway or hyper-inflation or galloping inflation where a persistent inflation gets out of control and the value of money declines rapidly to a tiny fraction of its former value eventually to almost nothing, so that a new currency has to be adopted.
Because of its impact on the general economic performance, inflation is indeed one of the most unstable macro-economic variables that has drawn extensive concern in many economies, especially in the developing world.
d) Inflation is caused by factors arising from different situations. However, there are basically three types
of inflation:
• Cost-push • Demand-pull • Monetary.
Cost-push inflation occurs from the supply side of an economy when the increasing costs of production push up the general level o prices. It’s largely as a result of the following:- Wage costs arising from institutional intervention: Powerful trade unions, for instance will bargain for higher wages without corresponding increases in productivity. Since wages constitute production costs, employers will usually pass the increased wage cost on to the consumer in terms of higher prices. Structural rigidity: Slow mobility of resources between the various sectors of an economy has an effect of increasing prices. This is an example of most developing countries especially those which are predominantly agricultural, since such sectors are subject to natural and other factors which cause shortages and hoarding, hence frequent price increase. Import goods at relatively inflated prices: Import prices could also be high depending on the import duty imposed on imported goods. Capital goods, in this case, increase the cost of production and thus the final product prices. Exchange rates: The determination of exchange rates at any given time depends on whether or not an economy has been liberalized. Any time a currency depreciates or otherwise devalued, domestic prices of goods and services tend to increase.
Mark-up pricing decisions: Many large firms set their prices on a unit cost plus profit basis. This makes prices more sensitive to supply than demand influence and may tend to increase with rising costs, whatever the state of the economy.
Uncertainty and expectation/speculation: In the event of uncertainty and general expectation of prices to rise, demand increases and the overall effect is inflation. This is exactly an example of a financial market (eg. foreign exchange market) instability such as Kenya’s (1997). Demand-pull inflation is the excess of aggregate demand over the value of output (measured in constant prices) at full employment will create excess demand in many individual markets, and prices will be bid upward. The rise in demand for goods and services will cause a rise in demand for factors and their prices will increase as well. Thus, inflation in the prices of both consumer goods and factors of production is caused by a rise in aggregate demand.

Revision Questions and Answers
ECONOMICS
137
General shortage of goods and services: Whenever there is supply deficiency of goods and services in times of say, disasters like earthquakes, floods, wars or draught, the general level of prices will rise because of excess demand over supply.
Government spending: This certainly arises as a result of government action. Governments may finance spending through budget deficits; either resorting to print money with which to pay bills or what amounts to the same thing, borrowing from the Central bank for this purpose. Many economists believe especially so due to fiscal indiscipline of most governments.
Monetary type of inflation stems from the policy orientation/frameworks of the monetary authority (central bank) which may be in form of sale of treasury bills (TB’s) at relatively high interest rates (return) and thus creating a tendency for commercial banks to increase their base lending rates; the overall effect is an upward pressure on the general level of prices. This argument is a close relative of the quantity theory of money which states that a disproportionately large increase in money supply cause the general level of prices to rise faster.
c) Inflation has different effects on different economic activities on both micro and macro levels. Some of
these problems are considered below:
a. During inflation money loses value. This implies that in the lending-borrowing prices, lenders will be losing and borrowers will be gaining at least to the extent of the time value of money. Cost of capital/credit will increase and the demand for funds is discouraged in the economy, limiting the availability of investible funds. Moreover the limited funds available will be invested in physical facilities which appreciate in value over time. Its also possible the diversion of investment portfolio into speculative activities away from directly productive ventures.
b. Other things constant, during inflation more disposable incomes will be allocated to consumption since prices will be high and real income very low. In this way, marginal propensity to save will decline culminating in inadequate saved funds. This hinders the process of capital formation and thus the economic prosperity to the country.
c. The effects of inflation on economic growth have got inconclusive evidence. Some scholars and researchers have contended that inflation leads to an expansion in economic growth while others associate inflation to economic stagnation. However, if commodity prices rise faster and earlier than will a have positive impact on economic growth. Such kind of inflation if mild, will act as an incentive to producers to expand output and if the reverse happened, there will be a fall in production resulting into stagflation i.e. a situation where there is inflation and stagnation in production activities.
d. There is always a trade-off between inflation rate and employment rate. Policy makers may undertake an inflationary measure t solve unemployment. Creating more job opportunities raises peoples’ income and their purchasing power which may eventually cause inflationary tendencies in the economy. However, if inflation reduces the level of aggregate demand to the effect of excess production capacities, unemployment will no doubt occur.
e. When inflation imply that domestic commodity prices are higher than the world market prices, a country’s exports fall while the import bill expands. This is basically due to the increased domestic demand for imports much more than the foreign demand for domestic produced goods (exports). The effect is a deficit in international trade account causing balance of payment problems for the country that suffers inflation.
f. During inflation, income distribution in a country worsens. The low income strata get more affected especially where the basic lie sustaining commodities’ prices rise persistently. In fact such persistence accelerates the loss of purchasing power and the vicious cycle of poverty.
NB: Both fiscal and monetary policies are used to control inflation. (check)

Answers
STRATHMORE UNIVERSITY ● REVISION KIT
138
3.10 INTERNATIONAL TRADE AND FINANCE Question 36
a) International trade is the exchange of goods and services between countries (i.e. between one country and another). This form of trade is either in goods, termed visibles or services termed invisibles eg. trade in services such as tourism, shipping and insurance.
• International trade is with a view to: • Acquisition of what cannot be produced eg. raw materials (imports) • Foreign exchange from exports • Industrialization – mobilization of domestic resources for industrial development • Transfer of expertise • Competitive business environment which increases the scope of concern on quality and relatively
stable commodity prices. • Attracting foreign direct investment (FDI) – establishment of international trade ventures and
opportunities broadens the base for employment required to increase effective demand necessary for economic growth and development.
b) For a country to become richer or less poorer, it must increase it production of goods and services
by putting to good use its available productive resources. Efficiency in resource use is achieved through specialization. Under specialization an individual an enterprise (farm or factory) or a country tends to work at the occupation for which it is most suitable in terms of training skill, resources, character etc. Through specialization incomes are maximized which can be exchanged for goods and services produced by other specialists. Specialization then leads to the need for a market in which goods and services can be exchanged. The opposite of specialization is autarky or self sufficiency which are obviously inefficient. Within the sphere of international trade, it is advantageous for any two or more trading countries in each to produce and supply products which it can produce efficiently and to supply each other through trade. Even if a country has absolute advantage in the production of all its commodities the principle of specialization requires that it concentrate on the product in which its relative superiority in greatest while the other countries concentrate on the product in which their relative inferiority is least. As a result, there will always be an incentive for specialization and trade between countries and even the least efficient producer can gain from trade.
The problems in pursuing comparative advantage are as follows:
• This doctrine is valid in the case of a classical competitive market characterized by a large number of
informed buyers and sellers and homogenous products in each market, with world market places serving as efficiency determinants for global allocation of resources to their most suitable uses. Unfortunately, world markets and their prices are largely inefficient showing influences of trade barriers, discrimination and market distortions.
• Individual countries systematically aim at maximizing their potential gains from trade rather than with optimizing the allocation of world resources.
• By pursuing gains from trade in the short run young nations may jeopardize long term development prospects because:
i) It is important to protect infant industries to acquire new skills, technology and home markets which
are necessary in the early years of industrial development; ii) Concentrating on short term comparative advantage may lead to internalizing wrong externalities eg.
promoting use of illiterate peasants and primary sector production;

Revision Questions and Answers
ECONOMICS
139
c) The balance of Payments of a country is a record of all financial transactions between residents of that country and residents of foreign countries. (Residents’ in this sense does not just refer to individuals but would also include companies, corporations and the government). Thus all transactions are recorded whether they derive from trade in goods and services or transfer of capital.
Like all balance sheets, the balance of payments is bound to balance. For if the country has “overspent”
then it must have acquired the finance for this “overspending” from somewhere (either by running up debts or using its reserves) and when this item is included in the accounts they will balance. It follows, therefore that when reference is made to a balance of payments “deficit” or “surplus” this only looks at a part of the total transactions eg. that part involving trade in goods and services which is termed the “balance of Payments on current account”.
If the value of exports exceed the value of imports the balance of payments is said to be in Trade
Surplus. This is regarded as a favourable position because a persistent trade surplus means the country’s foreign exchange reserves are rising and so its ability to pay for its imports and settle its international debts. Also persistent balance of payments trade deficit is regarded as a sign of failure in the country’s trade with other countries and is therefore politically undesirable.
The structure of the Balance of Payments takes three forms: current, capital and monetary accounts.
The current account reflects transactions involving recently produced goods and services rendered.
These include the visible and invisible trade transactions. Invisibles cover services such as insurance, shipping and tourism. The account also includes transfer of interest, profits, dividends currently earned on assets abroad and other transfers such as gifts and migrant remittances, thus the current account records the imports and exports of goods and services and all the net private and government transfers.
The capital account records movements of capital goods, investment and other short term capital movement. All payments arising from transfers of capital or assets plus the extension of credit official or private fall under the capital account.
At this point a line is drawn to reflect the balance of all transactions current and capital struck and the out turn which may be a surplus or deficit is described as the balance for official financing. The monetary account is then a balancing account including changes in foreign reserves. This section shows all those official transactions including the use of or the addition to the external reserves and the use of funds borrowed from the IMF or other governments, the purpose of which is to accommodate or finance the balance on current and capital items.
The processes leading to deficits are associated with: • Excessive imports over exports, • Excessive capital outflows; and • Overvalued domestic currencies
Some steps necessary to correct the situation: • Limitation of imports through import substitution • Some degree of devaluation/depreciation • Improvement of the balance on capital account through encouraging more capital inflows (in form
or FDI’s foreign aid etc). • Expanding the stock of official reserves.

Questions–Mocks
STRATHMORE UNIVERSITY ● REVISION KIT
140
Part III: Comprehensive Mock Examinations
QUESTIONS - MOCKS
COMPREHENSIVE TEST 1
Time Allowed: 3 hours Answer any FIVE questions. All questions carry equal marks Question One
(a) In a certain economy the marginal propensity to save is 0.2 and the autonomous consumption equals 400.
i. Formulate the consumption function. (3 marks) ii. If the Government’s expenditures were to increase by 50% what would be the resultant change in
National income. (3 marks) (b) The demand and supply schedules for carrots in a certain market are given below: Price per ton (Sh ‘000’)
Quantity demanded per month (Thousands of tons)
Quantity supplied per month (Thousands of tons)
2 110.0 5.0 4 90.0 46.0 8 67.5 100.0 10 62.5 115.0 12 60.0 122.5 Determine the equilibrium quantity and price by graphical method. (8 marks) (c ) Explain how the concept of elasticity guides decisions in the following situations: (i) Government’s tax policy on household consumption. (2 marks) (ii) Devaluation policy to encourage exports and discourage imports. (2 marks) (iii) Price discrimination by a monopolist. (2 marks) (Total: 20 marks) Question Two
(a) (i) Based on the circular flow of income analysis, explain why marginal propensity to consumer plus marginal propensity to save equals one. (4 marks)
What is the relationship between the simple multiplier and marginal propensity to consume?
(3 marks) (b) Given a hypothetical consumption function of the form: C = a + bYd Where Yd = Y – T And Y = Income T = Taxes and that:

Comprehensive Mock Examinations
ECONOMICS
141
Government spending and investment are exogenously determined at G and I respectively: Determine Government Spending Multiplier. (5 marks) (c ) Briefly explain the hindrances encountered in estimating national income values of a developing country. (8 marks) (Total: 20 marks)
Question Three
You have been hired as a consultant by a firm producing bread to advise on a pricing strategy that would enable the firm to maximize profits. This firm is a monopolist which sells in two distinct markets, one of which is completely sealed off from the other. As part of the analysis, you establish that the total demand for the firm’s output is given by the following equation: Q = 50 – 0.5P and the demand for the firm’s output in the two markets is given by the following equations: Q1 = 32 – 0.4P1 and Q2 = 18 – 0.1 P2 Where: Q = total output P = Price Q1 = Output sold in Market 1 Q2 = Output sold in Market 2 P1 = Price charged in Market 1 P2 = Price charged in Market 2 The cost of production is given by C = 50 + 40Q Where C = total cost of producing bread. Required: (a) The total output that the firm must produce in order to maximize profits. (4 marks) (b) What price must be charged in each market in order to maximize profits? (2 marks) (c) How much profit would the firm earn if it sold the output at a single price, and if it discriminates?
(5 marks) (d) (i) The price elasticity of demand for the two markets at the equilibrium price and quantity. (4 marks) (ii) Comment on how the price elasticity of demand may be used in making economic decisions. (3 marks) (e) Under what conditions is price discrimination possible? (2 marks) (Total: 20 marks) Question Four
(a) Distinguish between a tariff and a quota as applied in International Trade. (8 marks) (b) Argue for and against international trade restrictions. (12 marks) (Total: 20 marks)

Questions–Mocks
STRATHMORE UNIVERSITY ● REVISION KIT
142
Question Five (a) State the Law of diminishing returns as applied to production functions. (3 marks) (b) Illustrate and explain the three stages associated with the law of variable proportions. (9 marks) (c) The table below represents a production function for a commodity X where capital is fixed and
labour is variable. Quantity of Labour Total Physical product (Tons of X)
0 0 1 15 2 34 3 48 4 60 5 62
Using the data in the table, plot the marginal product for labour. (8 marks) (Total: 20 marks) Question Six (a) (i) A monopolistic firm with a linear demand curve finds that it can sell two units at Sh.12 or twelve
units at Sh.2. Its fixed cost is Sh. 20 and its marginal cost is constant at Sh. 3 per unit Derive and plot the following: Marginal cost, average total cost, marginal revenue and demand curves for this firm. (8 marks) (ii) At what output level will this firm produce? (4 marks) (b) Bring out the salient features of a monopsony market model. (8 marks) (Total: 20 marks) Question Seven (a) Discuss the major causes of supply curve shifts. (7 marks) (b) By use of diagrams, illustrate and explain the resultant changes on the equilibrium price and quantity
from a simultaneous fall in price of a substitute and an increase in the cost of raw materials for a specific commodity. (7 marks)
(c) What are the determinants of demand for labour? (6 marks) (Total: 20 marks) Question Eight (a) (i) Define the term hyperinflation. (2 marks)
(ii) what is the effect of high and rising inflationary rate on the rate of interest? (4 marks) (iii) Suggest economic measures to curb inflation. (8 marks)
(b) Given the following data in millions of shillings pertaining to an economy, determine Net National and Gross National Product Values. (6 marks)
National income 3,387 Indirect business taxes (less subsidies) 366
Depreciation 455 (Total: 20 marks)
Comprehensive Mock Examinations
ECONOMICS
143
COMPREHENSIVE TEST 2
Time Allowed: 3 hours Answer any FIVE questions. All questions carry equal marks
Question One
a) Distinguish between Gross National and Gross Domestic products and account for the lower values of the former in developing economies. (5 marks)
b) Define the term per capita income. Show its usefulness and highlight some of its inherent shotcomings. (7 marks)
The table below represents estimated national income values for hypothetical economy X in millions of shillings: Gross National Product (at market prices) = 389.2 Depreciation allowance = 47.0 Indirect taxes less subsidies = 42.4 Business taxes = 11.4 Personal income taxes = 66.3 Government transfers = 59.3 Retained profits = 13.0 Based on the information provided, calculate the Net National Product at market price, the Net National Income (at factor cost), Personal Income and the disposable income for this economy (8 marks) (Total: 20 marks) Question Two
(a) PQR Ltd is the sole supplier of electricity in your country. It supplies electricity to two separate consumers, namely (i) industrial and commercial users and (ii) domestic users. The company is able to charge different prices or tariffs to these two consumers. Suppose the PQR Ltd’s total cost of producing electricity is given by the following cost function:
C = 50 + 20Q Where C = total cost Q = total output of electricity produced The demand functions for the two consumers is given as follows: P1 = 80 – 5Q1 P2 = 180 – 20Q2 Where P1 = Tariff charged to commercial users Q1 = Output sold to commercial users P2 = Tariff charged to domestic users Q2 = Output sold to domestic users.
Required:
a) The output produced and how much of this output will be sold in each market if PQR Ltd is to maximize profits? (6 marks)
b) At what price will the outputs in each market be sold? (4 marks) c) The price elasticities of demand for the two markets (at equilibrium price and quantity). d) Comment on the relationship between the price elasticity of demand and the level of prices
in decision- making. (6 marks) e) Under what circumstances might it be possible and profitable for a monopolist to charge different
prices for his product in different markets? (4 marks) (Total: 20 marks)
Questions–Mocks
STRATHMORE UNIVERSITY ● REVISION KIT
144
Question Three
a) What are the main causes of budget deficits? (5 marks) b) Explain why reduction of Government deficits has increasingly become an important issue in fiscal policy
framework of developing countries. (5 marks) c) Outline how each of the following may contribute to economic growth and development in developing
countries: i. Domestic economic governance and transparency. (5 marks) ii. Activities of commercial banks and non-bank financial institutions. (5 marks)
(Total: 20 marks) Question Four
Suppose in a two commodity market model the supply and demand functions are given as: QS1 = -3 +4P1 QS2 = -18 + 4P2 Qd1 = 4 – P1 + 1/2 P2 Qd2 = 10 + P1 – P2 Required:
a) Explain the relationship between the two commodities giving valid economic reasons. (6 marks) b) Using the functions provided, calculate the equilibrium values of prices and quantities. (6 marks) c) d) Discuss some of the factors that may cause a shift of the supply curve. (8 marks) (Total: 20 marks) Question Five
Most developing countries especially the sub-Saharan African countries have not realized the full benefits from International Trade. Required: Discuss the main reasons why such countries have not realized these benefits. (12 marks) What policy measures would you recommend to help the countries realize these benefits? (8 marks) (Total: 20 marks) Question Six
(a) Using a well labeled diagram, show and explain why in a perfectly competitive market structure, when the marginal revenue equals marginal cost, this is only a necessary but not sufficient condition for profit maximization. (6 marks)
(b) Bring out the salient features of a monopolistic competition market model (6 marks) (c) Using an appropriate diagram, illustrate and explain why prices are sticky in oligopoly markets. (8 marks) (Total: 20 marks) Question Seven
(a) (i) Outline the major differences between quantity and the Keynesian Liquidity preference
theories of money demand. (5 marks) (ii) If money supply in a given economy equals 500 while the velocity and price equal 8 and 2
respectively, determine the level of real and nominal output. (3 marks) (b) What factors determine the rate of interest in an economy? (6 marks) (c) Discuss some of the consequential economic impacts of high and rising rate of interest. (6 marks) (Total: 20 marks)

Comprehensive Mock Examinations
ECONOMICS
145
Question Eight
Assume a consumer spends all his income in the purchase of two goods X and Y whose prices are Sh. 30 and Sh. 20 per unit respectively. The consumer’s monthly income is Sh. 12,000. He is satisfied with various combinations of X and Y but prefers to spend his income in equal proportions on the two commodities, that is, at a ratio of 1:1 to maintain his level of satisfaction. Required:
(a) Using clearly labeled diagrams: (i) Show the relevant budget line and indifference curves indicating the equilibrium position of the consumer. (6 marks) (ii) What is the effect of an increase in the consumers income from Sh. 12,000 to sh. 24,000 per month? (4 marks) (b) (i) Differentiate between inferior and giffen goods. (2 marks) (ii) Using separate diagrams, illustrate and explain the substitution and income effects of a price fall for both inferior and giffen goods (8 marks) (Total: 20 marks)

Questions–Mocks
STRATHMORE UNIVERSITY ● REVISION KIT
146
COMPREHENSIVE TEST 3
Time Allowed: 3 hours Answer any FIVE questions. All questions carry equal marks
Question One
a) Discuss the different approaches used in the measurement of the National Income of a country. (6 marks) b) The Economic Advisory Department of Examland has estimated that its country’s marginal propensity
to consume equals 0.6, investment in millions of shillings equals 2,000, Government spending 8,000, autonomous consumption 10,000 and net exports 1,000.
Required:
1. Calculate the level of equilibrium of National Income for this economy. (5 marks) 2. If the currency of Examland depreciated, what would likely happen to the National Income? Why?
(3 marks) c) What are the main problems associated with National Income Accounting in developing countries?
(6 marks) (Total: 20 marks) Question Two
(a) Explain what is meant by the terms own price, income and cross elasticities of demand. (9 marks) (b) How and when is the concept of elasticity applied in economic policy decisions. (11 marks)
(Total: 20 marks) Question Three
(a) Define the term Monetary Policy. (2 marks) (b) Discuss any four instruments of this policy used to control and regulate money supply by the Central
Banking Authorities. (12 marks) (c) What limits the successful application of these tools (in b above) in developing countries? (6 marks) (Total: 20 marks) Question Four
(a) State the main sources of monopoly powers. (5 marks) (b) Explain why the marginal revenue curve lies below the average revenue curve in a monopolistic firm
(3 marks) (c) Illustrate diagrammatically the output levels for both profit-maximizing and the loss making
monopolist firm in the short-run. Give brief explanations. (12 marks) (Total: 20 marks) Question Five
Write brief notes on the following economic concepts: (a) Choice , Scarcity and opportunity cost. (5 marks) (b) Exchange rate. (5 marks) (c ) Producer’s surplus. (5 marks) (d) Isoquants. (5 marks) (Total: 20 marks)

Comprehensive Mock Examinations
ECONOMICS
147
Question Six
(a) Make a distinction between fixed and variable costs of production. Give examples of each. (5 marks) (b) In a perfectly competitive market the average revenue and average cost functions are: AR = K1Q – K2 and AC = K1 - K2 respectively. Q K1, K2 are constants Q is the output level Based on the given functions, determine: (i) Fixed and Variable cost functions (6 marks) (ii) The level of output at which the firm breakevens (3 marks) (c) Distinguish between implicit and explicit costs. (6 marks) (Total: 20 marks) Question Seven
Kenya is planning to be a newly industrialized country by the year 2020 A.D. What obstacles are likely to impede the achievement of this objective and what steps must be taken to overcome such obstacles? (Total: 20 marks)
Question Eight
(a) Assume there are 10,000 identical individuals (consumers) in the market for commodity x each with a demand function given by Qdx = 12 – 2Px and 1,000 identical producers of commodity x, each with a supply function which takes the form Qsx = 20 Px. Required: (i) Determine the market demand and market supply functions for commodity x. (4 marks) (ii) Compute the market equilibrium price (Px) and quantity (Qx) (6 marks)
(b) One of the determinants of demand for a commodity is advertising.
Required: (i) Explain the extent to which advertising influences demand. (5 marks) (ii) State the factors that a business firm should consider while developing an advertising policy.
(5 marks) (Total: 20 marks)

Answers-Mocks
STRATHMORE UNIVERSITY ● REVISION KIT
148
ANSWERS - MOCKS
COMPREHENSIVE MOCK EXAMINATIONS
PAPER ONE
QUESTION 1
(a) MPs = 0.2
Co = 400 (i) C = a + by where a: autonomous consumption b: mpc MPS + MPC = 1 MPC = 1 – MPS MPC = 1 – 0.2 MPC = 0.8 Since a = 400 b = 0.8 Then C = 400 + 0.8Y (ii) ∆Y = ∆G X K ∆Y = K∆ G but k = 1/1-mpc = 1/mps
where K represents the multiplier which is the reciprocal of the marginal propensity to save (mps) i.e. k = 1/mps ∆Y = 1/0.2(0.5) = 2.5 = (5/2 x 100) = 250%
∆Y = 1/mps ∆G

Comprehensive Mock Examinations
ECONOMICS
149
(b) D
Price/tonne (Sh. ‘000’) S 12 - 10 - 8 - Pe = 6 ●e 4 - 2 - D S 0 10 20 30 40 50 60 70 Qe 80 90 100 110 120 130 Quantity per Month (Thousands of tones) Pe = Ksh. 6,000 Qe = 77,500 tonnes SS: Supply Curve DD: Demand Curve Pe: Equilibrium price Qe: Equilibrium quantity e: Equilibrium point. Scale: Vertical axis: 1 cm rep Ksh.1000. Horizontal axis: 1 cm reps. 5000 tonnes
(c) How the concept of elasticity guides decisions in the following situations: (i) Government tax policy on household consumption:
An indirect tax has an effect of increasing the price of the product and how much of the tax burden is going to be transferred to the final consumer depends on the nature of elasticity of demand. Assuming that the objective of the government is to discourage consumption, the tax policy is going to b e effective only if the demand for the taxable commodity is relatively elastic so that an increase in its price reduces the quantity demanded more than proportionately.
(ii) Devaluation policy to encourage exports and discourage imports: Devaluation is the reduction of the relative value of a domestic currency; or simply as a deliberate
reduction of the price of a domestic currency per unit of a foreign currency, usually in a fixed exchange rate regime.Devaluation makes exports cheaper while imports become relatively expensive and the policy of devaluation is going to be effective in encouraging exports and discouraging imports only where the

Answers-Mocks
STRATHMORE UNIVERSITY ● REVISION KIT
150
demand for both exports and imports is highly elastic; in this case, devaluation tends to more than
proportionately increase and decrease exports and imports respectively, ceteris paribus. (iii) Price discrimination by a monopolist:
Price discrimination is the monopoly practice of charging different prices to different consumers (or in different markets) for the same product irrespective of cost structure.
Possible only with different elasticities in different markets such that a higher price is charged in the inelastic demand market and a lower price in the elastic demand market.
Question 2
(a) (i) Disposable income is either consumed or saved, and any change in this income causes changes in consumption and savings; the ratio of change in consumption to change in income measures the marginal propensity to consume (mpc), while the ratio of change in savings to change in income represents marginal propensity to save (mps).
Thus, if: C = 0.8 Yd S = 0.2Yd Then ∆c/∆Yd = 0.8 = mpc and ∆s/∆Yd = 0.2 = mps (0.8 + 0.2) = 1; ∴mpc + mps = 1. Savings: 20% of Disposable income (S = 0.2Yd) Disposable Income Yd = 0.85Y T = 150 Consumption 80% of Disposable Income (c = 0.8Yd) (c = 680)
National Income Y = 1000 Io = 220. Go = 100
HOUSEHOLDS
Income tax (at 15%) (T = 0.15Y)
FIRMS

Comprehensive Mock Examinations
ECONOMICS
151
C = 0.8 Y d 680 = 0.8Yd ∴Yd = (680/0.8) = 850 If disposable income (Yd) increases by 10% ( i.e from 850 to 935) Consumption (c) increases from 680 to 748 and savings (s) from 170 to 187. ∆Yd = (935 – 850) = 85 ∆c = (748 – 680) = 68 ∆s = (187 – 170) = 17 ∆c = (68/85) = 0.8 ∆Yd ∆s = (17/85) = 0.2 ∆Yd ∆c + ∆s = 0.8 + 0.2 = 1 ∆Yd ∆Yd ∴mpc + mps = 1. Y = C + S ∆Y = ∆C + ∆S ∆Y = ∆C + ∆S ∆Y ∆Y ∆Y I = ∆C + ∆S where ∆C = mpc ∆Y ∆Y ∆Y ∆s = mps ∆Y ∴mpc + mps = 1. (ii) Relationship between simple multiplier and marginal propensity to consume:
K = 1/1 – mpc where K: multiplier ∆Y = k∆C
Mpc: marginal propensity to consume
1 – mpc: Marginal propensity to save (mps)
The simple multiplier (k) is an increasing function of the marginal propensity to consume (mpc) i.e an increase (decrease) in mpc increases (decreases) the multiplier (k) by reducing (increasing) the size of ( 1 – mpc) i.e mps; The multiplier (k) is the reciprocal of the marginal propensity to save; (k = 1/mps)
(b) Determination of Government Expenditure Multiplier:
C = a + bYd and Y = Income Where Yd = Y – T and T = Taxes Go: Government Spending Io: Investment

Answers-Mocks
STRATHMORE UNIVERSITY ● REVISION KIT
152
Y = C + Io + Go ………………...(1)
C = a + bYd ……………………...(2)
Y = a + bYd + Io + Go ……….. (3)
Y = a +b (Y – T) + Io + Go
Y = a + b Y – bT + Io + Go
Y – b Y = a – bT + Io + Go
Y (1 – b) = a – bT + Io + Go
Y = a – bT + Io + Go ………….(4)
1 – b
d Y = 1 > 0 Since b<1 (Government Spending Multiplier)
dGo 1 - b
Approach:
This model can be solved for Y by substituting the second (2) equation into the first (1) equation to get the third (3) equation which is eventually reduced to equation four (4) (i.e. the reduced form of equilibrium Income). The partial derivative of equation four (4) gives the Government – Spending Multiplier.
Important::
Y = C + I + G………..(1)
C = a + bYd …………(2)
The first equation in this system gives the equilibrium condition for national income, while the second equation shows how C is determined in the model. Parameters: (a) is positive because consumption is positive even if disposable income (Y – T) is zero; (c) Is a positive fraction because it represents the marginal propensity to consume (mpc) Exogenous variables: The exogenous variables Io (Investment) and Go (Government Spending) are, of
course, non negative. All the parameters and exogenous variables are assumed to be independent of one another, so that
any one of them can be assigned a specific new value without affecting the others.
(c) Hindrances encountered in estimating national income values of a developing country:
• complete / inadequate information • Double counting • Changes in prices • The problem of inclusion, in terms of:

Comprehensive Mock Examinations
ECONOMICS
153
a) Subsistence output (income) b) Intermediate goods c) Housing i.e. rent on owner-occupiers d) Public services provided by the government e) Foreign payments i.e. net income from abroad f) Illegal activities e.g. smuggled output g) Revaluation of assets.
NB: Briefly explain each of these hindrances.
QUESTION 3
a) Q1 = 32 – 0.4P1
0.4P1 = 32 – Q1
P1 = 32 – Q1
0.4
= 32 - Q1
0.4 0.4
= 320 – 10Q1
4 4
Therefore, P1 = 80 – 2.5Q1 ……………..(1)
TR1 = P1Q1
= (80 – 2.5Q1)Q1
TR1 = 80Q1 – 2.5Q12 …………………..(2)
MR1 = dTR1
dQ1
Therefore MR1 = 80 – 5Q1 ……………..(3)
Q2 = 18 – 0.1P2
0.1P2 = 18 – Q2
P2 = 18 – Q2
0.1
Therefore P2 = 180 – 10Q2 …………….(4)

Answers-Mocks
STRATHMORE UNIVERSITY ● REVISION KIT
154
TR2 = P2Q2
(180 – 10Q2)Q2
Therefore TR2 = 180Q2 – 10Q2 2 ……..(5)
MR2 = dTR2
dQ2
MR2 = 180 – 20Q2 ……………………...(6)
C = 50 + 40Q
C = total cost of production
TC = 50 + 40Q ………………………..(7)
MC = dTC/dQ = 40 …………………..(8)
MC = MR1 40 = 80 – 5Q1 5Q1 = 40 Q1 = (40/5) = 8 Q1 = 8 Units of bread sold in market one (1). MC = MR2 40 = 180 – 20Q2 20Q2 = 140 Q2 = (140/20) = 7 Q2 = 7 Units of bread sold in market two (2). Q = Q1 + Q2 = (8 + 7) Q = 15 Total Units of bread sold. (b) P1 = 80 – 2.5Q1 but Q1 = 8 = 80 – 2.5(8) = (80 – 20) = 60 P1 = 60. P2 = 180 – 10Q2 but Q2 = 7 = 180 – 10(7) = (180 – 70) = 110 P2 = 110.
MC = MR1 = MR2

Comprehensive Mock Examinations
ECONOMICS
155
(c) Profit earned if output is sold at a single price: Q = 50 – 0.5P 0.5P = 50 – Q P = 50 – Q
0.5 0.5 P = 100 – 2Q TR = P.Q = (100 – 2Q)Q TR = 100Q – 2Q23 MR = 100 – 4Q From equation (8) in part (a), MC = 40 MC = MR 40 = 100 – 4Q 4Q = 60 Q = 15 Units of bread TR = 100Q – 2Q2 = 100(15) – 2(15)2 = 1,500 – 2 ( 225) =(1,500 – 450) = 1,050 TR = 1,050 OR P = 100 – 2Q = 100 – 2(15) =(100 – 30) = 70 P = 70 TR = P.Q = (70 X 15) TR = 1,050 TC = 50 + 40Q 50 + 40(15) (50 + 600) = 650 TC = 650 II = TR – TC (1,050 – 650) = 400 II = 400 Profit earned upon price discrimination: TR1 = 80Q1 – 2.5Q12 But Q1 = 8 =80(8) – 2.5(8)2 = 640 – 2.5(64)
Answers-Mocks
STRATHMORE UNIVERSITY ● REVISION KIT
156
(640 – 160) = 480 TR1 = 480 TR2 = 180Q2 – 10Q22 but Q2 = 7 = 180(7) – 10(7)2 =1,260 – 10(49) =(1,260 – 490) = 770 TR2 = 770 TR = TR1 + TR2 (480 + 770) =1,250 TR = 1,250 TC = 50 + 40Q but Q = 15 50 + 40(15) = 650 TC = 650 II = TR – TC = (1,250 – 650) = 600 II = 600
Comment:
Profit (II) is higher with price discrimination than at a single price. It is therefore commercially advisable for the monopolist to price discriminate and earn a supernormal profit of 600 instead of 400 without price discrimination. (d) (i). Price elasticity of demand for the two markets at the equilibrium price and quantity: Market One (1): Ped1 = ∆Q1 • P1 ∆P1 Q1 Q1 = 32 – 0.4 P1 dQ1 = - 0.4 dP1 P1 = 60 Q1 = 8 Therefore dQ1 • P1 = ( -0.4 • 60 ) = (-24) = -3 dP1 Q1 8 8 Ped1 = -3 Ped = 3 (Price elastic) Market two (2): Ped2 = ∆Q2 • P2 ∆P2 • Q2

Comprehensive Mock Examinations
ECONOMICS
157
Q2 = 18 – 0.1P2 dQ2 = - 0.1 dP2 P2 = 110 Q2 = 7 Therefore dQ2 • P2 = ( -0.1 • 110 ) = (-11 ) dP2 Q2 7 7 Ped2 = -1.57 Ped2 = 1.57 ( Price elastic) (ii) Price elasticity of demand may be used in making economic decisions from the stand point of:
• Price discrimination with a view to increasing total revenue by charging a higher price in the relatively price inelastic (or low elastic demand) market and a lower price in the elastic demand market.
• Government’s indirect tax policy with a view to either raising revenue or discouraging consumption – effective only where demand is inelastic (relatively less elastic) and elastic (highly elastic) respectively.
• Tax shifting by producers (suppliers) – where demand is inelastic suppliers are able to shift a greater portion of the tax burden to the consumer in form of higher prices than when demand is relatively elastic such that more of the tax burden is absorbed by the supplier.
• Devaluation policy, which is only effective in encouraging exports while discouraging imports (by making exports cheaper and imports expensive) where the demand for both imports and exports is highly price elastic.
(e) Conditions under which price discrimination is possible: • Effective market separation e.g in terms of time, age, geographical location etc. • Absolute control over supply. • Different price elasticity of demand in different markets. NB: more on part (a) Assuming no price discrimination, the total output that the firm should produce in order to maximize profits would be computed as follows: Q = 50 – 0.5P 0.5P = 50 – Q P = 50 – Q 0.4 0.5 P = 100 – 2Q TR = P.Q = (100 – 2Q)Q = 100Q – 2Q2 MR = dTR/dQ = 100 – 4Q OR P = 100 – 2Q = AR and since the slope of MR is twice the slope of AR in monopoly, Therefore, MR = 100 – 2(2Q) MR = 100 – 4Q MC = MR 40 = 100 – 4Q 4Q = 60

Answers-Mocks
STRATHMORE UNIVERSITY ● REVISION KIT
158
Q = (60/4) = 15 Q = 15 Units
QUESTION 4
(a) Free Trade maximizes world output and benefits all nations. However, practically all nations impose some restrictions on the free flow of international trade. Since these restrictions and regulations deal with the nation’s trade or commerce, they are generally known as commercial policies. While trade restrictions are invariably rationalized in terms of national welfare, in reality they are usually advocated by those special groups in the nation that stand to benefit from such restrictions.
The most important type of trade restriction is the tariff. A tariff is a tax or duty levied on the traded commodity as it crosses a national boundary. It is ideally divided into import tariff and an export tariff. An import tariff is a duty on the imported commodity, while an export duty is a duty on the exported commodity. Import duties are more important and the most prevalent. Infact, export tariffs are constitutionally prohibited by most (developed) countries such as the U.S but are often applied by developing countries on their traditional exports (such as Ghana on its Cocoa an Brazil on its coffee) to get better prices and raise revenue. Developing nations rely heavily on export tariffs to raise revenue because of their ease of collection. On the other hand, industrial countries invariably impose tariffs or other trade restrictions to protect some (usually L – intensive) industry, while using mostly increased taxes to raise revenue.
Tariffs can be ad valorem, specific or compound;
Advalorem tariff – is expressed as a fixed percentage of the value of the traded commodity. For example, a 10 per cent ad valorem tariff on bicycles would result in the payment to customs officials of the sum of Ksh 200 on each Ksh 2000 imported bicycle and the sum of Ksh 400 on each Ksh 4,000 imported bicycle.
Specific tariff – is expressed as a fixed sum per physical unit of the traded commodity e.g. a specific tariff of Ksh 100 on each imported bicycle regardless of its price.
Compound tariff – is a combination of an ad valorem and a specific tariff e.g. a compound duty of 5 per cent ad valorem and a specific duty of Ksh 100 on imported bicycles would result in the collection of the sum of Ksh 200 on each Ksh 2,000 imported bicycle. (NB: Duty on bicycles (in Kenya) was waived in the 2001/2002 budget). The United States, for instance, uses the ad Valorem and the Specific tariff with about equal frequency, whereas European Countries rely mainly on the ad valorem tariff.
NB: Sometimes an import tariff exceeds the price/value of the imported product, and the tariff
becomes a prohibitive tariff e.g. a 100 percent import tariff on Commodity X is the ad valorem rate that would make the tariff prohibitive. A tariff can also take the form of an optimum tariff, which is that rate of tariff that maximizes the net benefit resulting from the improvement in the nation’s terms of trade against the negative effect resulting from reduction in the volume of trade. That is, starting from a free trade position, as the nation increases its tariff rate, its welfare increases up to a maximum (the optimum tariff) and then declines as the tariff rate is raised past the optimum. However, as the terms of trade of the nation imposing the tariff improve, those of the trade partner deteriorate, since they are the inverse or reciprocal, of the terms of trade of the tariff-imposing nation. Facing both a lower volume of trade and deteriorating terms of trade, the trade partner’s welfare definitely declines. As a result, the trade partner is likely to retaliate and impose an optimum tariff of its own. While recapturing most of its losses with the improvement in its terms of trade, retaliation by the trade partner will definitely reduce the volume of trade still further. The first nation may then itself retaliate. If the process continues, all nations usually end up losing all or most of the gains from trade.
Comprehensive Mock Examinations
ECONOMICS
159
A quota is a direct quantitative restriction on the amount of a commodity allowed to be imported (or exported). Import quotas are far more common and important than export quotas, and so the term ‘quota’ is often used exclusively to imply import quota e.g those applied by Kenya on imported cereals like maize (year 2001) and the United States on African textile and garment (NB/: African textiles and garment have now been granted duty-free access to the U.S market under the U.S Congress AGOA initiative).
Differences between an import quota and an equivalent (implicit) import tariff: • With a given import quota, an increase in demand will result in a higher domestic price and greater
domestic production and lower consumption; however, with a given import tariff, an increase in demand will increase consumption and imports. An import quota completely replaces the market mechanism while an import tariff alters it (market mechanism) by allowing for adjustments in the demand for, and supply of the traded commodity.
• The second difference between an import quota and an import tariff is that the quota involves the distribution of import licenses. In this case, the government must decide the basis for distributing licenses among potential importers of the commodity. Such choices may be based on arbitrary official judgment rather than on efficiency considerations, and they tend to remain frozen even in the face of changes in the relative efficiency of various actual and potential importers of the commodity. Furthermore, since import licenses result in monopoly profits, potential importers are likely to devote a great deal of effort in lobbying and even bribing government officials to obtain them (i.e. in so called rent-seeking activities). Thus, import quotas not only replace the market mechanism, but also result in waste from the point of view of the economy as a whole and contain the seeds of corruption.
• An import quota limits imports to the specified level with certainty, while the trade effect of an import tariff may be uncertain. This is because the elasticities of demand and supply are often not known, making it difficult to estimate the import tariff required to restrict imports to a desired level. Moreover, foreign exporters may absorb all or part of the tariff by increasing their efficiency of operation or by accepting lower profits. As a result, the actual reduction in imports may be less than anticipated. Exporters cannot do this with an import quota since the quantity of imports allowed into the country is clearly specified by the quota. It’s for this reason, and also because an import quota is less ‘visible’, that domestic producers strongly prefer quotas to tariffs. However, since import quotas are more restrictive than equivalent import tariffs, society should generally resist these efforts.
(b) Case for and against International trade restrictions: (i) Case For: • Infant Industry Argument – If an industry is just developing, with a good chance of success once it is
established and reaping economies of scales, then it is necessary to protect it from (external) competition temporarily until it reaches levels of production and costs which allow it to compete effectively with established industries elsewhere. This argument is most commonly used to justify the high level of protection that surrounds the manufacturing industry in developing countries, as they attempt to replace foreign goods with those produced/made in their own country (import substitution strategy).
• Cheap Labour – It’s often argued that the economy must be protected from imports which are produced with cheap labour; that buying foreign goods (imports) from low wage countries amounts not only to unfair competition, but continues to encourage the exploitation of cheap labour in those countries as well as undermining the standard of living of those in high wage economies.
• Dumping – Dumping occurs where goods are sold in a foreign market at prices below their cost of production or at prices below the prices in the country of origin. This may be undertaken either by a foreign monopolist, using high profits at home to subsidize exports for political or strategic reason. Countries in which such products are sold feel justified in undertaking protectionism. This is because dumping could result in the elimination of home industries, and the country then becomes dependent on foreign goods which (although cheap in relative terms)have no guaranteed quality standards.

Answers-Mocks
STRATHMORE UNIVERSITY ● REVISION KIT
160
• Balance of payments (BOP) and Budget Deficits – If a country had a persistent BOP deficit, it’s
unlikely to be able to finance from its limited reserves. It therefore becomes necessary for it to adopt some form of restriction on imports e.g. tariffs which also act as a source of revenue.
• Danger of over-specializing – A country may feel that in its long-term interest it should not be too specialized.A country may not wish to abandon production of certain key commodities even though the foreign product is more competitive, because it will then be too dependent on imports. In future, prices of such goods may rise or supplies may diminish. It is for this reason that countries wish to remain largely self-sufficient (e.g. in food – as a security); Specialization gains in terms of comparative advantage could be enjoyed in the meantime, but in future, demand may fall and the country suffers disproportionately (e.g. loss/reduction of foreign exchange earnings). In this case, a country will then diversify into production of other goods while restricting importation of same or similar products.
• Strategic Reasons – a country may find it’s not in its interest to be dependent on imports, and can protect a home industry regardless of its efficiency status. Many countries maintain industries for strategic reasons e.g. the steel industry, shipping, agriculture etc
• Structural unemployment – decline of a highly localized industry due to international trade causes great problems of regional (structural) unemployment. If it would take time to re-locate labour to other jobs/sectors, then the government, under considerable political and humanitarian pressure, tends to restrict the imports that are causing the industry to decline.
• Bargaining power – even when a country sees no economic benefit in protection, it may find it useful and effective to maintain (impose) tariffs and /or other forms of restriction as bargaining gambits in negotiating better terms with other countries.
(ii) Case against: • Free Trade Argument – This maintains that free trade allows all countries to specialize in producing
commodities in which they have comparative advantage. They can produce and consume more of all commodities than would be available if specialization had not taken place. By implication, any quotas, tariffs, other forms of import controls and/or export subsidies would interfere with the overall advantages from free trade and thereby making less efficient the use of world resources.
• Monopoly Power – Protection could make industries with high capital base to develop monopoly power, and such power is socio-economically undesirable in terms of output restriction (output deficiency) and considerably higher prices, which militate against living standards (welfare).
• Retaliation – Advocate of free trade also advance the argument that if one country imposes import restrictions, then those countries adversely affected will impose retaliatory restrictions on its exports and thereby ending up not having any gainful net effect. This could also lead to a tariff war which no country can benefit from, and which contracts the volume of world trade on which every country’s international prosperity depends.
• Inflation – If key foreign goods are not free to enter the country (or cost more), prices tend to increase, leading to increased level of inflation.
• Inefficiency – where there is protection against foreign competition, the industries (sectors) enjoying this shade tend to be slow in instituting efficiency enhancing systems (such as paying due regard to research and development) with a view to meeting international quality standards specifications. Kenya, for instance, cannot achieve its 2020 industrialization dream without efficiency (in both public and private sectors).
QUESTION 5
(a) Law of Diminishing Returns The law of diminishing returns states that “As additional units of a variable factor are added to a given quantity of a fixed factor, with a given state of technology, the marginal product and the average product of the variable factor will eventually decline”. This law comes about because each unit of the variable factor has less of the fixed factor to work with.
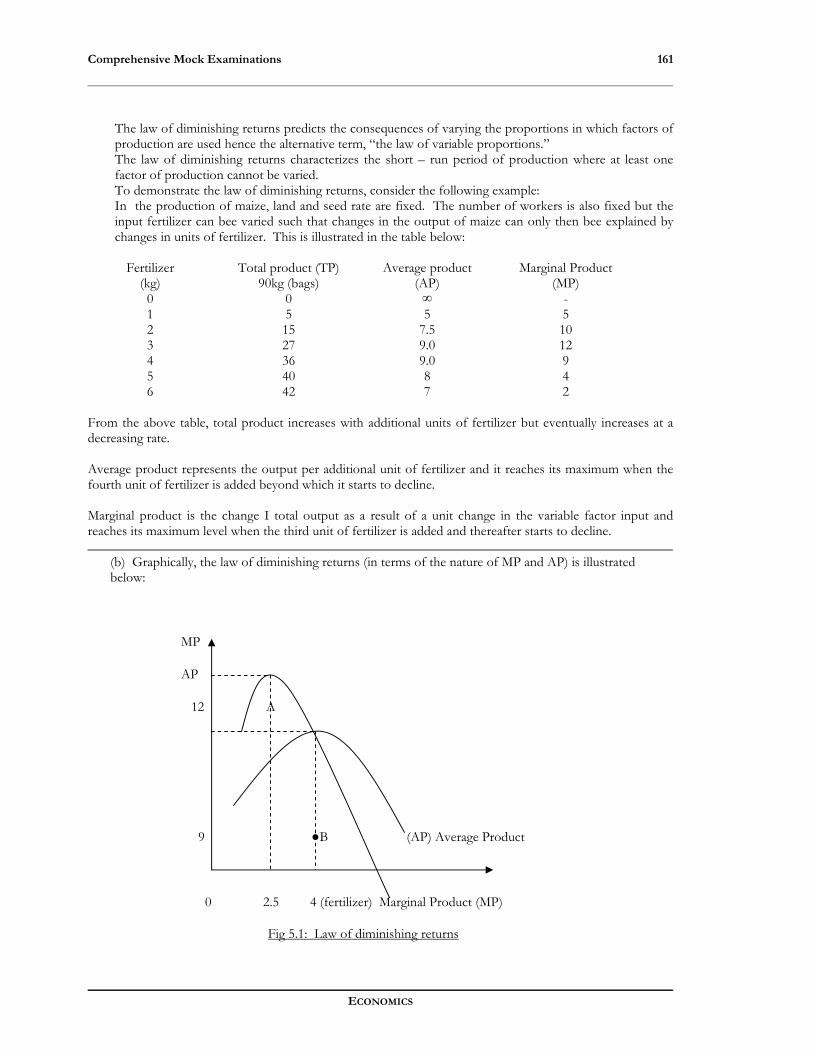
Comprehensive Mock Examinations
ECONOMICS
161
The law of diminishing returns predicts the consequences of varying the proportions in which factors of production are used hence the alternative term, “the law of variable proportions.” The law of diminishing returns characterizes the short – run period of production where at least one factor of production cannot be varied. To demonstrate the law of diminishing returns, consider the following example: In the production of maize, land and seed rate are fixed. The number of workers is also fixed but the input fertilizer can bee varied such that changes in the output of maize can only then bee explained by changes in units of fertilizer. This is illustrated in the table below:
Fertilizer (kg)
Total product (TP) 90kg (bags)
Average product (AP)
Marginal Product (MP)
0 0 ∞ - 1 5 5 5 2 15 7.5 10 3 27 9.0 12 4 36 9.0 9 5 40 8 4 6 42 7 2
From the above table, total product increases with additional units of fertilizer but eventually increases at a decreasing rate. Average product represents the output per additional unit of fertilizer and it reaches its maximum when the fourth unit of fertilizer is added beyond which it starts to decline. Marginal product is the change I total output as a result of a unit change in the variable factor input and reaches its maximum level when the third unit of fertilizer is added and thereafter starts to decline.
(b) Graphically, the law of diminishing returns (in terms of the nature of MP and AP) is illustrated below:
MP
AP
12 A
9 ●B (AP) Average Product
0 2.5 4 (fertilizer) Marginal Product (MP)
Fig 5.1: Law of diminishing returns
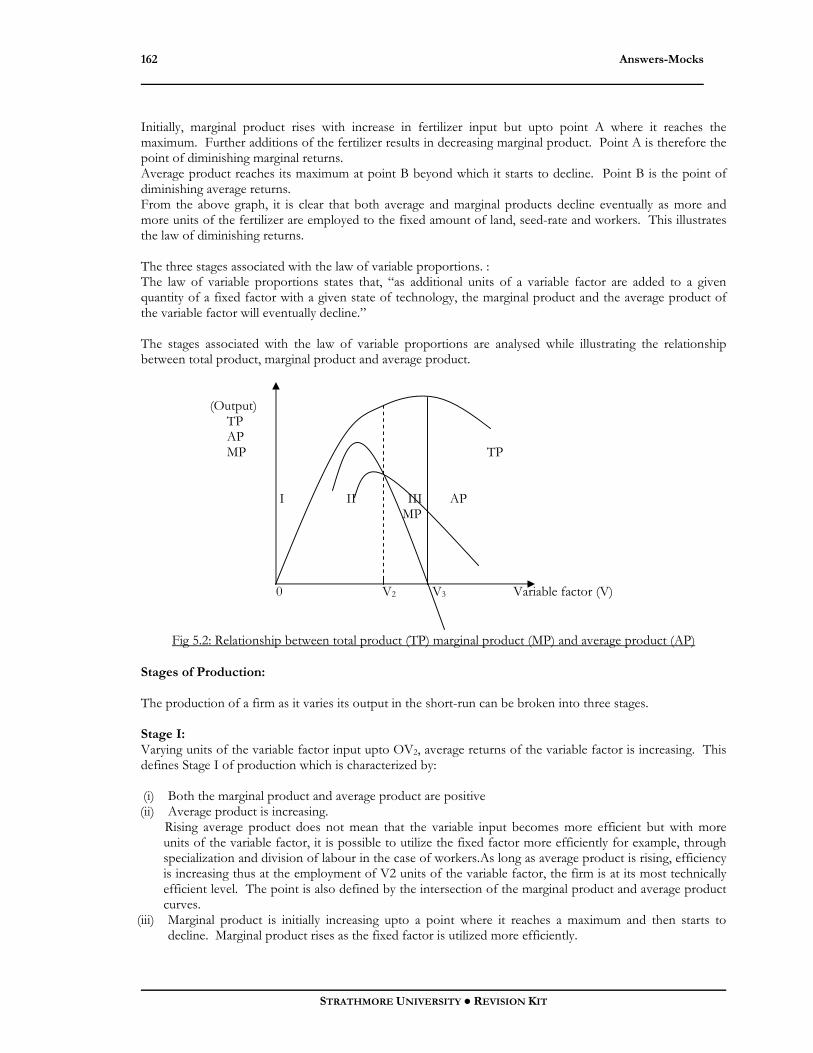
Answers-Mocks
STRATHMORE UNIVERSITY ● REVISION KIT
162
Initially, marginal product rises with increase in fertilizer input but upto point A where it reaches the maximum. Further additions of the fertilizer results in decreasing marginal product. Point A is therefore the point of diminishing marginal returns. Average product reaches its maximum at point B beyond which it starts to decline. Point B is the point of diminishing average returns. From the above graph, it is clear that both average and marginal products decline eventually as more and more units of the fertilizer are employed to the fixed amount of land, seed-rate and workers. This illustrates the law of diminishing returns. The three stages associated with the law of variable proportions. : The law of variable proportions states that, “as additional units of a variable factor are added to a given quantity of a fixed factor with a given state of technology, the marginal product and the average product of the variable factor will eventually decline.” The stages associated with the law of variable proportions are analysed while illustrating the relationship between total product, marginal product and average product. (Output) TP AP MP TP I II III AP MP 0 V2 V3 Variable factor (V)
Fig 5.2: Relationship between total product (TP) marginal product (MP) and average product (AP)
Stages of Production: The production of a firm as it varies its output in the short-run can be broken into three stages. Stage I: Varying units of the variable factor input upto OV2, average returns of the variable factor is increasing. This defines Stage I of production which is characterized by: (i) Both the marginal product and average product are positive (ii) Average product is increasing.
Rising average product does not mean that the variable input becomes more efficient but with more units of the variable factor, it is possible to utilize the fixed factor more efficiently for example, through specialization and division of labour in the case of workers.As long as average product is rising, efficiency is increasing thus at the employment of V2 units of the variable factor, the firm is at its most technically efficient level. The point is also defined by the intersection of the marginal product and average product curves.
(iii) Marginal product is initially increasing upto a point where it reaches a maximum and then starts to decline. Marginal product rises as the fixed factor is utilized more efficiently.

Comprehensive Mock Examinations
ECONOMICS
163
(iv) Total product increases at an increasing rate as marginal product is rising and then it starts to increase at
a decreasing rate as marginal products starts to fall. (v) Stage I is said to be the stage of increasing returns. Stage II: Stage II begins where Average product starts to fall upto the point where marginal product becomes zero. This stage is characterized by the following:
1. Both marginal product and average product are declining. Marginal product is declining at a faster rate than average product.
2. Declining average product indicates decreasing returns and thus decreasing efficiency. This comes about because each additional unit of the variable factor has less of the fixed factor to work with.
3. Both marginal product and average product are positive, 4. Total product is increasing but at a decreasing rate. 5. Stage II is the stage of diminishing returns.
Stage III: Stage III begins where marginal product becomes negative. It is characterized by the following:
1. Marginal product is negative and declining. 2. Average product is positive and declining. 3. Total product is declining.
Firms will avoid operating at Stage I as it involves utilizing a fixed factor inefficiently. Firms will also avoid Stage III as it involves falling total product since marginal product is negative. Firms will thus find Stage II economically efficient because marginal product and average product are positive although declining. Additional units of the variable factor will increase total product at this stage. Stage I and Stage III are thus the irrational zones of production while Stage II is the rational zone of production. (c) Quantity of labour Total physical product Marginal product Working for (MP): (tons of X) (15 – 0) = 15 1 - 0 0 0 15 (34 – 15) = 19 2 - 1 1 15 19 (48 – 34) = 14 2 34 3 - 2 14 3 48 (60 – 48) = 12 12 4 - 3 4 60 2 (62 – 60) = 2 5 62 5 – 4 Marginal product of labour is the change in total output as a result of a unit change in labour (variable factor) input. Symbolically, the marginal product of labour can be written as:

Answers-Mocks
STRATHMORE UNIVERSITY ● REVISION KIT
164
Marginal product of labour = Change in total product ⇒ MPL = ∆TP Change in units of labour ∆ L Marginal product of labour is shown in the above table in column three. Graphically, marginal product is illustrated below: Marginal Product (MP) 20 - 18 - 16 - ●A 14 - x 12 - x 10 - x 8 - xMP 6 - 4 - 2 - 0 1 2 3 4 5 Units of Labour
Fig 5.3: Marginal product of labour (MPL)
From the graph, initially with low levels of employment of labour, marginal product rises with increase in labour employment but upto point A when the second unit of labour is employed. From point A, further employment of labour will result in decreasing marginal product. Point A is the point of diminishing marginal returns. Initially there was increasing returns due to the benefits of specialization and division of labour but later, labour has less of the fixed factor to work with and starts interfering with each other. Question 6
a) i)
P 12 2 (Sketch)Q 2 12
P = a – bQ (Linear Demand Function)
12 = a – 2b ------- (i) 2 = a – 12b -------(ii) 10 = 10b ∴ b = 1 12 = a – 2b a = 12 + 2b a = 12 + 2(1)

Comprehensive Mock Examinations
ECONOMICS
165
∴ a = 14 Thus, p = 14 –Q
P 14 12 10 8 6 4 2Q = 14 - P 0 2 4 6 8 10 12
TR = P.Q; p = 14 – Q ∴ TR = (14 – Q)Q TR = 14Q – Q2 (Total Revenue Function) MR = dTR = 14 – 2Q
dQ
MR = 14 – 2Q (Marginal Revenue Function) Q 0 2 4 6MR = 14 – 2Q 14 10 6 2
C = f(Q) MC = 3 TC = 20 + 3Q TC = ∫ 3+ C where C: constant = TFC = 20 MC = dTC = 3 ∴ TC = 3Q + 20 dQ
ATC = TC = 20 + 3Q = 20 + 3 Q Q Q Q 0 1 2 3 4 5 6 7 8 9 10 11 12 ATC α 23 13 9.7 8 7 6.3 5.8 5.5 5.2 5 4.8 4.7

Answers-Mocks
STRATHMORE UNIVERSITY ● REVISION KIT
166
Marginal cost (mc) 24 - 22 - Marginal Revenue (MR) where: 20 - MR: Marginal Revenue Curve Price (P) D= AR: Demand Curve (Average Revenue Curve) 18 - MC: Marginal Cost Curve ATC: Average Total Cost Curve 16 - 14 -
12 - 10 - 8.5 ATC 8 - 6.6 6 - 4 - 3 ● MC 2 - MR D = AR
0 2 4 5.5 6 8 10 12 14 Output (Q)
Fig: 6.1 Equilibrium for a Monopolistic Firm a) ii) Computation of Output (Q): MC = 3 MR = 14 – 2Q MC = MR 3 = 14 – 2Q 2Q = 14 –3
2Q = 11 ∴ Q = 5.5 Units
Computation of price (p): P = a – bQ but a = 14 & b = 1 ∴ P = 14 – Q but Q = 5.5 P = (14 – 5.5) = Sh. 8.50
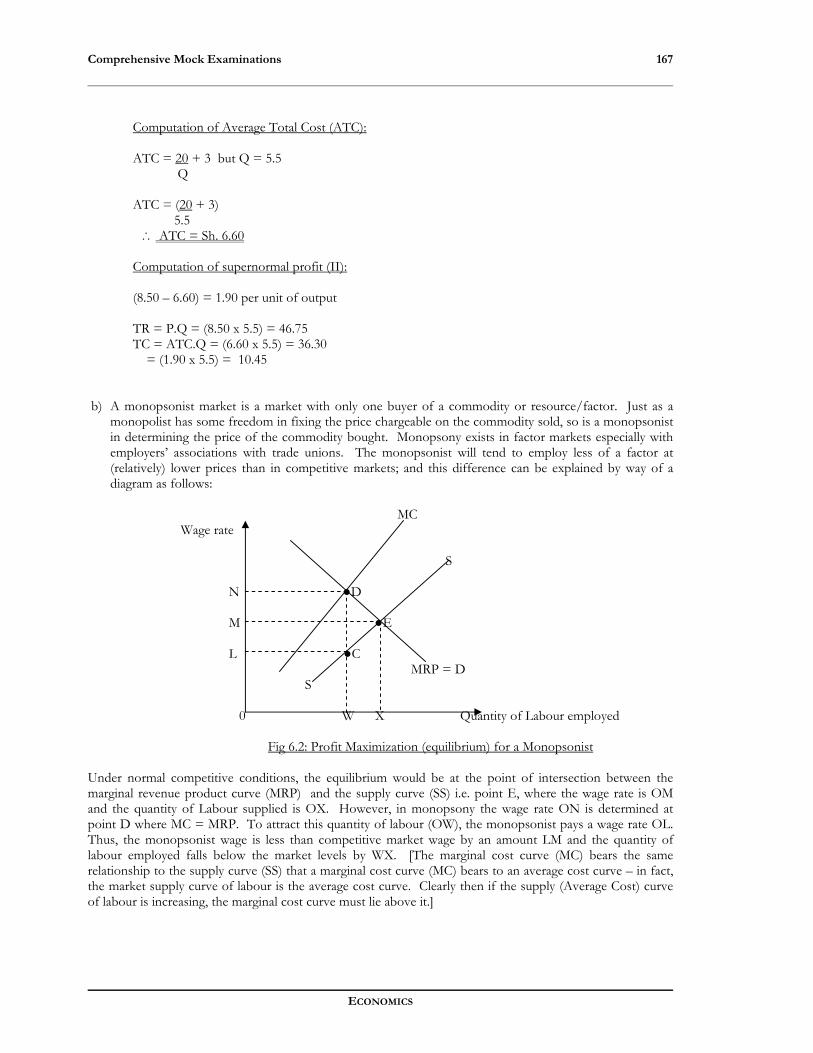
Comprehensive Mock Examinations
ECONOMICS
167
Computation of Average Total Cost (ATC):
ATC = 20 + 3 but Q = 5.5 Q
ATC = (20 + 3) 5.5 ∴ ATC = Sh. 6.60 Computation of supernormal profit (II): (8.50 – 6.60) = 1.90 per unit of output TR = P.Q = (8.50 x 5.5) = 46.75 TC = ATC.Q = (6.60 x 5.5) = 36.30 � = (1.90 x 5.5) = 10.45
b) A monopsonist market is a market with only one buyer of a commodity or resource/factor. Just as a
monopolist has some freedom in fixing the price chargeable on the commodity sold, so is a monopsonist in determining the price of the commodity bought. Monopsony exists in factor markets especially with employers’ associations with trade unions. The monopsonist will tend to employ less of a factor at (relatively) lower prices than in competitive markets; and this difference can be explained by way of a diagram as follows:
MC Wage rate S N ●D M ●E L ●C MRP = D S
0 W X Quantity of Labour employed
Fig 6.2: Profit Maximization (equilibrium) for a Monopsonist
Under normal competitive conditions, the equilibrium would be at the point of intersection between the marginal revenue product curve (MRP) and the supply curve (SS) i.e. point E, where the wage rate is OM and the quantity of Labour supplied is OX. However, in monopsony the wage rate ON is determined at point D where MC = MRP. To attract this quantity of labour (OW), the monopsonist pays a wage rate OL. Thus, the monopsonist wage is less than competitive market wage by an amount LM and the quantity of labour employed falls below the market levels by WX. [The marginal cost curve (MC) bears the same relationship to the supply curve (SS) that a marginal cost curve (MC) bears to an average cost curve – in fact, the market supply curve of labour is the average cost curve. Clearly then if the supply (Average Cost) curve of labour is increasing, the marginal cost curve must lie above it.]
Answers-Mocks
STRATHMORE UNIVERSITY ● REVISION KIT
168
NB: Where there is an intensive bargain between the monopsonist and, say, a trade union, the monopsonist may be prevented from paying lower wages (like OL) i.e. moving from E to C and the income represented by the area LCDN is subject to the bargaining strength.
More on Monopsony:
Monopsony results from either or both of two basic conditions. First, monopsonistic purchases of a resource may occur when units of the resource are specialized to a particular user. This means that the marginal revenue product of the resource in the specialized use is higher than it is in any alternative employments from the consideration of resource suppliers. Thus, the resource supply curve facing the monopsonist will be the market supply curve of the resource and usually upward sloping to the right. The more the user is willing to pay for the resource, the greater will be the quantity placed on the market. A situation of the kind described may occur when a special type of skilled labour is developed to meet certain needs of a specific firm. The higher the wage rate offered for the special category of labor, the more individuals there will be who are willing to undergo the necessary training to develop the skill. No other firm utilizes labour with this or similar skills; consequently, once trained, the workers’ only options are to work for this firm or to work elsewhere at jobs where their marginal revenue products and wage rates are significantly lower. Specialization of resources to a particular user is not confined to labour. A large aircraft or automobile manufacturer, for instance, may depend on a number of suppliers to furnish certain parts used by no other manufacturer. In the tightest possible case, such suppliers sell their entire output to the manufacturer, and complete monopsony by the manufacturer therefore exist. Given time, the suppliers may be able to convert production facilities to supply other types of parts to other manufacturers, and the degree of monopsony enjoyed may be decreased correspondingly. The second condition from which monopsony may result is the immobility of certain resources. It is not necessary that resources in general be immobile but only that their mobility out of certain areas or away from certain firms be lacking, thus creating unique monopsonistic situations. Various forces may hold workers in a given community together or to a given firm, including emotional ties to the community together with the fear of the unknown; ignorance regarding alternative employment opportunities; insufficient funds to permit job seeking etc. Monopsony in the purchase of a resource is exploitative. Monopsonistic exploitation is clearly depicted in a comparison with a competitive resource purchasing. In a competitive purchasing situation, each firm will add to its profits by taking larger quantities of the resource up to the point at which the marginal revenue product of the resource is equal to the resource price since the resource price is the same as its marginal cost. The resource receives a price per unit equal to what any one unit of it contributes to the firm’s total receipts. In contrast, the monopsonist maximizes profits by stopping short of the resource employment level at which marginal revenue product of the resource is equal to its price per unit. This is shown in figure 6.2. The profit-maximizing level of employment is that at which the marginal revenue product equals the marginal cost. Since the marginal cost exceeds the resource price, the marginal revenue product of the resource does also. Hence units of the resource (eg. labour) are paid less than what any one of them contributes to the total receipts of the firm. This situation is called monopsonistic exploitation of the resource – where the monopsonist restricts the quantity of the resource used while holding down its price. Question 7
a) Supply curve shifts are caused by factors other than own price of a commodity. Some of these major causes include:
• Production costs – a function of factor prices. • Technology • Government policy (taxes & subsidies) • Natural factors/events (e.g weather, pests, diseases etc)

Comprehensive Mock Examinations
ECONOMICS
169
• Prices of other related goods (substitutes & complements) • Transport and communication • Political stability/atmosphere • Future expectations • Changes in the supply of the product with which the product in question is in joint supply e.g beef
& hides; petrol & paraffin. • Changes in the goals of a firm • Ease of entry • Time
NB: Clearly explain each of these points ( 8 major points) (a) A substitute is that good whose demand is an increasing function of the price of another related good.
A fall in price of a substitute (e.g coffee) decreases the demand for a commodity (e.g tea), denoted by a downward shift of the demand curve as shown below:
D1 Price of tea S D2 P1 ●e1 P2 ●e2 D1 D2 S 0 Qd Q2 Q1 Quantity of tea An increase in the cost of raw materials increases the cost of production for a specific commodity; this reduces the ability of firms to produce and thereby causing a reduction in supply of the commodity, represented by a leftward/upward shift of the supply curve as shown below: D Price of tea S2 S1 P2 ●e2 P1 ●e1 D S2 S1 0 Qs Q2 Q1 Quantity of tea
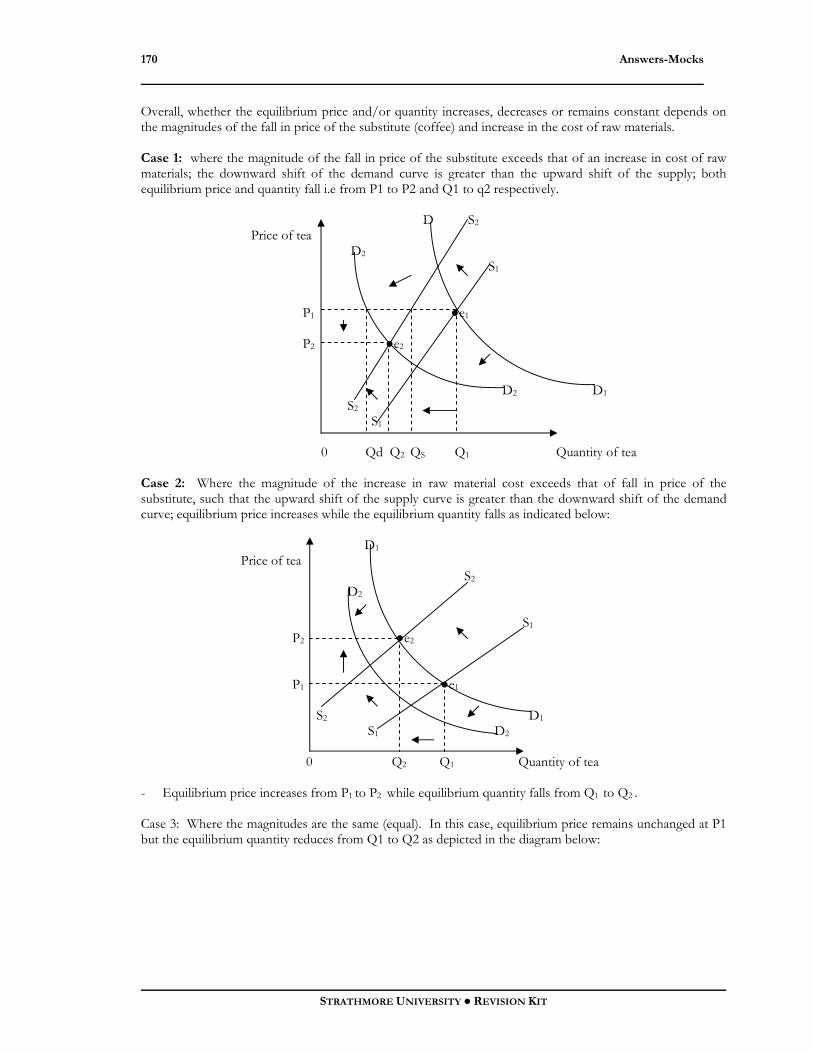
Answers-Mocks
STRATHMORE UNIVERSITY ● REVISION KIT
170
Overall, whether the equilibrium price and/or quantity increases, decreases or remains constant depends on the magnitudes of the fall in price of the substitute (coffee) and increase in the cost of raw materials. Case 1: where the magnitude of the fall in price of the substitute exceeds that of an increase in cost of raw materials; the downward shift of the demand curve is greater than the upward shift of the supply; both equilibrium price and quantity fall i.e from P1 to P2 and Q1 to q2 respectively. D S2 Price of tea D2 S1 P1 ●e1 P2 ●e2 D2 D1 S2 S1 0 Qd Q2 QS Q1 Quantity of tea Case 2: Where the magnitude of the increase in raw material cost exceeds that of fall in price of the substitute, such that the upward shift of the supply curve is greater than the downward shift of the demand curve; equilibrium price increases while the equilibrium quantity falls as indicated below: D1 Price of tea S2 D2 S1 P2 ●e2 P1 ●e1 S2 D1 S1 D2 0 Q2 Q1 Quantity of tea - Equilibrium price increases from P1 to P2 while equilibrium quantity falls from Q1 to Q2 . Case 3: Where the magnitudes are the same (equal). In this case, equilibrium price remains unchanged at P1 but the equilibrium quantity reduces from Q1 to Q2 as depicted in the diagram below:

Comprehensive Mock Examinations
ECONOMICS
171
S2 Price of tea D2 D1 S1 P1 ●e2 ●e1 S2 S1 D1 D2 0 Q2 Q1 Quantity of tea NB: Since the direction of change in quantity is not doubtful (it falls) then case two (2) is most likely. (b) Determinants of demand for labour: • Productivity/efficiency – skill and expertise • Real wage rate (the proportion of TC accounted for by labour cost) • Mobility and the marginal rate of technical substitution between labour and other factors of production
particularly capital. • Technology – depending on the resource mix • Demand for goods that labour help produce (final product) – elasticity of demand for the final product. • Availability and efficiency of other factors of production • Government policy NB: Briefly explain each of these determinants. Notes: • Elasticity of demand for the final product::
If labour is producing a commodity with a very inelastic demand, an increase in wages will have a relatively small effect on the demand for labour. If the increase in wages is passed on in the form of higher prices, the fall in quantity demanded of the product will be relatively small. There will be a corresponding small reduction in the demand for labour. However, if the demand for the product is elastic, a small increase in price will lead to a relatively larger reduction in the quantity demanded; if an increase in wages is passed on in the form of higher prices, there will be a large reduction in the demand for labour.
• The proportion of total costs accounted for by labour costs:
If wages account for only a small proportion of total cost, the demand for labour will be inelastic. Some industries are labour-intensive e.g house building in the construction industry and therefore labour cost make up a large proportion of the total cost of production; other industries are capital-intensive e.g oil refinery. If wages increase while productivity remains unchanged, the labour cost accounts for a greater percentage of the average cost in a labour-intensive industry. The effect of the increase in wages will be to raise the unit cost. In contrast, in a capital-intensive industry where labour cost form a lesser percentage of the average cost, an increase in wages will raise the unit cost at a lower percentage than in the earlier case. If the increased cost are passed on in the form of higher prices, the effects for demand of labour are likely to be much greater in the case of labour intensive industry.

Answers-Mocks
STRATHMORE UNIVERSITY ● REVISION KIT
172
• Period of Time:
Demand for labour will be more elastic in the long run because it will take time for firms to change their production methods and replace workers with machines. Labour may also have fixed contracts and a period of notice has to be given.
Question 8
(a) (i) Hyper inflation-that which tends to get out of hand/control such that the value of money declines rapidly to a tiny fraction of its former value and eventually to almost nothing, so that a new currency has to be adopted. It is also known as runaway or galloping inflation; Uganda experienced this type of inflation during the 70s.
(ii) High and rising inflationary rate has an effect of increasing interest rates. During inflation, money loses value and lenders (such as banks and other financial institutions) have to reflect an upward adjustment on the interest charged on loanable funds (credit funds). High and rising inflation therefore increases the cost of capital/credit and the demand for funds is largely reduced in the economy, limiting the availability of investible funds. Moreover, the limited funds available will be invested in physical facilities which appreciate in value over time. It is also possible the diversion of investment portfolio (the amount available for investment) into speculative activities away from directly productive ventures.
(iii) An inflationary situation can be addressed/tackled effectively if the cause is first and foremost identified. Governments have basically three policy measures to adopt in order to control inflation:
• Fiscal policy - This policy is based on demand management in terms of either raising or lowering the
level of aggregate demand. The government could attempt to influence many of the components [C + I + G + (X – M)] of the aggregate demand by reducing government expenditure and raising taxes. This policy is effective only against demand - pull inflation.
• Monetary policy - For many years monetary policy was seen as only supplementary to fiscal policy. Neo-keysians content that monetary policy works through the rate of interest while monetarists’ viewpoint is to control money supply through setting targets for monetary growth. This can be achieved through what is known as the Medium term financial strategy (MTFs) which aims at gradually reducing the growth of money in line with the growth of real economy - the use of monetary policy instruments such as the bank rate, open market operations (omo), variable reserve requirement (cash & liquidity ratios).
• Direct Intervention (prices and incomes policy) – Direct intervention involves fixing wages and
prices to ensure there is almost equal rise in wages and other incomes alongside the improvement in economic productivity. Nevertheless, these policies become successful for a short period as they end up storing more trouble in future, since once relaxed will lead to frequent price increases and wage fluctuation. Like direct intervention, fiscal and monetary policies may fail if it is relied upon as the only means of controlling inflation, and that what is needed is an element of policy combination.
(b) The approach required here is that of public sector National Income Accounts.
(i) NNP - indirect taxes + subsidies = NI; NNP = NI + Indirect Taxes - Subsidies, Since (indirect taxes - subsidies) is positive (in this case) i.e. 336, implying that indirect taxes exceed subsidies.
NNP - 336 = 3,387 NNP = (3,387 + 336) NNP = 3,723
(ii) GNP – Dep = NNP
GNP = NNP + Dep GNP = (3,723 + 445) GNP = 4,178.

Comprehensive Mock Examinations
ECONOMICS
173
The public sector National Income Accounts Format: GNP 4,178 Less Depreciation (Dep) 455 Net National Product (NNP) 3,723 Less Indirect taxes (plus subsidies)(-336) 336 National Income (NI) 3,387
Answers-Mocks
STRATHMORE UNIVERSITY ● REVISION KIT
174
PAPER TWO
QUESTION 1
a) Gross Domestic Product (GDP) – the money value of all (final) goods and services produced within the country but excluding net income from abroad.
• Gross National Product (GNP) – The money value of all (final) goods and services produced by
the nationals of a country during a year both within and outside the country. • GDP + (Net Income from abroad) = GNP
In most developing countries/economies GNP is lower than GDP because the net Income from abroad is usually very low and particularly negative. We have for instance very few Kenyans who have invested in other (developed) countries compared to the large volumes of foreign direct investment (FDI) in the country.
• GNP = GDP +[Production - Production by foreigners by nationals abroad (c) within a developing country (F)]
• GNP = GDP + (C – F); Since (c) is very small compared to (F) then the negative effect (reducing effect) on GDP is high. The negative net Income from abroad drastically reduces GNP since GNP = GDP + [-(C – F)].
b) Per capita Income – the National Income per head which is given by dividing National Income by the
total population of a country in a year.
Per capita Income = National Income = NI Total Population P
It shows the standard of living a country can afford for its people. The level of income per capita is determined by the size of a country’s population. The higher is the rate of growth of population, the lower is the rate of growth of income per capita. Per capita income is a theoretical rather than a factual concept. It shows what the share of each individual’s National Income would be if all citizens were treated as equal. In real world situation, there exists considerable inequality in the distribution of income especially in third world countries. The composition of output may change e.g the defence –related goods may be produced and less spent on social services or consumer goods; standards of living depend on the quantity of consumer goods enjoyed. Overtime, price will change. The index of retail prices may be used to express the GNP in real terms but there are well known problems in the use of such methods e.g the problem of weighting etc. National income may grow as well as per capita income figures but this is not representative of the distribution of income. A small group may be better off while others have static or worse off welfare standards.
There is also a possibility for an increase in Income per capita to be accompanied by deteriorating working conditions arising from eventualities like environmental pollution. These non-monetary aspects are not well taken into account when estimating GNP and GNP per capita. Moreover, National Income increases when people pay for services which they previously carried out themselves. If a housewife, for instance, takes an office job and pays someone to do her housework, National Income will increase to the extent of both persons’ wages. Similarly, a reduction in National Income would occur if a person painted his house instead of hiring a professional painter. Changes of this nature imply that changes in the GNP per capita will only largely misrepresent changes in the standard of living.
Sometimes even the estimation of the total population fails the test of accuracy necessary for the reflection of the true perception e.g underestimation of the population figure would imply an overstatement of the GNP per capita, and thus failing to reflect the true state of welfare.

Comprehensive Mock Examinations
ECONOMICS
175
(c) Ksh (Millions)GNP (MP) 389.2Depreciation 47.0NNP (MP) 342.2Indirect taxes less Subsidies (42.4)NNP (FC) = NI 299.8Government transfers 59.3 359.1Business taxes 11.4Retained profits 13.0 24.4Personal Income 334.7Personal taxes 66.3Disposable income 268.4 Question 2
(a) (i) Q1 + Q2 = Q TR1 = P1 Q1 = (80 – 5Q1 ) Q1 ----------------------------(1) TR1 = 80Q1 – 5Q21 MR1 = dTR1 = 80 – 10Q1 ---------------------------------(2) dQ1 TR2 = P2 Q2 = (180 – 20Q2 )Q2 TR2 = 180Q2 - 20Q22 ----------------------------------(3) MR2 = dTR2 = 180 – 40Q2 ---------------------------(4) dQ2 C = 50 + 20Q MC = dC = 20 ---------------------------------------(5) dQ MC = MR1 = MR2 MC = MR1 20 = 80 – 10Q1 10Q1 = 60 Q1 = 6 units of electricity sold to commercial users. MC = MR2 20 = 180 – 40Q2 40Q2 = 160 Q2 = 4 units of electricity sold to domestic users. Q = Q1 + Q2 = (6 + 4) = 10 Q = 10 units of total output of electricity produced. (ii) P1 = 80 – 5Q1 but Q1 = 6 P1 = 80 – 5(6) = (80 – 30) = 50 P1 = 50 price charged on electricity sold to commercial users.
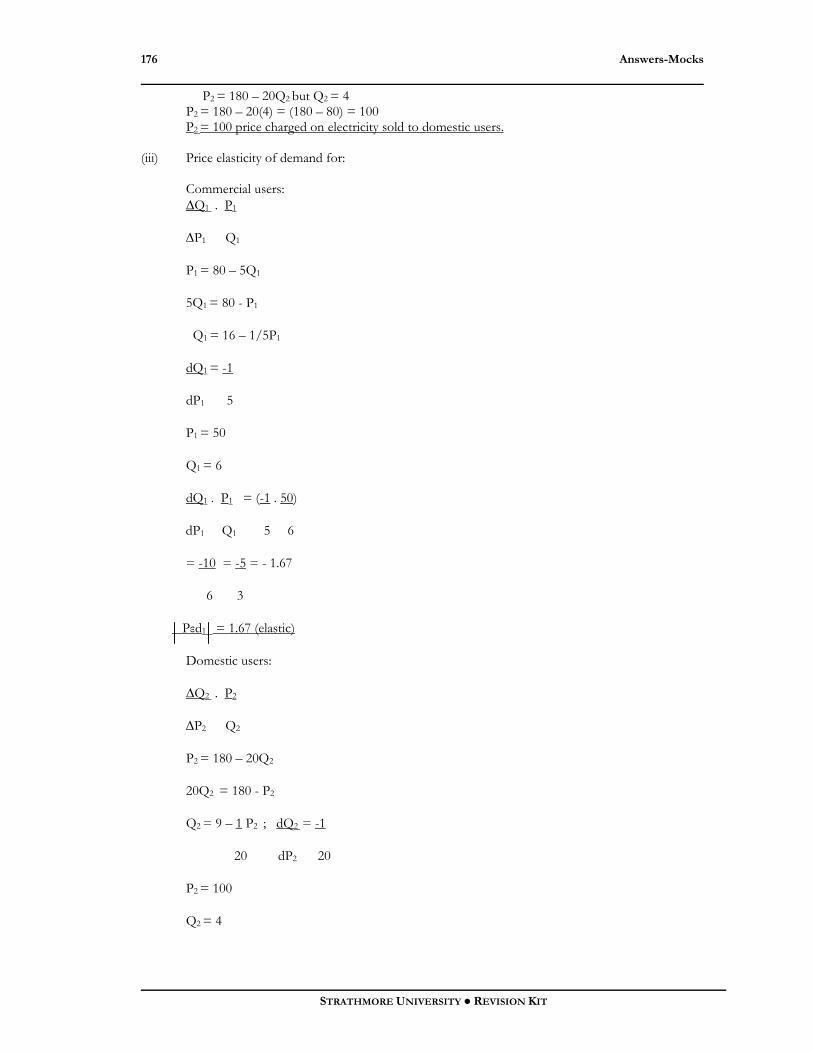
Answers-Mocks
STRATHMORE UNIVERSITY ● REVISION KIT
176
P2 = 180 – 20Q2 but Q2 = 4 P2 = 180 – 20(4) = (180 – 80) = 100 P2 = 100 price charged on electricity sold to domestic users. (iii) Price elasticity of demand for: Commercial users: ∆Q1 . P1
∆P1 Q1
P1 = 80 – 5Q1
5Q1 = 80 - P1
Q1 = 16 – 1/5P1
dQ1 = -1
dP1 5
P1 = 50
Q1 = 6
dQ1 . P1 = (-1 . 50)
dP1 Q1 5 6
= -10 = -5 = - 1.67
6 3
Pεd1 = 1.67 (elastic)
Domestic users:
∆Q2 . P2
∆P2 Q2
P2 = 180 – 20Q2
20Q2 = 180 - P2
Q2 = 9 – 1 P2 ; dQ2 = -1
20 dP2 20
P2 = 100
Q2 = 4

Comprehensive Mock Examinations
ECONOMICS
177
∆Q2 . P2 = (-1 . 100) = -5
∆P2 Q2 20 4 4
Pεd2 = 1.25 (elastic).
Comment: Price elasticity of demand and the level of prices have an inverse relationship in decision making; a higher price is charged where price elasticity of demand is low, while a lower price is charged where price elasticity of demand is relatively high. Based on the above computations of price elasticity of demand (for commercial and domestic users), a higher price (P2 = 100) is charged to domestic users since the price elasticity of demand is low (1.25) while a lower price (P1 = 50) is charged to commercial users since price elasticity of demand is relatively high (1.67).
(b) It might be possible and profitable for a monopolist to charge different prices for his product in different markets under the following major circumstances:
• Market separation (to avoid seepage or arbitrage) – a monopolist must be able to keep the markets
separate either in terms of distance or time to avoid the product being bought in the cheaper market and sold in the more expensive market at prices below the monopoly price.
• Difference in elasticities of demand in different markets – this makes it possible the charging of a higher price in the inelastic demand market and a lower price in elastic demand market.
• Total control over production (supply) of a product which has no close substitute. An example of price discrimination are the bus fares charged by KBS at different times of the day. In the mornings and evenings (peak hours) the demand for transport is higher and more inelastic than during the rest of the day. Hence fares are higher in the morning and in the evening than during the rest of the day.
NB: In monopoly, MR function can be worked out from the AR function since the slope of MR curve is
twice the slope of AR curve. Example:
P1 = AR1 = 80 – 5Q1 P2 = AR2 = 180 – 20Q2 Slope of AR1 = -5 Slope of AR2 = -20 Slope of MR1 = -10 Slope of MR2 = -40 Thus MR1 = 80 – 10Q1 Thus MR2 = 180 – 40Q2
The above method is however not appropriate in perfect competition since the AR and MR curves are perfectly elastic, implying that the slope of the MR curve is equal to the slope of the AR curve, and it equals zero.
Part (iii) of the question can alternatively be worked out as follows: Pεd for commercial users:
P1 = 80 – 5Q1
Slope = ∆P1 = -5 ∆Q1 ∆Q1 = 1 = 1 ∆P1 slope -5 Pεd1 = ∆Q1 . P1 = ( 1 x 50) ∆P1 Q1 -5 6 = -1.67
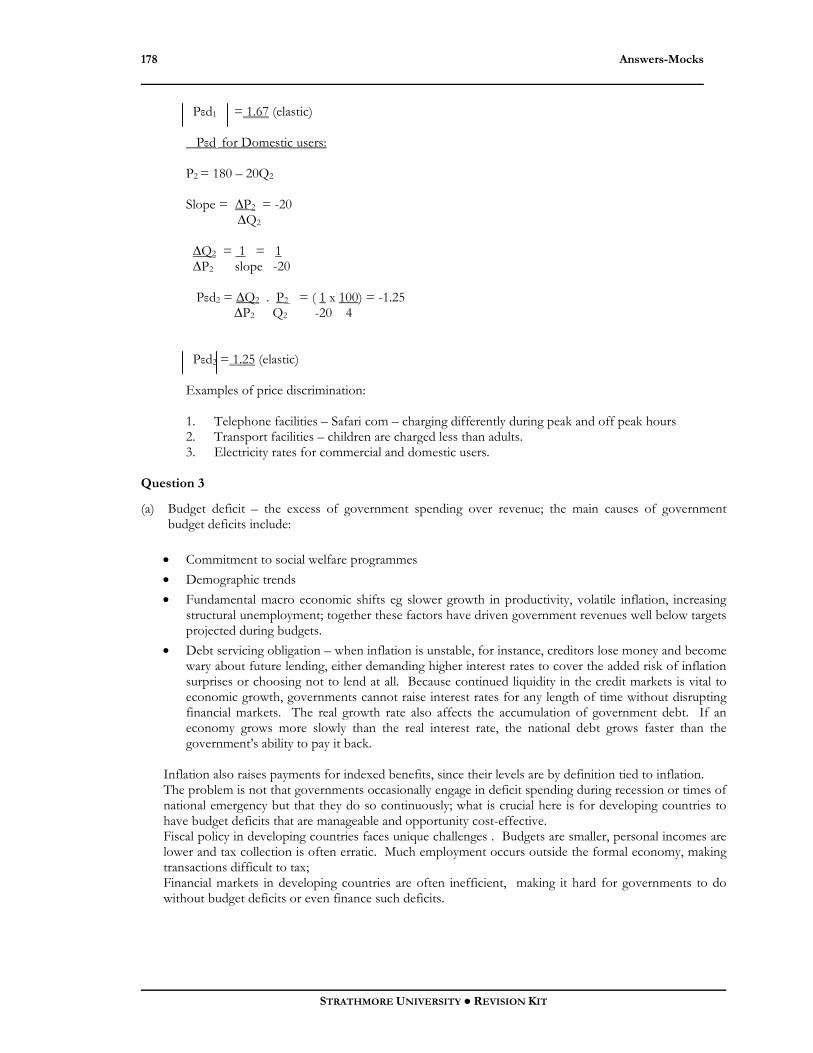
Answers-Mocks
STRATHMORE UNIVERSITY ● REVISION KIT
178
Pεd1 = 1.67 (elastic) Pεd for Domestic users: P2 = 180 – 20Q2 Slope = ∆P2 = -20 ∆Q2 ∆Q2 = 1 = 1 ∆P2 slope -20 Pεd2 = ∆Q2 . P2 = ( 1 x 100) = -1.25 ∆P2 Q2 -20 4 Pεd2 = 1.25 (elastic) Examples of price discrimination: 1. Telephone facilities – Safari com – charging differently during peak and off peak hours 2. Transport facilities – children are charged less than adults. 3. Electricity rates for commercial and domestic users.
Question 3
(a) Budget deficit – the excess of government spending over revenue; the main causes of government budget deficits include:
• Commitment to social welfare programmes • Demographic trends • Fundamental macro economic shifts eg slower growth in productivity, volatile inflation, increasing
structural unemployment; together these factors have driven government revenues well below targets projected during budgets.
• Debt servicing obligation – when inflation is unstable, for instance, creditors lose money and become wary about future lending, either demanding higher interest rates to cover the added risk of inflation surprises or choosing not to lend at all. Because continued liquidity in the credit markets is vital to economic growth, governments cannot raise interest rates for any length of time without disrupting financial markets. The real growth rate also affects the accumulation of government debt. If an economy grows more slowly than the real interest rate, the national debt grows faster than the government’s ability to pay it back.
Inflation also raises payments for indexed benefits, since their levels are by definition tied to inflation. The problem is not that governments occasionally engage in deficit spending during recession or times of national emergency but that they do so continuously; what is crucial here is for developing countries to have budget deficits that are manageable and opportunity cost-effective. Fiscal policy in developing countries faces unique challenges . Budgets are smaller, personal incomes are lower and tax collection is often erratic. Much employment occurs outside the formal economy, making transactions difficult to tax; Financial markets in developing countries are often inefficient, making it hard for governments to do without budget deficits or even finance such deficits.

Comprehensive Mock Examinations
ECONOMICS
179
(b) Reduction of Government deficits has increasingly become an important issue in fiscal policy framework of developing countries because of some reasons like:
• Increased public debt which is costly to maintain – debt servicing is costly in terms of high interest
rates. • Deficit financing is a disincentive to investment – especially where there is an upward adjustment in
level of taxes. • Reduction in donor and other development partners’ role in deficit financing support – necessitating
strict budget discipline – the need for developing countries to narrow the budget deficits in line with their tax revenue base.
• Budget deficits are inflationary, especially where government spending is on aspects like salaries for civil servants, provision of relief food or subsidizing loss making public enterprises, all having no direct relationship with real output.
(c) (i) Economic governance and transparency are about being open and exposed to constructive criticism
and rating on matters pertaining to sound economic management and performance. In perspective are the following issues:
• Allocation/distribution of national resources • Strict adherence to established economic management fundamentals (involves chief executives and
public accounting officers such as permanent secretaries living up to the full extent of ethical standards).
• Tax administration, use and distribution of tax revenue. On tax administration, control systems should be established to minimize tax evasion loopholes; equitable distribution of tax revenue with a view to providing public and merit goods and services for the sole purpose of improving the general welfare status of the people
• Integrity and relevance of key institutions of the central government e.g the Central Tender Board (CTB): Contracts should be allowed to attract competitive bidding and the mode of selection be well defined, with the results and reasons for selection of a particular bidder published (e.g. in the print media) for everybody to see; there should also be sufficient room for appeals for parties (in the bidding process) dissatisfied with the tendering procedure results.
• Due respect for merit tests – the mode of appointment to public offices or portfolios, for instance, should pass the merit test based on competence (itself based on the level of education, skill and professionalism). A permanent secretary in the Ministry of Roads & Public works, for example, should be a qualified engineer (Member of the Institution of Engineers); such human resource status ensures that road construction and maintenance meet the required specifications, which considerably increase the useful life of such roads and thereby minimizing waste of pubic funds which occurs in terms of frequent high cost of reconstruction.
(ii) Commercial banks and non- financial institutions may contribute to economic growth and development
from the standpoint of their functions which include: • Provision of safe deposits for money and other valuables • Credit creation based on mobilization of savings • Facilitation of the central bank’s/ government policy initiatives • Provision of management advisory services • Employment • Facilitation of domestic and international trade transactions (e.g. foreign exchange transactions) • Insurance services to customers e.g. the Standard Chartered Bank (Kenya) • Issue of local travelers’ cheques which guards against loss and theft for if the cheques are lost or
stolen, the lost or stolen numbers can be cancelled, which cannot be done with cash; it’s also safe where large sums of money is involved.
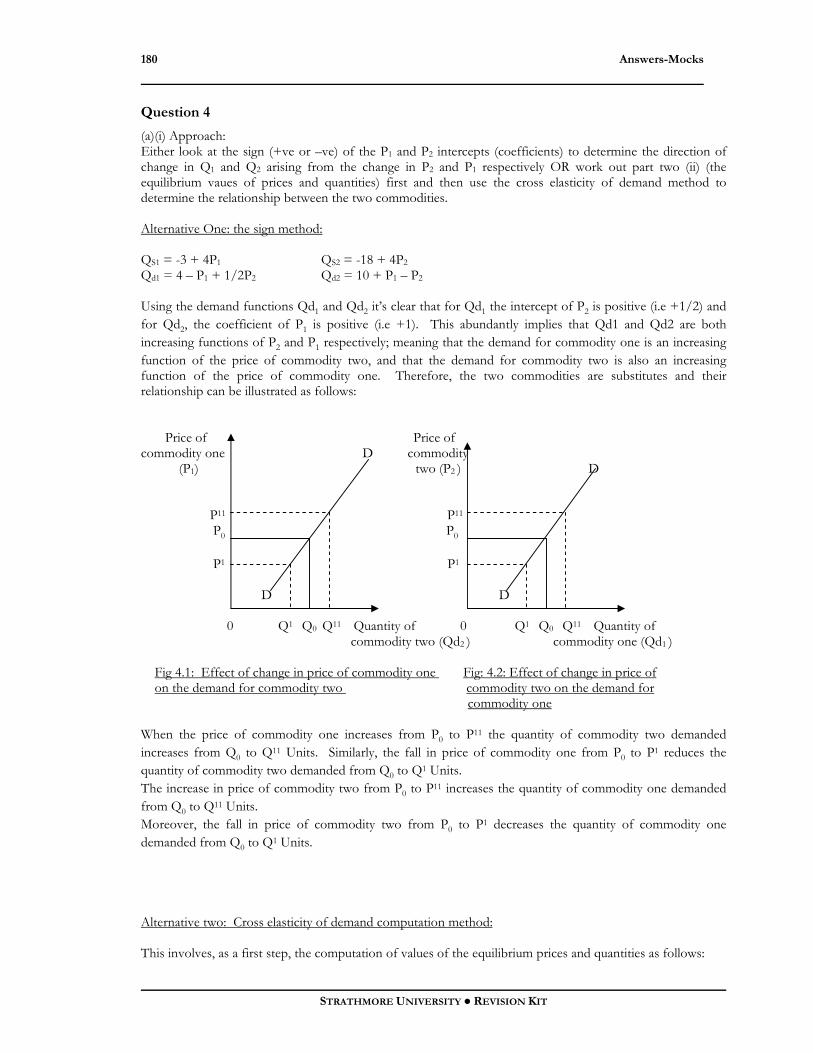
Answers-Mocks
STRATHMORE UNIVERSITY ● REVISION KIT
180
Question 4
(a)(i) Approach: Either look at the sign (+ve or –ve) of the P1 and P2 intercepts (coefficients) to determine the direction of change in Q1 and Q2 arising from the change in P2 and P1 respectively OR work out part two (ii) (the equilibrium vaues of prices and quantities) first and then use the cross elasticity of demand method to determine the relationship between the two commodities. Alternative One: the sign method: QS1 = -3 + 4P1 QS2 = -18 + 4P2 Qd1 = 4 – P1 + 1/2P2 Qd2 = 10 + P1 – P2 Using the demand functions Qd1 and Qd2 it’s clear that for Qd1 the intercept of P2 is positive (i.e +1/2) and for Qd2, the coefficient of P1 is positive (i.e +1). This abundantly implies that Qd1 and Qd2 are both increasing functions of P2 and P1 respectively; meaning that the demand for commodity one is an increasing function of the price of commodity two, and that the demand for commodity two is also an increasing function of the price of commodity one. Therefore, the two commodities are substitutes and their relationship can be illustrated as follows: Price of Price of commodity one D commodity (P1) two (P2 ) D P11 P11 P0 P0 P1 P1 D D 0 Q1 Q0 Q11 Quantity of 0 Q1 Q0 Q11 Quantity of commodity two (Qd2 ) commodity one (Qd1 ) Fig 4.1: Effect of change in price of commodity one Fig: 4.2: Effect of change in price of on the demand for commodity two commodity two on the demand for commodity one When the price of commodity one increases from P0 to P11 the quantity of commodity two demanded increases from Q0 to Q11 Units. Similarly, the fall in price of commodity one from P0 to P1 reduces the quantity of commodity two demanded from Q0 to Q1 Units. The increase in price of commodity two from P0 to P11 increases the quantity of commodity one demanded from Q0 to Q11 Units. Moreover, the fall in price of commodity two from P0 to P1 decreases the quantity of commodity one demanded from Q0 to Q1 Units. Alternative two: Cross elasticity of demand computation method: This involves, as a first step, the computation of values of the equilibrium prices and quantities as follows:

Comprehensive Mock Examinations
ECONOMICS
181
QS1 = -3 + 4P1 QS2 = -18 + 4P2 Qd1 = 4 – P1 + 1/2P2 Qd2 = 10 + P1 – P2 Equilibrium Prices: Commodity One: QS1 = Qd1 -3 + 4P1 = 4 – P1 + 1/2P2 4P1 + P1 – 1/2P2 = 4 + 3 5P1 – 1/2P2 = 7 10P1 – P2 = 14 …………………………… (i) Commodity two: QS2 = Qd2 -18 + 4P2 = 10 + P1 – P2 4P2 – P1 + P2 = 28 5P2 – P1 = 28 …………………………….. (ii) Thus, 10P1 – P2 = 14 ……………………….. (i) 5P2 – P1 = 28 ………………………… (ii) Solving by substitution is as follows: If –P1 = 28 – 5P2 Then P1 = 5P2 – 28 10P1 – P2 = 14 ……………………… (i) But P1 = 5P2 – 28 ∴10(5P2 – 28) – P2 =14 50P2 – 280 – P2 = 14 49P2 = 294 P2 = (249/49) = 6 ∴P2 = 6 10P1 – P2 = 14 but P2 = 6 ∴10P1 – 6 = 14 10P1 = 20 P1 = (20/10) = 2 ∴P1 = 2 Equilibrium Quantities: Commodity One:

Answers-Mocks
STRATHMORE UNIVERSITY ● REVISION KIT
182
QS1 = Qd1 QS1 = -3 + 4P1 but P1 = 2 ∴QS1 = -3 + 4(2) (-3 + 8) = 5 ∴QS1 = 5 Units Qd1 = 4 – P1 + 1/2P2 BUT P1 = 2 & P2 = 6 ∴Qd1 = 4 – 2 + 1/2(6) (4 – 2 + 3) = 5 ∴Qd1 = 5 units ∴QS1 = Qd1 = 5 Units. Commodity Two: QS2 = Qd2 QS2 = -18 + 4P2 but P2 = 6 ∴QS2 = -18 + 4(6) (-18 + 24) = 6 ∴QS2 = 6 Units Qd2 = 10 + P1 – P2 but P1 = 2 & P2 = 6 Qd2 = (10 + 2 – 6) = 6 ∴Qd2 = 6 units ∴QS2 = Qd2 = 6 Units. P1 = 2 P2 = 6 Q1 = 5 Q2 = 6 The relationship between Q1 and Q2 is drawn from the standpoint of cross elasticity of demand as follows: QS1 = -3 + 4P1 QS2 = -18 + 4P2 Qd1 = 4 – P1 + ½P2 Qd2 = 10 + P1 – P2 Xed = ∆Qd1 • P2 OR Xed = ∆Qd2 • P1 ∆P2 Qd1 ∆P1 Qd2 dQd1 = ½ dQd2 = 1 dP2 dP1 but P2 = 6 & Qd1 = 5 P1 = 2 and Qd2 = 6 therefore: therefore: ∆Qd1 • P2 = (1 x 6 ) = 0.6 ∆Qd2 • P1 = (1 x 2 ) = 0.33 ∆P2 Qd1 2 5 ∆P1 Qd2 6
Comprehensive Mock Examinations
ECONOMICS
183
therefore Xed = 0.6 therefore Xed = 0.33 In both cases, the cross elasticity of demand (Xed) is positive, implying that the two commodities (Q1 and Q2) are substitutes (e.g tea and coffee); this means that the demand for one commodity is an increasing function of the price of the other. Such goods are often highly competitive since they can be used alternatively, either mutually exclusively (where they are perfect substitutes) or to some extent (as close substitutes). NB: Alternative two, as you can see, is lengthy and quite involving; therefore, alternative one is most appropriate but at least to the extent of this part of the question. (ii) Determination of the equilibrium values of prices and quantities: QS1 = -3 + 4P1 QS2 = -18 + 4P2 Qd1 = 4 – P1 + 1/2P2 Qd2 = 10 + P1 – P2 Equilibrium Prices: Commodity One: QS1 = Qd1 -3 + 4P1 = 4 – P1 + 1/2P2 4P1 + P1 – 1/2P2 = 4 + 3 5P1 – 1/2P2 = 7 10P1 – P2 = 14 …………………………… (i) Commodity two: QS2 = Qd2 -18 + 4P2 = 10 + P1 – P2 4P2 – P1 + P2 = 28 5P2 – P1 = 28 …………………………….. (ii) Thus, 10P1 – P2 = 14 ……………………….. (i) 5P2 – P1 = 28 ………………………… (ii) Solving by substitution is as follows: If – P1 = 28 – 5P2 Then P1 = 5P2 – 28 10P1 – P2 = 14 ……………………… (i) But P1 = 5P2 – 28 ∴10(5P2 – 28) – P2 =14 50P2 – 280 – P2 = 14 49P2 = 294

Answers-Mocks
STRATHMORE UNIVERSITY ● REVISION KIT
184
P2 = (294/49) = 6 ∴P2 =Ksh 6 10P1 – P2 = 14 …………………….(i) But P2 = 6 ∴10P1 – 6 = 14 10P1 = 20 P1 = (20/10) = 2 ∴P1 = Ksh 2 Equilibrium Quantities: Commodity One: QS1 = Qd1 QS1 = -3 + 4P1 but P1 = 2 ∴QS1 = -3 + 4(2) (-3 + 8) = 5 ∴QS1 = 5 Units Qd1 = 4 – P1 + 1/2P2 but P1 = 2 & P2 = 6 ∴Qd1 = 4 – 2 + 1/2(6) (4 – 2 + 3) = 5 ∴Qd1 = 5 units ∴QS1 = Qd1 = 5 Units. Commodity Two: QS2 = Qd2 QS2 = -18 + 4P2 but P2 = 6 ∴QS2 = -18 + 4(6) (-18 + 24) = 6 ∴QS2 = 6 Units Qd2 = 10 + P1 – P2 but P1 = 2 & P2 = 6 Qd2 = (10 + 2 – 6) = 6 ∴Qd2 = 6 units ∴QS2 = Qd2 = 6 Units. P1 = Ksh 2 P2 = Ksh 6 Q1 = 5 Units Q2 = 6 Units (b) A shift of the supply curve is caused by changes in factors other than own price of the commodity.
Supply curve can shift either upwards to the left (denoting a fall in supply) or downwards to the right (representing an increase in supply).

Comprehensive Mock Examinations
ECONOMICS
185
S1 S0 Price (P) S2 P S1 S0 S2 0 Q1 Q0 Q2 Quantity (Q) Fig 4.3: Shift of the supply curve Factors: • Cost of production (factor prices) • Government policy (taxation and subsidies) • Natural events (e.g weather) • Goals of the firm • Availability and cost of credit • Transport and communication • Prices of related products (substitutes and complements) • Technology • Future expectations • Changes in the supply of the product with which the product in question is in joint supply e.g Hides &
Beef; petrol and paraffin. • Time Question 5
(a) Some of the reasons why most developing countries (especially the Sub-Saharan African countries) have not realized the full benefits from international trade:
• Impact of economic integration – Loss of tax revenue to governments initially in form of import
duties. • The infant industry argument – dumping of foreign goods tends to reduce the industrial
development potential in the country of destination. • Similarity of products – reduces comparative advantage as specialization chances are minimal and
less rewarding in foreign exchange. • Existence of trade restrictions - perhaps the most prevalent aspect of international trade; such
restrictions take different forms eg. tariffs and quotas, which restrict the free flow of goods and services in the global market.
• Differences in the levels of economic development – to survive and cut oneself an international competitive trade image/performance, a country needs to have a high productive capacity (with high product quality standards) based on advanced and appropriate state of technology ( eg exports should be processed and done to meet international specifications). This is what is lacking in most developing countries, such that we have trade between unequals.
• Minimal trade promotions – most developing countries have yet or have established less impacting
export promotions in the global market; effective institutions have not been established abroad to make it known what is available in the export mix of developing countries etc.

Answers-Mocks
STRATHMORE UNIVERSITY ● REVISION KIT
186
• Political atmosphere – the political atmosphere in most developing countries is that of instability, which discourages productive investment; both existing and potential investors have become extra cautious and most often exercise a less than maximum portfolio selection. To invest in an export oriented venture requires large capital provision and this is what insecurity is discouraging in most developing countries.
(b) Measures:
• Increasing the budget provisions to the security/defence machinery of peace keeping missions; the sale of arms to war torn countries should be brought into focus in International Law in form of crime against humanity.
• Widening the scope of bilateral and multilateral trade agreements – specifically those seeking to open up the markets of developed countries to exports of the developing world (currently, the United States government has established the African Growth & Opportunities Act (AGOA) trade initiative which grants African textile and garment manufacturers preferential access to the US market); this is one of the ways forward.
• Creation and sustenance of investor and development partners’ confidence by maintaining structures supportive of efficient and vice-free domestic economic governance
• Enhanced credit facility access orientation – democratically elected governments tend to enjoy a wider scope of support from both citizens and development partners; STABEX funds in Kenya, for instance, should reach the intended coffee farmers without any hindrances in order to allow farmers to soundly decide, plan and control their farming activities with a view to increasing the total coffee output for export.
In addition, the government should maintain strict budget discipline by having only manageable deficits in order to avoid the punitive economic effects ( eg high interest rates, external debt crisis) arising from continued borrowing from the open market and international financial institutions like the World Bank/IMF.
• Redefining the role of governments in provision of public goods eg. physical and qualitative
infrastructure etc. • Formation of regional groupings devoid of lack of political commitment • Extensive export promotion programmes:
The Kenya National Chamber of Commerce and Industry, for instance, should upgrade its operations to world-class standards through search for markets, partners and financing information. Kenya’s entrepreneurs should be able to, for example, penetrate the Private Label Marketing Association (PLMA) which is based in Europe and represents the World’s leading supermarket chains. The rationale behind the association is to create their own brands and sell products under their own brand names, hence the need for developing countries businesses (Kenya for example) to enter into partnerships with the PLMA. Every year a number of Third World companies are selected to exhibit and display their products with a view to tapping into the Lucrative European Market. Only a few Kenyan Companies have done this; this failure is attributable to lack of guidance and awareness on how to tap into the huge EU market. Financial analysts caution that while the CDE is willing to assist, Kenyan companies must follow global trends, especially in ISO standardization, branding and advertising of their products. It’s also important for developing countries’ key export products such as Kenya’s agricultural exports of Coffee, Tea, Cashew nuts, Fish, Handicrafts and Horticulture to be aggressively branded and advertised to reap maximum benefits to the economy. Kenyan Horticulture products in the EU market, especially in London and Paris are branded and displayed in supermarkets to make it appear they are locally produced without giving any credit to their country of origin. The consumers are not aware, for example, that their cup of the superior arabica coffee come from Kenya because it will probably have a German or Swiss Label.
Comprehensive Mock Examinations
ECONOMICS
187
For far too long, Kenyan companies have concentrated on the production side and ignored branding and packaging which matters a lot to consumers in the developed world market. The Caribbean Companies selling bananas to Europe, such as Dole, have succeeded much more than the Kenyan companies selling flowers, fresh fruit and other horticultural products. Its vital that the developing countries’ chambers of commerce and industry (eg Kenya National Chamber of Commerce & Industry) be revitalized as the voice for the export – oriented business community because export – led growth will play a key role in creating wealth and alleviating poverty.
Question 6
(a) The necessary condition for profit maximization is determined at the level of output at which the marginal revenue (MR) is equal to marginal cost (MC): MC = MR level of output.
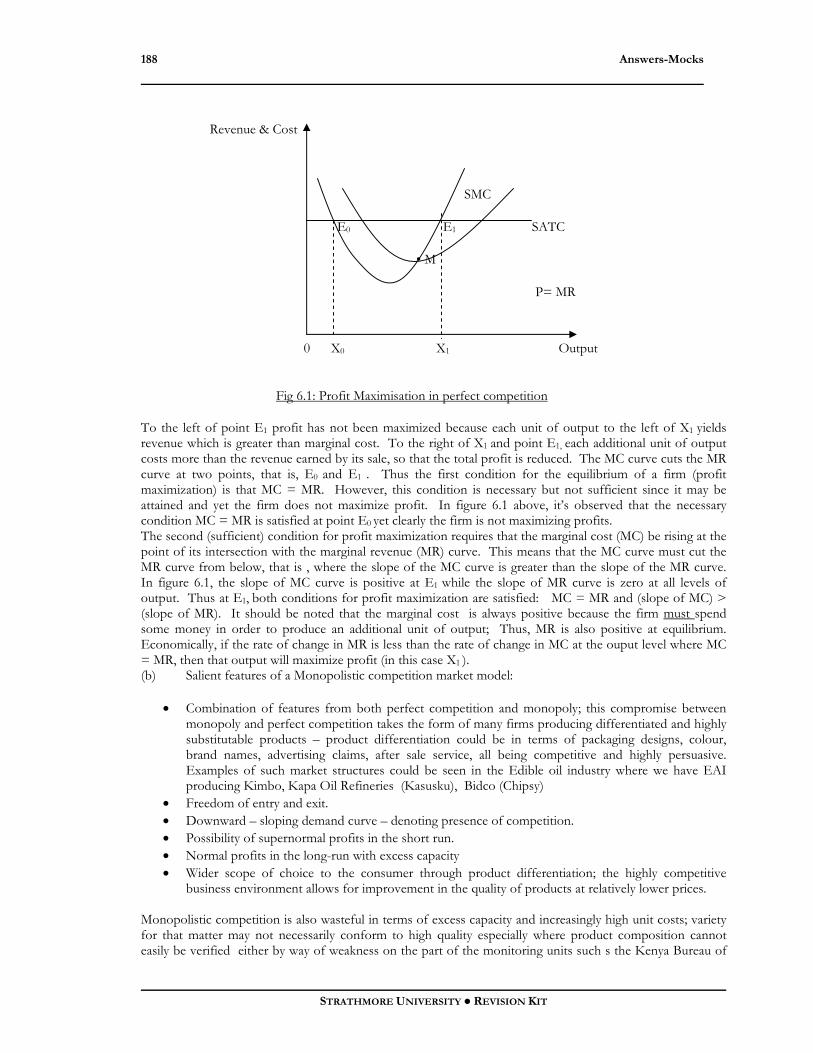
Answers-Mocks
STRATHMORE UNIVERSITY ● REVISION KIT
188
Revenue & Cost
SMC
E0 E1 SATC
• M
P= MR
0 X0 X1 Output
Fig 6.1: Profit Maximisation in perfect competition
To the left of point E1 profit has not been maximized because each unit of output to the left of X1 yields revenue which is greater than marginal cost. To the right of X1 and point E1, each additional unit of output costs more than the revenue earned by its sale, so that the total profit is reduced. The MC curve cuts the MR curve at two points, that is, E0 and E1 . Thus the first condition for the equilibrium of a firm (profit maximization) is that MC = MR. However, this condition is necessary but not sufficient since it may be attained and yet the firm does not maximize profit. In figure 6.1 above, it’s observed that the necessary condition MC = MR is satisfied at point E0 yet clearly the firm is not maximizing profits. The second (sufficient) condition for profit maximization requires that the marginal cost (MC) be rising at the point of its intersection with the marginal revenue (MR) curve. This means that the MC curve must cut the MR curve from below, that is , where the slope of the MC curve is greater than the slope of the MR curve. In figure 6.1, the slope of MC curve is positive at E1 while the slope of MR curve is zero at all levels of output. Thus at E1, both conditions for profit maximization are satisfied: MC = MR and (slope of MC) > (slope of MR). It should be noted that the marginal cost is always positive because the firm must spend some money in order to produce an additional unit of output; Thus, MR is also positive at equilibrium. Economically, if the rate of change in MR is less than the rate of change in MC at the ouput level where MC = MR, then that output will maximize profit (in this case X1 ). (b) Salient features of a Monopolistic competition market model:
• Combination of features from both perfect competition and monopoly; this compromise between monopoly and perfect competition takes the form of many firms producing differentiated and highly substitutable products – product differentiation could be in terms of packaging designs, colour, brand names, advertising claims, after sale service, all being competitive and highly persuasive. Examples of such market structures could be seen in the Edible oil industry where we have EAI producing Kimbo, Kapa Oil Refineries (Kasusku), Bidco (Chipsy)
• Freedom of entry and exit. • Downward – sloping demand curve – denoting presence of competition. • Possibility of supernormal profits in the short run. • Normal profits in the long-run with excess capacity • Wider scope of choice to the consumer through product differentiation; the highly competitive
business environment allows for improvement in the quality of products at relatively lower prices. Monopolistic competition is also wasteful in terms of excess capacity and increasingly high unit costs; variety for that matter may not necessarily conform to high quality especially where product composition cannot easily be verified either by way of weakness on the part of the monitoring units such s the Kenya Bureau of
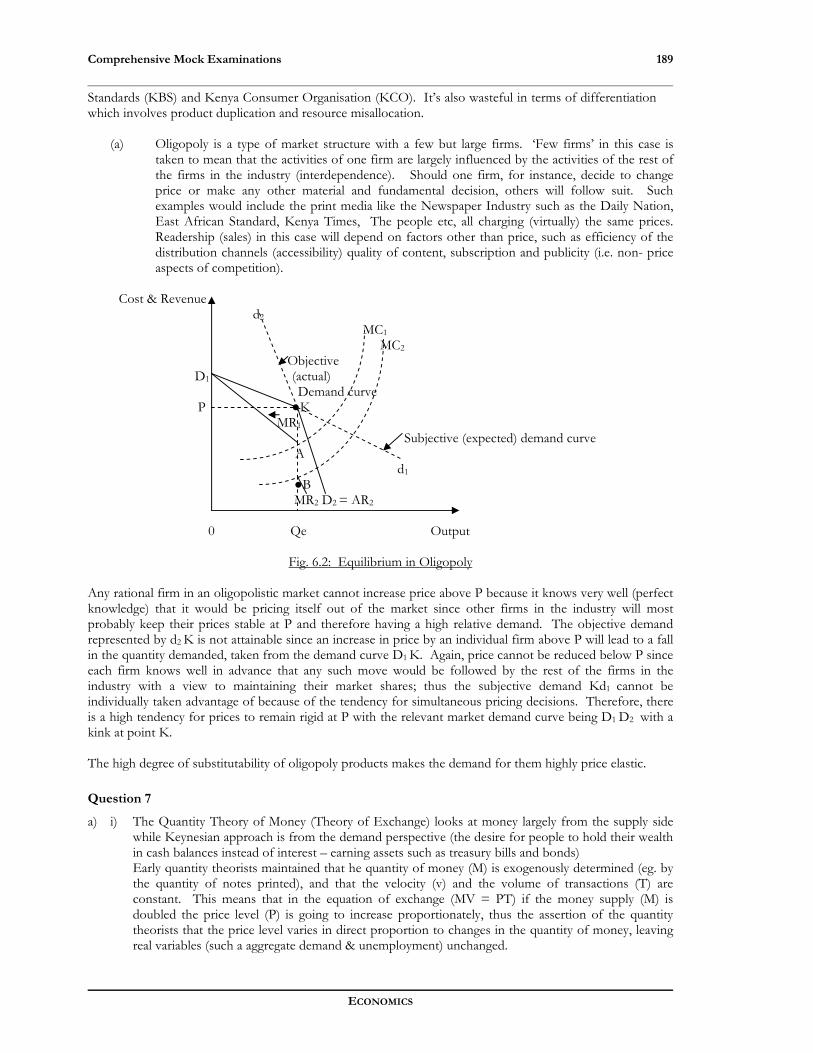
Comprehensive Mock Examinations
ECONOMICS
189
Standards (KBS) and Kenya Consumer Organisation (KCO). It’s also wasteful in terms of differentiation which involves product duplication and resource misallocation.
(a) Oligopoly is a type of market structure with a few but large firms. ‘Few firms’ in this case is taken to mean that the activities of one firm are largely influenced by the activities of the rest of the firms in the industry (interdependence). Should one firm, for instance, decide to change price or make any other material and fundamental decision, others will follow suit. Such examples would include the print media like the Newspaper Industry such as the Daily Nation, East African Standard, Kenya Times, The people etc, all charging (virtually) the same prices. Readership (sales) in this case will depend on factors other than price, such as efficiency of the distribution channels (accessibility) quality of content, subscription and publicity (i.e. non- price aspects of competition).
Cost & Revenue d2 MC1 MC2 Objective D1 (actual) Demand curve P ●K MR1 Subjective (expected) demand curve A d1 ●B MR2 D2 = AR2 0 Qe Output
Fig. 6.2: Equilibrium in Oligopoly Any rational firm in an oligopolistic market cannot increase price above P because it knows very well (perfect knowledge) that it would be pricing itself out of the market since other firms in the industry will most probably keep their prices stable at P and therefore having a high relative demand. The objective demand represented by d2 K is not attainable since an increase in price by an individual firm above P will lead to a fall in the quantity demanded, taken from the demand curve D1 K. Again, price cannot be reduced below P since each firm knows well in advance that any such move would be followed by the rest of the firms in the industry with a view to maintaining their market shares; thus the subjective demand Kd1 cannot be individually taken advantage of because of the tendency for simultaneous pricing decisions. Therefore, there is a high tendency for prices to remain rigid at P with the relevant market demand curve being D1 D2 with a kink at point K. The high degree of substitutability of oligopoly products makes the demand for them highly price elastic. Question 7
a) i) The Quantity Theory of Money (Theory of Exchange) looks at money largely from the supply side while Keynesian approach is from the demand perspective (the desire for people to hold their wealth in cash balances instead of interest – earning assets such as treasury bills and bonds) Early quantity theorists maintained that he quantity of money (M) is exogenously determined (eg. by the quantity of notes printed), and that the velocity (v) and the volume of transactions (T) are constant. This means that in the equation of exchange (MV = PT) if the money supply (M) is doubled the price level (P) is going to increase proportionately, thus the assertion of the quantity theorists that the price level varies in direct proportion to changes in the quantity of money, leaving real variables (such a aggregate demand & unemployment) unchanged.
Answers-Mocks
STRATHMORE UNIVERSITY ● REVISION KIT
190
By keeping the velocity of money constant, money appears as a technical input to spending, that is, a certain quantity of money is required per unit of spending; there is no indication that the velocity of circulation of money might be affected by the decisions of people themselves to hold money. The Keynesian view, however, maintains that the more people tend to want to keep their wealth in liquid form (eg. cash and cheques/current/sight accounts) rather than time deposits or long-term loans, the smaller the proportion of the existing stock of money that can be lent out by financial institutions to be spent by borrowers. Thus, the more people wish to hold reserves of liquidity in money balances the lower will tend to be the velocity of circulation of money. Keynes argued in the General Theory of Employment, Interest and Money (1936) that velocity (V) can be unstable as money shifts in and out of ‘idle’ money balances reflecting changes in people’s liquidity preference. The supply of money is exogenously determined by the monetary authority and therefore interest – inelastic, and what actually causes changes in real economic variables is the frequency of change in the velocity of money an argument which the Quantity Theory of money doesn’t recognize, since it holds constant the velocity of money (V). Other than for transactions purposes, Keynes argued that the demand for money depends on the wave of pessimism concerning real world prospects which could precipitate a ‘retreat into liquidity’ as people seek to increase their money holdings. This increase in money holding would lower the velocity of circulation of money and thus aggregate demand would fall bringing about economic recession. The demand for money, according to Keynes, is for three motives: transactions, precautionary and speculative motives, arguing that the demand for money is positively related to income and negatively related to interest rate, which should not fall below the investors’ normal rate of interest.
ii) M = 500
V = 8 P = 2 MV = PT 500(8) = 2T T = (4,000) = 2000 2 PT = the money value of all transactions in the economy and therefore represents the nominal value of output. ∴ PT = (2 x 2000) = 4000
b) Factors determining the rate of interest in an economy: • Credit Management performance standards – eg by banks and other financial institutions. Credit
management efficiency levels determine the size of non-performing loans and bad debts, which tend to force banks and other lending institutions to readjust and try to cushion themselves with revision of interest rates on new loan agreements.
• Size of government budget deficit – budget deficits necessitates government borrowing from the open market through manipulation of the treasury bill rates; treasury bill rate is usually used by commercial banks as a benchmark to determine their base lending rates.
• Demand for and supply of loanable funds • Inflationary tendencies – direction of change in the average level of prices. • Availability of off shore lines of credit – determines the rate of interest charged by domestic lenders.
Comprehensive Mock Examinations
ECONOMICS
191
• Exchange rate variation – lenders with off shore lines of credit, for instance, (for the purposes of lending domestically) and who have to repay in hard currencies, will have to adjust upwards their interest rates whenever the domestic currency depreciates.
c) Some of the consequential economic impacts of high and rising interest rates: • Increased cost of public debt servicing – redemption of treasury bills and bonds by the government
involves paying back the principle sum plus interest. • Non-performing loans/bad debts arising from existing loan agreements. This tends to cripple the
liquidity status of institutions, leading to cash flow crisis and possibly of a complete collapse. We have seen in Kenya the Central Bank imposing statutory management of some commercial banks with a view to reviving them; with some of these banks being liquidated where revival trials fail. A bank collapse means a lot in terms of loss of deposits of those with accounts, unemployment, tax revenue to the government etc.
• Disincentive to investment – increase in interest rate increases the cost of capital hence reducing capital formation, growth and development.
• Inflationary tendencies – a rise in interest rates tends to increase the general level of prices of goods and services, leading to reduced purchasing power and welfare standards.
• Rationalization of business operations with a view to cutting costs – one of the options taken is to retrench workers (the order of the day in Kenya), again increasing the general level of unemployment, poverty and purchasing power (effective demand)
• Credit squeeze – high and rising interest rates reduces the ability of banks and other financial institutions to create more credit (advance new loans from deposits net of the cash-ratio requirement) since the demand for loanable funds decreases.
Question 8
(a) (i) PX = 30 PY = 20 I = 12000 Ratio of income between X and Y 1: 1 Budget constraint : I = PX QX + PY QY 12000 = 30QX + 20QY Computation of the budget line extreme quantities of X & Y: At Y = 0, X = I/PX = (12000) = 400 units 30 At X = 0, Y = I/PY = (12000) = 600 units 20 Computation of consumer equilibrium (utility maximizing) quantities of X & Y: indifference curve: Ratio of income is 6000: 6000 X = I/PX = (6000) = 200 units 30 Y = I/PY = (6000) = 300 units

Answers-Mocks
STRATHMORE UNIVERSITY ● REVISION KIT
192
Units of Y (QY )
1200 A1 1000 800 600 A ●e2 U2 400 e1 300 U1 200 0 200 B 600 B1 1000 1200 Units of X (QX ) 400 800
Fig 8.1: Consumer equilibrium
(ii) PX = 30 PY = 20 I = 24000 Ratio 1:1 ⇒ 12000: 12000 Budget constraint: 24000 = 30QX + 20QY Budget line:
At Y = 0, X = (24000) = 800 units 30
At X = 0, Y = (24000) = 1200 units 20 Indifference Curve: X = (12000) = 400 units 30 Y =(12000) = 600 units 20 NB: Where X and Y are perfect complementary goods (as may be implied by the proportionate
consumption), the relevant indifference curves U1 and U2 would be right angled (L-shaped) at the equilibrium points e1 and e2 .
(b) (i) An inferior good is that good whose consumption is due to the consumer’s inability to afford close substitutes. When income increases (even with a price fall) the demand for such goods will reduce as consumers now go for close substitutes eg. vegetable products like sukuma wiki.
A giffen good, on the other hand, is that whose consumption takes a substantial portion of Consumer’s income so that given a price fall (and therefore an increase in real income) consumers will not buy more than before eg. salt. A fall in price of a giffen good implies that some of
the household’s money income has been freed with which they can now buy more superior goods while buying less of the giffen good. It then follows that all giffen goods are
inferior but not all inferior goods are giffen.

Comprehensive Mock Examinations
ECONOMICS
193
(ii) Substitution effect is the change in the quantity demanded of a commodity due to change in the relative prices of the commodities, real income of the consumer remaining constant. Income effect refers to the change in the quantity demanded of a commodity arising from change in real income (purchasing power of money income) relative prices remaining constant. An inferior good is one whose consumption is due to the inability of the consumer to afford close substitutes; consumption of inferior goods decreases with increase in income. Commodity Y where: A I1 I2 : Indifference curves AB, AB1 : Budget lines A1 B2 : Compensating variation budget line A1 B2 // AB1 A1 M: Substitution effect Y2 ● C2 N: Income effect Y0 ●C0 I2 M>N Y1 ●C1 I1 ↔ ↔ M N
0 X0 X2X1 B B2 B1 Commodity X
Fig 8.1: Income and substitution effects of a price fall for an inferior good
The initial consumer equilibrium is at point C0 with X0 units of commodity X and Y0 units of commodity Y. A fall in price of commodity X has an effect of rotating the budget line outwards from AB to AB1. . This is due to the total price effect which involves both income and substitution effects. To be able to distinguish between the impact of change in real income (income effect) and that of substitution (substitution effect) on the quantity demanded, a compensating variation budget line A1 B2
tangent to the original indifference curve I1 at point C1 and parallel to the budget line AB1 is introduced, on the assumption that accompanying the price fall is a compensating variation of money income (eg. an upward adjustment of tax or reduction of a subsidy) such that the real income of the consumer remains unchanged (income effect is held constant) and thereby enabling for the isolation and estimation of the impact of substitution (substitution effect) of a price fall, represented by the movement from consumer equilibrium C0
to C1 that is X0 X2 of X on the X-axis. However, the compensating variation is a device which enables the isolation of the substitution effect, but does not show the ultimate equilibrium of the consumer. This ultimate equilibrium is determined by the nature of the commodity whose price has changed (fallen in this case) i.e. normal, inferior or giffen. For an inferior good, less is demanded (commodity X) as the purchasing power increases due to the price fall, although the substitution effect still remains positive. Nevertheless, for most inferior goods the negative income effect will more than offset the positive substitution effect so that the total price effect will be negative. Again, although the income effect of most inferior goods is negative, there may still be a positive substitution effect stronger enough to allow for a downward sloping (normal) demand curve. Thus the positive substitution effect is in most cases adequate for establishing the law of demand; but where the income effect is negative and very strong the law of demand does not hold (instead we have a regressive demand curve). In figure 8.1 the income effect of the price fall is represented by (X2 X1 ) units of commodity X and the substitution effect is given by ( X0 X2 ) units of commodity X. The negative income effect of the price fall moves the ultimate consumer equilibrium to C2
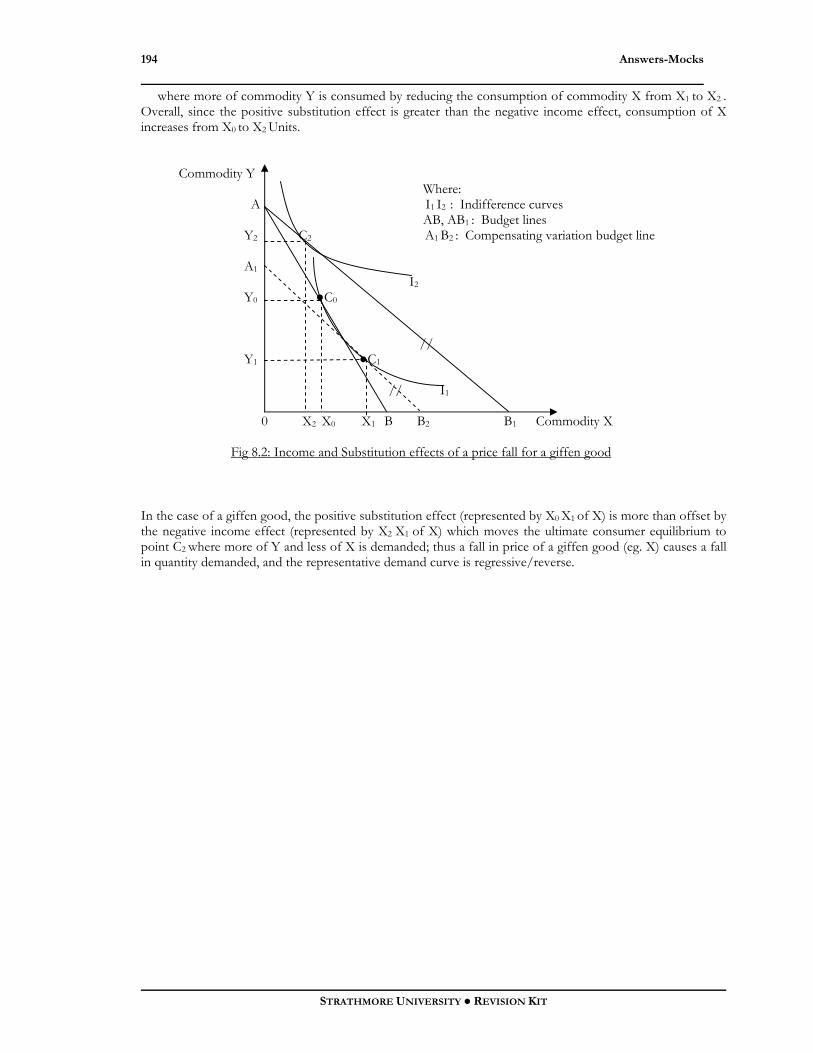
Answers-Mocks
STRATHMORE UNIVERSITY ● REVISION KIT
194
where more of commodity Y is consumed by reducing the consumption of commodity X from X1 to X2 . Overall, since the positive substitution effect is greater than the negative income effect, consumption of X increases from X0 to X2 Units. Commodity Y Where: A I1 I2 : Indifference curves AB, AB1 : Budget lines Y2 C2 A1 B2 : Compensating variation budget line A1 I2 Y0 ●C0 // Y1 ●C1 // I1 0 X2 X0 X1 B B2 B1 Commodity X
Fig 8.2: Income and Substitution effects of a price fall for a giffen good
In the case of a giffen good, the positive substitution effect (represented by X0 X1 of X) is more than offset by the negative income effect (represented by X2 X1 of X) which moves the ultimate consumer equilibrium to point C2 where more of Y and less of X is demanded; thus a fall in price of a giffen good (eg. X) causes a fall in quantity demanded, and the representative demand curve is regressive/reverse.

Comprehensive Mock Examinations
ECONOMICS
195
PAPER THREE
QUESTION 1
(a) There are basically three methods of measuring National Income:
• Income approach • Expenditure approach • Output/Value Added approach • The Income Approach:
Each time something is produced and sold someone obtains income from those activities/transactions. More precisely, each unit of expenditure will find its way partly into wages/salaries, profits, interest and rents. Income earned for purposes other than rewards for producing goods and providing services are ignored i.e. transfer payments such as unemployment benefits, pension and grants to students, which if included would lead to double counting. All factor incomes are summed up including the estimated value of earnings in kind (such as the market value of rent-free housing) and subsistence income. These incomes are in the form of employment income (including self employment), profits of private companies and public enterprises, interest on capital and rent on land and buildings. The sum of these incomes give the Gross Domestic Income (which is an equivalent of Gross Domestic Product). To Gross Domestic Income we add the net property Income from abroad (the difference between what foreigners earn at home and what nationals earn abroad). This gives Gross National Income (GNI) from which capital consumption (depreciation) is deducted to arrive at the Net National Income (NNI).
• The Expenditure Approach:
This method centers on the component of the final product demand which generates production. It thus measures (GDP) as the sum total expenditure on final goods and services produced/rendered in an economy, and is given by the national expenditure equation: Y ≡ E = C + I + G + (X – m) where C: Private consumption expenditure I: Expenditure by investors (Investment expenditure) G: Government expenditure on goods and services (such as health, education, general administration
including Law and Order) provided by the government to the public – usually referred to as the public consumption expenditure. This component (G) excludes transfer payments such as unemployment benefits. Instead, its taken as a measure of the value of the services provided by the center (including Local Governments), and public authorities.
(X – M): Expenditure on exports less expenditure on imports and its value is often negative for most
developing countries. Under this approach, expenditure on financial assets such as bonds and shares an on second hand goods should be excluded as they do not involve any new output.
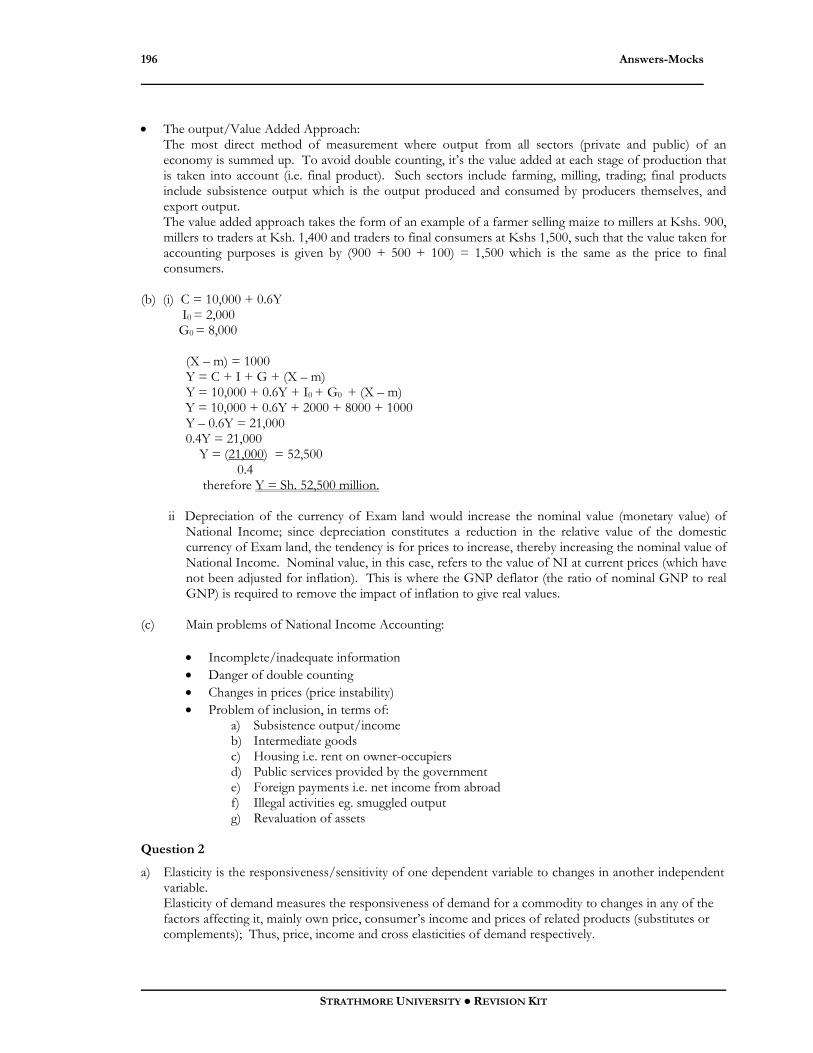
Answers-Mocks
STRATHMORE UNIVERSITY ● REVISION KIT
196
• The output/Value Added Approach:
The most direct method of measurement where output from all sectors (private and public) of an economy is summed up. To avoid double counting, it’s the value added at each stage of production that is taken into account (i.e. final product). Such sectors include farming, milling, trading; final products include subsistence output which is the output produced and consumed by producers themselves, and export output. The value added approach takes the form of an example of a farmer selling maize to millers at Kshs. 900, millers to traders at Ksh. 1,400 and traders to final consumers at Kshs 1,500, such that the value taken for accounting purposes is given by (900 + 500 + 100) = 1,500 which is the same as the price to final consumers.
(b) (i) C = 10,000 + 0.6Y I0 = 2,000 G0 = 8,000 (X – m) = 1000 Y = C + I + G + (X – m) Y = 10,000 + 0.6Y + I0 + G0 + (X – m) Y = 10,000 + 0.6Y + 2000 + 8000 + 1000 Y – 0.6Y = 21,000 0.4Y = 21,000 Y = (21,000) = 52,500 0.4 therefore Y = Sh. 52,500 million. ii Depreciation of the currency of Exam land would increase the nominal value (monetary value) of
National Income; since depreciation constitutes a reduction in the relative value of the domestic currency of Exam land, the tendency is for prices to increase, thereby increasing the nominal value of National Income. Nominal value, in this case, refers to the value of NI at current prices (which have not been adjusted for inflation). This is where the GNP deflator (the ratio of nominal GNP to real GNP) is required to remove the impact of inflation to give real values.
(c) Main problems of National Income Accounting:
• Incomplete/inadequate information • Danger of double counting • Changes in prices (price instability) • Problem of inclusion, in terms of:
a) Subsistence output/income b) Intermediate goods c) Housing i.e. rent on owner-occupiers d) Public services provided by the government e) Foreign payments i.e. net income from abroad f) Illegal activities eg. smuggled output g) Revaluation of assets
Question 2
a) Elasticity is the responsiveness/sensitivity of one dependent variable to changes in another independent variable. Elasticity of demand measures the responsiveness of demand for a commodity to changes in any of the factors affecting it, mainly own price, consumer’s income and prices of related products (substitutes or complements); Thus, price, income and cross elasticities of demand respectively.

Comprehensive Mock Examinations
ECONOMICS
197
(Own) price elasticity of demand: defined as a measure of the degree of the responsiveness of quantity
demanded of a commodity to changes in own price; its given by the ratio of the percentage or proportionate change in quantity demanded to the percentage or proportionate change in own price of the commodity i.e.
% change in quantity demanded or ∆Q • P % change in own price ∆P Q
Its usually negative for normal goods (positive for inferior goods) and can either be elastic, inelastic, perfectly elastic perfectly inelastic or unitary. Its elastic where a small change in price causes a more than proportionate change in quantity demanded; inelastic where change in price causes a less than proportionate change in quantity demanded; unitary where change in price results into a proportionate change in quantity demanded – in which case, the price elasticity absolute values are greater than one, less than one and equal to one respectively.
Diagrammatic illustrations may be drawn/shown Own price elasticity of demand is determined by factors such as the nature of the commodity, availability of substitutes, durability, number of uses, possibility for postponed use, proportion of income spent.
Income elasticity of demand is a measure of the degree of responsiveness of demand to changes in consumers’ income; expressed as the ratio of the percentage/proportionate change in quantity demanded to the percentage/proportionate change in consumers’ income i.e. % change in quantity demanded or ∆Q • Y % change in consumer’s income ∆Y Q
where Y represents income. This ratio is positive for normal goods and negative for inferior goods. Income elasticity of demand is determined by the stage of economic development and the nature of the commodity.
Cross elasticity of demand is a measure of the degree of the responsiveness of the quantity demanded of one commodity to changes in the price of another related commodity, either a close substitute or complement. Its expressed as the ratio of the percentage/proportionate change in the quantity demanded of one commodity to the percentage/proportionate change in price of another related commodity i.e.
% change in quantity demanded of commodity A or ∆QA • PB % change in price of a related commodity B ∆PB QA
The above ratio is positive for substitutes and negative for complementary goods as illustrated below:
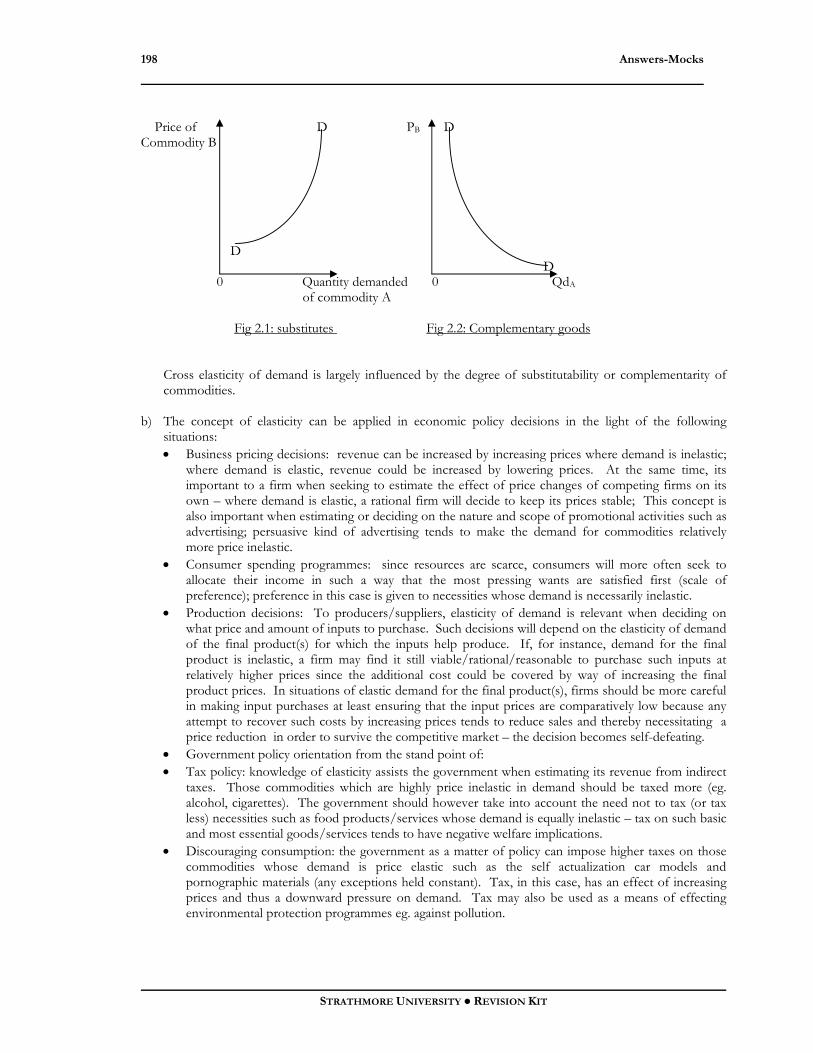
Answers-Mocks
STRATHMORE UNIVERSITY ● REVISION KIT
198
Price of D PB D Commodity B D D 0 Quantity demanded 0 QdA of commodity A Fig 2.1: substitutes Fig 2.2: Complementary goods
Cross elasticity of demand is largely influenced by the degree of substitutability or complementarity of commodities.
b) The concept of elasticity can be applied in economic policy decisions in the light of the following situations: • Business pricing decisions: revenue can be increased by increasing prices where demand is inelastic;
where demand is elastic, revenue could be increased by lowering prices. At the same time, its important to a firm when seeking to estimate the effect of price changes of competing firms on its own – where demand is elastic, a rational firm will decide to keep its prices stable; This concept is also important when estimating or deciding on the nature and scope of promotional activities such as advertising; persuasive kind of advertising tends to make the demand for commodities relatively more price inelastic.
• Consumer spending programmes: since resources are scarce, consumers will more often seek to allocate their income in such a way that the most pressing wants are satisfied first (scale of preference); preference in this case is given to necessities whose demand is necessarily inelastic.
• Production decisions: To producers/suppliers, elasticity of demand is relevant when deciding on what price and amount of inputs to purchase. Such decisions will depend on the elasticity of demand of the final product(s) for which the inputs help produce. If, for instance, demand for the final product is inelastic, a firm may find it still viable/rational/reasonable to purchase such inputs at relatively higher prices since the additional cost could be covered by way of increasing the final product prices. In situations of elastic demand for the final product(s), firms should be more careful in making input purchases at least ensuring that the input prices are comparatively low because any attempt to recover such costs by increasing prices tends to reduce sales and thereby necessitating a price reduction in order to survive the competitive market – the decision becomes self-defeating.
• Government policy orientation from the stand point of: • Tax policy: knowledge of elasticity assists the government when estimating its revenue from indirect
taxes. Those commodities which are highly price inelastic in demand should be taxed more (eg. alcohol, cigarettes). The government should however take into account the need not to tax (or tax less) necessities such as food products/services whose demand is equally inelastic – tax on such basic and most essential goods/services tends to have negative welfare implications.
• Discouraging consumption: the government as a matter of policy can impose higher taxes on those commodities whose demand is price elastic such as the self actualization car models and pornographic materials (any exceptions held constant). Tax, in this case, has an effect of increasing prices and thus a downward pressure on demand. Tax may also be used as a means of effecting environmental protection programmes eg. against pollution.

Comprehensive Mock Examinations
ECONOMICS
199
• Protectionism: Its in the interest of most governments to protect their domestic industries against unfavourable external competition (largely because of the state of unequal footing between domestic and foreign industries producing virtually the same or close substitute products) by imposing tariffs on imports. This policy can only be effective where the domestic demand for both local and foreign substitutes is highly price elastic; this way, an increase in import prices by the amount of tariff should be sufficient to deter or discourage domestic demand for them, at least in favour of domestic substitutes (assuming that the quality and other buyer benefits or factors are held constant).
• Price controls/minimum wage guidelines: Depending on the nature of an economy, minimum wage legislations can be effective only where the demand for labour (in the labour market) is highly inelastic; If elastic, any attempt to set a minimum wage will be met by a drastic fall in demand for labour hence unemployment, a situation which makes job seekers much more willing to accept lower wages, rendering the legislation ineffective.
• Regulation of farmers’ income especially during bumper harvest – demand should be inelastic otherwise the government will be forced to buy and store or even dispose of the surplus to external markets (dumping). This depends on the nature of the commodity (perishable or durable) and the ability of the government to pay farmers promptly (eg 1994/1995 maize bumper harvest in Kenya)
• Devaluation policy: reducing the relative value of a domestic currency i.e. making it cheaper in terms of another (foreign) currency. This has an effect of making exports cheaper and imports relatively expensive, the aim being to encourage (increase) exports and discourage (reduce) imports so as to improve the country’s balance of payments (BOP) position. This policy is effective only when demand for both imports and exports is highly price elastic.
Knowledge of elasticity is also relevant in the event of:
• Price discrimination: market segmentation where more is supplied/sold in the price elastic than
inelastic markets and charging lower and higher prices respectively. • Shifting the tax burden: It is possible to shift the indirect tax burden to the consumer where
demand is price inelastic. • Production of commodities whose income elasticity of demand is positive and high eg. TV’s,
cars etc.
QUESTION 3
a) Monetary policy refers to the manipulation of money supply, liquidity and interest rates in the economy in order to achieve increased employment, economic growth, reduced inflation and improved balance of payments.
b) Monetary policy works through the intermediary of monetary policy instruments such as the bank rate, open market operations (OMO), variable reserve requirement (cash and liquidity ratios), funding, marginal requirement, selective credit control and moral suasion . This policy relates mostly to credit control which is the control of the lending capacity of commercial banks and other financial institutions. Monetarists largely content that inflation is caused by a prior increase in money stock, and therefore to control inflation, the growth of money supply must first be controlled.
Instrument of Monetary policy:
- The Bank rate:- During inflation, for instance, money supply should be reduced. This could be
achieved by way of increasing the bank rate ( the rate at which commercial banks borrow from the Central Bank) to discourage borrowing by Commercial banks from the Central Bank and by the public from commercial banks (since an increase in the bank rate translates into higher commercial banks lending rates to individuals or corporates). The Central Bank could increase money supply by reducing the bank rate and thereby reducing the interest rates charged by commercial banks to the public.
Answers-Mocks
STRATHMORE UNIVERSITY ● REVISION KIT
200
- Open Market Operations (OMO):- During inflation, the government sells its securities (such as
treasury bills and bonds) in the stock exchange market (money market) which has an effect of reducing the amount of money in circulation (held by the public and commercial banks). If however, the government wishes to stimulate the aggregate demand (by increasing money supply) the decision should be to buy back the securities from the public/commercial banks; this increases the lending capacity of commercial banks and the purchasing power of the public.
- Variable Reserve Requirement (VRR):- This instrument involves the cash and liquidity ratios, taken as
a proportion of total deposits in cash and liquid forms, respectively. Money supply can be increased (decreased) by reducing (increasing) these ratios, depending on the economic objectives of the Monetary Authorities.
- Funding:- This is the conversion of short-term debt agreement into long-term. The government
could be having budget deficits which it wants to control at manageable levels, and feels that it cannot afford to honour its short-term repayment obligations as they fall due. Moreover, this decision also has an effect of reducing the present money supply level although its going to be expensive servicing such long-term debts in future, in terms of high interest rates.
c) In developing countries like Kenya, the open market operations (OMO) are not quite virtually
effective in controlling money supply. The main reason for this is the less developed money and capital markets, and the limited quantity and range of financial assets (securities, etc) held in the country which the Monetary Authority can buy or sell in order to increase or decrease cash holdings with the public. Sometimes, commercial banks are less sensitive to changes in their cash base. Partly, this is because they have, since the development of independent monetary system, found themselves with excess liquidity, especially due to the scarcity of good/viable projects and credit – worthy borrowers to whom they could lend. The other reason could be that such commercial banks are branches of foreign banks to which they can turn for more funds whenever their lending capacity is considerably reduced by the monetary authorities. This reduces the ability of the monetary authorities to control inflation by reducing money supply. The bank rate is less effective in most developing countries for a variety of reasons such as the limited range of liquid financial assets. Even if interest rates are successfully raised (or lowered), the effect on investment may be limited. Public sector investment is not likely to be very sensitive to changes in interest rates. For local private entrepreneurs who find it difficult to get access to capital, availability of credit may be more important than its cost/price. The greater emphasis on development is likely to reduce the role played by the rate of interest, which has been kept low and stable by most developing countries in order to encourage capital formation. Moreover, development objectives have generally involved making credit available on concessionary terms to sectors like manufacturing and agricultural small-holders, further reducing the scope of the impact of the interest rate policy. In the case of variable reserve requirement, increased liquidity may still be offset in part if commercial banks have access to external lines of credit from partners or their parent companies. Its also possible that a variable reserve asset ratio is likely to be much more useful in restricting the expansion of credit and of the money supply than in expanding it; if there is a chronic shortage of credit-worthy borrowers and desirable (viable ) investment projects, reducing the required liquidity ratio of the banks may simply leave them with surplus liquidity and not cause them to expand credit. Similarly, if banks have substantial cash balances (reserves) the change in the statutory cash ratio required may have to be very large. Funding may be effective in controlling liquidity. However, its expensive since the rate of interest on long-term debt is usually much higher than on short-term loans. Considerable funding of debts might therefore have undesirable effect of increasing long-term interest rates and inflationary tendencies. Governments should therefore try as much as possible to maintain strict budget discipline to avoid frequent debt conversions whose long-term financing militates against efficient and effective discharge of government functions.
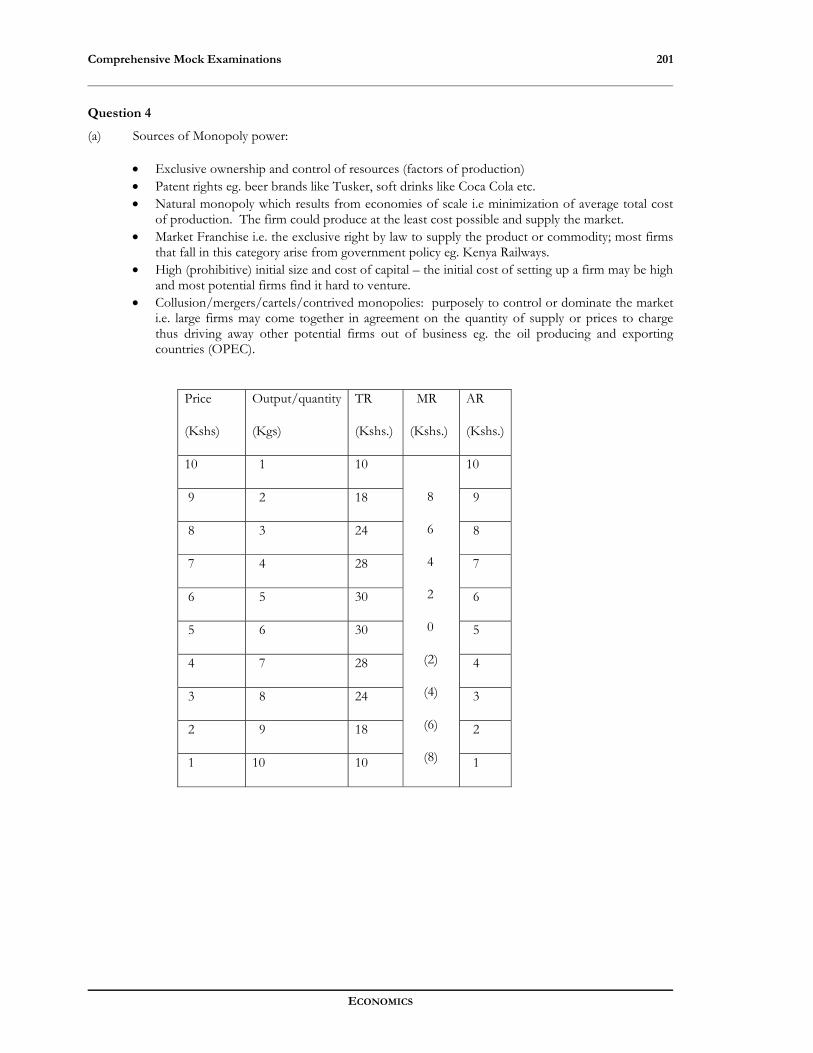
Comprehensive Mock Examinations
ECONOMICS
201
Question 4
(a) Sources of Monopoly power:
• Exclusive ownership and control of resources (factors of production) • Patent rights eg. beer brands like Tusker, soft drinks like Coca Cola etc. • Natural monopoly which results from economies of scale i.e minimization of average total cost
of production. The firm could produce at the least cost possible and supply the market. • Market Franchise i.e. the exclusive right by law to supply the product or commodity; most firms
that fall in this category arise from government policy eg. Kenya Railways. • High (prohibitive) initial size and cost of capital – the initial cost of setting up a firm may be high
and most potential firms find it hard to venture. • Collusion/mergers/cartels/contrived monopolies: purposely to control or dominate the market
i.e. large firms may come together in agreement on the quantity of supply or prices to charge thus driving away other potential firms out of business eg. the oil producing and exporting countries (OPEC).
Price
(Kshs)
Output/quantity
(Kgs)
TR
(Kshs.)
MR
(Kshs.)
AR
(Kshs.)
10 1 10
8
6
4
2
0
(2)
(4)
(6)
(8)
10
9 2 18 9
8 3 24 8
7 4 28 7
6 5 30 6
5 6 30 5
4 7 28 4
3 8 24 3
2 9 18 2
1 10 10 1
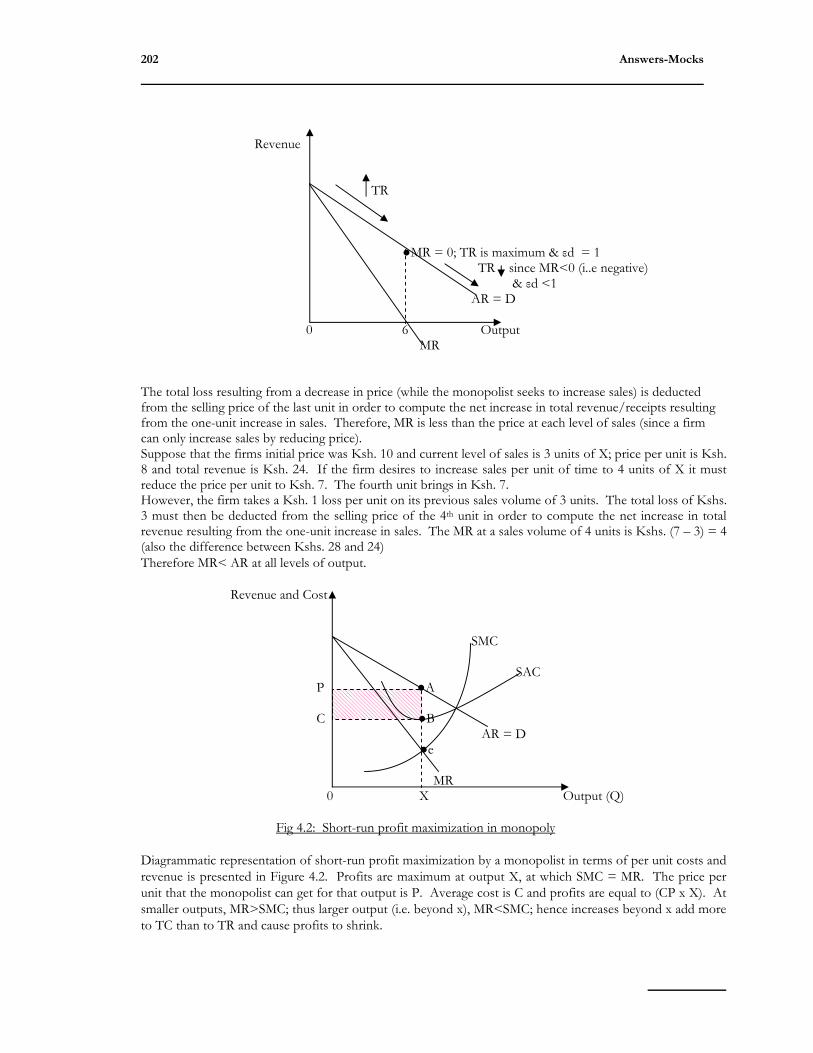
Answers-Mocks
STRATHMORE UNIVERSITY ● REVISION KIT
202
Revenue TR ●MR = 0; TR is maximum & εd = 1 TR since MR<0 (i..e negative) & εd <1 AR = D 0 6 Output MR The total loss resulting from a decrease in price (while the monopolist seeks to increase sales) is deducted from the selling price of the last unit in order to compute the net increase in total revenue/receipts resulting from the one-unit increase in sales. Therefore, MR is less than the price at each level of sales (since a firm can only increase sales by reducing price). Suppose that the firms initial price was Ksh. 10 and current level of sales is 3 units of X; price per unit is Ksh. 8 and total revenue is Ksh. 24. If the firm desires to increase sales per unit of time to 4 units of X it must reduce the price per unit to Ksh. 7. The fourth unit brings in Ksh. 7. However, the firm takes a Ksh. 1 loss per unit on its previous sales volume of 3 units. The total loss of Kshs. 3 must then be deducted from the selling price of the 4th unit in order to compute the net increase in total revenue resulting from the one-unit increase in sales. The MR at a sales volume of 4 units is Kshs. (7 – 3) = 4 (also the difference between Kshs. 28 and 24) Therefore MR< AR at all levels of output.
Revenue and Cost SMC SAC P ●A C ●B AR = D ●e MR 0 X Output (Q)
Fig 4.2: Short-run profit maximization in monopoly
Diagrammatic representation of short-run profit maximization by a monopolist in terms of per unit costs and revenue is presented in Figure 4.2. Profits are maximum at output X, at which SMC = MR. The price per unit that the monopolist can get for that output is P. Average cost is C and profits are equal to (CP x X). At smaller outputs, MR>SMC; thus larger output (i.e. beyond x), MR<SMC; hence increases beyond x add more to TC than to TR and cause profits to shrink.

Comprehensive Mock Examinations
ECONOMICS
203
Revenue & Cost SMC SAC
AVC C ●B
P ●A ●e AR = D MR 0 X Output (Q)
Fig 4.3: Short-run loss minimization in monopoly
There is a common misconception that a monopolist always makes profits. Whether or not this is so always depends on the relationship between the market demand curve faced by the monopolist and the cost conditions. The monopolist may incur losses in the short-run and like the purely competitive firm, continue to produce if the price more than covers average variable costs. In figure 4.3, the monopolist’s costs are so high and the market so small that at no output will the price cover average costs. Losses are minimum provided the price is greater than the average variable costs, at output X, at which SMC = MR. Losses are equal to (PC x X). Another common misconception is that the demand curves, with the exception of those faced by firms under conditions of pure competition, range from highly elastic toward their upper ends to highly inelastic toward their lower ends and cannot be said to be either elastic or inelastic. They are usually both, depending on the sector of the demand curve under consideration. The output that maximizes a monopolists profits will always be within the elastic sector of the demand curve if there are any costs of production. Marginal Cost is always positive; therefore, at the output at which MC = MR, MR must also be positive. If it is positive, then the elasticity of demand must be greater than one. NB: A monopolist continues production at a loss in the short-run as long as its covering its average variable cost (AVC), that is, so long as AR>AVC: shown in the diagram. Question 5
(a) Choice, scarcity and opportunity cost:
• Scarcity being the central economic problem is defined as the inadequacy/insufficiency/inability of (economic) resources or goods and services available to satisfy them. Scarcity is therefore not the same as ‘few’ resources. Since resources are scarce (limited in supply) it implies that such resources have alternative uses and command a non-zero price; thus, scarce resources are known as economic resources and goods and services made available (produced) by utilizing such resources are referred to as economic goods and services. A resource be it land, capital, labour or entrepreneurial ability, can be put to alternative uses (used to satisfy a variety of human wants)

Answers-Mocks
STRATHMORE UNIVERSITY ● REVISION KIT
204
eg. in terms of land, a plot can be used for various purposes with a view to satisfying wants on it, one can construct residential houses, commercial buildings, an educational center or farming.
• Choice is (may be) defined as the power of discretion that is the ability and freedom to select from alternatives; choice arises due to scarcity of resources with such resources having alternative uses and therefore cannot satisfy all human wants pertaining to them at the same time. Choice is made between alternatives depending on scale of preference which differ between an individual consumer, producer (firm/investor) or government determined by the view to maximize satisfaction, return and equity on provision (especially) of public and merit goods respectively. A rational consumer chooses those goods (and services) from which maximum satisfaction is derived; for an investor, choice is made of those ventures which yield the highest possible return at least costs; a government that embraces the dictates of good governance would seek to ensure equity in distribution of resources by prioritizing between alternatives, for instance choosing to spend more on public and merit goods (such as defence/law and order and education and health respectively).
• Opportunity cost of an action is the value of the benefit expected from the next best foregone alternative. It’s a derivative concept which arises due to the scarcity of resources (for production) or goods and services (for consumption) which necessitates the making of choice between competing alternative uses where more of a commodity is produced or consumed by reducing the production or consumption of another. From the standpoint of an entrepreneurial ability, the opportunity cost of deciding to organize land, labour and capital in the manufacture of fertilizer in a factory is the value of organizing the same resources in establishing and running a (private) school; the opportunity cost of choosing to be a doctor is the value of the benefit forgone by not being a lawyer.
A CPA course student could have Ksh. 200 and requires both economics and FA1 text books, each costing Kshs. 200. This amount (Kshs. 200) is certainly not enough (such that the two items are mutually exclusive) and therefore calls for the student to choose between the two alternatives, that is, to either buy the economics textbook and forgo the FA text book or vice versa. Assuming that the student opts to buy the economics text book, the opportunity (economic) cost is the value of the benefit forgone by not buying the FA textbook. Accounting profits net of opportunity cost gives economic profit, opportunity cost being an implicit cost. Opportunity cost can be illustrated by way of a diagram using a production possibility curve/frontier which is concave to the origin denoting increasing opportunity cost as shown below:
Agricultural Product (A) P A1 A2 0 M1 M2 P Manufactured product (M)

Comprehensive Mock Examinations
ECONOMICS
205
- To increase production of M from M1 to M2 the producer has to reduce production of A from A1 to A2 ; thus, the opportunity cost of production of (M1 M2 ) units of M is the value of (A1 A2 ) units of A forgone.
b) Exchange rate: refers to the rate at which one currency exchanges for another that is the amount of one currency that is exchanged for a unit of another currency in a given exchange rate regime.
In a fixed exchange rate regime, the exchange rate is determined by the government; in a floating exchange rate regime, it’s the market forces of demand and supply that determine exchange rates.
When the government increases the exchange rate and thus reducing the relative value of its currency, the process is known as devaluation. Similarly, where the exchange rate increases as determined by the free interaction of the market forces such that the relative value of the currency falls, the process is referred to as depreciation.
D S Kshs/$ 78 ●E D 60 S 54 ($) 0 Quantity of dollars traded on the foreign exchange market Where: DD: Demand for US dollars. SS: Supply of US dollars
Fig: 5.1: Determination of exchange rates Market forces determine the exchange rate at Ksh. 78/dollar, given by the intersection of the supply (SS) and demand (DD) curves at E. The government on its part (in a fixed exchange rate regime) has the prerogative to fix the exchange rate at, for instance, Ksh. 54 or 60 per dollar. (c) Producer’s Surplus:- is the difference between the total amount producers receive for any given quantity
of a product and the minimum amount they would have been willing to accept for that quantity. It can also be defined as the gain to producers arising from the difference between the price they actually receive (market price) and the price they were willing to accept instead of going without selling any of the products (expected price) It’s measured diagrammatically by the area above the supply (marginal cost) curve but below the price at which that quantity is sold.
Exc
hang
e ra
te

Answers-Mocks
STRATHMORE UNIVERSITY ● REVISION KIT
206
Price SS(MC) PX ●c a 0 X1 Quantity
Fig: 5.2: Producer’s Surplus (d) Isoquants: An Isoquant is a locus of technically efficient combinations of two factors of production
their utilization from which the same level of output is produced; its slope measures the marginal rate of technical substitution (MRTS) of one factor (eg labour) for another factor (eg. capital), that is MRTSLK or capital for labour i.e. MRTSKL
Isoquants have the following properties:
(i) Negatively sloped – denoting marginal rate of technical substitution (ii) Do not intersect – if they do, it would mean that an Isoquant represents two levels of output,
which is inconsistent with the definition of Isoquants. (iii) Convex to the origin – since the two factors of production are not perfect substitutes and
therefore subject to diminishing marginal rate of technical substitution of one factor for another. (iv) Isoquants higher above and further away from the origin of an Isoquant map represent higher
levels of output. These properties are represented by way of diagrams as shown below:
Capital (k) k1
MRTSLk k2 QX 0 L1 L2 Labour (L)

Comprehensive Mock Examinations
ECONOMICS
207
Capital (k) A●B● (ii)
●C QX2 QX1
0 Labour (L)
Capital (k) (iii) k1 Diminishing MRTSLk k2 k3 k4 QX 0 L1 L2 L3 L4 Labour (L)

Answers-Mocks
STRATHMORE UNIVERSITY ● REVISION KIT
208
(iv) Capital (k) QX4 QX3
QX2 QX1
0 Labour (L) Question 6
(a) Fixed Cost (FC): - Do not vary with the level of output i.e. remain constant (same) at all levels of possible output depending on the size of the plant eg. Administrative costs (in terms of salaries of top management etc), depreciation, rent & rates, interest on loans. Such costs are associated with the fixed inputs in the short-run. Fixed costs come about because in the short-run the firm cannot vary all its inputs. Fixed inputs are fixed by definition and those costs associated with fixed inputs constitute the firm’s total fixed cost.
Cost (C) (25) = C0 TFC 0 X1 X2 X3 Output (Q) (6) (7) (8)
At all levels of output X1 , X2 , X3 etc fixed cost (TFC) remains constant at CO = 25. Fixed Costs are also known as “overhead costs” or “unavoidable costs”. Variable cost (VC): - Vary directly with the possible levels of output both in short-run and long-run eg. raw material cost, cost of direct labour, running expenses of fixed capital such as fuel, ordinary repairs, routine maintenance, electricity etc. Such costs are associated with variable inputs in the short-run and long-run. Variable cost function takes the form TVC = f(Q). For a firm to increase its output level, it will require more variable inputs hence higher variable costs. Variable costs are often referred to as “direct costs” or “avoidable costs”. They can be avoided by not hiring the variable factor.
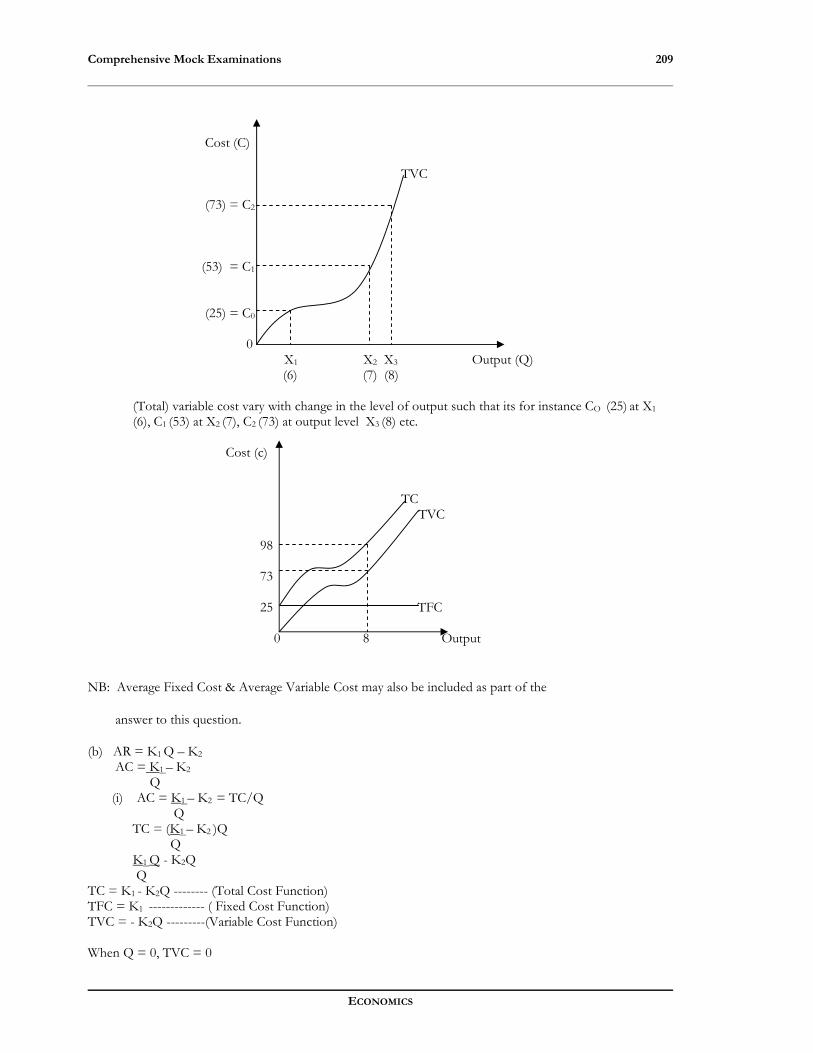
Comprehensive Mock Examinations
ECONOMICS
209
Cost (C) TVC (73) = C2 (53) = C1 (25) = C0 0 X1 X2 X3 Output (Q) (6) (7) (8)
(Total) variable cost vary with change in the level of output such that its for instance CO (25) at X1 (6), C1 (53) at X2 (7), C2 (73) at output level X3 (8) etc.
Cost (c) TC TVC 98 73 25 TFC 0 8 Output
NB: Average Fixed Cost & Average Variable Cost may also be included as part of the
answer to this question.
(b) AR = K1 Q – K2 AC = K1 – K2 Q (i) AC = K1 – K2 = TC/Q Q TC = (K1 – K2 )Q Q
K1 Q - K2Q Q TC = K1 - K2Q -------- (Total Cost Function) TFC = K1 ------------- ( Fixed Cost Function) TVC = - K2Q ---------(Variable Cost Function) When Q = 0, TVC = 0
Answers-Mocks
STRATHMORE UNIVERSITY ● REVISION KIT
210
When Q = 0, TC = 0 + TFC TC = TFC TFC = TC = K1 - K2Q but Q = 0 So TFC = TC = K1 TFC = K1 AFC = TFC/Q = K1 ; AFC = K1 Q Q TC = TFC+ TVC TC = K1 – K2 Q TFC = K1 at all levels of output TFC = K1, thus at any level of output, TVC = TC – TFC TVC = K1 - K2 Q - K1 TVC = - K2 Q AVC = TVC/Q AVC = - K2 Q/Q AVC = - K2 (ii) At breakdown, TR = TC AR = K1 Q – K2 = TR Q TR = (K1 Q – K2 )Q TR = K1 Q2 - K2 Q ---------------- (Total Revenue Function) TC = K1 - K2 Q ---------------- (Total Cost Function ) TR = TC ∴ K1 Q2 - K2 Q = K1 - K2 Q K1 Q2 = K1 Q2 = K1 K1 Q2 = 1 Q = 1 = 1 Q = 1 unit NB: The breakeven point is where total revenue (TR) is equal to total cost (TC) so that the firm neither makes a profit nor a loss. When total revenue (TR)> Total Cost (TC), the firm makes a profit; where profit (II) = TR – TC When total revenue (TR) < Total Cost (TC), the firm makes a loss since it spends more than it gains. (c) Implicit and explicit costs:
(i) Implicit Costs: These are costs of self-owned, self employed resources used by a firm in the process of production (abstract costs) eg. opportunity cost, individual managerial skills etc. Such costs are not fixed and it’s the owner who evaluates them.
Comprehensive Mock Examinations
ECONOMICS
211
These costs are not expressly incurred but are implied. An example would be: a firm that operates its business from a building situated on a piece of land owned by the owners of the firm. Practically, if the land was rented out to another person (3rd party) this 3rd party would pay rent on it. Likewise, theoretically, the business having its premises on this land should charge itself the rent it would be paying if it was not owning (holding) the land.
Otherwise, the stay on the land would not be economical since the opportunity cost of it would be too high. This is because if this cost is not charged a large amount is forgone in terms of rent ‘receivable’.
(ii) Explicit Costs:
These are costs of resources hired or purchased by a firm for use in the production process eg. wages, transport cost etc. profits calculated by only taking into account explicit costs are known as financial profits. Since such costs arise from acquisition of inputs (resources), the amount is determined by price.
NB: Profits calculated on the basis of both implicit and explicit costs are called economic
profits. Question 7
Industrialization being a process, requires a multi-faceted effort; it requires a strong government with a comprehensive representative focus, people having institutionalized sense of nationalistic ideals and an international community that truly values mutuality in international development partnership. The government should have clear policies and incentive guidelines to attract investors. This should go along with aggressive marketing of the business opportunities both locally and abroad. The country’s infrastructure needs to be restored and maintained so as to reduce incidental costs of transportation eg along the Mombasa - Nairobi highway. Institutions like the Kenya Roads Board should be strengthened (in terms of resources, expertise and independence) to make it possible the prioritization of issues particularly relating to the physical aspect of infrastructure. Other aspects of infrastructure to be looked into include the railway network (to avoid constant derailings), airports’ navigation equipment. Training needs should be addressed with specific reference to the technical aspects of industrialization. No country would industrialize without a corresponding technically trained and skilled labour force. Technical Training Institutions should therefore be streamlined and strengthened in order to meet the challenges of the industrialization status Kenya plans to achieve. Special consideration should also be given to Information Technology (IT) on which almost every aspect of business (commerce) and industry relies. Corruption should be rooted out at all costs to avoid instances like tax evasion (which denies the government its rightful revenue and thereby causing frequent costly budget deficit financing), dumping of substandard goods, smuggling and awarding of contracts devoid of merit (on individual whims of power brokers). There should be no conflict of interest when dealing with national issues, and the rule of law must be upheld so that offenders are firmly dealt with. It also involves giving the Kenya Anti- Corruption Authority (KACA) the full backing of the law to allow it to operate independently in carrying out its mandate of investigating and prosecuting economic crimes. This should be enhanced by widening the scope of commercial courts (eg appointing more judges to handle cases) and ensuring that there are no undue injunctions that interfere with the necessary justice of timely conclusion of cases. Moreover, there is a strong need for the adoption of the civil service code of ethics to make civil servants more transparent and accountable, and thereby minimizing chance of misuse of office (misuse of public funds etc). The agricultural sector also needs serious attention in terms of encouraging the setting up of agro-based industries which add value to export products (such as tea, coffee, pyrethrum and cashew nuts). This can be done by availing soft loans to farmers (especially small scale farmers), subsidizing the cost of input (as the West continues to do) and improving the quality of agro-products )to meet ISO standards) and their prices. The government (Ministry of Agriculture and Rural Development) has prepared a new National Agricultural and Livestock Extension Programme (NALEP) as part of the Kenya Rural Development Strategy (KRDS) and the poverty Reduction strategy paper (PRSP) initiative aimed at assisting farmers to enhance food production, guarantee food security, increase incomes and improve standards of living.

Answers-Mocks
STRATHMORE UNIVERSITY ● REVISION KIT
212
This programme (NALEP) prescribes alternative extension approaches and cost effective methods of disseminating appropriate technologies to the farming community with a view to producing beyond subsistence and becoming supportive of the agro-based industries (by increasing the scope of supply of raw materials). This the way forward, and this programme should be implemented as good as it is on paper. Local industries should be protected from cheap imports. This can be done by introducing primitive taxes (tariffs) on foreign goods and strengthening the commitment to economic integration initiatives particularly relating to the rules of origin. Currently, Kenya is witnessing its domestic market flooded with cheap imports or even used imports otherwise known as ‘Mitumba”; motor vehicle assembling industries are witnessing a considerable decline in volume of activity, textile and shoe industries the same (eg RIVATEX, Bata Shoe Company etc). Kenya cannot under any circumstance, industrialize if such industries are left to continue with this trend; if there is no market, existing industries close down (and possibly shift to alternative countries), unemployment increases, purchasing power (effective demand) falls and the general level of poverty increases. These facets are certainly not good for a country that struggles to industrialize. No rational investor would want to establish a new industry when similar ones are closing down. Micro and small scale enterprises at the grass root or even estate level should be encouraged a great deal, extension of credit facilities for such ventures at relatively low interest rates must be put in place so as to encourage upcoming entrepreneurs. To this end, a number of NGO’s are currently in the field as well as banks but their interest rates are still relatively very high; may be the Central Bank of Kenya (Amendment) Act 2000 “The Donde Bill” (approved by parliament on the 27th of July 2001 which seeks to impose a cap on lending rates by banks of 4% above the prevailing 91 day Treasury Bill rate, restricts the total amount of interest levied to not more than the original capital lent, imposes restrictions on the lending fees that are normally charged to borrowing customers, and prescribes the deposit rate payable on interest earning accounts at 70% of the prevailing Treasury Bill rate) is going to help. The government together with state corporations such as the Kenya Industrial Estate (KIE) and the Industrial Development Bank (IDB) should play a leading role towards this endeavor. Though a lot of emphasis has been on the informed sector lie the Jua Kali, the quality of products unless internationally competitive in terms of the ISO standards will not take Kenya any much further in the industrialization process. Power is another item which needs urgent attention as a factor in industrial undertakings. The charges levied in this country are some of the highest in the world. In the current situation, all manufacturers want to make the best out of the least, unfortunately, the power sector has not been rationalized, even with the separation of the generation (now under Ken Gen) and the distribution (by Kenya Power & Lighting Company Ltd) functions. Compared to the neighboring countries, the charges remain unreasonably high. This is attributable to past poor sectoral planning strategies which are now translating into power crisis occasioned by eventualities such as drought (1999/2000). The Sondu Miriu Power project in Nyanza province now being constructed (2001) with the assistance from the Japanese government is as a realization of the lack of foresight in the establishment of the seven Forks dam (Tana river) in eastern province in the drastic fall in the water levels in these dams forced the Ministry of Energy to institute the necessary yet very painful power rationing programme (1999/2000) which seriously impacted (negatively) on the entire spectrum of the Kenyan economy (eg increasing production costs etc) especially the manufacturing sector. Kenya should also make a strong effort to reduce the cost of fuel of which the industrial growth is largely a function. Fuel products’ (such as petrol & diesel) prices have a direct relationship with the costs of production which eventually determine final product prices. Bringing down fuel prices means reducing production costs to the industrial sector, which then translates into relatively lower final product prices and increased effective demand necessary to spur industrial growth. Kenya has recently (2001) made an effort in this direction by negotiating with Sudan the possibilities of oil exploration (and investment) and importation. Though this has generated much international and domestic criticisms from the human rights organizations (claiming the possibility of an increased revenue base for the SPLA forces in southern Sudan), it serves the purpose for Kenya to go ahead (of course not unconditionally – Kenya being a member of the UN peace keeping Missions) and import oil (crude or final) in order to reduce the cost of fuel in this country.
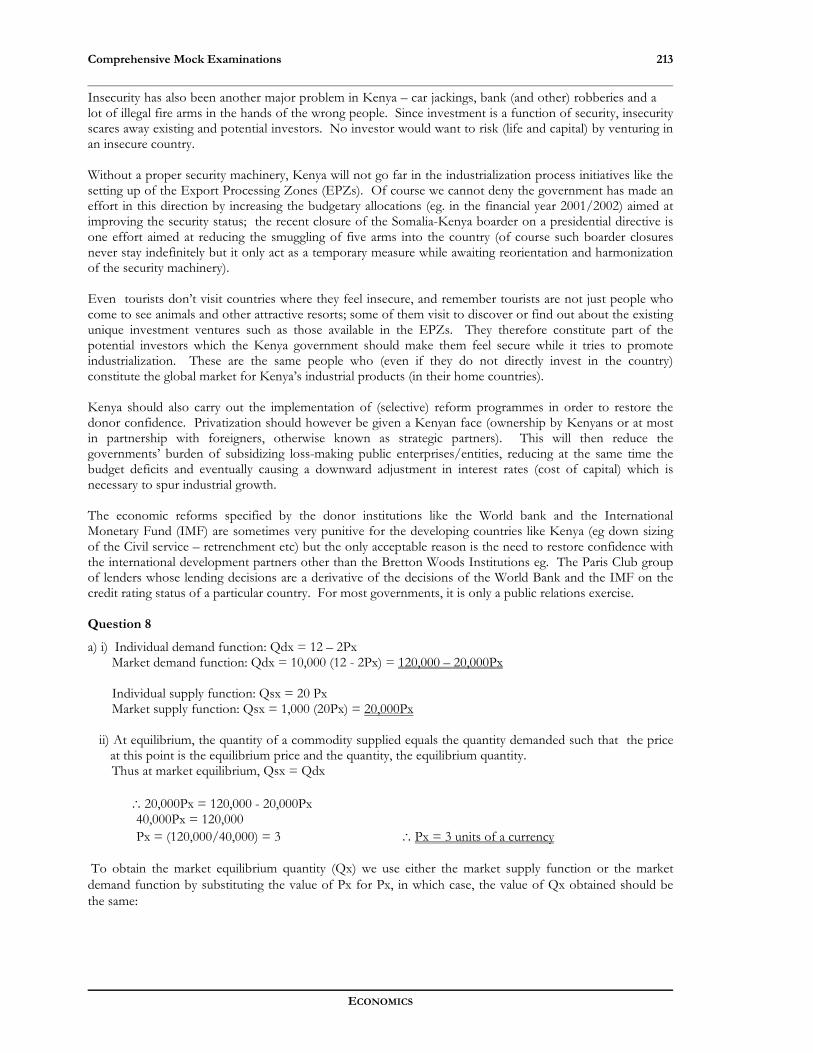
Comprehensive Mock Examinations
ECONOMICS
213
Insecurity has also been another major problem in Kenya – car jackings, bank (and other) robberies and a lot of illegal fire arms in the hands of the wrong people. Since investment is a function of security, insecurity scares away existing and potential investors. No investor would want to risk (life and capital) by venturing in an insecure country. Without a proper security machinery, Kenya will not go far in the industrialization process initiatives like the setting up of the Export Processing Zones (EPZs). Of course we cannot deny the government has made an effort in this direction by increasing the budgetary allocations (eg. in the financial year 2001/2002) aimed at improving the security status; the recent closure of the Somalia-Kenya boarder on a presidential directive is one effort aimed at reducing the smuggling of five arms into the country (of course such boarder closures never stay indefinitely but it only act as a temporary measure while awaiting reorientation and harmonization of the security machinery). Even tourists don’t visit countries where they feel insecure, and remember tourists are not just people who come to see animals and other attractive resorts; some of them visit to discover or find out about the existing unique investment ventures such as those available in the EPZs. They therefore constitute part of the potential investors which the Kenya government should make them feel secure while it tries to promote industrialization. These are the same people who (even if they do not directly invest in the country) constitute the global market for Kenya’s industrial products (in their home countries). Kenya should also carry out the implementation of (selective) reform programmes in order to restore the donor confidence. Privatization should however be given a Kenyan face (ownership by Kenyans or at most in partnership with foreigners, otherwise known as strategic partners). This will then reduce the governments’ burden of subsidizing loss-making public enterprises/entities, reducing at the same time the budget deficits and eventually causing a downward adjustment in interest rates (cost of capital) which is necessary to spur industrial growth. The economic reforms specified by the donor institutions like the World bank and the International Monetary Fund (IMF) are sometimes very punitive for the developing countries like Kenya (eg down sizing of the Civil service – retrenchment etc) but the only acceptable reason is the need to restore confidence with the international development partners other than the Bretton Woods Institutions eg. The Paris Club group of lenders whose lending decisions are a derivative of the decisions of the World Bank and the IMF on the credit rating status of a particular country. For most governments, it is only a public relations exercise. Question 8
a) i) Individual demand function: Qdx = 12 – 2Px Market demand function: Qdx = 10,000 (12 - 2Px) = 120,000 – 20,000Px
Individual supply function: Qsx = 20 Px Market supply function: Qsx = 1,000 (20Px) = 20,000Px
ii) At equilibrium, the quantity of a commodity supplied equals the quantity demanded such that the price
at this point is the equilibrium price and the quantity, the equilibrium quantity. Thus at market equilibrium, Qsx = Qdx
∴20,000Px = 120,000 - 20,000Px 40,000Px = 120,000 Px = (120,000/40,000) = 3 ∴Px = 3 units of a currency To obtain the market equilibrium quantity (Qx) we use either the market supply function or the market demand function by substituting the value of Px for Px, in which case, the value of Qx obtained should be the same:
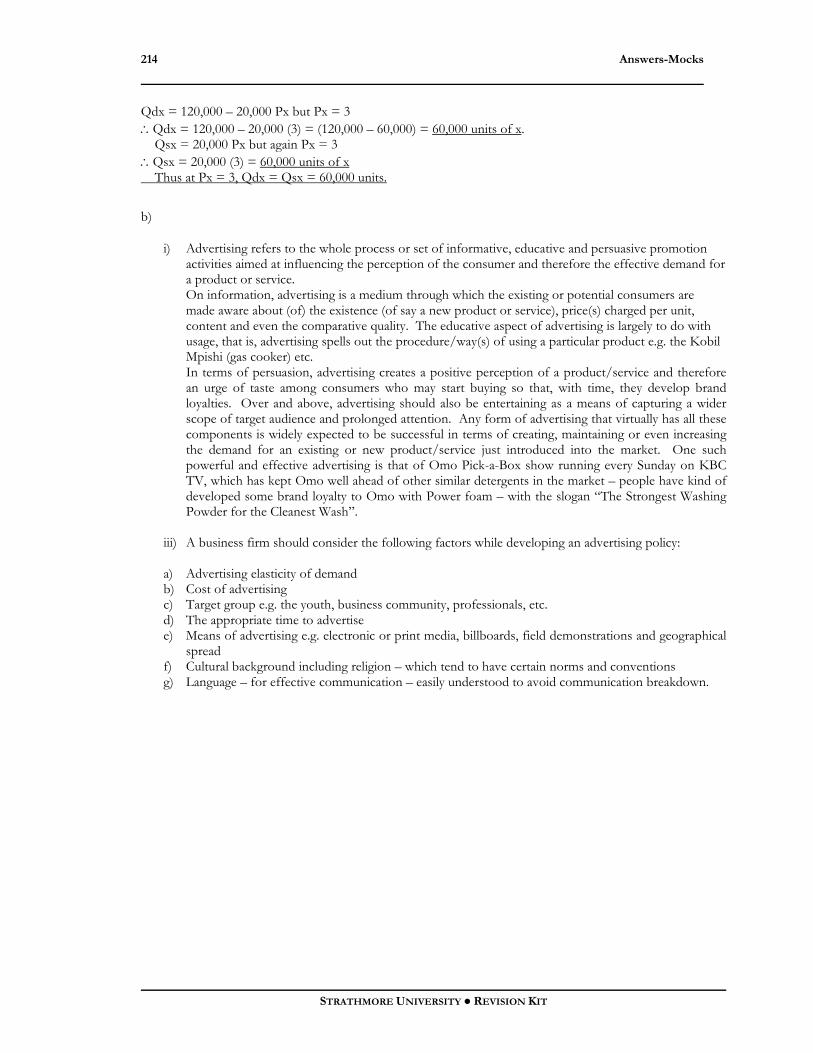
Answers-Mocks
STRATHMORE UNIVERSITY ● REVISION KIT
214
Qdx = 120,000 – 20,000 Px but Px = 3 ∴Qdx = 120,000 – 20,000 (3) = (120,000 – 60,000) = 60,000 units of x. Qsx = 20,000 Px but again Px = 3 ∴Qsx = 20,000 (3) = 60,000 units of x Thus at Px = 3, Qdx = Qsx = 60,000 units.
b)
i) Advertising refers to the whole process or set of informative, educative and persuasive promotion activities aimed at influencing the perception of the consumer and therefore the effective demand for a product or service. On information, advertising is a medium through which the existing or potential consumers are made aware about (of) the existence (of say a new product or service), price(s) charged per unit, content and even the comparative quality. The educative aspect of advertising is largely to do with usage, that is, advertising spells out the procedure/way(s) of using a particular product e.g. the Kobil Mpishi (gas cooker) etc. In terms of persuasion, advertising creates a positive perception of a product/service and therefore an urge of taste among consumers who may start buying so that, with time, they develop brand loyalties. Over and above, advertising should also be entertaining as a means of capturing a wider scope of target audience and prolonged attention. Any form of advertising that virtually has all these components is widely expected to be successful in terms of creating, maintaining or even increasing the demand for an existing or new product/service just introduced into the market. One such powerful and effective advertising is that of Omo Pick-a-Box show running every Sunday on KBC TV, which has kept Omo well ahead of other similar detergents in the market – people have kind of developed some brand loyalty to Omo with Power foam – with the slogan “The Strongest Washing Powder for the Cleanest Wash”.
iii) A business firm should consider the following factors while developing an advertising policy: a) Advertising elasticity of demand b) Cost of advertising c) Target group e.g. the youth, business community, professionals, etc. d) The appropriate time to advertise e) Means of advertising e.g. electronic or print media, billboards, field demonstrations and geographical
spread f) Cultural background including religion – which tend to have certain norms and conventions g) Language – for effective communication – easily understood to avoid communication breakdown.