economics of web service provisioning: optimal market
TRANSCRIPT

ECONOMICS OF WEB SERVICE PROVISIONING:
OPTIMAL MARKET STRUCTURE AND INTERMEDIARY STRATEGIES
By
QIAN TANG
A DISSERTATION PRESENTED TO THE GRADUATE SCHOOL OF THE UNIVERSITY OF FLORIDA IN PARTIAL FULFILLMENT
OF THE REQUIREMENTS FOR THE DEGREE OF DOCTOR OF PHILOSOPHY
UNIVERSITY OF FLORIDA
2004

Copyright 2004
by
Qian Tang

To Yanzan and my parents

iv
ACKNOWLEDGMENTS
Words do not suffice to express my gratefulness to those who have helped me get
through the difficulties and accomplish this dissertation. First, I give my special thanks
to Dr. Hsing Kenny Cheng, chairman of my supervisory dissertation committee. Without
his support, encouragement, and patient guidance, I could not have finished this
dissertation and developed the strong interests in research. I also thank Dr. Shubho
Bandyopadhyay, Dr. Steven Shugan, and Dr. Asoo Vakharia for serving on my
supervisory committee, and for their helpful support. I appreciate Dr. Gary Koehler for
his valuable suggestions on my research. I learn the art and beauty of research from all
the faculty members in my department. To show my thankfulness, I am determined to
follow their examples, and be a good professor and scholar.
Last, but certainly not least, I wish to dedicate my thanks to Yanzan and my parents
from the bottom of my heart. Although they are physically far away from me, I feel they
are with me all the time. It is their unconditional support and love that have made all my
accomplishments possible.

v
TABLE OF CONTENTS page ACKNOWLEDGMENTS ................................................................................................. iv
LIST OF TABLES........................................................................................................... viii
LIST OF FIGURES ........................................................................................................... ix
ABSTRACT....................................................................................................................... xi
CHAPTER 1 INTRODUCTION .........................................................................................................1
1.1 Web Services: History and Overview...................................................................2 1.1.1 Software as service .....................................................................................3 1.1.2 Platform independence ...............................................................................4 1.1.3 Integration of Web services........................................................................5
1.2 Business Implications of Web Services................................................................6 1.2.1 Reduction of integration cost.....................................................................7 1.2.2 Service-oriented architecture......................................................................7 1.2.3 Web service intermediary...........................................................................8
1.3 Research Issues.....................................................................................................9 1.3.1 Optimal market structure............................................................................9 1.3.2 Optimal location and pricing of an integrated Web service .....................10 1.3.3 Optimal subscription and listing fee charged by a WSI ...........................11
1.4 Summary of Major Findings...............................................................................12 2 OPTIMAL WEB SERVICE MARKET STRUCTURE..............................................15
2.1 Related Literature ...............................................................................................16 2.2 A General Model ................................................................................................18
2.2.1 Independent service vendors ....................................................................20 2.2.2 Strategic alliance ......................................................................................22 2.2.3 Web service marketplace..........................................................................23
2.3 Analytical Insights from a Simplified Model .....................................................24 2.4 Computational Explorations ...............................................................................30
vi
3 OPTIMAL LOCATION AND PRICING OF AN INTEGRATED WEB SERVICE.36
3.1 Problem Description and Related Literature ......................................................37 3.2 The Linear City Model .......................................................................................41
3.2.1 Cost to buy from WSI in linear city ..................................................41 3.2.2 Cost to buy from service vendors in linear city ................................41 3.2.3 Optimal location and pricing in linear city........................................42
3.3 The Unit Circle Model........................................................................................44 3.3.1 Cost to buy from WSI in unit circle ..................................................45 3.3.2 Cost to buy from service vendors in unit circle ................................45 3.3.3 Optimal location and pricing in unit circle........................................46
4 Optimal subscription and lising fee of a Web service intermediary............................51
4.1 The Web Service Supply Chain..........................................................................53 4.2 Literature Review ...............................................................................................55 4.3 The Model...........................................................................................................59
4.3.1 Consumer’s subscription decision............................................................60 4.3.2 Service vendor’s listing decision..............................................................62
4.4 Optimal Subscription and Listing Fee ................................................................63 4.4.1 Network value is less than intrinsic value ................................................66 4.4.2 Network value is greater than intrinsic value ...........................................73
5 CONCLUSIONS AND FUTURE RESEARCH .........................................................81
APPENDIX A PROOFS OF CHAPTER 2 .........................................................................................87
A.1 Proof of Lemma 2-1...........................................................................................87 A.2 Proof of Lemma 2-3...........................................................................................88 A.3 Proof of Lemma 2-4...........................................................................................89 A.4 Proof of Proposition 2-6 ....................................................................................90 A.5 Proof of Proposition 2-7 ....................................................................................90 A.6 Proof of Proposition 2-8 ....................................................................................91 A.7 Proof of Proposition 2-9 ....................................................................................92
B PROOFS OF CHAPTER 3 .........................................................................................94
B.1 Proof of Proposition 3-1.....................................................................................94 B.2 Proof of Lemma 3-2...........................................................................................97 B.3 Proof of Lemma 3-4...........................................................................................99 B.4 Proof of Proposition 3-5...................................................................................100 B.5 Proof of Proposition 3-6...................................................................................100

vii
C PROOFS OF CHAPTER 4 .......................................................................................102
C.1 Proof of Lemma 4-1.........................................................................................102 C.2 Proof of Lemma 4-3.........................................................................................103 C.3 Proof of Proposition 4-6...................................................................................104 C.4 Proof of Proposition 4-12.................................................................................105 C.5 Proof of Corollary 4-14....................................................................................106 C.6 Proof of Corollary 4-15....................................................................................107
LIST OF REFERENCES.................................................................................................109
BIOGRAPHICAL SKETCH ...........................................................................................113

viii
LIST OF TABLES
Table page 2-1. Design of numerical experiments .............................................................................31
2-2. Optimal market structure w.r.t 3V ............................................................................33
C-1. Optimal Subscription Fee when vγ < ..................................................................105
C-2. Optimal Subscription Fee when vγ ≥ ..................................................................106
ix
LIST OF FIGURES
Figure page 1-1. Example of Web service application .........................................................................4
1-2. Web service integration .............................................................................................6
2-1. Independent service vendors ...................................................................................20
2-2. Strategic alliance......................................................................................................22
2-3. Web service marketplace.........................................................................................23
2-4. Optimal profit of ISV ..............................................................................................26
2-5. Optimal profit of marketplace w.r.t. c .....................................................................27
2-6. Optimal profit of marketplace w.r.t. V3 .................................................................28
2-7. ISV vs. marketplace.................................................................................................28
2-8. SA vs. marketplace ( * **3V V V< < ) .........................................................................29
2-9. SA vs. marketplace ( **3V V> ) .................................................................................30
2-10. Marketplace is optimal ...........................................................................................32
2-11. SA dominates for small integration cost while marketplace dominates for large integration cost.......................................................................................................32
2-12. Strategic alliance is optimal....................................................................................32
3-1. Web service execution model..................................................................................37
3-2. Linear city model.....................................................................................................41
3-3. Marginal customer in LC model..............................................................................42
3-4. Unit circle model .....................................................................................................45
4-1. Web service supply chain .........................................................................................54
x
4-2. Model of subscription and listing fee ......................................................................60
4-3. Proportion of Subscribers when vγ < ....................................................................66
4-4. Optimal subscription fee when vγ < .....................................................................71
4-5. Optimal profit when vγ < ......................................................................................71
4-6. Proportion of subscribers when vγ > ....................................................................73
4-7. Optimal subscription fee depends on Φ when 21 22γ γ γ< < ..................................77
4-8. Optimal subscription fee depends on Ψ when 22γ γ> ...........................................77

xi
Abstract of Dissertation Presented to the Graduate School of the University of Florida in Partial Fulfillment of the Requirements for the Degree of Doctor of Philosophy
ECONOMICS OF WEB SERVICE PROVISIONING: OPTIMAL MARKET STRUCTURE AND INTERMEDIARY STRATEGIES
By
Qian Tang
August 2004
Chair: Hsing Kenneth Cheng Major Department: Decision and Information Sciences
The Web services technology empowers a service-oriented architecture featured by
“Just-in-Time” software integration and “on-demand” software provisioning. My
objective is to study the impact of this new technology on firm strategies. To the best of
my knowledge, mine is among the first studies of optimal strategies for offering Web
services from an economic perspective.
First I address the optimal market structure to provide complementary Web
services. In particular, three market structures are compared: independent service
vendors; strategic alliance; and marketplace. The optimal market structure with different
integration cost and market settings is derived. The model incorporates the integration
cost that was not considered in previous literature on physical product bundling. Results
indicate that in the context of Web service integration, a Web service marketplace (which
corresponds to a structure of mixed bundling of physical goods) is not necessarily always
the best market structure.
xii
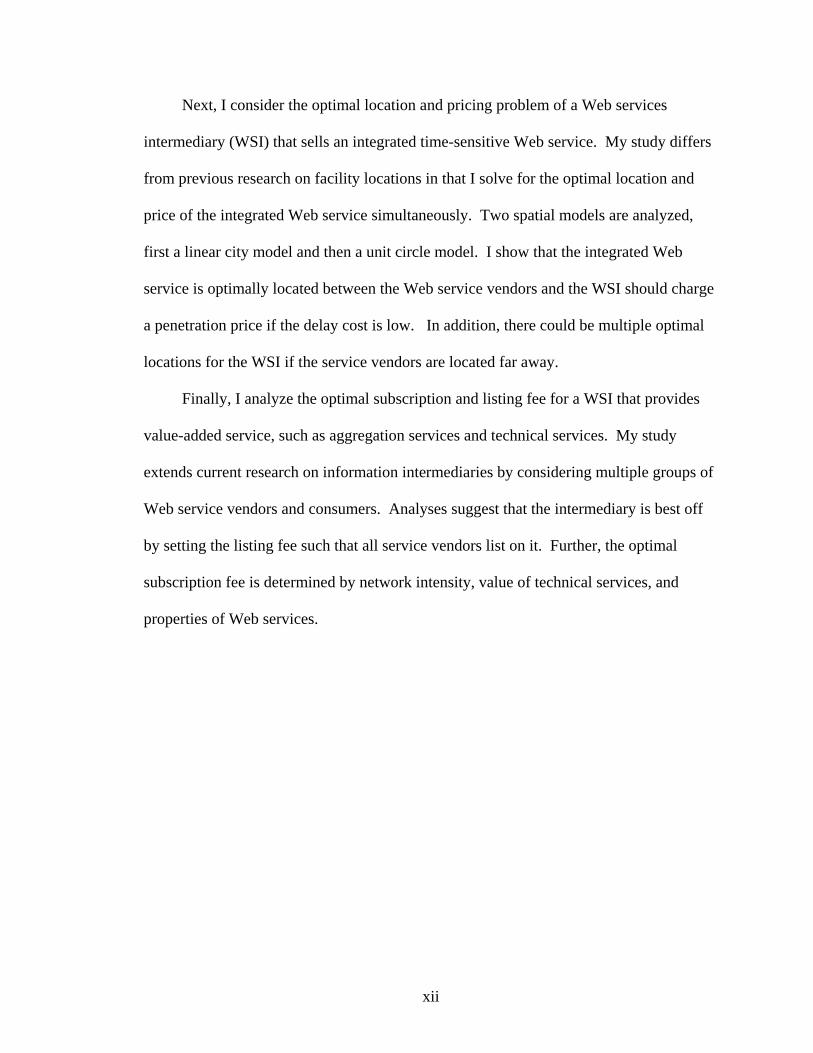
Next, I consider the optimal location and pricing problem of a Web services
intermediary (WSI) that sells an integrated time-sensitive Web service. My study differs
from previous research on facility locations in that I solve for the optimal location and
price of the integrated Web service simultaneously. Two spatial models are analyzed,
first a linear city model and then a unit circle model. I show that the integrated Web
service is optimally located between the Web service vendors and the WSI should charge
a penetration price if the delay cost is low. In addition, there could be multiple optimal
locations for the WSI if the service vendors are located far away.
Finally, I analyze the optimal subscription and listing fee for a WSI that provides
value-added service, such as aggregation services and technical services. My study
extends current research on information intermediaries by considering multiple groups of
Web service vendors and consumers. Analyses suggest that the intermediary is best off
by setting the listing fee such that all service vendors list on it. Further, the optimal
subscription fee is determined by network intensity, value of technical services, and
properties of Web services.
1
CHAPTER 1 INTRODUCTION
The Web services architecture represents a new computing paradigm that allows
for the distribution, discovery, production and consumption of loosely coupled software
components over the Internet. The objective of the dissertation is to study the optimal
strategies for providing Web services from an economic perspective. In particular, I aim
to address three research problems: optimal market structure for providing
complementary Web services; optimal location and pricing of an integrated Web service
provided by a Web service intermediary; optimal subscription and listing fee charged by
a Web services intermediary in a Web service supply chain.
The organization of the dissertation is as follows. Chapter 1 first gives a general
introduction of the Web services technology, which includes the evolution of Web
services and its technical characteristics. Then I discuss the business implications of Web
services and introduce the research issues. Major findings are summarized at the end of
Chapter 1. In Chapter 2, I examine the problem of optimal Web service market structure.
Chapter 3 solves the joint decision problem of optimal location and pricing for an
integrated Web service with the analysis of two spatial models. Chapter 4 analyzes the
optimal subscription and listing fee charged by a Web service intermediary. In each
chapter, I provide literature review and discuss the relevance to and distinctions from this
research. Managerial insights are interpreted after presenting results from the analytical
and numerical studies. Chapter 5 concludes this dissertation with discussion on future
research plans.

2
1.1 Web Services: History and Overview
The business world is undergoing a globalization trend. Firms are expanding their
territories into new markets abroad to create growth. Supply chains are being established
among partners in different geographical regions to increase sourcing efficiency. To reap
the full benefit of globalization, a firm oftentimes needs to standardize or reengineer its
business processes, which requires the integration of various information systems built on
different platforms at different times. Further, the globalization of business requires a
distributed computing environment that allows companies to take advantage of the
computing power at various operational units, regardless of geographical location and
platform. Web services, a recent paradigm of computing, represents the most promising
solution to date to addressing the challenge of distributed enterprise computing required
by the globalization of business.
Hailed as revolutionary, Web Services technology came along an evolutionary path
of growth. There has been continuous effort to improve the reusability, flexibility and
interoperability of information systems. The advent of object-oriented languages makes
it possible to encapsulate functionality in software components called “objects.” Sun
Microsystems introduced the platform-independent, bytecode-based Java language so
that programs can be downloaded and run anywhere in the world. Microsoft catered to
this componentization trend by providing the Object Linking and Embedding (OLE)
technology. As Internet popularity grows and network technology matures, firms began
to seek solutions for distributed computing. Yet the problem of incompatibility soon gets
in the way when it comes to the collaboration and interaction among heterogeneous
systems. Sun’s Java Remote Method Invocation (RMI) over Internet Inter-Orb Protocol
(IIOP) aims to deliver distributed computing capabilities, but it is overwhelmingly
3
complex and requires of Java end nodes. Likewise, Distributed Common Object Model
(DCOM) proposed by Microsoft works only on Windows platforms (Schmelzer 2002).
For the first time, Web services technology poses a promising solution to the “plug-
and-play” Holy Grail based on open standards and the decomposition of software
application. According to the Stencil Group (Sleeper 2001), Web services are “loosely
coupled, reusable software components that semantically encapsulate discrete
functionality and are distributed and programmatically accessible over standard Internet
protocols.” From a technical perspective, Web services represent a collection of standard
protocols for the creation, distribution, discovery and integration of semantic software
components that encapsulate business functionalities. The key to Web services is
dynamic software discovery and just-in-time software service creation (ingtegration)
through the integration of loosely coupled software components. Central to the Web
services architecture are the concepts of software as service and platform independence.
1.1.1 Software as service
As opposed to packaged monolithic applications that must be written or licensed,
Web services encapsulate specific business functionalities that can be “rented” over the
Internet. The idea of software as services dates back to the provision of application as
services by Application Service Providers (ASP). But the Web services are not merely a
newer version of ASP. Traditional ASP usually provides complex application systems,
like Enterprise Resource Planning (ERP), through proprietary connection. Web services
decompose business processes into granular components and thus allow customers to
select services on an as-needed basis (Sharma and Gupta 2002). Further, Web services
are distributed over the Internet, while traditional ASPs host their applications on a
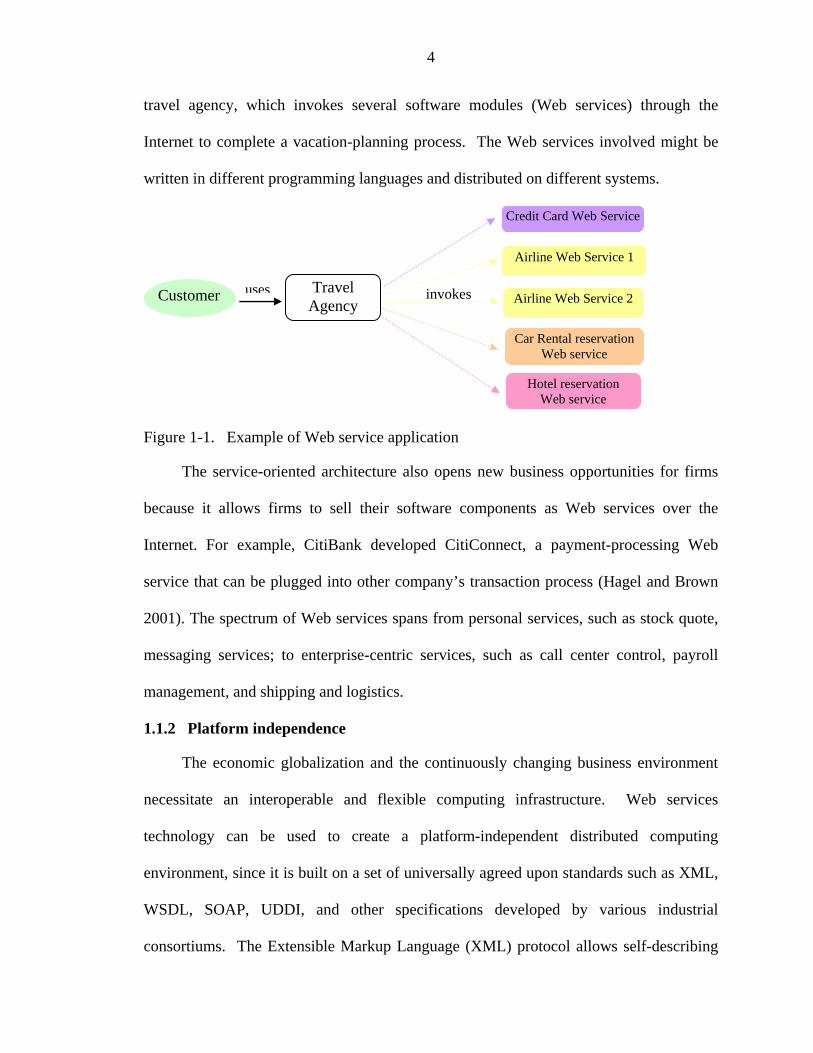
centrally located server. Figure 1-1 shows an example of Web service application for a
4
travel agency, which invokes several software modules (Web services) through the
Internet to complete a vacation-planning process. The Web services involved might be
written in different programming languages and distributed on different systems.
Figure 1-1. Example of Web service application
The service-oriented architecture also opens new business opportunities for firms
because it allows firms to sell their software components as Web services over the
Internet. For example, CitiBank developed CitiConnect, a payment-processing Web
service that can be plugged into other company’s transaction process (Hagel and Brown
2001). The spectrum of Web services spans from personal services, such as stock quote,
messaging services; to enterprise-centric services, such as call center control, payroll
management, and shipping and logistics.
1.1.2 Platform independence
The economic globalization and the continuously changing business environment
necessitate an interoperable and flexible computing infrastructure. Web services
technology can be used to create a platform-independent distributed computing
environment, since it is built on a set of universally agreed upon standards such as XML,
WSDL, SOAP, UDDI, and other specifications developed by various industrial
consortiums. The Extensible Markup Language (XML) protocol allows self-describing
Customer
Credit Card Web Service
Airline Web Service 1
Airline Web Service 2
Car Rental reservation Web service
Hotel reservation Web service
uses invokesTravel Agency
5
data to be exchanged independent of platform and language. The Web Services
Description Language (WSDL) builds on XML and specifies how Web services can
communicate with each other. The XML-based messaging protocol Simple Object
Access Protocol (SOAP), recently renamed Services-Oriented Architecture Protocol,
supports the invocation of software components over existing networks like HTTP and
FTP in a fashion similar to Remote Procedure Call (RPC). The Universal Description,
Discovery and Integration (UDDI) specification specifies the mechanism for the
description, registration, dynamic lookup and integration of software components.
1.1.3 Integration of Web services
In essence, the Web services architecture represents a platform-, language-, and
vendor-neutral framework for the interaction and integration of software components via
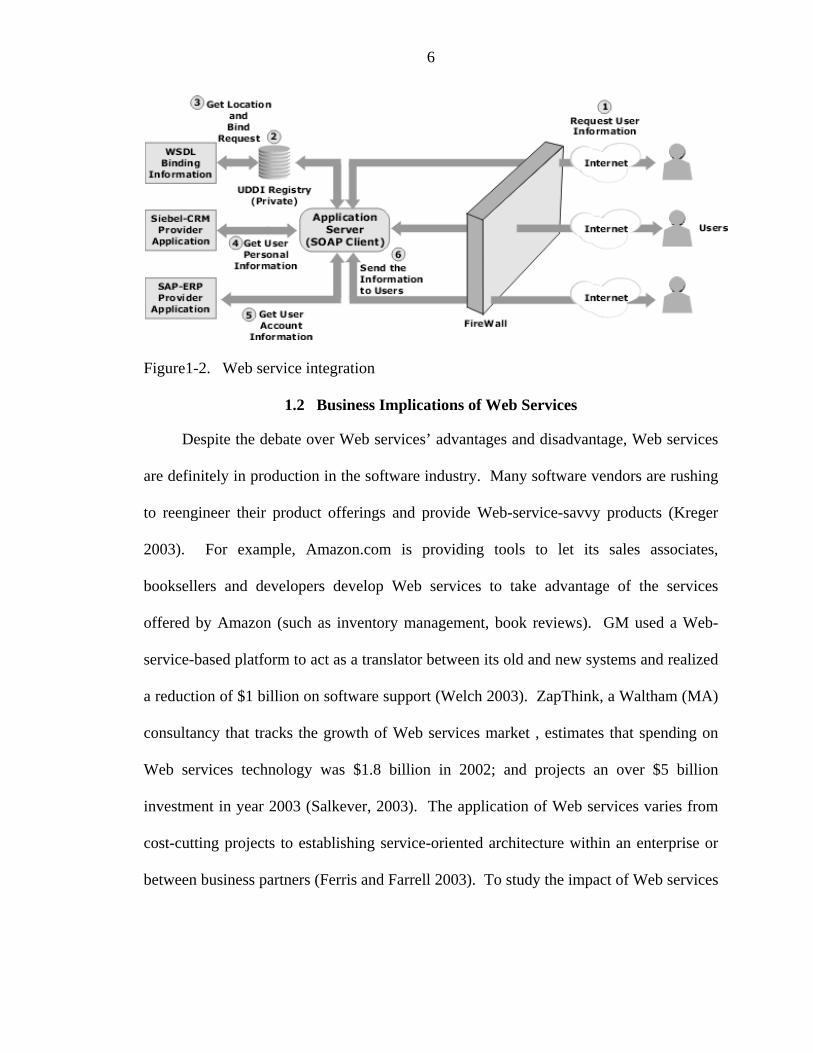
standard networking technologies. Figure 1-2 shows how the Web service protocols
work together to compose two complementary Web services: the customer relationship
management (CRM) Web service and the enterprise resource planning (ERP) Web
service (Samtani and Sadhwani 2001). In the example, users request information about a
particular person. The request is first handled by a UDDI server, which looks up its
registry for relevant services that handle user information. Both CRM and ERP services
are found. The UDDI server then forwards the location and WSDL information of the
two services to an application server, which invokes the services to retrieve requested
information. All communications between the application server and the two services are
based on the SOAP protocol. In the end, the retrieved information is sent back to the
user. The location of the services is transparent to the user who may not even be aware
that two services are involved in the process.
6
Figure1-2. Web service integration
1.2 Business Implications of Web Services
Despite the debate over Web services’ advantages and disadvantage, Web services
are definitely in production in the software industry. Many software vendors are rushing
to reengineer their product offerings and provide Web-service-savvy products (Kreger
2003). For example, Amazon.com is providing tools to let its sales associates,
booksellers and developers develop Web services to take advantage of the services
offered by Amazon (such as inventory management, book reviews). GM used a Web-
service-based platform to act as a translator between its old and new systems and realized
a reduction of $1 billion on software support (Welch 2003). ZapThink, a Waltham (MA)
consultancy that tracks the growth of Web services market , estimates that spending on
Web services technology was $1.8 billion in 2002; and projects an over $5 billion
investment in year 2003 (Salkever, 2003). The application of Web services varies from
cost-cutting projects to establishing service-oriented architecture within an enterprise or
between business partners (Ferris and Farrell 2003). To study the impact of Web services
7
on firm strategies, let’s first examine the benefits of Web service from a business
perspective.
1.2.1 Reduction of integration cost
The standardizing of protocols has profound business implications. One of the key
benefits of Web services lies in reduced integration cost because of the openness of
technology. Firms are relieved of the complexity of integrating applications built on
different platforms or located on different networks. The application of Web services
often involves the integration of disparate software components, either within an
enterprise or among trading partners.
Internally, the Web Service architecture changes the fundamental cost structure of
Enterprise Application Integration (EAI). A firm can decrease development cost and
duration dramatically by leveraging existing systems and outsourcing standard modules.
Externally, Business-to-Business (B2B) integration or collaboration is made more cost
efficient because the firms no longer have to set up a separate integration project with
each business partner. Thus, business alliances can be created and decoupled on the fly.
1.2.2 Service-oriented architecture
The service-oriented architecture (sometimes called e-service) is defined as
offering software components as services that can be purchased or rented over a network,
such as the Internet. As standardized, self-describing application modules that can be
described, published, located and invoked over the Internet, Web services form the
foundation of a service-oriented architecture to support universal application integration
(Rust and Kannan 2003). For example, Huang and Chung (2003) proposed a framework
of application integration based on Web services technology, addressing issues such as
security, transaction control, and reliability.
8
The essence of a service-oriented architecture lies in “service on demand” and
“just-in-time” service integration. Firms benefit from the service-oriented architecture
powered by Web services in many ways. For example, firms have the ability to choose
components that best match the company’s business processes, to tailor components to
the individual needs of business units, and to incrementally pay for the overall system
(Fingar 2000; Sundarraj and Talluri 2003).
1.2.3 Web service intermediary
Although Web services are designed to be platform-independent, they leave
unspecified the context necessary for service integration on the process level. For
example, the Web service consumers have to define the order of sequence, control
information flow, exceptions handlings, and transactional integrity enforcement, just to
name a few (Cubera et al. 2003, Little 2003). Furthermore, a directory service is required
if run-time discovery and integration are to be materialized.
To help realize the “plug-and-play” service-oriented architecture, a new business
model, referred to as the Web service intermediaries (WSI), has seen rapid growth in
practice in industry recently. A WSI provides value-added services including directory
and search engine, auditing, quality of service (QoS) assurance and integration and
orchestration of Web services. For example, Salcentral.com (which originally called
itself “the Napster of Web services”) provides a Web service search engine and tools for
developing and integrating Web services. Maintenance of Web services is made more
simplified since the WSI hosts the latest version of Web services and offers tools so that
the Web service producers can manage and control their Web services. By offering
aggregation services and technical support for Web service development, management
9
and integration, a Web service intermediary benefits both ends of the Web service supply
chain: the Web service vendors and consumers.
1.3 Research Issues
With growing adoption of Web services technology, the research landscape in
many fields, such as software engineering and management, is about to experience a
major shift. For instance, the Web service technology emphasizes on reducing the size of
software components while at the same time introduces new issues on Web service
integration. The execution of Web services over the Internet causes a network delay not
associated with traditional standalone systems. Thus, Web services technology could
change software development and marketing strategies, such as software quality,
development costs, and pricing. Therefore, it is imperative that information systems
researchers delve into this new computing paradigm and provide useful insights to guide
business practice.
At the same time, it should be noted that the ultimate value of Web services
technology is not in itself. Rather, it lies in the productivity gain and the creation of new
business opportunities due to its reusability, flexibility and interoperability. My objective
is to study the impact of Web services technology on firm strategies and software
development with the use of economic models. In particular, I aim to analyze the Web
services technology from the following three perspectives.
1.3.1 Optimal market structure
By building on standard technologies, Web services technology enables dynamic
software integration that is essential to enterprise application integration and business-to-
business integration. Therefore, a natural start for Web services research is to examine
10
the impact of integration cost when composing Web services of complementary
functionalities.
Several research questions arise when Web services are exploited for application
integration. First, does a software producer always benefit from the interoperability of
Web services? Second, how should software producers take advantage of Web service
technologies and optimally provide complementary Web services to maximize total
profit? Finally, should firms offer their software components separately, form a strategic
alliance to provide a composite Web service or establish a marketplace that sells both
individual and composite Web services? The first part of my study answers these
questions by analyzing the optimal market structure for providing two complementary
Web services.
1.3.2 Optimal location and pricing of an integrated Web service
Besides traditional functions such as matchmaking, aggregation of demand and
supply, providing trust, and offering market characteristics to suppliers and consumers as
in the electronic intermediaries (Bailey and Bakos 1997, Bakos 1998), a Web service
intermediary (WSI) has several unique features worthy of special interest. For instance,
unlike traditional electronic intermediaries that generally offer static information, a WSI
can participate actively in the Web service supply chain by offering dynamic information
goods such as Web services.
In the second part of the dissertation, I study the optimal strategy of a Web service
intermediary that sells an integrated Web service to compete with Web service vendors.
As discussed previously, the composition of Web services incurs an integration cost.
Therefore, a Web service consumer interested in the composite Web service must take
into account the integration cost when deciding whether to buy the integrated service
11
from the WSI or integrate by oneself the Web services bought separately from the Web
service vendors. On the other hand, the execution of Web services on remote servers
causes a response delay that consists of program running time and network delay. As a
result, a Web service consumer must factor in the delay cost when deciding whether to
“buy” (or execute) the integrated Web service from the intermediary. Since the network
delay is related to the physical distance between the Web service intermediary and the
client, the optimal strategy of the WSI requires solving the joint decision problem of
location and pricing of the integrated Web service.
Specifically, I seek to address the following research questions. What is the
optimal pricing strategy for the composite Web service: a penetration price or a high
price? Where should the WSI in competition with two individual service providers host
its integrated Web service? Should the WSI be located close to the service providers or
stay away from the service providers to avoid competition?
1.3.3 Optimal subscription and listing fee charged by a WSI
Depending on technical strengths and business scope, Web service intermediaries
can play various roles in linking the service vendors and service requestors. For example,
Salcentral.com, maintains a comprehensive directory of Web services so that service
consumers can browse, search for, and audit particular Web services. Another Web
service intermediary, GrandCentral.com, provides a centralized Web service network and
acts as a trust broker that handles all the issues around message delivery and routing,
security, etc. In summary, a WSI provides value-added services to both Web service
vendors and Web service requestors, allowing it to charge fees to both sides of the Web
service supply chain.
12
Finally, I focus on studying the optimal strategy for a Web service intermediary
that provides aggregation and technical services to Web service vendors and consumers.
The Web service intermediary charges fees to both sides of the Web service supply chain.
I address the optimal pricing strategies for a Web services intermediary in a supply chain
of complementary Web services. That is, the WSI serves multiple groups of Web service
vendors and consumers. The following research questions are explored. First, what are
the optimal subscription fee and listing fee? Second, should the intermediary subsidize
one side of the market to maximize its profit? If so, which side of the market should the
intermediary subsidize? Next, what is the impact of technical strength and intensity of
network effect on the intermediary’s pricing strategy? Finally, how do the characteristics
of Web services affect the optimal strategies of the intermediary?
1.4 Summary of Major Findings
To analyze optimal market structures, I compare three market structures–
independent service vendors (ISV), strategic alliance (SA) and Web service marketplace.
Analytical results and computational explorations suggest that Web service vendors
benefit from the integration of Web services because the Web service marketplace always
dominates the ISV market structure, regardless of the integration cost. The optimal
market structure is determined by the integration cost, and the valuations and market
potentials of the individual and composite Web services. As the valuation of the
integrated Web service is small, the service providers prefer marketplace to strategic
alliance. For larger valuation of the integrated software service, service providers prefer
marketplace if the integration cost is high; while strategic alliance dominates if the
integration cost is low. If the valuation of the integrated software service is sufficiently
high, strategic alliance becomes the optimal market structure.

13
The joint decision problem of optimal location and pricing for an integrated Web
service provided by a Web services intermediary (WSI) is analyzed with two spatial
models. In general, optimal location and price depend on integration cost, delay cost and
prices of the individual Web services. In a linear city model, I show that the midpoint
position between the service providers is always the optimal location for the integrated
Web service. Furthermore, when the delay cost is quite small, the best pricing strategy is
to charge a penetration price to capture entire market demand. On the other hand, the
WSI should charge a high price to share the market with the service providers when the
delay cost is high. Analysis of a unit circle model shows that the WSI is optimally
located midway between the service providers and charges a market-covering price when
the delay cost is small. In addition, if the distance between the service providers is large,
there are multiple optimal locations for the integrated Web service.
Finally, I find that in the presence of cross network externalities between two ends
of a Web service supply chain, a WSI always has incentive to subsidize the service
vendors by setting a low listing fee that induces all service vendors to list their Web
services on it. On the other hand, the intermediary may choose to attract only portion of
the Web service consumers, depending on the relationship between the intensity of cross
network externalities and consumer’s valuation of the WSI’s value-added technical
services. If the consumers value the technical services more than the network effect, the
optimal subscription fee and profit are increasing in network effect. Furthermore, the
WSI should allow more consumers to subscribe to its service as network effect
intensifies. The optimal subscription fee is also affected by the nature of Web services
provided by the service vendors, such as the prices of Web services and market potentials
14
of the composite Web service. For example, if the market potential of the composite
Web service is large and the consumers have high valuation for the technical services, the
intermediary should never set a low subscription fee to attract all consumers to subscribe
when the consumers value the network effect more than the technical services. On the
other hand, the WSI should set the subscription to allow all Web service consumers to
subscribe if the market potential of the composite service is smaller than the market
potentials of the two individual Web services and the network intensity is high.
15
CHAPTER 2 OPTIMAL WEB SERVICE MARKET STRUCTURE
In this chapter, I study the optimal market structure for providing complementary
Web services when consumers incur an integration cost to compose multiple Web
services. In particular, I compare three market structures for two software vendors
offering two complementary Web services: (1) the independent service vendors (ISV)
structure in which the two firms sell Web services separately; (2) the strategic alliance
(SA) structure in which the two firms establish partnership to offer an integrated Web
service; and (3) the Web services marketplace structure in which the two firms sell both
the individual and the composite Web services.
One example of complementary Web services is a school calendar scheduling Web
service and a weather forecast Web service. The calendar-scheduling Web service can be
integrated with the weather forecast Web service so that the school can schedule certain
events (such as such as football games and skiing competitions) in accord with the
weather conditions. Another example of Web services that can be integrated is an
inventory management system and a purchasing system. The two systems can work
together so that purchasing orders can be automatically generated when the inventory is
below a certain level and the inventory can be updated in real time when purchases are
made.
This chapter is organized as follows. First, I review literature on physical good
bundling and integration, followed by discussion about the uniqueness of Web service
integration. Then I present the models of three market structures and derive profit

16
functions in each market structure. After that, the optimal market structure is found by
comparing the profits of three market structures with varying integration cost and market
conditions. The analysis includes analytical study of a simplified model and numerical
explorations of the general model.
2.1 Related Literature
The bundling strategy for complementary products and services has been an active
research topic in marketing and economics. Economides and Salop (1992) study the
optimal market structure in light of the tradeoff between vertical integration of
complementary products and horizontal competition among substitutable composite
products. They model a market of two complementary products, each provided by two
firms. A number of market structures, which differ in the degree of competition and
integration, exist under different combinations of the four firms. Their research focuses
on comparing the equilibrium price of the composite product under different market
structures.
Matutues and Regibeau (1992) study the optimal strategy on product compatibility
and bundling with a spatial model in which consumers have heterogeneous fit cost (or
taste) of different product components. They set up a model of two firms each selling
two complementary products. Farrell and Katz (2000) study a market composed of a
monopoly offering one product component and several companies (possibly including the
monopoly) offering another complementary product component. Their study
concentrates on the monopoly’s incentive to “squeeze” the producers of the other product
component by means of pricing, product innovation, or exclusive trading rules.
Implications on social welfare are explored.
17
Venkatesh and Mahajan (1993) examine the optimal pricing strategy under three
bundling strategies: pure component, pure bundling and mixed bundling with a
probabilistic model. Similar bundling strategies are analyzed by Chuang and Sirbu
(1999) with application to N goods (journal articles). Both papers (Venkatesh and
Mahajan 1993, Chuang and Sirbu 1999) conclude that the mixed bundling strategy yields
maximum profit for firms.
Several unique features of Web services technology necessitate a different
approach to the study of Web service integration. First, Web services are essentially
programmable software components. Unlike physical goods that can be bundled (or put
together) at ease, the integration of two arbitrary software components requires both
human expertise and financial resources because of the complexity of addressing the
platform- and language-disparities, such as recoding of data and/or application interfaces.
In essence, the integration of software components introduces an integration cost not
considered in all previous research on product or service bundling strategies to the best of
my knowledge.
Second, Web services technology provides the flexibility of selecting software
components on an as-needed basis. In other words, there are demands for both the
individual and the composite Web services. Many previous studies focus on the market
structure for the composite product while ignoring the demand for the individual
components (Economides and Salop 1992, Matutues and Regibeau 1992, Farrell and
Katz 2000).
Third, an integrated software application is usually a new software product that is
indivisible and has different value and function than simply adding the values and
18
functions individual software components. Product bundles, on the other hand, are put
together without change to each component. An analogy of integrated Web service is
alloy wheal, which is made from tin and aluminum. Many previous works on product
bundling treat the value of the bundled product as the sum of values of the components,
which is referred to as the assumption of strict addition. Typically mixed bundling
emerges as the profit-maximizing strategy (Venkatesh and Mahajan 1993, Chuang and
Sirbu 1999). As I will show later, mixed bundling is not necessarily always optimal for
Web services.
Although Venkatesh and Kamakura (2003) relax the strict addition assumption and
consider contingent valuation for bundling complementary and substitute products, their
result can’t be applied to Web services directly because of two reasons. First, unlike
physical goods, the marginal cost of providing one copy of Web service is negligible.
Second, since the integrated Web service is indivisible, it is impossible to buy the
integrated software and if the consumer is only interested in one component. Likewise,
the papers by Bakos and Bryjolfsson (1999, 2000) have to be modified to fit in the
context of Web service integration. I address the impact of integration cost on Web
service market structure by taking into account different the demand of both the
individual and the integrated Web services.
2.2 A General Model
Consider two service vendors selling two distinct but functionally complementary
software components (S1 and S2). Components S1 and S2 can be integrated into a
composite service (S3). Correspondingly, the potential buyers of Web services are
classified into three groups: the potential buyers of S1, the potential buyers of S2, and
19
potential buyers of S3. Let the size of the three groups of potential buyers be 1Q , 2Q and
3Q . The buyers in each group have a homogeneous reservation price (valuation) of 1V ,
2V and 3V for S1, S2, and S3, respectively.
I consider three market structures that can be adopted by two profit-maximizing
Web service vendors. In the first market structure, independent service vendors (ISV),
the two firms sell the Web services independently. Consumers interest in the composite
service must integrate S1 and S2 by themselves and thus incur an integration cost of c .
In the second market structure, strategic alliance (SA), the two firms form an alliance to
sell only S3, the integrated Web service. In the third market structure, Web service
marketplace (Marketplace), the two firms sell S1, S2, and S3. There is no integration
cost for customers in the SA or Marketplace structures.
The two service vendors seek the optimal market structure to maximize their
profits. Intuitively, the valuations of the three services, the sizes of the three groups of
customers, and the integration cost will affect the service vendors’ decisions. Of special
interest is the impact of the integration cost, since one key benefit from Web services
technology is reduced integration cost. I develop an economic model to examine the
optimal market structure for the Web service vendors with respect to various integration
costs. To reflect industry reality, two assumptions are made regarding the integration
cost and service valuations. First, I assume that the composite Web service is valued
more than any of the individual services alone. Second, I assume the integration cost can
not exceed the values of each Web service. In summary,
30 ic V V< < < , 1, 2i = . (2.1)
20
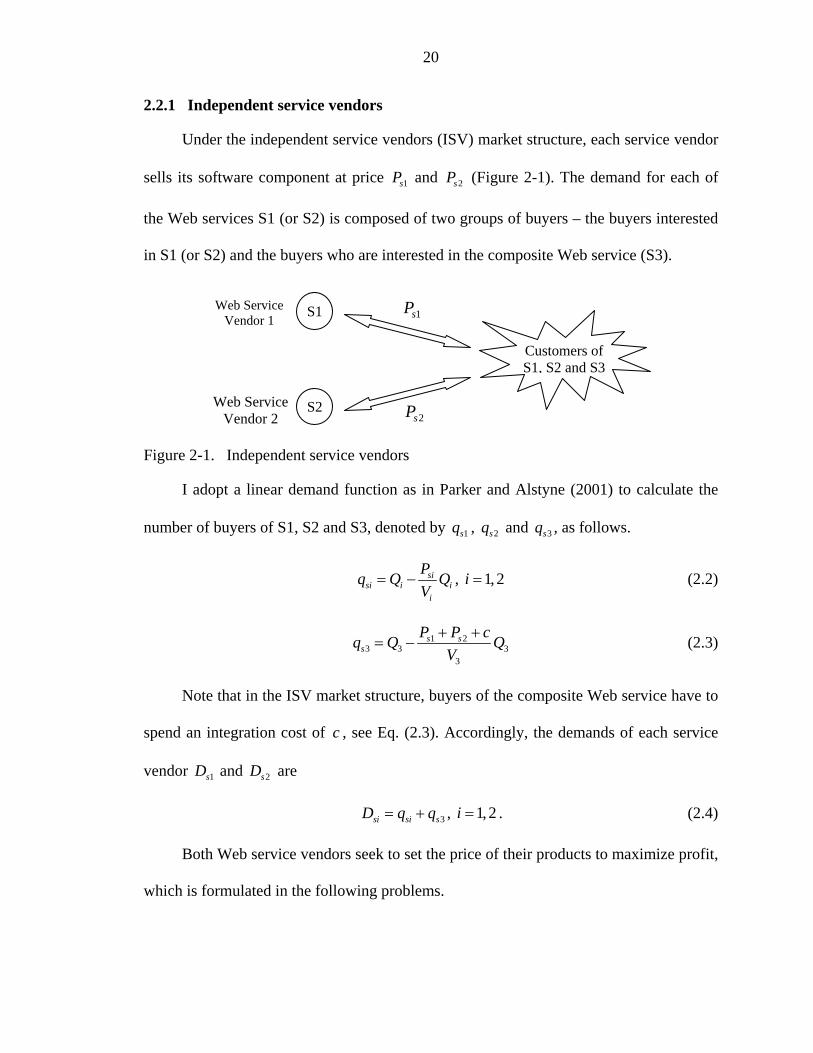
2.2.1 Independent service vendors
Under the independent service vendors (ISV) market structure, each service vendor
sells its software component at price 1sP and 2sP (Figure 2-1). The demand for each of
the Web services S1 (or S2) is composed of two groups of buyers – the buyers interested
in S1 (or S2) and the buyers who are interested in the composite Web service (S3).
Figure 2-1. Independent service vendors
I adopt a linear demand function as in Parker and Alstyne (2001) to calculate the
number of buyers of S1, S2 and S3, denoted by 1sq , 2sq and 3sq , as follows.
sisi i i
i
Pq Q QV
= − , 1, 2i = (2.2)
1 23 3 3
3
s ss
P P cq Q QV
+ += − (2.3)
Note that in the ISV market structure, buyers of the composite Web service have to
spend an integration cost of c , see Eq. (2.3). Accordingly, the demands of each service
vendor 1sD and 2sD are
3si si sD q q= + , 1, 2i = . (2.4)
Both Web service vendors seek to set the price of their products to maximize profit,
which is formulated in the following problems.
S1
S2
Web Service Vendor 1
Web Service Vendor 2 2sP
Customers of S1, S2 and S3
1sP

21
1 23 3
3
( ) ( )max si
si s ssi si si si siP i i
i
P P P cP D P Q Q P Q QV V
π + += ⋅ = − + − , 1, 2i = (2.5)
By solving the first order conditions of both service vendors simultaneously, one
derives the equilibrium optimal prices of Web services S1 and S2 in Eq. (2.6).
Subsequently, the optimal profits of the two service vendors *siπ can be calculated by
plugging the prices in Eq. (2.6) into the profit function. Unfortunately, the complexity of
*siπ prohibits an explicit display of its functional from.
2 2 2 2* 1 2 3 2 3 3 1 3 2 3 2 3 3 3 2 3 3 2 2 3 2 31 12 2
1 2 3 1 3 2 3 2 3 1 3 3 1 2
2 2 2 2* 1 2 3 1 3 3 2 3 1 3 1 3 3 3 1 3 3 1 1 3 1 32 2
1 2 3 1 3 2 3 2 3
2 2 2 24 4 4 3
2 2 2 24 4 4
s
s
Q Q V Q Q V Q Q V V cQ Q V Q V V cQ V Q Q V VP VQ Q V Q Q V V Q Q VV Q VV
Q Q V Q Q V Q Q VV cQ Q V Q VV cQ V Q Q VVPQ Q V Q Q V V Q Q V
⎛ ⎞+ + − + − −= ⎜ ⎟+ + +⎝ ⎠
+ + − + − −=
+ + 221 3 3 1 23
VV Q VV
⎛ ⎞⎜ ⎟+⎝ ⎠
(2.6)
It should be pointed out, however, that if the integration cost is prohibitively high,
there could be no demand of the integrated product, i.e., 3 0sq = . In that case, the service
vendors’ profit-maximizing problem reduces to
ˆ
ˆˆˆmax ( )si
sisi si i i
Pi
PP Q QV
π = − , 1, 2i = . (2.7)
By inspection, the optimal prices and profits in case of no demand for the
composite Web service are
*ˆ2
isi
VP = , *ˆ4i i
siV Qπ = , 1, 2i = . (2.8)
Summarizing the results of Eqs. (2.6) and (2.8), one gets the optimal profits for the
each of the independent service vendors in the ISV market structure as follows.
* * *ˆmax{ , }si si siπ πΠ = , 1, 2i = . (2.9)
22
In order to make the three market strategies comparable, I take a “macro” market
view of the independent service vendors. That is, I use the sum of the independent
service vendor’s optimal profits as a measurement of the goodness of ISV market
structure. The optimal profit of the ISV market strategy is defined as * * *1 2s s sΠ = Π + Π ,
where *siΠ ( 1, 2i = ) are described in Eq. (2.9).
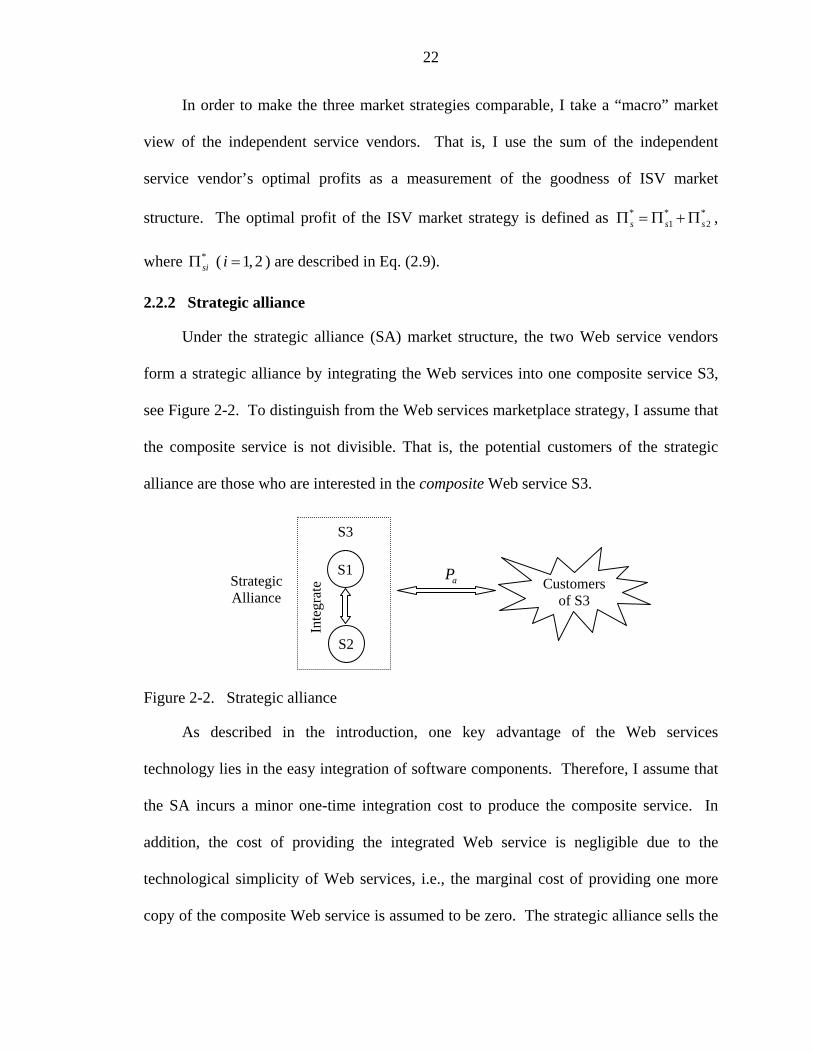
2.2.2 Strategic alliance
Under the strategic alliance (SA) market structure, the two Web service vendors
form a strategic alliance by integrating the Web services into one composite service S3,
see Figure 2-2. To distinguish from the Web services marketplace strategy, I assume that
the composite service is not divisible. That is, the potential customers of the strategic
alliance are those who are interested in the composite Web service S3.
Figure 2-2. Strategic alliance
As described in the introduction, one key advantage of the Web services
technology lies in the easy integration of software components. Therefore, I assume that
the SA incurs a minor one-time integration cost to produce the composite service. In
addition, the cost of providing the integrated Web service is negligible due to the
technological simplicity of Web services, i.e., the marginal cost of providing one more
copy of the composite Web service is assumed to be zero. The strategic alliance sells the
aP Customers of S3
S1
S2
S3
Strategic Alliance
Inte
grat
e
23
composite service at price aP . The consumers don’t incur additional integration cost
when they buy S3 from the SA. Since the integrated Web service is indivisible, the
potential buyers of the SA are the buyers of S3. The strategic alliance seeks to optimally
set the price of the composite service ( aP ) to maximize profit, which is formulated as
3 33
( )max a
aa aP
PP Q QV
π = − (2.10)
Solving the first order condition of Eq. (2.10) yields the optimal price and profit of
the strategic alliance, summarized as follows.
* 3
2aVP = , * 3 3
4aV Q
Π = . (2.11)
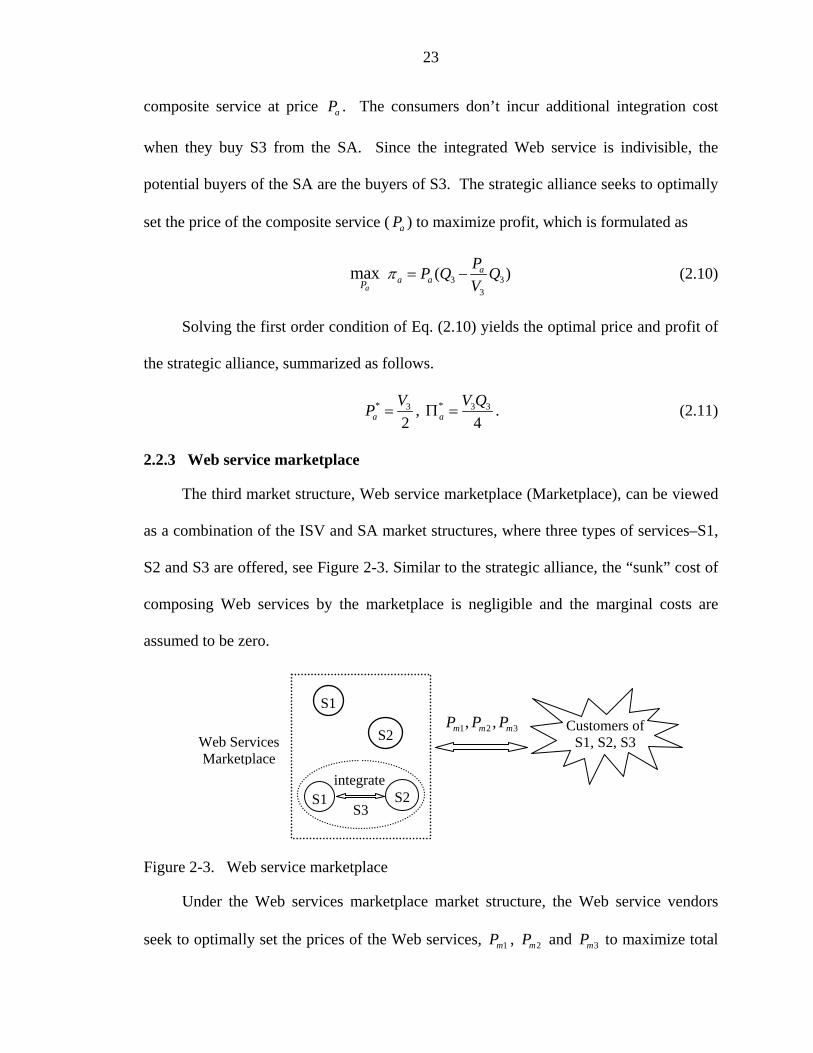
2.2.3 Web service marketplace
The third market structure, Web service marketplace (Marketplace), can be viewed
as a combination of the ISV and SA market structures, where three types of services–S1,
S2 and S3 are offered, see Figure 2-3. Similar to the strategic alliance, the “sunk” cost of
composing Web services by the marketplace is negligible and the marginal costs are
assumed to be zero.
Figure 2-3. Web service marketplace
Under the Web services marketplace market structure, the Web service vendors
seek to optimally set the prices of the Web services, 1mP , 2mP and 3mP to maximize total
Customers of S1, S2, S3 Web Services
Marketplace
S1
S2
S1 S2 integrate
S3
1 2 3, ,m m mP P P
24
profit. To ensure that the demand for the composite Web service S3 is non-negative, the
price of the composite Web service sold by the marketplace cannot exceed the total cost
of creating S3 by the consumers themselves, i.e., 3 1 2m m mP P P c≤ + + . Put in math, the
optimization problem in the Marketplace structure can be formulated in Eq. (2.12).
1 2 3
3 1 2
1 2 31 1 1 2 2 2 3 3 3, ,
1 2 3max ( ) ( ) ( )
s.t m m m
m m m
m m mm m m mP P P
P P P c
P P PP Q Q P Q Q P Q QV V V
π
≤ + +
= − + − + − (2.12)
The constrained profit maximization problem defined in Eq. (2.12) can be solved
using KKT conditions. The similar approach is used in proving Lemma 2-3 in the next
section. The optimal total profit under the Web service marketplace market structure is
described as follows.
* 3 1 2
*
3 1 21 1 2 2 3 3
( ) if 2
( )1 ( ) if 4 2
m
m
V V Vc
V V VV Q V Q V Q c
π − +⎧ <⎪⎪Π = ⎨ − +⎪ + + ≥⎪⎩
, (2.13)
where
2 2 2 2 2 2* 1 2 1 3 1 3 1 2 2 1 2 3 2 3 2 1 3 1 3 2 3 2 3 1
1 3 2 1 2 3 2 3 1
21 2 3 3 1 2 2 3 1 3 1 2
1 3 2 1 2 3 2 3 1
4( )
(4 4 4 4 2 2 2 )4( )
mQ Q VV Q Q VV Q QV V Q Q V V Q QV V Q Q V V
Q Q V Q Q V Q Q V
Q Q Q cV cV cV c V V VV VVQ Q V Q Q V Q Q V
π + + + + +=
+ +
− − − + + −+
+ + .
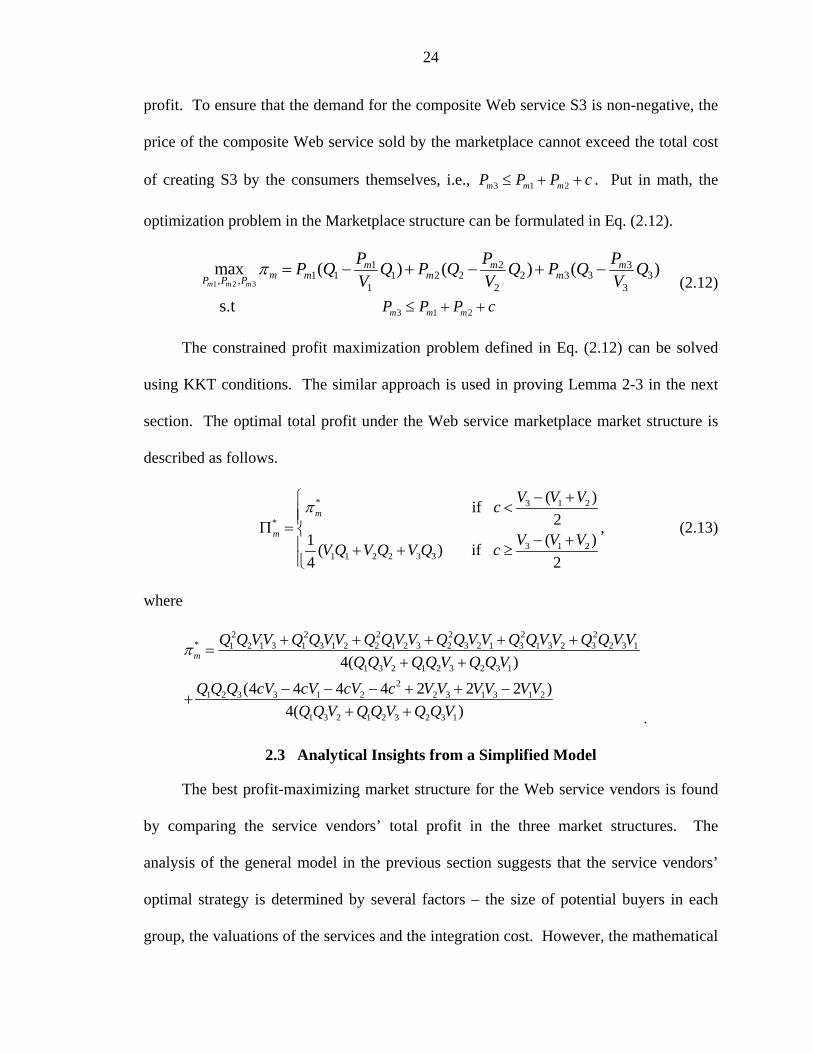
2.3 Analytical Insights from a Simplified Model
The best profit-maximizing market structure for the Web service vendors is found
by comparing the service vendors’ total profit in the three market structures. The
analysis of the general model in the previous section suggests that the service vendors’
optimal strategy is determined by several factors – the size of potential buyers in each
group, the valuations of the services and the integration cost. However, the mathematical
25
complexity of the general model, especially the optimal total profit of the independent
service vendors (see the optimal prices in Eq. (2.6)), makes the analysis of optimal
market structure technically intractable. Therefore, the following two simplifying
assumptions are made to modify the general model in order to gain insights from
analytical study. First, I assume that there are (approximately) equal number of potential
customers of S1 and S2. Secondly, it is assumed that the potential customers of S1 and
S2 have (approximately) equal valuations of the two services. By imposing the
assumptions, we can focus on studying the impact of integration cost on optimal market
structure first. The assumptions are specified mathematically as follows.
1 2Q Q Q= = and 1 2V V V= = (2.14)
In the simplified model, I study a symmetric market where the two complementary
services are valued equally and both Web service vendors enjoy the same market
potential. At the same time, the relationship between the integration cost and the
valuations of the services, described in Eq. (2.1), still holds in the simplified model.
Plugging Eq. (2.14) into the general model, I derive the optimal total profits under the
three market structures in the context of a symmetric market, which are summarized in
the following lemmas.
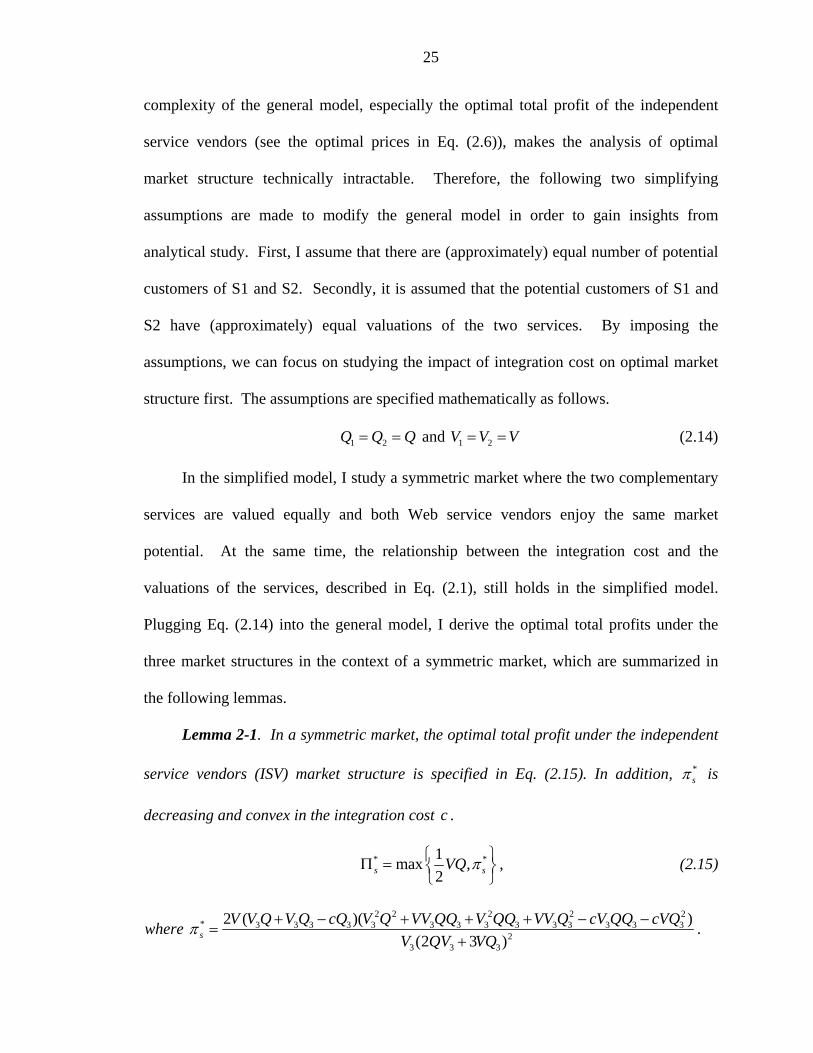
Lemma 2-1. In a symmetric market, the optimal total profit under the independent
service vendors (ISV) market structure is specified in Eq. (2.15). In addition, *sπ is
decreasing and convex in the integration cost c .
* *1max ,2s sVQ π⎧ ⎫Π = ⎨ ⎬
⎩ ⎭, (2.15)
where 2 2 2 2 2
* 3 3 3 3 3 3 3 3 3 3 3 3 3 32
3 3 3
2 ( )( )(2 3 )s
V V Q V Q cQ V Q VV QQ V QQ VV Q cV QQ cVQV QV VQ
π + − + + + − −=
+.
26
Figure 2-4. Optimal profit of ISV
Lemma 2-2. In a symmetric market, the optimal total profit of the strategic
alliance is specified in Eq. (2.11).
Proof. Because the strategic alliance sells the composite Web service only, the
valuation and market size of the individual Web services won’t affect the strategic
alliance’s profit. Q.E.D.
Lemma 2-3. In a symmetric market, the optimal total profit of the Web services
marketplace is
* 3
*
33 3
2 if 2
21 1 if 2 4 2
m
m
V Vc
V VVQ V Q c
π −⎧ <⎪⎪Π = ⎨ −⎪ + ≥⎪⎩
, (2.16)
where 2
* 3 33 3
3 3
( 2 2 )1 12 4 4( 2 )m
QQ V V cVQ V QQV Q V
π − −= + −
+.
Lemma 2-4. *mπ is increasing and concave in the integration cost c . *
mΠ is
increasing in the valuation ( 3V ) and market potential ( 3Q ) of the composite service. In
addition, the total profit of the marketplace is at minimum when 0c = , which is
described in Eq. (2.17).
2
* 3 3
3 3
( )( 0)2( 2 )mVV Q Qc
QV VQπ +
= =+
(2.17)
*sπ
/ 2VQ
*sΠ
Integration cost (c)0

27
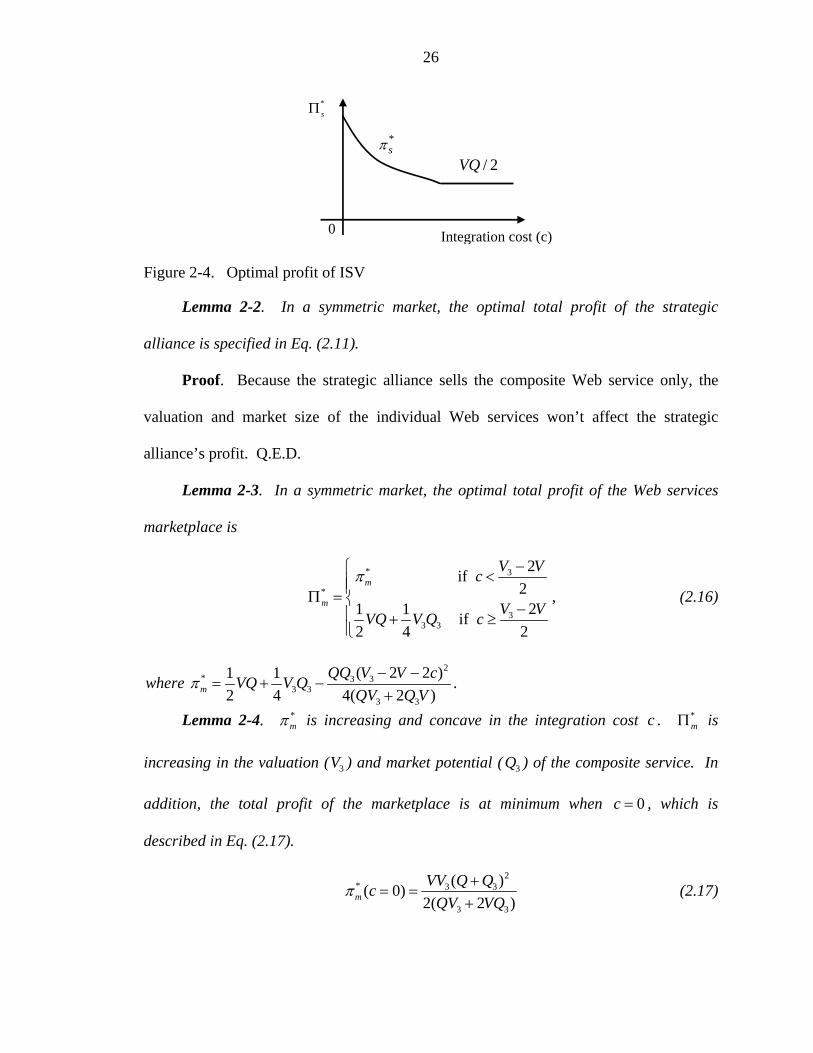
Figure 2-5. Optimal profit of marketplace w.r.t. c
Lemma 2-5. In a symmetric market, the optimal profit of the Web services
marketplace takes the form of *mπ when 3 4V V> ; the optimal profit switches from *
mπ to
3 31 12 4
VQ V Q+ when 32 4V V V< < ; the optimal profit takes the form of 3 31 12 4
VQ V Q+ if
3 2V V V< < .
Proof. Lemma 2-3 suggests that the optimal profit of the Web services
marketplace is bimodal, which depends on the relationship between V , 3V and c .
According to Eq. (2.16), the optimal profit is *mπ if 3 2
2V Vc −
< while the optimal profit
is 3 31 12 4
VQ V Q+ if 3 22
V Vc −≥ . Recall our assumption in Eq. (2.1) that the integration
cost can’t exceed the values of Web services being integrated, i.e., 0 c V< < ,
accordingly, there are three possible functional forms of the profit with respect to 3V . In
particular, if 3 4V V> , 3 22
V Vc −< is always satisfied; if 3 2V V V< < , 3 2
2V Vc −
≥ is
always satisfied; if 32 4V V V< < , either 3 22
V Vc −< or 3 2
2V Vc −
≥ applies. Q.E.D.
Lemma 2-1 to 2-4 describes the optimal profits under three market structures.
Figures 2-4 and 2-5 plot the behavior of the profit under the ISV and marketplace market
Integration cost
Profit
*mΠ 3 3/ 2 / 4VQ V Q+
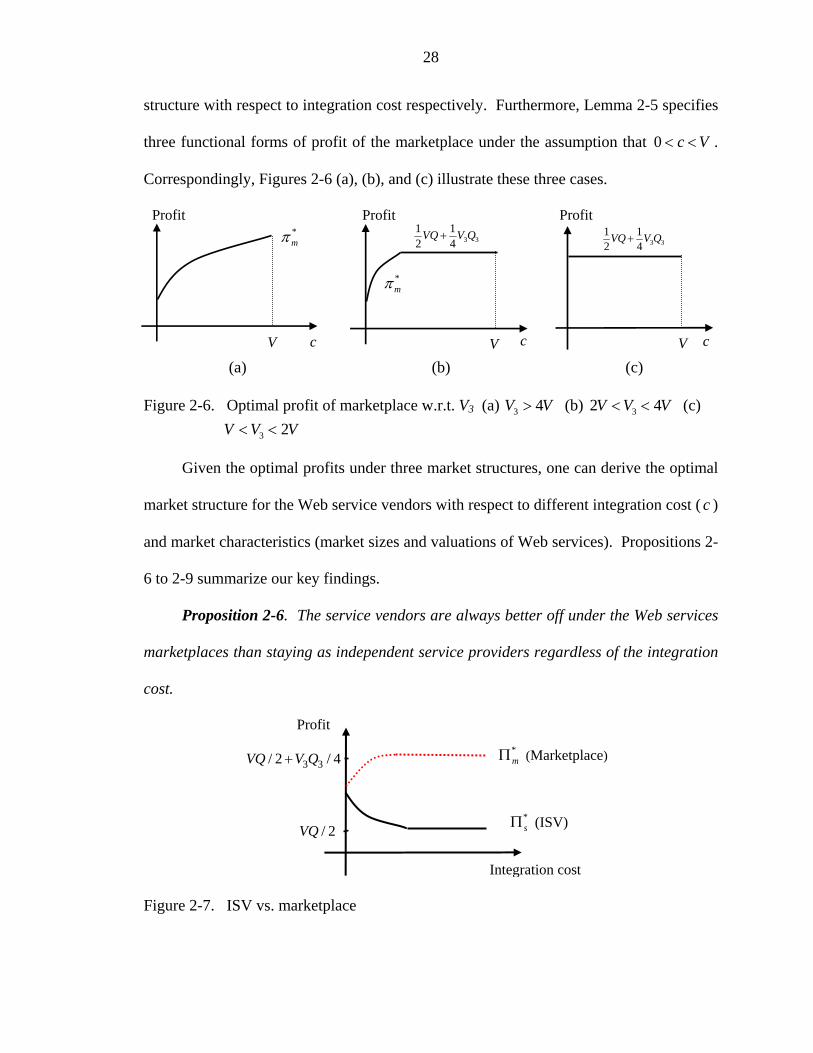
28
structure with respect to integration cost respectively. Furthermore, Lemma 2-5 specifies
three functional forms of profit of the marketplace under the assumption that 0 c V< < .
Correspondingly, Figures 2-6 (a), (b), and (c) illustrate these three cases.
(a) (b) (c)
Figure 2-6. Optimal profit of marketplace w.r.t. V3 (a) 3 4V V> (b) 32 4V V V< < (c)
3 2V V V< <
Given the optimal profits under three market structures, one can derive the optimal
market structure for the Web service vendors with respect to different integration cost ( c )
and market characteristics (market sizes and valuations of Web services). Propositions 2-
6 to 2-9 summarize our key findings.
Proposition 2-6. The service vendors are always better off under the Web services
marketplaces than staying as independent service providers regardless of the integration
cost.
Figure 2-7. ISV vs. marketplace
*sΠ (ISV) / 2VQ
Integration cost
Profit
3 3/ 2 / 4VQ V Q+*mΠ (Marketplace)
Profit
c V
*mπ
Profit
cV
*mπ
3 31 12 4
VQ V Q+
Profit
c V
3 31 12 4
VQ V Q+
29
Proposition 2-7. When *3V V V< < , Web services marketplace is the dominant
market structure, regardless of the integration cost. Specifically,
*3 3(2 4 ) /( )V Q Q Q V= + (2.18)
Proposition 2-8. When * **3V V V< < , strategic alliance is the optimal market
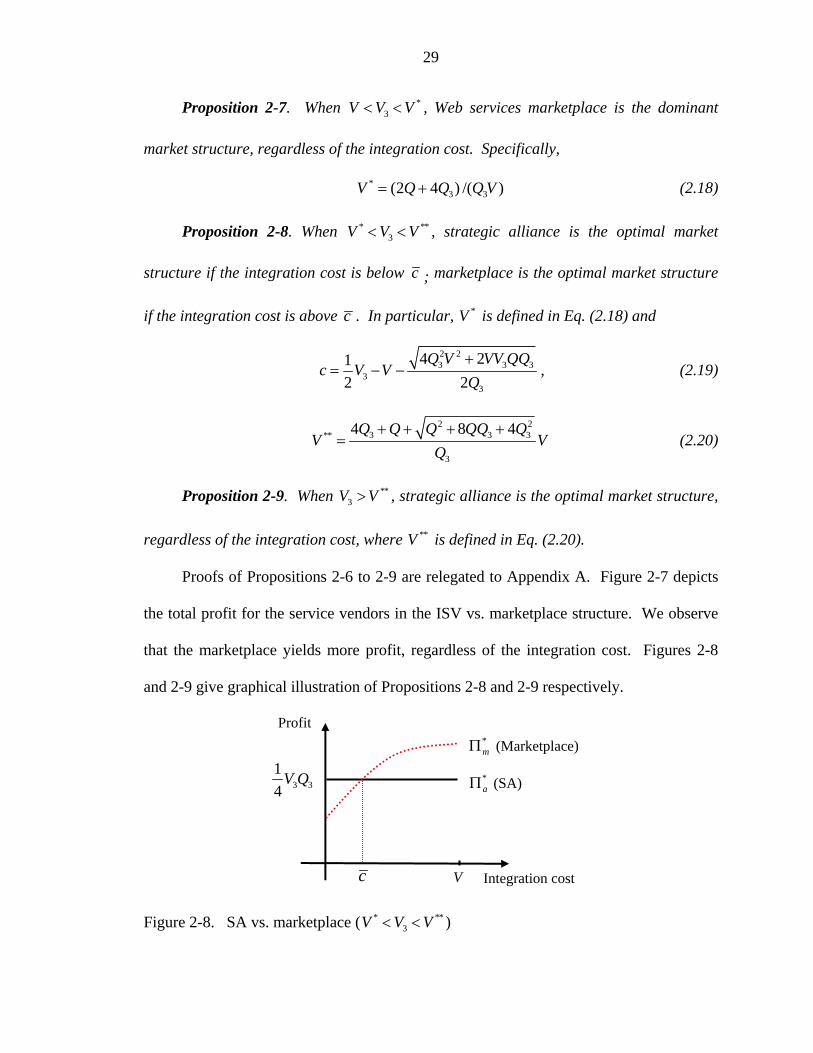
structure if the integration cost is below c ; marketplace is the optimal market structure
if the integration cost is above c . In particular, *V is defined in Eq. (2.18) and
2 23 3 3
33
4 212 2
Q V VV QQc V V
Q+
= − − , (2.19)
2 2
3 3 3**
3
4 8 4Q Q Q QQ QV V
Q+ + + +
= (2.20)
Proposition 2-9. When **3V V> , strategic alliance is the optimal market structure,
regardless of the integration cost, where **V is defined in Eq. (2.20).
Proofs of Propositions 2-6 to 2-9 are relegated to Appendix A. Figure 2-7 depicts
the total profit for the service vendors in the ISV vs. marketplace structure. We observe
that the marketplace yields more profit, regardless of the integration cost. Figures 2-8
and 2-9 give graphical illustration of Propositions 2-8 and 2-9 respectively.
Figure 2-8. SA vs. marketplace ( * **
3V V V< < )
*aΠ (SA) 3 3
14
V Q
Integration cost
Profit *mΠ (Marketplace)
c V

30
Figure 2-9. SA vs. marketplace ( **3V V> )
2.4 Computational Explorations
From the simplified model, we observe that the integration cost plays a critical role
in determining the optimal market structure for the Web service vendors. In addition, the
optimal market structure also depends on the valuations and the sizes of market potential
of the individual and composite Web services in a symmetric market. To complete our
analysis on optimal market structure, one should consider the general cases where 1 2V V≠
and 1 2Q Q≠ . Due to the technical intractability, we resort to numerical experiments to
draw insights from the generalized model in this section.
In the numerical experiments, I focus on the situations where the valuations and the
market potentials of the individual services are different. Without loss of generality,
experiments are conducted assuming 1 2V V> since one can always exchange Web service
1 and service 2 without changing the results. In addition, we run the experiments under
the constraints specified in Eq. 2-1 (i.e., 3 1 2max{ , }V V V> , 1 2min{ , }c V V< ).
Insights from the numerical experiments are summarized in Observations 2-1 and
2-2. Table 2-1 describes the design of the experiments, which classifies six combination
scenarios of iV and iQ ( 1,2,3i = ).
*aΠ (SA)
3 314
V Q
Integration cost
Profit
*mΠ (Marketplace)
V
31
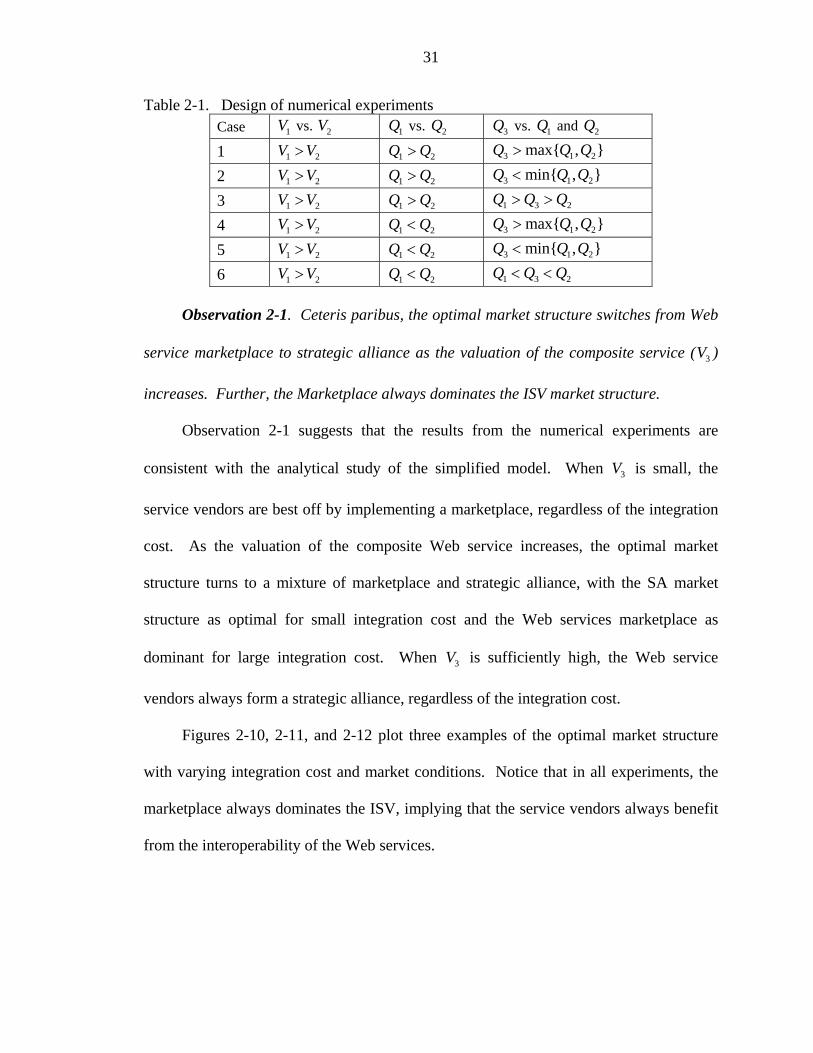
Table 2-1. Design of numerical experiments Case 1V vs. 2V 1Q vs. 2Q 3Q vs. 1Q and 2Q
1 1 2V V> 1 2Q Q> 3 1 2max{ , }Q Q Q> 2 1 2V V> 1 2Q Q> 3 1 2min{ , }Q Q Q< 3 1 2V V> 1 2Q Q> 1 3 2Q Q Q> > 4 1 2V V> 1 2Q Q< 3 1 2max{ , }Q Q Q> 5 1 2V V> 1 2Q Q< 3 1 2min{ , }Q Q Q< 6 1 2V V> 1 2Q Q< 1 3 2Q Q Q< <
Observation 2-1. Ceteris paribus, the optimal market structure switches from Web
service marketplace to strategic alliance as the valuation of the composite service ( 3V )
increases. Further, the Marketplace always dominates the ISV market structure.
Observation 2-1 suggests that the results from the numerical experiments are
consistent with the analytical study of the simplified model. When 3V is small, the
service vendors are best off by implementing a marketplace, regardless of the integration
cost. As the valuation of the composite Web service increases, the optimal market
structure turns to a mixture of marketplace and strategic alliance, with the SA market
structure as optimal for small integration cost and the Web services marketplace as
dominant for large integration cost. When 3V is sufficiently high, the Web service
vendors always form a strategic alliance, regardless of the integration cost.
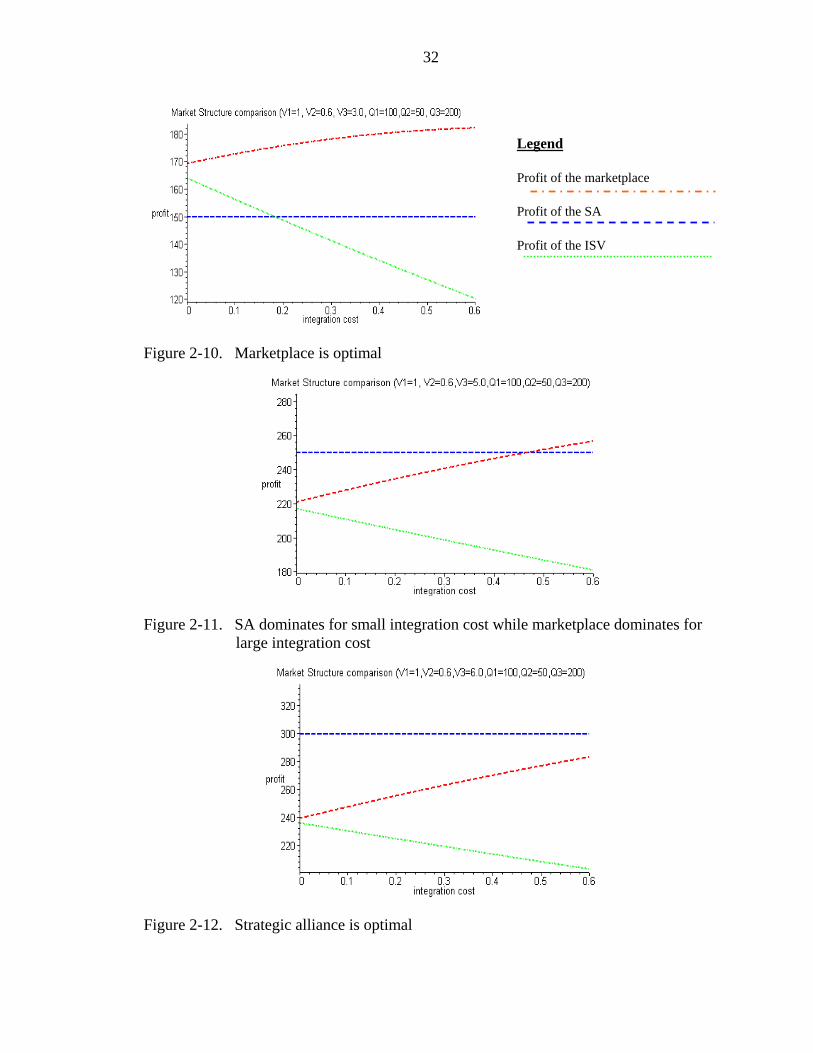
Figures 2-10, 2-11, and 2-12 plot three examples of the optimal market structure
with varying integration cost and market conditions. Notice that in all experiments, the
marketplace always dominates the ISV, implying that the service vendors always benefit
from the interoperability of the Web services.
32
Figure 2-10. Marketplace is optimal
Figure 2-11. SA dominates for small integration cost while marketplace dominates for large integration cost
Figure 2-12. Strategic alliance is optimal
Legend Profit of the marketplace Profit of the SA Profit of the ISV
33
Observation 2-2. The threshold of 3V for SA to surpass Marketplace is decreasing
in potential market size of the composite service ( 3Q ). In addition, the threshold value is
smaller in a market where 1 2V V> and 1 2Q Q< than in market where 1 2V V> and
1 2Q Q> .
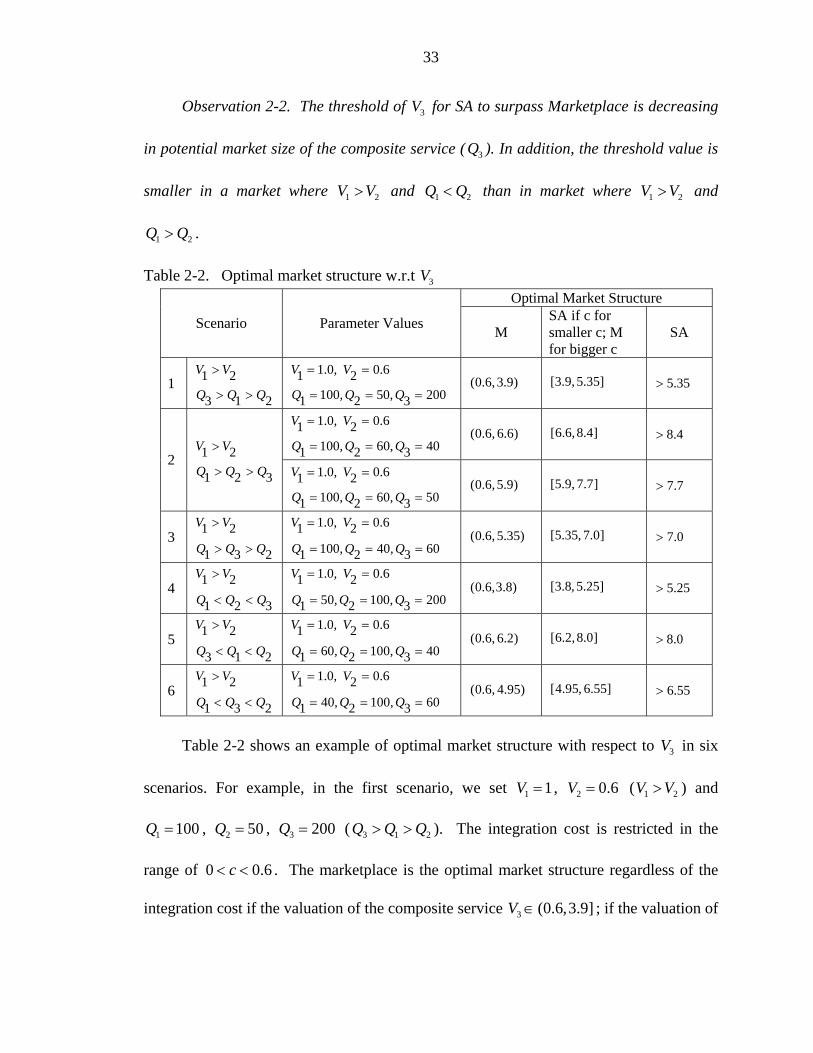
Table 2-2. Optimal market structure w.r.t 3V Optimal Market Structure
Scenario Parameter Values M SA if c for smaller c; M for bigger c
SA
1 1 2V V>
3 1 2Q Q Q> >
1.0, 0.61 2V V= =
100, 50, 2001 2 3Q Q Q= = = (0.6, 3.9) [3.9, 5.35] 5.35>
1.0, 0.61 2V V= =
100, 60, 401 2 3Q Q Q= = = (0.6, 6.6) [6.6,8.4] 8.4>
2 1 2V V>
1 2 3Q Q Q> > 1.0, 0.61 2V V= =
100, 60, 501 2 3Q Q Q= = = (0.6, 5.9) [5.9, 7.7] 7.7>
3 1 2
1 3 2
V V
Q Q Q
>
> >
1.0, 0.61 2100, 40, 601 2 3
V V
Q Q Q
= =
= = = (0.6, 5.35) [5.35, 7.0] 7.0>
4 1 2
1 2 3
V V
Q Q Q
>
< <
1.0, 0.61 250, 100, 2001 2 3
V V
Q Q Q
= =
= = = (0.6,3.8) [3.8, 5.25] 5.25>
5 1 2
3 1 2
V V
Q Q Q
>
< <
1.0, 0.61 260, 100, 401 2 3
V V
Q Q Q
= =
= = = (0.6, 6.2) [6.2,8.0] 8.0>
6 1 2
1 3 2
V V
Q Q Q
>
< <
1.0, 0.61 240, 100, 601 2 3
V V
Q Q Q
= =
= = = (0.6, 4.95) [4.95, 6.55] 6.55>
Table 2-2 shows an example of optimal market structure with respect to 3V in six
scenarios. For example, in the first scenario, we set 1 1V = , 2 0.6V = ( 1 2V V> ) and
1 100Q = , 2 50Q = , 3 200Q = ( 3 1 2Q Q Q> > ). The integration cost is restricted in the
range of 0 0.6c< < . The marketplace is the optimal market structure regardless of the
integration cost if the valuation of the composite service 3 (0.6,3.9]V ∈ ; if the valuation of
34
the composite service 3 (3.9,5.35]V ∈ , the optimal market structure is dependent on the
integration cost, with the strategic alliance as optimal for small integration cost and the
marketplace as optimal for large integration cost; the strategic alliances becomes the
dominant strategy for the service vendors if the valuation of the composite service
satisfies 3 5.35V > , regardless of the integration cost. The threshold values of the
composite service valuations ( 3V ) in this experiment are 3.9 and 5.35, where the
marketplace turns from less dominant to being dominated. Another interesting
observation from the numerical experiment is that a more “balanced” market tends to
favor the strategic alliance. This can be shown by comparing case 3, a polarized market
where service vendor 1 has apparent advantages over service vendor 2 ( 1 2V V> , 1 2Q Q> ),
against case 6, a balanced market where both service provider 1 and service provider 2
has certain market advantage ( 1 2V V> , 1 2Q Q< ). With the same market potential of the
integrated service ( 3Q ), the Strategic Alliance beats the marketplace if 3 7.0V > in case 3
while the marketplace is dominated by the strategic alliance if 3 6.55V > in case 6.
Observation 2-1 suggests that a higher valuation for the composite component ( 3V )
tends to favor the strategic alliance. Observation 2-2 further describes how the threshold
value is affected by the market potential of the composite service. At first sight, this
observation is somewhat obvious since the optimal profit of the strategic alliance is
3 3 / 4V Q , which is increasing in 3V and 3Q . However, the marketplace also sells the
composite product and its optimal profit is also increasing in the valuation and market
potential of the composite service (see Lemma 2-4). Observation 2-2 might result from
the fact that the profit of the marketplace is restricted in its price setting policy
35
3 1 2m m mP P P c≤ + + . In fact, it can be proved that the optimal price of the composite
software component in the marketplace is less than the optimal price in the strategic
alliance, see Appendix A. This suggests that the service vendors don’t necessarily
always benefit from diversifying their products. If the composite service is highly
valuable and has a large market potential, the service vendors are better off by
establishing a strategic alliance selling simply the composite service.
Another interesting observation from the numerical experiments suggests that a
more “balanced” market seem to favor the strategic alliance more than the marketplace.
The market is balanced if one service vendor sells a valuable service with small market
potential while the other service vendor sells a less valuable service with larger market
potential. In other words, if the service vendor each has some advantage in service
valuation or market power, they are more likely to form a cooperative strategic alliance.
On the other hand, if the market is extremely asymmetric with one service vendor selling
a highly valuable service and enjoying a large potential market, the service vendors are
more likely to prefer the Web services marketplace, which gives them a certain degree of
autonomy.
36
CHAPTER 3 OPTIMAL LOCATION AND PRICING OF AN INTEGRATED WEB SERVICE
While the Web services technology is a promising solution to bridging the platform
discrepancy and geographical distance between software components, some constraints
may impede the widespread adoption of Web services and the service-oriented
architecture. In particular, the performance of Web services is refrained by the
computing power of local servers and the robustness and capabilities of the underlying
network through which the Web services are distributed.
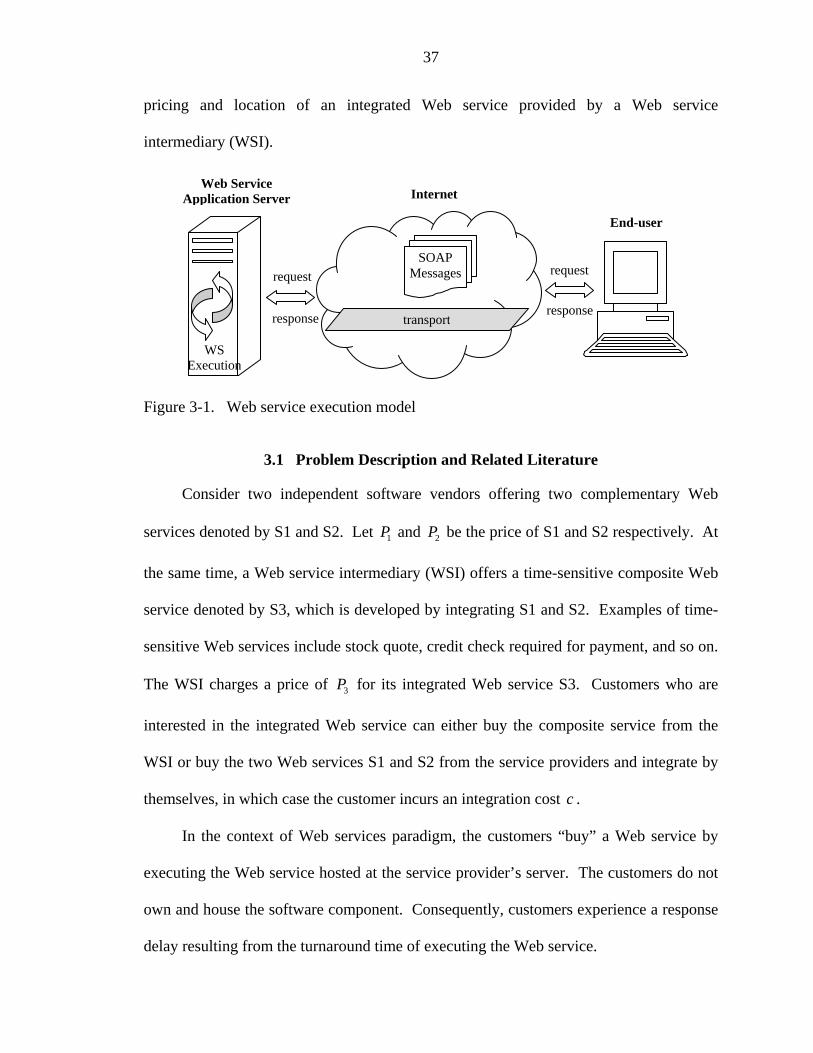
From technical perspectives, the execution of Web services follows the traditional
Client/Sever paradigm. Figure 3-1 illustrates an example of Web service consumption.
First, the Web service client sends a processing request to a remote Web service
application server. The Web service application server locates the appropriate Web
service and transforms (or “serializes”) the request into Web-services-compliant format
(SOAP) and then forward to a particular Web service to handle the request. The result is
transmitted over the network and finally transformed (or “deserializes”) in a format
understood by the end user. Overall, the response delay in Web service execution
consists of the computation time at the server and the network delay. Sometimes,
response time is especially important for time-sensitive applications such as stock quote
and instant messaging. As the computing power keeps increasing at decreasing cost, in
accord with the well-known Moore’s Law of computing, it’s not hard to predict that the
network latency will become a prominent part of the response delay for applications
distributed over the Internet. This chapter studies the impact of network delay on the
37
pricing and location of an integrated Web service provided by a Web service
intermediary (WSI).
Figure 3-1. Web service execution model
3.1 Problem Description and Related Literature
Consider two independent software vendors offering two complementary Web
services denoted by S1 and S2. Let 1P and 2P be the price of S1 and S2 respectively. At
the same time, a Web service intermediary (WSI) offers a time-sensitive composite Web
service denoted by S3, which is developed by integrating S1 and S2. Examples of time-
sensitive Web services include stock quote, credit check required for payment, and so on.
The WSI charges a price of 3P for its integrated Web service S3. Customers who are
interested in the integrated Web service can either buy the composite service from the
WSI or buy the two Web services S1 and S2 from the service providers and integrate by
themselves, in which case the customer incurs an integration cost c .
In the context of Web services paradigm, the customers “buy” a Web service by
executing the Web service hosted at the service provider’s server. The customers do not
own and house the software component. Consequently, customers experience a response
delay resulting from the turnaround time of executing the Web service.
Web Service Application Server
WS Execution
End-user
request
response
request
response
SOAP Messages
transport
Internet
38
In this chapter, we focus on the demand for the integrated Web service. Suppose
the reservation prices of the customers for the integrated service are sufficiently high so
that all customers have one unit demand for the composite Web service and they either
buy from the WSI or from the service vendors. A customer evaluates the total cost to
decide whether to buy the integrated Web service from the WSI or buy the individual
Web services from the service vendors and then create the integrated Web service by
herself. To be more specific, the total cost to “purchase” the integrated Web service
includes the price charged by the WSI (or the Web service vendors), delay cost and
integration cost (if the customer buys from the service vendors). In case a customer
incurs the same cost to, the customer will buy the composite Web service from the WSI
due to some valued-added services by the WSI.
As the response time is a major concern for consumers of time-sensitive integrated
Web service, it is important to analyze the composition of response time of applications
over the Internet. According to Johansson, et al. (2000), the response time of applications
over the Internet is composed of two parts − local processing time and network response
time. Local processing time is determined by the capacity of the local server and the
request load. Network response time can be further divided into transmit time, queuing
delay and network latency. Transmit time is related to network bandwidth while the
queuing delay is determined by capacity of network devices and amount of data
transmission jobs. Network latency is the time taken to transport data between two
locations on the network and is generally a function of physical distance between the two
nodes on the network. Johansson (2000) points out that while much research has been
done on network design in consideration of network bandwidth and device capacity, the
39
network latency is usually ignored in previous research. Since the cost of computing is
halved roughly every eighteen months and the network infrastructure has seen an
accelerating growth recently, the network latency will become one dominant term of
response time of applications over the Internet.
In an abstract sense, the Internet is composed of two parts, the cores and the edges.
Local servers and client machines are located at the edges, connected by the switches and
routers at the core. The network latency for exchanging data between the server and the
client is a function of number of routers and switches between them, which is correlated
with the physical distance between the server and the client. To model the impact of
network latency on the response time of Web services, let t be the delay cost per unit of
distance between the customer and the Web service provider where the distance
corresponds to the number of routers and switches between them.
The choice of optimal location for the WSI bears some resemblance to the facility
location problem in previous literature. Information systems research on network design
has traditionally taken an operations research (OR) approach, borrowing methods from
classic OR problems such as the facility location problem (Erlenkotter 1977). The
facility location problem, usually modeled as a mixed integer programming problem, is
defined as choosing the number of facilities and locations to minimize total cost (or
maximize profit) subject to capacity constraints, demand constraints and others. Solution
methodologies include developing heuristics based on dynamic programming (Li et al.
1999), Lagrangean relaxation (Liu et al. 2001), and so on. Sun (2003) and Sun and
Koehler (2003) were among the first to study the location model for Web service
intermediaries. Mixed integer programming models are proposed in Sun (2003) and Sun
40
and Koehler (2003) to decide the best location of a WSI by considering the usage
requirement, server’s capacity, and assignment constraints. Efficient heuristics were
developed to tackle the location problem as the proposed model became computationally
intractable.
Several special characteristics of Web services suggest solving the location and
pricing problem of the integrated Web service in a different way from traditional facility
location problems. First, while the facility setup cost is an important factor in the facility
location problem, I treat it as sunk cost and focus on the WSI’s revenue from selling the
composite Web service. Second, usually the facility location problem deals with cost
minimization and solves the decision problem for one single company without
consideration of competitions. The WSI, however, has to compete with the Web service
providers by choosing the right location and the right price for its integrated Web service.
Our problem is unique in that we consider the joint decision of location and pricing
problem in a market of complementary Web services. Last, as will be illustrated below,
the delay cost of accessing Web services for a customer in the network has several
complex functional forms, which is dependent on the location of the customer. Although
in facility location problems one can model the delay cost as a function of distance
between computing nodes, it does not provide the flexibility to choose different delay
cost functions for customers at different locations.
In this chapter, I propose a spatial model to study the joint location and pricing
decision problem for the WSI. The optimal location and price is first derived in a linear
city model. Then a unit circle model is applied to study the joint decision problem in a
more general context.
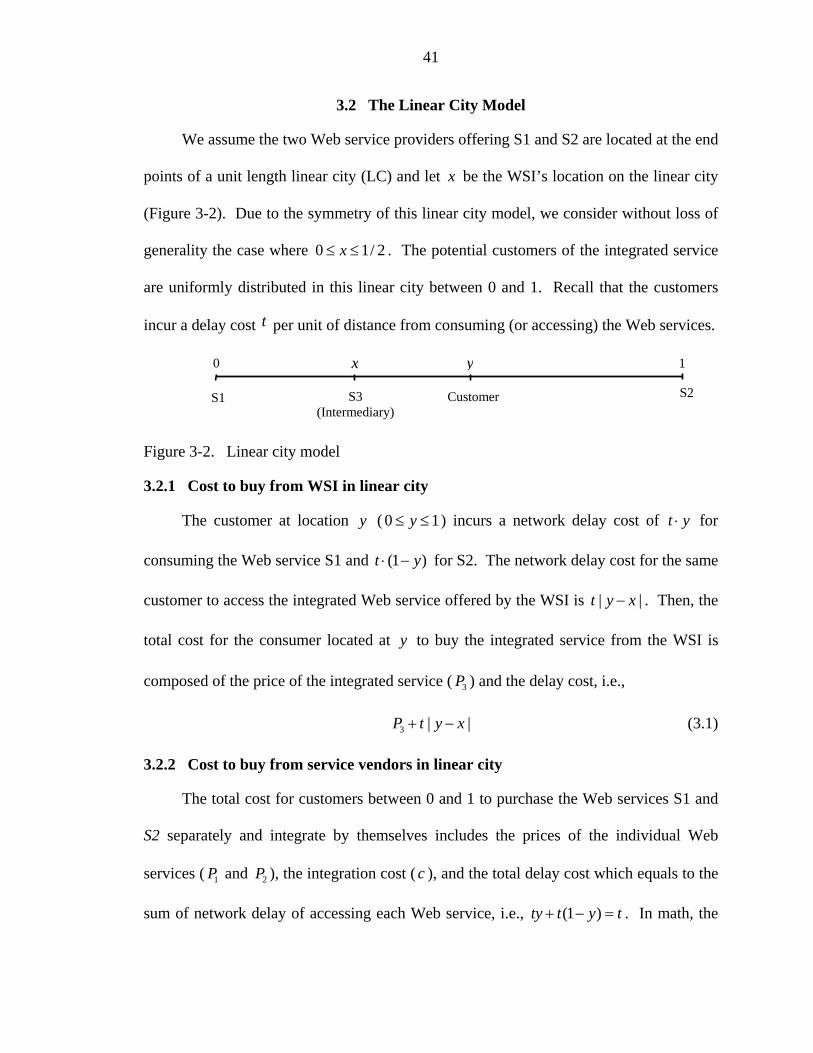
41
3.2 The Linear City Model
We assume the two Web service providers offering S1 and S2 are located at the end
points of a unit length linear city (LC) and let x be the WSI’s location on the linear city
(Figure 3-2). Due to the symmetry of this linear city model, we consider without loss of
generality the case where 0 1/ 2x≤ ≤ . The potential customers of the integrated service
are uniformly distributed in this linear city between 0 and 1. Recall that the customers
incur a delay cost t per unit of distance from consuming (or accessing) the Web services.
Figure 3-2. Linear city model
3.2.1 Cost to buy from WSI in linear city
The customer at location y ( 0 1y≤ ≤ ) incurs a network delay cost of t y⋅ for
consuming the Web service S1 and (1 )t y⋅ − for S2. The network delay cost for the same
customer to access the integrated Web service offered by the WSI is | |t y x− . Then, the
total cost for the consumer located at y to buy the integrated service from the WSI is
composed of the price of the integrated service ( 3P ) and the delay cost, i.e.,
3 | |P t y x+ − (3.1)
3.2.2 Cost to buy from service vendors in linear city
The total cost for customers between 0 and 1 to purchase the Web services S1 and
S2 separately and integrate by themselves includes the prices of the individual Web
services ( 1P and 2P ), the integration cost ( c ), and the total delay cost which equals to the
sum of network delay of accessing each Web service, i.e., (1 )ty t y t+ − = . In math, the
S1 S2 S3 (Intermediary)
Customer
0 1 x y
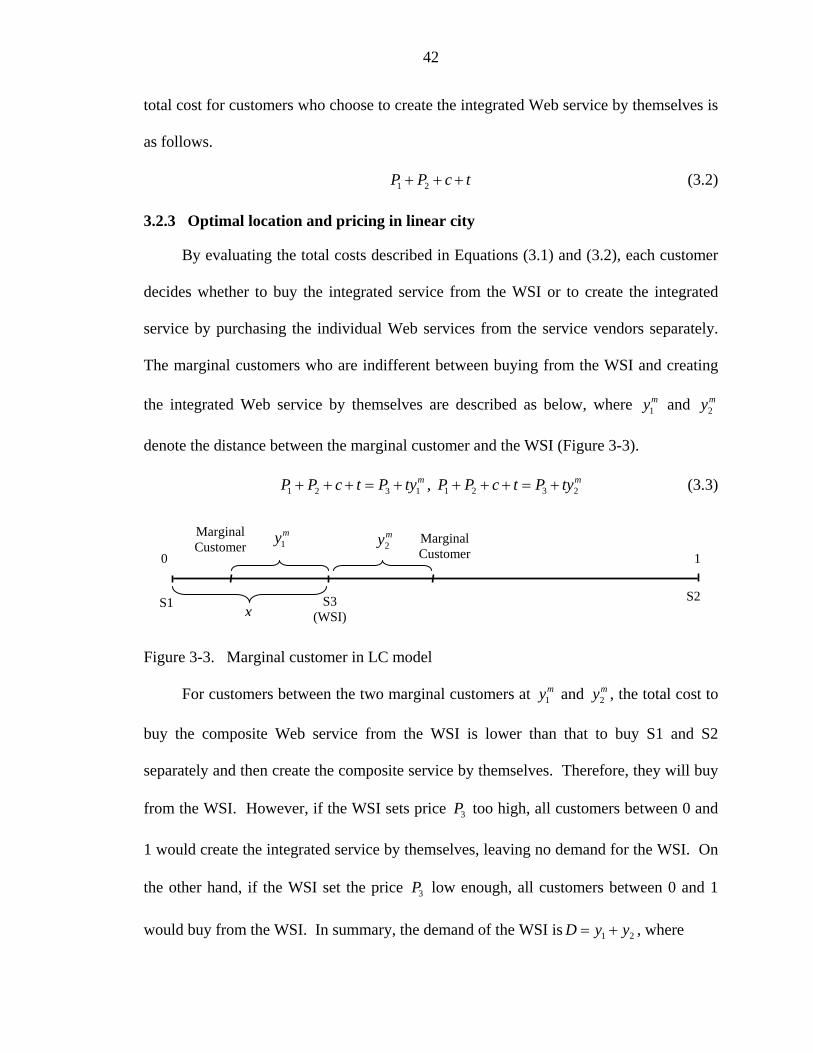
42
total cost for customers who choose to create the integrated Web service by themselves is
as follows.
1 2P P c t+ + + (3.2)
3.2.3 Optimal location and pricing in linear city
By evaluating the total costs described in Equations (3.1) and (3.2), each customer
decides whether to buy the integrated service from the WSI or to create the integrated
service by purchasing the individual Web services from the service vendors separately.
The marginal customers who are indifferent between buying from the WSI and creating
the integrated Web service by themselves are described as below, where 1my and 2
my
denote the distance between the marginal customer and the WSI (Figure 3-3).
1 2 3 1mP P c t P ty+ + + = + , 1 2 3 2
mP P c t P ty+ + + = + (3.3)
Figure 3-3. Marginal customer in LC model
For customers between the two marginal customers at 1my and 2
my , the total cost to
buy the composite Web service from the WSI is lower than that to buy S1 and S2
separately and then create the composite service by themselves. Therefore, they will buy
from the WSI. However, if the WSI sets price 3P too high, all customers between 0 and
1 would create the integrated service by themselves, leaving no demand for the WSI. On
the other hand, if the WSI set the price 3P low enough, all customers between 0 and 1
would buy from the WSI. In summary, the demand of the WSI is 1 2D y y= + , where
S1 S2
0
S3 (WSI)
Marginal Customer 1
Marginal Customer 2
my1my
x
43
0, if 0
, if 0
, if
mi
m mi i i
mi
y
y y y x
x y x
⎧ ≤⎪
= < <⎨⎪ ≥⎩
, 1, 2i = (3.4)
Accordingly, the joint decision of optimal location and pricing for the integrated
Web service by the WSI is formulated as follows
33 3 1 2,
( )
s.t Eq. (3.4)
maxP x
P D P y yπ = ⋅ = + (3.5)
Proposition 3-1. In the unit-length linear city model, the optimal price and profit
of the integrated Web service are *3 1 2
12
P P P c t= + + + and *1 2
12
P P c tπ = + + + . The
mid-point position between the service providers is the optimal location for the integrated
Web service, i.e., * 12
x = . Furthermore, the WSI captures the entire market demand by
charging *3P and *
3P increases faster with c than t .
Proof. The derivation of the optimal profit and location is quite tedious and the
details are delegated to the Appendix B. I just provide a sketch of proof here. This joint
decision problem is solved in two steps. First, I derive the optimal price and profit for the
WSI given any particular position x . Then, the optimal location is selected as the one
that yields the highest profit obtained in the previous step. Q.E.D.
Proposition 3-1 suggests that if all customers are located between the service
providers, in which case all customers incur the same cost if they integrate the composite
Web services by purchasing S1 and S2 from the service providers, the optimal location of
the WSI would be the midpoint position between the service providers. In addition, the
WSI is best off by charging a penetration price to capture entire market demand. In
44
addition, as the delay cost or the integration cost increases, the WSI should increase the
price of the composite Web service and obtain more profit. However, integration cost
has bigger impact on profit (and price) than the delay cost. It is quite intuitive that the
WSI gains more profit when the integration cost is higher since more customers will
switch to the WSI due to the higher cost of integrating the individual Web services.
However, when the delay cost increases, the costs of buying from the WSI and the
service providers will both increase. The increased profit of the WSI in the presence of
larger delay cost suggests that the negative impact of delay cost is higher for the service
providers than the WSI.
In the linear city model, it is assumed that the service vendors are located at
“extreme points” such that all customers are located between the service providers. As a
result, all customers experience equal delay cost if they buy the two Web services from
service vendors. In the next section, I shall relax this assumption by considering a unit
circle model.
3.3 The Unit Circle Model
In this section, I study the more general case with a unit circle (UC) model in which
not all customers are located between two Web service vendors. Let 0 be the location of
the first service provider on the unit circle, and the second service provider is located at
distance d clockwise from the first provider. Without loss of generality, we restrict our
attention to consider the case where 102
d≤ ≤ . Suppose the integrated Web service is
located at x clockwise ( 0 1x≤ < ) on the unit circle. There are N potential customers of
the integrated service uniformly distributed along the unit circle.
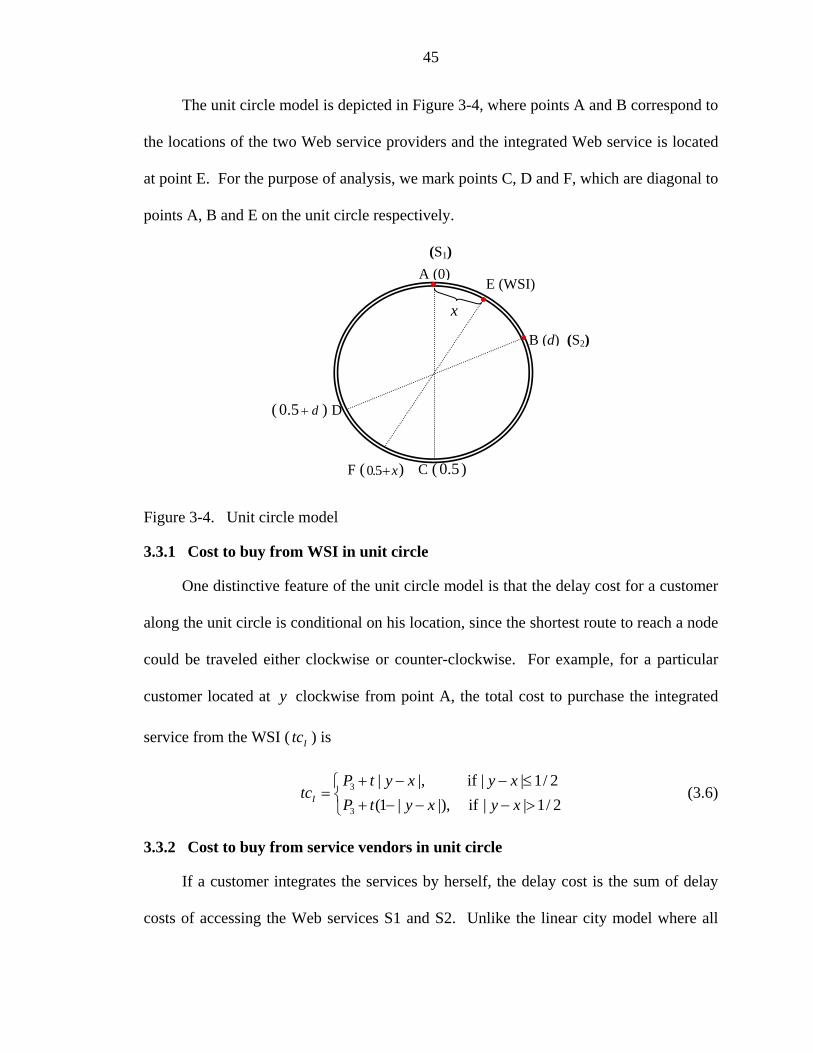
45
The unit circle model is depicted in Figure 3-4, where points A and B correspond to
the locations of the two Web service providers and the integrated Web service is located
at point E. For the purpose of analysis, we mark points C, D and F, which are diagonal to
points A, B and E on the unit circle respectively.
Figure 3-4. Unit circle model
3.3.1 Cost to buy from WSI in unit circle
One distinctive feature of the unit circle model is that the delay cost for a customer
along the unit circle is conditional on his location, since the shortest route to reach a node
could be traveled either clockwise or counter-clockwise. For example, for a particular
customer located at y clockwise from point A, the total cost to purchase the integrated
service from the WSI ( Itc ) is
3
3
| |, if | | 1/ 2(1 | |), if | | 1/ 2I
P t y x y xtc
P t y x y x+ − − ≤⎧
= ⎨ + − − − >⎩ (3.6)
3.3.2 Cost to buy from service vendors in unit circle
If a customer integrates the services by herself, the delay cost is the sum of delay
costs of accessing the Web services S1 and S2. Unlike the linear city model where all
(S1)A (0)
B (d) (S2)
C ( 0.5 )
( 0.5 d+ ) D
E (WSI)
x
F (0.5 x+ )
46
customers are located between the two service providers and incur the same delay cost
when accessing the Web services S1 and S2, customers at different locations experience
different response delay due to different shortest route of access. For example, a
customer located between A and B incur a delay cost of td , while a customer located
between C and D incur a delay cost of (1 )t d− . Customers located within the BC and
DA segments incur a delay cost between td and (1 )t d− . Equation (3.7) formulates the
total cost ( NItc ) for a customer at y ( 0 1y≤ < ) if he (or she) integrate the Web service
by oneself, which includes the prices of the Web services S1 and S2, the integration cost,
and delay cost.
1 2
1 2
1 2
1 2
, if 0(2 ), if 1/ 2(1 ), if 1/ 2 1/ 2(2 2 ), if 1/ 2 1
NI
P P c td y dP P c t y d d y
tcP P c t d y dP P c t y d d y
+ + + ≤ ≤⎧⎪ + + + − < ≤⎪= ⎨ + + + − < ≤ +⎪⎪ + + + − + + < <⎩
(3.7)
3.3.3 Optimal location and pricing in unit circle
Given the total costs Itc and NItc , one can find the location of the marginal
customer who is indifferent between buying the integrated Web service from the WSI
and from the Web service vendors. Consequently, the demand for the integrated Web
service at a particular location on the unit circle can be calculated as a function of the
delay cost, integration cost, distance between the individual service providers and their
prices. Using the same approach as in the previous section, one can solve the joint
decision problem of optimal location and pricing for the integrated Web service.
However, it is rather tedious since the cost functions of Itc and NItc have conditional
format, which in turn leads to complex profit function for the WSI. Therefore, I use a
different approach to solve the location and pricing problem in the unit circle model. The
47
following lemmas explain our logic of derivation. Further, results from analytical study
are presented in Propositions 3-5 and 3-6, followed by interpretations of managerial
insights.
Lemma 3-2. The highest market-covering price for the integrated Web service at
x is
1 2 1 2 1 2
1 23
1 2
1 2
min{ , (0.5 ), ( )}, 0( ), 0.5( 0.5), 0.5 0.5( 1), 0.5 1
P P c tx P P c t d P P c t d x x dP P c t d x d x
PP P c t d x dP P c t x d x
+ + + + + + − + + + − ≤ ≤⎧+ + + − < ≤
= ⎨ + + + − < ≤ ++ + + − + ≤ <
⎪⎪
⎪⎪⎩
(3.8)
Proof. The highest market-covering price is the highest price the WSI can charge
while still attracting all customers in market. This price is calculated in two steps. First,
for each customer I calculate the total cost to buy Web services from the service vendors
and then create the integrated Web service by himself (or herself). Then, the highest
market-covering price is selected as the lowest total costs for all customers in market.
Detailed derivation is left to Appendix B.
Lemma 3-3. When the WSI charges the highest market-covering price, the WSI
achieves maximum profit if the integrated Web service is located between the two Web
service providers.
Proof. When the WSI captures the entire market demand, its profit is constrained
by the highest price it can charge, which is conditional on the location of the integrated
Web service, as specified by the four cases in Eq. (3.8). By inspection, one gets
3 1 2P P P c≥ + + in the first case while 3 1 2P P P c≤ + + in the rest three cases. In other
words, if the integrated Web service is placed between the two service vendors, the
intermediary can charge a higher price while still captures entire market demand.
48
Therefore, the WSI will choose to locate the integrated Web service between the service
providers to maximize profit. Q.E.D.
Lemma 3-4. If the WSI raises its market-covering price 3P by 3ktPN
∆ = , where k
is a positive integer, it will lose no less than min{ , }k N customers. Furthermore, if
3( 1)kt k tP
N N+
< ∆ < , the WSI loses demand of no less than min{ 1, }k N+ .
Proof. See Appendix B.
Proposition 3-5. When 1 22( )t P P c≤ + + , it is optimal to host the integrated Web
service between the service providers of S1 and S2 and the optimal price is the highest
market-covering price specified in (3.8), i.e.,
*3 1 2 1 2 1 2min{ , (0.5 ), ( )}P P P c tx P P c t d P P c t d x= + + + + + + − + + + − (3.9)
Proof. Proposition 3-5 is derived from Lemma 3-2, 3-3 and 3-4. See Appendix B
for a detailed proof.
Proposition 3-6. When 1 22( )t P P c≤ + + and 13
d > , there are multiple optimal
locations for the WSI. The optimal location and pricing of the integrated Web service are
described in (3.10).
If 1 13 2
d< ≤ , *3 1 2
1( )2
P P P c t d= + + + − and *1 122 2
d x d− ≤ ≤ − (3.10)
On the other hand, when 1 22( )t P P c≤ + + and 103
d≤ ≤ , the optimal location and
pricing of the integrated Web service are described in Eq. (3.11).
If 103
d≤ ≤ , *3 1 2 / 2P P P c t= + + + and *
2dx = (3.11)

49
Propositions 3-5 and 3-6 are consistent with the analysis in the linear city model.
However, in the linear city model, the two Web service vendors are located at the end
points such that the integrated Web service can only be stored between them. In the unit
circle model, the WSI can choose the intensity of competition by locating at different
regions on the unit circle. For example, the competition between the WSI and the service
providers is maximal if the integrated Web service is located between A and B; In
contrast, the competition is minimal in section between C and D; Further, the sections
between BC and DA represent regions of moderate competition.
Proposition 3-5 suggests that if the delay cost is small, the WSI prefers maximum
competition and will set a low penetration price to capture the entire market demand. At
first sight, this result is quite “unconventional” in that classic economic theories, such as
the theory of Bertrand competition, suggest that firms prefer lesser competition in order
to avoid price war. This unusual result can be explained by two characteristics of the
Web service market. First, as an executable program distributed over the Internet, the
performance of a Web services based platform is greatly constrained by the underlying
networking infrastructure. In particular, a customer accessing the Web service incurs a
delay cost due to network latency, which is associated with the physical distance between
the customer and Web service application server. Second, due to the platform
independence and software modularity, a Web services based platform boasts the
flexibility of integrating multiple Web services on the fly, across the street or across the
ocean. Consequently, in case when multiple Web services at different locations are
accessed to compose an integrated Web service, the network delay of accessing the
integrated Web service is the sum of network latency of accessing each constituent Web
50
services. On the other hand, there’s only one single network delay when a customer
accesses an integrated Web service from the WSI directly. Therefore, although the WSI
faces a stronger competition when the integrated Web service is located between the two
Web service vendors, it will be compensated since it can charge a higher market-covering
price. In fact, this is not a deviant from the results in a Bertrand competition, since the
WSI sets a low penetration price to cover the entire market.
While the linear city model yields one single optimal location for the WSI,
Proposition 3-6 suggests that there could be multiple optimal locations for the integrated
Web service in the unit circle model. In fact, the result in the linear city model can be
viewed as a special case of the unit circle model since the mid-point position is always
the optimal location according to Proposition 3-6.
51
CHAPTER 4 OPTIMAL SUBSCRIPTION AND LISING FEE OF A WEB SERVICE
INTERMEDIARY
Depending on technical strengths and business scope, the Web service intermediary
(WSI) can play various roles in the Web service supply chain. In the previous chapter, I
focused on studying the optimal strategy for a WSI that provides integration service and
sells an integrated Web service. In this chapter, I study another model of WSI that does
not sell Web services of its own. Instead, the WSI offers aggregation service to match
the Web service vendors with the Web service consumers. In addition, the WSI provides
value-added services to take the advantage of its technical expertise.
One example of such WSI is Salcentral.com, which maintains a comprehensive
directory of Web services so that service consumers can browse, search for and audit
particular Web services. Another WSI, GrandCentral.com, provides a centralized Web
services network and acts as a trust broker that handles issues of message delivery and
routing, security, …, etc. In summary, the WSIs provide certain value-added services to
both Web service vendors and service requestors, allowing them to charge a fee to both
sides of the Web services supply chain.
In this chapter, I study the optimal strategies for the WSI in a supply chain of
complementary Web services. In particular, the WSI serves two groups of web service
vendors that provide Web services of complementary functionalities. The two
complementary Web services can be integrated by consumers to create a new composite
Web service. Correspondingly, the consumers are divided into three groups – those who
52
desire the two individual Web services and those for the composite Web service. The
WSI charges the Web service vendors a listing fee and the Web service consumers a
subscription fee in order to access the added value provided by the WSI. The added
value of the WSI consists of the “intrinsic” value and the “cross network externality”
value. The intrinsic value of the WSI refers to the standalone services offered by the
WSI such as Web service development tools, maintenance, and security. The cross
network externality value is proportional to the number of service vendors listed in and
the customers subscribing to the WSI. That is, the more service vendors listed on the
WSI, the more valuable it is for service consumers to subscribe to the intermediary, and
vice versa.
The Web services supply chain has several unique characteristics. First, unlike
traditional supply chain, the object supplied and consumed in the Web services supply
chain is not tangible physical goods, but rather software components residing at the
service provider’s computer server. Hence, most issues considered in traditional supply
chain literature such as inventory and ordering decisions of the distributor are no longer
relevant to the WSI. The major decision facing the WSI is how to optimally set the
listing fee for the Web service providers and the subscription fee for the Web service
consumers. Second, most supply chain literature involves one supplier and one customer,
or one group of suppliers and one group of customers. One of the most appealing
features of the Web service technology is the ease of creating a new composite web
service (i.e., new business functionality) from integrating two Web services of
complementary functionalities. To account for this reality, this model includes two
groups of Web service vendors providing complementary Web services. The consumers
53
of the Web service supply chain are thus comprised of three groups – those demanding
the individual Web services and those in need of the composite Web service. Third, in
addition to the intrinsic value offered by the WSI, we study the impact of “cross network
externality” effect on the WSI’s optimal strategies. The intensity of the cross-network
externality effect is found to be a key factor affecting the WSI’s pricing strategies.
The objective of this chapter is to study what are the best strategies for the profit-
maximizing WSI. Specifically, I address the following research questions. First, what
are the optimal subscription fee and listing fee? Second, is it optimal for the WSI to
attract all the Web service providers and/or all the Web service customers? Next, what is
the impact of the WSI’s intrinsic value and intensity of network externality effect on its
pricing strategies? Finally, how does the nature of the Web services market affect the
optimal strategy of the WSI?
This chapter is organized as follows. First, I provide critical background of the
Web service supply chain. Next, I review related literature and outline the uniqueness of
this research. After that, I introduce the analytical model and derive the optimal listing
fee and subscription fee, followed by discussion on managerial insights.
4.1 The Web Service Supply Chain
A Web service supply chain is composed of three parties, the Web service vendors,
the Web service consumers and the Web service intermediary. A Web service vendor
develops some Web service with certain business function and makes it accessible
through its Web site. To make the Web service interoperable and discoverable, a Web
service description file (WSDL), which describes the function of the Web service and
specifies the technical signatures such as entry point, transport protocol and encoding
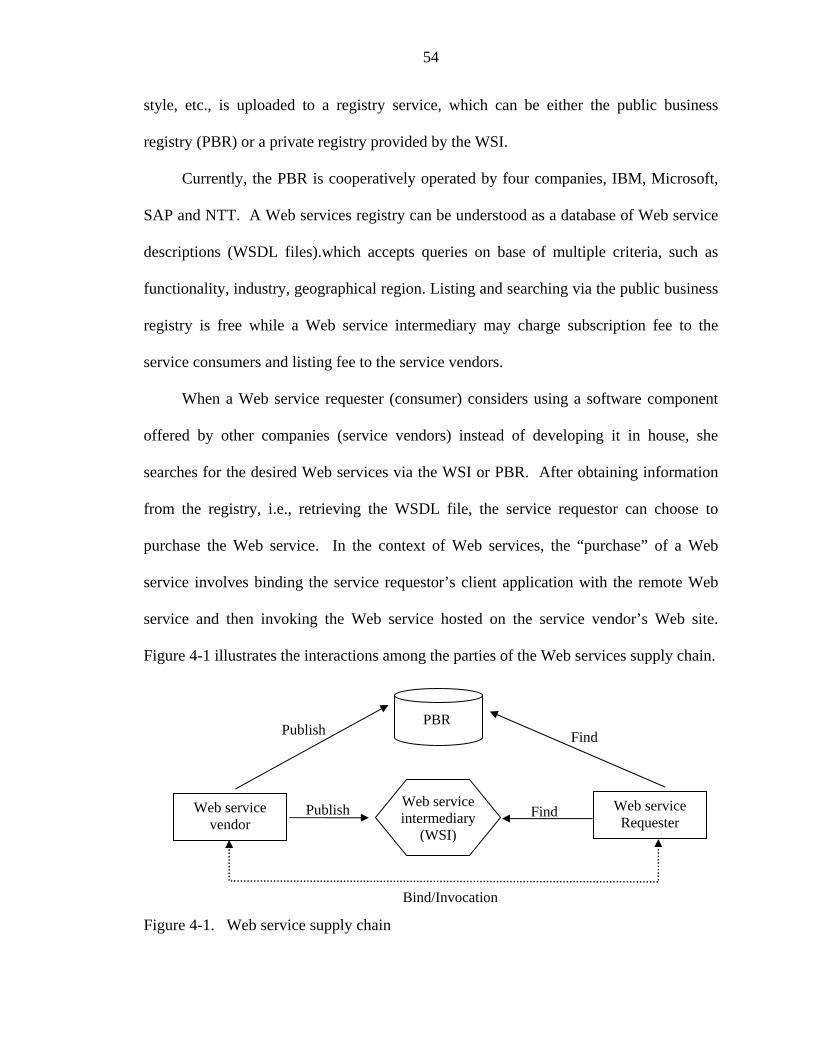
54
style, etc., is uploaded to a registry service, which can be either the public business
registry (PBR) or a private registry provided by the WSI.
Currently, the PBR is cooperatively operated by four companies, IBM, Microsoft,
SAP and NTT. A Web services registry can be understood as a database of Web service
descriptions (WSDL files).which accepts queries on base of multiple criteria, such as
functionality, industry, geographical region. Listing and searching via the public business
registry is free while a Web service intermediary may charge subscription fee to the
service consumers and listing fee to the service vendors.
When a Web service requester (consumer) considers using a software component
offered by other companies (service vendors) instead of developing it in house, she
searches for the desired Web services via the WSI or PBR. After obtaining information
from the registry, i.e., retrieving the WSDL file, the service requestor can choose to
purchase the Web service. In the context of Web services, the “purchase” of a Web
service involves binding the service requestor’s client application with the remote Web
service and then invoking the Web service hosted on the service vendor’s Web site.
Figure 4-1 illustrates the interactions among the parties of the Web services supply chain.
Figure 4-1. Web service supply chain
Web service intermediary
(WSI)
Bind/Invocation
Find Publish
Web service vendor
Web service Requester
PBR
Publish Find
55
In addition to providing registry services, a WSI also provides value-added services
to consumers of Web services. For example, the intermediary can help reduce
transaction costs among trading partners by providing account management so that
consumers only need one account to access multiple Web services (e.g., SalCentral.com).
The WSI may improve Web services management by enforcing contract to guarantee
quality of service and security (e.g., FlamencoNetworks.com). The WSI can also exploit
its technical expertise and provide integration services to realize “service on demand”
(e.g., GrandCentral.com). The WSI can set up a networking infrastructure to provide
reliable service provisioning (e.g., BlueTitan.com). At the same time, Web service
vendors benefit from publishing their Web services on the WSI since the added values by
the WSI help increase the chance of a successful transaction with subscribers of the
intermediary.
4.2 Literature Review
Vast amount of research has been conducted on traditional intermediaries, with
applications mostly in financial market, labor market and supply chain markets.
Research on Web services in general and Web services intermediaries (WSI) in particular
has primarily centered around technical issues in the computer science field, while there
is a lack of research on Web services and WSI from the perspective of business
management. Prior literature on traditional intermediaries can be generally classified into
two categories.
The first stream of research on traditional intermediaries studies the role of
intermediaries. According to Spulber (1996), intermediaries can play several roles in a
vertical market − matching and searching, price setting and market clearing, providing

56
liquidity and immediacy as well as guaranteeing of quality. There is ample research on
each aspect of the roles played by the intermediaries. Rubinstein and Wolinsky (1987)
model the interaction between buyers and sellers as a time-consuming bilateral search
process and studies how a matchmaking intermediary can affect profit division between
the two parties of transaction. Yavas (1994) studies the impact of an intermediary on
consumer search behavior, while Naert (1971) takes the perspective of producers and
analyzes the producer’s optimal decisions on advertising and markup in an intermediated
market. Biglaiser (1993) takes another avenue of research and shows that an expert
intermediary can contribute to quality guarantee. The advent of the Internet technologies
and the ensuing e-commerce heralds recent research on the functions of electronic
intermediaries (Bailey and Bakos 1997, Bakos 1998, Kaplan and Sawhney 2000). By
observing the that the Internet helps reduce search cost (Bakos 1997), Bailey (1998) sets
out to study whether the intermediation via the Internet reduces friction and finds
empirically that there is greater price dispersion in online intermediaries.
The second stream of abundant research on traditional intermediaries examines the
optimal strategies of intermediaries. Gehrig (1993) studies the tradeoff between ask-bid
spread and cost of delay in private search and finds that a monopoly intermediary will
charge a positive spread. In another paper by Wooders (1997), it is shown that a profit-
maximizing intermediary may act as a Walrasian auctioneer by setting bid and ask prices
to nearly Walrasian equilibrium prices. Prior research on intermediaries of traditional
physical goods market unfortunately cannot be directly applied to online intermediaries,
since most online intermediaries take the role of “matchmakers” instead of “market
makers”. That is, they provide value-added services and don’t sell products on their own.

57
There are no issues of inventory costs, shipping costs, order quantities and transfer prices
that underline the framework of numerous previous research.
Recent work on optimal strategies of information intermediaries is more related to
our research on WSI. Baye and Morgan (2001) study how an information gatekeeper,
which provides product and price information to consumers, should optimally set
subscription fee to consumers and advertising fee to producers. Baye and Morgan (2001)
find that the gatekeeper will set a low subscription fee to attract all customers. There are
two key differences between Baye and Morgan (2001) and this research. First, they
assume that customers are geographically segmented so that consumers only buy from
local firms if they do not subscribe to the gatekeeper. In contrast, Web services
requestors can always search via a public business registry and obtain an entire list of
available service vendors. Second, the advertised price is lower than unadvertised price
in requestors, while in the context of Web services market, the service vendors and
requestors trade directly even if they find the match via the WSI, see Fig. 1. This feature
combined with the Web service requestors’ ability to search the entire list of service
providers leads to no difference between listed and unlisted prices. These two key
differences between the information gatekeeper and the WSI result in opposite
conclusions to those in Baye and Morgan (2001). Bhargava and Choudhary (2004) study
the product line design (vertical differentiation) of an information intermediary in the
presence of aggregation benefits. In their model, consumers have heterogeneous search
costs and producers have heterogeneous expectations of gains from joining the
intermediary. In this paper, we model the interaction among the service vendors, the
58
WSI, and consumers in response to the subscription fee and listing fee charged by the
WSI.
Recent work on optimal strategies of information intermediaries is more related to
this research on Web service intermediaries. Baye and Morgan (2001) study how should
an information gatekeeper, which provides product and price information to consumers,
optimally set subscription fee to consumers and advertising fee to producers. It is shown
that the gatekeeper should set a low subscription fee to attract all customers. There are
several key differences from this research. First, they assume that customers are
geographically segmented so that consumers only buy from local firms if they do not
subscribe to the gatekeeper. In contrast, as explained in the previous section, the
requestors of Web services can always search via a public business registry and obtain an
entire list of available service vendors. Second, they explicitly allow price dispersion,
making advertised price lower than unadvertised price while in the context of a Web
service supply chain, the service vendors and requestors trade directly even if they find
the match via an intermediary. This implies that there’s no price difference between
listed and unlisted prices. It is worth noting that due to the major discrepancies of
problem setup, this research leads to opposite conclusions from those by Baye and
Morgan (2001).
Of most relevance to this research is the work by Corbett and Karmarkar (1999),
which analyzes optimal subscription fee and listing fee by an intermediary when there
exhibit cross network externalities. Their study, however, focuses on one group of sellers
and consumers of one product. Since a major benefit of Web services technology is the
ease of software integration, the WSI we study faces two groups of service vendors
59
providing complementary functionalities, resulting in three groups of customers − namely
two groups of consumers of the individual Web services and a third group of consumers
of the integrated Web service. Consequently, the problem facing the WSI is much more
complicated.
4.3 The Model
Following the modeling approach of Corbett and Karmarkar (1999), I consider two
groups of Web service vendors which provide two complementary Web services, denoted
by S1 and S2. The two complementary Web services can be integrated into one
composite Web service S3. There are 1N service vendors of S1 and 2N service vendors
of S2. The numbers of service providers 1N and 2N are sufficiently large, and the Web
service market of S1 and S2 is highly competitive. The prices of S1 and S2, denoted by
1P and 2P respectively, are thus treated as exogenously given.
The Web service consumers consist of three distinct groups – 1Q consumers
interested in S1, 2Q consumers interested in S2, and 3Q consumers interested in the
composite Web service S3. In case a consumer is interested in the individual Web
service (S1 or S2) and the composite Web service S3, he is counted as a consumer of S3
since the composite Web service always performs the functions of S1 and S2.
A monopolist WSI that provides value-added services charges a fixed listing fee L
to Web service providers and charges a fixed subscription fee F to service consumers.
Let ix ( 1, 2i = ) be the proportion of service vendors listed on the WSI and jy
( 1, 2,3j = ) be the proportion of consumers subscribing to the intermediary. Figure 4-2
delineates the basic setup of the model discussed above.
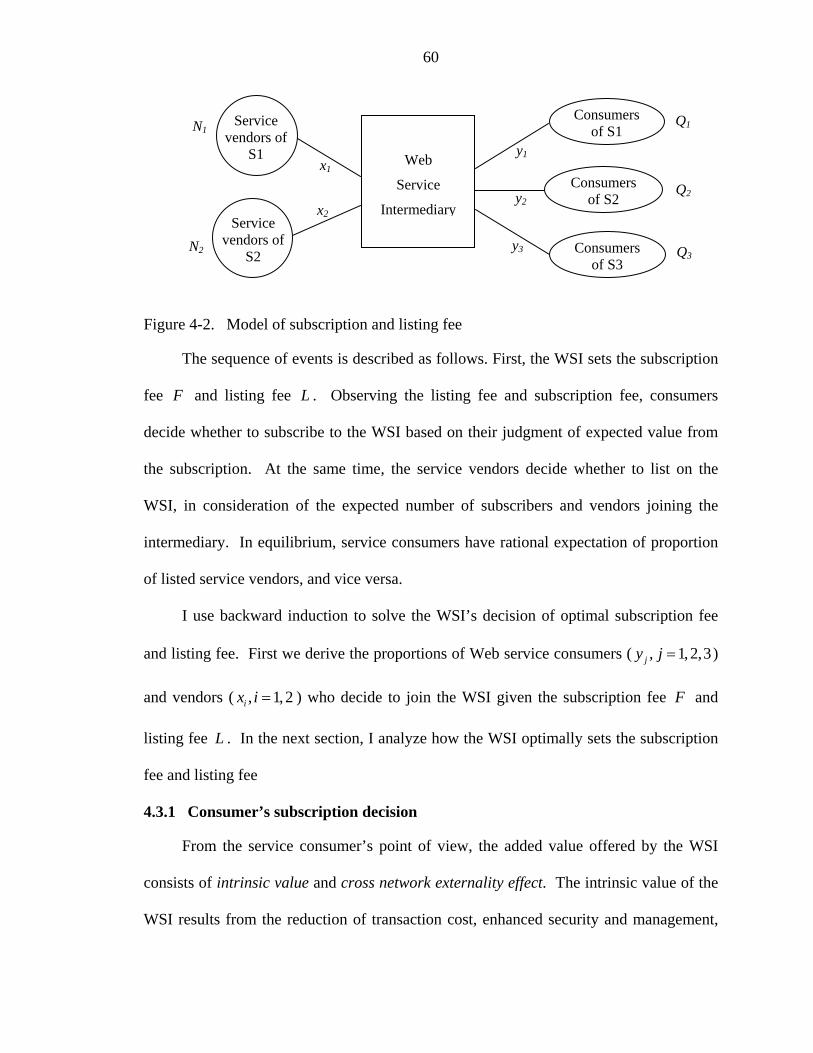
60
Figure 4-2. Model of subscription and listing fee
The sequence of events is described as follows. First, the WSI sets the subscription
fee F and listing fee L . Observing the listing fee and subscription fee, consumers
decide whether to subscribe to the WSI based on their judgment of expected value from
the subscription. At the same time, the service vendors decide whether to list on the
WSI, in consideration of the expected number of subscribers and vendors joining the
intermediary. In equilibrium, service consumers have rational expectation of proportion
of listed service vendors, and vice versa.
I use backward induction to solve the WSI’s decision of optimal subscription fee
and listing fee. First we derive the proportions of Web service consumers ( , 1, 2,3jy j = )
and vendors ( , 1, 2ix i = ) who decide to join the WSI given the subscription fee F and
listing fee L . In the next section, I analyze how the WSI optimally sets the subscription
fee and listing fee
4.3.1 Consumer’s subscription decision
From the service consumer’s point of view, the added value offered by the WSI
consists of intrinsic value and cross network externality effect. The intrinsic value of the
WSI results from the reduction of transaction cost, enhanced security and management,
Web
Service
Intermediary
Service vendors of
S1
Consumers of S1
x1
x2
N1
N2
Q1
Q3
y1
y2
y3
Q2
Service vendors of
S2
Consumers of S2
Consumers of S3
61
and improved reliability, etc. In general, the intrinsic value is related to the technical
strength of the WSI and is independent of the number of service vendors listed on it. The
consumers are heterogeneous in their judgment of the intrinsic value, denoted by the
random variable v uniformly distributed in the interval [0, ]v . The ceiling of the
distribution, v , is used as a representative measure of consumers’ valuation of the WSI’s
intrinsic value. The second part of the WSI’s added value is network effect, which is
increasing in the number of Web service vendors listed on the intermediary. Let γ
indicate the intensity of the cross network externality, or consumer’s valuation for the
network effect. Then, the network value to a consumer equals γ multiplied by the
number of service vendors listed on the WSI.
Web service consumers decide whether to subscribe to the WSI by evaluating the
cost (subscription fee) and value from subscribing to it. For a customer who is interested
in S1, the total benefit from subscribing to the intermediary is 1v xγ+ where v is the
consumer’s valuation of the WSI’s intrinsic value, and 1x is the proportion of listed Web
service vendors providing S1. Let 01v be the valuation of the marginal consumer of S1
indifferent between subscribing and not subscribing to the WSI. Then equation
01 1v x Fγ+ = holds. Similarly, the marginal consumer of S2 with intrinsic value of 02v is
described by 02 2v x Fγ+ = . The proportion of consumers of S1 (or S2) who subscribe to
the WSI corresponds to those consumers who have higher valuation than that of the
marginal consumer, specified as follows. Note that if the subscription fee is prohibitively
high, all consumers will stay away from the WSI ( 0y = ), while a sufficiently low
subscription fee attracts all consumers to subscribe ( 1y = ).

62
1,2
( )/ if ( ) 1, if (all subscribe)
0, if (nobody subscribe)
i i i
i i ii
i
v F x v x F v xy x F x
F v x
γ γ γγ
γ=
− + ≤ ≤ +⎧⎪= <⎨⎪ > +⎩
(4.1)
The consumer who is interested in the composite Web service derives 1 2v x xγ γ+ +
benefit from subscribing to the WSI. That is, the network value for the consumers of
composite service S3 is increasing in the proportion of listed service vendors of S1 and
the proportion of listed service vendors of S2. In accordance, the proportion of
consumers of S3 who subscribe to the intermediary is as follows.
1 2 1 2 1 2
3 1 2 1 2
1 2
( ) / if ( , ) 0 if
1 if
v F x x v x x F v x xy x x F v x x
F x x
γ γ γ γ γ γγ γ
γ γ
− + + + ≤ ≤ + +⎧⎪= > + +⎨⎪ < +⎩
(4.2)
4.3.2 Service vendor’s listing decision
Subscribers to the WSI search the Web services listed on the intermediary and
choose to transact with those vendors listed on the WSI, while non-subscribers search
through the public business registry (PBR) which contains the entire list of service
vendors. Since the price of the same Web service in this competitive market is the same,
consumers pick the service vendor with equal likelihood. In other words, listing to the
WSI helps the service vendors increase the chance of accomplishing transactions with
more consumers (unless none of the consumers subscribe to the WSI) and reduce the
competition from peer service vendors (if not all service vendors publish on the
intermediary).
Given the proportion of consumers subscribing to the intermediary ( 1y , 2y and
3y ), the profits for a service vendor to list ( Iiπ ) or not list ( NI
iπ ) are formulated in
Equations (4.3) and (4.4), respectively. The subscript i is an index of Web services (S1
63
or S2). Notice that the demand of Web service S1 (likewise, S2) comes from both the
consumers of S1 (S2) and those of the composite Web service S3.
3 33
1 1( ) ( )I i ii i i i
i i i i i i
y y y yPQ PQ LN x N N x N
π − −= + + + − , 1, 2i = (4.3)
33
1 1NI ii i i i
i i
y yPQ PQN N
π − −= + , 1, 2i = (4.4)
A Web service vendor of S1 will choose to list on the WSI if it gains more profit
from listing ( I NIπ π≥ ) while otherwise it will not list. Hence, one derives the proportion
of service vendors listing on the WSI from the equation NI Ii iπ π= ( 1,2i = ), which is
described below. Similar to the consumer side, the intermediary will attract all service
vendors if the listing fee is low enough ( 1x = ). It is interesting that that although a high
subscription fee will drive all consumers away from the intermediary, a high listing fee
won’t deter all service vendors. This is because those consumers who subscribe to the
intermediary won’t search beyond the WSI, creating a niche market of subscribers for the
service vendors listed on the WSI.
3 3 3 3
3
( ) ( ) if ( , )
1 otherwise
i i i i i i
i ii i
P y Q y Q P y Q y QLLN Nx y y
+ +⎧ ≥⎪= ⎨⎪⎩
, 1, 2i = (4.5)
4.4 Optimal Subscription and Listing Fee
After deriving the response functions of the service consumers and service vendors,
the WSI solves the decision problem described as follows. The initial cost to set up for
the WSI is sunk and the marginal operational cost incurred by the intermediary is
assumed to be negligible.
64
1 1 2 2 3 3 1 1 2 2,
max ( ) ( )
s.t. Eqs. (4.1), (4.2),and (4.5)L F
y Q y Q y Q F x N x N LΠ = + + + + (4.6)
Lemma 4-1. The optimal strategy of the WSI is to induce all service vendors to list
on the intermediary, i.e., 1 2 1x x= = . Specifically, the WSI will set the listing fee at
*1 2min{ , }L L L= , where 3 3( )i i i
ii
P y Q y QLN+
= ( 1,2i = ).
Lemma 4-1 specifies that the listing fee should be low enough such that all service
vendors list on the WSI ( 1 2 1x x= = ). The exact value of the listing fee cannot be
determined until we derive the proportion of the subscribers ( jy ’s), which in turn is
determined by the subscription fee F . In addition, the minimum of 1L and 2L is
dependent on the values of iP , iN and iQ .
Knowing that its optimal strategy is to attract all service vendors to list on it, the
WSI is naturally confronted with the following question: whether it should attract all
customers to subscribe? Lemma 4-2 suggests that this is not the case.
Lemma 4-2. The intermediary’s profit is not always maximized when all customers
subscribe to its service, i.e., 1 2 3 1y y y= = = .
Proof. I prove Lemma 4-2 by showing an example where the intermediary obtains
more profit without full subscription from the service consumers. First note that F γ= is
the maximum subscription the intermediary can charge to induce total subscription.
From Lemma 4-1 we know that the intermediary has incentive to allow all service
vendors to list on it. Consequently, the maximum profit the intermediary can achieve
when all consumers subscribe to it is 1 1 2 3 1 1 3 2 2 3( ) ( ) ( )Q Q Q P Q Q P Q Qπ γ= + + + + + + .
Next consider the case when the intermediary charge a subscription fee of ' 2F γ= ,
65
which induces all customers of S3 to subscribe but not all customers of S1 and S2 will
subscribe, i.e., 1 20 , 1y y≤ < and 3 1y = . Then the intermediary’s profit is '2π π≥ , where
2 3 1 3 2 32 Q PQ P Qπ γ= + + is calculated when we plug in 2F γ= , 3 1y = and 1 2 0y y= =
into the profit function. With simple algebra, it’s easy to show that the intermediary
obtains more profit if 3 1 2 1 1 2 2( )Q Q Q PQ P Qγ γ> + + + , i.e., '2 1π π π≥ > . Q.E.D.
Next we reformulate the optimal decision problem faced by the WSI by applying
Lemma 4-1 and Lemma 4-2 in Eq. (4.7).
1 1 2 2 3 3 1 1 1 3 3 2 2 2 3 3max ( ) ( ) ( )
s.t. (4.1), (4.2), (4.5)NF
y Q y Q y Q F P y Q y Q P y Q y QΠ = + + + + + + (4.7)
Note that the functional form of proportions of subscribers ( 'jy s ) is conditional on
the value of subscription fee ( F ). Accordingly, the WSI’s profit function takes different
format under various subscription fee. In order to solve for the optimal subscription fee,
we need to compare the profit under each possible combination of 'jy s ( 1,2,3j = ). That
is, we need to consider internal solutions ( 0 1jy< < ) as well as the boundary solutions
( 0jy = or 1). Furthermore, the proportion of consumers who subscribe to the WSI
varies under different relationship of γ and v . For example, if the intermediary charge a
subscription fee of v γ+ , all consumers of S3 will subscribe to it if vγ > . On the other
hand, only partial consumers of S3 will subscribe to it if vγ < with subscription fee
charged at v γ+ . In the following two subsections, I solve for the optimal subscription
fee *F under different relationships between consumer’s valuation of the network effect
(γ ) and the WSI’s intrinsic value ( v ).
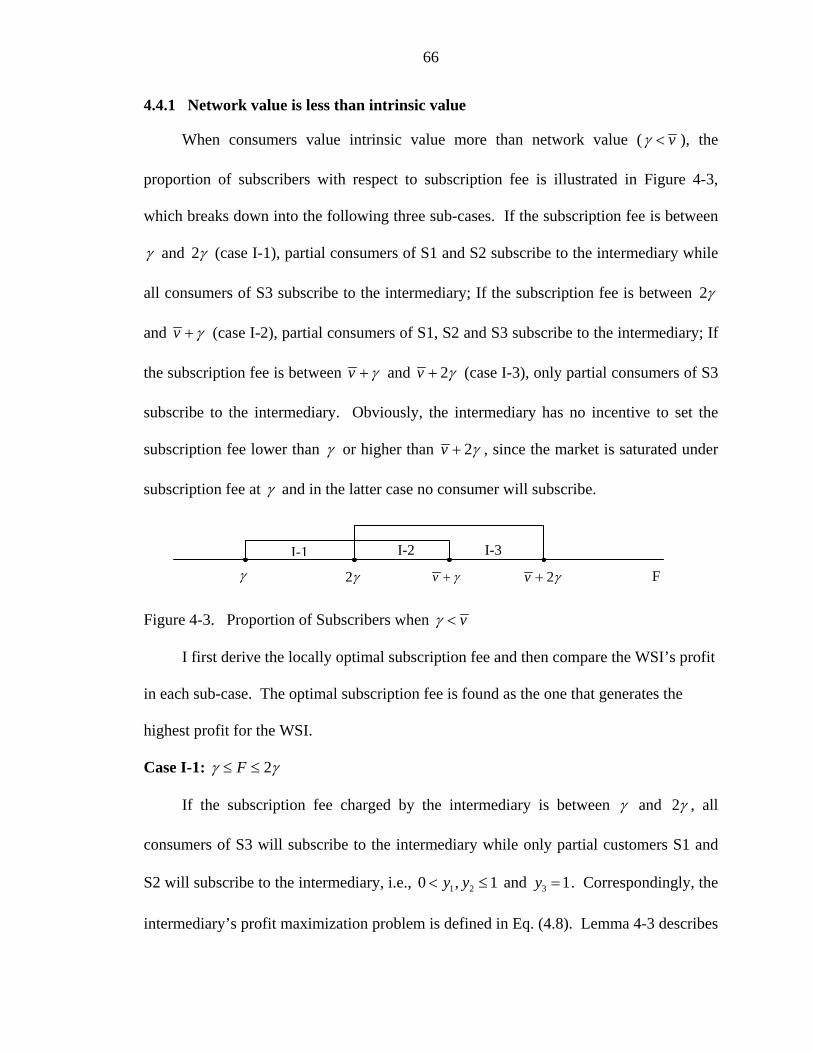
66
4.4.1 Network value is less than intrinsic value
When consumers value intrinsic value more than network value ( vγ < ), the
proportion of subscribers with respect to subscription fee is illustrated in Figure 4-3,
which breaks down into the following three sub-cases. If the subscription fee is between
γ and 2γ (case I-1), partial consumers of S1 and S2 subscribe to the intermediary while
all consumers of S3 subscribe to the intermediary; If the subscription fee is between 2γ
and v γ+ (case I-2), partial consumers of S1, S2 and S3 subscribe to the intermediary; If
the subscription fee is between v γ+ and 2v γ+ (case I-3), only partial consumers of S3
subscribe to the intermediary. Obviously, the intermediary has no incentive to set the
subscription fee lower than γ or higher than 2v γ+ , since the market is saturated under
subscription fee at γ and in the latter case no consumer will subscribe.
Figure 4-3. Proportion of Subscribers when vγ <
I first derive the locally optimal subscription fee and then compare the WSI’s profit
in each sub-case. The optimal subscription fee is found as the one that generates the
highest profit for the WSI.
Case I-1: 2Fγ γ≤ ≤
If the subscription fee charged by the intermediary is between γ and 2γ , all
consumers of S3 will subscribe to the intermediary while only partial customers S1 and
S2 will subscribe to the intermediary, i.e., 1 20 , 1y y< ≤ and 3 1y = . Correspondingly, the
intermediary’s profit maximization problem is defined in Eq. (4.8). Lemma 4-3 describes
γ 2γ v γ+ 2v γ+
I-1 I-2 I-3
F

67
the optimal subscription fee when the intermediary desires to attract all consumers of S3
and partial consumers of S1 and S2.
11 1 2 3 31,2
max ( ) ( )
s.t 2
i iF i
v F v FQ Q Q F P Q Qv v
F
γ γ
γ γ=
+ − + −⎡ ⎤Π = + + + +⎢ ⎥⎣ ⎦≤ ≤
∑ (4.8)
Lemma 4-3. If vγ < and 2Fγ γ≤ ≤ , the subscription fee that maximizes the
profit of the intermediary ( *11F ) is specified as follows.
a. If 1 1 2 2 3
1 2
( ) ( )( )
v P Q v P Q vQ vQ Q
γ− + − +≤ <
+, *
11F γ= ;
b. If 1 1 2 2 3 1 1 2 2 3
1 2 1 2
( ) ( ) ( ) ( )3( )
v P Q v P Q vQ v P Q v P Q vQQ Q Q Q
γ− + − + − + − +< <
+ +, *
11 11F F= ,
where 11F is defined as 1 1 2 2 311
1 2
( ) ( )2( )
v P Q v P Q vQFQ Q
γ γ+ − + + − +=
+;
c. If 1 1 2 2 3
1 2
( ) ( )03( )
v P Q v P Q vQQ Q
γ − + − +< ≤
+, *
11 2F γ= .
Proof. Lemma 4-3 is derived from solving the constrained optimization problem
defined in (4.8). See Appendix C for a detailed derivation.
Case I-2: 2 F vγ γ≤ ≤ +
If the subscription fee charged by the intermediary is between 2γ and v γ+ , part
of customers interested in each of the Web services S1, S2 and S3 will subscribe to the
intermediary, i.e., 0 1jy< < ( 1, 2,3j = ). Correspondingly, the intermediary’s profit
maximization problem is defined as follows. Lemma 4-4 describes the optimal
subscription fee when the intermediary desires to allow all groups of consumers to
subscribe.
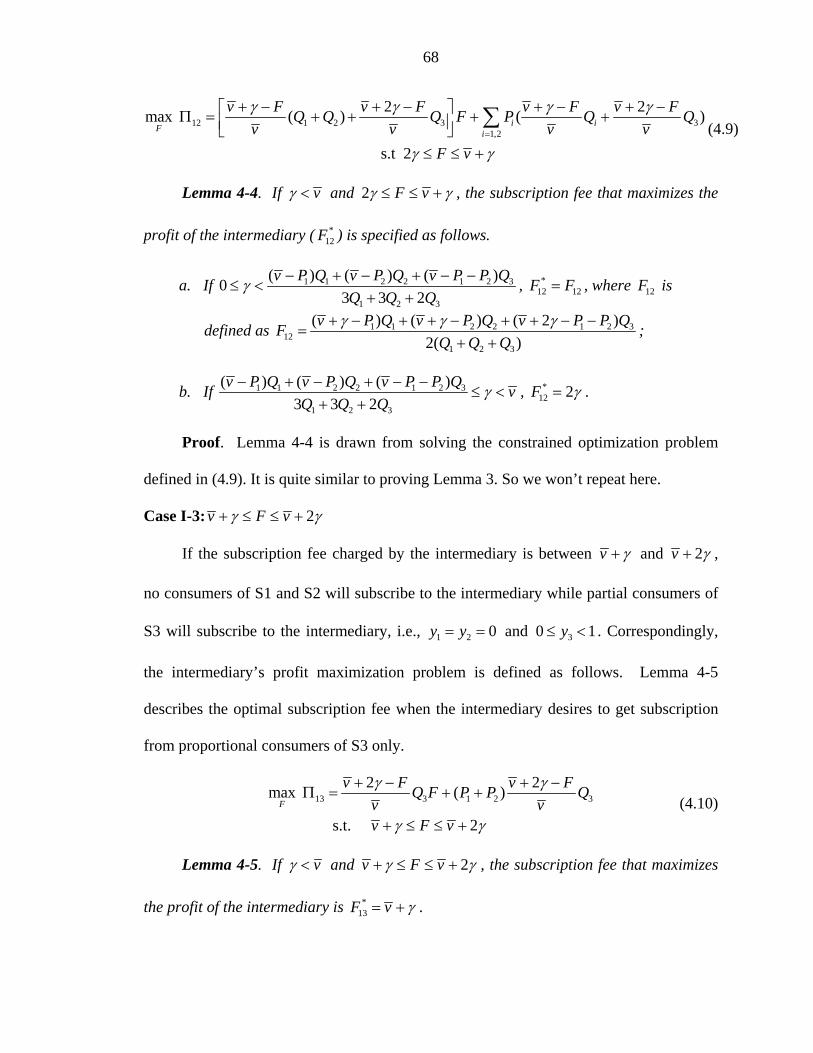
68
12 1 2 3 31,2
2 2max ( ) ( )
s.t 2
i iF i
v F v F v F v FQ Q Q F P Q Qv v v v
F v
γ γ γ γ
γ γ=
+ − + − + − + −⎡ ⎤Π = + + + +⎢ ⎥⎣ ⎦≤ ≤ +
∑ (4.9)
Lemma 4-4. If vγ < and 2 F vγ γ≤ ≤ + , the subscription fee that maximizes the
profit of the intermediary ( *12F ) is specified as follows.
a. If 1 1 2 2 1 2 3
1 2 3
( ) ( ) ( )03 3 2
v P Q v P Q v P P QQ Q Q
γ − + − + − −≤ <
+ +, *
12 12F F= , where 12F is
defined as 1 1 2 2 1 2 312
1 2 3
( ) ( ) ( 2 )2( )
v P Q v P Q v P P QFQ Q Q
γ γ γ+ − + + − + + − −=
+ +;
b. If 1 1 2 2 1 2 3
1 2 3
( ) ( ) ( )3 3 2
v P Q v P Q v P P Q vQ Q Q
γ− + − + − −≤ <
+ +, *
12 2F γ= .
Proof. Lemma 4-4 is drawn from solving the constrained optimization problem
defined in (4.9). It is quite similar to proving Lemma 3. So we won’t repeat here.
Case I-3: 2v F vγ γ+ ≤ ≤ +
If the subscription fee charged by the intermediary is between v γ+ and 2v γ+ ,
no consumers of S1 and S2 will subscribe to the intermediary while partial consumers of
S3 will subscribe to the intermediary, i.e., 1 2 0y y= = and 30 1y≤ < . Correspondingly,
the intermediary’s profit maximization problem is defined as follows. Lemma 4-5
describes the optimal subscription fee when the intermediary desires to get subscription
from proportional consumers of S3 only.
13 3 1 2 32 2max ( )
s.t. 2F
v F v FQ F P P Qv vv F v
γ γ
γ γ
+ − + −Π = + +
+ ≤ ≤ + (4.10)
Lemma 4-5. If vγ < and 2v F vγ γ+ ≤ ≤ + , the subscription fee that maximizes
the profit of the intermediary is *13F v γ= + .
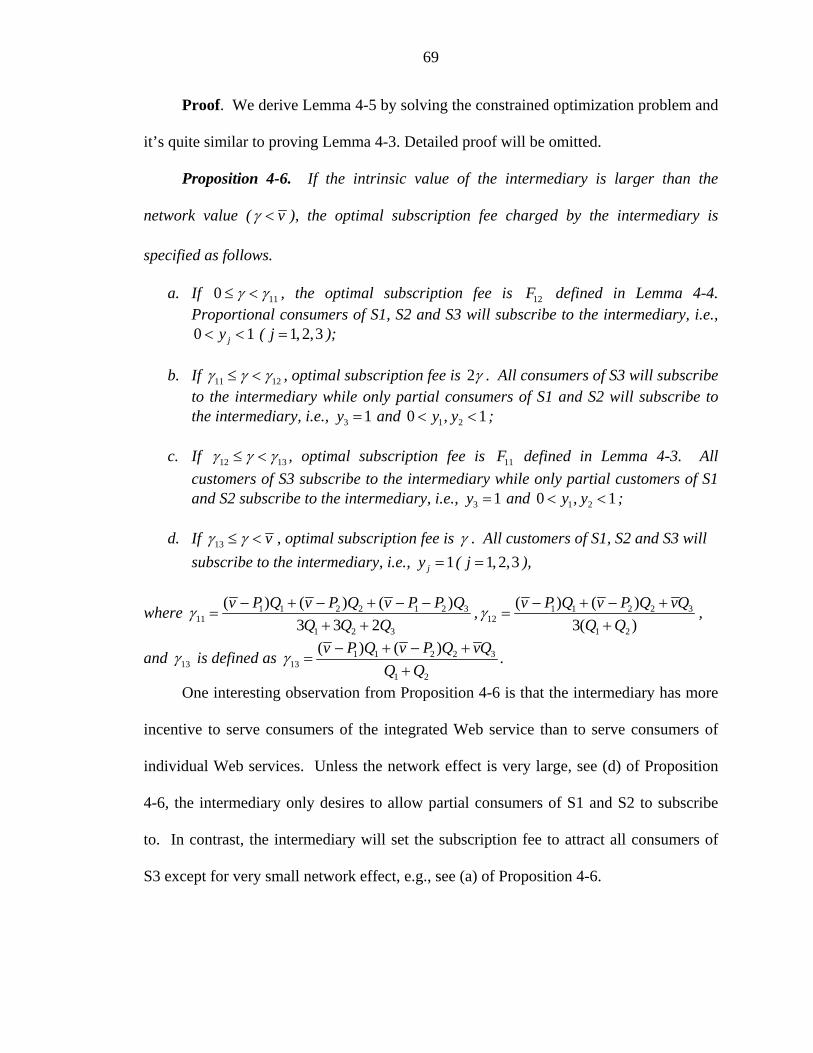
69
Proof. We derive Lemma 4-5 by solving the constrained optimization problem and
it’s quite similar to proving Lemma 4-3. Detailed proof will be omitted.
Proposition 4-6. If the intrinsic value of the intermediary is larger than the
network value ( vγ < ), the optimal subscription fee charged by the intermediary is
specified as follows.
a. If 110 γ γ≤ < , the optimal subscription fee is 12F defined in Lemma 4-4. Proportional consumers of S1, S2 and S3 will subscribe to the intermediary, i.e., 0 1jy< < ( 1, 2,3j = );
b. If 11 12γ γ γ≤ < , optimal subscription fee is 2γ . All consumers of S3 will subscribe to the intermediary while only partial consumers of S1 and S2 will subscribe to the intermediary, i.e., 3 1y = and 1 20 , 1y y< < ;
c. If 12 13γ γ γ≤ < , optimal subscription fee is 11F defined in Lemma 4-3. All customers of S3 subscribe to the intermediary while only partial customers of S1 and S2 subscribe to the intermediary, i.e., 3 1y = and 1 20 , 1y y< < ;
d. If 13 vγ γ≤ < , optimal subscription fee is γ . All customers of S1, S2 and S3 will subscribe to the intermediary, i.e., 1jy = ( 1, 2,3j = ),
where 1 1 2 2 1 2 311
1 2 3
( ) ( ) ( )3 3 2
v P Q v P Q v P P QQ Q Q
γ − + − + − −=
+ +, 1 1 2 2 3
121 2
( ) ( )3( )
v P Q v P Q vQQ Q
γ − + − +=
+,
and 13γ is defined as 1 1 2 2 313
1 2
( ) ( )v P Q v P Q vQQ Q
γ − + − +=
+.
One interesting observation from Proposition 4-6 is that the intermediary has more
incentive to serve consumers of the integrated Web service than to serve consumers of
individual Web services. Unless the network effect is very large, see (d) of Proposition
4-6, the intermediary only desires to allow partial consumers of S1 and S2 to subscribe
to. In contrast, the intermediary will set the subscription fee to attract all consumers of
S3 except for very small network effect, e.g., see (a) of Proposition 4-6.

70
Furthermore, Proposition 4-6 suggests that the optimal subscription fee is
conditional on intensity of the network effect (γ ). Note that 11 12 13γ γ γ< < , this implies
that as the intensity of network effect increases, or consumer’s valuation of the network
effect increases, the intermediary has incentive to allow more and more consumers to
subscribe to it, since the proportion of subscribers increases from (a) to (d). The behavior
of optimal subscription fee and profit is summarized in Proposition 4-7.
Proposition 4-7. If the intrinsic value of the intermediary is larger than the
network value ( vγ < ), the optimal subscription fee and optimal profit are increasing in
network intensity (γ ).
Proof. By inspection, the subscription fee is increasing in network intensity under
each conditions specified in (a)-(d). In addition, note that the subscription fee coincides at
each point that delimits successive cases from (a) to (d). For example, when 11γ γ= , the
optimal subscription fee 12F under the condition (a) equals 2γ , which is the optimal
subscription fee under the condition (b). Therefore, the optimal subscription increases
with network intensity. The network effect has similar effect on the optimal profit for the
intermediary. Q.E.D.
Figures 4-4 and 4-5 illustrate the behavior of optimal subscription fee and profit
when the network effect is lower than the intrinsic value of the WSI ( vγ < ). The
parameters in the shown example are: 1 100Q = , 2 150Q = , 3 90Q = , 1 5P = , 2 2P = ,
5v = , 11 0.29γ = , 12 1.2γ = , 13 3.6γ = . Note that the optimal subscription fee (or profit) is
a kinked one (different functional forms with varying network intensity). But the optimal
subscription fee (or profit) is generally increasing in network intensity.
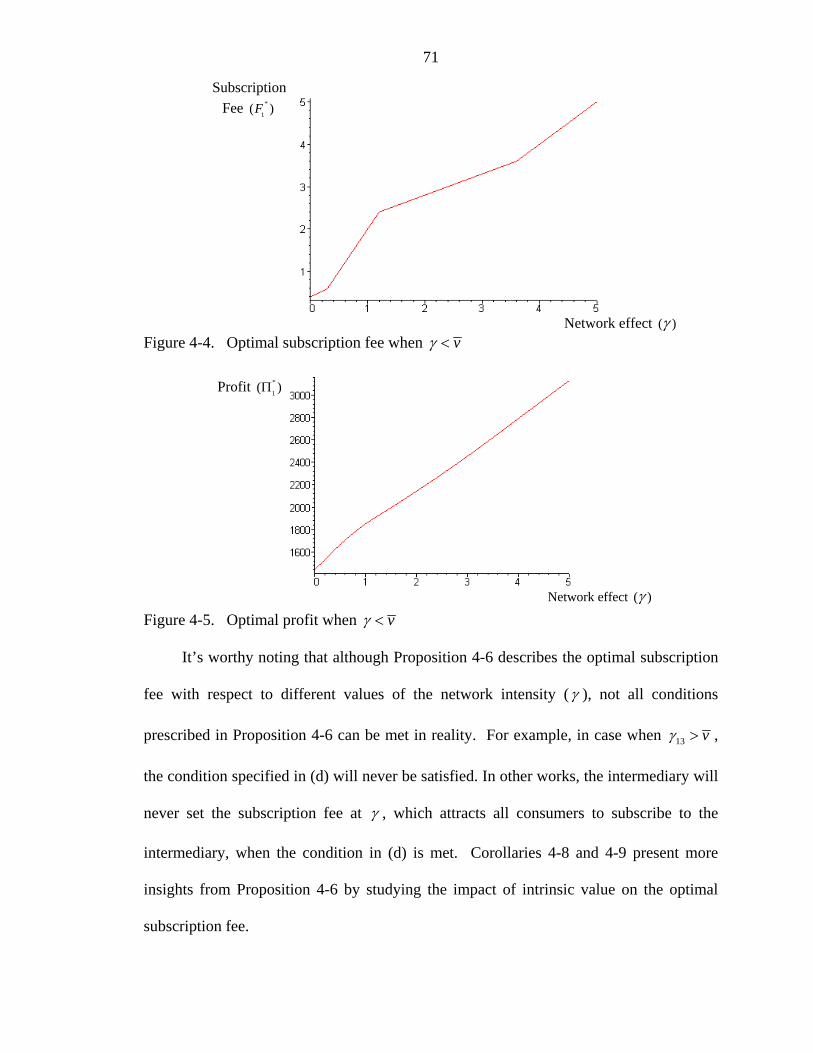
71
Figure 4-4. Optimal subscription fee when vγ <
Figure 4-5. Optimal profit when vγ <
It’s worthy noting that although Proposition 4-6 describes the optimal subscription
fee with respect to different values of the network intensity (γ ), not all conditions
prescribed in Proposition 4-6 can be met in reality. For example, in case when 13 vγ > ,
the condition specified in (d) will never be satisfied. In other works, the intermediary will
never set the subscription fee at γ , which attracts all consumers to subscribe to the
intermediary, when the condition in (d) is met. Corollaries 4-8 and 4-9 present more
insights from Proposition 4-6 by studying the impact of intrinsic value on the optimal
subscription fee.
Profit *
1( )Π
Network effect ( )γ
Subscription Fee *
1( )F
Network effect ( )γ
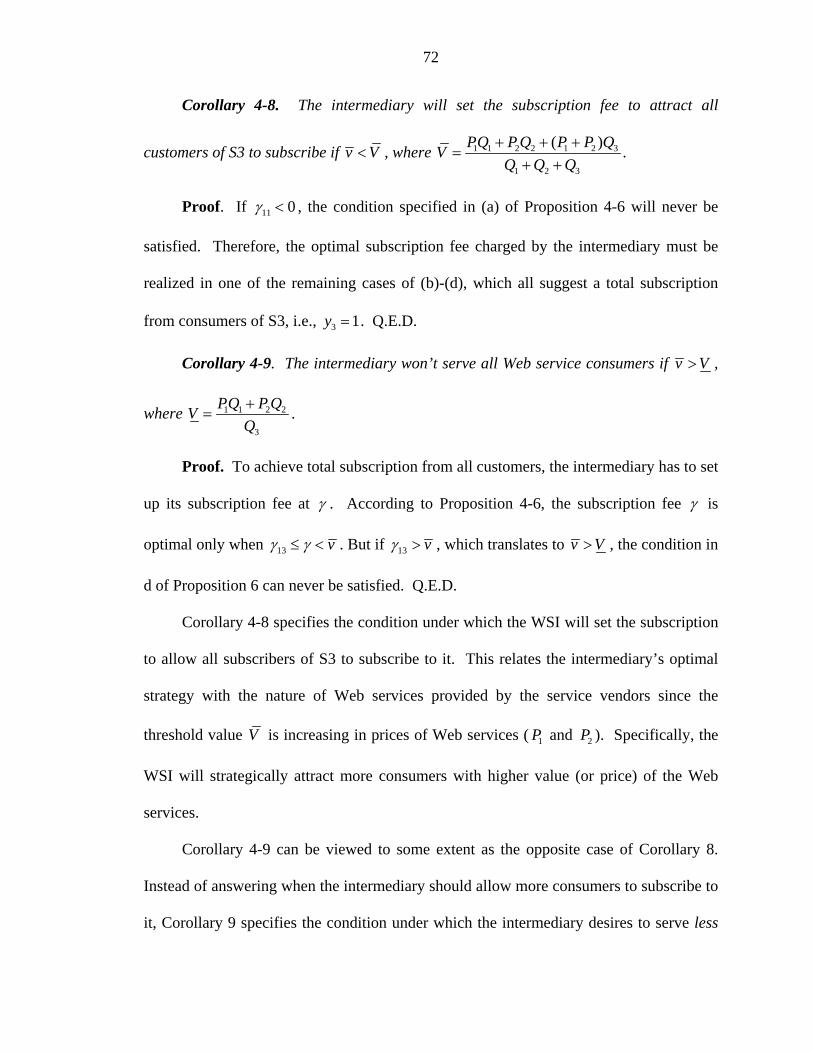
72
Corollary 4-8. The intermediary will set the subscription fee to attract all
customers of S3 to subscribe if v V< , where 1 1 2 2 1 2 3
1 2 3
( )PQ P Q P P QVQ Q Q
+ + +=
+ +.
Proof. If 11 0γ < , the condition specified in (a) of Proposition 4-6 will never be
satisfied. Therefore, the optimal subscription fee charged by the intermediary must be
realized in one of the remaining cases of (b)-(d), which all suggest a total subscription
from consumers of S3, i.e., 3 1y = . Q.E.D.
Corollary 4-9. The intermediary won’t serve all Web service consumers if v V> ,
where 1 1 2 2
3
PQ P QVQ+
= .
Proof. To achieve total subscription from all customers, the intermediary has to set
up its subscription fee at γ . According to Proposition 4-6, the subscription fee γ is
optimal only when 13 vγ γ≤ < . But if 13 vγ > , which translates to v V> , the condition in
d of Proposition 6 can never be satisfied. Q.E.D.
Corollary 4-8 specifies the condition under which the WSI will set the subscription
to allow all subscribers of S3 to subscribe to it. This relates the intermediary’s optimal
strategy with the nature of Web services provided by the service vendors since the
threshold value V is increasing in prices of Web services ( 1P and 2P ). Specifically, the
WSI will strategically attract more consumers with higher value (or price) of the Web
services.
Corollary 4-9 can be viewed to some extent as the opposite case of Corollary 8.
Instead of answering when the intermediary should allow more consumers to subscribe to
it, Corollary 9 specifies the condition under which the intermediary desires to serve less
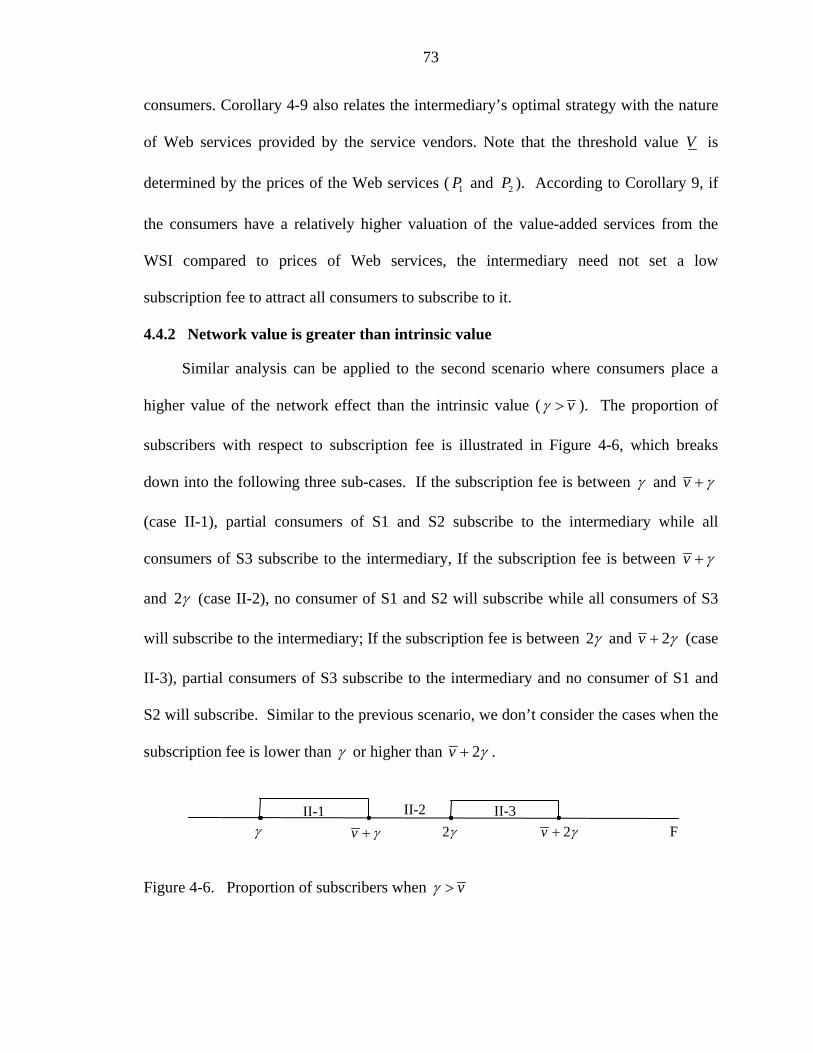
73
consumers. Corollary 4-9 also relates the intermediary’s optimal strategy with the nature
of Web services provided by the service vendors. Note that the threshold value V is
determined by the prices of the Web services ( 1P and 2P ). According to Corollary 9, if
the consumers have a relatively higher valuation of the value-added services from the
WSI compared to prices of Web services, the intermediary need not set a low
subscription fee to attract all consumers to subscribe to it.
4.4.2 Network value is greater than intrinsic value
Similar analysis can be applied to the second scenario where consumers place a
higher value of the network effect than the intrinsic value ( vγ > ). The proportion of
subscribers with respect to subscription fee is illustrated in Figure 4-6, which breaks
down into the following three sub-cases. If the subscription fee is between γ and v γ+
(case II-1), partial consumers of S1 and S2 subscribe to the intermediary while all
consumers of S3 subscribe to the intermediary, If the subscription fee is between v γ+
and 2γ (case II-2), no consumer of S1 and S2 will subscribe while all consumers of S3
will subscribe to the intermediary; If the subscription fee is between 2γ and 2v γ+ (case
II-3), partial consumers of S3 subscribe to the intermediary and no consumer of S1 and
S2 will subscribe. Similar to the previous scenario, we don’t consider the cases when the
subscription fee is lower than γ or higher than 2v γ+ .
Figure 4-6. Proportion of subscribers when vγ >
γ 2γv γ+ 2v γ+ II-1 II-2 II-3
F
74
Case II-1: F vγ γ≤ ≤ +
In Case II-1 the intermediary’s profit function is the same as the one defined in
Case I-1. All consumers of S3 will subscribe to the intermediary while only partial
customers S1 and S2 will subscribe to the intermediary, i.e., 1 20 , 1y y< ≤ and 3 1y = .
However, the range of subscription fee is different from that of case I-1. We define the
intermediary’s decision problem in Eq. (4.11). Lemma 4-10 specifies the optimal
subscription fee when the intermediary desires to attract all consumers of S3 and partial
consumers of S1 and S2.
21 1 2 3 31,2
max ( ) ( )
s.t
i iF i
v F v FQ Q Q F P Q Qv v
F v
γ γ
γ γ=
+ − + −⎡ ⎤Π = + + + +⎢ ⎥⎣ ⎦≤ ≤ +
∑ (4.11)
Lemma 4-10. If vγ < and F vγ γ≤ ≤ + , the subscription fee that maximizes the
profit of the intermediary ( *21F ) is specified as follows.
a. If 3 1 1 2 2
1 2
( ) ( )vQ v P Q v P QvQ Q
γ γγ − + + − + +≤ ≤
+, *
21F v γ= + ;
b. If 3 1 1 2 2 1 1 2 2 3
1 2 1 2
( ) ( ) ( ) ( )vQ v P Q v P Q v P Q v P Q vQQ Q Q Q
γ γ γ− + + − + + − + − +< <
+ +,
*21 21F F= , where 21F is defined as 1 1 2 2 3
211 2
( ) ( )2( )
v P Q v P Q vQFQ Q
γ γ+ − + + − +=
+;
c. If 1 1 2 2 3
1 2
( ) ( )v P Q v P Q vQQ Q
γ − + − +≥
+, *
21F γ= .
Proof. Lemma 4-10 is proved using the same approach in proving Lemma 4-3.
Case II-2: 2v Fγ γ+ ≤ ≤
If the subscription fee is between v γ+ and 2γ , all consumers of S3 will subscribe
while no consumers of S1 or S2 will subscribe to the WSI, i.e., 1 2 0y y= = and 3 1y = .
75
Furthermore, the WSI must set the subscription fee at 2γ , which is the highest
subscription fee the WSI can charge in order to have all consumers of S3 subscribe to it.
This is because any subscription fee less than 2γ won’t attract more consumers and thus
will render less profit for the WSI. Therefore, Case II-2 can be viewed as a special case
of Case II-3 to be discussed below.
Case II-3: 2 2F vγ γ≤ ≤ +
If the intermediary set the subscription fee between 2γ and 2v γ+ , no consumer
of S1 or S2 will subscribe while some consumers of S3 might subscribe to it, i.e.,
1 2 0y y= = and 30 1y≤ ≤ . The profit maximization problem is described in Eq. (4.12).
It is same with the one defined in case I-3, except for different constraint the subscription
fee. Lemma 4-11 specifies the optimal subscription fee when the intermediary desires to
get subscription from proportional consumers of S3 only.
23 3 1 2 32 2max ( )
s.t. 2 2F
v F v FQ F P P Qv v
F v
γ γ
γ γ
+ − + −Π = + +
≤ ≤ + (4.12)
Lemma 4-11. If vγ > and 2 2F vγ γ≤ ≤ + , the subscription fee that maximizes
the profit of the intermediary is *23F v γ= + .
Proof. The proof is similar to that of Lemma 4-5.
Proposition 4-12. If consumer evaluate the value from network effect more than
that of the technical services ( vγ > ), the optimal subscription fee is described as follows,
where 3 1 1 2 221
1 2
( ) ( )vQ v P Q v P QQ Q
γ − + − +=
+ and 1 1 2 2 3
221 2
( ) ( )v P Q v P Q vQQ Q
γ − + − +=
+.
76
a. If 21v γ γ≤ ≤ , the optimal subscription fee is 2γ . All customers of S3 subscribe to the intermediary while no customers of S1 and S2 subscribe, i.e., 1 2 0y y= = and
3 1y = ;
b. If 21 22γ γ γ< < , the optimal strategy for the intermediary is to set the subscription so that all consumers of S3 subscribe while some consumers of S1 or S2 subscribe, i.e., 3 1y = and 1 20 , 1y y< ≤ . In particular, the subscription fee is
d. 21,* if 02 , if <0F
Fγ
Φ ≥⎧= ⎨
Φ⎩, where 21F is defined in Lemma 4-10 and
[ ]21 1 2 2 3 3 1 2( ) ( ) 4 ( ) ( )Q v P Q v P vQ v v Q Q Qγ γ γΦ = + + + + + − + − +
c. If 22γ γ≥ , the optimal subscription fee and proportions of subscribers are
* , if 02 , if 0
Fγ
γΨ >⎧
= ⎨ Ψ ≤⎩, where 1 2 3 1 1 2 2( )Q Q Q PQ P QγΨ = + − + + ,
leading to all consumers of S1, S2, and S3 to subscribe if *F γ= , or all consumers of S3
to subscribe but none of customers of S1 and S2 when * 2F γ= .
Proof. See Appendix C.
Similar to the previous scenario for vγ < , I derive the optimal subscription fee for
the WSI by comparing the WSI’s profit in Case II-1 and Case II-3, which is summarized
in Proposition 4-12. But this scenario ( vγ > ) is a bit more complex than the case when
vγ < , since we don’t have conclusive solutions for the optimal subscription fee under
conditions (b) and (c), which are determined by functions Φ and Ψ respectively. That
is, the optimal subscription fee is determined not only by the network intensity but also
the nature of the Web services, e.g., prices of individual Web services ( P ’s), market size
(Q ’s), and the intrinsic value of the intermediary’s service v .
Figures 4-7 and 4-8 draw an example of the behavior of optimal subscription fee
with respect to network effect under conditions (b) and (c), which are determined by
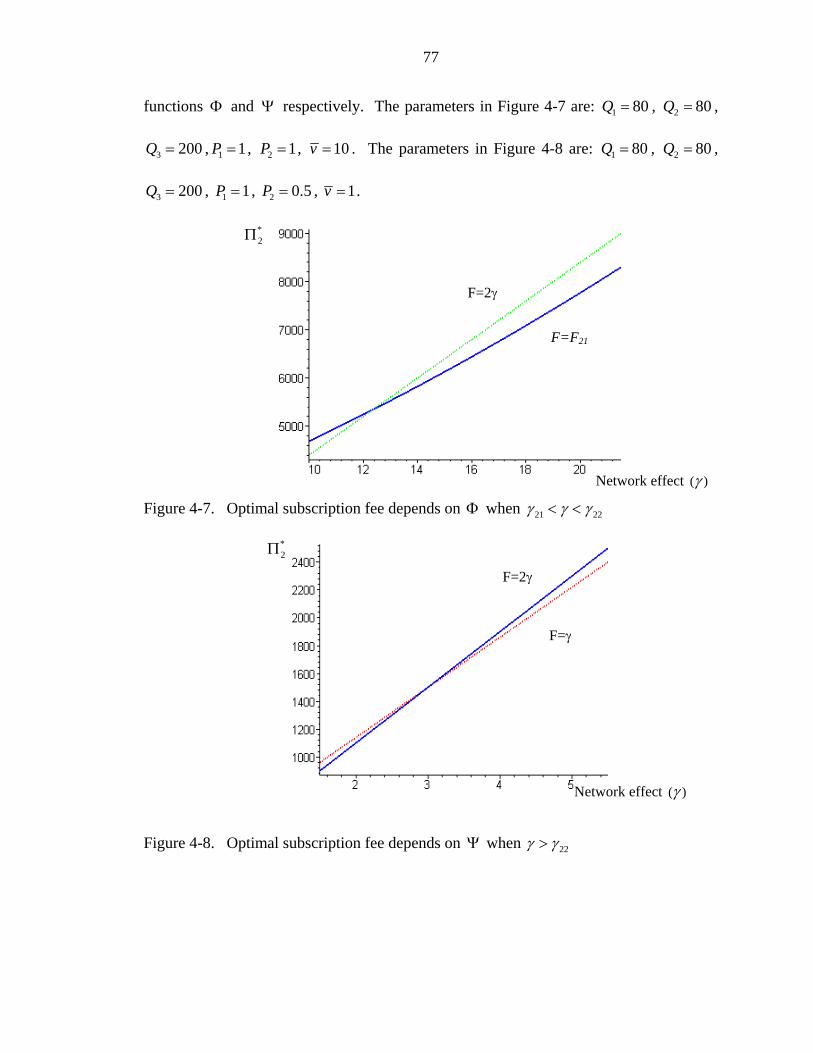
77
functions Φ and Ψ respectively. The parameters in Figure 4-7 are: 1 80Q = , 2 80Q = ,
3 200Q = , 1 1P = , 2 1P = , 10v = . The parameters in Figure 4-8 are: 1 80Q = , 2 80Q = ,
3 200Q = , 1 1P = , 2 0.5P = , 1v = .
Figure 4-7. Op
Figure 4-8. Op
*
timal subscription fee depends on Φ when 21 22γ γ γ< <
tim
2Π
Network effect ( )γ
*
F=2γ
F=F21
al subscription fee depends on Ψ when 22γ γ>
Network effect ( )γ
2Π
F=γ
F=2γ
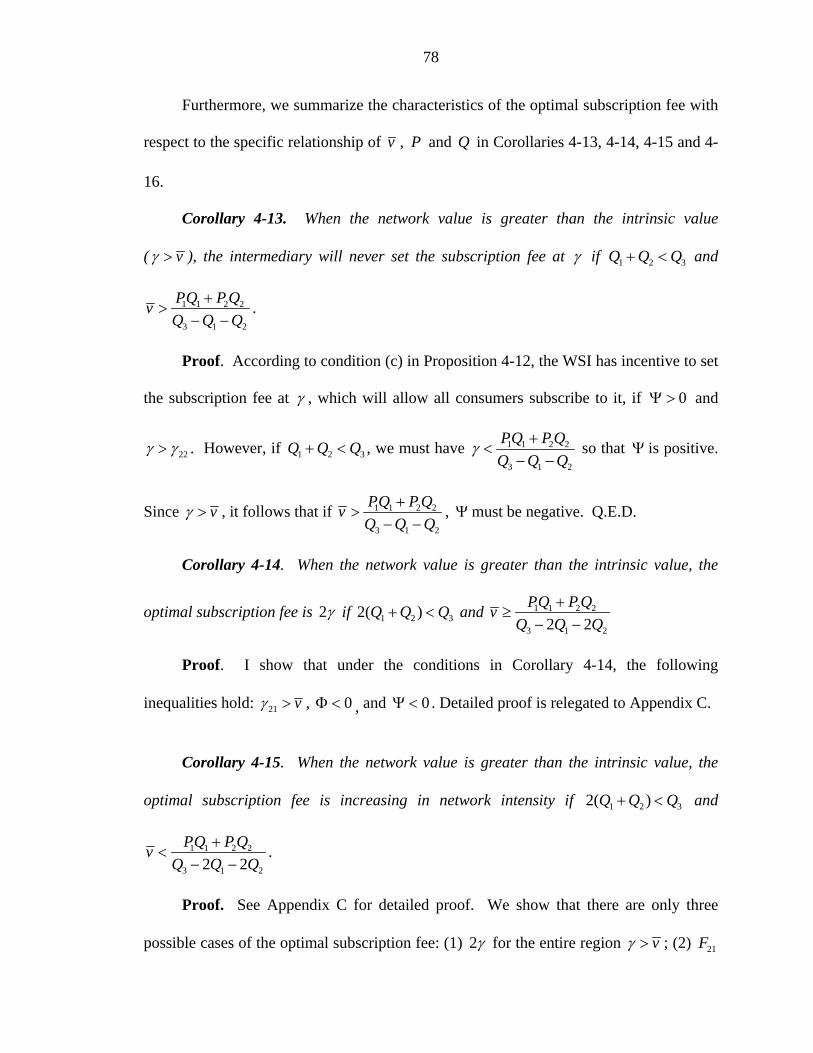
78
Furthermore, we summarize the characteristics of the optimal subscription fee with
respect to the specific relationship of v , P and Q in Corollaries 4-13, 4-14, 4-15 and 4-
16.
Corollary 4-13. When the network value is greater than the intrinsic value
( vγ > ), the intermediary will never set the subscription fee at γ if 1 2 3Q Q Q+ < and
1 1 2 2
3 1 2
PQ P QvQ Q Q
+>
− −.
Proof. According to condition (c) in Proposition 4-12, the WSI has incentive to set
the subscription fee at γ , which will allow all consumers subscribe to it, if 0Ψ > and
22γ γ> . However, if 1 2 3Q Q Q+ < , we must have 1 1 2 2
3 1 2
PQ P QQ Q Q
γ +<
− − so that Ψ is positive.
Since vγ > , it follows that if 1 1 2 2
3 1 2
PQ P QvQ Q Q
+>
− −, Ψ must be negative. Q.E.D.
Corollary 4-14. When the network value is greater than the intrinsic value, the
optimal subscription fee is 2γ if 1 2 32( )Q Q Q+ < and 1 1 2 2
3 1 22 2PQ P Qv
Q Q Q+
≥− −
Proof. I show that under the conditions in Corollary 4-14, the following
inequalities hold: 21 vγ > , 0Φ < , and 0Ψ < . Detailed proof is relegated to Appendix C.
Corollary 4-15. When the network value is greater than the intrinsic value, the
optimal subscription fee is increasing in network intensity if 1 2 32( )Q Q Q+ < and
1 1 2 2
3 1 22 2PQ P Qv
Q Q Q+
<− −
.
Proof. See Appendix C for detailed proof. We show that there are only three
possible cases of the optimal subscription fee: (1) 2γ for the entire region vγ > ; (2) 21F
79
for 21 22γ γ γ< < , γ and then 2γ for 22γ γ> ; (3) 21F and then 2γ for 21 22γ γ γ< < , 2γ
for 22γ γ> .
Corollary 4-16. If 22γ γ> and 1 2 3Q Q Q+ > , the optimal subscription fee is γ .
Proof. By inspection, Ψ is positive when 1 2 3Q Q Q+ > under condition c in
Proposition 4-12. Q.E.D.
Proposition 4-12 specifies three strategies for the intermediary when the network
effect is more significant ( vγ > ): charge a low subscription fee to attract all consumers
(γ ); allow only consumers of S3 to subscribe ( 2γ ); or allow partial consumers of S1 (or
S2) and all consumers of S3 to subscribe ( 21F ). Although the optimal strategy should be
determined by the network intensity and functions of Φ and Ψ , there are cases where
the WSI is certain about the optimal subscription without having to evaluate the values of
Φ or Ψ .
Corollary 4-13 states the condition when the intermediary will never charge a low
subscription fee to attract all consumers to subscribe to its service. It suggests that if the
market for the composite service is large and consumers have high valuation of the
technical expertise (intrinsic value) of the WSI, it will never offer a low subscription fee
to attract all consumers. Corollary 4-14 further states the condition under which the
intermediary only needs to attract consumers of S3 to subscribe to its service. Corollary
4-15 characterizes the behavior of the optimal subscription fee if the market for the
composite service is large but the consumer’s valuation of the WSI’s intrinsic value is not
as high. It should be noted that if at some point, the optimal subscription fee is 2γ , the
WSI will never set the subscription fee of γ . In other words, if the WSI’s strategy is to

80
attract consumers of S3 only, it won’t lower the subscription fee to attract all consumers
as network effect intensifies. On the other hand, if the market size of the composite Web
service S3 is small, Corollary 4-16 suggests that the WSI should set the subscription fee
to attract all consumers if the network effect is large.

81
CHAPTER 5 CONCLUSIONS AND FUTURE RESEARCH
The intense competition and the constant changing nature of the global economy
call for an agile information technology infrastructure for businesses to stay competitive
and adapt to new threats and opportunities. Astute managers face an enormous pressure
to cut costs and leverage existing information technology resources, a task complicated
by legacy systems built on technologies of different ages. Web services technology,
touted as the foundation to an interoperable, location transparent service-oriented
architecture has been developed as a promising solution to the challenge of heterogeneity
and change.
Despite the enormous hype and doubt in industry, there has been a lack of
academic awareness on this new computing paradigm, especially from business angle.
The objective of my dissertation is to study the business implications of Web services on
firm strategies. Specifically, I focus on the optimal strategies to provide Web services for
Web service vendors and Web service intermediaries. The dissertation is divided into
three research topics.
The first part of the dissertation deals with the optimal market structure to provide
complementary Web services. In particular, I compare three market structures–
independent service vendors (ISV), strategic alliance (SA), and Web service marketplace.
Under the ISV market structure, two Web service vendors offer two complementary Web
services separately and it is left to consumers to integrate the two Web services. Under
the SA market structure, two Web service vendors form an alliance to sell an integrated

82
Web service. Under the market structure of Web service marketplace, both individual
and composite Web services are provided.
Interesting managerial insights have been derived from theoretical analysis of a
simplified model and numerical explorations on a generalized model. First, it is found
that the marketplace dominates the ISV market structure, implying that Web service
vendors can benefit from the integration of Web services. Second, the integration cost
and the market characteristics of Web services play important roles in determining the
optimal market structure. If the valuation of the integrated software service is small, the
service vendors prefer marketplace to SA. For larger valuation of the integrated Web
service, the marketplace is preferred if the integration cost is high while SA dominates if
the integration cost is low. As the valuation of the integrated software service becomes
sufficiently high, SA turns to be the optimal market structure. In addition, if the
integrated service enjoys a larger market potential, SA will beat marketplace for a smaller
valuation of the integrated service. Finally, in a more balanced market, where one
service vendor has advantage over software valuation while the other service vendor has
advantage over market potential, SA is preferred to marketplace for a smaller valuation of
the integrated service.
The second part of the dissertation is intrigued by observing Web service
consumption model. In a Web-service-based computing environment, the Web service
consumers no longer need to license or house the software modules (Web services).
Instead, the consumption of Web services involves accessing the software component on
the remote server of Web service vendors. This causes network latency because of the
83
turnaround time between Web service vendors and consumers. As a result, the
performance of Web services is affected by where the Web services are located.
In the second part of the dissertation, I solve the joint decision of location and
pricing for a time-sensitive composite Web service provided by a Web service
intermediary. I propose two spatial models to solve the joint optimization problem by
taking into account both delay cost and integration cost. A linear city model is first
presented to study a special case where the individual Web service providers are located
at the ends of the linear city model. Optimal location and price are derived in the linear
city model. Analytical results indicate that the optimal location for the integrated Web
service is midpoint between the service providers. When the delay cost is small, the WSI
should set a low penetration price to capture entire market demand. When the delay cost
is high, the best strategy for the WSI is to share the market with the service providers.
Furthermore, the optimal price and profit are increasing in delay cost and integration cost.
To study the general cases where not all customers reside between the service providers,
a unit circle model is applied. Analysis in the unit circle model shows that when the
delay cost is low, the highest market-covering price is the optimal price and the optimal
location is midpoint between the service providers. Interestingly, analysis of the unit
circle model suggests that there exist multiple optimal locations for the integrated Web
service if the distance between the two Web service vendors is large.
Finally, I study the optimal strategies of a Web services intermediary (WSI) that
provides aggregation service and value-added technical services in a supply chain of
complementary Web services. The value of the aggregation service is dependent on the
number of participants in the Web service supply chain. Specifically, the Web service
84
consumers appreciate the aggregation service more if there are more vendors listed on the
WSI. Likewise, the Web service vendors think it is more worthwhile to list the Web
services on the WSI if more consumers are aware of it. The value-added technical
services are network-dependent, such as enforcing quality of service, enhancing security,
improving Web service management.
The aggregation and value-added services give the WSI the privilege to charge
subscription fee to Web service consumers and listing fee to Web service vendors. The
last part of the dissertation aims to solve for the optimal subscription and listing fees. In
particular, I consider a WSI that faces service vendors providing two complementary
Web services and there are demand for both the individual Web services and the
composite Web service. Analytical results suggest that in the presence of inter-network
externalities, the optimal strategy for the intermediary is to set a listing fee such that all
Web service vendors list their Web services on it. On the other hand, the optimal
subscription fee is determined by the relationship between the network value and the
value of technical services. When the consumers appreciate the technical services more
than the network effect, the optimal subscription fee is increasing in network effect and
the intermediary will attract more consumers as network effect intensifies. In addition,
the intermediary’s strategy is affected by the natures of Web services being traded, such
as the prices of Web services, the market size, and the relationship between consumer’s
valuation of technical services by the WSI and the prices of Web services.
This dissertation should serve as a ground for extended research in the future.
There are many interesting issues worthy of future work. In the study on optimal market
structure, I shall consider more market structures. For example, instead of having the
85
Web service vendors form a marketplace, a third-party company could serve the same
task of providing both individual and composite Web services. In some cases, the two
complementary Web services are not of equal importance. In other words, there could be
no demand for a supplementary Web service by its own. Another interesting issue of
Web service market structure is the tradeoff between customization and integration.
While a strategic alliance or marketplace helps reduce integration cost, the Web service
consumer suffers from loss of customization. Therefore, I shall incorporate the effect of
customization for the analysis on optimal market structure in the future. Furthermore, the
current research on market structure takes a “macro” view of the problem, ignoring the
profit distribution among service vendors. It is interesting to analyze the market
structures under different profit division mechanisms.
In the analysis of optimal location and pricing of an integrated Web service, I only
derive analytical results for the case when the delay cost is low in the unit circle model.
While analytical derivations of general scenarios for large delay cost become
mathematically impracticable to solve, I can adopt other numerical approaches, such as
simulations, to draw more insights.
The second and third part of the dissertation address different types of Web service
intermediary–a “matchmaker” that provides value-added services and a “market maker”
that sells an integrated Web service. A WSI that has the technical capabilities can
provide both integration and aggregation services. This means the relationship between
the WSI and the Web service vendors could be both cooperative and competitive. It’s
worth studying the optimal strategies of such Web service intermediaries. Another
86
avenue of future research is to extend the monopolistic WSI to consider competition in
the duopoly setting.
87
APPENDIX A PROOFS OF CHAPTER 2
A.1 Proof of Lemma 2-1
In a symmetric market, where the valuations and market sizes of the two Web
services are equal, the profit maximization problem for the service vendors is
1 23 3
3
( ) ( )max si
si s ssi si si si siP
P P P cP D P Q Q P Q QV V
π + += ⋅ = − + − , 1, 2i = (A.1)
By solving the above problems for each Web service vendor simultaneously, one
gets the optimal solutions described as follows.
* 3 3 3 3
3 32 3siVV Q VV Q cVQP
QV VQ+ −
=+
(A.2)
2 2 2 2 2
* 3 3 3 3 3 3 3 3 3 3 3 3 3 32
3 3 3
( )( )(2 3 )si
V V Q V Q cQ V Q VV QQ V QQ VV Q cV QQ cVQV QV VQ
π + − + + + − −=
+ (A.3)
Take the first and second derivatives of *siπ with respect to c .
2 2 2*
3 3 3 3 3 3 32
3 3 3
2 [ ( ) ( ) ( )](2 3 )
si VQ V Q QQ V QQ V c VQ V cc V V Q VQ
π + + − + −∂ = −∂ +
(A.4)
2 * 2
3 3 32 2
3 3 3
2 ( )(2 3 )
si Q V Q V QVc V QV Q Vπ∂ +
=∂ +
(A.5)
By inspection, the first derivative is negative under the assumption that
30 c V V< < < while the second derivative is positive. Therefore, *sπ is decreasing and
convex in c, where * * *1 2s s sπ π π= + . In addition, *
sπ is maximized when 0c = . Recall that
88
the optimal total profit under the ISV market structure is * *1max ,2s sVQ π⎧ ⎫Π = ⎨ ⎬
⎩ ⎭. It
follows that the optimal total profit is *sπ when 0c = , since
2 2
* 3 3 3 3 3 3 32
3 3
( )( 9 ) 8 ( ) 41( 0)2 2(2 3 )s
QQ V V V V Q V V V VV Qc VQQV VQ
π − + + − += − =
+. (A.6)
Obviously, when 3V V> , we always have * 1( 0)2s c VQπ = > . Therefore, the shape
of the function *sΠ switches from *
sπ to 12
VQ as the integration cost increases.
A.2 Proof of Lemma 2-3
We solve the constrained profit maximization problem by establishing Lagrangean
function, see (A.7) and then solving for the KKT conditions in Equations (A.8) to (A.11).
1 2 31 2 3 3 3 1 2 3
3
( ) ( ) ( ) ( ) ( )m mm m m m m m
P P PL P Q Q P Q Q P Q Q P P c PV V V
λ λ= − + − + − + + + − (A.7)
1 1
11
2 0, 0m m
mP m P
PL Q Q P LV
λ= − + ≤ = (A.8)
2 2
22
2 0, 0m
mPm m P
PL Q Q P LV
λ= − + ≤ = (A.9)
2 3
33 3 3
3
2 0, 0m m
mP m P
PL Q Q P LV
λ= − − ≤ = (A.10)
1 2 3 0, 0m m mL P P c P Lλ λλ= + + − ≥ = (A.11)
Obviously, the zero price solution can’t be optimal. So we must have equalities in
Equations (A.8) to (A.10). If 0λ > , then according to (A.11) we have 0Lλ = , which
implies 3 1 2m m mP P P c= + + . Substitute into Equations (A.8) to (A.10) and one gets the
optimal solutions as follows.
89
* * 3 31 2
3 3
( 2 2 )2 2( 2 ) 2m m
Q V V V cV VP PQV Q V
− −= = + >
+ (A.12)
* 3 3 3 33
3 3
( 2 2 )2 2( 2 ) 2m
V QV V V c VPQV Q V
− −= − <
+ (A.13)
2
* 3 33 3
3 3
( 2 2 )1 12 4 4( 2 )m
QQ V V cVQ V QQV Q V
π − −= + −
+ (A.14)
Note that 0λ > requires 3 2 2V V c> + . On the other hand, if 3 2 2V V c≤ + , we must
have we have 0λ = . The corresponding optimal solutions are
*1
ˆ2mVP = , *
2ˆ
2mVP = , * 3
3ˆ
2mVP = (A.15)
*3 3
1 1ˆ2 4m VQ V Qπ = + (A.16)
In summary, the optimal profit of the marketplace is specified in Eq. (A.14) if
3 2 2V V c> + and specified in Eq. (A.16) otherwise. Q.E.D.
A.3 Proof of Lemma 2-4
Take the first and second order derivative of *mπ with respect to c
*
3 3
3 3
( 2 2 )2
m QQ V V cc V Q VQ
π∂ − −=
∂ +,
2 *3
23 3
22
m QQc V Q VQπ∂ −
=∂ +
(A.17)
According to Lemma 2-3, *mπ is valid in the interval 3 2 2V V c> + . Therefore, *
mπ
is increasing and concave in c .
It is obvious that the optimal profit when 3 2 2V V c≤ + ( *ˆmπ ) is increasing in 3V and
3Q . Next we take the derivative of *mπ with respect to 3V and 3Q as follows.
* 2 2 2 2 2 2 2 2
3 3 3 32
3 3 3
( 2 2 2 )( 2 )
m Q Q V Q V Q c QQ V cVQQ cVQV QV Q Vπ∂ + + + + +
=∂ +
(A.18)
90
* 2 2 2 2 2 2 2 2 2
3 3 3 3 3 32
3 3 3
( 2 )( 2 )
m V VV QQ V Q cV Q VV Q Q V c Q cVQQ QV Q Vπ∂ + + + − − −
=∂ +
(A.19)
Obviously, *mπ is increasing in 3V since
*
3
0m
Vπ∂
>∂
. In addition, under the constraints
3 2 2V V c> + and c V< , we have *
3
0m
Qπ∂
>∂
. In summary, *mΠ ( *
mπ and *ˆmπ ) is increasing
in both 3V and 3Q . Q.E.D.
A.4 Proof of Proposition 2-6
First we compare the profit under ISV market structure ( *sπ ) vs. that of a
marketplace ( *mπ ) with respect to zero integration cost as follows.
3 2 2
* * 3 3 32
3 3 3 3
( )( 0) ( 0)(2 )(2 3 )m s
V V Q Q Qc cQ V V Q V Q Q V
π π += − = =
+ + (A.20)
Obviously, *mπ is always greater than *
sπ at 0c = . From lemma 2-1, we know that
the optimal total profit of the independent service vendors is maximized when the
integration cost is zero. Further, Lemma 2-3 suggests that the marketplace’s optimal
profit minimizes when the integration cost is zero. Therefore, the marketplace is always
a better market structure than the ISV market structure. Q.E.D.
A.5 Proof of Proposition 2-7
Proposition 2-6 suggests that the marketplaces always dominates the ISV market
structure. So we focus on comparing the profits under the market structure of SA against
marketplace. First note that when 3 2V V V< < , we have 3 2 2V V c< + for all 0c > .
According to Lemma 2-5, the optimal profit of the marketplace is 3 31 12 4
VQ V Q+ in the
interval [0, ]c V∈ . This suggests that the strategic alliance is always dominated in this
91
situation since its optimal profit is 3 314
V Q . Therefore, when 3 2V V V< < , the
marketplace is the optimal strategy for the service vendors.
Next we compare the optimal profit of the marketplace against that of the strategic
alliance by analyzing the difference of optimal profits under the two market structures
when 33
22 (4 )QV V VQ
< < + . Note that when the integration cost is zero, the profit
difference is
* * 3 3 3 33
3 3
(4 2 )( ) ( 0)4( 2 )m a
V Q Q V QV Q VV cV Q Q V
ϕ π + −= = − Π =
+ (A.21)
When 33
22 (4 )QV V VQ
< < + , we have 3 3 3 32 4 2Q V Q V Q V QV< < + , suggesting that
ϕ is always positive. Therefore, strategic alliance is dominated by the Web services
marketplace if 33
22 (4 )QV V VQ
< < + . Summarizing the results above, we conclude that
the marketplace is the optimal market strategy for the service vendors regardless of the
integration cost when 33
2(4 )QV V VQ
< < + . Q.E.D.
A.6 Proof of Proposition 2-8
From the proof of Proposition 2-7, we know that * *( 0)m acπ = < Π if 33
2(4 )QV VQ
> + .
Note that under the assumption 0 c V< < , we have 3 2 2V V c> + since 33
2(4 )QV VQ
> + .
This implies that the functional form of the marketplace is *mπ , according to Lemma 2-3.

92
By equating *mπ with *
aΠ , one gets two roots of the integration cost c , where the
marketplace generates the same profit as the strategic alliance, described as follows
2 23 3 3
33
4 212 2
Q V VV QQV V
Q+
− ± (A.22)
Since 0 c V< < and 312
V V V− > , we have the smaller root as the threshold value
c . From lemma 2-3, we know that *mπ is increasing in the integration cost. Therefore,
the strategic alliance is superior to the marketplace when c c< while the marketplace is
superior to the strategic alliance when c c> .
A.7 Proof of Proposition 2-9
According to lemma 2-5, the optimal profit of the Web services marketplace takes
the form of *mπ when 3 4V V> . From lemma 2-4, we note that *
mπ is increasing in
integration cost. Therefore, in the interval 0 c V≤ ≤ , the optimal profit of the
marketplace reaches maximum at c V= . The difference of the optimal profit of the
marketplace and the strategic alliance is
2 2
* * 3 3 3 3 3 33
3 3
(2 8 12 )( ) ( )4( 2 )m a
Q VV Q VV Q V Q Q VV c VV Q Q V
φ + − −≡ Π = − Π =
+ (A.23)
If 3( ) 0Vφ < , we conclude that the profit of the strategic alliance is greater than that
of the marketplace in the interval 0 c V≤ ≤ . The condition 3( ) 0Vφ < is equivalent to
2 23 3 3 3 3(2 8 ) 12 0Q V VQ VQ V V Q− + + > , (A.24)
which is satisfied under the following to conditions
3V V> or 3V V< , (A.25)
93
where 2 2
3 3
3
8 4(4 )
Q Q QQ QV V
Q+ + +
= + ,2 2
3 3
3
8 4(4 )
Q Q QQ QV V
Q− + +
= + .
From proposition 2-8, we know that the strategic alliance dominates the
marketplace if 33
2(4 )QV VQ
> + . Obviously, the second condition is not feasible since
3
2(4 )QV VQ
< + . Therefore, the strategic alliance dominates the marketplace under the
first condition, i.e., 3V V> . Q.E.D.
94
APPENDIX B PROOFS OF CHAPTER 3
B.1 Proof of Proposition 3-1
First, we derive the WSI’s optimal price and profit at given location x . Note that
the WSI’s demand is conditional on the price of the integrated service 3P , therefore, we
need to calculate the WSI’s optimal price and profit under different classifications of the
demand function.
Case 1: If 3 1 2P P P c t≥ + + + , we have 1 2 0y y= = . This makes zero profit for the
WSI since the price is too high. We will disregard this situation in the future analysis.
Case 2: If 1 2 3 1 2(1 )P P c t x P P P c t+ + + − ≤ ≤ + + + , we have 1 20 ,m my y x≤ ≤ . The
total demand of the WSI is 1 2m mD y y= + . The decision problem of the WSI is to
optimally set the price 3P to maximize profit, described in (B.1).
3
1 2 33
1 2 3 1 2
( ) max =2
s.t. (1 )P
P P c t PPt
P P c t x P P P c t
π + + + −⋅
+ + + − ≤ ≤ + + + (B.1)
By solving the profit maximization problem in (A1), one gets the optimal price and
profit as follows.
*3 1 2 (1 )P P P c t x= + + + − , *
1 22 [ (1 )]x P P c t xπ = + + + − (B.2)
Case 3: If 1 2 3 1 2 (1 )P P c tx P P P c t x+ + + ≤ ≤ + + + − , we must have 1my x≥ and
2 1my x≤ − , so the total demand of the WSI is 2mD x y= + . Similar to the case 1-2, we
95
solve the profit maximization problem for the WSI. The optimal price and profit in this
case are summarized as below.
a. If 1 22( )t P P c≥ + + and 1 2 1 3 2
P P c t xt
+ + +≤ ≤ , the optimal price and profit are
the same as in (B.2).
b. If 1 22( )t P P c≥ + + and 1 203
P P c txt
+ + +≤ ≤ or if 1 20 2( )t P P c≤ ≤ + + and
1 2( ) 0 t P P cxt
− + +≤ ≤ , the optimal price and profits are
* 1 23
(1 )2
P P c t xP + + + += ,
2* 1 2[ (1 )]
4P P c t x
tπ + + + +
= (B.3)
c. If 1 20 2( )t P P c≤ ≤ + + and 1 2( ) 1 2
t P P c xt
− + +≤ ≤ , the price and profits are
*3 1 2P P P c tx= + + + , *
1 2P P c txπ = + + + (B.4)
Case 4: If 3 1 2P P P c tx≤ + + + , we have 1my x≥ and 2 1my x≥ − . This suggests that
the WSI captures the whole market demand. In addition, if the WSI attracts all demand
in market, it doesn’t gain more profit if it lowers the price. Therefore, the bounding
solution gives the optimal price and profit in this case, which is the same as in Eq. (B.4).
By comparing the maximal profits in Cases B-2 to B-4, we can determine the
optimal profit *π for the WSI given any location x . Next, given the WSI’s optimal
profit at any location x , the optimal location of the WSI is selected as the one that yields
maximum profit.
Since the profit in case 1-3 is conditional on the delay cost t , we determine the
optimal location and profit for the WSI under different setting of t . First, we look at the
scenario when 1 22( )t P P c≥ + + . If 1 203
P P c txt
+ + +≤ ≤ , we need to compare the profits
96
specified in Equations (B.2), (B.3), and (B.4) to derive the optimal price and profit. It
can be shown that the optimal profit is described in Eq. (B.3). Note that the profit in Eq.
(B.3) is increasing in x . Therefore, the intermediary will set its location at the upper-
bound. In summary, the optimal location, price and profit for the range
1 203
P P c txt
+ + +≤ ≤ are
1 2
3P P c tx
t+ + +
= , 1 23
2( )3
P P c tP + + += ,
21 24( )
9P P c t
tπ + + +
= (B.5)
In a similar manner, we compare the profits in Equations (B.2) and (B.4) for the
scenario when 1 2 13 2
P P c t xt
+ + +≤ ≤ . Our analysis shows that the maximum profit is
found in (B.2). Consequently, the optimal location, price and profit for the range
1 2 13 2
P P c t xt
+ + +≤ ≤ are
12
x = , 3 1 2 0.5P P P c t= + + + , 1 2 0.5P P c tπ = + + + (B.6)
By comparing the profits in Equations (B.5) and (B.6), we conclude that * 12
x = is
the optimal location for the WSI. This is because when 1 22( )t P P c≥ + +
2 2
1 2 1 20.5 ( ) 4( ) 09
t t P P c P P ct
π π + + + − + +− = ≥ (B.7)
The corresponding optimal price and profit are
*3 1 2 0.5P P P c t= + + + , *
1 2 0.5P P c tπ = + + + (B.8)
97
Next, we consider the scenario when 1 20 2( )t P P c≤ ≤ + + . Following a similar
solution procedure, we find that the optimal location is * 12
x = and the corresponding
price and profit are the same as in Eq. (B.8).
To summarize the above two scenarios, the optimal location of the WSI is * 12
x = ,
independent of the delay cost. In addition, the optimal price and profit is shown in Eq.
(B.8). By inspection, the optimal profits and prices are increasing in delay cost t and
integration cost c . In addition, the comparative statics is straightforward since
* *
c tπ π∂ ∂
>∂ ∂
. Q.E.D.
B.2 Proof of Lemma 3-2
Note that the total cost to buy from the Web service intermediary (WSI) or to create
the integrated Web service by buying S1 and S2 from individual service providers (SP) is
determined by the customer’s and the WSI’s locations, see Equations. (3.6) and (3.8).
Therefore, we need to calculate the highest market penetration price 3P under four
scenarios, i.e., the WSI is located in the AB, BC, CD or DA segment. In each scenario,
we consider demand of customers in AB, BC, CD and DA.
Scenario 1. The WSI is between A and B ( 0 x d≤ ≤ )
For customers between AB, the total cost to buy from the SP is
1 2P P c td+ + + while the highest cost to buy from the WSI is 3P tx+ if 02dx≤ ≤ , or
3 ( )P t d x+ − if 2d x d< ≤ . Thus, the WSI attracts all customers between AB if
98
3 1 2 1 2min{ , ( )}P P P c tx P P c t d x≤ + + + + + + − . Similarly, all customers between CD will
buy from the WSI if 3 1 21( )2
P P P c t d≤ + + + − .
For customers between BC, the cost to buy from SP and WSI are greater than the
cost incurred by the customer at location B, but the increased cost is greater if buying
from SP. This implies that if customer at point B will buy from WSI, all customers
between BC will buy from the WSI too. Likewise, all customers between DA will buy
from the WSI if the customer at location A prefers the WSI.
Scenario 2. The WSI is between B and C ( 12
d x< ≤ )
Due to similar argument as in scenario 1, the WSI captures the entire market
demand in section AB if 3 1 2 ( )P P P c t d x≤ + + + − while all customers between CD prefer
the WSI if 3 1 21( 2 )2
P P P c t d x≤ + + + − + . In addition, all customers between BC will
buy from WSI if the customer at location B buys from WSI and all customers between
DA will buy from the WSI as long as customer at A prefers to buy from the WSI.
Adding the fact that 12
d x< ≤ and 0d x− < , the highest price that could still capture the
whole market is 1 2 ( )P P c t d x+ + + − .
Scenario 3. The WSI is between C and D ( 1 12 2
x d< ≤ + )
Consider the marginal customer who is located between AB and diagonal to the
WSI. The cost to buy from SP is 1 2P P c td+ + + while the cost to buy from WSI is
3 / 2P t+ . Therefore, the customer will buy from WSI if 3 1 2 ( 1/ 2)P P P c t d≤ + + + − . For
all other customers, they have a higher or equal cost to buy from SP while a lower cost to
99
buy from WSI. Thus, they will all buy from WSI if the marginal customer buys from
WSI.
Scenario 4. The WSI is between D and A ( 1 12
d x+ ≤ < )
Similar to the argument in previous scenarios, all customers will buy from WSI if
the customer at point B buys from the WSI. The highest price the WSI can charge is
1 2 ( 1)P P c t x+ + + − . Q.E.D.
B.3 Proof of Lemma 3-4
We prove this lemma by induction. Let N∆ denote the reduced demand when the
WSI raises its price above the market-covering price. First consider raising price to
3tPN
+ ( 1k = ). Since 3P is the highest market penetration price, there is one marginal
customer who is indifferent between the WSI and the service providers. This marginal
consumer will switch to the service providers if the WSI raises the price, i.e., 1N∆ = . At
the same time, the customer next to the marginal customer but closer to the WSI becomes
indifferent between the service providers and the WSI. Suppose we have 1N k∆ ≥ −
when 3 ( 1) tP kN
∆ = − and there is one marginal customer (denoted by 0θ ). If we further
raise the price by tN
, the marginal customer at 0θ will switch to the service providers.
At the same time, the customer next to 0θ and closer to or further from the WSI becomes
the next marginal customer. The WSI continues to loose customers in this way until all
customers in market switch to the service providers. In summary, we have
min{ , }N k N∆ ≥ when 3ktPN
∆ = . If 3( 1)kt k tP
N N+
< ∆ < , it’s similar to the case of
100
3ktPN
∆ = except that one more customer switches to the WSI instead of becoming the kth
marginal customer. Q.E.D.
B.4 Proof of Proposition 3-5
We first prove that the market-covering price is optimal for the WSI if
1 22( )t P P c≤ + + . When the price of the integrated service is 3P , the WSI obtains total
profit 3P Nπ = . If the WSI sets a price below 3P , it will lose profit since reducing
price won’t increase the WSI’s demand. On the other hand, if the WSI raises its price by
3P∆ , the WSI’s profit becomes
3 3 3 3 3( )( ) ( )P P N N P N P N N NPπ = + ∆ − ∆ = + ∆ − ∆ − ∆ (B.9)
Obviously, if 3P∆ is very large, all customers will switch to the service providers
( N N∆ = ) and the WSI has zero profit. We now restrict our attention when N N∆ < .
Lemma 3-3 suggests that when 3( 1)k t ktP
N N−
< ∆ < , N k∆ ≥ thus 3 3NP kP∆ ≥ . Further,
we have 3 3( )P N N P N kt∆ − ∆ ≤ ∆ = . According to the functional form of 3P in Lemma 1,
we have 3P t> if 1 22( )t P P c≤ + + . Therefore, the WSI’s profit decreases when it
charges a price higher than 3P regardless of its location x . Moreover, Lemma 3-2
suggests that if the WSI charges the highest market-covering price 3P , it gains maximum
profit if it is located between the service providers. In summary, the WSI’s total profit is
maximized if it is located between the service providers and sets the price at 3P . Q.E.D.
B.5 Proof of Proposition 3-6
The highest penetration price charged by the WSI when it is located between the
Web service vendors can be rewritten as follows.
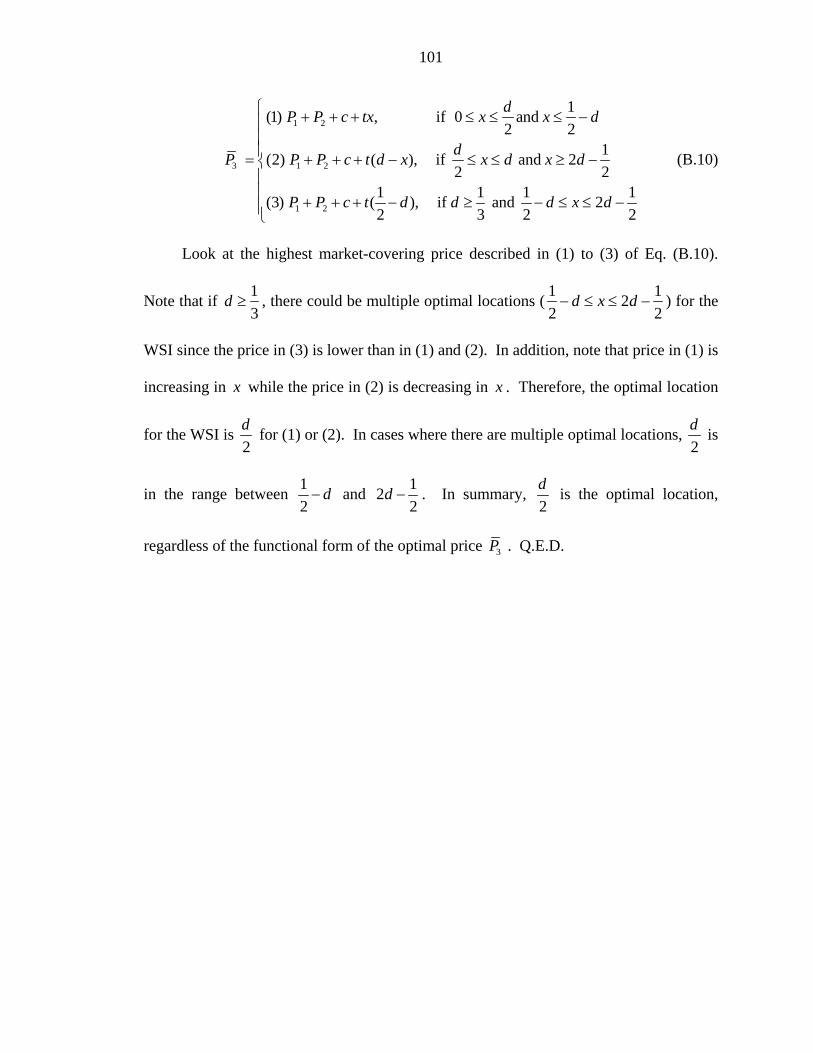
101
1 2
3 1 2
1 2
1(1) , if 0 and 2 2
1(2) ( ), if and 22 2
1 1 1 1(3) ( ), if and 22 3 2 2
dP P c tx x x d
dP P P c t d x x d x d
P P c t d d d x d
⎧ + + + ≤ ≤ ≤ −⎪⎪⎪= + + + − ≤ ≤ ≥ −⎨⎪⎪ + + + − ≥ − ≤ ≤ −⎪⎩
(B.10)
Look at the highest market-covering price described in (1) to (3) of Eq. (B.10).
Note that if 13
d ≥ , there could be multiple optimal locations ( 1 122 2
d x d− ≤ ≤ − ) for the
WSI since the price in (3) is lower than in (1) and (2). In addition, note that price in (1) is
increasing in x while the price in (2) is decreasing in x . Therefore, the optimal location
for the WSI is 2d for (1) or (2). In cases where there are multiple optimal locations,
2d is
in the range between 12
d− and 122
d − . In summary, 2d is the optimal location,
regardless of the functional form of the optimal price 3P . Q.E.D.
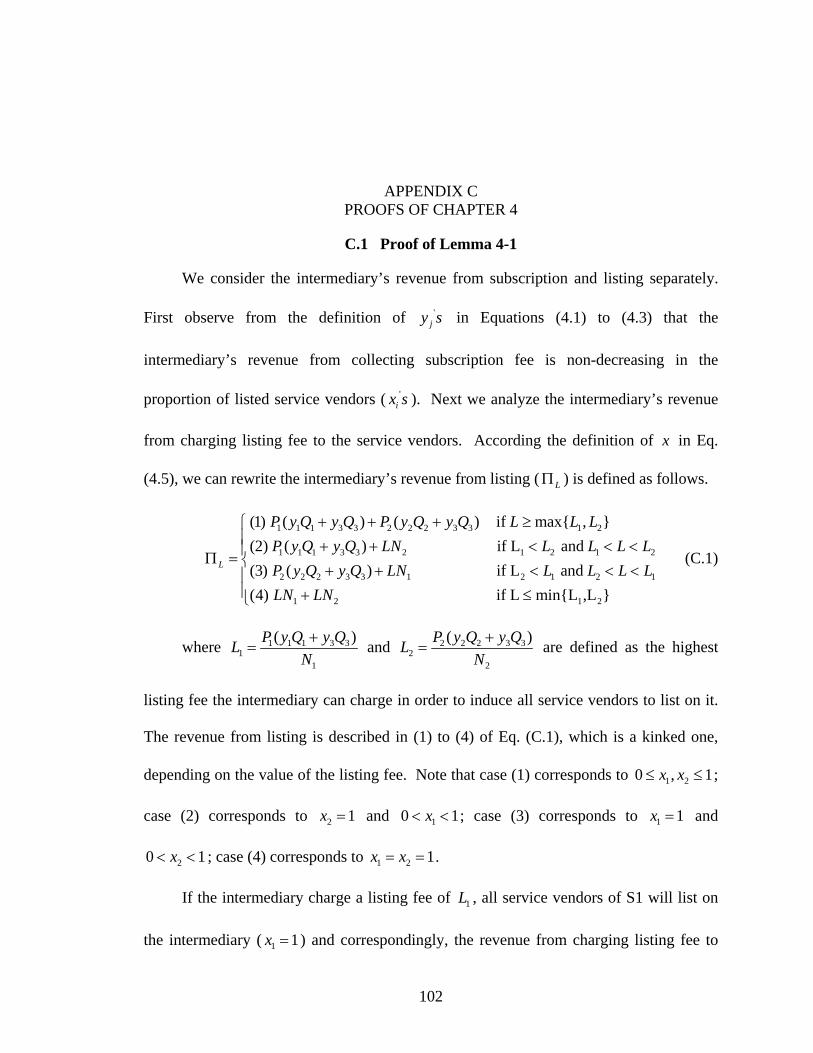
102
APPENDIX C PROOFS OF CHAPTER 4
C.1 Proof of Lemma 4-1
We consider the intermediary’s revenue from subscription and listing separately.
First observe from the definition of 'jy s in Equations (4.1) to (4.3) that the
intermediary’s revenue from collecting subscription fee is non-decreasing in the
proportion of listed service vendors ( 'ix s ). Next we analyze the intermediary’s revenue
from charging listing fee to the service vendors. According the definition of x in Eq.
(4.5), we can rewrite the intermediary’s revenue from listing ( LΠ ) is defined as follows.
1 1 1 3 3 2 2 2 3 3 1 2
1 1 1 3 3 2 1 2 1 2
2 2 2 3 3 1 2 1 2 1
1 2
(1) ( ) ( ) if max{ , }(2) ( ) if L and (3) ( ) if L and (4)
L
P y Q y Q P y Q y Q L L LP y Q y Q LN L L L LP y Q y Q LN L L L LLN LN
+ + + ≥+ + < < <
Π =+ + < < <
+ 1 2 if L min{L ,L }
⎧⎪⎪⎨⎪⎪ ≤⎩
(C.1)
where 1 1 1 3 31
1
( )P y Q y QLN
+= and 2 2 2 3 3
22
( )P y Q y QLN
+= are defined as the highest
listing fee the intermediary can charge in order to induce all service vendors to list on it.
The revenue from listing is described in (1) to (4) of Eq. (C.1), which is a kinked one,
depending on the value of the listing fee. Note that case (1) corresponds to 1 20 , 1x x≤ ≤ ;
case (2) corresponds to 2 1x = and 10 1x< < ; case (3) corresponds to 1 1x = and
20 1x< < ; case (4) corresponds to 1 2 1x x= = .
If the intermediary charge a listing fee of 1L , all service vendors of S1 will list on
the intermediary ( 1 1x = ) and correspondingly, the revenue from charging listing fee to
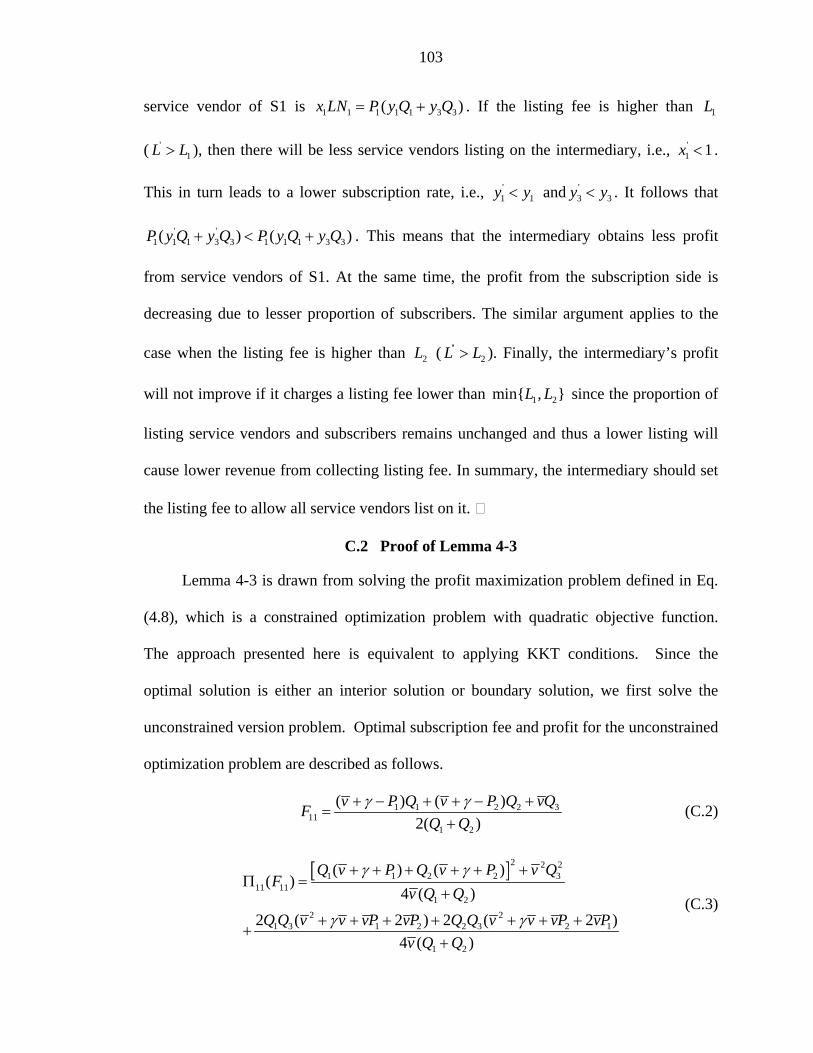
103
service vendor of S1 is 1 1 1 1 1 3 3( )x LN P y Q y Q= + . If the listing fee is higher than 1L
( '1L L> ), then there will be less service vendors listing on the intermediary, i.e., '
1 1x < .
This in turn leads to a lower subscription rate, i.e., '1 1y y< and '
3 3y y< . It follows that
' '1 1 1 3 3 1 1 1 3 3( ) ( )P y Q y Q P y Q y Q+ < + . This means that the intermediary obtains less profit
from service vendors of S1. At the same time, the profit from the subscription side is
decreasing due to lesser proportion of subscribers. The similar argument applies to the
case when the listing fee is higher than 2L ( ''2L L> ). Finally, the intermediary’s profit
will not improve if it charges a listing fee lower than 1 2min{ , }L L since the proportion of
listing service vendors and subscribers remains unchanged and thus a lower listing will
cause lower revenue from collecting listing fee. In summary, the intermediary should set
the listing fee to allow all service vendors list on it.
C.2 Proof of Lemma 4-3
Lemma 4-3 is drawn from solving the profit maximization problem defined in Eq.
(4.8), which is a constrained optimization problem with quadratic objective function.
The approach presented here is equivalent to applying KKT conditions. Since the
optimal solution is either an interior solution or boundary solution, we first solve the
unconstrained version problem. Optimal subscription fee and profit for the unconstrained
optimization problem are described as follows.
1 1 2 2 311
1 2
( ) ( )2( )
v P Q v P Q vQFQ Q
γ γ+ − + + − +=
+ (C.2)
[ ]2 2 21 1 2 2 3
11 111 2
2 21 3 1 2 2 3 2 1
1 2
( ) ( )( )
4 ( )
2 ( 2 ) 2 ( 2 )4 ( )
Q v P Q v P v QF
v Q Q
Q Q v v vP vP Q Q v v vP vPv Q Q
γ γ
γ γ
+ + + + + +Π =
+
+ + + + + + ++
+
(C.3)
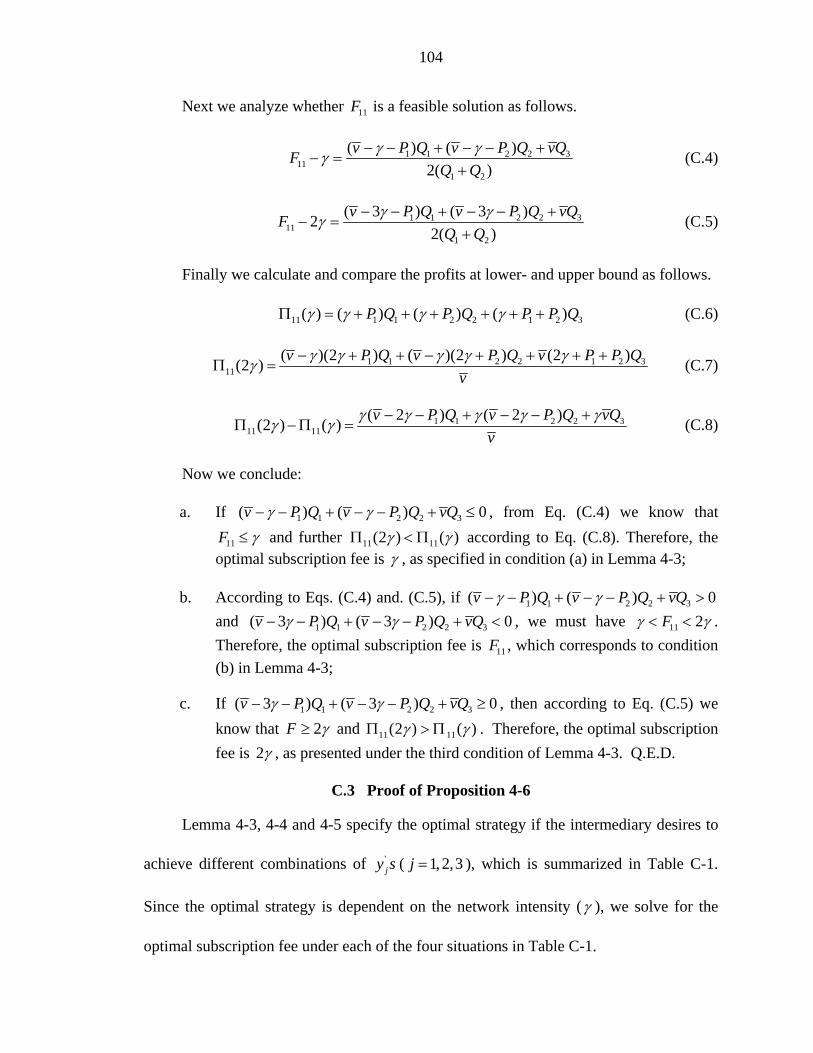
104
Next we analyze whether 11F is a feasible solution as follows.
1 1 2 2 311
1 2
( ) ( )2( )
v P Q v P Q vQFQ Q
γ γγ − − + − − +− =
+ (C.4)
1 1 2 2 311
1 2
( 3 ) ( 3 )22( )
v P Q v P Q vQFQ Q
γ γγ − − + − − +− =
+ (C.5)
Finally we calculate and compare the profits at lower- and upper bound as follows.
11 1 1 2 2 1 2 3( ) ( ) ( ) ( )P Q P Q P P Qγ γ γ γΠ = + + + + + + (C.6)
1 1 2 2 1 2 311
( )(2 ) ( )(2 ) (2 )(2 ) v P Q v P Q v P P Qv
γ γ γ γ γγ − + + − + + + +Π = (C.7)
1 1 2 2 311 11
( 2 ) ( 2 )(2 ) ( ) v P Q v P Q vQv
γ γ γ γ γγ γ − − + − − +Π − Π = (C.8)
Now we conclude:
a. If 1 1 2 2 3( ) ( ) 0v P Q v P Q vQγ γ− − + − − + ≤ , from Eq. (C.4) we know that
11F γ≤ and further 11 11(2 ) ( )γ γΠ < Π according to Eq. (C.8). Therefore, the optimal subscription fee is γ , as specified in condition (a) in Lemma 4-3;
b. According to Eqs. (C.4) and. (C.5), if 1 1 2 2 3( ) ( ) 0v P Q v P Q vQγ γ− − + − − + > and 1 1 2 2 3( 3 ) ( 3 ) 0v P Q v P Q vQγ γ− − + − − + < , we must have 11 2Fγ γ< < . Therefore, the optimal subscription fee is 11F , which corresponds to condition (b) in Lemma 4-3;
c. If 1 1 2 2 3( 3 ) ( 3 ) 0v P Q v P Q vQγ γ− − + − − + ≥ , then according to Eq. (C.5) we know that 2F γ≥ and 11 11(2 ) ( )γ γΠ > Π . Therefore, the optimal subscription fee is 2γ , as presented under the third condition of Lemma 4-3. Q.E.D.
C.3 Proof of Proposition 4-6
Lemma 4-3, 4-4 and 4-5 specify the optimal strategy if the intermediary desires to
achieve different combinations of 'jy s ( 1,2,3j = ), which is summarized in Table C-1.
Since the optimal strategy is dependent on the network intensity (γ ), we solve for the
optimal subscription fee under each of the four situations in Table C-1.

105
Table C-1. Optimal Subscription Fee when vγ < *
1iF 110 γ γ≤ ≤ 11 12γ γ γ< < 12 13γ γ γ≤ < 13 vγ γ≤ < *
11F 2γ 2γ 11F γ *
12F 12F 2γ 2γ 2γ *
13F v γ+ v γ+ v γ+ v γ+ The optimal subscription fee can be found as the one of *
11F , *12F , and *
13F that
maximizes the profit of the WSI. We observe:
a. If 110 γ γ≤ ≤ , the optimal subscription fee is 12F as specified in (a) of Proposition 4-6 since
[ ]21 1 2 2 3 1 2
12 12 111 2 3
( 3 ) ( 3 ) ( 2 )( ) (2 ) 0
4 ( )Q v P Q v P Q v P P
Fv Q Q Q
γ γ γγ
− − + − − + − − −Π − Π = >
+ + (C.9)
2
1 1 2 2 3 1 212 12 13
1 2 3
[ ( ) ( ) ( )]( ) ( ) 04 ( )
Q v P Q v P Q v P PF vv Q Q Q
γ γγ + + + + + + + +Π − Π + = >
+ + (C.10)
b. If 11 12γ γ γ≤ < , the optimal subscription fee is 2γ as specified in (b) of Proposition 4-6 since
[ ]1 1 2 2 3 1 211 13
( ) (2 ) (2 ) ( )( )(2 ) ( ) 0
v Q P Q P Q v P Pv
vγ γ γ γ γ
γ γ− + + + + − + +
Π − Π + = > (C.11)
c. If 12 13γ γ γ≤ < , the optimal subscription fee is 11F as specified in (c) of Proposition 4-6 since
2
1 1 2 2 311 11 12
1 2
[ ( 3 ) ( 3 ) ]( ) (2 ) 04 ( )
Q v P Q v P vQFv Q Q
γ γγ − − + − − +Π − Π = >
+ (C.12)
d. If 13 vγ γ≤ < , we conclude that the optimal subscription fee is γ as specified in (d) of Proposition 4-6 by observing the fact that 11 11( ) (2 )γ γΠ > Π in the proof of (1) in Lemma 4-3 and 11 13(2 ) ( )vγ γΠ > Π + from Eq. (C.11). Q.E.D.
C.4 Proof of Proposition 4-12
Proposition 4-12 can be proved by using the similar approach when we prove
Proposition 4-6. First we summarize the optimal strategy of the intermediary under
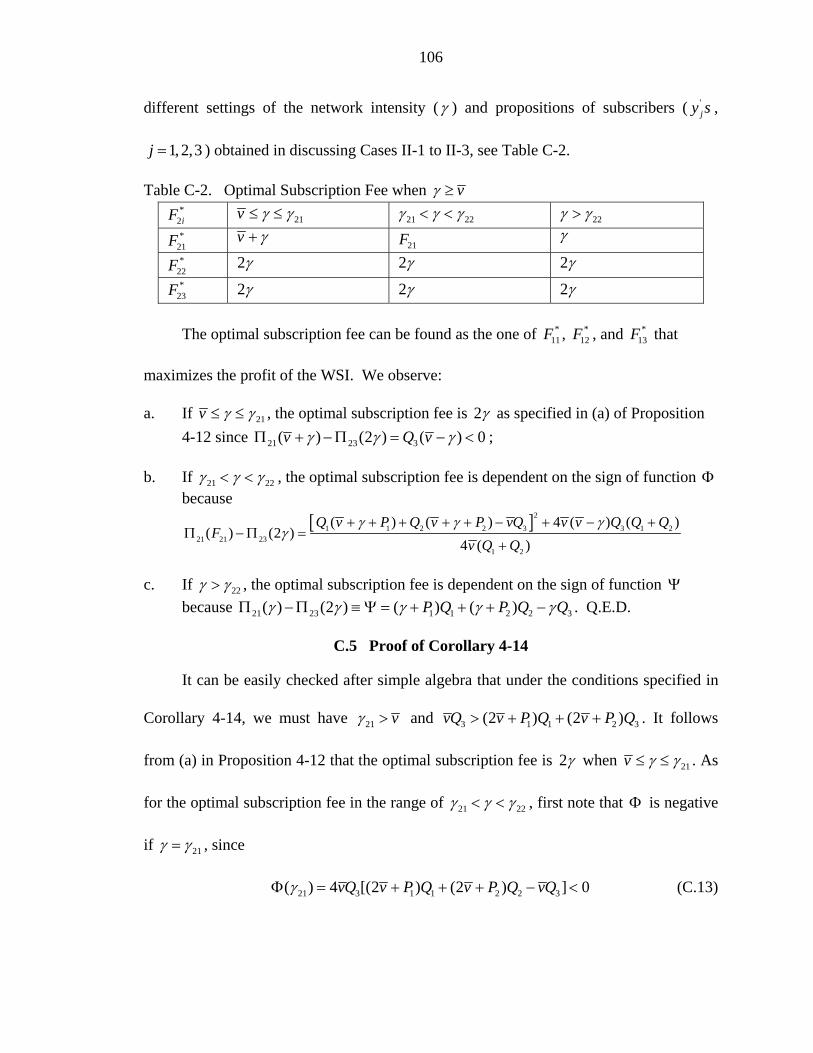
106
different settings of the network intensity (γ ) and propositions of subscribers ( 'jy s ,
1, 2,3j = ) obtained in discussing Cases II-1 to II-3, see Table C-2.
Table C-2. Optimal Subscription Fee when vγ ≥ *
2iF 21v γ γ≤ ≤ 21 22γ γ γ< < 22γ γ> *
21F v γ+ 21F γ
*22F 2γ 2γ 2γ *
23F 2γ 2γ 2γ The optimal subscription fee can be found as the one of *
11F , *12F , and *
13F that
maximizes the profit of the WSI. We observe:
a. If 21v γ γ≤ ≤ , the optimal subscription fee is 2γ as specified in (a) of Proposition 4-12 since 21 23 3( ) (2 ) ( ) 0v Q vγ γ γΠ + − Π = − < ;
b. If 21 22γ γ γ< < , the optimal subscription fee is dependent on the sign of function Φ because
[ ]2
1 1 2 2 3 3 1 221 21 23
1 2
( ) ( ) 4 ( ) ( )( ) (2 )
4 ( )Q v P Q v P vQ v v Q Q Q
Fv Q Q
γ γ γγ
+ + + + + − + − +Π − Π =
+
c. If 22γ γ> , the optimal subscription fee is dependent on the sign of function Ψ because 21 23 1 1 2 2 3( ) (2 ) ( ) ( )P Q P Q Qγ γ γ γ γΠ − Π ≡ Ψ = + + + − . Q.E.D.
C.5 Proof of Corollary 4-14
It can be easily checked after simple algebra that under the conditions specified in
Corollary 4-14, we must have 21 vγ > and 3 1 1 2 3(2 ) (2 )vQ v P Q v P Q> + + + . It follows
from (a) in Proposition 4-12 that the optimal subscription fee is 2γ when 21v γ γ≤ ≤ . As
for the optimal subscription fee in the range of 21 22γ γ γ< < , first note that Φ is negative
if 21γ γ= , since
21 3 1 1 2 2 3( ) 4 [(2 ) (2 ) ] 0vQ v P Q v P Q vQγΦ = + + + − < (C.13)
107
Next, we calculate the first derivative of Φ with respect to γ and evaluate the sign
for 22γ γ= , described in Eqs. (C.14) and (C.15).
1 2 1 1 2 2 3( )[( ) ( ) 3 ]Q Q v P Q v P Q vQγ γ γγ
∂ΦΦ ≡ = + + + + + + −
∂ (C.14)
22 1 2 3( ) 2 ( ) 0v Q Q Qγ γΦ = + − < (C.15)
Since γΦ is increasing in γ and it is evaluated negative at 22γ , it follows that γΦ
is negative for the interval 21 22γ γ γ< < . Adding the fact that Φ is negative at 21γ , we
conclude that 0Φ < is negative in the interval 21 22γ γ γ< < . According to (b) in
Proposition 4-12, we know that the optimal subscription fee is 2γ under the condition
that 21 22γ γ γ< < . In addition, the optimal subscription fee will never switch from 2γ to
21F with the increase of γ when 1 2 3Q Q Q+ < .
Finally, we show that if 22( ) 0γΦ < , the function Ψ is negative in the interval
22γ γ≥ due to two facts: (1) functions Φ and Ψ have same sign when 22γ γ= , see Eqs.
(C.16) and (C.17); (2) Ψ is decreasing in γ when 1 2 32( )Q Q Q+ < .
2 2 222 1 1 2 1 1 3 2 2 2 3 3( ) 4 ( 2 )v vQ vQ Q PQ Q vQ P Q Q vQγΦ = + + + + − (C.16)
2 2 2
1 1 2 1 1 3 2 2 2 3 322
1 2
2( ) vQ vQ Q PQ Q vQ P Q Q vQQ Q
γ + + + + −Ψ =
+ (C.17)
In summary, under the conditions specified in Corollary 4-14, the optimal
subscription charged by the intermediary is 2γ if vγ ≥ . Q.E.D.
C.6 Proof of Corollary 4-15
First note from the definition of 21γ , that under the conditions specified in
Corollary 4-15, we have 21 vγ < . This implies that first condition specified in
108
Proposition 4-12 will never be satisfied. Therefore, we only need to consider the optimal
subscription fee under conditions (b) and (c), i.e, the optimal subscription fee is either 21F
or 2γ when 21 22γ γ γ< < while the optimal subscription fee is either γ or 2γ when
22γ γ> . Since 21F is found between γ and 2v γ γ+ < and 21F γ= when 21γ γ= , we can
prove that the optimal subscription fee is increasing in γ if there are only three possible
cases for the optimal subscription fee: (a) 2γ for the entire region vγ > ; (b) 21F for
21 22γ γ γ< < ; γ then 2γ for 22γ γ> ; (c) 21F and then 2γ for 21 22γ γ γ< < ; 2γ for
22γ γ> .
We note that:
a. From the proof of Corollary 4-14, we know that when 1 2 32( )Q Q Q+ < , the optimal subscription will never switch from 2γ to 21F in the interval
21 22γ γ γ< < . Furthermore, we have shown in the previous Corollary that if the optimal subscription fee is 2γ when 21 22γ γ γ< < , i.e., 22( ) 0γΦ < we must have 0Ψ < for the region 22γ γ> ;
b. If the optimal subscription fee is 21F in the interval 21 22γ γ γ< < , we must have 22( ) 0γΦ > . Since functions Φ and Ψ have same sign, we must have
22( ) 0γΨ > , which implies that the optimal subscription take the form of γ at
22γ γ= ;
c. It is already shown in the previous Corollary that if 22( ) 0γΦ < , the optimal subscription fee takes the form of 2γ in the interval 22γ γ> . Q.E.D.
109
LIST OF REFERENCES
Bailey, J. P. 1998. Intermediation and electronic markets: aggregation and pricing in Internet commerce. PhD Dissertation, MIT, Cambridge, MA. http://www.rhsmith.umd.edu/lbpp/jbailey/pub/phdthesis.pdf, last accessed June 08, 2004.
Bailey, J. P. and Bakos, Y. 1997. An exploratory study of the emerging role of electronic intermediaries. International Journal of Electronic Commerce 1 3 7-20.
Bakos, J. Y. 1997. Reducing buyer search costs: implications for electronic marketplaces. Management Science 43 12 1676-1692.
_________. 1998. The emerging role of electronic marketplaces on the internet. Communications of the ACM 41 8 35-42.
_________, Brynjolfsson, E. 1999. Bundling information goods: pricing, profits and efficiency. Management Science 45 12 1613-1630.
_________, _________ 2000. Bundling and competition on the internet. Marketing Science 19 1 63-82.
Baye, M., Morgan, J. 2001. Information gatekeepers on the internet and the competitiveness of homogeneous product markets. The American Economic Review 91 3 454-474.
Bhargava, H., Choudhary, V. 2004. Economics of an information intermediary with aggregation benefits. Information Systems Research 15 1 22-36.
Biglaiser, G. 1993. Middlemen as experts. The Rand Journal of Economics 24 2 212-223.
Chuang, J. C, Sirbu, M. A. 1999. Optimal bundling strategy for digital information goods: network delivery of articles and subscriptions. Information Economics and Policy 11 2 147-177.
Corbett, J. C., Karmarkar, U. S. 1999. Optimal pricing strategies for an information intermediary. Working paper, University of California, Los Anglos. http://personal.anderson.ucla.edu/charles.corbett/papers/99-001.pdf, last accessed June 11, 2004.
Cubera, F., Khalaf R., Mukhi, N., Tai, S., Weerawarana, S. 2003. The next step in Web services. Communications of the ACM 46 10 29-34.
110
Economides, N., Salop, S. 1992. Competition and integration among complements, and network market structure. Journal of Industrial Economics. 40 1 105-123.
Erlenkotter, D. 1977. Facility location with price-sensitive demands: private, public and quasi-public. Management Science 24 4 378-386.
Farrell, J., Katz, M. 2000. Innovation, rent extraction and integration in systems markets, Journal of Industrial Economics 48 4 413- 432.
Ferris, C., Farrell, J. 2003. What are Web services? Communications of the ACM 46 6 31.
Fingar, P. 2000. Component-based frameworks for e-commerce. Communications of the ACM 43 10 61-66.
Gehrig, T. 1993. Intermediation in search markets. Journal of Economics and Management Strategy 2 97-120.
Geng, X., Huang, Y., Winston, A. B. 2003. Smart marketplaces: a step beyond web services. Information and e-Business Management 1 1 15-34.
Gottschalk, K., Graham, S., Kreger, H., Snell, J. 2002. Introduction to web services architecture. IBM Systems Journal 41 2 170-177.
Samtani, G., Sadhwani, D. 2001. EAI and Web services: easier enterprise application integration? http://www.webservicesarchitect.com/content/articles/samtani01print.asp, last accessed June 08, 2004.
Hagel, J. III, Brown, J. S. 2001. Your next IT strategy. Harvard Business Review October 105-113.
Harter, D. E., Slaughter, S. A. 2003. Quality improvement and infrastructure activity costs in software development: a longitudinal analysis. Management Science 49 6 784-800.
Huang, Y., Chung, J-Y. 2003. A web service-based framework for business integration solutions. Electronic Research and Applications 2 15-26.
Irani, R. 2001. Web services intermediaries: adding value to Web services. http://www.webservicesarchitect.com/content/articles/irani07print.asp, last accessed June 11, 2004.
Johansson, J. M. 2000. On the impact of network latency on distributed systems design. Information Technology and Management 1 3 183-194.
Johansson, J. M., March, S. T., Naumann, J. D. 2000. The effects of parallel processing on update response time in distributed database design. Proceedings of International Conference on Information Systems (ICIS). 187-196.
111
Kaplan, E., M. Sawhney 2000. E-hubs: the new B2B marketplaces. Harvard Business Review May-June 97-103.
Kreger, H. 2003. Fulfilling the Web services promise. Communications of the ACM. 46 6 29-34.
Krishnan, M. S., Kriebel, C. H., Kekre, S., Mukhopadhyay, T. 2000. An empirical analysis of productivity and quality in software products. Management Science 46 6 745-759.
Li, B., Golin, M. J., Italiano, G. F., Deng, X. 1999. On the optimal placement of web proxies in the internet. Proceedings of 18th IEEE INFOCOM 1282-1290.
Little, M. 2003. Transactions and web services. Communications of the ACM 46 10 49-54.
Liu, Q., Padmanabham, V. N., Voelker, G. M. 2001. On the placement of web server replicas. Proceedings of 20th IEEE INFOCOM 1587-1596.
Lyytinen, K., Mathiassen, L., Ropponen, J. 1998. Attention shaping and software risk: a categorical analysis of four classical risk management approaches. Information Systems Research 9 3 233-255.
Matutes, C., Regibeau, P. 1992. Compatibility and bundling of complementary goods in duopoly, Journal of Industrial Economics. 40 1 37-54.
Naert, P. 1971. Optimizing consumer advertising, intermediary and markup in a vertical market structure. Management Science 18 4 90-101.
Newcomer, E. 2002. Understanding Web services: XML, WSDL, SOAP and UDDI. Addison-Wesley.
Parker, G. and Van Alstyne, M. 2001. Opening the code: how open is optimal? Proceedings of 23rd International Conferences on Information Systems (ICIS) 519-523.
Rubinstein, A., Wolinsky, A. 1987. Middleman. The Quarterly Journal of Economics 102 3 581-594.
Rust, R. T., Kannan, P. K. 2003. E-service: a new paradigm for business in the electronic environment. Communications of the ACM 46 6 36-42.
Salkever, A. 2003. Slowly weaving web services together. BusinessWeek June 24, 2003.
Schmelzer, R. 2002. XML and Web services unleashed. Sams Publishing Indianapolis, IN.
112
Sharma, S. K., Gupta, J. N. D. 2002. Application service providers: issues and challenges. Logistics Information Management 15 3 160-169.
Sleeper, B. June 2001. Defining Web services: an analysis memo from Stencil Group. http://www.perfectxml.com/Xanalysis/TSG/TSG_DefiningWebServices.pdf, last accessed June 09, 2004.
Spulber, D. 1996. Market microstructure and intermediation. Journal of Economic Perspectives 10 3 135-152.
Sun, Y. 2003. A location model for web services intermediaries. Doctoral Dissertation, Warrington College of Business Administration, University of Florida, Gainesville, FL.
_____, Koehler, G 2003. A location model for web services intermediaries, California State University, San Marcos working paper.
Sundarraj, R. P., Talluri, S. 2003. A multi-period optimization model for the procurement of component-based enterprise information technologies. European Journal of Operational Research 146 2 339-351.
Venkatesh, R., Mahajan, V. 1993. A probabilistic approach to pricing a bundle of products or services. Journal or Marketing Research 30 4 494-508.
Venkatesh, R., Kamakura, W. 2003. Optimal bundling and pricing under a monopoly: contrasting complements and substitutes from independently valued products. Journal or Business 76 2 211-231.
Welch, D. 2003. Where web services meets the road. BusinessWeek. June 24, 2003.
Wooders, J. 1997. Equilibrium in a market with intermediation is Walrasian. Review of Economic Design 3 75-89.
Yavas, A. 1994. Middleman in bilateral search markets. Journal of Labor Economics 12 3 406-429.
Zegura, E. W., Calvert, K., Bhattacharjee, S. 1996. How to model an Internetwork. Proceedings of 16th IEEE INFOCOM 594- 602.
113
BIOGRAPHICAL SKETCH
Qian Tang is born in Shanghai, China, in 1975. She received her Bachelor of
Engineering in Management Information Systems in 1998 from Tongji University,
Shanghai. In August 2000 she came to the US for a doctoral program in the Department
of Decision and Information Sciences. She earned her Master of Science degree in 2003
and is expecting to receive the Ph.D. degree in August 2004.
Qian’s research interests are in the analytical modeling of economics of
information systems, and the impact of IT on firm strategies. Her teaching interests
include e-commerce, information systems, etc. She is a member of Association for
Information Systems (AIS), Decision Sciences Institute (DSI), and Institute for
Operations Research and Management Science (INFORMS).