economics of walnuts, including the new cost and...
TRANSCRIPT

Advances in Walnut Production Course Economics of Walnuts,
including the New Cost and Returns Information
Daniel A. Sumner University of California Agricultural Issues Center and
Agricultural and Resource Economics, UC, Davis November 16, 2015

Objectives and Outline 1. Review the industry level economic trends and forces.
– Production, price, exports etc. – Economics of Issues such as drought, trade deals with
Asia and general economic issues 2. Understand the current economic costs and returns at the
farm using the new Sacramento Valley cost study as the representative case – Background and assumptions, – Tables on practices and costs – Revenues and ranging analysis
3. Where is the California industry heading given issues and costs and demand-side forces

Walnut Bearing Acreage
150
175
200
225
250
275
30020
0020
0120
0220
0320
0420
0520
0620
0720
0820
0920
1020
1120
1220
1320
14
Tho
usan
d A
cres
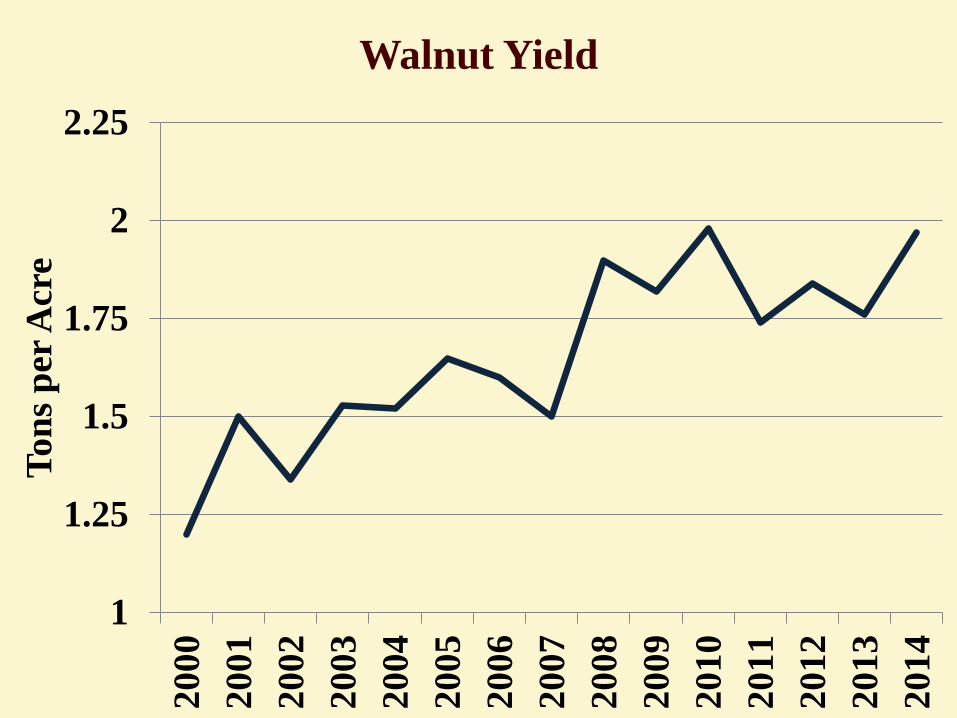
Walnut Yield
1
1.25
1.5
1.75
2
2.25
2000
2001
2002
2003
2004
2005
2006
2007
2008
2009
2010
2011
2012
2013
2014
Tons
per
Acr
e

California Walnut Production
400
500
600
700
800
900
1000
1100
1200
2000
2001
2002
2003
2004
2005
2006
2007
2008
2009
2010
2011
2012
2013
2014
Mill
ion
poun
ds

Farm Value of California Walnuts
0200400600800
1,0001,2001,4001,6001,8002,000
2000
2001
2002
2003
2004
2005
2006
2007
2008
2009
2010
2011
2012
2013
2014
Mill
ion
Dol
lars

California Walnut Farm Price
$0.40$0.60$0.80$1.00$1.20$1.40$1.60$1.80$2.00
2000
2001
2002
2003
2004
2005
2006
2007
2008
2009
2010
2011
2012
2013
2014
Farm
Pri
ce p
er P
ound

Monthly Value of California Walnut Exports
$0
$50
$100
$150
$200
$250
$300
$350Ja
n-10
Jun-
10N
ov-1
0A
pr-1
1Se
p-11
Feb-
12Ju
l-12
Dec
-12
May
-13
Oct
-13
Mar
-14
Aug
-14
Jan-
15Ju
n-15
Valu
e of
Exp
orts
($ m
illio
n)
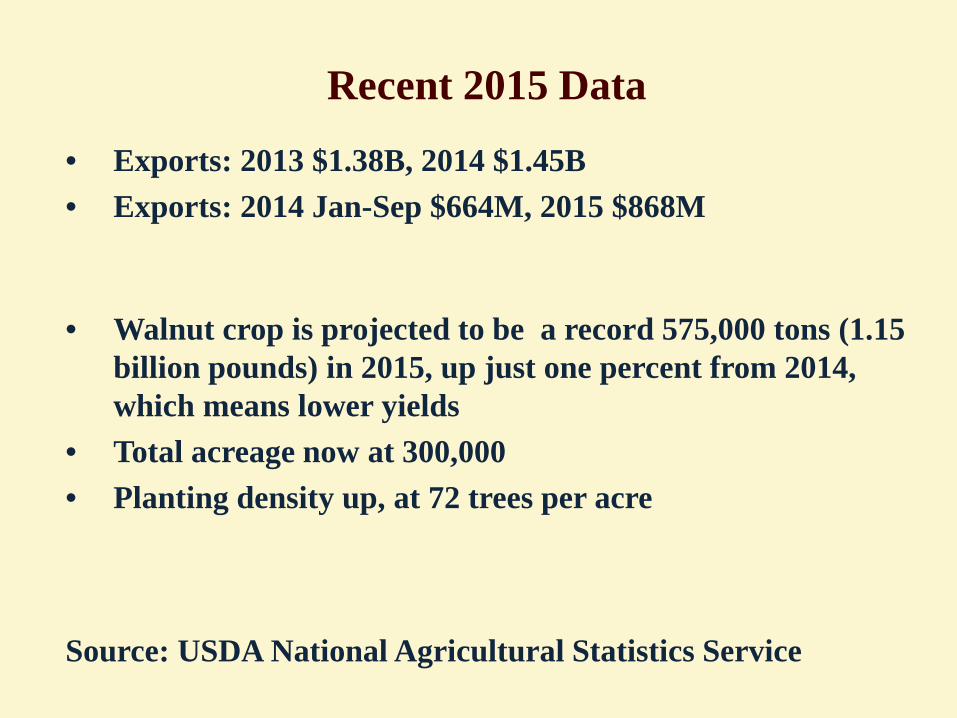
Recent 2015 Data
• Exports: 2013 $1.38B, 2014 $1.45B • Exports: 2014 Jan-Sep $664M, 2015 $868M
• Walnut crop is projected to be a record 575,000 tons (1.15 billion pounds) in 2015, up just one percent from 2014, which means lower yields
• Total acreage now at 300,000 • Planting density up, at 72 trees per acre Source: USDA National Agricultural Statistics Service

The Industry Economic Picture: Factors and Trends
1. Production and prices are both strong … Can that continue? Probably not at this pace, but that is not really news.
2. The 2015 strong dollar has to put downward pressure on exports, but not a big factor yet
3. Keep and eye on the new TPP trade deal, it may help grow exports to Asia in the next decades
4. Interest rates will be rising, but if I knew exactly when I would be a gazillionaire
5. US and other rich economy consumer incomes tend to grow slowly, but growth and demand in emerging markets will take a growing share of production

2015 Sample Costs to Establish and Produce
English Walnuts in the Sacramento Valley
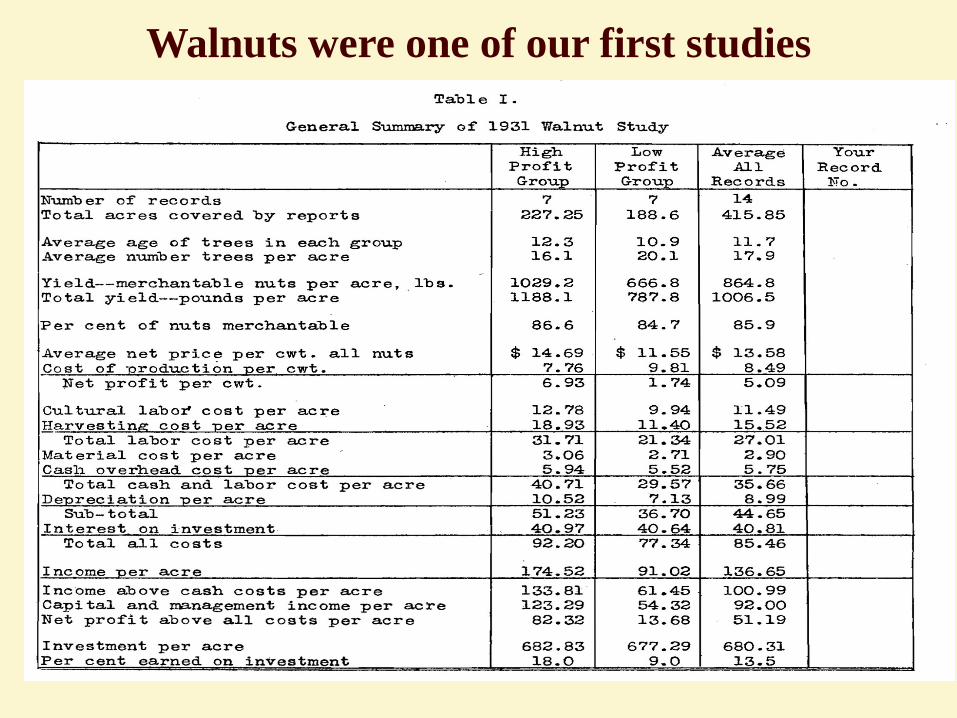
Walnuts were one of our first studies

Authors and collaborators for the 2015 Study • Janine K. Hasey, UC Cooperative Extension Farm Advisor • Richard P. Buchner, UC Cooperative Extension Farm Advisor • Karen Klonsky, UC Cooperative Extension Specialist, Department
of Agricultural and Resource Economics, UC Davis • Nina Anderson, Ag Issues Center, Department of Agriculture and
Resource Economics, UC Davis • ** Don Stewart, Staff Research Associate, Ag Issues Center,
Department of Agricultural and Resource Economics, UC Davis With help from Sac Valley growers (we do not usually name growers) Produced by the University of California, Agriculture and Natural Resources (Cooperative Extension and the Agricultural Issues Center) and UC Davis Department of Agricultural and Resource Economics
Just type in: Coststudies.ucdavis.edu Search for walnuts
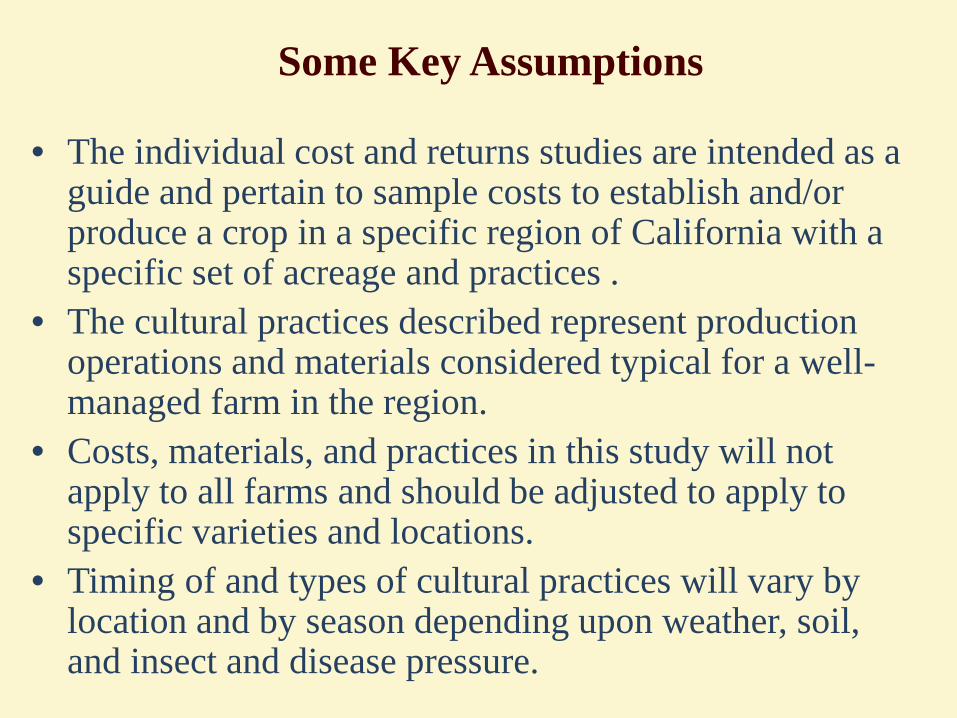
Some Key Assumptions
• The individual cost and returns studies are intended as a guide and pertain to sample costs to establish and/or produce a crop in a specific region of California with a specific set of acreage and practices .
• The cultural practices described represent production operations and materials considered typical for a well-managed farm in the region.
• Costs, materials, and practices in this study will not apply to all farms and should be adjusted to apply to specific varieties and locations.
• Timing of and types of cultural practices will vary by location and by season depending upon weather, soil, and insect and disease pressure.
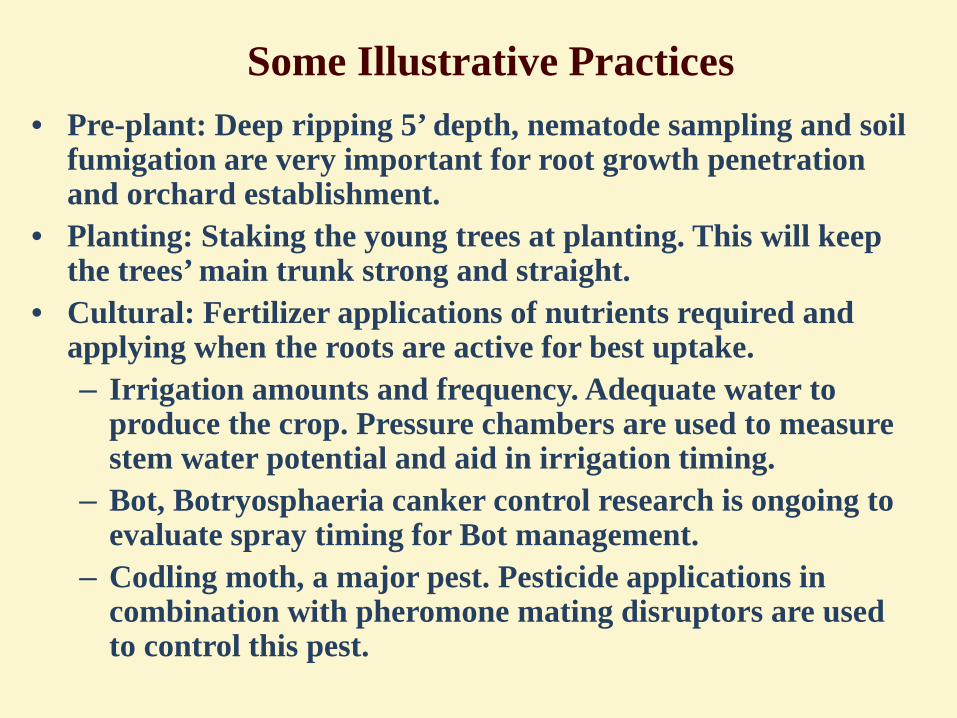
Some Illustrative Practices • Pre-plant: Deep ripping 5’ depth, nematode sampling and soil
fumigation are very important for root growth penetration and orchard establishment.
• Planting: Staking the young trees at planting. This will keep the trees’ main trunk strong and straight.
• Cultural: Fertilizer applications of nutrients required and applying when the roots are active for best uptake. – Irrigation amounts and frequency. Adequate water to
produce the crop. Pressure chambers are used to measure stem water potential and aid in irrigation timing.
– Bot, Botryosphaeria canker control research is ongoing to evaluate spray timing for Bot management.
– Codling moth, a major pest. Pesticide applications in combination with pheromone mating disruptors are used to control this pest.

Cost Definitions • Cash overhead consists of various cash expenses paid out during
the year that are assigned to the whole farm and not to a particular operation. Examples are; interest on operating capital, liability and property insurance, and equipment repairs.
• Non-cash overhead is calculated as the capital recovery cost for equipment and other farm investments. Examples are; land, irrigation systems, equipment and orchard establishment costs.
• Operating costs include the outlays for materials and services needed to produce the crop. Examples are; fertilizer, pesticides, irrigation, labor, custom operations, crop processing and storage.
• Cash costs include all the individual operating costs. Examples are; cultural and harvesting operations, assessment and environmental fees.
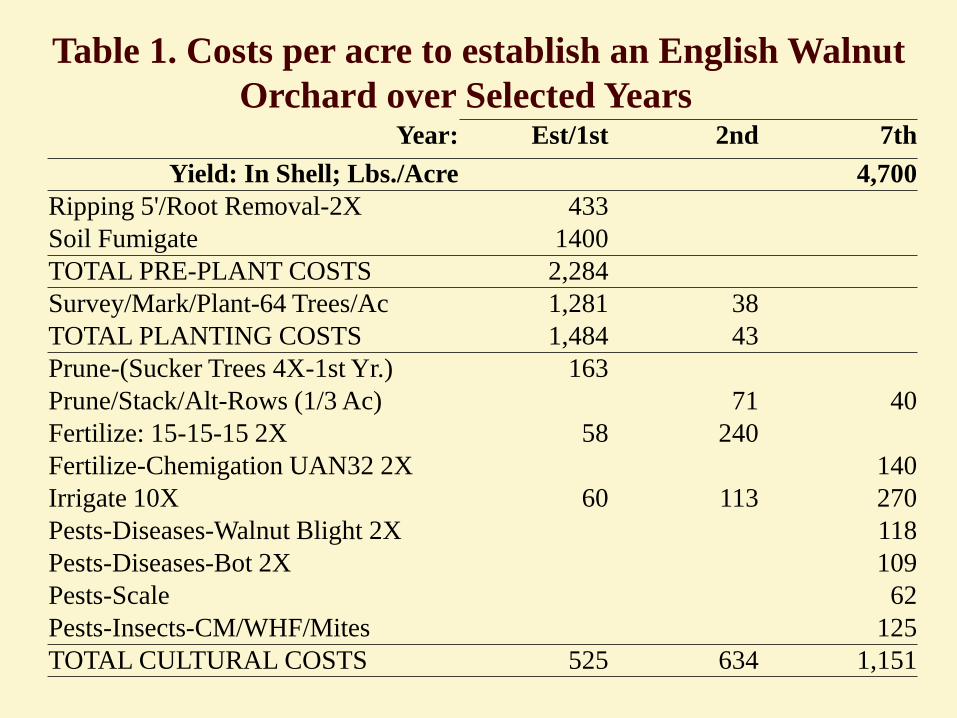
Table 1. Costs per acre to establish an English Walnut Orchard over Selected Years
Year: Est/1st 2nd 7th Yield: In Shell; Lbs./Acre 4,700
Ripping 5'/Root Removal-2X 433 Soil Fumigate 1400 TOTAL PRE-PLANT COSTS 2,284 Survey/Mark/Plant-64 Trees/Ac 1,281 38 TOTAL PLANTING COSTS 1,484 43 Prune-(Sucker Trees 4X-1st Yr.) 163 Prune/Stack/Alt-Rows (1/3 Ac) 71 40 Fertilize: 15-15-15 2X 58 240 Fertilize-Chemigation UAN32 2X 140 Irrigate 10X 60 113 270 Pests-Diseases-Walnut Blight 2X 118 Pests-Diseases-Bot 2X 10⁹ Pests-Scale 62 Pests-Insects-CM/WHF/Mites 125 TOTAL CULTURAL COSTS 525 634 1,151

Table 1. Costs per acre to establish (continued) Year: Est/1st 2nd 7th
Yield: In Shell; Lbs./Acre 4,700 TOTAL HARVEST COSTS 909 Interest On Operating Capital @ 5.75% 229 18 17 TOTAL OPERATING COSTS/ACRE 4,521 634 2,077 TOTAL CASH OVERHEAD COSTS 487 487 526 TOTAL CASH COSTS/ACRE 5,008 1,120 2,602 INCOME/ACRE FROM PRODUCTION 5,875 NET PROFIT/ACRE ABOVE CASH COSTS 3,273 ACCUMULATED NET CASH COSTS/ACRE 5,008 6,128 4,982 TOTAL NON-CASH OVERHEAD COSTS 1,480 1,477 1,935 TOTAL COST/ACRE FOR THE YEAR 6,488 2,597 4,538 INCOME/ACRE FROM PRODUCTION 5,875 NET PROFIT/ACRE ABOVE TOTAL COST 1,337 TOTAL ACCUMULATED NET COST/ACRE 6,488 9,085 17,108

Table 2. Costs per acre to produce walnuts
Time (Hrs/A)
Labor Cost
Material Costs
Custom/Rent
Total Cost Operation
TOTAL CULTURAL COSTS 2.51 123 782 210 1,151
TOTAL HARVEST COSTS 0 0 277 783 1,059
TOTAL OPERATING COSTS 3 123 1,058 993 2,241
TOTAL CASH OVERHEAD COSTS 526
TOTAL CASH COSTS 2,767
NON-CASH OVERHEAD COSTS 1,935
TOTAL COSTS 4,703

Table 3. Costs and Returns Quantity/
Acre Unit Price or Cost/Unit
Value or Cost/Acre
GROSS RETURNS Production Years 5,500 Lb 1.25 6,875 TOTAL GROSS RETURNS 5,500 Lb 6,875 Pest control and Tree Aids 386 Custom: 993 Irrigation: 270 Fertilizer: 140 Assessment: 261 TOTAL OPERATING 2,241 NET ABOVE OPERATING 4,634 CASH OVERHEAD 526 TOTAL CASH COSTS 2,767 NET ABOVE CASH COSTS 4,108 NON-CASH OVERHEAD 1,935 TOTAL COST 4,703 NET ABOVE TOTAL COST 2,172

Table 5. Costs at Varying Yields
Yield (Lbs./Acre) 4,000 6,000 8,000 Operating Costs/Acre: Cultural 1,151 1,151 1,151 Harvest 706 1,059 1,412 OPERATING COSTS 1,887 2,241 2,596 CASH OVERHEAD 526 526 526 TOTAL CASH COSTS 2,412 2,767 3,122
NON-CASH OVERHEAD 1,935 1,935 1,935
TOTAL COSTS/ACRE 4348.00 4703.00 5057.00

Table 5. Net Returns above Costs Yield (Lbs./Ac)
PRICE ($/Lb) 4000 6000 8000 Net Return Per Acre Above Operating Costs For Walnuts
1.00 2,113 3,759 5,404 1.20 2,913 4,959 7,004 1.50 4,113 6,759 9,404 Net Return Per Acre Above Cash Costs For Walnuts 1.00 1,588 3,233 4,878 1.20 2,388 4,433 6,478 1.50 3,588 6,233 8,878 Net Return Per Acre Above Total Costs For Walnuts 1.00 -348 1,297 2,943 1.20 452 2,497 4,543 1.50 1,652 4,297 6,943

Implications and Final Remarks • The numbers look good • This is consistent with rapid expansion and recent profits • What does this mean for the future of the industry? • It means that, if this picture continues, the industry expands
until this picture cannot continue any longer! – Walnuts planted on marginally acceptable land – Walnuts planted where water availability and cost is
worrisome – Enough new production to put pressure on prices
Excess profit attracts new acreage (some of which is not the best suited to the commodity) This tends to erode the level of profits that attracted the entry This is an old story from many farm industries and one we all need to remember

Thank you. www.aic.ucdavis.edu