economics of tobacco control paper no. 13 hnp discussion … · 2016-07-12 · hnp discussion paper...
TRANSCRIPT

H N P D I S C U S S I O N P A P E R
Economics of Tobacco Contro l Paper No. 13
About this series...
This series is produced by the Health, Nutrition, and Population Family (HNP) of the WorldBank’s Human Development Network. The papers in this series aim to provide a vehicle forpublishing preliminary and unpolished results on HNP topics to encourage discussion anddebate. The findings, interpretations, and conclusions expressed in this paper are entirelythose of the author(s) and should not be attributed in any manner to the World Bank, to itsaffiliated organizations or to members of its Board of Executive Directors or the countriesthey represent. Citation and the use of material presented in this series should take intoaccount this provisional character. For free copies of papers in this series please contact theindividual authors whose name appears on the paper.
Enquiries about the series and submissions should be made directly to the Editor inChief Alexander S. Preker ([email protected]) or HNP Advisory Service([email protected], tel 202 473-2256, fax 202 522-3234). For more information,see also www.worldbank.org/hnppublications.
The Economics of Tobacco Control sub-series is produced jointly with the Tobacco FreeInitiative of the World Health Organization. The findings, interpretations and conclusionsexpressed in this paper are entirely those of the authors and should not be attributed in anymanner to the World Health Organization or to the World Bank, their affiliated organizationsor members of their Executive Boards or the countries they represent.
The editors for the Economics of Tobacco Control papers are: Joy de Beyer([email protected]), Emmanuel Guindon ([email protected]) and Ayda Yurekli([email protected]).
THE WORLD BANK
1818 H Street, NWWashington, DC USA 20433Telephone: 202 477 1234Facsimile: 202 477 6391Internet: www.worldbank.orgE-mail: [email protected]
Tobacco Free InitiativeWorld Health Organization
WORLD HEALTH ORGANIZATIONRegional Office for South-East Asia
World Health House, Indraprastha EstateMahatma Gandhi Marg
New Delhi 110002, IndiaTelephone: 233 70804; 233 0809-11
Facsimile: 23370197, 2337 9395E-mail:[email protected]
A Study on the Economics of Tobacco in Nepal
Yagya B. Karki, Kiran Dev Pant and Badri Raj Pande
October 2003
Pub
lic D
iscl
osur
e A
utho
rized
Pub
lic D
iscl
osur
e A
utho
rized
Pub
lic D
iscl
osur
e A
utho
rized
Pub
lic D
iscl
osur
e A
utho
rized
Pub
lic D
iscl
osur
e A
utho
rized
Pub
lic D
iscl
osur
e A
utho
rized
Pub
lic D
iscl
osur
e A
utho
rized
Pub
lic D
iscl
osur
e A
utho
rized


A STUDY ON THE ECONOMICS OF TOBACCO IN NEPAL
YAGYA B. KARKI, KIRAN DEV PANT AND BADRI RAJ PANDE
October 2003

ii
Health, Nutrition and Population (HNP) Discussion Paper This series is produced by the Health, Nutrition, and Population Family (HNP) of the World Bank’s Human Development Network (HNP Discussion Paper). The papers in this series aim to provide a vehicle for publishing preliminary and unpolished results on HNP topics to encourage discussion and debate. The findings, interpretations and conclusions expressed in this paper are entirely those of the authors and should not be attributed in any manner to the World Bank, to its affiliated organizations or to members of its board of executive directors or the countries they represent. Citation and the use of material presented in this series should take into account this provisional character. For free copies of papers in this series please contact the individual authors whose names appear on the paper. Enquiries about the series and submissions should be made directly to the editor- in-chief. Submissions should have been previously reviewed and cleared by the sponsoring department that will bear the cost of publication. No additional reviews will be undertaken after submission. The sponsoring department and authors bear full responsibility for the quality of the technical contents and presentation of material in the series. Since the material will be published as presented, authors should submit an electronic copy in a predefined format (available at www.worldbank.org/hnppublications on the guide for authors page) as well as three camera-ready hard copies (copied front to back exactly as the authors would like the final publication to appear). Rough drafts that do not meet minimum presentational standards may be returned to authors for more work before being accepted. The editor-in-chief of the series is Alexander S. Preker ([email protected]); For information regarding this and other World Bank publications, please contact the HNP Advisory Services ([email protected]) at +1 202 473 2256 (telephone) or +1 202 522 3234 (fax). __________________________________________________________________________ The Economics of Tobacco Control sub-series is produced jointly with the Tobacco Free Initiative of the World Health Organization. The findings, interpretations, and conclusions expressed in this paper are entirely those of the authors and should not be attributed in any manner to the World Health Organization or to the World Bank, their affiliated organizations or to members of their executive boards or the countries they represent. The editors of the Economics of Tobacco Control papers are Joy de Beyer ([email protected]), Emmanuel Guindon ([email protected]) and Ayda Yürekli ([email protected]). For free copies of papers in this series please contact the individual authors whose names appear on the paper or one of the editors. Papers are posted on the publications pages of these websites: www.worldbank.org/hnp and www.worldbank.org/tobacco ISBN 1-932126-56-2 © 2003 The International Bank for Reconstruction and Development/The World Bank 1818 H Street, NW Washington DC 20433 All rights reserved.

iii
Health, Nutrition and Population (HNP) Discussion Paper
ECONOMICS OF TOBACCO CONTROL PAPER NO. 13
A Study on the Economics of Tobacco in Nepal
Yagya B. Karkia, Kiran Dev Pantb and Badri Raj Pandec
aPrincipal Investigator, Nepal Health Economics Association, Kathmandu, Nepal bResearch Officer, Nepal Health Economics Association, Kathmandu, Nepal cResearch coordinator, President, Nepal Health Economics Association, Kathmandu, Nepal
Paper prepared for the World Health Organization’s Regional Office for South-East Asia. Presented at a meeting on the Economics of Tobacco Control in the South-East Asia Region, in Jakarta, Indonesia,
December 3-4, 2003. Abstract: This study is based both on secondary and primary data. The primary data were collected using a smoking behaviour survey and a purposive sample survey among tobacco-cultivating farmers. The overall smoking prevalence in Nepal for the population aged 15 or more is estimated at 37.4%, and is higher (47.4%) among males than among females (27.6%). Poor people are more likely to consume tobacco than their better-off counterparts, resulting in increased health hazards and the diversion of scarce income. The tobacco industry is a lucrative business for the private sector and government; the private sector makes large profits, and the tax revenue is substantial. Economic analysis estimated the price elasticity of demand for cigarettes and bidi at –0.882. It is found also that the poor and the young are the groups most sensitive to price changes. Therefore, considering health and economic benefits and poverty alleviation goals, a policy of real price increase through taxation of all types of tobacco product would be a desirable public policy for the government of Nepal to consider. Keywords: Nepal, tobacco, tobacco revenue, cigarette, bidi, poor, tobacco tax, price, price elasticity, policy. Disclaimer: The findings, interpretations and conclusions expressed in the paper are entirely those of the authors, and do not represent the views of the World Bank or the World Health Organization, their executive directors or the countries they represent. Correspondence details: Yagya B. Karki, Nepal Health Economics Association, Kathmandu, Nepal. GPO Box 3108, Kathmandu, Nepal, telephone +977 1 552 4290; e-mail: [email protected] ; fax +977 1 437 3054.

iv

v
ABBREVIATIONS AND ACRONYMS CBS Central Bureau of Statistics COPD Chronic obstructive pulmonary disease CPI Consumer price index DALY Disability-adjusted life year FY Fiscal year GDP Gross domestic product GNP Gross national product HIV/AIDS Human immunodeficiency virus/acquired immune deficiency syndrome IHD Ischaemic heart disease IMR Infant mortality rate INGO International nongovernmental organization MOF Ministry of Finance MOH Ministry of Health MOPE Ministry of Population and Environment NPC National Planning Commission NGO Nongovernmental organization NHEICC National Health Education, Information and Communication Centre NLSS Nepal Living Standard Survey NRB Nepal Rastra Bank (Central Bank of Nepal) PAR Population-attributable risk RR Relative risk STP Smokeless tobacco product VDC Village development committee WB World Bank WHO World Health Organization WHO/SEARO World Health Organization Regional Office for South-East Asia

vi

vii
TABLE OF CONTENTS ABBREVIATIONS AND ACRONYMS...................................................................................V NOTE FROM REGIONAL DIRECTOR, OFFICE FOR SOUTH-EAST ASIA, WORLD
HEALTH ORGANIZATION ..........................................................................................XI FOREWORD .........................................................................................................................XIII ACKNOWLEDGEMENTS .................................................................................................... XV SUMMARY ..........................................................................................................................XVII 1. GENERAL SITUATION OF THE COUNTRY .....................................................................1
1.1. Country background ...................................................................................................1 1.2. Demographic characteristics ......................................................................................1 1.3. Health system .............................................................................................................3 1.4. Literacy.......................................................................................................................4 1.5. Economic indicators ...................................................................................................5
2. THE TOBACCO INDUSTRY IN NEPAL ...........................................................................10 2.1. Tobacco industry statistics ........................................................................................10 2.2. Production, trade and consumption of manufactured tobacco .................................12 2.3. Tobacco agriculture statistics....................................................................................15 2.4. Tobacco household economics: the tobacco cultivation survey...............................17 2.5. Tobacco advertising and promotion by tobacco companies .....................................23
3. PREVALENCE AND CONSUMPTION..............................................................................24 3.1. Prevalence of tobacco use ........................................................................................24 3.2. Consumption of tobacco products............................................................................30
4. PRICES, TAXES, AND THE DEMAND FOR TOBACCO PRODUCTS ..........................33 4.1. Prices, taxes and government revenues ....................................................................33 4.2. Smuggling of tobacco products................................................................................38 4.3. The demand for tobacco products in Nepal..............................................................38 4.4. Simulation analysis: tobacco taxes as a revenue-generating tool.............................47
5. HEALTH AND TOBACCO CONTROL..............................................................................48 5.1. Health consequences of tobacco use ........................................................................48 5.2. Tobacco control measures ........................................................................................50
6. POLICY RECOMMENDATIONS.......................................................................................51 APPENDICES ..........................................................................................................................57
Appendix 1. Health service infrastructure by year .........................................................58 Appendix 2. Cigarette production 1984–85 to 1998–99 ................................................59 Appendix 3. Sampling design for Nepal smoking behaviour survey, 2000 ...................60 Appendix 4. Nepal smoking behaviour survey questionnaire, 2000 ..............................63 Appendix 5. Nepal tobacco cultivation survey questionnaire, 2000 ..............................71 Appendix 6. Household expenditure ...............................................................................76 Appendix 7. Hausman test..............................................................................................77 Appendix 8. Proportion of smokers................................................................................78 Appendix 9. Relative risks for major diseases in China.................................................79
REFERENCES .........................................................................................................................81

viii
TABLES Table 1.1. Population size and growth rates, Nepal, 1911–2001........................................................................................2 Table 1.2. Percentage distribution of population by age, sex and residence, 2001.........................................................2 Table 1.3. Trend of infant mortality rate and life expectancy in the past 50 years..........................................................3 Table 1.4. Causes of death in Nepal........................................................................................................................................4 Table 1.5. Literacy (aged 10+), Nepal, 1952–54 to 1996....................................................................................................5 Table 1.6. GDP and population growth rates, Nepal, 1964–65 to 1998–99 .....................................................................6 Table 1.7. National urban consumer price index. Base year 1983–84 = 100...................................................................7 Table 1.8. Percentage distribution of the employed population (aged 10+) by major employment sector for rural
and urban areas, Nepal, 1991.........................................................................................................................................8 Table 1.9. Percentage distribution of the employed population (aged 10+) by major employment sector and sex,
Nepal, 1971–91 ................................................................................................................................................................8 Table 1.10. Labour force by sector, Nepal, 1998/99.............................................................................................................9 Table 1.11. Occupational classification of the economically active population 10 years and over, Nepal, 1984/85
and 1995/96.......................................................................................................................................................................9 Table 2.1. Industrial (manufacturing) establishments in Nepal, 1996/97 .......................................................................10 Table 2.2. Employment in the tobacco-producing and retail sector, 2000, Nepal.........................................................11 Table 2.3. Tobacco employees by skill category.................................................................................................................11 Table 2.4. Selected industrial statistics, manufactured tobacco, Nepal, 1986–1996.....................................................12 Table 2.5. Production of cigarettes and bidi, 1986/87 to 1999/2000 (million sticks)...................................................12 Table 2.6. Tobacco imports and exports, 1984/85 to 1998/99, real 1995/96 Rs and US$ ...........................................13 Table 2.7. Tobacco exports and total exports, 1984/85 to 1998/99 (1995/96 million Rs) ...........................................14 Table 2.8. Tobacco imports and total imports, Nepal, 1984/85 to 1998/99 (1995/96 million Rs) ............................14 Table 2.9. Supply and sales of cigarettes and bidi, 1984/85 to 1998/99, Nepal ............................................................15 Table 2.10. Crop area (000 hectares) by crop type, Nepal, 1981/82 and 1991/92 ........................................................16 Table 2.11. Tobacco production and yield, Nepal, 1984/85 to 1999/2001 .....................................................................16 Table 2.12. Household income sources by ecological region and residence, Nepal, 2000 (Rs).................................18 Table 2.13. Nominal household and per capita income by geographical group (annual income in 2000 rupees)...18 Table 2.14. Nominal per capita income by quintile (rupees)............................................................................................19 Table 2.15. Distribution of the population by nominal per capita income by quintile and geographical group, Nepal,
2000..................................................................................................................................................................................19 Table 2.16. Household income sources by quintile income group, Nepal, 2000 (Rs)..................................................19 Table 2.17. Tobacco farmers’ household income sources for four districts, Nepal, 2000 (Rs)...................................20 Table 2.18. Nominal annual per capita income of tobacco farmers, quintiles (2000 rupees).....................................20 Table 2.19. Household income sources, tobacco farmers by quintile, Nepal, 2000 (Rs).............................................21 Table 2.20. Household expenditure of tobacco farmers in four districts, Nepal, 2000 ................................................22 Table 2.21. Household expenditures of tobacco farmers by income quintile, Nepal, 2000 ........................................22 Table 3.1. Unstandardized and standardized smoking prevalence rates by age, sex and residence, Nepal, 1980s and
2000..................................................................................................................................................................................25 Table 3.2. Prevalence of daily smoking among youths aged 8–19 in a rural hill area in 1983–84 and among youths
aged 10–19 in rural hills and Tarai in 2000, Nepal..................................................................................................26 Table 3.3. Unstandardized and standardized smoking prevalence rates by age, sex and region, Nepal, 1980s and
2000..................................................................................................................................................................................27 Table 3.4. Smoking prevalence of population aged 10 years and over, by gender, region and literacy, 2000 .........27 Table 3.5. Number of cigarettes/bidi smoked during most recent pregnancy by literacy, Nepal, 1997 ....................28 Table 3.6. Smoking prevalence (%),males and females 10 years and older by 5-year age group, Nepal, 2000 ......29 Table 3.7. Mean age at first smoking by region and sex, Nepal, 2000............................................................................30 Table 3.8. Consumption of tobacco products and money spent on them by region and sex, Nepal, 2000...............31 Table 3.9. Cigarette and bidi smoking rates (%) for population 15 years of age and over and estimates of per capita
consumption of cigarettes and bidi, Nepal, 2000 .....................................................................................................31 Table 4.1. Nominal cigarette prices, Nepal, 1991–2000 (Rs per pack of 20) ................................................................34 Table 4.2. Specific excise per 1000 sticks in Nepal, 1997/98 to 2002/03 (Rs)..............................................................35

ix
Table 4.3. Tax incidence of selected tobacco products, Nepal, selected years ..............................................................36 Table 4.4. Revenue from tobacco products, Nepal, 1984/85 to 1998/99 (real 1995/96 million Rs).........................37 Table 4.5. Total government revenue and total tobacco products revenue, Nepal, 1984/85 to 1998/99 (1995/96
million Rs).......................................................................................................................................................................37 Table 4.6. Household expenditure groups by region and residence, Nepal, 2000 (Rs)................................................40 Table 4.7. Household expenditure by income group, all households, Nepal, 2000 ......................................................41 Table 4.8. Tobacco-using households’ expenditure on tobacco products*.....................................................................41 Table 4.9. Price elasticity for the overall population and by age groups ........................................................................44 Table 4.10. Price elasticity by income quintile ....................................................................................................................45 Table 4.11. Price elasticity by geographical location .........................................................................................................45 Table 4.12. Income elasticity for the overall population and by age group....................................................................46 Table 4.13. Income elasticity by income quintile ...............................................................................................................46 Table 4.14. Income elasticity by geographical location .............................................................................................47 Table 4.15. Potential revenue from tobacco taxes ..............................................................................................................48 Table 7.1. Sample selection ....................................................................................................................................................62 Table 7.2. Hausman test...........................................................................................................................................................77 Table 7.3. Proportion of smokers ...........................................................................................................................................78 Table 7.4. Relative risks for major diseases in China (men aged 35 and above) ..........................................................79 Table 7.1. Relative risks for major diseases in China (women aged 35 and above).....................................................79 FIGURES ) LJ XUH�6P RNLQJ � SUHYDOHQFH�DP RQJ � SRSXODWLRQ�E\ � UHJ LRQ�DQG�VH[�1 HSDO ............................................25 ) LJ XUH�6P RNLQJ � SUHYDOHQFH�HGXFDWLRQ�DP RQJ � DGXOWV�RI�DQG�ROGHU�1 HSDO ..............................................28 ) LJ XUH�6P RNLQJ � SUHYDOHQFH�IRU�P DOHV�DQG�IHP DOHV�E\ -year age groups, Nepal, 2000......................................29 ) LJ XUH�&LJ DUHWWH�UHDO�SULFHV�DQG�FRVWOLQHVV�1 HSDO –73 to 2000–01 ...............................................................33 ) LJ XUH�5HDO�FLJ DUHWWH�SULFHV�5V�DQG�SHU�FDSLWD�FLJ DUHWWH�FRQVXP SWLRQ .......................................................39

x

xi
NOTE FROM REGIONAL DIRECTOR, OFFICE FOR SOUTH-EAST ASIA, WORLD HEALTH ORGANIZATION
The trend in tobacco consumption in many developing countries is worrying. This is not only because of the millions of deaths and related suffering that it involves, but also due to its negative impact on economic development. Experiences from many countries have shown that cost effective tobacco control measures can be taken that could bring net economic gains for the country. Proven, cost-effective measures include: public education and information; a ban on tobacco advertising; tobacco smuggling deterrence and increased tobacco taxes. All these measures can be incorporated in national anti- tobacco legislation. Studies and research from countries around the world have revealed that an increase in tax on tobacco products is perhaps the most effective tool for tobacco control, and is especially effective in reducing tobacco use among young people and people with low incomes. Higher tobacco taxes can help a country in a number of ways – by generating additional revenue, reducing tobacco use leading to less tobacco-related morbidity and mortality and reduced expenditure on treatment of tobacco-related diseases. Effective collaboration between health and finance ministries is essential to address appropriately the economic and fiscal aspects of tobacco control. Such collaboration could ensure improved health for millions of people by protecting them and their families from the harmful effects of tobacco use. I am confident that the findings of the study initiated by World Health Organization and World Bank will encourage the policy makers, in particular, in the health and finance ministries, to take appropriate and coordinated action for tobacco control. 10 October, 2003
Dr Uton Muchtar Rafei Regional Director
World Health Organization Office for South East Asia

xii

xiii
FOREWORD In 1999, the World Bank published Curbing the epidemic: governments and the economics of tobacco control, which summarizes the trends in global tobacco use and the resulting immense and growing burden of disease and premature death. By 1999, there were already 4 million deaths from tobacco each year. This number is projected to grow to 10 million per year by 2030, given present trends in tobacco consumption. Already about half of these deaths are in high- income countries, but recent and continued increases in tobacco use in the developing world is causing the tobacco-related burden to shift increasingly to low- and middle- income countries. By 2030, seven of every ten tobacco-attributable deaths will be in developing countries. Curbing the epidemic also summarizes the evidence on the policies and interventions that have proved to be effective and cost-effective in reducing tobacco use in countries around the world. Raising taxes to increase the price of tobacco products is the most effective way to reduce tobacco use, and the single most cost-effective intervention. It is also the most effective way to persuade young people to quit or not take up smoking. This is because young people, like others with low incomes, tend to be highly sensitive to price increases. Why are these proven cost-effective tobacco control measures not adopted or implemented more strongly by governments? Many governments hesitate to act decisively to reduce tobacco use because they fear that tax increases and other tobacco control measures might harm the economy by reducing the economic benefits their country gains from growing, processing, manufacturing, exporting and taxing tobacco. The argument that tobacco contributes revenues, jobs and incomes is a formidable barrier to tobacco control in many countries. Are these fears supported by the facts? In reality, these fears turn out to be largely unfounded when the data and evidence on the economics of tobacco and tobacco control are examined. A team of about 30 internationally recognized experts in economics, epidemiology and other relevant disciplines who contributed to the analysis presented in Curbing the epidemic reviewed a large body of evidence. The team concluded that in most countries tobacco control would not lead to a net loss of jobs and could, in many circumstances, actually generate new jobs. Tax increases would increase (not decrease) total tax revenues, even if cigarette smuggling increased to some extent. Furthermore, the evidence shows that cigarette smuggling is caused at least as much by general corruption as by high tobacco product tax and price differentials. The team recommended that governments not forego the benefits of tobacco tax increases because they feared the possible effect on smuggling. Rather, they should act to deter, detect and punish smuggling. Much of the evidence presented and summarized in Curbing the epidemic was from high-income countries. However, the main battleground against tobacco use is now in low- and middle- income countries. If needless disease and millions of premature deaths are to be prevented, then it is crucial that developing counties raise tobacco taxes, introduce comprehensive bans on advertising and promotion of tobacco products, ban smoking in public

xiv
places, inform their citizens about the harm that tobacco causes and the benefits of quitting, and provide advice and support to help people quit. In talking to policy-makers in developing countries, it became clear there was a great need for country-specific analytic work to provide a basis for policy making within a sound economic framework. The World Bank and WHO’s Tobacco Free Initiative (as well as several other organizations, acting in partnership or independently) began to commission and support analysis of the economics of tobacco and tobacco control in many countries around the world. The report presented in this paper makes a valuable contribution to our understanding of the issues and likely economic impact of tobacco control. Our hope is that the information, analysis and recommendations contained herein will prove helpful to policy-makers and result in stronger policies to reduce the unnecessary harm caused by tobacco use. Joy de Beyer Tobacco Control Coordinator Health, Nutrition and Population World Bank

xv
ACKNOWLEDGEMENTS The authors would like to express their indebtedness to the World Health Organization’s Regional Office for South-East Asia and to the government in Nepal for facilitating this study. Thanks are due to Jin Shuigao, WHO consultant, for providing assistance in the early stage of the study. The authors would like to thank the officials of the Nepalese Department of Health Services, particularly LR Ban, Director of the National Health Education, Information and Communication Centre, and his officials, the Departments of Industries and Commerce and other government institutions, and Nepal Rastra Bank for their assistance. We would also like to record our appreciation for the input provided by MR Pandey and Gaja Nand Agrawal, Department of Economics, Tribhuvan University, Kathmandu. The authors are grateful to Anne-Marie Perucic and Emmanuel Guindon of the World Health Organization, Geneva, for their assistance and advice in econometric analyses. The authors are also grateful to the World Bank publishing the report as an HNP discussion paper.

xvi

xvii
SUMMARY Demographic and health situation Nepal’s population of 23.1 million (2001) is growing at an annual rate of 2.27%, given high fertility and fast-declining mortality. About 40% of the population is aged between 0 and 14. Life expectancy in 2000 was 60 years. Almost 90% of the population lives in rural areas. Literacy rates in 2001 were 67% for men and 41% for women. The main causes of death were infectious, maternal and perinatal, at just under 50%; non-communicable and congenital conditions accounted for about 40% of deaths. Tobacco production and trade In 1996/97 there were four cigarette manufacturers in Nepal—three private, one public—plus an agent for foreign cigarettes. There was also a handful of small and poorly organized manufacturers of other tobacco products, mainly bidi (sticks made from inferior tobacco wrapped loosely in leaf); their numbers are declining. Cigarette production is increasing. Tobacco and tobacco product imports are increasing, although they represent only 1% of Nepal’s total import value. Most imported tobacco comes from India. Nepal’s tobacco farming and exports are negligible. Smuggling of tobacco products, especially smokeless products, into Nepal is believed to be common. The country has long porous borders, and such border controls as exist are beset by local corruption. The introduction of a value-added tax in 1997 is thought to have exacerbated matters, but there are no data to verify this. Smoking behaviour and tobacco consumption survey A purposive survey of 1,438 households (nearly 6,000 people) carried out for this study in November-December 2000 collected information on household incomes, smoking behaviours and tobacco cultivation. The survey found that annual per capita income was US$ 175, 25% lower than the official per capita GDP of $230 (World Bank, 2003). Urban households earned more than rural households. Farm-related earnings accounted for 40% of income, and non-farm income comprised 47%. Income from tobacco-related activities was negligible-- less than 1% of all income. The wealthiest 20% of households accrued 56% of total income, a shift in distribution towards the wealthy since 1996. Income distribution appears to be more equitable in the mountain region. The survey found a smoking prevalence of 48% among men aged 15 and older, and 29% among adult women, much lower among men than found in previous surveys. Prevalence is considerably higher in rural areas, and among men. Other studies note that smoking rates are among the highest in the world. Smoking prevalence tends to increase with age; indeed, the survey found a decline in smoking prevalence among the young in recent years. Smoking is inversely related to education level and literacy.

xviii
Annual average consumption among those 10 and over was just over 2000 sticks. Except in the mountain region, females are slightly heavier smokers than males. Smokers spent about US$ 30 a year on cigarettes and bidi – a remarkably high 17% of income. Men tended to spend more on cigarettes and to buy more expensive brands than women. Traditional forms of tobacco consumption seem to be decreasing as cheap cigarettes become more widely and cheaply available; cigarette smoking has a certain social cachet. Prices, taxes and demand Cigarette real prices have fallen by about one-third since 1970. With rising incomes, this has made cigarettes about 60% more affordable in 2000 than at the beginning of the 1970s. Price trends were not available for other tobacco products, but bidi and smokeless (chewed) tobacco products tend to be more affordable than cigarettes. Three types of tax on manufactured cigarettes are levied in Nepal: an excise tax, a health (smoking) tax and a 10% value-added tax. The most important is the excise tax, levied according to the type and length of the cigarette. In 2002/03, the total tax incidence ranged from 25% on highly priced international brands to just over 50% on popular domestic brands. This is quite low in comparison to international tobacco tax incidence levels, which often reach 75% to 85% and well below the World Bank recommendation that the tax component of the price of a pack of cigarettes be between two-thirds and four-fifths of the total retail cost. Moreover, since the taxes are specific—that is, fixed amounts per 1,000 cigarettes, inflation continually erodes their value. The small health tax, used for cancer control, has not changed since 1994–95, although the real value of the currency has fallen by more than 90%. Tobacco tax revenue has stayed fairly stable since 1985 at about US$ 50 million (in real terms). As the tax base has grown and diversified, tobacco tax revenue has fallen as a percentage of total tax revenue and total government revenue, although it still accounts for about 11% and 9% respectively. About two-thirds of household expenditure went on food, energy and clothing, with education and health accounting for about 20%. Expenditure on tobacco products was 3.5% of total expenditure for all households, and 7% among tobacco-using households. As might be expected, poorer and rural households spent a greater proportion of their (lower) incomes on tobacco products. Price and income elasticities were estimated for the population as a whole and for age and income groups. The total price elasticity for the whole population was found to be –0.88 and significant, which means that a price increase of 10% would result in an 8.8% fall in consumption. Separate estimates of the elasticity of smoking participation and the conditional elasticity of demand show that decisions to smoke or not, and changes in the amount smoked, are about equally affected by changes in the price of tobacco. The empirical analysis found that younger people would be more sensitive to price changes than older people, possibly because they have less disposable income and/or are less likely to be addicted. As expected, poorer households were found more sensitive to price changes than wealthier ones. Urban smokers are more sensitive to price change than rural ones, reflecting higher urban cigarette prices.
xix
Income elasticity was found to be usually positive but small, implying that each 10% increase in income would lead to a 1.8% increase in tobacco consumption. In addition to the health benefits they create by reducing tobacco use, tax increases also generate additional government revenue. This is contrary to the misconception that lower consumption necessarily means lower tax revenue. In order to show the revenue-generating potential of tobacco taxes in Nepal, the paper simulated the effect of a 5% annual increase in real prices compared to a baseline scenario of constant real prices. The household analysis price and income elasticity estimates of –0.88 and 0.18 were used. It was assumed that the entire 5% real price increase would be driven by higher tax rates and that real GDP per capita in the region would grow at an annual rate of 4%. (This is a fairly conservative estimate in light of the latest detailed projections published by the International Monetary Fund.) Government revenues from tobacco taxes were simulated to 2010 from a 1998 baseline. All other factors that might influence the consumption of tobacco products were assumed to remain the same. The simulation showed that Nepal could generate an additional Rs 22,808 million (US$ 368 million) between 2000 and 2010 by steady 5% annual real increases in tobacco prices, using higher tax rates to raise prices. Health and tobacco control People in Nepal, particularly in rural areas, are largely unaware of the health risks of tobacco. Consumption of tobacco is a social habit; for some it is also a status symbol. Recent data on smoking-related diseases in Nepal are scant. There were 60,000 cancer patients reported in Nepal in 1997. A 1988 study showed a high prevalence of chronic bronchitis (33.9% among men and 28.3% among women) and chronic obstructive lung disease. Prevalence of tobacco use combined with the use of unventilated indoor fires for cooking and heating produce high rates of lung disease in Nepal. Costs due to tobacco consumption include costs for treatment of tobacco-attributable illness and opportunity costs of income foregone through disability and premature death. The lack of data made it impossible to determine morbidity and mortality rates and costs incurred due to tobacco consumption, but they are likely to be high. The Ministry of Health is actively engaged in controlling tobacco use in Nepal. The Ministry’s National Health Education, Information and Communication Centre is primarily responsible for carrying out health education and communication programs against smoking. Anti-smoking communication campaigns use many media—radio, print, hoarding boards, television and video and workshops across the country. In 1993/94, the Ministry introduced a levy on each cigarette to be allocated for health care, although its real valued has been hugely eroded by inflation. All tobacco products must carry health warnings, and advertising of tobacco in public places or through electronic media is banned. However, other media channels are extensively used, the national daily newspapers and magazines are full of cigarette advertisements, and the warning on cigarette packages is too small. A bill before parliament calls for a complete ban on tobacco use in public places and on the sale of tobacco to minors. It also proposes tighter regulation of advertising. The bill is expected to become law, despite resistance from the tobacco industry.

xx
Policy recommendations The high prevalence of tobacco use in Nepal needs to be reduced to avert a growing burden of disease. The government’s attempts at using mass communication to modify behaviour have been hampered by Nepal’s linguistic diversity, and tobacco use is just one of the many health challenges competing for priority. The paper suggests that each 10% increase in price would decrease consumption of cigarettes and bidi by nearly 9%. Tax increases would increase government revenues. The poor are highly sensitive to price change, falls in tobacco use enable them to use money now spent on tobacco for other uses. The paper recommends that taxes on non-cigarette tobacco products, which are disproportionately less taxed, be increased, and tax increases be used to increase prices of all tobacco products each year by at least 5% above the rate of inflation. The paper further recommends that the health tax be increased to make up for the inflation of the past 10 years and be increased in line with inflation in future. As the degree of smuggling in a country is linked to a country’s overall corruption, the government should take steps to reduce corruption. Tighter import controls should be introduced at border posts. Despite the government’s anti-smoking measures, tobacco companies are investing heavily in tobacco promotion. The tobacco control bill before parliament should be enacted without delay. The goal should be a complete and comprehensive ban on all tobacco product advertising and promotion, direct and indirect. The paper notes the lack of available information on the tobacco industry and tobacco use and the difficulty in collecting it. A reliable system of data collection and record-keeping is needed for cigarettes and other tobacco products. This would improve revenue collection and deter corruption. Primary and secondary data on the health risks and medical costs of tobacco use are not available. A detailed study would be needed to address these gaps. Information would be needed on cigarette smoking and other tobacco products, and related causes of death and morbidity broken down by region, residence, sex and age, treatment costs, both direct and indirect, for major tobacco-attributable illnesses. Tobacco control measures should be integrated into other public health initiatives in Nepal, and their priority increased. As literacy and smoking prevalence are inversely correlated, a drive to increase literacy rates might also help to decrease smoking. Tobacco production and use and tobacco-related health issues touch many different spheres of government, including health, finance, industry and labour, and nongovernmental organizations. A Tobacco Free Initiative unit or task force should be set up to coordinate tobacco-control activities. Tobacco tax revenues, in spite of leakage and smuggling, contributes about 9% of all government revenues, the Ministry of Finance should have a strong interest in raising tax rates regularly, and introducing tighter controls. This will also help control smuggling.

1
1. GENERAL SITUATION OF THE COUNTRY
1.1. Country background Nepal is a landlocked country. India surrounds her on the east, south and west, and to the north is the Tibetan region of China. The total land area of the country is 147,181 km2. The country is divided into five development regions, which are further subdivided into 14 zones and 75 districts. In addition, the country is characterized by three distinct geographic areas running east to west, referred to as the Mountains, the Hills and the Tarai. The mountain areas range in altitude from 4880 metres to 8848 metres above sea level and include such mountains as Everest, Kanchanjunga, Makalu, Dhaulagiri and Annapurna. The area accounts for almost 35% of the total land area of the country and according to the 1991 census about 8% of the country’s 18.5 million population lives in this area. The hill areas range in altitude from above 305 metres to 4880 metres. The Hills account for 44% of the total land of the country and about 45% of the total population. The Tarai areas range from about 60 metres to 305 metres above sea level and include some of the most fertile land in the country. Slightly over one-fifth of the total land area and about 47% of the total population are located in the Tarai. Population density, which reached 126 per km2 nationally in 1991, is rather unevenly distributed through these areas. The Tarai has the highest density at 254 persons per km2, followed by the Hills at 137 and the Mountains at only 28 persons per km2.
1.2. Demographic characteristics Nepal’s fertility is high and mortality is declining fast, resulting in a high rate of population growth. It took 60 years for the 1911 census population of 5.6 million to double to 11.6 million in 1971. The 1991 census yielded a total population of 18.5 million, an average annual growth rate of 2.1% for 1981–1991. The 2001 census showed Nepal’s population reaching 23.1 million—an average annual growth rate of 2.27%. If this trend continues, Nepal’s population will again double by 2032 (Table 1.1). Demographically, Nepal’s population is very young. The proportion of the 0–14 age group in total population has remained at 40% or more since 1961 -- the proportions of 0–14 population were 40.0%, 40.5%, 41.4%, and 42.4% in 1961, 1971, 1981 and 1991 respectively (Karki, 1993). Table 1.2 shows slightly lower proportion of young age population in urban areas (37.3%) compared to the rural areas (42.9%) of Nepal. According to the most recent population census of 2001 (Central Bureau of Statistics and UNFPA, 2002) the age structure still remains quite young as the population 0–14 is reported to be as high as 39.3% (Table 1.2).

2
Table 1.1. Population size and growth rates, Nepal, 1911–2001 ____________________________________________________________
Census year
Population (000s)
Average annual geometric growth rate
(%)
Doubling time (years)
1911 5 639 … 1920 5 574 –0.12 1930 5 533 –0.07 1941 6 284 1.16 60
1952/53 8 257 2.30 30 1961 9 413 1.65 42 1971 11 556 2.07 34 1981 15 023 2.66 26 1991 18 491 2.10 33 2001 23 151 2.27 31
Source: Central Bureau of Statistics, 1958: Population census 1952–54, Table 2; Central Bureau of Statistics, 1968: Population census 1961 , Vol. 3, Part 2, Table 2; Central Bureau of Statistics, 1975: Population census 1971, Vol. 1, Table 5; Central Bureau of Statistics, 1984, Population census 1981, Vol. 2, Table 4; Central Bureau of Statistics, 1993, Population census 1991, Vol. 1, Table 5; and Central Bureau of Statistics and UNFPA, 2002, Population census 2001: National Report.
Table 1.2. Percentage distribution of population by age, sex and residence, 2001 _____________________________________________________________________________
Urban (%) Rural (%) Total (%) Age (years) Male Female Total Male Female Total Male Female Total <5 9.4 9.6 9.5 12.8 12.3 12.6 12.3 11.9 12.1 5–14 23.6 23.5 23.6 28.6 27.1 27.8 27.9 26.6 27.2 15–29 31.6 32.2 31.9 25.0 27.2 26.1 26.0 27.9 27.0 30–49 24.1 23.2 23.7 20.5 21.0 20.7 21.0 21.3 21.2 50+ 11.2 11.5 11.4 13.1 12.3 12.7 12.8 12.2 12.5 Total population (millions) 1.7 1.6 3.3 19.9 10.0 19.9 11.6 11.6 23.2 Source: Central Bureau of Statistics and UNFPA, 2002, Population census 2001: National Report. About 86% of the total population of Nepal reside in rural areas. In 1971 more than half of the total urban population lived in the three cities of the Kathmandu valley, but by 2001 this proportion had declined to about 30.9%. Now 45.5% of the total urban population live in the Tarai areas. According to the 1991 census, the urban population was 9.2% (see Table 1.2), but by the end of 1997 this had changed to 12.7% because of the reclassification of some rural areas as urban centres1 (Bastola, July 2000), and by 2001 the urban proportion was 14.2% (see Table 1.2). 1 In 1991 there were 33 municipalities but at the beginning of 1992 an additional three areas were designated as urban areas. Further, at the beginning of 1997, 15 more areas were designated as urban and at the end of 1997 another seven areas were designated as urban areas.

3
1.3. Health system Health care delivery system The Ministry of Health (MOH) is the main body providing health services to the Nepalese people. As of fiscal year 1999/2000 there were 4,421 government health institutions, comprising 83 hospitals, 13 health centres, 705 health posts, 275 ayurvedic health facilities, 3,185 sub-health posts and 160 primary health care centres. (Ministry of Finance, May–June 2000). There were 78,203 people engaged in providing health services to the people of Nepal through various types of health facility. In Appendix 1, health services data since 1981–82 are presented (health statistics from fiscal year 1994–95 onwards are only for the government sector). Besides government facilities, there are many private and nongovernmental organizations, national and international, that provide health services to people in different parts of the country. Many of these organizations specialize in specific health areas. During the last half of the 20th century, Nepal has made tremendous improvements in mortality, which is evident from Table 1.3. The infant mortality rate and life expectancy at birth have improved—infant mortality has gone down by more than half, and life expectancy has nearly doubled. Nevertheless, these indicators are still not very good by world standards. Among the south Asian countries, life expectancy in Nepal in 2002 was lower than all other countries: Bangladesh—male 62 years and females 63 years; India—male 62 years and females 64 years; Pakistan—male 63 years and female 65 years; and considerably lower than Sri Lanka—male 72 years and female 76 years (World Bank, 2003).
Table 1.3. Trend of infant mortality rate and life expectancy in the past 50 years __________________________________________________________________________ Infant mortality rate
per 1000 live births Life expectancy at birth Source
Year Male Female Male Female Total 1952–54 260.0 250.0 27.10 28.50 27.78 a Vaidyanathan and Gaige,
1973 1961 191.7 123.4 36.96 39.64 38.27 a Karki, 1977 1971 143.8 117.2 43.10 40.80 41.98 a Karki, 1977 1981 136.0 111.0 50.90 48.10 49.53 a Central Bureau of
Statistics, 1987 1991 105.0 99.0 54.10 53.80 53.95 a Karki, 1992 1996 101.9b 83.7 b … … 55.33 MOPE, 1998 2001 2002
66.1
62.7
60.6 60.1
61.0 59.6
60.80 59.9
Karki, 2002 World Bank, 2003
__________________________________________________________________________
a Life expectancy for both sexes was arrived at by using a sex ratio (male:female) of 105. b MOH, 1997.

4
Causes of death The World Bank 1 documented the burden of diseases for Nepal (Table 1.4). The study pointed out that causes of illness and deaths were not systematically collected in government hospitals. The data used were from private hospital records, which were fairly representative of the population. Half of all deaths were due to infectious and parasitic diseases, and perinatal and reproductive disorders. The highest risk groups are children under five and women of reproductive age. Although under-fives represent only 16% of the population, they account for 50% of the disability-adjusted life years lost (DALYs2). It is also found that until age 44 females were 25% more likely to die or suffer serious disability than males. In the context of the Nepalese social and cultural value system, which generally favours males, addressing women’s health is a big challenge. Striking in Table 1.4 is that well over 40% of all deaths in Nepal were from non-communicable diseases (NCDs) and congenital problems. As the epidemiological and demographic transitions proceed, NCDs tend to weigh ever more heavily in country’s health burden. Tobacco use is a key risk factor for many non-communicable diseases, and also increases the risk of some infectious diseases, notable tuberculosis, bronchitis, and asthma.
Table 1.4. Causes of death in Nepal Cause of death Male
(%) Female (%)
Total (%)
Group 1. Infectious, maternal, perinatal and nutritional problems (pneumonia, bacterial diseases, intestinal infections, bronchitis, asthma, abortion complications, tuberculosis, etc.)
48.1 51.3 49.7
Group 2. Non-communicable and congenital problems (digestive disorders, cardiovascular diseases, diseases of the nervous system, etc.)
44.0 40.2 42.1
Group 3. Injuries and accidents 6.8 7.0 6.9 Unclassified 1.0 1.5 1.0 Total (number) 120 539 125 839 246 432 Source: World Bank, June 2000.
1.4. Literacy Information on literacy (ability to read and write) has been collected in Nepal since the 1950s. Table 1.5 shows literacy since the 1952–54 census for males and females by residence. The 1 World Bank, June 2000. Although the final report came out in June 2000, the data used for analysis were from the eighth plan period (1992–97). 2 DALY combines potential years of life lost as a result of death at a given age and years of life lived with disability, using appropriate disability weights depending on the severity of illness. One DALY is thus one lost year of healthy life. See Murray CJL, Lopez AD, 1996. The global burden of disease. Summary. WHO, Harvard School of Public Health and World Bank. Cambridge, Massachusetts, Harvard University Press.

5
national literacy level for both sexes combined increased from about 5% (9.5% male and 0.7% female) in 1952–54 to 53.8% (66.5% male and 41.4% female) in 2001 (Central Bureau of Statistics and UNFPA, 2002, Population census 2001: National Report). The literacy level of females remained less than half that of males until 1996. In Nepal, as elsewhere, urban literacy is much higher (about 65%) than rural literacy (about 36%). The striking feature of Nepalese society is that literacy is persistently low among women even in urban areas.
Table 1.5. Literacy (aged 10+), Nepal, 1952–54 to 1996
Year Urban (%) Rural (%) Total (%) Source Male Female Total Male Female Total Male Female Total 1952–54
n.a. n.a. n.a. n.a. n.a. n.a. 9.5 0.7 5.3 1
1961 57.5 19.6 40.0 14.6 1.1 7.7 16.4 1.8 8.9 1 1971 62.4 28.0 47.0 22.9 2.7 12.9 24.7 3.7 14.3 1 1981 62.0 37.2 50.6 32.9 9.8 21.6 34.9 11.5 23.5 1 1991 77.5 52.3 65.5 51.3 19.6 36.2 54.0 22.7 38.1 2 1996* 77.3 50.5 64.2 50.1 22.4 35.8 52.2 24.4 37.8 3
*Rates are for population 6 years and older. Sources: 1 Sharma, 1989; 2 Central Bureau of Statistics, 1993, Vol. 1, Parts 1 and 10 and Vol. 2; 3 Central Bureau of Statistics, Dec. 1996, NLSS, 1996, Vol. 1.
1.5. Economic indicators Gross domestic product Planned economic development started in Nepal in 1956 with the first five-year plan of 1956–61. The current five-year plan is the tenth, covering 2002–07. The first plan was formulated by the democratically elected government but before the plan ended, the government was dissolved, in December 1960. The subsequent six plans were formulated and implemented under the panchayat1 system of government. The eighth plan (1992–97) was the first plan after the restoration of democracy in 1990. Table 1.6 shows performance in different plan periods. The gross domestic product (GDP) average annual growth rate between 1964–65 and 1974–75 was 10.2%. The growth rate at the end of the panchayat period was about 11%. During the interim period the growth rate shot up to 20%. During the eighth plan period the growth rate was slightly over 10% while in recent years it has slid below 10% (Table 1.6). The GDP growth rates in real terms are much lower: in 1989–90 the real growth rate was 4.57% and since then it has gone up and down: in 1998–99 it came down to 3.45%. The rates of growth of population in those years have remained at over 2%.
1 In the panchayat system of government the king of Nepal was the absolute leader.

6
Table 1.6. GDP and population growth rates, Nepal, 1964–65 to 1998–99 Years Nominal GDP
(million Rs) Real GDP (1984–85 million Rs)
Real GDP 1984–85 million US$ )
Real GDP average
annual growth Rate (%)
Population average
annual growth rate (%)
1964/65 6 272 1974/75 16 571 1984/85 46 587 46 587 2823 1989/90 103 416 58 243 2110 4.57 2.05 1991/92 149 485 64 496 1503 5.23 2.28 1992/93 171 386 66 979 1565 3.85 2.57 1996/97 280 513 82 980 1461 5.50 2.42 1998/99 342 036 89 255 1313 3.71 2.27 1999/00 379 521 95 016 1377 3.18 2.27 2000/01* 410 194 2001/02** 428 033 * 2000/01 is a revised estimate. **2001/02 is a preliminary estimate. Source: National Planning Commission, Eighth Plan, July 1992; MOF, Economic Surveys, 1993, 2000 and 2002. Foreign exchange rate from Nepal Rastra Bank, Quarterly economic bulletin, 1999, 34(1):68. Consumer price index Price changes are influenced by both internal and external factors. Internal factors include conditions of domestic production, the supply situation and the effects of macroeconomic policy. Prices of imported goods, price fluctuations in India and elsewhere, and rates of inflation in other countries are external factors influencing price trends in Nepal. Taking 1983/84 as the base year, Nepal’s overall urban consumer price index increased to 439.9 by the first quarter of the fiscal year 1999/2000 (Table 1.7). The highest price increase (643.9) is seen for restaurant meals (not shown here; see National Rastra Bank, 1999), vegetables and fruits (528.4), spices (522.6), pulses (518.5), housing rent (513.1), grains and cereal products (436.9), followed by education, reading materials and recreation (428.5). For cigarettes the price increase is relatively moderate, it is about 350 times (Table 1.7). Thus cigarette prices have not kept pace with overall inflation.

7
Table 1.7. National urban consumer price index. Base year 1983–84 = 100
Fiscal year Overall
index Cigarettes Grain
and cereal products
Cloth and clothing
Housing Medical and personal care
Education, reading materials and recreation
1984/85 104.1 108.1 93.1 105.3 113.6 109.4 105.4 1985/86 120.6 119.5 112.3 115.1 125.8 125.1 115.9 1986/87 136.6 132.7 130.6 126.6 135.4 140.2 132.2 1987/88 151.7 141.6 142.1 135.6 149.5 154.5 151.8 1988/89 164.0 155.8 151.6 145.3 175.7 169.5 153.3 1989/90 179.9 159.6 154.9 170.5 195.4 165.1 170.9 1990/91 197.5 177.9 165.0 185.9 216.9 174.5 189.5 1991/92 239.2 213.1 218.4 214.4 250.3 198.1 213.1 1992/93 260.3 233.5 232.0 236.9 286.8 227.5 248.8 1993/94 283.7 255.7 241.7 256.4 313.8 243.6 276.3 1994/95 305.4 268.4 260.7 282.2 336.9 258.4 304.8 1995/96 330.2 278.3 282.9 302.6 361.5 266.9 326.5 1996/97 355.9 294.7 312.0 320.3 395.2 316.5 336.9 1997/98 370.0 318.6 310.6 335.3 407.1 315.7 365.5 1998/99 417.1 334.9 371.8 349.4 417.7 350.9 390.1 1999/00* 439.9 348.4 436.9 356.1 420.9 364.4 428.5
* 1st quarter. Source: Nepal Rastra Bank, Quarterly economic bulletin, 1999, 34(1):44–45. Employment in different economic sectors Nepal is predominantly an agrarian economy. According to the 1991 census the proportion of economically active population 10 years of age 1 and over engaged in the primary sector, including agriculture, forestry, hunting and fishing, was 81.2% for both sexes (Table 1.8). More females (90.5%) were engaged in the primary sector than males (74.9%). By residence more rural population are engaged in the primary sector than in other sectors; nearly 86% of the rural population is engaged in the primary sector while in the urban areas it is only 24%. Table 1.9 shows the employed population (aged 10+) by major employment sector and sex from 1971 to 1991. The proportion of the population engaged in the primary sector has slowly fallen and the proportion in the tertiary sector has increased. This is true of both males and females. Even so, the proportion of females engaged in the primary sector is still above 90%.
1 In Nepal there is no system of compulsory education.

8
Table 1.8. Percentage distribution of the employed population (aged 10+) by major employment sector for rural and urban areas, Nepal, 1991
Employment sector
Nepal (%) Rural (%) Urban (%) Total Male Female Total Male Female Total Male Female Agriculture, forestry and fishing
81.23 74.93 90.53 85.54 80.37 92.79 24.07 19.67 38.12
Mining and quarrying
0.03 0.04 0.01 0.02 0.03 0.01 0.13 0.13 0.12
Manufacturing 2.04 2.65 1.16 1.51 2.05 0.76 9.12 8.72 10.39 Electricity, gas and water
0.16 0.25 0.03 0.1 0.17 0.01 0.93 1.1 0.38
Construction 0.49 0.72 0.13 0.36 0.54 0.1 2.16 2.6 0.82 Commerce 3.49 4.47 2.05 2.3 2.9 1.5 19.3 20.8 14.67 Transport and communication
0.70 1.12 0.07 0.46 0.75 0.04 3.84 4.83 0.65
Finance and business services
0.29 0.41 0.09 0.14 0.22 0.02 2.21 2.36 1.75
Personal and community services
10.24 13.59 5.32 8.41 11.4 4.23 34.54 35.8 30.57
Other 0.38 0.59 0.06 0.36 0.58 0.05 0.63 0.72 0.33 Sector not stated 0.96 1.23 0.55 0.8 1.03 0.48 3.04 3.29 2.25 Total (000s) 7 339 4 375 2 964 6 824 3 983 2 841 514 391 122 Source: Shrestha P, Panta P, 1995. Economically active population. In Population monograph of Nepal. Central Bureau of Statistics, National Planning Commission, Kathmandu. Based on 1991 census data.
Table 1.9. Percentage distribution of the employed population (aged 10+) by major employment sector and sex, Nepal, 1971–91
Major sector 1971 1981 1991 Total Male Female Total Male Female Total Male Female Primary1 94.37 92.81 98.17 91.15 88.71 95.75 81.23 74.93 90.53 Secondary2 1.17 1.46 0.46 0.53 0.68 0.22 2.56 3.41 1.31 Tertiary3 4.45 5.73 1.60 6.47 8.48 2.68 14.87 19.83 7.55 Not stated 1.87 2.13 1.35 0.96 1.23 0.55 Others 0.38 0.60 0.06 1 Primary sector includes agriculture, forestry, hunting and fishing. 2 Secondary sector includes mining, quarrying, manufacturing and construction. 3 Tertiary sector includes electricity, gas, water transport, communications and other services. Source: Shrestha P, Panta P, 1995. Economically active population. In Population monograph of Nepal. Central Bureau of Statistics, National Planning Commission, Kathmandu. Based on 1991 census data. In 1998/99 a labour force survey was carried out by the government of Nepal which found that the primary sector employed 54% of the total labour force, followed by the service sector and lastly the industrial sector (Table 1.10). The information from this survey is for the economically active population 15 years of age and over. Some of the difference from the previous table could be due to the higher age cut off point. Nevertheless it is clear that Nepal remains primarily an agrarian country.

9
Table 1.10. Labour force by sector, Nepal, 1998/99
Sector Male Female Total percentage distribution (000s) (000s) (000s) Male Female Total Agriculture 3166 4074 7 240 54.13 80.15 66.23 Industry 1118 356 1 474 19.11 7.00 13.48 Services 1565 653 2 218 26.76 12.85 20.29 Total 5849 5083 10 932 Source: Government of Nepal. Report on the Nepal labour force survey, 1998–99:118–9, Tables E 6.5 and E 6.6. A 1984/85 household budget survey collected more detailed information on occupation than is usual in household surveys. It collected information on the economically active population 10 years of age and over engaged in bidi and cigarette processing by residence, and found that in Nepal only 0.2% were reported engaged in this occupation; more males (0.4%) worked at this trade than females (0.1%; Table 1.11). Also, there was more tobacco production activity in urban areas (0.3%) than rural (0.1%). During the 1980s there were about 6.9 million people 10 years of age and over economically active, so the total number of people engaged in tobacco processing was about 13,800. The 1995/96 urban household budget survey also contained detailed information on occupation groups. It found that only 0.1% of the economically active population 10 years of age and over was engaged in tobacco processing activity in urban areas (Table 1.11). This means in absolute terms, using the figures in Tables 1.8 and 1.10, that the total number of individuals is somewhere between 7,000 and 11,000. As the 1995/96 survey has no information on rural areas and since historically there have been fewer tobacco workers in rural areas it is quite likely that in the recent past the number of people engaged in tobacco processing has also declined in rural areas.
Table 1.11. Occupational classification of the economically active population 10 years and over, Nepal, 1984/85 and 1995/96
1984/85 1995/96 Occupation Nepal Rural Urban Urban
Total Male Female Total Male Female Total Male Female Total Male Female Agriculture and related
79.0 72.9 86.1 82.2 76.6 88.3 34.9 23.5 54.6 30.3 18.3 51.4
General labourers 7.2 7.7 6.6 6.9 7.5 6.3 11.2 10.5 12.4 Production 3.6 4.4 2.9 3.1 3.7 2.5 12.2 13.9 9.3 14.5 16.3 11.3 (Bidi and cigarette makers)
0.2 0.4 0.1 0.1 0.2 0.1 0.3 0.5 0.1 0.1 0.2 0
Sales 3.5 4.4 2.4 2.8 3.5 1.9 13.2 16.0 8.4 15.0 17.8 10.0 Services 5.7 8.9 2.0 4.2 7.2 1.0 24.5 29.8 15.1 26.0 29.5 19.7 Construction and transport
1.0 1.7 0.0 0.8 1.5 0.0 4.0 6.3 0.2 14.2 18.1 7.6
Source: multipurpose household budget survey, 1988:60–61; and household budget survey, 1999.

10
2. THE TOBACCO INDUSTRY IN NEPAL
2.1. Tobacco industry statistics Number of establishments, employment, output and wages A small semi-mechanized factory was established in 1948 at Birganj, a town near the Indian border due south of Kathmandu, with a limited capacity of 300 million sticks per year. It had a precarious existence because of the competition it faced from across the border, and met only a small part of Nepal’s demand. With the signing of a protocol in April 1959 between the government of the Soviet Union and the government of Nepal, a modern factory was established in Janakpur, south-east of Kathmandu in the plains area of Nepal. It was formally inaugurated by the then king of Nepal in January 1965. The factory’s total capacity was to be 2,000 million sticks a year (Devkota, 1968). At that time the total annual import requirement of cigarettes was estimated at 2,000 million sticks, but customs statistics recorded imports of only 1,038 million sticks in 1960/61. It was supposed that a sizeable part of imports went unrecorded, crossing the 600 mile border with India illegally. By 1996/97 there were 38 establishments (Table 2.1) producing tobacco products—cigarettes and bidi. Most of these production units are very small and they are often poorly organized. Only the five cigarette-producing factories are well organized. The only one in the public sector is the Janakpur Cigarette Factory. The four private sector companies are Surya Tobacco Company Pvt. Ltd., Perfect Blended Pvt. Ltd., Nepal Tobacco Pvt. Ltd. and Seti Cigarette Factory. The last one is registered as a factory but functions as a dealer for foreign cigarettes; it does not produce cigarettes locally. All the private factories were founded after 1980.
Table 2.1. Industrial (manufacturing) establishments in Nepal, 1996/97 Industry Number
of establishments
Number of persons engaged
Number of employees
Wages and salaries (Rs 000s)
Percentage of workforce
Average wages and salaries (Rs)
Average wages and salaries (Rs/month)
Tobacco mfg 38 3,213 3,142 101,939 1.68 32,444 2,704 Other 3,519 193,495 184,174 3,956,130 98.32 21,480 1,790 Total 3,557 196,708 187,316 4,058,069 100.00 21,664 1,805 Source: Central Bureau of Statistics, Statistical year book of Nepal 1999. Government of Nepal, National Planning Commission Secretariat, Kathmandu, Nepal. 1999, Table 13. The statistics show a little over 3,200 persons employed full time in tobacco-related industries (Table 2.1). There are also 81,200 retailers who sell cigarettes as well as many other goods, who might therefore be counted as working part-time (Table 2.2). The average wage of those working in tobacco product manufacturing establishments is about 1.5 times higher than in other manufacturing establishments (Table 2.1). In addition, since all bidi

11
workers are classified as unskilled (Table 2.3), the average wage in the cigarette-manufacturing industries will be much higher than the average shown in Table 2.1.
Table 2.2. Employment in the tobacco-producing and retail sector, 2000, Nepal Retail and marketing Company Processing
staff++ Full- time Part-time*
Surya Tobacco Company+ 350 40 43,000 Janakpur Cigarette Company+ 443 100 35,000 Perfect Blended+ 51 7 1,100 Nepal Tobacco+ 240 60 2,100 Bidi companies++ 1,922 0 0 Total employees 3,006 207 81,200 *Retailers. Source: +personal communication with Company Registration Department, Ministry of Industry, Commerce and Supplies; ++personal communication with respective industries. Among the current total employees in tobacco companies, only about 28% are reported to be skilled (Table 2.3). In cigarette factories, however, most employees are skilled. In the bidi factories no workers are classified as skilled.
Table 2.3. Tobacco employees by skill category
Company Total employees
Skilled* Unskilled
Surya Tobacco Company+ 390 302 88 Janakpur Cigarette Factory+ 543 303 240 Perfect Blended+ 58 46 12 Nepal Tobacco+ 300 240 60 Bidi companies** 1,922 0 1,922 Total 3,213 891 2,322
*includes 70% semi skilled; **seasonal workers. +Personal communication with each company. Source: Central Bureau of Statistics, Census of manufacturing establishments, 1996–1997 , national level:1. Table 2.4 presents selected industrial statistics for Nepal between 1986 and 1996. The number of individuals involved in tobacco manufacturing decreased from more than 8,000 to about 3,000 in this 10-year period. Female employment represents only a small portion of total manufacturing tobacco employment. The number of establishments involved in tobacco manufacturing fluctuated significantly between 1986 and 1996. It increased from about 70 in the late 1980s to reach a high of 115 in 1993 before falling to just 38 in 1996. Output value remained fairly stable between 1986 and 1994 fluctuating between Rs 2,280 and 2,860 million, and had risen to Rs 3,400 million (US$ 68 million) in 1996.

12
Table 2.4. Selected industrial statistics, manufactured tobacco, Nepal, 1986–1996
Year Total employment (number)
Female employment (number)
Number of establishments
Output 1995 million Rs
Wages and salaries 1995 million Rs
1986 8873 1075 69 2281 170 1987 7430 701 71 2765 171 1988 7160 1328 70 2366 176 1989 5724 517 72 2578 141 1990 4660 270 68 2861 130 1991 5622 499 85 2698 169 1992 … … … … … 1993 6831 506 115 2457 238 1994 6823 516 82 2619 149 1995 … … … … … 1996 3142 208 38 3391 94 Source: UNIDO Industrial Statistics Database 2002, 3-Digit level of ISIC Code prepared by: Statistics and Information Networks Branch, United Nations Industrial Development Organization.
2.2. Production, trade and consumption of manufactured tobacco Production Since 1986, annual cigarette production has fluctuated between 5,600 million and 8000 million sticks. Production of bidi gradually declined, but increased greatly again in 1998/99 (Table 2.5).
Table 2.5. Production of cigarettes and bidi, 1986/87 to 1999/2000 (million sticks)
Year Cigarettes Bidi 1986/87 5600 709 1987/88 6046 635 1988/89 5665 581 1989/90 6317 368 1990/91 6691 224 1991/92 6963 245 1992/93 7846 247 1993/94 6894 165 1994/95 7430 150 1995/96 8067 120 1996/97 7944 100 1997/98 8127 160 1998/99 7315 548 1999/2000* 7125 526
* estimate. Source: MOF, 2000. Economic survey 1999/2000:20, Table 3.1.

13
Among the four cigarette factories the production share of the government factory has steadily declined since the early 1980s; and is now only 30% of total cigarette production (Appendix 2). Trade In addition to cigarettes and bidi, smokeless tobacco products-- khaini, gutkha and zarda, types of chewing tobacco, are used in Nepal. As seen in Table 2.5, the value of raw tobacco, cigarettes and chewing tobacco imports has increased substantially over the years. It is unclear why there has been a sudden surge in imports of smokeless tobacco products since 1997/98 (khaini and zarda). Tobacco is exported from Nepal but export values are tiny compared to imports. Although Nepal produces a large quantity of cigarettes in the country, foreign cigarettes are also imported for consumption. Cigarette imports have been increasing fast, particularly in the recent past; in 1998–99 imports were worth nearly 1995/96 Rs 100 million (Table 2.6).
Table 2.6. Tobacco imports and exports, 1984/85 to 1998/99, real 1995/96 Rs and US$ Tobacco Cigarette Khaini/zarda Tobacco Cigarette Khaini/zarda Year Imports Exports Imports Imports Imports Exports Imports Imports
million Rs
million Rs
Million Rs million Rs US$ 000 US$ 000 US$ 000 US$ 000s
1984/85 221.0 0.3 10.5 4 438 6 210 1985/86 300.0 0.0 12.9 6 025 – 259 1986/87 161.6 0.5 1.4 3 245 10 29 1987/88 278.2 1.1 15.9 5 588 22 319 1988/89 370.6 0.6 16.7 7 444 12 335 1989/90 364.6 0.4 17.6 7 322 7 354 1990/91 417.1 1.0 1.8 8 376 20 37 1991/92 185.2 1.0 39.8 3 720 19 799 1992/93 442.0 0.9 59.5 8 877 18 1195 1993/94 400.2 0.7 42.8 8 038 14 860 1994/95 579.0 0.6 54.2 11 629 13 1088 1995/96 560.7 0.5 50.1 11 261 10 1006 1996/97 415.4 0.6 54.7 5.8 8 342 13 1098 117 1997/98 527.8 0.9 68.2 164.2 10 601 19 1370 3298 1998/99 468.1 1.9 98.6 422.8 9 401 39 1981 8491 Note: data on bidi exports not available. Source: personal communication, Trade Section, Nepal Rastra Bank, Kathmandu. Table 2.7 clearly shows the negligible value of tobacco exports compared to total exports of Nepalese products. In value, tobacco imports comprise about 1% of total national imports (Table 2.8). About 85% of the total tobacco imported is from India (Nepal Rastra Bank, 1999:56).

14
Table 2.7. Tobacco exports and total exports, 1984/85 to 1998/99 (1995/96 million Rs)
Year Tobacco exports Total exports Million Rs million Rs
Tobacco exports as % of total exports
1984/85 0.32 8 700 0.004 1985/86 0.00 8 433 0.000 1986/87 0.48 7 274 0.007 1987/88 1.09 8 964 0.012 1988/89 0.60 8 441 0.007 1989/90 0.37 9 461 0.004 1990/91 1.00 12,354 0.008 1991/92 0.97 18,932 0.005 1992/93 0.89 21,912 0.004 1993/94 0.70 22,460 0.003 1994/95 0.65 19,069 0.003 1995/96 0.50 19,881 0.003 1996/97 0.65 20,940 0.003 1997/98 0.94 23,496 0.004 1998/99 1.92 27,359 0.007
Source: Trade Section, Research Division, Nepal Rastra Bank and Nepal Rastra Bank, Quarterly economic bulletin, 1999, 34:53.
Table 2.8. Tobacco imports and total imports, Nepal, 1984/85 to 1998/99 (1995/96 million Rs)
Year Tobacco imports Total imports million Rs million Rs
Tobacco imports as % of total imports
1984/85 221.0 24 578.1 0.9 1985/86 300.0 25 592.3 1.2 1986/87 161.6 26 341.1 0.6 1987/88 278.2 30 217.0 0.9 1988/89 370.6 32 723.7 1.1 1989/90 364.6 33 623.7 1.1 1990/91 417.1 38 840.3 1.1 1991/92 185.2 44 116.0 0.4 1992/93 442.0 49 753.3 0.9 1993/94 400.2 60 035.9 0.7 1994/95 579.0 68 842.7 0.8 1995/96 560.7 74 454.5 0.8 1996/97 415.4 86 543.4 0.5 1997/98 527.8 76 005.1 0.7 1998/99 468.1 67 120.6 0.7 Source: Trade Section, Research Division, Nepal Rastra Bank and Nepal Rastra Bank, Quarterly economic bulletin, 1999, 34:56.

15
Tobacco Product Consumption It is difficult to estimate tobacco consumption in the Nepal because there are few relevant data. However, an attempt has been made here to arrive at consumption level by looking at total supply, which is a proxy for total consumption. Total supply is defined as domestic production plus imports of cigarettes. Export should be subtracted, but data were not available, and exports were small. In 1986/87, 4,400 million cigarettes and 567 million bidi were sold in Nepal (Table 2.9). By 1998/99 sales of cigarettes increased to 5,900 million sticks, bidi sales went down slightly to 438 million sticks. The production plus import data are considerably higher, and are likely to be a better indication of actual consumption.
Table 2.9. Supply and sales of cigarettes and bidi, 1984/85 to 1998/99, Nepal
Year Cigarette sticks (millions) Bidi sticks (millions) Supplya Sales Supplyb Sales 1986/87 5600 4404 709 567 1987/88 6048 4759 635 508 1988/89 5667 4461 581 464 1989/90 6320 5158 368 294 1990/91 6691 5333 224 179 1991/92 6971 5624 245 196 1992/93 7859 6429 247 197 1993/94 6904 5526 165 132 1994/95 7443 6100 150 120 1995/96 8080 6545 120 96 1996/97 7960 6424 100 80 1997/98 8148 6723 160 128 1998/99 7349 5901 548 438 a = production + import. Exports are negligible. b = production. Exports and imports are negligible. Source: Sales data were provided in a personnel communication, by the Statistics Unit, Department of Industry and Company Registrar Office, Ministry of Industry. The reason for the discrepancy between sales and production data is not known.
2.3. Tobacco agriculture statistics Trends in land use and yields of tobacco Despite Nepal’s rugged mountains, much of its land is used for cultivation, and about 80% of the total population live from farming. The total arable land in the country has increased from 1.59 million hectares in 1961/62 to 2.32 million hectares in 1991/92. In percentage terms, total arable land went up from 10.8% of total landmass in 1961/62 to 15.8% by 1991/92. The proportionate share of various crops in arable land has changed. In 1981/82, of the total crop area nearly 76% was occupied by cereal, and this figure increased to 80% by 1991/92 (Table 2.10). Similarly the area under vegetables also increased. The share in crop area of legumes, tubers, cash crops excluding tobacco, tobacco and oilseed all fell. The biggest fall was in tobacco:

16
in 1981/82, the total tobacco crop area was 0.3% or 8,700 hectares, by 1991/92 this had decreased to only 4,700 hectares and 0.1% of total area. During the same period, cigarette production increased. The offset is explained by increased tobacco imports (Table 2.6).
Table 2.10. Crop area (000 hectares) by crop type, Nepal, 1981/82 and 1991/92 1981/82 1991/92 Crop Area % Area % Cereal 2,509.0 75.7 3,251.7 80.0 Legumes 334.6 10.1 340.4 8.4 Tubers 86.0 2.6 79.2 1.9 Cash crops excluding tobacco 77.3 2.3 58.2 1.4 Tobacco 8.7 0.3 4.7 0.1 Oilseed 224.1 6.8 260.1 6.4 Spices 58.1 1.8 29.3 0.7 Vegetables 17.2 0.5 39.5 1.0 Area of all temporary crops 3,315.0 100.0 4,063.1 100.0 Source: Central Bureau of Statistics, 1994. National sample census of agriculture, Nepal, 1991–92. The production of tobacco in the country declined from 6 Mt in 1984/85 to 4 Mt by 2000/01 but the yield per hectare was slightly better (Table 2.11).
Table 2.11. Tobacco production and yield, Nepal, 1984/85 to 1999/2001 Year Production (Mt) Yield (Mt/ha) 1984/85 6.0 0.8 1985/86 5.0 0.5 1986/87 5.0 0.6 1987/88 4.0 0.7 1988/89 5.0 0.7 1989/90 7.0 0.9 1990/91 7.0 1.0 1991/92 6.0 0.9 1992/93 6.0 0.9 1993/94 6.0 0.9 1994/95 7.0 0.9 1995/96 6.0 0.9 1996/97 5.0 0.8 1997/98 4.6 0.8 1998/99 3.9 0.9 1999/00 3.8 0.9 2000/01 4.0 1.0 Source: economic surveys, 1999–2002:10, Table 2.2.

17
2.4. Tobacco household economics: the tobacco cultivation survey Sources, levels and distribution of income Sources of income The present study collected information on sources of household incomes in a smoking behaviour sample survey and tobacco cultivation purposive survey (November and December 2000). The questionnaires used are reproduced in Appendices 5 and 6. The sources of incomes surveyed were: • agricultural products: rice, corns, wheat, millets, beans, vegetables, fruits, etc. • cash crops (excluding tobacco products): sugarcane, oilseed, etc. • tobacco products: cultivation • livestock: domestic animals, milk, birds, fish, etc. • non-farm enterprise income: income from home enterprises and self employment outside
agriculture, etc. • transfers: income from remittances and transfers, etc. • tobacco-based cottage industry • service: salaries, wages and other incomes. Incomes were grouped into four categories: • Farm income. Agricultural products: rice, corns, wheat, millets, beans, vegetables, fruits,
etc, cash crops: sugarcanes, oilseeds, etc., (excluding tobacco products), and livestock: domestic animals, milk, birds, fish, etc.
• Income from tobacco-related activities. Tobacco products: cultivation and tobacco-based cottage industry.
• Non-farm income. Non-farm enterprise income: incomes from home enterprises and self-employment outside agriculture, etc., transfers: income from remittances and transfers, etc., service: salaries, and wages.
• Other income. Table 2.12 shows mean income for the four categories of income for households in three ecological regions and by residence. The total average household annual income, according to the smoking behaviour sample survey, was Rs 70,363 (US$ 955). This translates into per capita income of Rs 12,910.64 (US$ 175). The mean annual income for urban households was estimated at Rs 85,667 while for rural households it was Rs 68,474. Among the three ecological regions, the average annual household incomes were Rs 35,237, Rs 101,379 and Rs 62,973 for the mountains, hills and Tarai respectively (Table 2.12). Table 2.12 also shows percentage share of different income sources, according to which about 40% of annual household income comes from farming-related activities and about 47% comes from non-farm activities. Income from tobacco-related activities is insignificant, being less than 1%. The highest proportion of families depend on farm incomes in the high mountain region while in the mid hill region it appears to be dwindling. In the mid hills it is other incomes such as remittances, salaries and wages.

18
Table 2.12. Household income sources by ecological region and residence, Nepal, 2000 (Rs)
Region Farm
income Tobacco income
Non-farm income
Other income
Total
Mountain Mean 26 887 33 6 954 1 363 35 237 % 76.30 0.09 19.73 3.87 100.00 Hill Mean 28 372 484 65 849 6675 101 379 % 27.99 0.48 64.95 6.58 100.00 Tarai Mean 27 554 388 23 381 11 650 62 973 % 43.76 0.62 37.13 18.50 100.00 Rural Mean 28 277 423 32 005 7 769 68 474 % 41.30 0.62 46.74 11.35 100.00 Urban Mean 23 057 – 41 407 21 203 85 667 % 26.91 – 48.33 24.75 100.00 Nepal Mean 27 703 377 33 038 9 245 70 363 % 39.37 0.54 46.95 13.14 100.00 Source: Authors’ survey results. Income levels Table 2.13 reports average household and per capita income by geographical area. Just as for average household income, the per capita income varies a great deal between geographic region and place of residence. Interestingly enough, the difference between the high mountain and the hill region is much bigger than the rural–urban variation.
Table 2.13. Nominal household and per capita income by geographical group (annual income in 2000 rupees)
Average household
income Average household size
Average per capita income
Ecological region Mountain 35,237 5.5 6,652 Hill 101,379 5.6 18,345 Tarai 62,973 5.4 13,128 Residence Rural 68,474 5.5 13,056 Urban 85,666 4.9 20,272 Nepal 70,363 5.5 13,849
Source: Authors’ survey results. Income distribution Table 2.14 reports nominal per capita income in current rupees and the cumulative share of income by quintile. In nominal terms the bottom 80% of households earn about 44% of total income, while the top 20% earn the other 56% of income. In 1996 the bottom 80% of households earned 50% of total income, while the top 20% earned the other 50% (Central Bureau of Statistics, NLSS, 1997).

19
Table 2.14. Nominal per capita income by quintile (rupees) Quintile Mean
income Quintile share (%)
Cumulative share (%)
1 3,168 4.6 4.6 2 5,899 8.5 13.1 3 8,680 12.6 25.6 4 12,962 18.7 44.4 5 38,586 55.6 100.0 Average 13,849 100.0 Source: Authors’ survey results. Table 2.15 reports the distribution of the population by geographical area, nominal per capita income quintile and percentage share of income. Income distribution appears more equitable in the mountain region. The poorest quintile derives 75% of total household income from farming, this ratio decreases as income rises (Table 2.16).
Table 2.15. Distribution of the population by nominal per capita income by quintile and geographical group, Nepal, 2000
Mountain Hill Tarai Total Quintile Quintile
share (%)
Population distribution (%)
Quintile share (%)
Population distribution (%)
Quintile share (%)
Population distribution (%)
Quintile share (%)
Population distribution (%)
1 16.8 35.3 4.6 29.9 3.5 13.2 4.6 20.0 2 27.1 31.3 5.4 16.6 8.9 19.6 8.5 20.0 3 24.5 19.3 7.6 16.1 14.5 21.8 12.6 20.0 4 20.6 10.7 11.8 16.1 22.7 23.3 18.7 20.0 5 11.0 3.3 70.6 21.3 50.4 22.1 55.6 20.0 Source: Authors’ survey results.
Table 2.16. Household income sources by quintile income group, Nepal, 2000 (Rs) Quintile Farm
income Tobacco-related
Non-farm income
Other income
Total
1 Mean 14 576 235 4007 618 19 436 % 75.0 1.2 20.6 3.2 100.0 2 Mean 22 621 382 8936 2 935 34 874 % 64.9 1.1 25.6 8.4 100.0 3 Mean 25 874 560 16 857 6 040 49 331 % 52.4 1.1 34.2 12.2 100.0 4 Mean 30 724 534 25 646 8 260 65 164 % 47.1 0.8 39.4 12.7 100.0 5 Mean 44 735 170 109 909 28 407 183 221 % 24.4 0.1 60.0 15.5 100.0 Total Mean 27 703 377 33 038 9245 70 363 % 39.4 0.5 47.0 13.1 100.0 Source: Authors’ survey results.

20
The tobacco cultivation survey was conducted in four districts of the Tarai. The questionnaires were administered only to households that were involved in tobacco cultivation. The average size of land holding of these farmers was 1.33 hectares. The average size of land holding in Nepal in 1991/92 was 0.96 hectares, and the corresponding figure in the Tarai was 1.26 hectares (Central Bureau of Statistics, June 1994). The Central Bureau of Statistics also notes that the decline in farm size was most pronounced in the Tarai between 1981–82 and 1991–92, where the average farm size declined from 1.48 to 1.26 hectares (Central Bureau of Statistics, June 1994:12). Given this situation it is quite likely that the average land holding in the Tarai by 2002 might be even smaller than 1.33 hectares. On average, 0.38 hectares of land was used for tobacco cultivation in the four districts surveyed. The source of income data in the four districts reveals a similar pattern as Table 2.12 except that income from tobacco farming is significant among tobacco farmers. On average, income from tobacco cultivation is Rs 18,027 per annum, constituting about 27.1% of total annual household income (Table 2.17). Table 2.17. Tobacco farmers’ household income sources for four districts, Nepal, 2000 (Rs)
District Farm
income Tobacco income
Non-farm income
Other income
Total
Mahottari Mean 41 258 26 998 16 302 1628 86 186 % 47.87 31.32 18.92 1.89 100.00 Dhanusha Mean 57 860 21 999 5739 - 85 598 % 67.60 25.70 6.70 - 100.00 Parsa Mean 26 708 11 632 5196 931 44 466 % 60.06 26.16 11.68 2.09 100.00 Bara Mean 29 836 13 917 12 850 180 56 783 % 52.54 24.51 22.63 0.32 100.00 All districts Mean 38 152 18 027 9650 668 66 497 % 57.37 27.11 14.51 1.01 100.00 Source: Authors’ survey results. Among the tobacco farmers the distribution of income by quintile shows 20% of farmers earning a high share of total income (44%) while the remainder is earned by 80% of the farmers (Table 2.18).
Table 2.18. Nominal annual per capita income of tobacco farmers, quintiles (2000 rupees) Quintile Mean household income Quintile share (%) Cumulative share (%) 1 23 620 7.0 7.0 2 38 174 11.5 18.5 3 50 045 14.7 33.3 4 73 373 22.7 56.0 5 145 617 44.0 100.0 Average 66 497 100.0 Source: Authors’ survey results.

21
The tobacco farmers make 24% to 29% of their total income from tobacco farming. This does not vary much by economic stratum (Table 2.19).
Table 2.19. Household income sources, tobacco farmers by quintile, Nepal, 2000 (Rs)
Quintile Farm income
Tobacco-related
Non-farm income
Other income Total
1 Mean 11 505 6927.0 4881.0 308.0 23 621.0 % 48.7 29.3 20.7 1.3 100.0 2 Mean 22 828.0 10 967.0 3355.0 1025.0 38 175.0 % 59.8 28.7 8.8 2.7 100.0 3 Mean 29 435.0 12 604.0 7442.0 564.0 50 045.0 % 58.8 25.2 14.9 1.1 100.0 4 Mean 41 293.0 17 660.0 13 249.0 1171.0 73 373.0 % 56.3 24.1 18.1 1.6 100.0 5 Mean 84 737.0 41 572.0 19 058.0 250.0 145 617.0 % 58.2 28.5 13.1 0.2 100.0 Total Mean 38 152.0 18 027.0 9650.0 668.0 66 497.0 % 57.4 27.1 14.5 1.0 100.0 Source: Authors’ survey results. Household expenditure In all four districts combined, the mean annual household expenditure is Rs 69,226 (Table 2.20). The highest mean annual household expenditure is in Mahottari district—the south-eastern most district of the four districts—and the lowest is in Parsa district. Except for Parsa, annual mean household expenditure is higher than annual mean household income. Nearly 56% of all household expenditure is used for food items; education and health take up about 21%, other items nearly 10% and about 7% is taken up by consumer durable items. The share of expenses on tobacco consumption is about 2%. Income and expenditure comparisons by income groups of tobacco farmers reveal that except for the top 20% farmers (income group 5) the total annual household expenditures exceed the total annual household income. Just as the other families the tobacco farming families too spend about 2.3% of their total expenditure on tobacco products (Table 2.21). The poor farmers spend proportionately more (3 %) on tobacco than their well-off counterparts (2% or less).

22
Table 2.20. Household expenditure of tobacco farmers in four districts, Nepal, 2000
District Food, energy and clothing
Tobacco products
Education and health
Consumer durables
Other expenses
Total
Mahottari Mean 54 226 2 280 31 721 3 330 12 657 104 215 % 52.03 2.19 30.44 3.20 12.14 100.00 Dhanusha Mean 49 566 1 304 18 002 3 944 4 914 77 731 % 63.77 1.68 23.16 5.07 6.32 100.00 Parsa Mean 29 899 1 420 4 054 2 909 5 479 43 761 % 68.32 3.25 9.26 6.65 12.52 100.00 Bara Mean 33 695 1 347 9 780 10 190 5 499 60 510 % 55.69 2.23 16.16 16.84 9.09 100.00 All districts Mean 40 853 1 560 14 835 5 079 6 899 69 226 % 59.01 2.25 21.43 7.34 9.97 100.00 Source: Authors’ survey results.
Table 2.21. Household expenditures of tobacco farmers by income quintile, Nepal, 2000
Quintile Food, energy and clothing
Tobacco products
Education and health
Consumer durables
Other expenses Total
1 Mean 24 529 1 191 5826 2 264 5 255 39 065 % 62.8 3.0 14.9 5.8 13.5 100.0 2 Mean 28 778 1 324 6340 3 474 4 764 44 680 % 64.4 3.0 14.2 7.8 10.7 100.0 3 Mean 36 246 1 201 8977 3 456 5 373 55 253 % 65.6 2.2 16.2 6.3 9.7 100.0 4 Mean 47 096 1 502 19 907 5 085 8 768 82 358 % 57.2 1.8 24.2 6.2 10.6 100.0 5 Mean 66 939 2 564 32 627 11 005 10 208 123 343 % 54.3 2.1 26.5 8.9 8.3 100.0 Total Mean 40 853 1 560 14 835 5 079 6899 69 226 % 59.0 2.3 21.4 7.3 10.0 100.0 Source: Authors’ survey results. Tobacco commercial cultivation is apparently not an attractive occupation for farmers anymore in Nepal for several reasons. First, farmers say they do not make money from tobacco cultivation. This explanation is also supported by the annual income and expenditure data discussed above. Although tobacco has been grown for domestic use in the Tarai for many years, tobacco cultivation for commercial purposes started in the early 1960s. In the early years in Mahottari district (farmers in this district sell their tobacco to Janakpur Cigarette Factory) there were 45

23
barns1 but now there are only three barns. The decline of tobacco cultivation is attributable to the following reasons: • cigarette factories are indifferent to commercial farming of tobacco these days • cigarette factories label locally produced tobacco as low-grade tobacco • shortage of fuel wood for curing tobacco • costly transportation—transporting of tobacco from the farm to the factories is expensive
for the farmers • cigarette factories do not make payments to the farmers on time, which affects the next
round of farming • there is no guarantee that locally produced tobacco will be bought by cigarette factories. Most factories now import tobacco from India. Despite these problems some areas in the Tarai are particularly suitable for tobacco cultivation, and therefore farmers continue to grow tobacco. The farmers are, however, willing to give up tobacco cultivation if there were alternative crops. Irrigation would enable farmers to switch from tobacco to rice cultivation. Alternative employment opportunities for the local labour force would also enable farmers to stop tobacco cultivation. The government of Nepal, in its ninth five-year plan, has recognized the problems of tobacco farmers (National Planning Commission, July 1998:349). The problems identified by the government are: • reduction in per hectare productivity • low market price for the farmers’ tobacco products • lack of appropriate technology for improving yields • shortage of necessary fuel for tobacco processing for tobacco farmers • lack of improved seeds • shortage of fertilizers. The plan noted a commitment to solving these problems for tobacco farmers by the end of the ninth plan period—mid 2002—but if tobacco consumption is to be discouraged it might be better to help identify alternatives to tobacco farming rather than trying to improve tobacco farming2.
2.5. Tobacco advertising and promotion by tobacco companies All five companies that produce cigarettes and the Seti Cigarette Factory that distributes Marlboro cigarettes do massive promotional activities. In 1995/96 alone, Surya Tobacco Company spent Rs 31 million in advertising, up Rs 10 million compared to the Rs 20 million spent in 1994/95 (STC, Report and Accounts, 1995/96). Since the share of the STC cigarette factory is about 60% of the total market, it can be assumed that, in all, significantly more is spent on advertising by all the cigarette factories. Besides, since the market for smokeless tobacco products is growing fast, the money spent by khaini, pan parag and zarda companies on advertising is likely also to be quite large.
1 A barn is a heating centre for curing/processing tobacco leaves. 2 At the time of writing, it was not possible to evaluate the impact of the government’s commitment.

24
Until recently, cigarette advertising used all media channels, such as radio and television, videos, publications, wall paintings, hoarding boards and local folk singers. Attractive and expensive billboards advertising cigarette companies are seen at main junctions in many parts of the country. The government of Nepal has banned advertising of tobacco products through electronic media but other media channels are extensively used. The national daily newspapers and magazines are full of cigarette advertisements. The cigarette companies often put their advertisements on the front page of newspapers, the most expensive location.
3. PREVALENCE AND CONSUMPTION
3.1. Prevalence of tobacco use Smoking is common in Nepal regardless of age or sex. However, national data on tobacco use prevalence are not available. In order to fill this gap, the current study conducted a nationally representative sample survey in November and December 2000 (sample design and questionnaire for the smoking behaviour survey are in Appendices 3 and 4 respectively). Earlier studies were carried out in different parts of the country in 1979 and the early 1980s, and their main findings are reviewed here (Pandey et al., 1988). In the early 1980s, 64.2% of the population aged 20 and above were found to be smokers, the figures for males and females were 75.5% and 53.6%1 (Table 3.1). The present study shows a smoking prevalence rate of 45% among the population 20 years of age and over (see last column Table 3.1)2. Table 3.1 also presents standardized smoking prevalence rates for the population 20 years and over. Although significant differences were not observed between the standardized and unstandardized rates it was necessary to eliminate the effects of population age structure, if any. Smoking prevalence among the population aged 20 and over was lower in urban areas especially among women (both sexes 37%, males 64.6% and females 14.2%) than rural areas (both sexes 68%, males 77% and females 59.6%) in the 1980s and this pattern remained the same in our findings, but with a smaller divergence in female prevalence between urban and rural area: in urban areas the smoking prevalence rate among the population aged 20 and over for both sexes was 33.7%, for males 48.7% and for females 20.7%, and in the rural areas the corresponding figures were 46.3%, 57.0% and 35.7% (Table 3.1). Smoking prevalence for the population 10 years of age and over was 31.6% in 2000 (Table 3.1). More males smoked (39.5%) than females (23.8%). Smoking prevalence by geographical region by sex for the population 15 years of age and over are shown in Figure 3.1.
1 It must be noted that they are not really representative of the whole country because the sample design was a purposive sample, and these figures are based on different rural, urban and regional level data. 2 Since the study carried out by Pandey et al. (1988) was a purposive survey the comparisons between the present study and the earlier one should be interpreted with caution.

25
Table 3.1. Unstandardized and standardized smoking prevalence rates by age, sex and residence, Nepal, 1980s and 2000
Unstandard-
ized rate Standardized rate (2000 age structure)
Unstandard-ized rate
Standardized rate (2000 age structure)
Unstandardized rate
1980sa 1980sa 2000b 2000b 2000b Age group 20+ 20+ 10+ Urban Male 64.6 62.5 48.7 52.4 32.8 Female 14.2 14.5 20.7 21.6 14.8 Total 37.0 36.2 33.7 35.5 23.7 Rural Male 77.0 77.4 57.0 56.8 40.2 Female 59.6 59.6 35.7 36.1 24.9 Total 68.0 68.2 46.3 46.4 32.5 Nepal Male 75.5 75.7 56.2 56.2 39.5 Female 53.6 53.6 34.1 34.6 23.8 Total 64.2 64.2 45.0 45.3 31.6 aSource: Pandey MR, Basnyat B, Neupane RP, 1988. Chronic bronchitis and cor pulmonale in Nepal: a scientific epidemiological study . Kathmandu, Mrigendra Medical Trust. bSource: the present study. Age 10+ cannot be standardized because of the unavailability of data.
Figure 3.1 Smoking prevalence among 15+ population by region and sex, Nepal, 2000
59.3
47.9 46.8 48.4
23.6
54.9
30.3 28.7
-
10.0
20.0
30.0
40.0
50.0
60.0
70.0
Mountain Hill Tarai Nepal
Region
Per
cen
tag
e
Male 15+
Female 15+
Source: Authors’ survey Prior to this study only two studies (Pandey et al., 1987; Jhan et al., 1999) had collected smoking behaviour data among the young. Those studies were, however, limited to specific areas. The survey carried out by Pandey et al (1987) in 1983/84 in a rural hill area found smoking prevalence smoking among youths aged 8 to 19 years to be 12.6% (Table 3.2). Smoking was

26
much more common in young males (17.3%) than females (6.7%). This survey also showed that smoking prevalence increases with age; among the 16–19 year olds it was about 39% while among the 8-11 year olds it was only about 2%. The present study showed a 3.8% prevalence rate for 10–19 year olds in the rural population, with more young males smoking (6.1%) than young females (1.4%). Apparently smoking has declined considerably among the young in the rural areas of Nepal in the past 15 years. Table 3.2. Prevalence of daily smoking among youths aged 8–19 in a rural hill area in 1983–
84 and among youths aged 10–19 in rural hills and Tarai in 2000, Nepal Rural hill youths aged 8–19, Nepal, 1983–84 Present study Age group 8–11 12–15 16–19 8–19 10–19 (rural) Male (%) 2.3 14.0 39.0 17.3 6.1 Female (%) 1.1 6.6 16.0 6.7 1.4 Total (%) 1.7 10.6 29.9 12.6 3.8 Source: Pandey MR et al., 1987. Epidemiological study of tobacco smoking behaviour among young people in a rural community of the hill region of Nepal with special reference to attitude and beliefs. Community medicine, 9(2):110–20. The Jhan et al. study, carried out in Sunsari district in the south-eastern Tarai (1994), found a 17.5% smoking prevalence for the population aged 5 and over1. There too more males were found to be smokers (19.6%) than females (15.4%). In the neighbouring district of Jhapa, which was one of the 10 districts covered by the present study, smoking prevalence was 20.7% for the population 10 years of age and over. A higher proportion of males were smokers (27.4%) than females (15.1%). Unstandardized and standardized smoking prevalence rates by three ecological regions for 1980s and 2000 are given in Table 3.3. We found that smoking prevalence was highest in the mountain region (77.7% in the 1980s and 65.1% in 2000), followed by the hill region (68.4%% in the 1980s and 46.5% in 2000) and the Tarai had the lowest prevalence (55.7%% in the 1980s and 40.7% in 2000). In all regions and at all times males smoked more than females. However, the difference between males and females in smoking behaviour is small among the mountain population compared with people from other regions.
1 Although the Sunsari study collected smoking data for all age populations, smoking among children 5 years of age and under was virtually non-existent.

27
Table 3.3. Unstandardized and standardized smoking prevalence rates by age, sex and region, Nepal, 1980s and 2000
Unstandard-
ized rate Standardized rate (2000 age structure)
Unstandard-ized rate
Standardized rate (2000 age structure)
Unstandardized rate
1980sa 1980sa 2000b 2000b 2000b Age group 20+ 20+ 20+ 20+ 10+ Mountain Male 84.7 86.0 68.2 67.4 49.8 Female 71.7 71.3 62.1 61.1 45.8 Total 77.7 78.6 65.1 64.1 47.8 Hill Male 76.1 75.8 58.2 58.3 39.5 Female 50.9 50.1 35.6 37.8 25.4 Total 63.1 62.4 46.5 47.9 32.4 Tarai Male 62.8 63.6 53.6 52.8 37.7 Female 48.4 50.2 28.5 26.7 19.5 Total 55.7 57.2 40.7 39.4 28.6 aSource: Pandey MR, Basnyat B, Neupane RP, 1988. Chronic bronchitis and cor pulmonale in Nepal: a scientific epidemiological study . Kathmandu, Mrigendra Medical Trust. b Source: Authors’ survey results. Literacy seems to have a major impact on smoking habits. Literate people in Nepal are half as likely to smoke (22.3%) as illiterate people (45.8%; Table 3.4). Table 3.4. Smoking prevalence of population aged 10 years and over, by gender, region and
literacy, 2000 Literate (%) Illiterate (%) Male Female All Male Female All Mountain 32.2 14.5 26.9 73.1 56.1 62.4 Hill 32.5 9.8 23.4 72.0 43.9 51.6 Tarai 31.6 5.8 21.3 53.1 32.3 39.7 Nepal 31.9 7.5 22.3 59.9 38.6 45.8 Source: Authors’ survey results. Several studies have shown an inverse relationship between the number of years of schooling and smoking prevalence (World Bank, 1999), Nepal shows the same pattern. Figure 3.2 shows 50.6% of the illiterate adult population 20 years of age and over currently smoking; as the number of years of schooling increases the proportion of current smokers declines, with a threshold effect at 6 years of schooling.

28
Figure 3.2 Smoking prevalence by education among adults 20 and older, Nepal, 2000
50.645.8
32.7 32.9
0
10
20
30
40
50
60
Illiterate <6 years 6–12 years >12 years
Length of education
Per
cent
age
Source: Authors’ survey During the mid 1990s, the National Planning Commission and Central Bureau of Statistics carried out a survey among married women of reproductive age, who were asked (in addition to many other questions), about smoking habits. That survey reported lower smoking prevalence among literate women. A much higher percentage of illiterate women (27.6%) smoked during their most recent pregnancy than literate women (7.4%; Table 3.5).
Table 3.5. Number of cigarettes/bidi smoked during most recent pregnancy by literacy, Nepal, 1997
Number Literate (%) Illiterate (%) None 92.6 72.4 0–9 5.3 19.5 10–19 1.4 6.1 20+ 0.7 1.9 Total 1923 1609
Source: National Planning Commission, Central Bureau of Statistics, June 1998. Further analysis report on antenatal, delivery, postnatal services, literacy and polio coverage. Nepal multiple indicator surveillance, fifth cycle (March–May 1997). In collaboration with UNICEF Nepal. Relatively fewer younger people reported smoking than older people regardless of region of residence or sex (Table 3.6). People over 60 years of age smoke more than any other age group. This holds true for all respondents. The age prevalence rates for males and females and both sexes combined are vividly shown in Figure 3.3.

29
Figure 3.3. Smoking prevalence for males and females by 5-year age groups, Nepal, 2000
Table 3.6. Smoking prevalence (%),males and females 10 years and older by 5-year age group, Nepal, 2000
Age group Male (%) Female (%) Total (%) 10–14 1.1 0.0 0.6 15–19 12.9 2.8 7.9 20–24 32.2 11.2 21.4 25–29 51.5 23.8 36.7 30–34 61.8 33.0 46.4 35–39 66.7 36.0 52.2 40–44 64.2 45.0 54.0 45–49 63.2 50.3 56.3 50–54 62.0 57.1 59.7 55–59 73.0 37.8 57.1 60–64 68.6 54.0 61.3 65–69 60.9 43.3 52.4 70–74 60.3 48.8 55.4 75–79 38.9 61.1 50.0 80+ 45.5 32.0 38.3 Age10 and over 39.5 23.8 31.6
Source: Authors’ survey. Age of initiation Information on age when smoking began reveals that some people begin as early as age 5, but the average age for beginning to smoke is estimated to be 16.6 years for all respondents aged 10 and
0
1 0
2 0
3 0
4 0
5 0
6 0
7 0
8 0
10-1
4
15-1
9
20-2
4
25-2
9
30-3
4
35-3
9
40-4
4
45-4
9
50-5
4
55-5
9
60-6
4
65-6
9
70-7
4
75-7
9
80+
A g e g r o u p
Per
cen
tag
e
M a l e
F e m a l e
B o t h s e x e s

30
over (Table 3.7). Just as smoking prevalence is highest in the mountain region, the initiation age is the earliest, with the lowest average age at first smoking (15.4 years) in that region. Although fewer women than men smoke, they begin smoking earlier (15.8 years) than their male counterparts (17.0 years), and this is true of all regions of the country.
Table 3.7. Mean age at first smoking by region and sex, Nepal, 2000 Region Male Female Total Mountain 15.7 15.1 15.4 Hill 16.0 15.3 15.7 Tarai 17.7 16.4 17.3 Nepal 17.0 15.8 16.6 Source: Authors’ survey.
3.2. Consumption of tobacco products Tobacco products in Nepal comprise manufactured cigarettes of different types and brands, bidi (dry tobacco wrapped in dry leaves), kakkad/sulfa (tobacco smoked in a clay pipe), hukka (hubble-bubble or water pipe) and various kinds of chewing tobacco, known as khaini. Use of all of these was explored in the present survey. Among all respondents aged 10 and over, 31.6% were currently smokers and 79% of them were cigarette smokers. Cigarette smoking is considered by many as a social habit. Just like tea, cigarettes are offered to a person visiting a family or friend. People in the rural areas of Nepal generally believe that smoking enhances their personality. Of all current smokers, 8.8%, 9.8% and 2.4% used bidi, kakkad/sulfa and hukka respectively. Kakkad/sulfa and hukka are traditional types of tobacco product, consumed particularly among the hill and mountain populations of Nepal. Data were also collected on khaini consumption, which revealed that 9.4% of all respondents aged 10 and over were khaini consumers. Of all respondents aged 10 and over 36.9% were smokers and/or khaini consumers. Data on the quantity of cigarette/bidi sticks consumed showed that among the smokers, in a year, on average, 2,171.5 sticks were consumed by a person 10 years of age and over in Nepal (Table 3.8, equivalent to about 6 per day). Females were found to smoke slightly more sticks (2,230.7 sticks) than males (2,138.5 sticks). The smokers in the high mountain region consumed the highest number of cigarette/bidi sticks (2,752.2 sticks) followed by the hill region (2,210.4 sticks); and the Tarai people consumed the fewest cigarette/bidi sticks (2,007.1 sticks). It is only in the high mountain region where, on average, more sticks of cigarettes/bidi were consumed by males (2,920 sticks) than females (2,519.9 sticks; Table 3.8). Information was also collected on the amount of money spent on cigarettes/bidi. On average, a smoker spent Rs 1,459.7 annually. Although women smoked slightly more sticks a year, they spent a little less (Rs 1,179.0) than men (Rs 1616.0; Table 3.8) because they smoke less expensive cigarettes than men. This was true for all regions of the country. The authors met with smokers in the high mountain and hill regions of Nepal and found that the bidi smoked in the

31
hills and mountains are not manufactured like regular manufactured bidi in the Tarai. In the uplands, the smokers buy loose tobacco and wrap it in dry tree leaves to smoke. This is much cheaper than buying even the cheapest cigarettes.
Table 3.8. Consumption of tobacco products and money spent on them by region and sex,
Nepal, 2000 Region Sex Mean annual number of
cigarettes/bidi consumed Mean annual Rs spent on cigarettes/bidi
Mean annual Rs spent on all tobacco products
Mountain Male 2920.0 1621.3 1421.1 Female 2519.9 1234.7 1025.6 Total 2752.2 1459.2 1236.2 Hill Male 2145.3 1629.1 1346.7 Female 2304.1 1301.1 1169.3 Total 2210.4 1494.6 1279.2 Tarai Male 1966.9 1609.8 1355.7 Female 2092.9 1091.5 938.6 Total 2007.1 1444.5 1223.9 Nepal Male 2138.5 1616.0 1362.2 Female 2230.7 1179.0 1019.4 Total 2171.5 1459.7 1239.9 Source: Authors’ survey. The last column of Table 3.8 shows the average annual amount spent by a smoker on all tobacco products including cigarettes, bidi, kakkad/sulfa, hukka and khaini. The annual average amount of money spent was Rs 1,239.9, and the males spent more (Rs 1,362.2) than the females (Rs 1019.4). This pattern was true of all regions. An attempt has also been made here to estimate per adult consumption of cigarette and bidi sticks. In order to make this information comparable with other data, cigarette and bidi smoking prevalence rates have been estimated separately for the Nepal population aged 15 and over. Then the numbers of cigarette and bidi smokers in Nepal were estimated by multiplying the population aged 15 and older by the prevalence rates. Next, the total number of cigarettes and bidis smoked were estimated on the assumption that the present survey findings are representative of smoking intensity for the whole country. These totals were then divided by the total population aged 15 and older, to estimate population-wide per capita consumption. Table 3.9. Cigarette and bidi smoking rates (%) for population 15 years of age and over and
estimates of per capita consumption of cigarettes and bidi, Nepal, 2000 Age 15+ Cigarette smoking
prevalence rate (%)
Bidi smoking prevalence rate (%)
Cigarettes consumed per capita annually
Bidi consumed per capita annually
Male 40.5 3.27 828 106 Female 20.4 3.51 429 97 Both sexes 30.3 3.40 626 102 Source: Authors’ calculations.

32
Table 3.9 shows that in Nepal estimated per capita consumption of cigarettes was 626 sticks a year for both sexes combined, and for males and females the corresponding figures were 828 sticks and 429 sticks respectively. Similarly annual bidi consumption was estimated at 102 sticks for both sexes together and for males it was slightly higher (106 sticks) than for females (97 sticks)1. The total consumption is estimated to be 8.5 billion cigarettes and 1.4 billion bidi. These estimates exceed the current volume of cigarette and bidi production plus imports. Table 2.9 above shows that cigarette production plus imports peaked in 1997/98 at 8.1 billion sticks a year and bidi production plus imports was around 550 million sticks in 1998/99. If – and it is a serious caveat given the fairly small size of the survey – the present survey is accurately representative of per capita consumption and prevalence in the whole country, then this calculation suggests that there is a gap between consumption estimated using the survey data and production plus imports. The size of the gap may indicate the degree of cigarette smuggling into Nepal, at somewhere between 5 and 14% of the total number of cigarettes smoked. For bidi, at least some (considerable?) part of the gap of 0.85 billion sticks (the difference between estimated consumption and production plus imports) would be accounted for by home-produced bidi. The authors’ and the field workers’ impression was that traditional forms of smoking such as kakkad/sulfa and hukka are eroding fast for several reasons. First, manufactured cigarettes—both expensive (imported and locally produced) and cheap brands—are extensively available throughout the country. The various cigarette brands available in the country are Gorkha, Gold Flake, Batar, Shangrila, Winner, Yeti, Yak, Gainda, Deurali, Surya Luxury, Surya Mild, Shikhar, Mini Shikhar, Khukuri Gold, Khukuri, Bijuli, Camel, Gaurab, 555 Surya and Sahasi. The imported brands commonly available are 555 Foreign, Wall Street, Marlboro and Marlboro Light. Secondly, cigarettes are heavy promoted, as discussed earlier. Thirdly, many cigarette brands are cheap and easily available in that any shop, grocery or other, sells cigarettes throughout the country. Thirdly, cigarette smoking raises social status, at least in some peoples’ belief. Fourthly, smoking of kakkad/sulfa calls for the availability of specially processed tobacco and specially prepared clay pipes. Such processing skills are eroding fast. Fifthly, many farmers used to grow tobacco for their own consumption; this custom is on the decline. This survey found only about 0.15% of households producing tobacco for home consumption. The farmers who grew tobacco said that domestic farming of tobacco was not worth it as it hardly met the demand for smoking in the family. Also they told the author that only the older generation used home-grown tobacco, while the others mostly consumed cigarettes, with a few khaini users.
1 It must be noted here that bidi sticks are not necessarily manufactured bidi sticks; as in the hills and mountains loose tobacco is wrapped in dry tree leaves and smoked. In this study this type of smoking is also treated as bidi smoking.

33
4. PRICES, TAXES, AND THE DEMAND FOR TOBACCO PRODUCTS
4.1. Prices, taxes and government revenues Prices of tobacco products Increasing the price of tobacco products is arguably the most effective method of reducing prevalence and consumption. Individuals who do not use tobacco may refrain from starting, and thus avoid addiction. It can also induce current users to consume less tobacco or persuade them to quit, as well as prevent former users from starting again. Figure 4.1 presents trends in the real price of cigarettes and their “costliness” in Nepal for the period 1972/73 to 2000/01. The real price cigarette index is based on National Urban Consumer Price Index for cigarettes, which is deflated using the overall consumer price index. Both these time series were obtained from the Nepal Rastra Bank. Costliness is calculated by dividing per capita gross domestic product (GDP) by relative cigarette price. A falling costliness index indicates that tobacco products are becoming more affordable or less costly.
Figure 4.1. Cigarette real prices and costliness, Nepal, 1972/73 to 2000/01
0
20
40
60
80
100
120
1972 1975 1978 1981 1984 1987 1990 1993 1996 1999
Year
Inde
x (1
971–
72 =
100
)
Real price
Costliness
Source: Nepal Rastra Bank
These data show that real cigarettes prices in Nepal fell by as much as one-third during the past three decades. More disturbingly, in 2000 cigarettes were about 60% more affordable than they were at the beginning of the 1970s. Table 4.1 presents nominal cigarette prices by brand for the period 1990–2000. The field workers and the authors also found that in the districts the prices of cigarettes are a rupee or two higher than shown in Table 4.1 which uses data from final retailers. This was verified by asking retailers in the districts and consumers of cigarettes too. The present study reveals that of the total cigarette market the Surya Tobacco Pvt. Ltd. has 55% of the market share, followed by the

34
Janakpur Cigarette Factory Ltd. (28%), the Nepal Tobacco Pvt. Ltd. (13%); the remaining 4% market share is taken up by the Perfect Blended Pvt. Ltd.
Table 4.1. Nominal cigarette prices, Nepal, 1991–2000 (Rs per pack of 20)
Brand 2000 1999 1998 1997 1996 1995 1994 1993 1992 1991
Nepal Tobacco Company Pvt. Ltd. Yeti Filter 19.75 18.75 17.75 16.75 15.75 14.75 13.75 12.75 11.80 10.80 Gorkha Filter 13.90 13.40 12.90 12.40 11.90 11.40 10.90 10.40 9.90 9.40 Winner Filter 13.50 13.50 12.55 12.55 12.55 12.55 12.55 12.45 12.45 12.45 Goldflake 8.00 7.30 6.30 6.30 6.30 5.30 5.30 4.30 4.30 4.30 Bahar 7.30 7.30 6.30 6.30 6.30 5.30 5.30 4.30 4.30 4.30 Shangrila 17.55 Surya Tobacco Company Pvt. Ltd. Surya 47.00 44.75 43.75 43.75 42.75 42.75 41.75 41.75 39.80 39.80 Shikhar Premium 31.75 31.75 Shikhar Filter 25.00 23.75 22.75 22.75 21.75 21.75 20.75 20.75 19.80 19.80 Shilhar Menthol 23.75 23.75 22.75 22.75 21.75 21.75 20.75 20.75 19.80 19.80 Shikhar Mini 18.00 16.75 15.75 14.75 13.75 12.75 11.75 10.75 9.75 9.75 Khukuri Filter 13.90 13.40 12.90 12.40 11.90 11.40 10.90 10.40 9.90 9.40 Bijuli 7.30 7.30 6.30 6.30 6.30 5.30 5.30 4.30 4.30 4.30 Chautari 7.50 7.30 6.30 6.30 6.30 5.30 5.30 4.30 4.30 4.30 555 69.00 Janakpur Cigarette Factory Ltd. Yak Kings 23.75 23.75 22.75 22.75 21.75 21.75 20.75 20.75 19.80 19.80 Yak Filter 18.00 16.75 15.75 14.75 13.75 12.75 11.75 10.75 9.75 9.75 Himchuli Filter 13.90 13.40 12.90 12.40 11.90 11.40 10.90 10.40 9.90 9.40 Kasturi Filter 13.90 13.40 12.90 12.40 11.90 11.40 10.90 10.40 9.90 9.40 Gainda 9.00 8.75 8.65 8.65 8.65 8.65 8.65 8.65 8.65 8.65 Deurali 14.00 7.30 6.30 6.30 6.30 5.30 5.30 4.30 4.30 4.30 Lahure 6.30 6.30 6.30 5.30 5.30 4.30 4.30 4.30 Perfect Blended Pvt. Ltd. Shahashi 8.00 Gaurab 13.90 Source: personal communication with cigarette factories. Other manufactured tobacco products are bidi and khaini. Attempts were made to collect price trends for bidi but it was virtually impossible either in the capital city or in the districts where bidi are manufactured. Bidi are produced in the Tarai in large quantities but the manufacturing establishments are elusive. Recorded information on bidi manufacturing is not possible to collect. As an indicator, however, in March 2003, the retail price of one bundle of bidi (20 sticks) varied from Rs 3.5 to Rs 4 in Kathmandu, the capital city. The present study found five brands of bidi on the market; they are: Shiva, Dhadi, Rubi, Hulai and “302”. In other parts of the country, other bidi brands such as Ganesh bidi and Ghadi Chhap

35
bidi are also found. In the hills and mountains consumption of manufactured bidi is now virtually non-existent. Many shopkeepers now take the attitude that bidi are for poor people. Khaini, a chewing tobacco, is another widely consumed tobacco product in Nepal. Although khaini is fairly new to the Nepal hill population it is increasingly becoming popular in all parts of the country. Different brands of khaini such Balwan Chhap, Golden Khaini, Shambhu Khaini, Tulsi, Shreeram Chhap, Guruji Chhap, Parag Chhap, Panch Hajar Gutka and Shikhar Gutka are consumed in Nepal. The khaini packets are imported from India. The price of khaini packets ranges from Rs 3 to Rs 5 depending on the geographic region of the country. Uunmanufactured tobacco products in use in Nepal are tobacco wrapped in dry leaves which look like bidi and tobacco used in kakkad/sulfa and hukka. As discussed earlier these tobacco products are fast eroding because of cigarette manufacturers’ strong marketing strategy. Tax rates for tobacco products Three types of tax on manufactured cigarettes are levied in Nepal. They are excise tax, health (smoking) tax and a 10% value-added tax. The most important of these is the excise tax, which is levied according to the type of cigarette and the length of the cigarette stick. Cigarette excise taxes from 1997/98 to 2002/3 are presented in Table 4.2.
Table 4.2. Specific excise per 1000 sticks in Nepal, 1997/98 to 2002/03 (Rs) 1997/98 1998/99 1999/2000 2000/01 2001/02 2002/03 Plain Up to 70mm 80 90 90 100 110 125 Filter Up to 70mm 255 260 260 265 285 300 71–75mm 325 325 335 340 365 385 76–85mm 450 450 450 470 500 530 Above 85mm 600 600 600 600 675 710 Source: Aarthik Vidhayek, Vansar Darbandi. [Fiscal bills and tax structure], Ministry of Finance 1997/8 to 2002/3. Table 4.3 presents the tax incidence (i.e. the sum of all taxes as a percentage of the retail price) for selected tobacco products in Nepal. The tax incidence ranges from 25% on highly priced international brands to a little more than 50% on popular domestic brands. This is low in comparison to international tobacco tax incidence levels, which often reach 75% to 85% and is well below the World Bank recommendation that the tax component of the price of a pack of cigarettes should be between two-thirds and four-fifths of the total retail cost (World Bank, 1999). The current Nepal tax structure also appears to favour international brands at the expense of domestic brands as Nepal relies primarily on a “per quantity” (specific) excise as opposed to a “percentage” (ad valorem) excise.

36
Table 4.3. Tax incidence of selected tobacco products, Nepal, selected years Price (20
sticks, Rs) Specific excise (Rs per pack of 20)
VAT (%) Health tax (Rs per pack of 20)
Tax incidence (%)
Gainda (69 mm) 1997/98 8.65 1.60 10 0.4 33 2001/02 9.30 2.20 10 0.4 38 Deurali (69 mm) 1997/98 6.30 1.60 10 0.4 42 2001/02 7.30 2.20 10 0.4 46 Yak Filter (69 mm) 1997/98 17.55 5.10 10 0.4 41 2001/02 18.55 5.70 10 0.4 43 Khurkuri Filter (69 mm) 2001/02 14.40 5.7 10 0.4 52 2002/03 15.50 6.0 10 0.4 51 555 filter (85 mm) 2002/03 75.00 10.60 10 0.4 25 Bidi 2002/03 4.00 0.80 10 … 30 Source: Ministry of Finance/Table 4.1 and Table 4.2. In part due to the continued efforts and recommendations of the Nepal Cancer Relief Society, a measure was adopted by the national parliament to impose a 1 paisa health tax on each cigarette manufactured or imported (100 paisa = 1 rupee). This health tax became effective in 1993/94 and was subsequently increased to 2 paisa in 1994/95. The revenue generated by this tax is earmarked for cancer control. Three-quarters of the revenue from this health tax go to the BP Koirala Memorial Cancer Hospital in the Chitwan district, about 150 km south of Kathmandu, while the remaining 25% is distributed by a cancer committee chaired by the Health Secretary and composed of representatives of the Ministry of Finance and the Ministry of Health, and cancer hospitals. Recently, this health tax has been raising about Rs 200 million (approximately US$ 2.5 million) annually. It is worth noting that since 1994/95, the health tax has not increased in nominal terms and hence has been eroded by overall inflation. The real value of 2 paisa has fallen by more than 90% since 1994–95. Differently put, 2 paisa in 1994/95 are worth about 0.15 paisa in 2002/03. There is an urgent need to increase the health tax to its previous level of 2 paisa in 1994/95 rupees. To achieve this, the health tax should be raised to about 44 paisa in 2003. Trends in government revenue Table 4.4 presents trends in government revenue from tobacco products in real 1995/96 million rupees. Tobacco tax revenue has remained very stable from 1985 on in real terms. About Rs 2.5 thousand million (US$ 50 million) have been collected annually in tobacco taxes. Table 4.5 shows total tobacco tax revenue along side total tax revenue and total government revenue. As government total tax and other revenues have risen, tobacco tax revenue’s share of total tax revenue has decreased quite dramatically from more than 30% in 1985 to about 11.5% in 1998/99. The proportion of tobacco taxes in total revenue follows a similar trend.

37
Table 4.4. Revenue from tobacco products, Nepal, 1984/85 to 1998/99
(real 1995/96 million Rs) Year Excise Sales tax/VAT Import tax Other Total Cigarette Bidi 1984/85 458 1689 230 88 28 24931985/86 480 1503 205 114 25 23261986/87 514 1597 202 130 25 24671987/88 580 1616 170 146 21 25321988/89 555 1376 141 152 17 22411989/90 607 1719 100 160 10 25961990/91 689 1738 58 174 6 26641991/92 748 1503 53 162 5 24711992/93 797 1552 49 242 5 26451993/94 766 1245 30 173 3 22171994/95 785 1278 26 224 3 23161995/96 879 1505 20 220 2 26261996/97 999 1235 16 239 2 24901997/98 1146 1083 21 125 2 23771998/99 1091 933 70 446 7 2546Source: personal communication, Tax Department, VAT Office, Ministry of Finance, and budget speeches 1984/85 to 1998/99; Custom data, foreign trade statistics, Department of Customs, 1996/97 to 1997/98 and 1998/99; personal communication, Statistics Unit, Custom Department, MOF. Table 4.5. Total government revenue and total tobacco products revenue, Nepal, 1984/85 to
1998/99 (1995/96 million Rs)
Year Tobacco tax revenue
Total tax revenue
Total revenue
Tobacco tax as % of total tax revenue
Tobacco tax as % of total revenue
1984/85 2 493 8 098 10 077 30.8 24.71985/86 2 326 8 531 10 816 27.3 21.51986/87 2 467 9 161 12 537 26.9 19.71987/88 2 532 11 297 14 440 22.4 17.51988/89 2 241 11 232 13 893 20.0 16.11989/90 2 596 11 934 15 230 21.8 17.01990/91 2 664 12 801 16 792 20.8 15.91991/92 2 471 12 848 17 568 19.2 14.11992/93 2 645 13 897 18 057 19.0 14.61993/94 2 217 16 725 21 306 13.3 10.41994/95 2 316 20 373 25 503 11.4 9.11995/96 2 626 21 670 27 890 12.1 9.41996/97 2 490 22 865 28 436 10.9 8.81997/98 2 377 20 819 26 437 11.4 9.01998/99 2 546 22 081 28 610 11.5 8.9Source: economic survey, 1999–2000:76–9; Ministry of Finance; and Table 4.4.

38
4.2. Smuggling of tobacco products
Although no specific study has been done to estimate the extent of smuggling of tobacco products into and from Nepal, various reports indicate that smuggling is a significant problem. As mentioned earlier in this report, the local production of cigarettes did not meet the consumption requirements of the country even as early as the 1960s. It was then felt that because of the unguarded border with India on three sides of the country a sizeable part of cigarette imports went unrecorded (Devkota GM, 1968). In recent years smuggling of many commodities, including tobacco products (both smoking and non-smoking), through various entry points on the Nepal–India and Nepal–China (Tibetan region of China) borders and via Bangladesh has become a common phenomenon. Nepal is surrounded by India on three sides—east, south and west—and by the Tibetan region of China to the north. To the east Bangladesh is only about 12 kilometres away. On the Nepal–India border there are 24 customs posts and on the Nepal–China border there are four such posts. The eastern Kakarbhitta border customs post, besides being used as a Nepal–India border post, is also used as Nepal–Bangladesh post. These 28 posts are Nepal’s main entry/exit trade routes. It is thought that since the introduction of value-added tax on 16 November 1997 (Marasaini MK, 1999) tax and customs evasion and smuggling across the border between India and Nepal (Kantipur, 16 June 1999) have been on the increase. Many families make their living by smuggling goods through the Nepal–India open border. Small business houses do not need to keep records of their trade, which in a way encourages smuggling. Most smokeless tobacco products such as khaini, jarda and pan parag are smuggled into Nepal from India through these porous borders and are sold on the waysides as cheaply as in India (Deshantar weekly, 20 September 1998). According to another newspaper report, organized smuggling is common at the border entry/exit points. Government customs officers are reported to be of the opinion that high-powered people are behind these organized smuggling activities (Kantipur, 23 December 2000). It is not known what volume of tobacco products are smuggled out of the country and what volume is imported into the country. According to one newspaper report a businessman was fined Rs 7.2 million for importing khaini from India without paying value-added tax (Kantipur, 8 July 2001).
4.3. The demand for tobacco products in Nepal The inverse relationship between the consumption and the price of tobacco products is well known (see for example World Bank, 1999). Figure 4.2 shows the real price of a pack of 20 cigarettes in Nepal along side per capita consumption. Per capita consumption is estimated from cigarette production, import and export data weighted by the adult population 15 years and older. As expected, there is a close relationship between these two variables.1 As real cigarette prices fell in the 1970s and 1980s, per capita consumption increased almost four-fold.
1 Correlation coefficient r is –0.90 (n = 29).

39
Figure 4.2. Real cigarette prices (1995 Rs) and per capita cigarette consumption
0
100
200
300
400
500
600
700
800
1972 1976 1980 1984 1988 1992 1996 2000
Year
Per
cap
ita c
igar
ette
con
sum
ptio
n
0
2
4
6
8
10
12
14
16
18
Rea
l cig
aret
te p
rice
s (1
995
Rs)
Source: Nepal Rastra Bank/WHO
Prices
Consumption
Household level analysis In the context of Nepal, an attempt has been made to examine the demand for tobacco products using household data from the smoking behaviour survey carried out in 2000 for this paper. Data The smoking behaviour survey, in addition to collecting data on tobacco use prevalence and consumption of tobacco products, which were presented in section 3, collected information on household expenditure categories in the 12 months prior to the date of survey (November and December 2000). Expenditure Based on the data collected from the survey, the expenditure items were categorized into five groups: food, energy and clothing; education and health; expenditures on tobacco; consumer durables and other expenses (see details in Appendix 6). The average annual total household expenditure, according to the smoking behaviour sample survey, was estimated at Rs 54,250 or US$ 736.59 (Table 4.6). In the urban areas it was estimated at Rs 67,046 and in the rural areas it was Rs 52,671. The average annual household expenditure was highest in the hill region (Rs 78,587), followed by the Tarai region (Rs 48,130), and the mountain region was the lowest (Rs 28,631). In all regions the mean annual household income was higher than the mean annual household expenditure.

40
Table 4.6. Household expenditure groups by region and residence, Nepal, 2000 (Rs)
Food, energy and clothing
Tobacco products
Education and health
Consumer durables
Other expenses
Total
Mountain Mean 16 579 3 405 2746 608 5 293 28 631 % 57.90 11.89 9.59 2.12 18.49 100.00 Hill Mean 47 171 1 846 18 113 4 726 6 731 78 587 % 60.0 2.3 23.0 6.0 8.6 100.0 Tarai Mean 32 516 1 698 8 126 2 299 3 491 48 130 % 67.56 3.53 16.88 4.78 7.25 100.00 Rural Mean 33 659 1 916 9 591 2 714 4 791 52 671 % 63.9 3.6 18.2 5.2 9.1 100.0 Urban Mean 43 834 1 916 15 489 3 242 2 565 67 046 % 65.4 2.9 23.1 4.8 3.8 100.0 Nepal Mean 34 777 1 916 10 239 2 772 4 546 54 250 % 64.1 3.5 18.9 5.1 8.4 100.0 Source: Authors’ survey. Data on different types of expenditures revealed that food etc.(expenditure on food items: cereals, beans, fruits, meat, fish, milk, oil, etc., clothing and fuel items such as kerosene, gas, fire wood, etc.) accounted for over 64% of all household expenditure, followed by education and health at nearly a fifth (18.9%), other expenses (expenses on ceremonies and legal matters) 8.4%, consumer durable items (5.1%), and expenditure on tobacco products was 3.5% of total expenditures on average. This pattern held true for all households regardless of place of residence and region except in the high mountain region, where expenses on tobacco products were the highest at nearly 12% of total expenditures. The poorest two income groups spent nearly 70% of the total annual household expenditure on basic needs: food, clothing and fuel wood (Table 4.7). They spent about 5% of their total annual expenditure on tobacco products. Among the middle-income groups—third and fourth quintiles—the expenditure on tobacco was over 3%. The highest income group spent 2.3% of its total expenditure on tobacco. The average annual total household incomes of the bottom three income groups were less than the average annual total household expenditure. Only for the top two income groups was the annual income higher than annual expenditure.

41
Table 4.7. Household expenditure by income group, all households, Nepal, 2000
Quintile Food, energy and clothing
Tobacco products
Education and health
Consumer durables
Other expenses
Total
1 Mean 26 997 1 730 5 145 1 856 3 454 39 182 % 68.9 4.4 13.1 4.7 8.8 100.0 2 Mean 27 493 2 232 4 466 1 583 3 527 39 301 % 70.0 5.7 11.4 4.0 9.0 100.0 3 Mean 34 271 1 747 7 054 2 747 3 988 49 807 % 68.8 3.5 14.2 5.5 8.0 100.0 4 Mean 36 749 1 817 9 040 2 740 4 593 54 940 % 66.9 3.3 16.5 5.0 8.4 100.0 5 Mean 48 395 2052 25 524 4940 7174 88 086 % 54.9 2.3 29.0 5.6 8.1 100.0 Total Mean 34 777 1 916 10 239 2 772 4 546 54 250 % 64.1 3.5 18.9 5.1 8.4 100.0 Source: Authors’ survey. Household expenditure information was also collected in the tobacco cultivation survey and is presented in section 2. Table 4.8 illustrates the annual expend iture on tobacco products relative to total annual expenditure for tobacco-using households only (Table 4.7 averaged tobacco expenditures over all households). The results show that the share of tobacco expenses was more than 7% of total expenditure, which is not negligible. This relative expenditure is also shown by income quintile. The share of expenses on tobacco products for lowest- income households was very high (9.62%), especially when compared to the share of the highest income group (5.11%). The share of expenses on tobacco products decreased gradually as the households’ revenue increased. This shows clearly that the burden of tobacco use is heavier on poorer households than it is on richer households even though higher- income households spent more on tobacco products than poorer households did.
Table 4.8. Tobacco-using households’ expenditure on tobacco products* Overall Income quintile 1 2 3 4 5 Mean 2670 2301 2922 2336 2596 3206 % 7.12 9.62 8.69 6.143 5.75 5.11
* Expenditure on tobacco products (all tobacco products used in Nepal) as a percentage of total expenditure. Consumption of tobacco products The survey asked a specific question regarding the quantity of cigarettes and bidi consumed but it did not address other products (hukka, kakkad/sulfa, khaini, pan parag, etc.); the questionnaire asked households if they consumed hukka or kakkad/sulfa, but there was not a question about the quantity used. Households were also asked if they consumed khaini, but not about the quantity

42
consumed. Other tobacco products were not covered. There were however two questions regarding the quantity of own-grown tobacco and bought tobacco consumed by the household in kilograms, but it was not specified if this “tobacco” covered all tobacco products, including for instance bidi. Consequently, it was not possible to use these data because of underreporting, nor it was possible to add these quantities to the quantities of cigarettes and bidi consumed because of possible overlap in the calculation. In addition, 32.4% of individuals consume cigarettes and bidi (compared to a proportion of 37.4% of current smokers) whereas 6% of individuals consumed other smoked tobacco products and 11.3% of individuals consumed khaini. Methodology Due to the data limitation explained above, the estimation focuses on the consumption of cigarettes and bidi. In order to measure the responsiveness of tobacco consumption to changes in the price of tobacco (price elasticity), we need to estimate three parameters: elasticity of smoking participation, conditional price elasticity and total price elasticity. The price elasticity of smoking participation represents the impact of changes in price on the percentage of individuals who smoke. The conditional price elasticity indicates the responsiveness of the amount smoked to changes in prices among individuals who smoke. The total price elasticity includes both of those elasticities and shows the overall impact of a change in price on the quantity smoked. The elasticities were calculated as follows. Non-smokers did not report any expenditure on tobacco products, so no data was collected for these individuals on the price of tobacco products. It is assumed that they face the same tobacco product prices as other similar households that do smoke. So cigarette and bidi prices for non-smokers are first estimated from the data on smokers. 1. Estimate tax independently of whether a person is a smoker or not (in order to generate a price for non-smokers):
)(YfTax = => estimate Tax' and replace its values where we have no tax values in our Tax data (where non-smokers answered) => compile Tax* 2. Estimate price independently of whether a person is a smoker or not (in order to generate a price for non-smokers):
),,,,,( AgricUrbanEducLiteracyYTaxfP = => estimate P ' and replace its values where we have no price values in our P data (where non-smokers answered) => compile P* 3. Estimate of the probability of smoking as a function of price, income, age, gender, literacy, education, urban/rural residence, marital status, and occupation:
)*( 10987652
422111
1MarriedUrbanAgricEducLiteracyFemaleAgeAgeYPsmoke
ep
ββββββββββα ++++++++++−+=
And calculate )1(1
*1 smokersofProportion−×= ββ = price elasticity of smoking participation

43
4. Estimate consumption equation (for smokers only):
BidiAddictMarriedUrbanAgricEducFemaleAgeAgeYPC
ψ+µ+ϑ+τ+κ+λ+ς+∂+γ+δ+β+α= 2
β = conditional price elasticity for smokers 5. Total price elasticity = ββ +*
1 where C = cigarette and bidi monthly consumption (per stick) P = price of cigarettes or bidi in rupees (expenditure on cigarettes and bidi/consumption of cigarettes and bidi) (per stick) Y = per capita monthly income in rupees (household income divided by the number of individuals in the household) Tax = cigarette tax (50% of the cigarette price) or tax on bidi (30% of the price of bidi) in rupees (per stick) Age = age of the individual (15 years and up) Female = sex dummy =1 if the person is a female and =0 if the person is a male. Literacy = dummy variable =1 if person is literate and =0 otherwise. Educ = dummy variable =1 if person has completed high school (at least 10 years of schooling) and =0 otherwise. Agric = dummy variable for occupation, =1 if the person is a farmer and =0 if not. Urban = dummy variable for place of residence, =1 if the person lives in the urban area and =0 otherwise. Married = dummy variable for marital status, =1 if the person is married and =0 otherwise. Addict = addiction variable corresponding to the numbers of years of smoking. Bidi = dummy variable =1 if the person smokes bidi and =0 if the person smokes cigarettes. The logarithmic values of the data are used for the estimation. The probability of smoking was estimated in a logit model, and the consumption equation estimated with ordinary least squares. The price elasticity was estimated for all the population and also by age group and income group.

44
Results are shown below (the proportions of smokers by age and income group are listed in Appendix 6). The income elasticity was estimated following the same method. A Hausman test was performed in order to test whether the price data were endogenous. The test is applied to all the logit and consumption equations. The results are provided in Appendix 7. Results show that for all the different estimations the price is exogenous. Results Price elasticity Table 4.9 shows that the total price elasticity for the whole population is –0.882 and significant, which means that an increase in the price of 10% will reduce tobacco consumption by 8.82%. The values of the elasticity of smoking participation and the conditional elasticity of demand are close (–0.459 compared to –0.423); this means that an increase in the price of tobacco has almost the same effect in reducing the quantity of tobacco consumed by smokers as on the decision to quit smoking. Table 4.9 also shows the reaction to price changes by age group. The price elasticities are all negative and most are significant. Young individuals tend to be more responsive to prices than older individuals. This is so for three reasons. First, because tobacco use is highly addictive, older and hence usually longer term users are less able to quit and reduce their consumption when facing higher prices (Lewit et al., 1981). Secondly, youth smoking is believed to be more determined by peer pressure than adult smoking. In other words, the effect of the price increase will be compounded because of peer pressure (Lewit et al., 1981). Thirdly, because younger individuals tend to have less income than their older counterparts, it is more difficult for the young to absorb a price increase (Grossman and Chaloupka, 1997).
Table 4.9. Price elasticity for the overall population and by age groups
Overall Age group
15–24 25–34 35–44 45–54 55–64 65+ Logit coefficient on price
–0.733*** (0.125)
–1.535 (0.995)
–0.75*** (0.32)
–0.636*** (0.243)
–0.607*** (0.253)
–0.839*** (0.351)
–0.884** (0.374)
Elasticity of smoking participation
–0.459 –1.32 –0.449 –0.306 –0.263 –0.355 –0.459
Conditional price elasticity of demand
–0.423*** (0.044)
–0.559* (0.289)
–0.496*** (0.111)
–0.38*** (0.083)
–0.342*** (0.102)
–0.327*** (0.099)
–0.641*** (0.128)
Total price elasticity
–0.882 –1.879 –0.945 –0.686 –0.605 –0.682 –1.1
***, ** and *: Significantly different from 0 at the 1%, 5% and 10% levels respectively. Figures in brackets represent the standard deviation.

45
The results in Table 4.9 confirm this theory except for individuals in the oldest age group, 65 years and more, where price elasticity seems to be also very high. An explanation could be that the individuals belonging to the oldest group are more sensitive to changes in the price of bidi or cigarettes because they can switch more easily to other more “conventional” tobacco products since they are less influenced by international brand advertising and the fashion for using tobacco products, which is not the case for younger persons. They are also likely to have lower incomes. Table 4.10 shows estimations by income group. The population was distributed among five income groups ranging from the poorest to the richest. The price elasticities are found to be negative and significant. As expected, there is a downward trend in price elasticity as households get richer. Poorer households are more sensitive to changes in tobacco prices than households with higher incomes. Surprisingly, households in the lowest quintile seem to be less sensitive to price changes than households belonging to the second and third quintiles.
Table 4.10. Price elasticity by income quintile
Income quintile Lowest 2 3 4 Highest Logit coefficient on price
–0.868*** (0.31)
–0.771*** (0.278)
–0.909*** (0.3)
–0.865*** (0.311)
–0.758*** (0.289)
Elasticity of smoking participation
–0.312 –0.255 –0.346 –0.346 –0.313
Conditional price elasticity of demand
–0.478*** (0.092)
–0.608*** (0.096)
–0.479*** (0.121)
–0.283*** (0.103)
–0.291*** (0.106)
Total price elasticity –0.79 –0.863 –0.825 –0.629 –0.604 *** significantly different from 0 at the 1% level. Table 4.11 illustrates the reaction of individuals to price changes depending on their geographical location. Price elasticities are negative and significant. Urban residents seem to be more sensitive to price changes than rural residents. This is probably because tobacco prices are higher in urban areas and residents there are not ready to pay more on tobacco products than they actually do. Price is then a stronger incentive to quit or reduce smoking in urban locations compared to rural locations.
Table 4.11. Price elasticity by geographical location Geographical location
Urban Rural Logit coefficient on price –0.75
(0.597) –0.754*** (0.13)
Elasticity of smoking participation
–0.533 –0.503
Conditional price elasticity of demand
–0.49*** (0.192)
–0.418*** (0.045)
Total price elasticity –1.023 –0.921 *** significantly different from 0 at the 1% level.

46
Income elasticity Table 4.12 illustrates responses in tobacco consumption to changes in income. For the overall population, the total income elasticity is positive and significant but does not have a very high value. An increase in income of 10% will only increase consumption by 1.77%. Regarding the estimation of the income elasticity by age group, results are not significant but for most of the age groups, an increase in income would increase tobacco consumption. The income elasticity for the youngest age group is negative, but not significant. This result is counterintuitive as it would mean that younger individuals would decrease their tobacco consumption if their income increased. However, the data reflect differences in current consumption patterns among young people, and it may not be valid to infer dynamic effects.
Table 4.12. Income elasticity for the overall population and by age group
Overall Age group 15–24 25–34 35–44 45–54 55–64 65+ Logit coefficient on income
0.105 (0.077)
–1.341 (0.942)
0.23 (0.207)
–0.034 (0.142)
0.206 (0.174)
0.459* (0.217)
0.129 (0.239)
Elasticity of smoking participation
0.066 –1.153 0.138 –0.016 0.089 0.194 0.067
Conditional income elasticity of demand
0.111*** (0.028)
0.163 (0.286)
0.103 (0.067)
0.065 (0.053)
0.117* (0.063)
0.127* (0.067)
0.182*** (0.08)
Total income elasticity
0.177 –0.99 0.241 0.049 0.206 0.321 0.249
*** and *: significantly different from 0 at the 1% and 10% levels respectively. Theory suggests that people react differently to changes in income depending on the level of income. Table 4.13 illustrates the reaction of individuals to changes in income by income group. Results are not significant and not stable.
Table 4.13. Income elasticity by income quintile
Income quintile
Lowest 2 3 4 Highest Logit coefficient on income
0.373 (0.31)
–1.467 (1.227)
–2.778*** (1.271)
0.185 (1.068)
0.093 (0.227)
Elasticity of smoking participation
0.134 –0.485 –1.058 0.074 0.038
Conditional income elasticity of demand
0.14 (0.1)
–0.242 (0.436)
0.705 (0.45)
–0.175 (0.395)
0.138 (0.086)
Total income elasticity 0.274 0.727 –0.353 –0.101 0.176 *** significantly different from 0 at the 1% level.

47
Table 4.14 shows the income elasticity of individuals by geographical location. Urban residents seem to react slightly more in increasing their consumption when their income increases, although most of the coefficients are not statistically significant.
Table 4.14. Income elasticity by geographical location Geographical location
Urban Rural Logit coefficient on income 0.058
(0.333) 0.121 (0.08)
Elasticity of smoking participation
0.041 0.081
Conditional income elasticity of demand
0.172 (0.139)
0.109*** (0.028)
Total income elasticity 0.213 0.19 *** significantly different from 0 at the 1% level.
4.4. Simulation analysis: tobacco taxes as a revenue-generating tool As demonstrated earlier, higher prices will lead to reduced consumption and, hence, better health. This alone should justify tobacco tax increases. However, in addition to the health benefits they create, tax increases also generate additional government revenue. This has been seen in countries around the world and is contrary to the misconception that lower consumption necessarily means lower tax revenue. This is because while price increases do lead to decreases in consumption, these decreases are proportionately less than the price increases. In order to show the revenue-generating potential of tobacco taxes in Nepal, a scenario that simulates the effect of a 5% annual increase in real prices is contrasted to a baseline scenario of constant real prices. From the household analysis results presented earlier, price and income elasticity estimates of –0.9 and 0.18 are used. It is further assumed that the entire 5% real price increase is driven entirely by higher tax rates and that real GDP per capita in the region would grow at an annual rate of 4%. This is a fairly conservative estimate in light of the latest detailed projections published by the International Monetary Fund (International Monetary Fund, 2002). Government revenues from tobacco taxes are simulated to 2010 from a 1998 baseline. All other factors that might influence the consumption of tobacco products are assumed to remain the same. Table 4.15 presents the results of the simulation. These results suggest quite clearly that following WHO’s recommendation to increase tobacco prices by 5% in real terms annually would not only reduce tobacco consumption and improve health outcomes but would also significantly increase government revenue. The cumulative revenue gain from increasing tobacco prices by 5% in real terms annually are quite significant. For example, it is estimated that this policy could bring in an

48
extra Rs 27,265 million (US$ 440 million) in Nepal over the period 2000–10, while reducing per capita cigarette consumption to 60% of the likely level in 2010 at constant cigarette prices.
Table 4.15. Potential revenue from tobacco taxes
Cigarette consumption (sticks per capita)
Revenue gain (million Rs)
Revenue gain (US$ million)
Tax incidence
Constant prices
5% price increasea
Annual Cumulativeb Annual Cumulativeb 5% price increasea
Baseline 574 … … … … … 40
2005 673 499 2,426 9,803 39 158 59 2010 743 457 4,259 27,265 69 440 68
a in real terms. b From 2000. Source: Guindon, Boisclair and Perucic 2003.
5. HEALTH AND TOBACCO CONTROL
5.1. Health consequences of tobacco use People in Nepal, particularly the rural population, are largely unaware of the health risks of tobacco. For them consumption of tobacco either through smoking or by chewing khaini or putting dry tobacco leaf in the mouth is a social habit and part of meeting with friends and relatives. For some it is also a status symbol. Ignorance of the health risks of tobacco is perhaps due to the fact that it takes 30 to 40 years for a smoker to die because of smoking. However it is well proven that many premature deaths, disabilities and diseases are caused by tobacco consumption. In Nepal recent data on smoking-related diseases are not available but a study by Pandey et al. (19881) showed a high prevalence of chronic bronchitis (33.9% among men and 28.3% among women) and chronic obstructive lung disease. Prevalence of tobacco use combined with the use of unventilated indoor fires for cooking and heating produce high rates of lung disease in Nepal. A report in 1998 noted that there were 60,000 cancer patients in Nepal in 1997 (Kathmandu post, 29 January 1998). The number was arrived at by collecting data from six hospitals. It was reported that the “consumption of cigarettes and tobacco coupled with the ever growing environmental pollution has its share in the alarming growth of cancer cases”. Another recent study reports gutkha chewing becoming increasingly popular in the Tarai of Nepal. Gutkha is a mixture of processed betel leaves, betel nut, catechu, lime and tobacco. Gutkha can cause cancer of the mouth, stomach and liver (Kathmandu post, 13 February 2001).
1 The data for this study were from one of remotest areas of Nepal—Jumla, in the north-west—and were collected in May 1981 (see Pandey et al., 1988:18).

49
It appears that although the general public is not very aware of the health consequences of tobacco consumption1, the government, nongovernmental organizations and the private sector are concerned. Deaths and medical costs of smoking Smokers are likely to suffer from major chronic diseases, including cancers, stroke, heart diseases and chronic obstructive pulmonary disorder, and they are likely to require more health services such as outpatient visits, inpatient admissions and bed-days than non-smokers each year, and smokers are afflicted with chronic illnesses at an earlier age than non-smokers. Smoking-attributable economic costs include direct costs – the costs of treatment of tobacco-attributable illnesses, and indirect costs – loss of income while ill or from death at an early age. Direct costs stem from the use of medical services technology and skills and also from costs incurred in obtaining medical care. Direct costs include: • outpatient services (physician fee, nurses, pharmaceuticals, physical and biological exams) • inpatient services • long-term care at home or in nursing homes • transportation costs incurred by the patient and family • family costs: time spent on taking care of patients. The indirect costs are: • indirect morbidity costs: loss of earnings and benefits while ill • premature death: loss of future earnings. The cost of treating tobacco-related illnesses in Nepal was not possible to determine. However, the burden of illness due to smoking is significant in Nepal. Much needs to be done in order to give a full account of the burden of tobacco use in Nepal. The incidence of key tobacco-related illnesses such as lung cancer, strokes, heart diseases and COPD need to be determined. The tobacco-attributable fraction needs to be estimated2, and treatment costs for each disease episode estimated, as well as the other direct and indirect costs, to arrive at an estimate of this part of the cost of tobacco to the people and government of Nepal. This would require special data collection efforts in Nepal, that were beyond the scope of this study.
1 According to the Nepal smoking behaviour survey, 2000, less than 23% of the population surveyed answered “yes” to the following question: “Are you aware of any sources of information that talk about tobacco products?”. 2 Epidemiologists have developed a formula for estimating the population-attributable risk for a disease. The population-attributable risk (PAR) is the proportion of disease in a population that results from a particular risk, such as tobacco use. The PAR for any specific disease, from smoking can be estimated by the follow formula: PAR = p(RR – 1)/{1 + p(RR – 1)}, where RR is the relative risk or likelihood that smokers will develop a particular disease compared with non-smokers, and p is the smoking prevalence among the population. Neither RR nor PARs have been calculated for Nepal, but estimates are available for the Chinese population 35 years of age and over (see Appendix 9). If tobacco initiation and intensity of use differ across countries (and societies), RR for different illnesses may be country (or society)-specific. Genetic or other factors could also influence RRs; for example, the Chinese RR differ substantially for some diseases from the RR calculated for American and British populations. Judgements need to be used to decide which available RRs to use when estimating PARs in countries for which data are not available to estimate country-specific RRs.

50
5.2. Tobacco control measures The Ministry of Health is actively engaged in controlling tobacco use in the country. The Ministry’s National Health Education, Information and Communication Centre (NHEICC) is primarily responsible for carrying out health education and communication programs against smoking. Anti-smoking communication campaigns are carried out using all channels of communication—radio, print media, hoarding boards, television and video—and through workshops across the country. In 1992 the Ministry of Health formed a national anti-tobacco committee with representatives from nongovernmental organizations and the private sector. The committee introduced (1993/94) a levy on each cigarette, and this money is put into a fund, which is used to improve the health of the general public. The committee also observes anti-tobacco day every year. The government of Nepal has made it compulsory for tobacco products to carry health warning such as “Smoking is injurious to health”. However, the warnings appear in very small type on the side of cigarette packages, and are unlikely to have any noticeable impact. In the fiscal year 1997/98, the government banned advertisements of tobacco on electronic media (television and radio). However, advertisement is rife in print media and on large outdoor billboards, and there are promotional activities that are likely to appear specifically to young people, such as music concerts. One third of secondary school students surveyed in January 2003 reported that they had seen pro-tobacco advertisements during the past 30 days.1 Since 1992 smoking has been banned in public places such as hospitals, public transport, cinemas and government buildings. However, casual observation shows that compliance with the bans are poor and they are not enforced. There is a long way to go to protect the public in Nepal from second-hand smoke. In 2000, the government drafted a bill entitled “Smoking (prohibition and control) act 2057 (2000)”, which has not yet been approved by the government but is thought to be likely to be approved. This act calls for banning the use of tobacco and tobacco products in all public places. It would also ban selling of tobacco products to minors and put additional restrictions on advertising of tobacco items, including in the print media. In recent interactions between representatives of tobacco manufacturing companies, advertising agencies and government officials, those opposed to the new legislation complained that the act would restrict the right to information of a citizen in a free society2. Similar objections have been raised in other countries and overruled in some (such as South Africa, Australia and Thailand) and sustained in others (the United States). In Bangladesh, a High Court decision in 1999 ruled that promoting the use of cigarettes was contrary to the Constitutional protection of the right to life, since cigarettes kill half of all long-term users. 1 Paudel, 2003. The survey covered 2,032 students in 18 secondary schools in Pokhara Sub Metropolitan City. 2 This interaction programme was organized by the tobacco manufacturers in Kathmandu as a protest against the government ban on advertising tobacco products through electronic media such as radio and television. It took place on 22 December 2000 (Kantipur, 23 December 2000, Kathmandu, Nepal).

51
The government of Nepal is concerned with the harmful health effects of tobacco. In its current five-year plan it has approved a plan to complete the construction of BP Koirala Memorial Cancer Hospital in Chitwan—a district situated in the Tarai, south of Kathmandu. Its activities include provision of expert services to cancer patients and conducting health programs against heart disease resulting from modern health-affecting lifestyles such as smoking and drinking (National Planning Commission, July 1998:669). However, there is an urgent need to strengthen the policies and interventions to reduce tobacco use in Nepal, that have proved to be effective and highly cost-effective in other countries, at all income levels.
6. POLICY RECOMMENDATIONS A review of secondary information on tobacco use and tobacco economics and the analysis of the primary data on smoking behaviour and tobacco cultivation reveal several important issues related to tobacco use and economics in Nepal. In order to address these issues the research team has made the following recommendations to the government of Nepal for immediate action. Nepal must give high priority to these recommendations because the prevalence of smoking in Nepal is high by world standards. The overall smoking prevalence in Nepal for the population aged 15 or more is estimated at 37.4%, and it is higher (47.4%) among males than among females (27.6%). These rates are higher than all regions of the world except eastern Europe and central Asia, where the overall smoking prevalence is reported to be 41% and the corresponding figures for males and females are 59% and 26% (World Bank, 1999). Translating the Nepal smoking prevalence rates into absolute number yields 5.2 million smokers (3.2 million males and 2 million females) in the country in 2000. Efforts must be made to reduce this number as fast as possible, to prevent unnecessary disease and early deaths. Increase tax rates on all tobacco products On the basis of the evidence presented in this report it is clearly seen that the consumption of cigarettes and bidi can be influenced through variations in real prices. This finding has enormous implications for tobacco control in Nepal. The Nepalese government’s mass communication efforts in health education are hindered by the country’s diverse linguistic subcultures. Besides, because of resource constraints, the government finds it difficult to give priority to smoking control, given the pressing need to address the problems of infectious diseases and malnutrition. An excise-led smoking control policy would reduce smoking and simultaneously satisfy the Department of Customs requirements for what is an easily collected and bountiful source of revenue. The result of the exercise in this report suggests that each 10% increase in the price of cigarettes and bidi will decrease consumption by about 9%. The tax rate increases that would cause prices to rise would increase total tobacco tax revenues. As noted earlier the population of Nepal is growing at more than 2% per annum, resulting in an increasing number of individuals starting smoking. It has been found that the growth in the number of smokers is above 5% per annum. The price elasticity analysis reported here shows that

52
taxation policy could be a powerful instrument to reduce smoking in this expanding potential market. Higher prices could reduce tobacco consumption rapidly, possibly faster than any other realistic instrument of public health policy, and hence produce health benefits for millions of people. It is estimated that a 5% real price increase in tobacco products would reduce per capita cigarette consumption in Nepal dramatically – by about 60%, compared to the projected increase in consumption if cigarette prices remain constant in real terms. The data in this report show that the poor are highly sensitive to price change. A policy of increasing the real price of cigarettes and bidi would help particularly that section of the population which has less income at its disposal; the amount saved from not smoking could be used for food, health care, education and other basic needs and thereby contribute to the production of a more skilled and educated population and social development. Thus it would contribute to poverty reduction and quality of life in the country. It is primarily the poor who smoke bidi, and the tax level on this product is very low. Nevertheless, bidi are, as the present survey shows, a significant tobacco product—among all smokers some 9% smoke bidi. More tax would mean a higher price, which will discourage consumption of bidi. The other tobacco products such as khaini, pan parag and gutkha are also taxed but at a very low rate. Khaini, pan parag and gutkha chewing are increasingly becoming popular in all parts of the country, although this habit was not found in the hills and mountains of Nepal until some 15 years ago. The sample survey found 9.4% of population 10 years of age and over using khaini. The authors inquired about the use of khaini in remote hill and mountain districts too, where khaini was found sold in little tea and grocery shops. One of the main reasons for the increasing popularity of khaini is its heavy promotion through the media. With increased pricing on cigarettes and bidi, people may switch to smokeless tobacco products. In order to prevent this switching therefore and make the population feel the pinch of the economic cost of consuming smokeless tobacco products it is necessary to increase taxes on these products as well. This will increase the revenue of the government as well as reduce the consumption of these products. We therefore recommend that taxes be used to ensure that the price of all tobacco products increases by at least 5% in excess of inflation every year, as recommended by the World Health Organization. In light of the fact that the health tax has not kept up with inflation and has fallen in value by more than 90% during the past decade, it is recommended that the health tax be increased immediately to at least 44 paisa on each cigarette. It is also recommended that the value of the health tax, at the very least, keep pace with overall inflation. Control smuggling of tobacco products Because of the open border with India on three sides—east, south and west—smuggling of commodities between Nepal and India is common. Matters are not helped by the rampant corruption prevailing in Nepal. Because corruption is serious the present government introduced a bill into parliament with the hope of controlling it (Kantipur, 31 July 2001). Up to now, the bill is still pending. Although no Nepal-specific study has been done on smuggling and corruption,

53
studies elsewhere clearly show that tobacco smuggling tends to rise in line with the degree of corruption in a country (World Bank, 1999). It can therefore be safely concluded that corruption must be controlled in order to stop smuggling of tobacco products. In order to control smuggling of tobacco products through the open borders of Nepal and India clear and visible excise stamps should be introduced and required on all tobacco products sold in Nepal. No product should be allowed to be traded otherwise, and fines imposed for those found selling tobacco products without excise stamps. Strengthen tobacco control measures The Nepalese government has adopted several anti-tobacco measures such as requiring health warnings on cigarette packages and banning advertisement on the electronic media. But the tobacco companies still invest heavily in tobacco promotion, advertisements are highly visible on billboards and print media, and the health warnings are weak, tiny and probably ineffectual. For the greater benefit of the people, the government should pass the newly drafted bill in the parliament to make it a legal act. Nepal needs to enforce smoke-free policies in public places, ban all advertising and promotion of tobacco products through all media and channels, and require large, strong, clear health warnings on all tobacco products, preferable adopting global “best practice” of using pictures to make the messages accessible to illiterate people and increase their impact. The proposed law would also make it mandatory to obtain a licence to sell any tobacco products, and prohibits sales to minors, etc. Much stronger, proven measures to reduce the consumption of tobacco products in Nepal will in turn improve the health of the people. Improve surveillance and research The study team had frustrating experiences in trying to learn about the production and consumption of different tobacco products, particularly bidi and smokeless tobacco products. Despite several attempts to collect information on the production and consumption of bidi and smokeless tobacco products, no records were available. The government must therefore introduce a system which requires all manufacturers and dealers of bidi and smokeless tobacco products to keep records of production and sales. The government must also have a section dealing with record-keeping of all production and sales of bidi and smokeless tobacco products. This will ensure keeping track of revenue collection; discourage the black market and control corruption. Commercial tobacco cultivation is not an attractive occupation for farmers in Nepal for several reasons. First, farmers say they do not make money from tobacco cultivation as the expenses incurred in farming tobacco are more than the return from it. Although tobacco cultivation for domestic use was prevalent in the Tarai for many years, tobacco cultivation for commercial purposes started fairly recently in the early 1960s. The farmers are willing to give up tobacco cultivation if some alternative could be provided. They are of the opinion that if irrigation facilities could be arranged they would switch from tobacco to rice cultivation. Information on tobacco farming reveals that the farmers involved in this occupation are forced to do so because of the absence of alternative opportunities to make their living in their localities.

54
The total annual household income and expenditure of the tobacco farmers show that no farmer is saving at the end of the year; rather they end up in debt. Their complaints include lack of technical know-how to improve tobacco farming, lack of improved variety of seeds, lack of fuel to process the tobacco raw materials and reluctance of the cigarette factories to buy their farm products on time and at reasonable rates. Paradoxically, despite the tremendous increase in the production of cigarettes over the years, the number of tobacco farmers has declined in the country and the area under tobacco has declined. The local farmers complain that these days raw tobacco is imported from outside the country to the detriment of local farmers. It is therefore recommended that research into alternative livelihoods for tobacco farmers be conducted. This study, because of resource and time limitations, could not look into the health risks and medical costs of tobacco use. Unfortunately secondary data on health risks and medical costs of tobacco use are not available either. Therefore, it is highly recommended that a detailed study on health risks and medical costs of tobacco use be conducted in Nepal. The proposed study should collect information on smoking of cigarettes and use of other tobacco products, and related causes of death and morbidity broken down by region, residence, sex and age, including costs, both direct and indirect. Integrate tobacco control in broader poverty reduction efforts The Nepalese government is implementing a number of health education and public health programs in different parts of the country in collaboration with local and international nongovernmental organizations. In Nepal there are now some 10,555 nongovernmental organizations operating in different parts of the country. Of these 205 are concerned with health, 4,662 with community development, 1,900 with youth development, 844 with women and development, 210 with child welfare and the rest focus on HIV/AIDS, disability, environment, moral development and education (Ghimire, 2000). The authors had an opportunity to visit several nongovernmental organization programs in different parts of the country but unfortunately anti-tobacco programs were given little importance. This large network of nongovernmental organizations could be used to enable an anti-tobacco campaign to reach population in the rural areas of the country. Introducing interpersonal communication (IPC) can reinforce the anti-tobacco messages given through conventional channels. The IPC approach is particularly suitable for an audience that is largely illiterate. Since smoking and consumption of tobacco is a habit, it takes time to change. Attempts to change behaviour call for continuous and effective public education programs. Although the government, through the Ministry of Health’s National Health Education, Information and Communication Centre, has been carrying out these activities, they still need to be drastically improved and made accessible to and easily understood by the general public. There was a big difference between literate and illiterate populations with respect to smoking habits. More than twice the proportion (45.8%) of the illiterate population was found smoking

55
than the literate population (22.3%). Therefore attempts to promote literacy in the country should be expanded and strengthened, and anti-smoking programs targeted at illiterate people. Create a Tobacco Free Initiative unit and tobacco economics unit In view of the seriousness of social and health hazards of tobacco use by the people of Nepal it is now time to give special attention to tobacco control measures. Production and use of tobacco products, particularly cigarettes, bidi and chewing tobacco products, are ever increasing but in relation to this trend the government, including the Ministry of Finance and the Ministry of Health, is not giving enough attention to the problems arising from tobacco use. The Ministry of Health should create a Tobacco Free Initiative unit to coordinate and promote anti tobacco programs including interministerial and government and nongovernmental organization/private sector/donor coordination, IEC/IPC1 and community mobilization activities. At the moment there are anti-tobacco health education activities run by the National Health Education, Information and Communication Centre but this is not sufficient to address the ever- increasing problems of tobacco use in the country. There is a desperate need to stop and prevent the growing number of young people from taking up the habit of smoking and chewing tobacco products. This is much more important in view of the fact that the big tobacco companies are targeting young people through promotional activities throughout the country. The Nepalese government collects, despite leakage and smuggling, some 11% of total government tax revenue from levies put on tobacco products. In order to streamline levy collection from different tobacco products, the Ministry of Finance should create a tobacco economics unit as soon as possible. Strong financial rules should be introduced, implemented and monitored regularly. This will also help control smuggling of tobacco products.
1 Information, education and communication (IEC)/interpersonal communication and counselling (IPC).

56

57
APPENDICES

58
Appendix 1. Health service infrastructure by year
Fiscal year Description
1982–83
1983–84
1984–85
1985–86
1986–87
1987–88
1988–89
1989–90 1990–91
1991–92 1992–93
1993–94
1994–95
1995–96
1996–97
1997/98 1998/99 1999/00 2000/01
Hospital 75 80 80 81 91 96 101 111 111 113 114 114 82++ 82++ 82++ 82++ 83++ 83++ 83++ Health centres 26 26 26 20 20 18 16 16 18 18 18 18 17 17 17 17 13 13 700 Health posts 744 744 744 745 814 816 816 816 816 816 816 801 775 775 754 736 723 711 696 Ayurvedic services centres
113 125 125 135 145 145 155 153 153 165 165 168 167 172 200 230 260 275 275
Sub health posts 0 0 0 0 0 0 0 0 0 200 700 1 300 1 997 2 597 3 187 3 192 3 187 3 179 3171 Primary health centres
0 0 0 0 0 0 0 0 0 0 20 40 59 79 100 120 140 160 180
Hospital beds 2 993 3 058 3 522 3 742 3 842 4 153 4 329 4 572 4 570 4 798 4 848 4 848 3 604 3 604 3904 4 189 4 955 5190 5250 Health staff Doctors 526 572 602 710 863 879 951 951 1196 1497 1497 917+ 952+ 872+ 894+ 894+ 923+ 1259+ 1259+ Nurses 1 820 1 986 2 109 2 223 2 319 2 663 2 980 2 980 2 986 2 986 2 999 2 980 4 606 4 606 4 706 3 588 3 925 4 655 4655 Kaviraj* n.a. 164 164 164 165 165 198 240 240 270 240 193 249 249 290 290 201 211 211 Vaidya** n.a. 114 114 114 114 114 119 130 130 144 144 168 197 197 219 219 195 210 210 Health assistants n.a 778 795 795 795 1 017 1 186 1 186 1 186 3 461 3 461 1 168 4 492 5 092 5 152 5 192 5 295 5 295 5295 Health workers***
1373 2 918 3 345 6 472 7 011 13 462 14337 19 461 19 461 20 442 20 442 24 000 2 400 2 400 3 187 3 190 3 190 3 190 3190
Village health workers
1 600 2 596 2 598 2 626 2 626 3 000 3 000 4 015 4 015 4 015 4 015 4015 4 015 4 015 4 015 4 015 4 015 3985
Other members: trained birth attendants and women health volunteers
n.a. n.a. n.a. n.a. n.a. n.a. n.a. n.a. n.a. n.a. n.a. n.a. 11 049 13 089 55 109 59 719 60 627 60 627 11 049
*Kaviraj is a person trained in traditional medicines. **Vaidya is also a person trained in traditional medicines but he/she also prepares herbal medicines. ***Female community health volunteers (women health volunteers) included in the health workers category from 1987/88 to 1993/94. + Government employees only. ++ Includes government hospitals only. Source: Ministry of Finance. Economic surveys, 1995–96 and 2002–03

59
Appendix 2. Cigarette production 1984–85 to 1998–99
Company 1984–85
1985–86
1986–87
1987–88
1988–89
1989–90
1990–91
1991–92
1992–93
1993–94
1994–95
1995–96
1996–97
1997–98
1998–99
Janakpur Cigarette Factory Public Ltd.** Production (million sticks) 4830 3117 3446 2924 2695 3297 3496 3356 3218 2891 2270 2908 1708 2100 2199 Share (%) 100 65.75 61.54 48.36 47.57 52.19 52.25 48.2 41.01 41.94 30.6 36.05 21.5 25.84 30.06 Surya Tobacco Pvt. Ltd.** Production (million sticks) 0 1164 1293 2003 2226 2473 2748 3053 3393 3934 4998 5091 4647 4053 4458 Share (%) 24.55 23.09 33.13 39.29 39.15 41.07 43.85 43.24 57.06 67.3 63.11 58.5 49.87 60.94 Nepal Tobacco Pvt. Ltd.** Production (million sticks) 0 460 861 1119 744 547 447 554 1235 69 162 68 1589 1974 586 Share (%) 9.70 15.38 18.51 13.13 8.66 6.68 7.96 15.74 1.00 2.18 0.84 20.00 24.29 8.01 Perfect Blend Pvt. Ltd.** Production (million sticks) 0 0 0 0 0 0 0 0 0 0 0 0 0 0 72 Share (%) 0.98 Total production* 4830 4741 5600 6046 5665 6317 6691 6963 7846 6894 7430 8067 7944 8127 7315
Source: * Ministry of Finance, Economic survey, 1999–2000:20. ** Personal communications from Janakpur Cigarette Factory, Surya Tobacco, Nepal Tobacco and Perfect Blended Pvt. Ltd.

60
Appendix 3. Sampling design for Nepal smoking behaviour survey, 2000 Introduction Because of the constraints of time and resources, it was decided to cover 10 districts and select from each of them one village development committee1. From these VDCs a total of 14 wards were selected overall in the hope that about 100 households each would be selected for interview. This gives an average cluster size of 100 households. On the assumption that there would be at least 50% smokers2 in a household of 5.6 members3 a total of 1,400 households were sampled in the hope that some 4,000 individuals would be interviewed for the smoking behaviour survey. Sampling methodology The sample design followed the four stage systematic sampling procedure. The four stages are described below. First stage The population of Nepal was 18,491,097 in 1991. As 10 districts were to be selected, the selection interval was taken as 18,491,097/10 = 1,849,110. Thus 10 districts were selected with probability proportional to census population of the districts and the selection probability p1i is given by pi/1,849,110, where pi is the census population of district i in 1991. The highest value of pi was 675,342. Second stage One village development committee (VDC) from each selected district was to be selected. These VDCs were selected with probability proportional to census population of the VDC in each district. The selection probability p2ij is given by pij/? jpij where pij is the population of jth VDC in ith district. Third stage In this stage 14 wards from the 10 selected VDCs were to be selected. Let nij be the number of wards to be selected in jth village development committee of the ith district with the following conditions (names of selected VDCs and ward numbers are given in Table 8.1 below). A total of 14 wards were selected.
The sample is self-weighting; i.e. if p3ij = nij/Nij is the conditional probability of selecting at the third stage (Nij being total number of wards in the jth village development committee of ith district), then p1ip2ijp3ij = K, where K is constant. Or p1jp2ijnij/Nij = K Or nij= (KNij)/(p1ip2ij) Or ? nij= K[Nij/p1ip2ij] Or K = 14/[Nij/p1ip2ij]
1 One village development committee comprises of 9 wards. Each ward has about 100 households. 2 The design was done on the assumption that smoking prevalence was about 50% not 38.4% which was the estimate after this sample was implemented. 3 According to the population census of 1991 the average household size was 5.6 (CBS, Vol. I, Table 1).

61
Fourth stage On average, 100 households are to be selected in each selected ward. For this, a quick count of the dwellings is made and the segments made accordingly. One segment is selected at random. The segments are labelled as n segments, based on 1991 census of households, as follows:
1991 households Number of segments <150 1 150–249 2 250–349 3 350–449 4 450–549 5 550–649 6 650–749 7
and so forth. If there are <150 households in a ward, all households are selected. If there are 150–249, households, then two segments are made and all households in one segment are interviewed. Similarly, segments are made for other numbers of households, and one chosen. If there are 1,000 households or more, a batch of 100 households is selected and these households are interviewed. Segments are made in such a way that each segment contains approximately the same number of dwellings and therefore one segment was chosen at random.
Procedure
Districts are arranged starting from the north-east districts in the mountain region down to south-east district in the Tarai region, then the adjacent district in the Tara region up to the northernmost district, then the adjacent district in the northern district and down to the southern district, and so on. This arrangement of districts was adopted from the arrangement made by the Central Bureau of Statistics in Nepal. Ten districts were selected with probability proportional to the census population per the 1991 census. In fact, three sets of districts were selected, and of these one was chosen, taking into account the accessibility of and feasibility of interviewing in the selected districts along with selected probabilities as shown in Table 8.1 below. Similarly, the village development committees were selected with probability proportional to the census population of the districts. In fact, three village development committees were selected in each district. The supervisor selected one of them by consulting with the district health officer.

62
Table 0.1. Sample selection
District Selection probability of districts
Selected village development committee
Selection Probability
No of wards (N)
N/p1p2 Number of wards to be selected
Number of selected wards
Ward number of selected wards
Number of households interviewed
Actual sample size
p1 p2 1 2 3 4 5 6 7 8 9 10 11
Jhapa 593 737/1 849 110 Golchhap 7 393/593 757 9 2251.0 1.1 1 3 131 508 Okhaldhunga 139 457/1 849 110 Taluwa 2 067/139 457 9 8051.2 4.0 2 37 91 347 Dhanusha 543 672/1 849 110 Mahendra
Nagar 10 209/543 672 9 1630.1 0.8 1 3 164 618
Sindhupalchok 261 025/1 849 110 Jyamire 4 844/261 025 9 3435.6 1.7 2 14 150 617 Dhading 278 068/1 849 110 Gajuri 6 446/278 068 9 2581.8 1.3 2 15 136 549 Chitwan 354 488/1 849 110 Bharatpur 54 670/354 488 12 405.9 0.2 1 11 158 607 Baglung 232 486/1 849 110 Harichaur 4 949/232 486 9 3362.7 1.7 2 59 158 742 Kapilvastu 371 778/1 849 110 Birpur 6 951/371 778 9 2394.2 1.2 1 9 150 602 Bardiya 290 313/1 849 110 Kalika 7 547/290 313 9 2205.1 1.1 1 2 150 725 Kailali 417 891/1 849 110 Geta 7 908/417 891 9 2104.4 1.0 1 2 150 642 Total 14 1438 5957

63
Appendix 4. Nepal smoking behaviour survey questionnaire, 2000 The information obtained from household members in this questionnaire shall be kept confidential as per the Statistics Law 2015 of the Country. This information shall be used for research purposes only. Department of Health Services, Ministry of Health, His Majesty’s Government of Nepal—Questionnaire Conducted by Nepal Health Economics Association
Form # Time interview started: hour: _____ minute: _____ Place name __________________________________ Household no.______________ District___________________ Municipality/village development committee ___________________________ Ward No.____________________ Name of head of household.____________________________________
Interviewer Visits 01 02 03 Date Interviewer’s name: Result* Next visit: date Time
*Result codes: 01 = Completed 02 = Household absent
03 = Time and date set for later 04 = Dwelling not found
05 = Other: (specify): ___________________ 77 = Refused
Name Date Signature Field edited by: Keyed by:

64
Section 1. Household information May I please have some information about the people who usually live or stayed last night in your household starting with the head of the household? S. No. Usual residents and visitors 1.
Relationship 2. Sex 3. Age 4.
Literate 5. Marital status
6. Occupation
7. Education Mark all
Please give me the names of the persons who usually live or stayed last night in your household, starting with the head of the household.
Relation to the household head. (for codes see below)
Male....1 Female..2
Completed age
Yes...... 1 No........2 (For children 6 years or under write 9) DK = 8
Married (1), Widowed (2), Divorced (3), Separated (4), Unmarried(5) (For children 10 years or under write 9) DK = 8
(for codes see below) For children 13 years or under write 99) DK = 88
Last qualification (For children 6 years or under write 99) DK = 88
household members who are 10 + years old
1 2 3 4 5 6 7 8 9 10 11 12 Relationship codes: Head...1, Wife/husband....2, Son/daughter..3, Grandchild...4, Father/mother...5, Sister/brother....6, Niece/nephew...7, Son/daughter-in- law....8, Brother/sister-in- law...9, Father/mother- in- law…10, Other family relative....11, Servant/servant’s relative...12, Tenant/tenant relative...13, Other person not related....14

65
Occupation codes: Agriculture non-tobacco…1, Agriculture tobacco-related…2, Cottage Industry non-tobacco…3, Cottage Industry tobacco-related…4, Modern industry non-tobacco…5,. Modern industry tobacco-related...6, Service non-tobacco…7 Service tobacco-related…8, Business non-tobacco…9, Business tobacco-related…10 Student…11, Unemployed…12, Daily wages non-tobacco…13, Daily wages tobacco-related...14, Cannot work (health…15, Others (specify).......................................16 Please tick here if another sheet is used for this family....... � Section 2: Smoking habits (for all household members 10 years and over) Line #
Write down names of all family members who are 10 years or older.
8. Have you ever smoked? Yes…1 No....2 →Q 20
9. How did you start smoking/what motivated you to begin smoking? (ask for most important and 2nd most important reasons)
10. How old were you when you began to smoke? (completed age)
11. Are you currently smoking? Yes…1 No...2→ Q20
12. What do you smoke? Cigarettes........1 Bidi.................2 Sulfa (kakkad)..3 Hukka................4 Other............ (multiple answers)
13. How many times a day do you smoke?
1
2
3
4
5
6
7
8

66
Line #
14. How many sticks of cigarettes/bidi do you smoke a day?
15. What cigarette brand do you normally smoke? (specify)
16. What bidi brand do you normally smoke?
17. How much do you normally spend a month on cigarettes/bidi smoking? (specify Rs.)
18. CHQ 12. You said you smoke/also smoke sulfa/hukka/other (..name..). Do you buy tobacco for it? Yes.. 1 No....2→Q20
19. How much do you normally spend a month on sulfa/hukka/other (..name..). smoking? (specify Rs.)
Cigarette
Bidi
1
2
3
4
5
6
7
8
9
10

67
Line #
20. Do you take khaini? Yes.. 1 No....2→Q22
21. How much do you normally spend a month on khaini? (specify Rs.) →Q23
22. What made you stop smoking? (ask for most important and 2nd most important reasons)
23. Are you aware of any sources of information that talk about tobacco products? Yes.. 1—name them No....2→section 3
24. What have you seen/heard/read about tobacco products? (specify)
25. Are those information enough? Yes.. 1 → Q27 No....2
26. What would you suggest for improvements?
1
2
3
4
5
6
7
8
9
10
11
12

68
Section 3: Production, sale and consumption of tobacco (ask head of household only) 27. In the past 12 months did you grow tobacco in your land or in land owned by someone else (or that was mortgaged in)? Yes.. 1 No....2 → Q32
28. What quantity of tobacco did you harvest in the last 12 months? Quintal................ kg..................
29. Of the total quantity you harvested how much did you sell (or do you expect to sell)? Quintal................ kg..................
30. Did you consume the home grown tobacco in the household? Yes.. 1 No....2→ Q32
31. Of the home grown tobacco, how much did you consume in the past 12 months? Quintal................ kg.................. → Q34
32. Did you buy tobacco for your consumption in the past 12 months? Yes.. 1 No....2→ Q37
33. In all, how much do consume in the past 12 months? Quintal................ kg.................. → Q35
34. How much would your household have to spend in the market to buy this quantity of tobacco (i.e. the quantity consumed in the past 12 months)? Rs.................... → Q36
35. How much did you spend on the purchase of that quantity? Rs.................
36. How much money did you make in the past 12 months by selling home-grown tobacco (after allowing for home consumption)? Rs....................
(check Q6 if business is the main occupation or if the main occupation is others but also runs a business as a secondary occupation ask this question – also administer retailer’s question items, for others skip to section 4) Did you sell tobacco products in the past 12 months? Yes—-1 No——→ Go to section 4
38. What tobacco products did you sell? Cigarettes................ Yes...1 No....2 Bidi................................Yes...1 No...2 Khaini......................Yes...1 No....2 Pan parag........................ Yes...1 No...2 Tobacco for hukka...Yes...1 No...2 Tobacco for kakkad/sulfa..Yes..1 No...2 Pan leaf with jarda...Yes..1 No...2 Other (specify)..........................................................
39. Of all the tobacco products you sold what proportion of them were Nepal made and what proportion were from outside? % Nepal............. % India.......... % Overseas..........
40. What was the turnover of your shop in the past 12 months? Rs.......................................
41. Of your total turn over what percentage of income was from the sale of tobacco products in the past 12 months?

69
............................% Section 4: Family income and expenditures (ask head of household only): Now I would like to know about your sources of family income and expenditures.
42. What are the sources of your income and in the past 12 months how much income did you earn? (Interviewer: write down incomes from different sources in rupees)
Ser. No.
Source of income Rs.
1. Agricultural products: rice, corns, wheat, millets, beans, vegetables, fruits, etc 2. Cash crops: sugarcanes, oilseeds, etc., (do not include tobacco products) 3. Tobacco products: cultivation 4. Livestock: domestic animals, milk, birds, fish, etc. 5. Non-farm enterprise income: income from home enterprises and self employment outside
agriculture, etc
6. Transfers: income from remittances and transfers, etc. 7. Tobacco-based cottage industry 8. Service: salaries 9. Wages 10. Other incomes: specify.............................. Total

70
43. In the past 12 months and in the last month what was your family expenditure? Ser. No.
Expenditure items Past 12 months (Rs.)
Last month (Rs.)
1. Expenditure on food items: cereals, beans, fruits, meat, fish, milk, oil, etc.
2. Expenditure on clothing 3. Fuel items: kerosene, gas, firewood, etc. 4. Schooling and education 5. Medicines and health services 6. Tobacco and related products 7. Consumer durable items 8. Other expenses: ceremonies, etc. 9. Legal expenses TOTAL [After completing the interview with the head of the household ask, in turn, other family members who are 10 years and older, q8 to q26 of Section 2]. Interviewer’s closing remarks:
Thank you. This ends our questions. You have been very helpful. Okay. Again, thank you for your time. Your comments have been very helpful. Time interview ended: hour: _____ minute: _____

71
Appendix 5. Nepal tobacco cultivation survey questionnaire, 2000
The information obtained from household members in this questionnaire shall be kept confidential as per the 2015 Statistics Law of the Country. Theses information shall be used for research purposes only. Nepal tobacco cultivation Survey-2000 Department of Health Services, Ministry of Health, His Majesty’s Government of Nepal—Questionnaire Conducted by Nepal Health Economics Association
Form # Time interview started: hour: _____ minute: _____ Place name __________________________________ household no.______________ district___________________ Municipality/village development committee ___________________________ Ward no.____________________ Name of head of household.____________________________________
Interviewer Visits 01 02 03 Date Interviewer’s name: Result* Next visit: date Time
*Result codes: 01 = Completed 02 = Household absent
03 = Time and date set for later 04 = Dwelling not found
05 = Other: (Specify): ___________________ 77 = Refused
Name Date Signature Field edited by: Keyed by:

72
Section 1: Farm family size, landholding, cultivation and production of tobacco
How many people usually live and eat together in this household? .................... people
2. How many males and how many females?......... Males.......... Females
3. What amount of farm land were in possession in the past 12 months? ——————-bigha———————-kattha——————dhur
4. For how many years has your family been engaged in tobacco farming?
........................ years.
5. In the past 12 months how much land did you use for tobacco cultivation? ——————-bigha———————-kattha——————dhur
When did you grow tobacco? From................ month to............... month
7. Did you irrigate the tobacco farm? Yes.. 1 No....2→ Q10
8. Did you receive any subsidy for tobacco irrigation facility such as boring, etc.? Yes.....1 No.......2→ Q10
9. What was the source(s) of subsidy? Agricultural Development Bank/Nepal................ 1 Govt.............. 2 Others (specify).......3
10. Did you use an improved variety of seed? Yes.....1 No.......2
11. What quantity of tobacco did you harvest in the last 12 months? Quintal................ kg..................
12. Of the total quantity you harvested how much did you give to landlord? Quintal................ kg.................. not applicable.............
13. Of the total quantity you harvested how much did you sell (or expect to sell)? Quintal................ kg..................
14. In the past 12 months did you consume the home grown tobacco in the household? Yes.. 1 No....2→ Q16
15. Of the home grown tobacco, how much did you consume in the past 12 months? Quintal................ kg.................. → Q19
16. Did you buy tobacco for your home consumption? Yes.. 1 No....2→ Q20
17. In all, how much did you consume in the past 12 months? Quintal................ kg..................
18. How much did you spend on the purchase of that quantity? Rs................. → Q20
19. How much would your household have to spend in the market to buy this quantity of tobacco (i.e. the quantity consumed in the past 12 months)? Rs....................
20. How much money did you make in the past 12 months by selling home-grown tobacco (after allowing for home consumption)? Rs...................................

73
Section 2: Inputs/subsidies to tobacco cultivation 21. Did you purchase or receive any tobacco seeds or tobacco young plants over the past 12 months? Yes.. 1 No....2 → Q24 22. Where did you obtain the tobacco seeds/ young tobacco plants? Agricultural Inputs Corporation (AIC)...........................................1 cooperative........................2
Other farmers.................3 private dealer...................4 From India..........................5 landlord..............................6 Cigarette factory....…..7 other.........................................8
23. How much did you spend on buying them? Rs.................................. (if nothing write zero)
24. Did you purchase any chemical fertilizers or insecticides for tobacco farm (or receive them from the landlord) over the past 12 months? Yes.. 1 No.... 2 → Q31
25. How much money in total did you spend on them? For fertilizers Rs.............................. For insecticides Rs............................... For transportation Rs......................
26. Where did you obtain the fertilizer? AIC............................................1 cooperative........................2 Other farmers..................3 private dealer...................4 From India...........................5 landlord..............................6 Cigarette factory.......7 other.......................................8
27. Did you obtain any of the fertilizer on credit? Yes.. 1 No....2 → Q31
28. Who was the source of credit for the fertilizer? ADB/N......................................1 Friends/family..................2 Cooperatives.......................3 Other......................................4
29. Were you able to obtain all the fertilizer you needed over the past 12 months? Yes.. 1 → Q31 No....2
30. Why were you unable to get all the fertilizer you needed in the past 12 months? Not available for purchase.......1 Not enough money..............................2 Other.........................................................3
31. Did you get any subsidy from government for your tobacco cultivation in the past 12 months? Yes.. 1 No....2 → Q34
32. Was the subsidy in terms of commodities or cash grant? Commodities..... 1 Cash........... 2
33. What was the total value of the subsidy? (interviewer: write both the value of commodities and the amount of cash in rupees) Rs...........................................

74
34. Now I would like to know what work force is required for your family in a year. For this could you please tell me how many part-time and full time workers did you have to use for farming including you own family members in the past 12 months? Crop Number of part-time workers Number of full- time workers Paddy Maize Wheat Vegetables Tobacco Others 35. What is the daily wage rate for a full time worker in this area? Rs........................
36. What is the daily wage rate for a part time worker in this area? Rs.......................................
Section 3: Family income: Now I would like to know about your sources of family income. 37. What are the sources of your income and in the past 12 months how much income did you earn? (interviewer: write down incomes from different sources in rupees)
Ser. No.
Sources of income Rs.
1. Agricultural products: rice, corn, wheat, millet, beans, vegetables, fruit, etc 2. Cash crops: sugarcanes, oilseeds, etc., (do not include tobacco products) 3. Tobacco products: cultivation 4. Livestock: domestic animals, milk, birds, fish, etc. 5. Non-farm enterprise income: income from home enterprises and self-employment outside
agriculture, etc.
6. Transfers: income from remittances and transfers, etc. 7. Tobacco-based cottage industry 8. Service: salaries 9. Wages 10. Other income: specify.............................. Total

75
38. In the past 12 months and in the last month what was your family expenditure?
Ser. No.
Expenditure items Past 12 months (Rs.)
Last month (Rs.)
1. Expenditure on food items: cereals, beans, fruits, meat, fish, milk, oil, etc. 2. Expenditure on clothing 3. Fuel items: kerosene, gas, firewood, etc. 4. Schooling and education 5. Medicines and health services 6. Tobacco and related products 7. Consumer durable items 8. Other expenses: ceremonies, legal fees, etc. Total Interviewer’s closing remarks Thank you. This ends our questions. You have been very helpful. Again, thank you for your time. Your comments have been very helpful. Time interview ended: hour: _____ minute: _____

76
Appendix 6. Household expenditure The expenditure items included the fo llowing: • expenditure on food items: cereals, beans, fruits, meat, fish, milk, oil, etc. • expenditure on clothing • fuel items: kerosene, gas, fire wood, etc. • schooling and education • medicines and health services • tobacco and related products • consumer durable items • other expenses: ceremonies, etc. • legal expenses. For analytical purposes the above expenditure items were categorized into five groups as follows: • food, etc.: expenditure on food items: cereals, beans, fruits, meat, fish, milk, oil, etc.,
expenditure on clothing and fuel items: kerosene, gas, firewood, etc. • education and health: schooling and education, and medicines and health services • expenditure on tobacco products: tobacco and related products • consumer durables: consumer durable items • other expenses: ceremonies, etc., and legal matters.

77
Appendix 7. Hausman test
Table 0.2. Hausman test Hausman statistic For the logit equation For the conditional demand
equation Overall 2
8χ = –55.55 212χ = –0.01
Quintile group First quintile 2
9χ = –10.67 212χ = –0.46
Second quintile 29χ = –2.4 2
12χ = 0.00 Third quintile 2
8χ = –3.39 211χ = 0.45
Fourth quintile 28χ = -0.55 2
12χ = -0.04 Fifth quintile 2
8χ = –0.038 211χ = –0.24
Age group 15–24 years 2
9χ = –0.11 29χ = –0.09
25–34 years 29χ = –0.82 2
11χ = –0.37 35–44 years 2
9χ = 2.04 29χ = -0.01
45–54 years 29χ = –1.59 2
9χ = –0.11 55–64 years 2
8χ = –1.4 29χ = 0.05
65 years and up 29χ = –1.74 2
11χ = –0.51 Geographical location Urban 2
6χ = 0.00 210χ = –0.02
Rural 28χ = –4.29 2
11χ = 0.8 The Hausman test compares two models using different estimations of the price to test which one is better. The first model uses the data on prices extracted from the survey and the second model uses an estimation of the price (instrumental variable). If there is no difference between the two models, it means that the instrumental variable does not bring more to the model than the price variable and thus the price is not endogenous. The test was performed using the software Stata, with H0 = “the difference in coefficients is not systematic”. Table 8.2 shows that some of the statistics were negative. The Stata manual explains that such results are not necessarily comforting because it means that the model estimated fails to meet the asymptotic assumptions, but it is not a surprising result either. However, negative values of the statistic could be interpreted as strong evidence that we cannot reject the null hypothesis and thus that price is exogenous. The other positive values in the table are statistics which accept the null hypothesis at more than 99%.
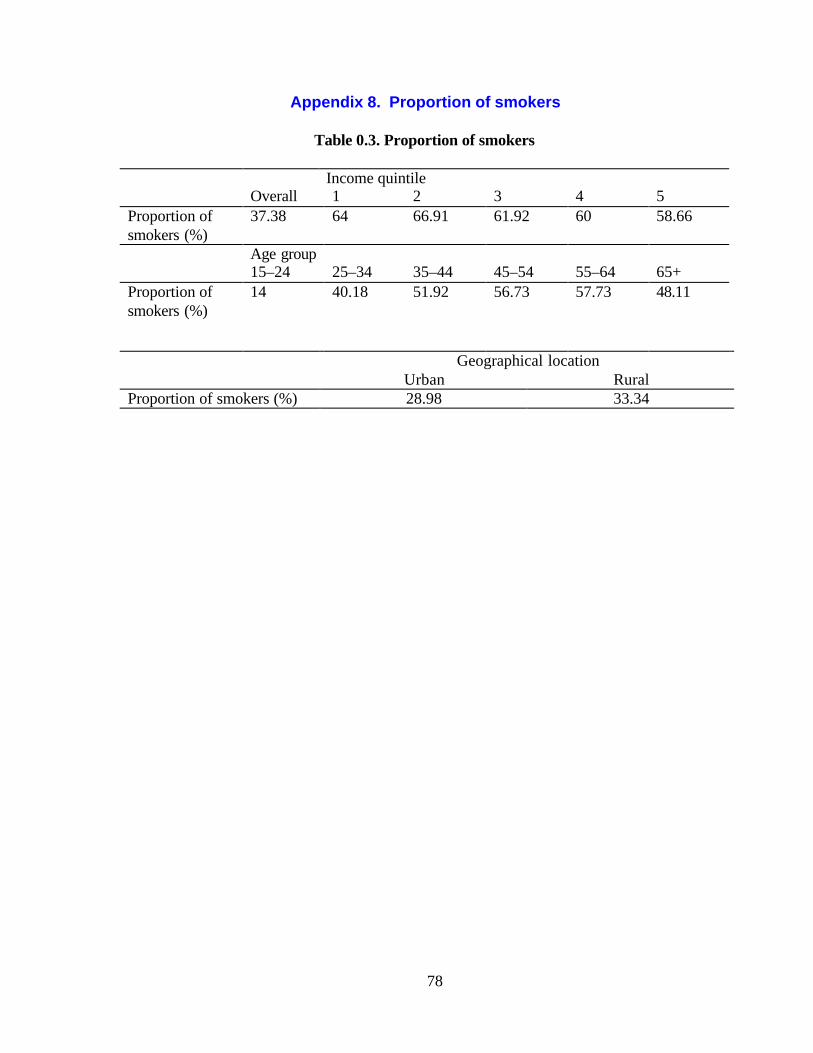
78
Appendix 8. Proportion of smokers
Table 0.3. Proportion of smokers
Income quintile Overall 1 2 3 4 5 Proportion of smokers (%)
37.38 64 66.91 61.92 60 58.66
Age group 15–24 25–34 35–44 45–54 55–64 65+ Proportion of smokers (%)
14 40.18 51.92 56.73 57.73 48.11
Geographical location Urban Rural Proportion of smokers (%) 28.98 33.34

79
Appendix 9. Relative risks for major diseases in China
Table 0.4. Relative risks for major diseases in China (men aged 35 and above)
RR All China Cause of death (ICD-9) Urban Rural RR PAR(%)
Lung cancer (162) 2.98 2.57 2.72 52.3 Oesophageal (150) 2.06 1.57 1.61 27.9 Stomach (151) 1.36 1.35 1.35 18.1 Liver cancer (155) 1.39 1.41 1.40 20.2 All cancer (140–208) 1.62 1.48 1.51 24.6 COPD 1.57 1.41 1.43 22.6 TB (011, 012, 018) 1.42 1.17 1.20 11.3 Stroke (430–9) 1.18 1.17 1.17 10.0 IHD (410–4) 1.28 1.28 1.28 14.7 All deaths 1.29 1.22 1.23 13.0
Source: Liu B, Peto, R et al., 1998.: British medical journal, (317):1411–22.
Table 6.1. Relative risks for major diseases in China (women aged 35 and above)
RR All China Cause of death (ICD-9) Urban Rural RR PAR(%) Lung cancer (162) 3.24 1.98 2.64 19.4 Oesophageal (150) 1.65 1.28 1.34 2.8 Stomach (151) 1.30 1.13 1.17 1.7 Liver cancer (155) 1.49 1.12 1.22 2.4 All cancer (140–208) 1.67 1.21 1.37 4.0 COPD 2.51 1.50 1.72 9.3 TB (011, 012, 018) 1.56 1.25 1.29 2.8 Stroke (430–9) 1.11 0.88 0.97 – IHD (410–4) 1.37 1.22 1.30 4.1 All deaths 1.40 1.14 1.23 2.7
Source: Liu B, Peto, R et al., 1998.: British medical journal, (317):1411–22.

80

81
REFERENCES Bastola T, July 2000. Urban population of Nepal. In Nepal population and development journal. Kathmandu, MOPE. Central Bureau of Statistics, 1958. Population census 1952–54. Table 2; Kathmandu. ———, 1968, Population census 1961. Vol. 3, Part 2, Table 2. Kathmandu, National Planning Commission Secretariat . ———, 1975, Population census 1971. Vol. 1, Table 5. Kathmandu, National Planning Commission Secretariat . ———, 1981, Population census 1981. Vol. 2, Table 4. Kathmandu, National Planning Commission Secretariat . ———, 1993, Population census 1991. Vol. 1, Table 5. Kathmandu, National Planning Commission Secretariat . ———, June 1994, National sample census of agriculture, Nepal, 1991/92. Analysis of Results. Kathmandu, National Planning Commission Secretariat. ———, 1997. Nepal living standard survey. Vol. 1. Kathmandu, National Planning Commission Secretariat . ———, June 1998. Further analysis report on antenatal, delivery, postnatal services, literacy and polio coverage. Nepal Multiple Indicator Surveillance, fifth cycle (March–May 1997) in collaboration with UNICEF/Nepal. ———,1998. Census of manufacturing establishments, 1996–7. Kathmandu, National Planning Commission Secretariat. ———,1999. Statistical year book of Nepal, 1999. Kathmandu, National Planning Commission Secretariat. ———,1999. Report on the Nepal labour force survey, 1998–99:118–19, tables E 6.5 and E 6.6. Kathmandu, National Planning Commission Secretariat. Central Bureau of Statistics, UNFPA, June 2002. Population Census 2001: National Report. Kathmandu, National Planning Commission Secretariat. Deshantar weekly, 20 September 1998, Kathmandu. Devkota GM, 1968. Janakpur Cigarette Factory, Pvt. Ltd. In Industrial digest Nepal 1968. Kathmandu.

82
Ghimire J, 2000. NGO development in Nepal. In Social development and INGOs activities in Nepal 2000. Kathmandu. Grossman M, Chaloupka FJ. Cigarette taxes: the straw to break the camel’s back. Public health reports, 1997, 112:290–7. Gurung Harka, September 1989. Regional patterns of migration in Nepal. Papers of the East–West Population Institute, 113. Janakpur Cigarette Factory, Janakpurdham, Nepal. Personal communication. Janakpur Cigarette Factory, price list, and Surya Tobacco Company, price list. Kantipur, 15 July 2001:2, 9. Kathmandu. Jhan N et al., April–June 1999. Smoking and Smokers in Sunsari Nepal. In Journal of the Nepal Medical Association,. Kantipur, 16 June 1999, Kathmandu. ———, 23 December 2000, Kathmandu. ———, 8 July 2001, Kathmandu. ———, 31 July 2001, Kathmandu. Karki YB, 1977. Some aspects of mortality in Nepal. MSc dissertation. London School of Economics and Political Science, London. ———, 1992. Estimates and Projections of Population: Nepal, 1981–2031. Central Department of Population Studies, Tribhuvan University, March 1993. Nepal’s population problem: a time bomb. Paper presented at a national seminar on population and sustainable development in Nepal. ———, 2002. Women outlive men. The rising Nepal, 8 November 2002. Kathmandu. 8 November. Lewit EM, Coate D, Grossman M. The effects of government regulation on teenage smoking. Journal of law and economics, 1981, 24:545–69. Liu BQ et al., 1998. Emerging tobacco hazards in China. 1. Retrospective proportional mortality study of one million deaths. British medical journal, 317(7170):1411–22. Marasaini MK, 1999. The value of VAT. Kathmandu post, 22 May 1999.

83
Ministry of Finance, Economic acts 1997–98 to 2002–03. Kathmandu.(The document is published every fiscal year, in mid-July) ———, 2002. Economic survey 2001–2002. Kathmandu. ———, 2000. Economic survey 1999–2000. Kathmandu. ———, Foreign trade statistics, fiscal years 1996–97 to 1998–99. Personal communication. ———, Value Added Tax Office. Personal communication. ———, Budget speeches, 1991/92–1998/99. Kathmandu. ———, 2000. Economic survey, 1999–2000:76–9. Ministry of Health, 2000. Smoking (prohibition and control) act, 2057 (2000). Ministry of Industry. Company registration. Personal communication. Ministry of Population and Environment (MOPE), 1998. Population projection of Nepal. Kathmandu. Murray CJL, Lopez AD, 1996. The global burden of disease. Summary. WHO, Harvard School of Public Health, World Bank. Cambridge, Massachusetts, Harvard University Press. National Planning Commission , 1992. The eighth five-year plan, 1992–1997. Kathmandu, National Planning Commission Secretariat. ———,1998. The ninth five-year plan, 1997–2002, Kathmandu, National Planning Commission Secretariat. Nepal Rastra Bank, Multipurpose household budget survey, 1988:60–1. Kathmandu. ———, 1999a. Household budget survey. Kathmandu. ———, 1999b. Quarterly economic bulletin, 34(1):44–5. Pandey MR, Basnyat B, Neupane RP, 1988. Chronic bronchitis and cor pulmonale in Nepal. A scient ific epidemiological study. Kathmandu, Mrigendra Medical Trust. Pandey MR et al., 1987. Epidemiological study of tobacco smoking behaviour among young people in a rural community of the hill region of Nepal with special reference to attitude and beliefs. Community medicine, 1987, 9(2)110–20. Paudel, D. 2003. Tobacco Use among Adolescent Students in Secondary Schools of Pokhara Sub Metropolitan City. (forthcoming).

84
Sharma P, 1989. Urbanization in Nepal. Papers of the East–West Population Institute, 110. Shrestha P, Pant P, 1995. Economically active population. In Population monograph of Nepal, Central Bureau of Statistics , Kathmandu. Surya Tobacco Company, Pvt., price list., Kantipur, 11 July 2002:9. Kathmandu. ———, 2000. Personal communication. Kathmandu post , 28 January 1998, Kathmandu. ———, 10 February 2001, Kathmandu. ———, 13 February 2001, Kathmandu. Vaidyanathan KE, Gaige FH, 1973. Estimates of abridged life tables, corrected age-sex distribution and birth and death rates for Nepal, 1954. Demography India, 2(2). World Bank, 1999. Curbing the epidemic: governments and the economics of tobacco control. Washington DC. ———, 2000. World development report, 1999/2000. New York, Oxford University Press. ———, 2003. World development indicators, 2003. New York, Oxford University Press. ———, June 2000. Nepal: operational issues and prioritization of resources in the health sector. Report 19 613. Health, Nutrition and Population Unit, South Asia Region.


H N P D I S C U S S I O N P A P E R
Economics of Tobacco Contro l Paper No. 11
About this series...
This series is produced by the Health, Nutrition, and Population Family (HNP) of the WorldBank’s Human Development Network. The papers in this series aim to provide a vehicle forpublishing preliminary and unpolished results on HNP topics to encourage discussion anddebate. The findings, interpretations, and conclusions expressed in this paper are entirelythose of the author(s) and should not be attributed in any manner to the World Bank, to itsaffiliated organizations or to members of its Board of Executive Directors or the countriesthey represent. Citation and the use of material presented in this series should take intoaccount this provisional character. For free copies of papers in this series please contact theindividual authors whose name appears on the paper.
Enquiries about the series and submissions should be made directly to the Editor inChief Alexander S. Preker ([email protected]) or HNP Advisory Service([email protected], tel 202 473-2256, fax 202 522-3234). For more information,see also www.worldbank.org/hnppublications.
The Economics of Tobacco Control sub-series is produced jointly with the Tobacco FreeInitiative of the World Health Organization. The findings, interpretations and conclusionsexpressed in this paper are entirely those of the authors and should not be attributed in anymanner to the World Health Organization or to the World Bank, their affiliated organizationsor members of their Executive Boards or the countries they represent.
The editors for the Economics of Tobacco Control papers are: Joy de Beyer([email protected]), Emmanuel Guindon ([email protected]) and Ayda Yurekli([email protected]).
THE WORLD BANK
1818 H Street, NWWashington, DC USA 20433Telephone: 202 477 1234Facsimile: 202 477 6391Internet: www.worldbank.orgE-mail: [email protected]
Tobacco Free InitiativeWorld Health Organization
WORLD HEALTH ORGANIZATIONRegional Office for South-East Asia
World Health House, Indraprastha EstateMahatma Gandhi Marg
New Delhi 110002, IndiaTelephone: 233 70804; 233 0809-11
Facsimile: 23370197, 2337 9395E-mail:[email protected]
Higher Tobacco Prices and Taxes in South-East Asia
An Effective Tool to Reduce Tobacco Use, Save Lives andGenerate Revenue
G. Emmanuel Guindon, Anne-Marie Perucic and David Boisclair
October 2003