economics of safety at surface mine spoil piles - centers for disease
TRANSCRIPT
RI 9653 REPORT OF INVESTIGATIONS/2000
Economics of Safety at Surface Mine Spoil Piles
U.S. DEPARTMENT OF HEALTH AND HUMAN SERVICESPublic Health Service
Centers for Disease Control and PreventionNational Institute for Occupational Safety and Health

Report of Investigations 9653
Economics of Safety at Surface Mine Spoil Piles
Thomas W. Camm
U.S. DEPARTMENT OF HEALTH AND HUMAN SERVICESPublic Health Service
Centers for Disease Control and PreventionNational Institute for Occupational Safety and Health
Spokane Research LaboratorySpokane, WA
July 2000

International Standard Serial NumberISSN 1066-5552

CONTENTSPage
Abstract . . . . . . . . . . . . . . . . . . . . . . . . . . . . . . . . . . . . . . . . . . . . . . . . . . . . . . . . . . . . . . . . . . . . . . . . . . . . . . . . . . . . . . 1Introduction . . . . . . . . . . . . . . . . . . . . . . . . . . . . . . . . . . . . . . . . . . . . . . . . . . . . . . . . . . . . . . . . . . . . . . . . . . . . . . . . . . . 2Background . . . . . . . . . . . . . . . . . . . . . . . . . . . . . . . . . . . . . . . . . . . . . . . . . . . . . . . . . . . . . . . . . . . . . . . . . . . . . . . . . . . 2Overview of dump-site injuries . . . . . . . . . . . . . . . . . . . . . . . . . . . . . . . . . . . . . . . . . . . . . . . . . . . . . . . . . . . . . . . . . . . . 2Costs of injury . . . . . . . . . . . . . . . . . . . . . . . . . . . . . . . . . . . . . . . . . . . . . . . . . . . . . . . . . . . . . . . . . . . . . . . . . . . . . . . . . 3Considerations for choosing a dumping method . . . . . . . . . . . . . . . . . . . . . . . . . . . . . . . . . . . . . . . . . . . . . . . . . . . . . . . 4Cost modeling . . . . . . . . . . . . . . . . . . . . . . . . . . . . . . . . . . . . . . . . . . . . . . . . . . . . . . . . . . . . . . . . . . . . . . . . . . . . . . . . . 5Cost categories . . . . . . . . . . . . . . . . . . . . . . . . . . . . . . . . . . . . . . . . . . . . . . . . . . . . . . . . . . . . . . . . . . . . . . . . . . . . . . . . . 5Cost analysis . . . . . . . . . . . . . . . . . . . . . . . . . . . . . . . . . . . . . . . . . . . . . . . . . . . . . . . . . . . . . . . . . . . . . . . . . . . . . . . . . . 6Summary . . . . . . . . . . . . . . . . . . . . . . . . . . . . . . . . . . . . . . . . . . . . . . . . . . . . . . . . . . . . . . . . . . . . . . . . . . . . . . . . . . . . . 8Acknowledgments . . . . . . . . . . . . . . . . . . . . . . . . . . . . . . . . . . . . . . . . . . . . . . . . . . . . . . . . . . . . . . . . . . . . . . . . . . . . . . 8References . . . . . . . . . . . . . . . . . . . . . . . . . . . . . . . . . . . . . . . . . . . . . . . . . . . . . . . . . . . . . . . . . . . . . . . . . . . . . . . . . . . . 8Appendix . . . . . . . . . . . . . . . . . . . . . . . . . . . . . . . . . . . . . . . . . . . . . . . . . . . . . . . . . . . . . . . . . . . . . . . . . . . . . . . . . . . . . 9
ILLUSTRATIONS
1. Edge-dumping . . . . . . . . . . . . . . . . . . . . . . . . . . . . . . . . . . . . . . . . . . . . . . . . . . . . . . . . . . . . . . . . . . . . . . . . . . . . . . . 22. Short-dumping . . . . . . . . . . . . . . . . . . . . . . . . . . . . . . . . . . . . . . . . . . . . . . . . . . . . . . . . . . . . . . . . . . . . . . . . . . . . . . . 23. Cracks near berm of spoil pile can create hazards for trucks dumping material near edge . . . . . . . . . . . . . . . . . . . . . 4
TABLES
1. Direct and indirect cost categories . . . . . . . . . . . . . . . . . . . . . . . . . . . . . . . . . . . . . . . . . . . . . . . . . . . . . . . . . . . . . . . 32. Costs per injury by severity . . . . . . . . . . . . . . . . . . . . . . . . . . . . . . . . . . . . . . . . . . . . . . . . . . . . . . . . . . . . . . . . . . . . . 43. Breakdown of labor expenses . . . . . . . . . . . . . . . . . . . . . . . . . . . . . . . . . . . . . . . . . . . . . . . . . . . . . . . . . . . . . . . . . . 64. Operating costs for surface mines calculated using various cost models . . . . . . . . . . . . . . . . . . . . . . . . . . . . . . . . . . 65. Estimated dozer production capacities . . . . . . . . . . . . . . . . . . . . . . . . . . . . . . . . . . . . . . . . . . . . . . . . . . . . . . . . . . . . 76. Estimated dozer operating costs . . . . . . . . . . . . . . . . . . . . . . . . . . . . . . . . . . . . . . . . . . . . . . . . . . . . . . . . . . . . . . . . . 7
UNIT OF MEASURE ABBREVIATIONS USED IN THIS REPORT
h hour mt/h metric ton per hour
Lm3 loose cubic meter st short ton
m meter $ dollar
mt metric ton % percent
mt/d metric ton per day
ECONOMICS OF SAFETY AT SURFACE MINE SPOIL PILES
By Thomas W. Camm1
ABSTRACT
This study was done to evaluate the costs of various dumping operations at waste and spoil piles. It hasbeen theorized that accidents associated with dumping operations might be reduced by short-dumping ratherthan edge-dumping, but many operators have been reluctant to use short-dumping because they believe it isnot as cost effective as edge-dumping. To evaluate this perception, researchers at the Spokane ResearchLaboratory of the National Institute for Occupational Safety and Health reviewed the costs of various dumpingmethods at waste and spoil piles. The study found that overall cost differences between the two methods werenot significant in most cases. However, while overall cost differences between the two methods appear small,capital costs could be more significant when short-dumping if numerous dump sites are used concurrently.The choice of which method to use should be based on considerations of the safety of dozer and truckoperators.
1Mining engineer, Spokane Research Laboratory, National Institute for Occupational Safety and Health, Spokane, WA.
2
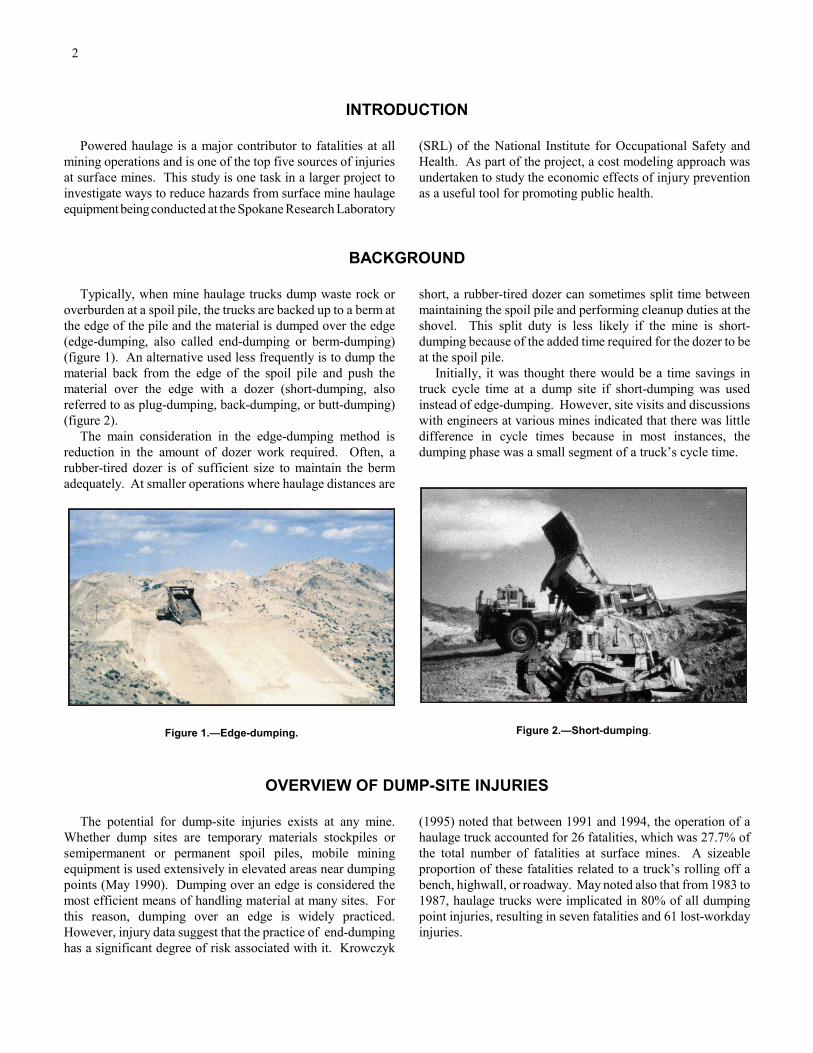
Figure 1.—Edge-dumping. Figure 2.—Short-dumping.
INTRODUCTION
Powered haulage is a major contributor to fatalities at allmining operations and is one of the top five sources of injuriesat surface mines. This study is one task in a larger project toinvestigate ways to reduce hazards from surface mine haulageequipment being conducted at the Spokane Research Laboratory
(SRL) of the National Institute for Occupational Safety andHealth. As part of the project, a cost modeling approach wasundertaken to study the economic effects of injury preventionas a useful tool for promoting public health.
BACKGROUND
Typically, when mine haulage trucks dump waste rock oroverburden at a spoil pile, the trucks are backed up to a berm atthe edge of the pile and the material is dumped over the edge(edge-dumping, also called end-dumping or berm-dumping)(figure 1). An alternative used less frequently is to dump thematerial back from the edge of the spoil pile and push thematerial over the edge with a dozer (short-dumping, alsoreferred to as plug-dumping, back-dumping, or butt-dumping)(figure 2).
The main consideration in the edge-dumping method isreduction in the amount of dozer work required. Often, arubber-tired dozer is of sufficient size to maintain the bermadequately. At smaller operations where haulage distances are
short, a rubber-tired dozer can sometimes split time betweenmaintaining the spoil pile and performing cleanup duties at theshovel. This split duty is less likely if the mine is short-dumping because of the added time required for the dozer to beat the spoil pile.
Initially, it was thought there would be a time savings intruck cycle time at a dump site if short-dumping was usedinstead of edge-dumping. However, site visits and discussionswith engineers at various mines indicated that there was littledifference in cycle times because in most instances, thedumping phase was a small segment of a truck’s cycle time.
OVERVIEW OF DUMP-SITE INJURIES
The potential for dump-site injuries exists at any mine.Whether dump sites are temporary materials stockpiles orsemipermanent or permanent spoil piles, mobile miningequipment is used extensively in elevated areas near dumpingpoints (May 1990). Dumping over an edge is considered themost efficient means of handling material at many sites. Forthis reason, dumping over an edge is widely practiced.However, injury data suggest that the practice of end-dumpinghas a significant degree of risk associated with it. Krowczyk
(1995) noted that between 1991 and 1994, the operation of ahaulage truck accounted for 26 fatalities, which was 27.7% ofthe total number of fatalities at surface mines. A sizeableproportion of these fatalities related to a truck’s rolling off abench, highwall, or roadway. May noted also that from 1983 to1987, haulage trucks were implicated in 80% of all dumpingpoint injuries, resulting in seven fatalities and 61 lost-workdayinjuries.
3
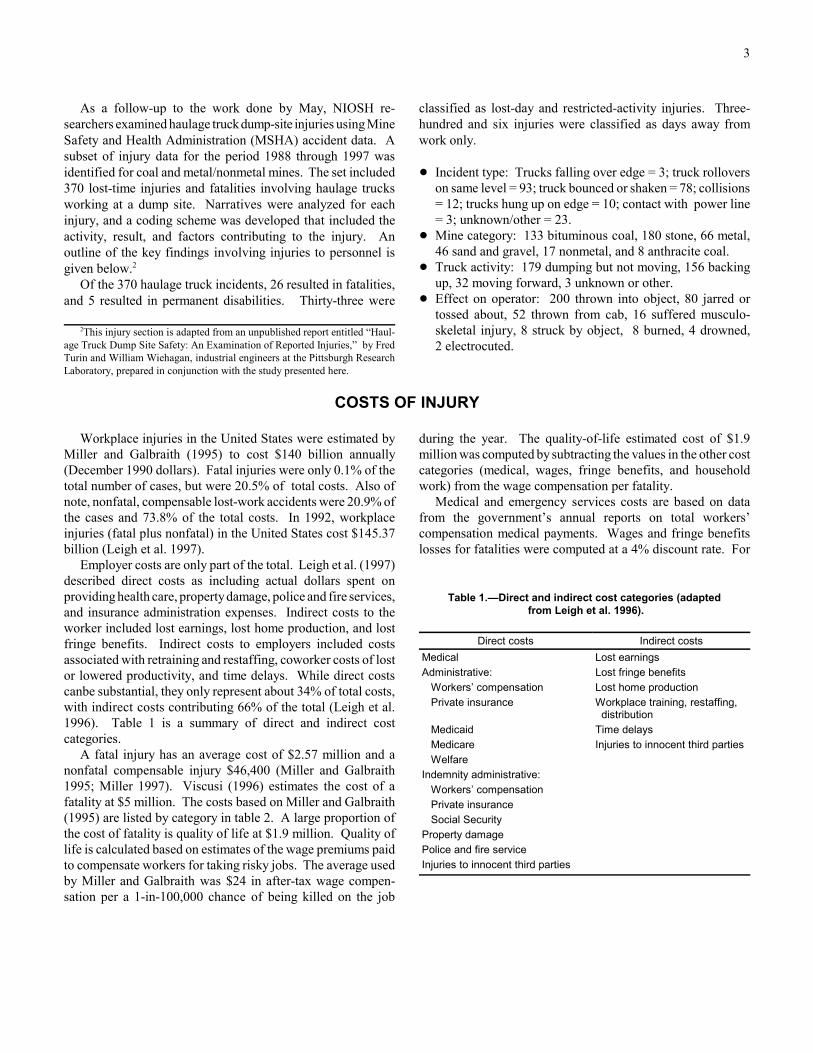
As a follow-up to the work done by May, NIOSH re-searchers examined haulage truck dump-site injuries using MineSafety and Health Administration (MSHA) accident data. Asubset of injury data for the period 1988 through 1997 wasidentified for coal and metal/nonmetal mines. The set included370 lost-time injuries and fatalities involving haulage trucksworking at a dump site. Narratives were analyzed for eachinjury, and a coding scheme was developed that included theactivity, result, and factors contributing to the injury. Anoutline of the key findings involving injuries to personnel isgiven below.2
Of the 370 haulage truck incidents, 26 resulted in fatalities,and 5 resulted in permanent disabilities. Thirty-three were
2This injury section is adapted from an unpublished report entitled “Haul-age Truck Dump Site Safety: An Examination of Reported Injuries,” by FredTurin and William Wiehagan, industrial engineers at the Pittsburgh ResearchLaboratory, prepared in conjunction with the study presented here.
classified as lost-day and restricted-activity injuries. Three-hundred and six injuries were classified as days away fromwork only.
! Incident type: Trucks falling over edge = 3; truck rolloverson same level = 93; truck bounced or shaken = 78; collisions= 12; trucks hung up on edge = 10; contact with power line= 3; unknown/other = 23.
! Mine category: 133 bituminous coal, 180 stone, 66 metal,46 sand and gravel, 17 nonmetal, and 8 anthracite coal.
! Truck activity: 179 dumping but not moving, 156 backingup, 32 moving forward, 3 unknown or other.
! Effect on operator: 200 thrown into object, 80 jarred ortossed about, 52 thrown from cab, 16 suffered musculo-skeletal injury, 8 struck by object, 8 burned, 4 drowned,2 electrocuted.
COSTS OF INJURY
Workplace injuries in the United States were estimated byMiller and Galbraith (1995) to cost $140 billion annually(December 1990 dollars). Fatal injuries were only 0.1% of thetotal number of cases, but were 20.5% of total costs. Also ofnote, nonfatal, compensable lost-work accidents were 20.9% ofthe cases and 73.8% of the total costs. In 1992, workplaceinjuries (fatal plus nonfatal) in the United States cost $145.37billion (Leigh et al. 1997).
Employer costs are only part of the total. Leigh et al. (1997)described direct costs as including actual dollars spent onproviding health care, property damage, police and fire services,and insurance administration expenses. Indirect costs to theworker included lost earnings, lost home production, and lostfringe benefits. Indirect costs to employers included costsassociated with retraining and restaffing, coworker costs of lostor lowered productivity, and time delays. While direct costscanbe substantial, they only represent about 34% of total costs,with indirect costs contributing 66% of the total (Leigh et al.1996). Table 1 is a summary of direct and indirect costcategories.
A fatal injury has an average cost of $2.57 million and anonfatal compensable injury $46,400 (Miller and Galbraith1995; Miller 1997). Viscusi (1996) estimates the cost of afatality at $5 million. The costs based on Miller and Galbraith(1995) are listed by category in table 2. A large proportion ofthe cost of fatality is quality of life at $1.9 million. Quality oflife is calculated based on estimates of the wage premiums paidto compensate workers for taking risky jobs. The average usedby Miller and Galbraith was $24 in after-tax wage compen-sation per a 1-in-100,000 chance of being killed on the job
during the year. The quality-of-life estimated cost of $1.9million was computed by subtracting the values in the other costcategories (medical, wages, fringe benefits, and householdwork) from the wage compensation per fatality.
Medical and emergency services costs are based on datafrom the government’s annual reports on total workers’compensation medical payments. Wages and fringe benefitslosses for fatalities were computed at a 4% discount rate. For
Table 1.—Direct and indirect cost categories (adapted from Leigh et al. 1996).
Direct costs Indirect costsMedical Lost earningsAdministrative: Lost fringe benefits
Workers’ compensation Lost home productionPrivate insurance Workplace training, restaffing,
distributionMedicaid Time delaysMedicare Injuries to innocent third partiesWelfare
Indemnity administrative:Workers’ compensationPrivate insuranceSocial Security
Property damagePolice and fire serviceInjuries to innocent third parties

4
Figure 3.—Cracks near berm of spoil pile can create hazards fortrucks dumping material near edge.
Table 2.—Costs per injury by severity, December 1990 dollars (adapted from Miller and Galbraith 1995)
Cost category Fatal Nonfatal compensableMedical/emergency services . . . . . . . . . . 13,000 6,300Wages/fringe benefits . . . . . . . . . . . . . . . 520,000 15,000Household work disruption . . . . . . . . . . . 110,000 2,500Work disruption . . . . . . . . . . . . . . . . . . . . 9,900 2,500Legal and administrative . . . . . . . . . . . . . 18,000 2,100
Subtotal . . . . . . . . . . . . . . . . . . . . . . . . 670,900 28,400Quality of life . . . . . . . . . . . . . . . . . . . . . . 1,900,000 18,000
Total . . . . . . . . . . . . . . . . . . . . . . . . . . . 2,570,900 46,400
costs of injuries, workers’ compensation data were used.Household work loss was estimated on the basis of $0.214 inlost household production for each dollar of wage loss. Thistook into account reduced wages from workers’ compensation,sick leave, and lost fringe benefits. Workplace disruption andemployer productivity loss costs included supervisor’s timespent in dealing with the incident. In addition, a fatal injurycosts 4 months of productivity (wages plus fringe benefits) due
to recruitment, retraining, and lost special skills. A com-pensable lost-time work injury cost 1 month of productivity.Legal and administrative costs were computed using multipliersfor health insurance, life and disability insurance, workers’compensation, auto liability insurance, auto property damageinsurance, and sick leave. These costs are summarized intable 2 (Miller and Galbraith 1995:December 1990 dollars).
CONSIDERATIONS FOR CHOOSING A DUMPING METHOD
Edge-dumping is favored by mine operators because it is thesimplest method—just back a truck up to a berm and dump.Most of the material falls over the edge, so there is a minimalamount of dozer work required to maintain the berm.Consequently, the effective life of the dozer is longer becausethe dozer is used less.
With edge-dumping, the material is basically in place andonly needs to be sculpted to maintain the berm. This requiresthat only 20% to 50% of the material needs to be moved by thedozer, and this for only a very short distance. This situationcontrasts with short-dumping, where 100% of the material mustbe moved by dozer. Because material is dumped back from theedge, it must be moved a greater distance than edge-dumpedmaterial. Thus, short-dumping requires more material to bemoved over a greater distance than does edge-dumping.
There are, however, circumstances where short-dumping ispreferred. In three situations in particular, short-dumping isstrongly advisable for safety reasons. The first is when thespoil pile has been loaded out. This occurs when material hasbeen removed from the lower part of the slope of the spoil pile,causing a steep wall that exceeds the natural angle of repose ofthe material. The main danger in this situation is that the addedweight of a loaded truck at the upper edge of the pile couldcause the wall to collapse. If the truck falls over the edge, thedriver is likely to be injured, and any machine or worker at thebottom may be buried by collapsing material.
The second situation is when there are cracks in the edge ofthe pile. The presence of cracks increases the likelihood thatthe edge will collapse if any weight is added. Figure 3 shows

5
an edge with cracks. It is best to use a dozer to push morematerial over the edge to stabilize the spoil pile before any otherequipment is allowed near the edge.
The third circumstance where edge-dumping should beavoided is when the berm along the edge is too low. To avoid
having the truck go through the berm and over the edge whendumping, the berm should be at least the height of the axle ofthe largest piece of equipment dumping at the berm. The mainfunction of the dozer during edge-dumping is to ensure that theberm is adequately maintained.
COST MODELING
There are several approaches available for cost modeling,and which one is chosen depends primarily on the level ofdetailed information available, the precision required for costs,and the amount of time and personnel available to perform acost analysis. The general approach for prefeasibility studies isto use generalized cost equations with limited design variables.These equations are most commonly a geometric regressionequation in the form y = axb, where y is the cost, a and b areconstants, and x is the design variable (tons per day, forexample). This type of approach is most useful for calculatingthe overall cost of a mine in a short amount of time with limitedengineering design required (Camm 1991; O’Hara andSuboleski 1992; Schumacher 1997).
A more detailed approach involves a specific engineeringdesign that itemizes the particular requirements of each unitprocess in the mine. This includes estimating specific laborrequirements, types of supplies and their consumption amountsper day (or per ton), and equipment (type, size, number of each)
and its utilization. Using all these detailed items and amounts,a more specific (and accurate) cost estimate is calculated. Casestudies of actual mining operations with characteristics similarto the mine being evaluated can provide guidance in developingengineering designs (Camm 1995; Gentry and O’Neil 1984).
A cost-modeling approach to studying the economic effectsof injury prevention provides a useful tool for promoting publichealth. It puts the cost of safety, and perhaps more importantly,the cost (and consequences) of minimizing or ignoring safety,into terms that will get the attention of decision makers. Whilethe concept of worker safety is readily agreed upon by mostpeople, in practice it often is sublimated to perceived economicexpediencies. By demonstrating that injury prevention not onlymakes good social and public relations sense, but is also goodeconomic sense, there is increased likelihood that newapproaches to injury prevention will be embraced with moreenthusiasm.
COST CATEGORIES
The cost of operating a dozer at a dump site is the mainvariable to consider when comparing edge-dumping and short-dumping. These costs can be divided into two broad categories,labor and equipment.
Labor costs depend on numerous factors: geographiclocation, availability of experienced workers, commodity beingmined, size of the mine, unionized or nonunionized labor, useor nonuse of contractors, and size of the corporation operatingthe mine. Hourly wages paid to an equipment operator areusually considered a direct operating cost (Gentry and O’Neil1984; Humphreys 1991).
Added to the direct costs of wages is the wage (or labor)burden. This factor includes insurance, Social Security taxes(FICA), unemployment tax, and other expenses that are basedon hourly wages. Table 3 provides a summary of the typical
items included in labor calculations. The wage burden can addfrom 25% to 58% to labor costs at surface coal mines in thewestern United States (Schumacher 1998).
Indirect labor costs include maintenance, supervision,support services, administration, and overhead.
Equipment costs can be broadly divided into two categories,operating cost and capital cost (Camm 1994b; Gentry andO’Neil 1984; Humphreys 1991; Schumacher 1996). Operatingcosts include what is consumed or used during actual operationof equipment. Replacement and repair of parts during normaloperation of equipment, diesel fuel, lubrication, tires, andmaintenance labor costs are all included in equipment operatingcosts. These costs are expressed in dollars per hour ofequipment operation, dollars per ton of ore mined, or dollars perday.

6
Table 3.—Breakdown of labor expenses (adapted from Schumacher 1998; Pruitt 1998)
Federal:Social Security (FICA) . . . . . . . . . . . . . . . . . . . . . . . . . 6.2% of wages less than $68,400Medicare . . . . . . . . . . . . . . . . . . . . . . . . . . . . . . . . . . . 1.45% of all wagesUnemployment tax (FUTA) . . . . . . . . . . . . . . . . . . . . . 6.2% of wages less than $7,000
0.8% of wages less than $7,0001
Black lung insurance . . . . . . . . . . . . . . . . . . . . . . . . . . $500 lump sum annuallyState (varies by state. Wyoming is used as an example below.):
Unemployment insurance . . . . . . . . . . . . . . . . . . . . . . 0.30-8.80% of wages less than $12,500Workers compensation . . . . . . . . . . . . . . . . . . . . . . . . $0.91 per $100 of all wagesOther misc. (Federal, state, or local) . . . . . . . . . . . . . . Varies
Company (dollars per month, varies by company):Medical insurance . . . . . . . . . . . . . . . . . . . . . . . . . . . . $300Dental insurance . . . . . . . . . . . . . . . . . . . . . . . . . . . . . (included in medical)Vision insurance . . . . . . . . . . . . . . . . . . . . . . . . . . . . . (included in medical)Disability insurance . . . . . . . . . . . . . . . . . . . . . . . . . . . $50Life insurance . . . . . . . . . . . . . . . . . . . . . . . . . . . . . . . $20Black lung insurance . . . . . . . . . . . . . . . . . . . . . . . . . . $20Auto liability insurance . . . . . . . . . . . . . . . . . . . . . . . . . $20Excess liability insurance . . . . . . . . . . . . . . . . . . . . . . . $20
Total insurance . . . . . . . . . . . . . . . . . . . . . . . . . . . . . $430Company retirement contribution . . . . . . . . . . . . . . . . . . . 0-10% of all wagesOther miscellaneous . . . . . . . . . . . . . . . . . . . . . . . . . . . . . VariesPaid leave (typical range, days per year):Holidays . . . . . . . . . . . . . . . . . . . . . . . . . . . . . . . . . . . . . . 10-12Vacation . . . . . . . . . . . . . . . . . . . . . . . . . . . . . . . . . . . . . . 10-25 (depending on length of service)Sick leave . . . . . . . . . . . . . . . . . . . . . . . . . . . . . . . . . . . . . 0-10
Total leave . . . . . . . . . . . . . . . . . . . . . . . . . . . . . . . . 20-47 TOTAL BURDEN (for surface coal, western United States) 25-58%, average 40% nonunion, 43%union. 1Tax rate is 6.2%; a credit up to 5.4% can be taken for state unemployment taxes paid. If the full5.4% state credit is taken, the effective Federal rate is 0.8%.
COST ANALYSIS
Overall operating costs typical for surface mines aresummarized in table 4. These are direct mine operating costsand do not include administrative, infrastructure, corporateoverhead, or mineral processing costs. Depending on the costestimation system used and the tonnage of material moved, totaloperating mining costs for a surface operation can vary from$0.96 to $1.46 per ton of material moved. Costs are adjusted to1998 dollars using Mining Cost Service indexes (Schumacher1999).
The choice of which earthmoving machine to use at a dumpsite will depend on the amount of material that must be moved.The most common dozer sizes found at operating mines areCaterpillar’s D10 or D11 (or an equivalent machine). At siteswith less capacity requirements and where the dozer is used toclean up away from the dump as well as to maintain the dump
site, rubber-tired dozers are often used. Using data from theCaterpillar Performance Handbook (Caterpillar 1996) thecapacities of D10, D11, and 834D dozers over distances of 15and 30 m are summarized in table 5.
Table 4.—Operating costs for surface mines calculated usingvarious cost models, dollars per metric ton of material
moved (all costs adjusted to 1998 dollars)
Cost model Ore production, mt/d10,000 20,000 40,000
Camm (1991) . . . . . . . . . . . . . 1.43 1.29 1.17Camm (1994a) . . . . . . . . . . . . 1.46 1.30 1.16Schumacher (1997) . . . . . . . . . 1.21 1.12 0.96 NOTE: All costs based on a stripping ratio of 2:1. Details of costequations appear in appendix.

7
In many cases, a mine will be able to switch to short-dumping using existing equipment. For example, if a mine useda D11 dozer and produced 40,000 mt/d of waste, then it couldmeet the requirements for edge-dumping (table 5). Assumingthat short-dumping would require 15 m of dozing distance, theD11 is still adequate to meet the needs of the mine. Table 6indicates that operating costs for a dozing distance of 15 to30 m would increase by $0.011/mt of waste material moved onthe spoil pile. Based on a typical direct mine operating cost of$1.10/mt of material moved by edge-dumping, short-dumpingwould increase costs by $0.01/mt, an increase of 0.9%. Aconstant labor wage for the dozer operator of $19.49/h is usedin table 6. The wage burden would add 40% ($7.80/h), for atotal labor cost of $27.29/h. Equipment costs are comparedfor three common dozer sizes: a large rubber-tired dozer(equivalent to a Caterpillar model 834B) and two track-typedozers (equivalent to Caterpillar models D10 and D11).
For comparative purposes, the costs in table 6 are given forsurface mines having a stripping ratio of 2:1 and average dozingdistances of 15 m for edge-dumping and 30 m for short-dumping. Capital costs for minerals extraction at a surfacemine (excluding infrastructure and minerals processing) are$24 million, $53 million, and $94 million for productioncapacities of 10,000, 20,000 and 40,000 mt/d of ore,respectively, in 1998 dollars (Schumacher 1996). The appendixcontains details of individual cost calculations.
Depreciation schedules are set by the Internal RevenueService at a fixed rate over 7 years for mobile mining equipment(Internal Revenue Service 1998). Whether the equipment isused constantly or for only a few hours a day, depreciation isthe same for tax purposes.
Estimated capital costs for dozers are $584,000 for a 834B(rubber-tired), $790,000 for a D10, and $1,216,000 for a D11(both the D10 and the D11 are track-type machines)(Schumacher 1996). Unit costs are estimated based onpublished sources and represent typical costs.
Equipment purchase costs and operating costs (table 6) canvary markedly from mine to mine, depending on geographiclocation and the corresponding availability of experiencedlabor; size of mine; use of union or nonunion labor; size,type, and age of equipment; and effectiveness of equipmentmaintenance program. Because of this variability, costs usedhere should be considered only as illustrative of the modelingprocess. Any actual mine is going to have specific labor wages,labor burdens, and equipment costs unique to its operation.
As an example, a mine that extracts 20,000 mt of ore per dayand has a stripping ratio of 2:1 will produce 40,000 mt of wasteper day. Using edge-dumping and assuming only 20% of thematerial needed to be moved, a dozer should be able to move anaverage of 8,000 mt/d for a distance of 15 m. All three of thedozers in table 5 could handle this requirement. If the mineused short-dumping, all 40,000 mt of waste per day would needto be moved an average distance of 30 m. Based on theinformation in table 5, a D11 would probably be necessary.Actual operating costs per ton moved would decrease becauseof the increased efficiency of a D11. However, because morematerial is being moved, operating costs per day would increaseby $624/d (8,000 mt/d × $0.047/mt = $376/d versus 40,000 mt/d× $0.025/mt = $1,000/d).
Based on a mining cost of $1.10/mt of material moved and60,000 mt of ore and waste mined per day, the estimated dailyoperating cost is $66,000/d. The $624/d is slightly less
Table 5.—Estimated dozer production capacities
Dozer model Av. dozing distance, m 1Lm3/h Material moved, mt/h 2 Daily capacity, mt/dD10 . . . . . . . . . . . . . . 15 2,600 3,640 49,500
30 1,500 2,100 28,500D11 . . . . . . . . . . . . . . 15 4,000 5,600 76,100
30 2,200 3,080 41,800834D . . . . . . . . . . . . . 15 1,100 1,540 20,900
30 650 910 12,300 1Lm3 = Loose cubic meters. This term refers to material that has been excavated and therefore is less dense than itsequivalent volume in the ground. 2Based on 1.4 Lm3/h, 85% equipment availability, two 8-h shifts per day. (Source: Caterpillar 1996)
Table 6.—Estimated operating dozer costs
Dozer model Av. dozing distance, m Operating cost, $/h Material moved, mt/h Operating costs, $/mt D10 . . . . . . . . . . . . . . . 15 $62.24 3,460 $0.017
30 62.24 2,100 0.030D11 . . . . . . . . . . . . . . . 15 78.27 5,600 0.014
30 78.27 3,080 0.025834D . . . . . . . . . . . . . . 15 71.68 1,540 0.047
30 71.68 910 0.079NOTE: All costs in 1998 dollars. Based on Schumacher 1996.
8
than a 1% increase in daily mine operating costs. The increasein capital costs for a D11 over an 834D is $632,000($1,216,000 to $584,000). The estimated capital cost for a20,000-mt/d surface mine is $52 million, which is an increaseof 1.2%.
If nonroutine costs were included, such as for repairing atruck that has fallen over an edge, for loss of use of that truck,and for the use of equipment needed to free a truck after it hasbeen stuck, then the cost difference between the two methodswould be reduced further.
SUMMARY
There were 370 lost-time accidents involving haulage trucksat mine dump sites between 1988 and 1997. One-hundredthirty-seven involved trucks falling over an edge. According toMiller (1997), the direct cost of a fatality to an employer is$9,900 and the cost of a lost workday injury is $1,600. Directemployer costs of fatalities or injuries are a small proportion oftotal costs. According to Miller and Galbraith (1995), the totalcost of a fatality can be $2,590,900 and the cost of a nonfatalwork injury $46,400.
Edge-dumping is the most common method for dumpingwaste at mine spoil piles. Short-dumping is usually employed
when there is a safety concern about edge-dumping. The addedcost of short-dumping can be quite variable depending on thecircumstances. In test calculations, short-dumping added about1% to both mine operating and capital costs. The largest costdifference was seen when a rubber-tired dozer was initially usedfor both edge-dumping at the spoil pile and for other duties,such as shovel clean-up, and it became necessary to switch toshort-dumping, which required a larger track-type dozer to beused at the spoil pile full-time.
ACKNOWLEDGMENTS
The author would like to thank Fred Turin and WilliamWiehagen (industrial engineers, PRL) for providing informa-tion on haulage truck injuries at dump sites and theirparticipation in field visits to several mining operations. Thefollowing personnel were also kind enough to provide minetours or information on their operations: Aaron Grinager,
Michael Lock, and Doug White (Glenrock Coal Co., Glenrock,WY); Jeff Whipple and Pat James (Bridger Coal Co., RockSprings, WY); Dave McCarthy (Black Butte Coal Co., Port ofRocks, WY); and William Pruitt (Kiewit Mining Group,Omaha, NE).
REFERENCES
Camm, T. W. Simplified Cost Models for Prefeasibility MineralEvaluations. U.S. Bur Mines Inform. Cir. 9298, 1991, 35 pp.___. Engineering Analysis Cost Models for the East Mojave National ScenicArea, California. U.S. Bur. Mines OFR 6-94, January 1994a, 45 pp.___. Simplified Cost Models for Prefeasibility Mineral Evaluations. MiningEngineering, v. 46, no. 6, June 1994b, pp. 559-562.___. The Relationship Between Engineering Design and Cost Estimation inCut-and-Fill Mine Stopes. Ph. D. dissertation, Univ. of Idaho, Moscow, ID,1995, 240 pp.
Caterpillar, Inc. (Peoria, IL.) Caterpillar Performance Handbook, 27th ed.,1996, 942 pp.
Gentry, D. W. and T. J. O’Neil. Mine Investment Analysis. SME., Littleton,CO, 1984, 502 pp.
Humphreys, K. K., ed. Jelen’s Cost and Optimization Engineering, 3rd ed.McGraw-Hill, 1991, 631 pp.
Internal Revenue Service. How To Depreciate Property. Publi. 946, 1998,104 pp.
Krowczyk, C. Haulage Fatalities at Surface Coal Mines, 1991-1994. MineSafety and Health Administration, Office of Injury and EmploymentInformation, Denver, CO. 1995.
Leigh, J. P., S. Markowitz, M. Fahs, J. Bernstein, L. Mishel, C. Shin, andP. Landrigan. Costs of Occupational Injuries and Illnesses in 1992: FinalNIOSH Report for Cooperative Agreement with E.R.C., Inc. U60/CCU902886.NIOSH, 1996, 98 pp.
Leigh, J. P., S. B. Markowitz, M. Fahs, C. Shin, and P. J. Landrigan.Occupational Injury and Illness in the United States. Archives of InternalMedicine, v. 157, July 28, 1997, pp. 1557-1568.
May, J. P. Analysis of Dump-Point Accidents Involving Mobile MiningEquipment. U. S. Bur. Mines Inform. Cir. 9250, 1990, 19 pp.
Miller, T. R. Estimating the Costs of Injury to U.S. Employers. Journal ofSafety Research., v. 28, no. 1, 1997, pp. 1-13.
Miller, T. R. and M. Galbraith. Estimating the Costs of Occupational Injuryin the United States. Accident Analysis and Prevention, v. 27, no. 6, 1995,pp. 741-747.
O’Hara, T. A. and S. C. Suboleski. Costs and Estimation. In SME MiningEngineering Handbook, ed. by H. L. Hartman. SME, Littleton, CO, 1992,pp. 405-424.
Pruitt, W. Kiewit Mining Group, Inc., personal communication, Omaha,NE, 1998.
Schumacher, O. L., ed. Mining Cost Service. Western Mine Engineer.Spokane, WA, 1999, 1998, 1997, 1996.
Viscusi, W. K. The Dangers of Unbounded Commitments To RegulateRisk. In Risks, Costs, and Lives Saved: Getting Better Results fromRegulation, ed. by R. W. Hahn. Oxford Univ. Press, New York, 1996,pp. 135-166.
9
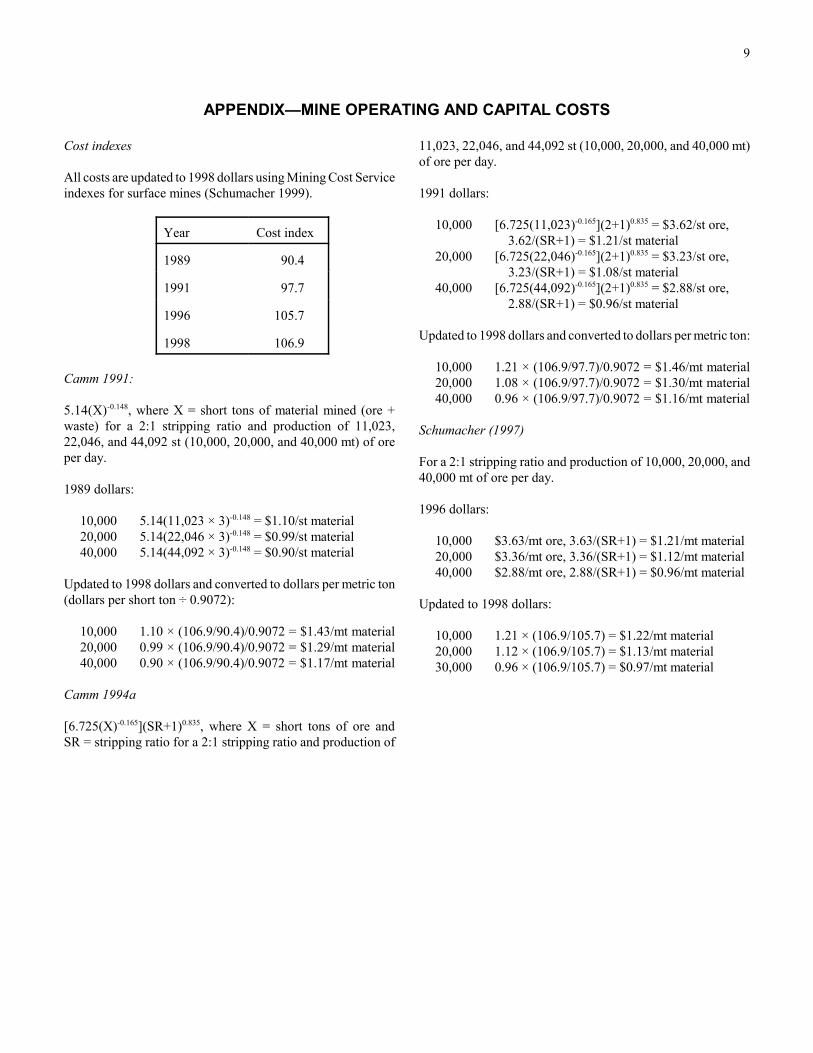
APPENDIX—MINE OPERATING AND CAPITAL COSTS
Cost indexes
All costs are updated to 1998 dollars using Mining Cost Serviceindexes for surface mines (Schumacher 1999).
Year Cost index
1989 90.4
1991 97.7
1996 105.7
1998 106.9
Camm 1991:
5.14(X)-0.148, where X = short tons of material mined (ore +waste) for a 2:1 stripping ratio and production of 11,023,22,046, and 44,092 st (10,000, 20,000, and 40,000 mt) of oreper day.
1989 dollars:
10,000 5.14(11,023 × 3)-0.148 = $1.10/st material 20,000 5.14(22,046 × 3)-0.148 = $0.99/st material 40,000 5.14(44,092 × 3)-0.148 = $0.90/st material
Updated to 1998 dollars and converted to dollars per metric ton(dollars per short ton ÷ 0.9072):
10,000 1.10 × (106.9/90.4)/0.9072 = $1.43/mt material20,000 0.99 × (106.9/90.4)/0.9072 = $1.29/mt material40,000 0.90 × (106.9/90.4)/0.9072 = $1.17/mt material
Camm 1994a
[6.725(X)-0.165](SR+1)0.835, where X = short tons of ore andSR = stripping ratio for a 2:1 stripping ratio and production of
11,023, 22,046, and 44,092 st (10,000, 20,000, and 40,000 mt)of ore per day.
1991 dollars:
10,000 [6.725(11,023)-0.165](2+1)0.835 = $3.62/st ore, 3.62/(SR+1) = $1.21/st material
20,000 [6.725(22,046)-0.165](2+1)0.835 = $3.23/st ore, 3.23/(SR+1) = $1.08/st material
40,000 [6.725(44,092)-0.165](2+1)0.835 = $2.88/st ore, 2.88/(SR+1) = $0.96/st material
Updated to 1998 dollars and converted to dollars per metric ton:
10,000 1.21 × (106.9/97.7)/0.9072 = $1.46/mt material20,000 1.08 × (106.9/97.7)/0.9072 = $1.30/mt material40,000 0.96 × (106.9/97.7)/0.9072 = $1.16/mt material
Schumacher (1997)
For a 2:1 stripping ratio and production of 10,000, 20,000, and40,000 mt of ore per day.
1996 dollars:
10,000 $3.63/mt ore, 3.63/(SR+1) = $1.21/mt material20,000 $3.36/mt ore, 3.36/(SR+1) = $1.12/mt material40,000 $2.88/mt ore, 2.88/(SR+1) = $0.96/mt material
Updated to 1998 dollars:
10,000 1.21 × (106.9/105.7) = $1.22/mt material 20,000 1.12 × (106.9/105.7) = $1.13/mt material 30,000 0.96 × (106.9/105.7) = $0.97/mt material

DHHS (NIOSH) Publication No. 2000-129
2000
To receive other information about occupational safety and health problems, call1-800-35-NIOSH (1-800-356-4674), or
visit the NIOSH Home Page on the World Wide Web at
http://www.cdc.gov/niosh