economics of obesity - of the university of...
TRANSCRIPT
Economics of Obesity
Jay BhattacharyaStanford University
May 2010
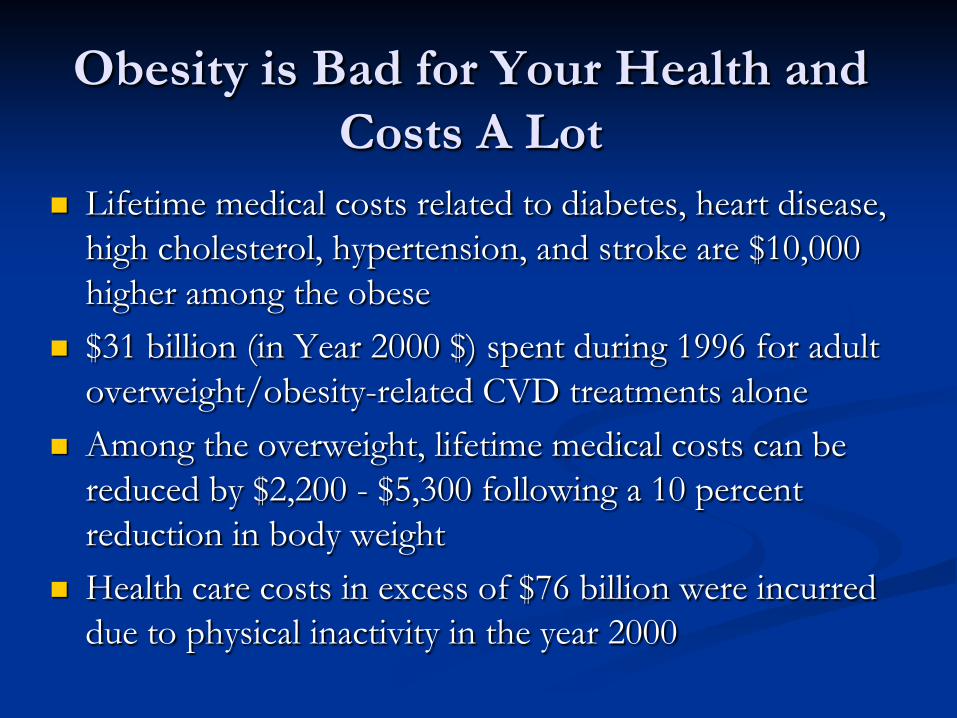
Obesity is Bad for Your Health and Costs A Lot
Lifetime medical costs related to diabetes, heart disease, high cholesterol, hypertension, and stroke are $10,000 higher among the obese
$31 billion (in Year 2000 $) spent during 1996 for adult overweight/obesity-related CVD treatments alone
Among the overweight, lifetime medical costs can be reduced by $2,200 - $5,300 following a 10 percent reduction in body weight
Health care costs in excess of $76 billion were incurred due to physical inactivity in the year 2000
Key Question: Who Pays for Obesity?
If you pay all the costs of decisions about your weight, there is little place for intervention by others who do not pay these costs.
But if others pay the costs there may be a (Pigouvian) justification for intervention.
Obesity Externalities
Health insurance costsDisability, morbidity, and mortality
costsFamily and friends externalities
Obesity and Health Insurance: Two Stories
Splitting the bill Insurance without moral hazard

Obesity and Private Insurance
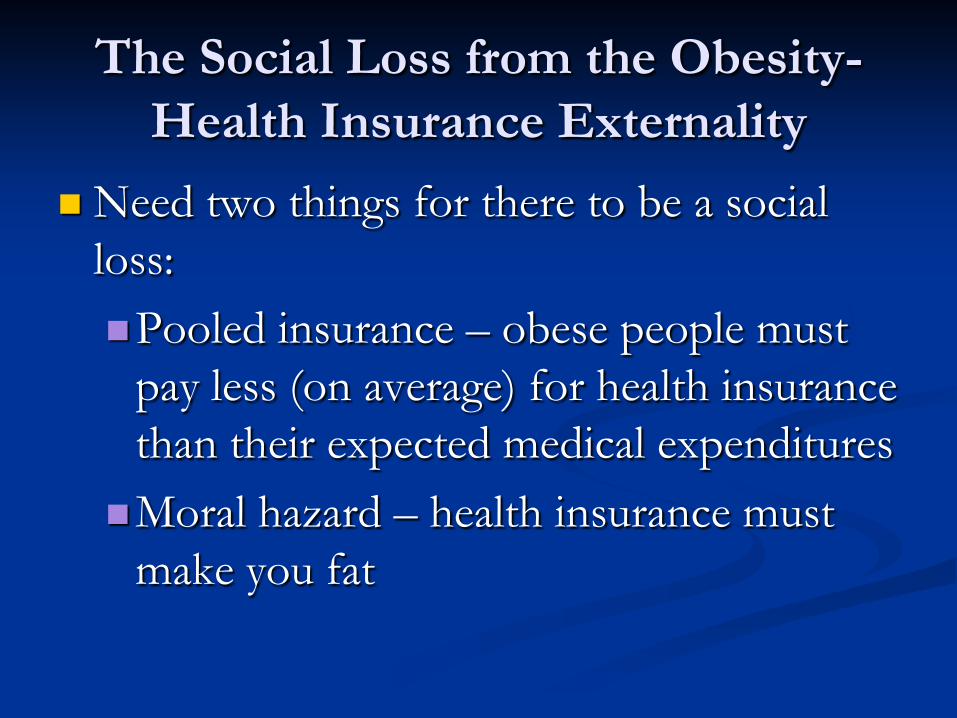
The Social Loss from the Obesity-Health Insurance Externality
Need two things for there to be a social loss:Pooled insurance – obese people must
pay less (on average) for health insurance than their expected medical expenditures
Moral hazard – health insurance must make you fat
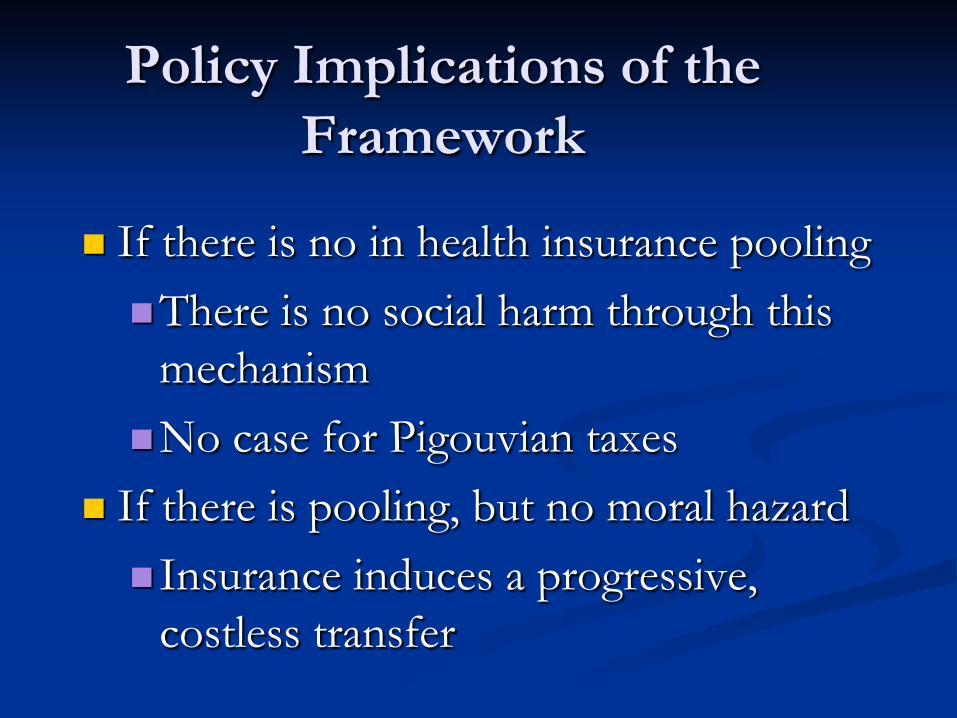
Policy Implications of the Framework
If there is no in health insurance pooling There is no social harm through this
mechanismNo case for Pigouvian taxes
If there is pooling, but no moral hazardInsurance induces a progressive,
costless transfer
Is There Pooling In Private Insurance?

Wages and Obesity
Obese workers earn less than thinner workers with equivalent job experience and education.
Some have argued that this is evidence of labor market discrimination against the obese.
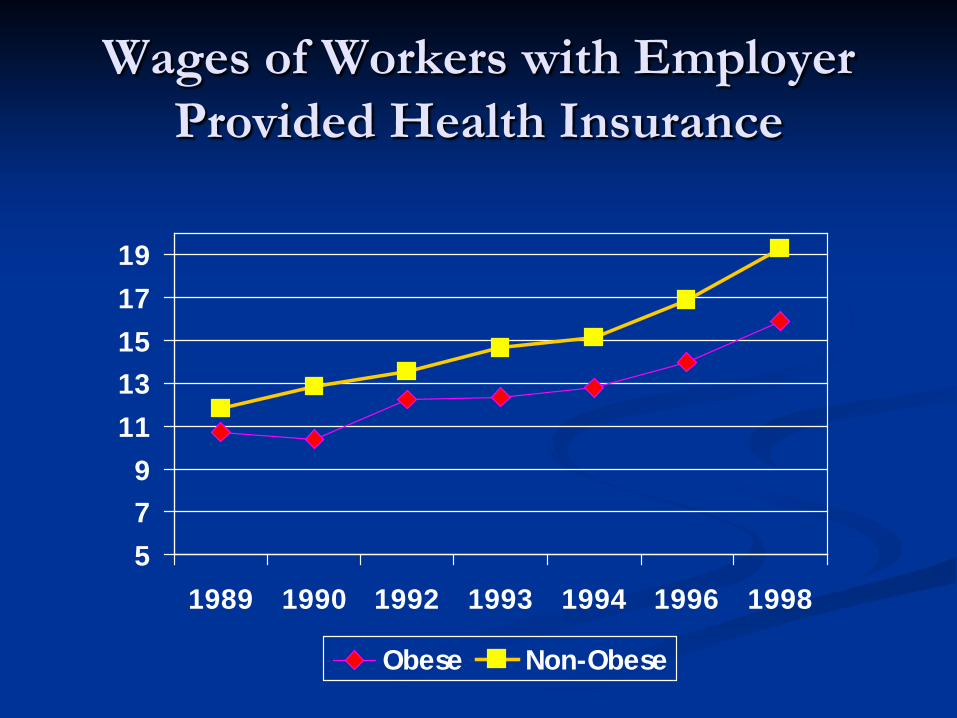
Wages of Workers with Employer Provided Health Insurance
579
1113151719
1989 1990 1992 1993 1994 1996 1998
Obese Non-Obese
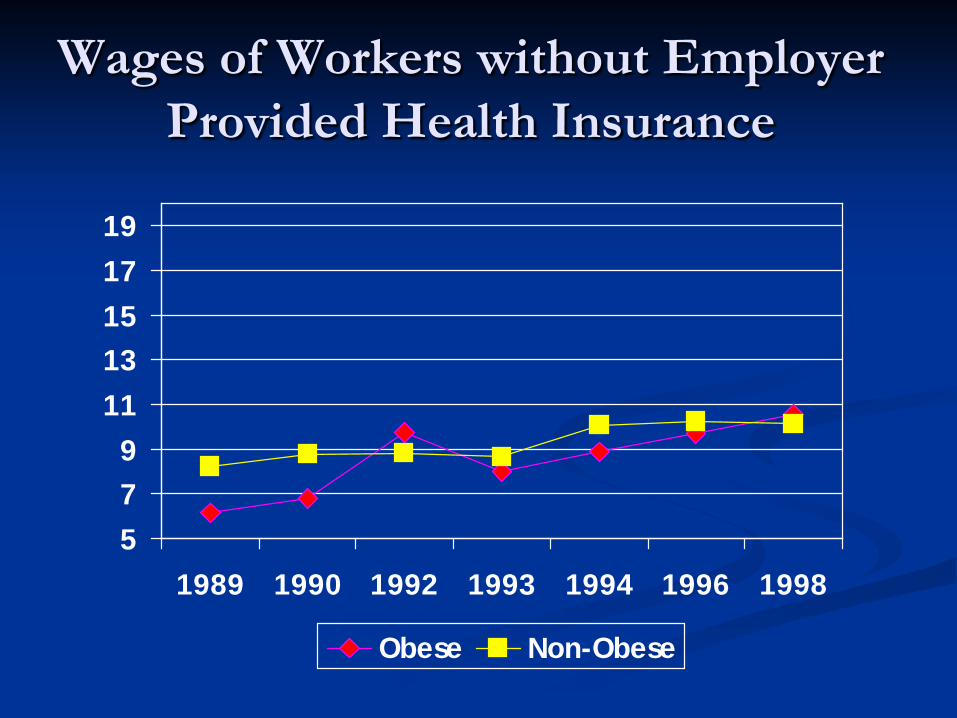
Wages of Workers without Employer Provided Health Insurance
579
1113151719
1989 1990 1992 1993 1994 1996 1998
Obese Non-Obese
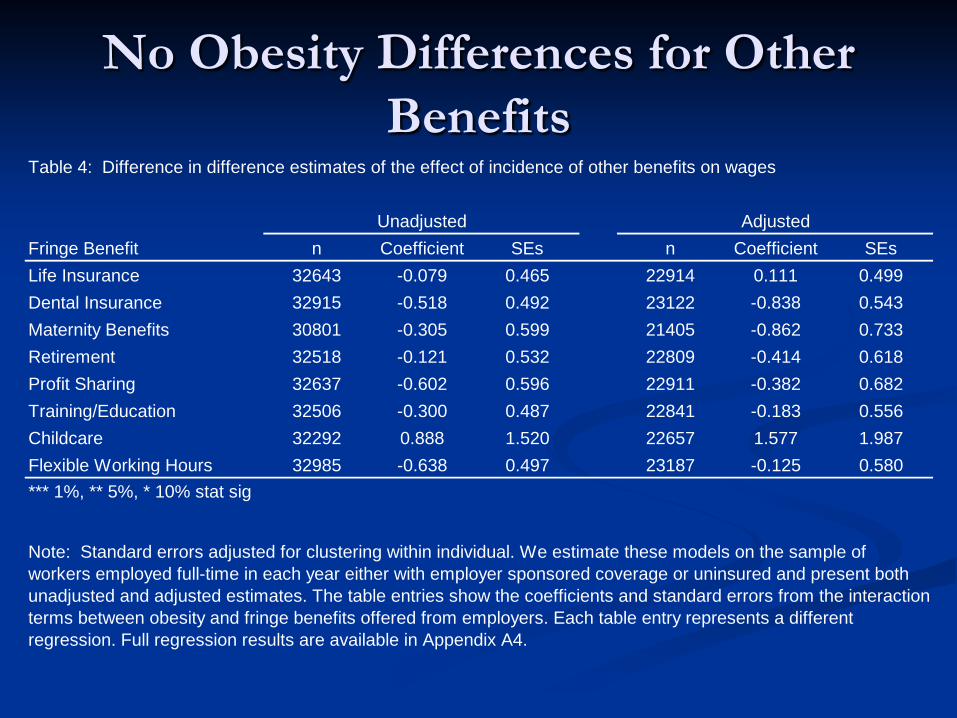
No Obesity Differences for Other Benefits
Table 4: Difference in difference estimates of the effect of incidence of other benefits on wages
Fringe Benefit n Coefficient SEs n Coefficient SEsLife Insurance 32643 -0.079 0.465 22914 0.111 0.499Dental Insurance 32915 -0.518 0.492 23122 -0.838 0.543Maternity Benefits 30801 -0.305 0.599 21405 -0.862 0.733Retirement 32518 -0.121 0.532 22809 -0.414 0.618Profit Sharing 32637 -0.602 0.596 22911 -0.382 0.682Training/Education 32506 -0.300 0.487 22841 -0.183 0.556Childcare 32292 0.888 1.520 22657 1.577 1.987Flexible Working Hours 32985 -0.638 0.497 23187 -0.125 0.580*** 1%, ** 5%, * 10% stat sig
Unadjusted Adjusted
Note: Standard errors adjusted for clustering within individual. We estimate these models on the sample of workers employed full-time in each year either with employer sponsored coverage or uninsured and present both unadjusted and adjusted estimates. The table entries show the coefficients and standard errors from the interaction terms between obesity and fringe benefits offered from employers. Each table entry represents a different regression. Full regression results are available in Appendix A4.
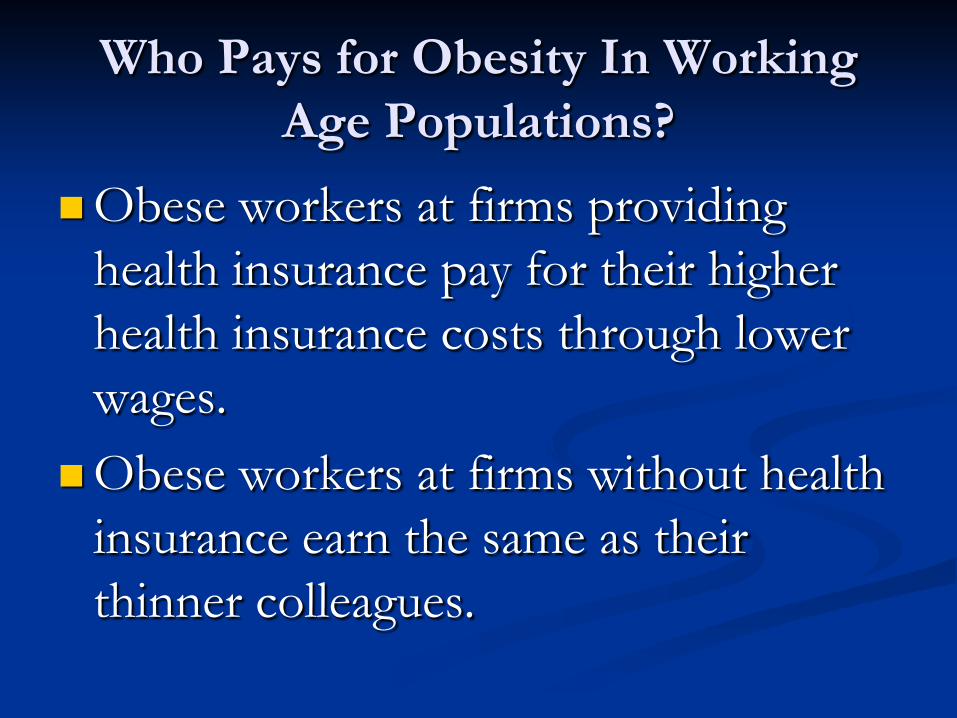
Who Pays for Obesity In Working Age Populations?
Obese workers at firms providing health insurance pay for their higher health insurance costs through lower wages.
Obese workers at firms without health insurance earn the same as their thinner colleagues.

Medicare and Obesity
There is no mechanism in Medicare financing to charge higher premiums to the obese
Obese individuals pay less for Medicare…They earn lower wages
…and get more They are unhealthier when they turn 65
Does Medicare Induce a Social Loss?
It depends upon the incentives created by the transfer to obese individuals induced by Medicare.
If the transfer does not change eating and exercise incentives, then there is no social loss.
Does More Generous Health Insurance Make You Fat?

RAND Health Insurance Experiment
Experiment run in the late 1970s to mid-1980sFamilies stayed in experiment for ~5
years
Random Assignment to Insurance
Free plan (no out of pocket costs of health care)
25% coinsurance (families paid 25% of health care costs)
50% coinsurance 95% coinsurance
RAND Health Insurance Experiment Reanalyzed
Goal: measure the insurance elasticity of body weight
If insurance induces moral hazard, we should expect the greatest gain in weight among people assigned to the most generous insurance (free plan)
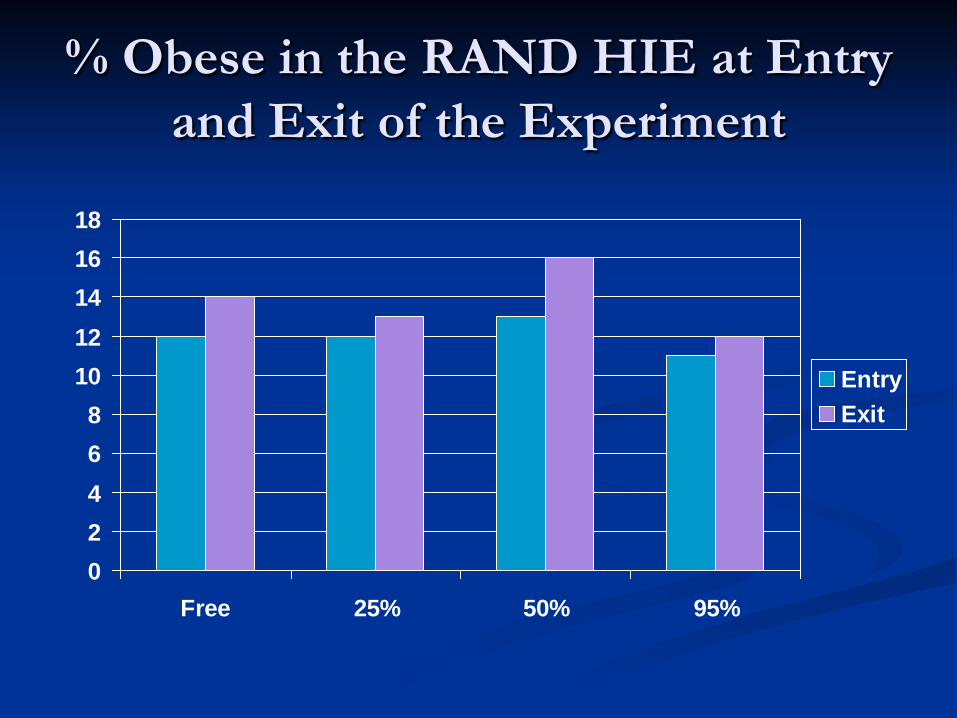
% Obese in the RAND HIE at Entry and Exit of the Experiment
02468
1012141618
Free 25% 50% 95%
EntryExit
Unintended Consequences of Price Interventions

Unintended Consequences of Food Taxes
Ideally, a food tax should be assessed on the 2500th calorie (and above) eaten during the day, not on the 1st
Political economy problems:Is granola junk food? Who decides?
Tax may cause undue hardship for the poor
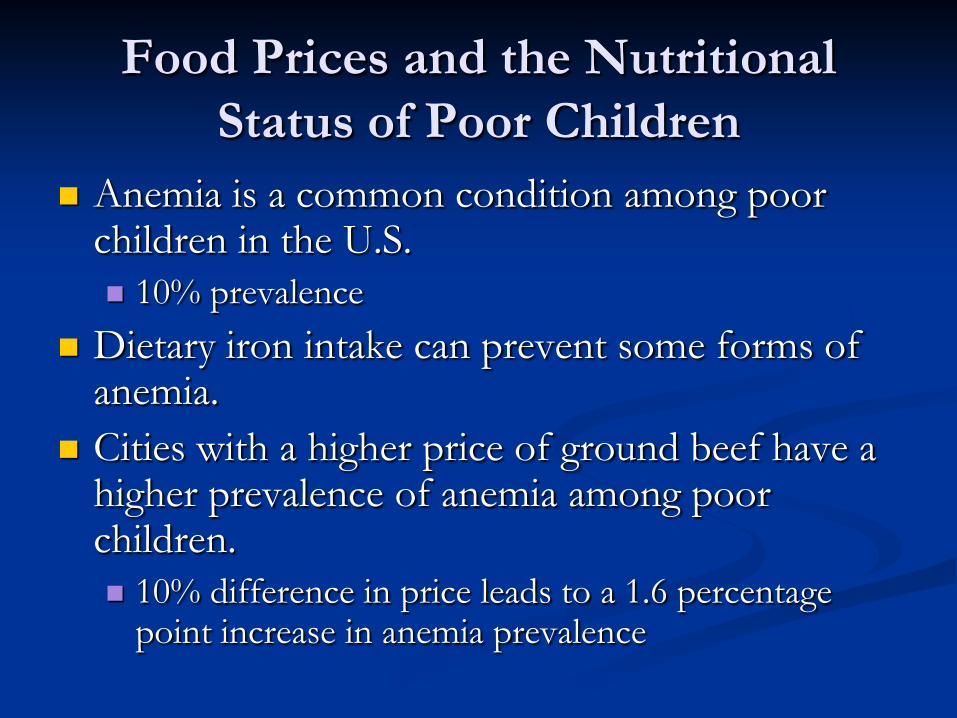
Food Prices and the Nutritional Status of Poor Children
Anemia is a common condition among poor children in the U.S. 10% prevalence
Dietary iron intake can prevent some forms of anemia.
Cities with a higher price of ground beef have a higher prevalence of anemia among poor children. 10% difference in price leads to a 1.6 percentage
point increase in anemia prevalence

Dependent variable (mean) All Ages All AdultsVitamin A deficiency (7%)
Price of Peaches 0.035(0.036)
-0.013(0.017)
Price of Milk 0.056(0.046)
0.075**
(0.024)Vitamin C deficiency (12%)
Price of Peaches 0.181**
(0.050)0.212**
(0.063)Price of Orange Juice 0.064*
(0.036)0.078*
(0.044)Folate deficiency (16%)
Price of Orange Juice 0.138**
(0.055)0.196**
(0.072)Price of Bread 0.195
(0.122)0.258(0.165)
Anemia (10%)Price of Ground Beef 0.106**
(0.051)0.063(0.048)
Effect of food prices on serum nutrient deficiencies
Evidence from the National Health and Nutrition Examination Survey III