economics of high voltage dc networks - certs.lbl.gov of high voltage dc networks . m ... the...
TRANSCRIPT

PNNL- 25704
Prepared for the U.S. Department of Energy Under Contract DE-AC05-76RL01830
Economics of High Voltage dc Networks M Elizondo H Kirkham March 2016


DISCLAIMER This documentation was prepared as an account of work sponsored by an agency of the United States Government. Neither the United States Government nor any agency thereof, nor Battelle Memorial Institute, nor any of their employees, makes any warranty, express or implied, or assumes any legal liability or responsibility for the accuracy, completeness, or usefulness of any information, apparatus, product, or process disclosed, or represents that its use would not infringe privately owned rights. Reference herein to any specific commercial product, process, or service by trade name, trademark, manufacturer, or otherwise does not necessarily constitute or imply its endorsement, recommendation, or favoring by the United States Government or any agency thereof, or Battelle Memorial Institute. The views and opinions of authors expressed herein do not necessarily state or reflect those of the United States Government or any agency thereof.
PACIFIC NORTHWEST NATIONAL LABORATORY
operated by BATTELLE
for the UNITED STATES DEPARTMENT OF ENERGY
under Contract DE-AC05-76RL01830
Printed in the United States of America
Available to DOE and DOE contractors from the Office of Scientific and Technical Information,
P.O. Box 62, Oak Ridge, TN 37831-0062; ph: (865) 576-8401, fax: (865) 576-5728
email: [email protected]
Available to the public from the National Technical Information Service, U.S. Department of Commerce, 5285 Port Royal Rd., Springfield, VA 22161
ph: (800) 553-6847, fax: (703) 605-6900 email: [email protected]
online ordering: http://www.ntis.gov/ordering.htm
This document was printed on recycled paper. (8/00)

PNNL- 25704
Economics of High Voltage dc Networks
M Elizondo H Kirkham
March 2016 Prepared for U.S. Department of Energy under Contract DE-AC05-76RL01830 Pacific Northwest National Laboratory Richland, Washington 99352
Page | ii
Executive Summary
This report is the second from this Laboratory on High Voltage dc networks. It puts less emphasis on the technical aspects of dc networks (that was the subject of the first report), and concentrates on the economics, particularly the matter of trading off one implementation against another. Our target audience includes the regulators and planners of the power industry, those whose decisions depend on understanding the implications of such new technology, and who can influence the development and implementation. We have in mind the US DOE, sponsor1 of the effort; the various engineers at the other government and non-government agencies, such as FERC and NERC; and the reliability coordinators. Utility planners are also likely to be interested, as the many advantages of a dc network await exploitation. After presenting some of the basics of the trade-off, and discussing some of the things to be considered, a number of trade-offs that have appeared in the literature are examined. We look in depth at four large networks for which dc schemes have been presented in the literature. Two are in the US (MISO and WECC) and two are in Europe. The section concludes that reliability and protection are two areas that deserve further attention, but that the problems can be assumed solvable when an economic trade-off is performed. The studies are instructive in that they make little or no use of the “breakeven distance” concept that has seemed to underlie most point-to-point dc systems. Following the discussion of these four studies, we investigate a further seven more briefly. The Report concludes that the economics of dc networks is challenging because of its complexity, but that any sufficiently well understood plan can be subjected to a trade-off that will show whether it has value. The method employed in a study by CIGRE is thought particularly appropriate. There are two Appendices. One deals with the accounting aspects of some of the costs of a large long-duration project such as an HVdc scheme. The other is a summary of a few HVdc schemes throughout the history of the technology
1 The interest of DOE in the subject of HVdc predates this work. Several years ago, DOE held a workshop in which many of the world’s experts in HVdc were present. In April 2013, DOE sponsored another workshop, and again invited experts from around the world. Narain Hingorani, a name known to all in the field because over fifty years ago (along with Colin Adamson, his professor) he wrote the first book in English on HVdc, was the keynote speaker at the latest workshop. The presentations may be found at http://energy.gov/oe/downloads/hvdc-workshop-april-22-2013 (accessed 26 February 2016)

Page | iii
Acknowledgements The authors of this report on HVdc networks acknowledge the financial support of Phil Overholt at the US Department of Energy. We note that his continued sense of the value of the effort as it developed was of importance in maintaining momentum.

Page | iv
Table of Contents
Executive Summary .................................................................................................................. ii
1.0 Background and Introduction ....................................................................................... 1
2.0 Trade-offs........................................................................................................................ 2
2.1 HVdc network value trade-offs ...................................................................................... 3
2.2 Comparing Alternatives: Overview ................................................................................ 5 2.2.1 Requirement Traceability........................................................................................... 5 2.2.2 Effect on Trade-off Study........................................................................................... 7 2.2.3 Adding rigor ............................................................................................................... 7 2.2.4 Factors to Consider in the Trade-off .......................................................................... 8 2.2.5 Simplifications ......................................................................................................... 10 2.2.6 A comment on feasibility ......................................................................................... 11
2.3 Business basics: overview .......................................................................................... 12
3.0 The Literature ............................................................................................................... 15
3.1 MISO Transmission Expansion Planning (MTEP) report 2014. .................................. 16
3.2 The WECC Interactive Transmission Project Portal .................................................... 19
3.3 Technical Limitations towards a SuperGrid – A European Perspective ....................... 21
3.4 Transmission investment problems in Europe: Going beyond standard solutions ....... 22
3.5 Feasibility of DC Transmission Networks .................................................................... 24
3.6 Other Trade-offs in the literature ................................................................................. 25 3.6.1 Barthold, 2006 ......................................................................................................... 25 3.6.2 McDonald, 2016 ...................................................................................................... 27 3.6.3 Li & McCalley, 2015 ................................................................................................ 28 3.6.4 Safety Nets ............................................................................................................. 30 3.6.5 Bell, et al., 2010 ...................................................................................................... 32 3.6.6 Kriegers Flak (50HERTZ;Energinet.dk;Svenska Kraftnät, 2010).............................. 33 3.6.7 CIGRE study of Voltage Source Converter (VSC) HVDC for Power Transmission – Economic Aspects and Comparison with other AC and DC Technologies ......................... 34
4.0 Conclusions .................................................................................................................. 37
5.0 Appendix on cost equations........................................................................................ 39
6.0 Appendix on some interesting HVdc schemes .......................................................... 42
6.1 PDCI: the Pacific DC Intertie ....................................................................................... 42
6.2 North-East India to Agra ............................................................................................. 44
6.3 Russian HVdc ............................................................................................................. 46 6.3.1 Origins ..................................................................................................................... 46 6.3.2 Abandoned UHV line in Russia ............................................................................... 46
7.0 Bibliography ................................................................................................................. 49

Page | v
List of Figures
Figure 1 Basic cash-flow diagram .................................................................................................... 13 Figure 2. MISO Diversity exchange scheme ................................................................................... 16 Figure 3. MISO planned HVdc network (after Fig E3-2 of (MISO 2014)) ..................................... 17 Figure 4. WECC planning map, showing concepts for dc lines ...................................................... 19 Figure 5. DC grid topologies ........................................................................................................... 21 Figure 6 Cost-optimized network (after MacDonald et al) ............................................................. 27 Figure 7 Some of the nodes and lines considered by Li and McCalley ............................................ 29 Figure 8 US-Canada western system safety net ................................................................................ 31 Figure 9 Kriegers Flak Sweden-Denmark-Germany wind power .................................................... 33 Figure 10. Evaluation of losses for four scenarios ............................................................................ 35 Figure 11. 30-year cash flow for assumed overhead line ................................................................ 37 Figure 12 Cash-flow diagram of capital cost recover in equal installments ..................................... 39 Figure 13 Agra-N.E. India HVdc scheme......................................................................................... 44 Figure 14 Map of India, showing areas blacked out in 2012 ............................................................ 45 Figure 15 Map of Europe and Russia, showing route of Ekibastuz-Tambov dc line ....................... 47 Figure 16 Tower of Russian Ekibastuz to Tambov line ................................................................. 48


Page | 1
Economics of High Voltage dc Networks 1.0 Background and Introduction
This work has its origins in a study done by the authors for the Department of Energy that showed that it was technically possible to create a network using direct current technology.1 “Network” in this context specifically means interconnected, in contrast to radial. The transmission system in the US qualifies as interconnected in this sense, the distribution system rarely is. A network has the advantage of redundancy, and that translates into what is commonly termed reliability in power delivery. The study argued that there were no technical barriers that could not be overcome. When that study began, there were no dc networks in existence. Just as it ended, it was announced that a dc network had been commissioned in China (on December 25, 2013), and publication of the report of the study was briefly held up while the authors gathered information about the new system. There are evidently no insuperable obstacles, and at least some arguments in favor of networking direct current. The study we are now embarking on explores the possibilities for applications. Applications stem from the feature that the operation of direct current systems is unlike the operation of ac in that the flow of power in a dc connection must be specifically controlled, whereas the flow in an ac network will naturally adjust to system conditions. The need to control the flow can be turned to advantage in a mixed ac/dc system. In the past, the flow on a dc line has been modulated to add damping to an ac system, for example. So dc lines can not only carry power, they can interact in a controlled way with the ac network. Our purpose here is to study the possibilities offered by the dc system as a network. To see what might make sense, we must understand the economics of the situation: like most engineering decisions, economics is a major factor. The estimation of costs and benefits is a complicated business, and there is no single “right” way. A phased approach like that described in (Westermann, et al. 2012) is usual. The exact details vary from place to place. In this report, we propose that a sort of trade-off study be done that compares the most likely options. Altogether, the idea is to be able to make a supportable statement that some particular option wins over the alternatives on economic grounds.
1 An Introduction to High Voltage dc Networks, H Kirkham, M Elizondo, J Dagle, PNNL-23273, February 2014

Page | 2
2.0 Trade-offs
We intend to examine possible ways to study the use of dc networks as part of the interconnected power delivery system. Such a study may, in the end, conclude that dc networks (specifically, networks) have no role in power delivery. The study in question is called a trade-off study, and it is based on an understanding of the options as they stack up against a set of requirements. (Therefore, we consider the matter of requirements in a later subsection.) A trade-off study may find that dc networks should be allowed to expand as needed, driven by local advantage. That might come about if transmission system owners decide dc networks should be considered as a routine aspect of transmission planning. Or it may find there is a larger gain to be had by planning for dc networks on an interconnection-wide scale. To frame these possibilities for the reader, we begin by re-examining some of the literature on HVdc. There is relatively little on the subject of networks, but the topic of HVdc in general is well covered. We anticipate several categories of application, and we try to expand or generalize from what is presently being considered to what might become possible in a networked delivery system. For example, could a network of dc lines be built purely as a sort of “safety net” for the ac system? The basis for any economic decision regarding dc networks must depart from the traditional way of looking at HVdc vs HVac. For point-to-point lines, the comparison of production cost, market performance and reliability (load loss) for the situation with or without a proposed line would be used as basis. On this basis, dc lines are typically favored for long distances, and the evaluation would typically assume the dc line was heavily loaded most of the time. For the purposes of considering a network, the planner must recognize that some parts of the network will not be fully loaded some of the time. After all, the ac power system network is not fully loaded all the time. That changes the way the cost of the dc network is justified. We expect that a well-done trade-off study would evaluate benefits other than just moving bulk power—for example, those brought by the controllability of the dc lines. For wind farm connection, voltage source converters (the kind we have proposed be used in HVdc networks) have several advantages. For example, the use of VSC HVDC makes a “soft” startup of the wind farm possible, and its flexibility provides a simple way to allow wind turbines to operate at different speeds during different wind conditions. The use of dc in interacting in a controllable way with the ac system was found to be an important technical benefit in our earlier study. Ways to look at the costs and benefits of that kind of interaction are therefore essential.

Page | 3
2.1 HVdc network value trade-offs
The decision to modify a power system in a certain way, for example by adding a dc network, is both a technical decision and an economic one. The planning engineer might advocate some particular solution because of its appeal in terms of controlling the power flow, for example. But the benefit of that control must, in the end, be judged economically. On the assumption that all the factors affecting performance can be given a fair economic value, and on the assumption that all requirements are met by all systems being compared, the system that gets built will usually be the one with the lowest lifetime cost. The process of making the decision will occur in several phases: the selection of the various options to be considered; cost estimation for these various options; and evaluation of the various benefits that will accrue. All this information will then feed into a cash-flow study that will consider the lifetime of the schemes being considered, and provide information for a decision. The lifetime of a power project is often longer than the period of employment of the planners involved. For the anticipated duration, the planner must anticipate load growth and redistribution with reasonable accuracy. That may involve considerations of politics (there could be a number of strategies that affect the trading of power), sustainability (affecting generation), and (these days) perhaps even climate change (which could affect the likelihood of fires or lightning). A fairly-done trade-off study is indicated, and because there are so many factors to take into account, the study should use automated means of comparison as much as possible. That the assumptions behind the calculations in a trade-off are valid is not always easy to verify, and that issue forms a large part of this report. Some of the assumptions are essential and yet can be barely more than guesses. For example, the losses in an HVdc systems are sometimes less than a similar ac system, but the effect on the ac system should be taken into account in calculating losses if it is to be done holistically. (The losses of a VSC terminal may be as much as 1.5% of the load it carries, and that may be an adequate way to estimate the cost of losses for trade-off purposes. The percentage number may seem small, but the dollar number over the life of a project is significant.) The assumptions—that the factors are fairly judged economically, and that the resulting systems can be compared evenly—are somewhat interlinked. For example, is damping control a requirement that must be met, or a desirable feature, but one that is not essential? Without a firm understanding of the answer, no trade-off study stands on firm ground. Guidance for clarifying and elucidating requirements is given below. The trade-off and the generation of final requirements is viewed as an interactive process. It is reasonable to assume that a dc network is a thing large enough that it requires building up over a number of years. Some existing HVdc schemes have been built that way, for example, the Quebec – New England project (McAllum, et al. 1994), and the Pacific DC Interconnection (PDCI) on the west coast. The Quebec – New England project grew by the addition of lines and converters over a number of years.2 The PDCI grew by the gradual upgrading of the line (over the same right of way) and converter ratings, and the installation of new converters.
2 See also https://en.wikipedia.org/wiki/Quebec_%E2%80%93_New_England_Transmission

Page | 4
The present endeavor is aimed at assisting such upgradings and expansions, and adding new dc transmission to existing ac systems. In many ways, engineering is a subset of economics. Certainly the path forward will involve consideration of much that is accounting: the trade-off process is, in essence, a simulation of the accounts for the project. We therefore begin with considering the matter of requirements, and follow by outlining some basic accounting ideas.

Page | 5
2.2 Comparing Alternatives: Overview A trade-off study is essentially an economic endeavor. But for our purposes, comparing ac and dc systems, the things being studied are highly technical. A question that demands an answer is How do we ensure that the trade-off is fair? In the sense that the trade-off is comparing apples and oranges, how do we ensure that the apples and the oranges are in some sense equivalent. It is proposed that the system requirements are the vehicle that can accomplish that. Formal requirements are not easy to write (more on that later) but a trade-off that makes use of less-than-perfectly-formal requirements can be very fruitful.
2.2.1 Requirement Traceability There are several ways that requirements can be “layered.” IEEE 2030 describes a descriptive layering for security: Customer Requirements (page 14) are at the top level, defining the expectations in terms of mission objectives. They are separated from Functional Requirements, that describe the actions necessary. Some organizations may have their own, different, structures. The point is that some sort of organization of requirements is necessary. We will present here a numerical scheme, with top-level requirements in Level 1. For any system, the Level 1 technical requirements are broad descriptions based on a concept of operations. Such things can be derived from a written description called a Concept of Operations Document, or ConOpsDoc. System planners may not have this written document, but it is at least in their minds—they are aware, for example, of the possibilities of using modulation of the dc power flow to help stabilize the underlying ac system. It is fair to note that environmental requirements and security requirements are also important. Each of these can be treated separately, and can have its own requirements structure. In our example here, we will not exclude security. A representative (and invented) organization of the levels of requirements for comparing an ac system and a dc system is given in Table I. Of course, we acknowledge we are not designing a system. We are writing what one might informally call “high level requirements.” Our goal is to provide some familiarity with the requirements process. In Table I, one “top level” requirement is shown as flowing down into several lower level requirements.

Page | 6
Table I Requirements Levels in ac/dc trade-off process
Level Involves Example
1 Major stakeholders, owners, partners, sponsors
Build a transmission reinforcement mechanism for path ABCD that will ensure compliance with known NERC requirements on system reliability.
1.5 alternatives DC transmission AC transmission
2
“Application” requirements
The system shall be capable of steady state power transfer of 2 GW, with an overload capability of (TBR).3
The system shall be capable of steady state power transfer of 2 GW, with an overload capability of (TBR).
2
“Application” requirements
The system shall have the ability to modulate the power flow in response to ac system conditions
Power system stabilizers shall have the ability to make positive damping in the event of any line outage
3
System; impacts several subsystems
Modulation controller shall have available information on voltage and power flow conditions throughout region encompassing path ABCD
PSSs shall respond regardless of initial loading conditions
4 Subsystem, or software program
Secure external communication system shall furnish controller information
No inter-area communication shall be needed
4 Subsystem, or software program
Security of communication system shall be reviewed annually
In the Table, we added an “intermediate” level 1.5, to allow a split between ac and dc options. That device shows that the addition of the modulation capability to the dc side brings with it other requirements, in this case to do with security. At Level 2, we have what might be called Application Requirements. These derive from what the ultimate user requires in order to do whatever it is that the reinforcement is for. In both the ac case and the dc case, this means moving a certain amount of power. In the dc case, it also means modulating the power flow. That capability comes with additional requirements (and therefore costs) but likely brings additional benefits. It may be that the modulation increases the system security (in the (N-1) sense) beyond that provided by the ac option. If so, that benefit must be captured in the trade-off, as well as the cost incurred to obtain it.
3 “To be reviewed,” meaning that the exact value to be inserted into the requirement would be fixed during a Requirements Review.

Page | 7
Level 3 are usually thought of as System Requirements (in contrast to Application Requirements at Level 2). A Level 3 requirement responds (usually) to a particular Level 2 requirement. Put another way: Level 2 requirements are an extraction of the application, and they are levied on Level 3. Level 3 Requirements affect the implementation of the system. In the example here, we have recognized that information is needed from around the system for the dc modulation to be effective. We have then recognized that the need for information is accompanied by a security risk, and that brings with it additional requirements at lower levels. We have indicated an annual security review as Level 4. We do not need to examine anything below this level for our present purposes.
2.2.2 Effect on Trade-off Study Now, with all that in mind, what has that to do with performing an economic trade-off study? Well, first, we are not advocating that the trade-off be preceded by a complete set of build-requirements. What we are saying is that consideration of the requirements, and the way they interact, may help when it comes to comparing systems that are very different, one to the other. In the Table above, there were requirements levied on the dc system that had no counterpart in the ac requirements. When considering design requirements for a trade-off study, there is no question of “requirements freeze.” In the real world of design and build, requirements are reviewed and agreed-to, and become very hard to change afterward. That is the only practical way to build a system. But for the purposes of a trade-off study, they should be more flexible, and the trade-off study can be viewed as part of the process that finalizes the requirements.
2.2.3 Adding rigor At some point in the interaction between the requirements development and the trade-off, there may be a need to increase the level of rigor applied to the requirements. Requirements will at some point have to be demonstrated to be valid, and will have to be met as the project proceeds. In other words, the requirements ultimately control the implementation. The trade-off of any proposed system must eventually take into account the requirements levied on the final system. At that point, it will be essential to understand the requirements process. We present here a very short summary of what might be called the requirements on requirements. Requirements must be
1. Verifiable 2. Unambiguous 3. Complete 4. Concise, Clear 5. Traceable

Page | 8
Let us look at each of these in turn. “Verifiable” applied to a requirement usually affects the testing of a work product, whether hardware or software. There are lots of ways of testing things, and we don’t need to be more than slightly aware of that here. But the “verifiable” rule eliminates the use in a requirement of a whole category of words. An example is “minimize,” because it is usually not possible to test that something has been minimized. (There might always be a better way.) One can minimize some things (like a least-squares error) but one cannot minimize things like power losses without adding a good deal of specification limiting the conditions. “Unambiguous” means only that the requirement can be interpreted only one way. A good writer will not struggle with this, but a poor writer might. It is necessary to avoid terms like “and/or” and “etc.” Numbers are always preferable to words like “all.” “Complete” is hard to achieve. One hopes that by organizing requirements into proper levels, one gets close. It is reasonable to suspect that in theory, a complete set of requirements is infinitely large! The “Concise, Clear” requirement means that a word like “tolerant” (as in “fault-tolerant”) does not qualify. For example, if we say that a system hardware element shall tolerate short-term overload, we must say what “tolerate” means (survive? operate during?) and what the basis of overload is. “Traceability” is an important part of requirements. We mentioned above that requirements flow down from one level to another. Traceability is the upward counterpart. In a dc converter, a requirement to have a particular kind of auxiliary input to the control system can be traced up to a higher-level requirement to be able to modulate the power flow in response to power system conditions. That, in turn, can be traced to a requirement on the power system security (a matter we shall discuss further below).
2.2.4 Factors to Consider in the Trade-off We examine the factors that must be considered in the order the costs (or profits) might be incurred over the lifespan of a project. This is a prediction problem that should be simplified as far as possible in order to make it tractable. When a decision has to be made, it will take into accounts costs, in some fashion, but not all costs are easily compared. Even the lifetime of the different alternatives may not be the same, making comparison difficult. Further, there has been a tendency for projects to be managed and maintained considerably beyond their original design lifetimes. Should that possibility be included? While such life-extension may seem economically sensible in the short term, it may not be so in the long run. (To illustrate the problems, the example of the PDCI is described in an Appendix. In this example, the two ends of the dc line were separately and differently upgraded over the years.) For a large physical infrastructure such as a dc network, there will be considerable expenditure before a single foundation is poured. One-time costs such as planning and design are likely to be large enough to warrant consideration, though it is not obvious ahead of time whether the costs will be significantly different between the various options. However, even if all the alternatives would have the same costs in this category, they should be included because they will affect the timing of the breakeven point. Commissioning costs, while unavoidable, will likely not be a significant factor in the overall long-term

Page | 9
cost equation. However, some adjustments may be needed in the way the system is operated, and funding should be set aside, as needed, to cover the costs of things like operator training. When construction begins, it will be on land that will have to be dedicated to the purpose. Ownership of that land is a matter that has to be taken into account: will it be bought, or leased? Each option has a cost factor that can be included in the trade-off. A question that may have to be answered is whether the cost could be included in the rate-base, and when that might be permitted to take place. It would be conventional to depreciate the amount, and the amount depreciated would be carried as an operating expense. The buildings put on the land may be considered in generally the same category. The equipment involved in different alternatives will have different characteristics in many ways. Some of them may have indirect effect on costs, and wherever possible this sort of thing should be noted. For example, as in the study by Barthold, the solid-state rectifiers in the converters have certain short-term overload characteristics. It could be that for some alternatives, the possibility exists to take advantage of that, but not for other alternatives. This is an example of the proposed alternatives not being exactly equivalent. In general, alternatives will rarely be exact equivalents. However, if the differences are noted appropriately, the cost effect should restore the comparison to an even-handed condition. The cash-flow situation is straightforward to represent. Income is derived from moving electricity, and the addition of the dc network will have an effect on the flows that is calculable. The cost of electricity, and the cost of losses should not prove hard to figure. The effect of the dc lines on ac system losses must be accounted for, and it may be that the reliability of transmission factors in, too. When the PDCI is tripped, for example, there is always a drop in system frequency. The frequency drops because the power flows readjust to meet the load, but the system losses without the dc line are greater than with to such an extent that the effect can be seen on frequency. It is argued in (Westermann, et al. 2012) that a “completely free” energy market could not provide certain ancillary services, such as power quality, and so these have to be made the responsibility of some institution, on behalf of the consumer. Frequency control, voltage/reactive control and black start capability are included. A dc network would affect the acquisition of these services because of its controllability. But it is hard to know how to value the benefit. It is harder still to value things like damping modulation, because the function is rarely implemented, so there is little in the way of firm data. The topic of damping in a multi-terminal situation has been discussed for decades (see, for example (Dougherty and Kirkham 1970). The paper showed, probably for the first time, that multiple damping controls could be used simultaneously in a multi-terminal system. The paper was aimed at a technical audience, there is no mention of the cost or benefit. The cost was assumed low (because it involved just electronics, rather than power equipment, and negligible compared to the benefit (which was not evaluated). In a discussion appended to this paper, an additional control is proposed that increases the steady flow on part of the ac system. This steady control is in addition to the varying modulation of the dc line in response to the angle-swing on the ac side. Taking advantage of the short-term overload capability of the dc system this way allows the system power angle to be reduced, a further aid to stability. But in the years since then, there has been little written about the topic, and (as far as we can ascertain) nothing about its economics.

Page | 10
Black-start capability was mentioned in our previous Report (Kirkham, Elizondo and Dagle 2014). The capability is shared with static VAr compensators, and while the details are likely to be specific to each given scenario, it may be possible to find figures in that literature for the cost benefits. It is reasonable to assume that all the cases in the trade-off study have the same objectives. In practice, that may be impossible. In Table I (Section 2.2.1) the requirements were the same down to Level 2. Both ac and dc options had the requirement to move 2 GW with some (TBR) overload capability. But the ac and dc sides of the trade-off had necessarily different requirements, because the implementations would be different. It is very difficult to keep such situations evenly “balanced.” Judgment is required. Yet since these requirements will affect such things as the rating and overload capability of costly hardware, the trade-off will necessarily be affected. Salvage value may remain at the end of a project, though in reality it may be positive or negative. We have no access to the numbers, but the safe disposal of the mercury-based converter equipment must have factored in to the lifetime costs of the early HVdc projects. For that matter, dealing with the mercury during the life of the converters must also have incurred considerable cost, as the mercury had a tendency to become contaminated with time. Further, any leakage was a hazard that had to be dealt with. Other on-going costs that must be considered over the life of the project include factors associated with personnel (both pay and training), project operations (contracts, insurance) as well as the financial considerations that apply (in particular, of course, interest, but also likely changes in energy mix—and hence costs—and population trends. If the job of the system planner is hard in the medium term, the job of the trade-off analyst is nigh-on impossible.
2.2.5 Simplifications A summary of life-cycle costs is given in (Mossadegh and Aggarwal 2010) that combines many of the factors mentioned here. The authors are concerned with offshore networking of renewable energy (ie, wind), but they do indicate some ways to simplify the calculations. For example, because it is hard to get good data, the authors suggest that the factors such as land acquisition, procurement and construction can be set volumetrically in one coefficient CPCD. For HVac the authors give the coefficient a value of 1.69 k€/MW.km. For a VSC system the factor is given as 6.72 in the same units. These authors show graphs that indicate that as the nominal power level is increased, the VSC HVdc system costs drop below the HVac costs. Exactly where the crossover takes place is, of course, dependent on the assumptions made about the system topology, and we cannot say the result is generally applicable. But the method is worth considering as a way to get at least a preliminary idea of the cost situation.

Page | 11
2.2.6 A comment on feasibility The reader may be interested to learn of a comment by a judge. The US Court of Appeals for the Seventh Circuit heard a case between the Illinois Commerce Commission and the Federal Energy Regulatory Commission (Posner, Wood and Williams 2013).4 The court was dealing with a number of issues to do with what one might think of as the “fairness” of allocating some costs. The court noted that “The Federal Power Act requires that the fee be ‘just and reasonable,’ 16 U.S.C. § 824d(a), and therefore at least roughly proportionate to the anticipated benefits to a utility of being able to use the grid.” On page 13 of the transcript is the observation that “It’s not enough for Illinois to point out that MISO’s and FERC’s attempt to match the costs and the benefits of the MVP program is crude; if crude is all that is possible, it will have to suffice.” It might be of some comfort to remember that when attempting to do these calculations.
4 Available at https://www.ferc.gov/legal/court-cases/opinions/2013/11-3421-opinion.pdf

Page | 12
2.3 Business basics: overview At its heart, accounting for the costs and benefits of a project such as a system reinforcement or a system expansion is simple. Money is spent on building the hardware system, the system is commissioned, and from that point forward it has operating and maintenance costs but it also brings in revenue. At some time after it is commissioned, the accumulated net income is enough to pay back the initial investment. From that moment on, the project operates “in the black.” When the project is old, or for some reason no longer needed, it is retired and decommissioned. The cost of that work must be borne by the owners, and when all is done, a lifetime profit or loss can be calculated. A trade-off study done before the start of work will estimate these cash flows, and their timing, and give a predicted figure for the breakeven time, and the lifetime profit (or loss). Cash flow is the net movement of money into and out of the project, or strictly in and out of the project’s financial records. For our purposes, a sum calculated at the end of a year will probably give us sufficient time resolution, so that a convention that assumes all expenses and profits occur at the end of the year is likely acceptable. Because for much of recent history the value of money has not been constant, there has been a need to account for the changing value of money. Typically, a certain amount of inflation is assumed—indeed, the Federal Reserve Bank, in charge of monetary policy in the US has a target of 2% inflation, and acts to raise or lower interest rates to achieve that goal. A rate called a discount rate is used on accounting to allow for the change in value of money. There is an assumed equivalence between money at one time and at another if the rate is known. The situation is a little complicated by the fact that it always seems to cost more to borrow money than to lend it. Perhaps the rates that apply are either side of what people think the future inflation is going to be. At any rate, the equivalence has to account for both the interest rate and the inflation rate. Once the details are available, the process of doing the trade-off will have to replicate the process of accounting that might go on for the project once it is funded and under way. There are what is called Generally Accepted Accounting Principles (is there a hint here that there is no “right” way?) that govern the recording and reporting of financial data. These principles create an annual statement of accounts, and the trade-off model should do the same. Costs have to be estimated, and income. Good cost figures are probably hard to come by, which in the view of the authors justifies using the simplest possible accounting methods that might be considered reasonable, such as the yearly costing convention. Experienced designers may be able to help, but past experience is not always a good guide.5 Just how the accounting is done on a project is a matter of some choice: many companies (including some National Laboratories) use a method called accrual accounting. In some versions, revenue may be counted as received as soon as bills are sent out, and costs may be deemed to have been occurred even if the bills behind those costs have not been received. A subcontract is half-way through its period of performance: it is assumed to have incurred half its final cost, for example. 5 Even after a project is completed, useful factors such as true unit costs are sometimes hard to calculate. The cost per km of a line is very dependent on terrain, for example, and one project may be over different ground than another. In a trade-off study, such a possibility is not likely to be very dependent on the options being compared.

Page | 13
Other companies assume expenses are incurred (and revenue received) only after the associated effort is complete. In the long run, this should give the same result as accrual accounting, but in the short term, it may be a less accurate reflection of the state of affairs. Whatever the trade-off designer chooses is going to be adequate for most trade-offs. In the end, a cash flow diagram is drawn. A common way to represent the cash flow diagram is with cash inflow shown as a vertical arrow upward, and a cash outflow as a downward arrow. Dollar amounts are shown associated with the arrows, but they are typically of the same length regardless of the amount. Time is shown on the horizontal axis, starting with zero, and with (usually) annual tick-marks numbered. The presentation is thus not the same as the graph in the CIGRE report, but that kind of graph can be derived from the cash-flow information. An example is given in Figure 1.
Figure 1 Basic cash-flow diagram
In Figure 1, the project begins with a cash outflow of $1000. There is an inflow that is taken to occur at the end of year 2. Other cash movements occur as shown. If the dollar amounts shown are based on a dollar being a dollar, the end of the project has net worth of $4200. But the value of the currency changes with time. There is often inflation to account for. This example of a project highlights the need to know how the value of money changes over time. There are therefore some calculations that must be done, based on the notion of equivalence mentioned earlier. The details of how that equivalence is calculated depend on whether the interest is compounded annually or at some smaller interval. To illustrate the complexity of the situation, assume an asset may have a worth at present that we can denote as P. We can designate the future worth by F, and we plan to calculate that at some time n compounding periods (here, years) from the present. The calculation is based on annual interest payments. To accomplish this crystal ball effort, we need to know the interest rate that will apply, something we can denote i, and give in percent. The easy way to convert from present (P) to future (F) is to apply the formula
𝐹𝐹 = 𝑃𝑃(1 + 𝑖𝑖)𝑛𝑛 (1) Thus, for example, if the interest rate is 3%, a dollar now is as good as $1.5579 in 15 years’ time.

Page | 14
If you need to reverse that calculation, to say that a certain amount must be held in reserve, for example, for decommissioning costs, then the exponent becomes negative
𝑃𝑃 = 𝐹𝐹(1 + 𝑖𝑖)−𝑛𝑛 (2) Thus, if the future need is for a dollar, the present need is for ¢64.18, assuming the incoming interest is the same as the outgoing, which it likely won’t be. These calculations are, of course, the reciprocal of one another. Both are functions in Excel, =FV and =PV. An Appendix deals with more of these relationships. The need for such detail arises because of the need to treat costs and benefits in an even-handed way. If the benefit of some system change will be felt immediately it may be found to have greater value (in the equivalence way) than the same thing later on, for example. The goal of the trade-off is to be fair in its assessment.

Page | 15
3.0 The Literature
In an article “Take My Grid Please!” George Loehr6 discusses three threats to reliability:
1) Complication System operation is increasing exponentially in complexity as the industry moves into retail access. This effect can be seen both in the number of players, and in the number and complexity of procedures.
2) Culture Shift The industry is moving from a culture of “cooperation and coordination” to one of “competition and confidentiality.”
3) Priorities They are shifting from reliability to price.
He goes on to argue for breaking up the two largest Interconnections, and reconnecting the parts by means of asynchronous dc connections. In an explanation of what he calls a “tripole” dc system, Lionel Barthold7 argues that the operation of the power system is already dependent on communication and control, despite the fact that many engineers think it not the case. He says:
AC systems, dependent to some degree on communication and control at the outset, have grown steadily more so; witness introduction of SCADA systems, remedial action schemes (RAS), Special Protection Schemes (SPS), and the growing acceptance of FACTS and real time phase angle-based operation logic.
Loehr argues that we have to do something, Barthold indicates a barrier long accepted is disappearing. These two documents together capture the (fairly recent) sense that the industry is changing in a way that will be more accepting of the need for communication and control, essential aspects of the operation of dc systems. It would be well to keep these admonitions in mind as we review the situation revealed in the literature. Our interest is, after all, a system that would be increasingly dependent on communications.
6 http://www.ece.uidaho.edu/hvdcfacts/Presentations/RefOnSegmentationJan06.pdf 7 Technical and Economic Aspects of Tripole HVDC, L. 0. Barthold, 2006 International Conference on Power System Technology

Page | 16
3.1 MISO Transmission Expansion Planning (MTEP) report 2014. In 2014, MISO performed what they described as a preliminary study based on HVdc inter-regional networking. The study was designed to capture the (cost) benefits of the diversity of load, of wind and solar resources, of frequency response (sharing the reserves required for correcting frequency), and energy arbitrage. (MISO 2014) The idea of taking advantage of diversity is not new to HVdc. It was the driving factor behind the decision to build the ties across the English Channel between France and England. But the scale of the MISO scheme is much larger than the cross-channel links. MISO divided the US into regions, and found that diversity existed between five of them. Figure 1 (adapted from the MISO report) shows the anticipated diversity power flows. (Greyed-out regions of the map are reduced in size in proportion to the regions involved in the exchange of power.)
Figure 2. MISO Diversity exchange scheme
Altogether, the benefits over 20 years were estimated to be $41.4Bn, and the benefit-to-cost ratio was 1.14:1. The regions identified as having most diversity (shown in Figure 1) totaled 32 GW. The addition of 15 GW of transmission, it was proposed, would allow for the capture of 30 GW of diversity. DC lines rated at 5.4 GW and 600 kV were envisioned, and converters were a mixture of line-commutated and VSC. The dc scheme analyzed was a multistate network, as shown in Figure 2.

Page | 17
Figure 3. MISO planned HVdc network (after Fig E3-28 of (MISO 2014)) The study noted that while peaking capacity exchanges were high-value, they would be a small fraction of the total benefit of the network. Load diversity topped the list, at over $20 Bn over 20 years. Energy arbitrage was considered to amount to just over $4 Bn over 20 years. In addition, it was argued that regional sharing of “frequency response” reserves would be possible, allowing a significant decrease (66%) in the spinning reserves in each of the Interconnections. During a frequency response event, one-third of the needed power could be shipped in from each of the other interconnections, and because it would be done by controlling the dc network, the reaction would be much faster than the (usual) governor controls, and the drop in frequency would be greatly reduced. Because of this reserve sharing, there would be a reduction of 5400 MW of spinning reserves, split as shown in Table II. The savings here were estimated at almost $10 Bn. Altogether, the network was estimated to cost $36.2 Bn and bring benefits of $41.4 Bn. It is worth noting that these benefits became possible only through the controllability of the dc network. An ac interconnection, if it were somehow made technically feasible, would not have brought all these benefits. 8 See https://www.misoenergy.org/Library/Pages/ManagedFileSet.aspx?SetId=2273 for Appendices to the MISO Report

Page | 18
Table II Actual and possible spinning reserve requirements
Interconnection Frequency response spinning reserves
Actual Based on HVdc network Difference
MISO, SERC, FRCC 2900 1100 1800
WECC 2740 940 1800
ERCOT 2750 950 1800
The MISO study concluded that WECC would get 45% of the benefits of the network, and MISO themselves 28%.

Page | 19
3.2 The WECC Interactive Transmission Project Portal MISO is not the only authority to be contemplating HVdc. The WECC Interactive Transmission Project Portal Map at https://www.wecc.biz/TransmissionExpansionPlanning/Pages/Project-Information-Portal2.aspx shows several dc lines are being considered. All are for the transmission of bulk power, and all are point-to-point lines. Figure 3 shows the locations of lines that are under consideration.
Figure 4. WECC planning map, showing concepts for dc lines Included in the plans are
• Triton HVDC Sea Cable Project, a possible multi-terminal undersea cable running along the coast from Ketchikan, Alaska to San Francisco, California. Details are presently scarce. The scheme is being studied by the group that proposed the
• Juan de Fuca Cable Project, a 550 MW HVdc line that would connect the Canadian island of Vancouver with the Olympic Peninsula in Washington State. This activity seems to have stalled since about 2011.
• Great Basin HVDC, a proposed 125-mile underground cable connecting Northern Nevada and Northern California with a capacity of 1 GW.

Page | 20
• The Northern Lights Chinook (MT-NV) HVDC Project, a 1000-mile 3-GW line from Harlowtown in central Montana to the Eldorado Valley, just south of Las Vegas, Nevada. “Chinook” is the name of a wind on the lee side of the mountains. The air is adiabatically warmed by having dropped its moisture as rain on the windward side. The word is included in the project name no doubt to indicate the connection to wind resources in the northern part of the region.
• Zephyr, another wind-inspired project and name. It would be a 3 GW, 850-mile line from Chugwater (just north of Cheyenne, in southeast Wyoming) to the same destination as Chinook.
• All the lines so far mentioned have had a “conceptual” status. The Centennial West Clean Line is a planned line rated at 3.5 GW from Northeastern New Mexico to Southern California, a distance of about 900 miles.
It is evident that the WECC is giving consideration to HVdc for connecting renewable resources to load centers. The idea of a network is not considered, as these are all separate proposals.

Page | 21
3.3 Technical Limitations towards a SuperGrid – A European Perspective
In a paper that examines the notion of a European Supergrid, (Van Hertem and Delimar 2010) an interesting way of presenting differences in the grid connections is shown in a figure. It is re-drawn here as Figure 4
Figure 5. DC grid topologies The first topology shown is really a point-to-point connection with some taps along the way. The old Sardinia line is of this kind. It does not really qualify as a network, and offers no inherent redundancy. The second topology is really a collection of point-to-point dc lines. This is almost certainly the kind of topology envisioned by MISO in their proposal, since that proposal includes both line-commutated and voltage sourced converters, and such a mixture would not work with connections on the dc side. This is a workable arrangement, and with coordination between the various control systems it should be flexible enough to be considered a network. The third topology is the network meshed on the dc side. This is the configuration we considered in our earlier Report, and is the configuration for which we derived the “evener,” a small dc/dc series converter that carries the full line current and adjusts the voltage. With breakers on the dc side, the arrangement is very similar to the ac network in that internal connections can be added to give redundancy and would not require a converter station. It may be well to consider using this kind of layered presentation in our future work. The paper is an examination of the possibility of a pan-European “supergrid,” presumably the kind of network envisioned by MISO and examined in Section 3.1. The authors conclude that there are presently technical obstacles to full-scale implementation. They discuss several protection problems. The lack of a circuit breaker is one of them—and is rumored to have been solved.9 There are still open questions regarding control and communications. But the authors conclude that the technical problems are not fundamental, and can be solved.
9 Perhaps we should say “solved again.” The PDCI was used for full-scale testing of a breaker in 1975, and several papers have been written describing alternative methods (Ekstrom, et al. 1976), (Melvold, et al. 1976), (Anderson and Carroll 1978).

Page | 22
3.4 Transmission investment problems in Europe: Going beyond standard solutions
A paper discussing the apparent lag in investments in the power grid (Buijs, et al. 2011) warns of increasing levels of congestion. Much of the European grid consists of equipment installed after WWII and up to the 1970s, and is said to be nearing the end of its lifetime. Obstacles encountered in the construction of new overhead lines for cross-border projects were listed. Table III here is an adaptation of Table I of the paper. We re-ordered the table in descending order of the number of obstacles:
Table III Obstacles to cross-border OH lines in Europe
Obstacle Number of projects
Authorization procedures 12 Electric and Magnetic Fields 11
Environmental Issues 9
Grid Issues 9
Visual Impact 7
Densely populated area 7
Difficult terrain and Weather 4
Identification of cross-border point 3
Commercial problem 3
Dependency on other project(s) 2
No perception of supra-national or European perspective
2
The point is noted that new technologies can be divided into those that allow the increase of flow through existing assets (such as FACTS—and we would add PMUs) and those that add new capability, such as building new lines. The argument is advanced that new technology of HVdc offers solutions to some of these obstacles. The case against ac overhead lines (OHL) is made succinctly:
The traditional approach in transmission system reinforcement is three-phase AC overhead lines (OHL). This solution is very cost effective and robust. It uses technology that is known and used for decades. There are currently no technologies that can compete with OHL when taking only investment cost into account, especially in rural areas. . . Although OHL often experience short outages, for instance due to lightning strikes, they can be restored with a simple line reclosure, making this a nonissue in meshed transmission systems. However, OHL have a high visual impact and are considered not appealing and possibly hazardous by public opinion. New tower types that are more visually appealing than lattice towers are available, but the towers can still be seen from a

Page | 23
(long) distance. Also the electromagnetic fields (EMF) can be reduced, but only to a certain degree. This results in tough siting opposition and long permitting processes. The construction of a new transmission system demands for a new transmission path, which requires a significant right-of-way (a corridor of up to hundreds of meters wide).
The case for HVdc is harder to make, but with a certain amount of hand-waving, it can be done. The objections to OHL is partly based on the fact that the line can be seen: bury it. The economics of that option requires the use of dc. there are no oscillating fields with direct current, because the frequency is zero. In a cable installation, the external electric field is zero, and the external magnetic field is smaller than the Earth’s background field, and can be presumed harmless. It is evident that the European transmission system, at 400 kV, may be reinforced by adding cables in greater amount than in the US. While some particular situations may make cable a requirement, the US use of overhead seems not to be waning. It may be that dc can still overcome some of the obstacles. If we assume that opposition to overhead lines in the US is based on similar problems to those seen in Europe, there is a role for public information dissemination. It might be good to point out to the public that, after years of research, no adverse field effects from power lines have been identified.

Page | 24
3.5 Feasibility of DC Transmission Networks
An international group from industry and academia assessed the feasibility of networking dc on a Panel at the ISGT-Europe conference in December 2011. (Jovcic, et al. 2011). The authors argue that the same drivers for networking the ac system early in the 20th century now apply to HVdc systems.
The authors note that
A multiterminal HVDC with small number of terminals and accepting some sacrifice in reliability could be developed with the existing VSC technologies. In developing high power large DC grids we should aim to achieve similar level of reliability and performance as with AC grids.
This is a point worth repeating: reliability is an essential part of the economic consideration.
Overall, the picture that is painted is one of much greater complexity than exists in ac networks. There are several different kinds of converter available, and they have advantages and disadvantages in different applications. Some designs can be used to act as circuit breakers, but at increased cost or complexity. A design problem for a dc network will evidently be a matter of performing the trade-offs appropriately.
That could be an aspect of the work that a trade-off study should investigate.
The question of protection is also brought up. After a general introduction to the topic, the notion of protecting the dc system by operations on the ac protection system is discussed and not ruled out. Protection that is purely dc is reported as not well-developed. In particular, there is a need to find new ways to locate a fault on a dc line without the problems of communication delay—in other words, operating from one location.10
DC protection is faced with a problem that has no counterpart in ac: following the clearing of a fault, an ac network will automatically redistribute the power flows according to the impedances of the remaining lines, and the locations of the loads and generators. The laws of physics control this redistribution, not a control system. With a dc network, the redistribution must be planned, which may mean planned in advance. In any event, it is a level of complexity that should not fall on the operator to solve in anything like real time.
10 The question of making measurements on the dc side is an interesting one. A current measurement of high accuracy seems not to be possible using the flux-gate methods traditionally employed. Estimating from measurements on the ac side is fraught with difficulty, though it has been done. The problems are so serious that in 2100 the EU started a project on the matter (see https://www.euramet.org/research-innovation/search-research-projects/details/?eurametCtcp_project_show%5Bproject%5D=1233&eurametCtcp_project%5Bback%5D=469&cHash=fd6a3a90602e88f8730d8799ec4d1bfa) Final report is available at this site.)
Page | 25
3.6 Other Trade-offs in the literature To some extent, a fair and even trade-off for a network of dc lines is hampered by the fact that there are so many variables that are not equivalent, and the planner struggles to compare alternatives. We discuss here a number of references that could be useful in this kind of situation.
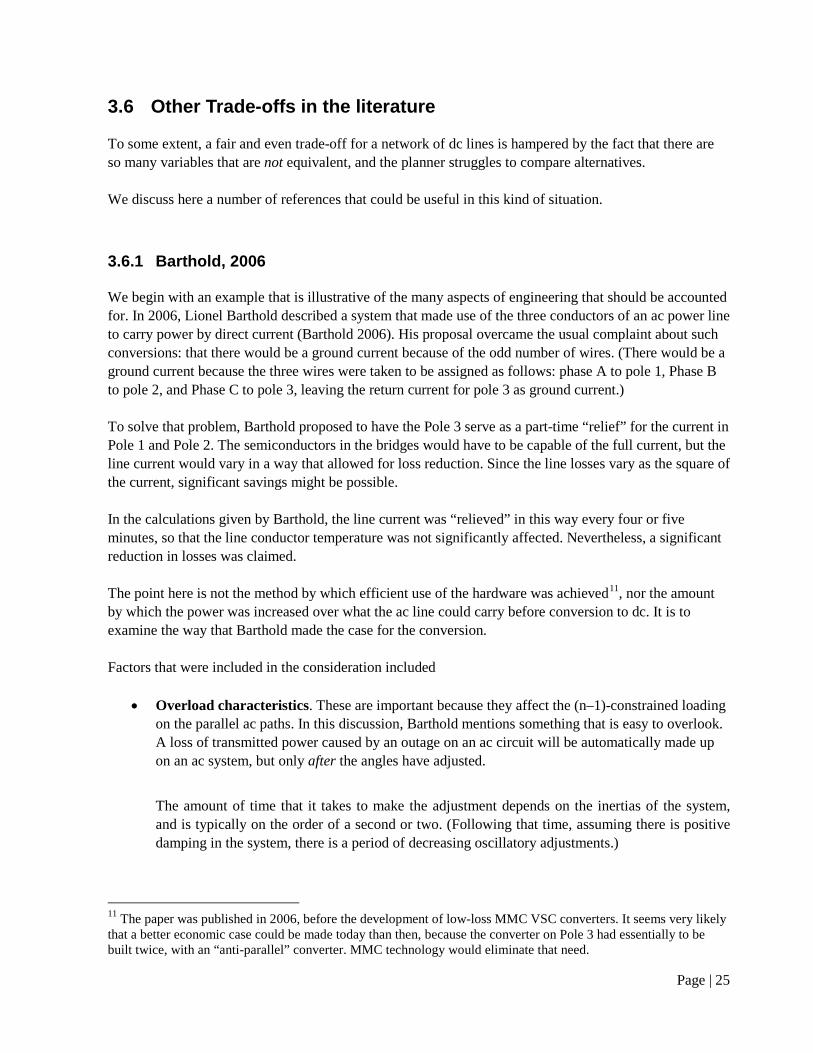
3.6.1 Barthold, 2006 We begin with an example that is illustrative of the many aspects of engineering that should be accounted for. In 2006, Lionel Barthold described a system that made use of the three conductors of an ac power line to carry power by direct current (Barthold 2006). His proposal overcame the usual complaint about such conversions: that there would be a ground current because of the odd number of wires. (There would be a ground current because the three wires were taken to be assigned as follows: phase A to pole 1, Phase B to pole 2, and Phase C to pole 3, leaving the return current for pole 3 as ground current.) To solve that problem, Barthold proposed to have the Pole 3 serve as a part-time “relief” for the current in Pole 1 and Pole 2. The semiconductors in the bridges would have to be capable of the full current, but the line current would vary in a way that allowed for loss reduction. Since the line losses vary as the square of the current, significant savings might be possible. In the calculations given by Barthold, the line current was “relieved” in this way every four or five minutes, so that the line conductor temperature was not significantly affected. Nevertheless, a significant reduction in losses was claimed. The point here is not the method by which efficient use of the hardware was achieved11, nor the amount by which the power was increased over what the ac line could carry before conversion to dc. It is to examine the way that Barthold made the case for the conversion. Factors that were included in the consideration included
• Overload characteristics. These are important because they affect the (n–1)-constrained loading on the parallel ac paths. In this discussion, Barthold mentions something that is easy to overlook. A loss of transmitted power caused by an outage on an ac circuit will be automatically made up on an ac system, but only after the angles have adjusted.
The amount of time that it takes to make the adjustment depends on the inertias of the system, and is typically on the order of a second or two. (Following that time, assuming there is positive damping in the system, there is a period of decreasing oscillatory adjustments.)
11 The paper was published in 2006, before the development of low-loss MMC VSC converters. It seems very likely that a better economic case could be made today than then, because the converter on Pole 3 had essentially to be built twice, with an “anti-parallel” converter. MMC technology would eliminate that need.

Page | 26
With a dc system in the right place (and that is one reason to have a dc network), the time can be significantly reduced, to a time governed by the characteristics of the dc line and the control system, likely a few ms together. If the dc system is allowed to go into an overload condition for a second or two, the ac system can be brought to a new stable operating point that moves the transient stability limit. (Barthold claims that the tripole system he is describing has a particular advantage because its design requires oversized semiconductors anyway.) This point is made in Section 1.3.1.
It is not clear how Barthold accounts for (that is, puts a price on) the value of this capability. If it can be done, it should be included in any trade-off study.
• NPV of losses. The system Barthold proposes has what he calls a “Cost Premium.” That means that compared to a bipole, his tripole is expensive to build. However, the claim is made that the NPV of losses contributes to a set of factors that more than offset the cost. (He includes the higher loading of ac circuits, improvement in response to the need for synchronizing power, and the better utilization of existing transmission investment.) The NPV of losses is something that is calculable by the methods of power flow analysis and dollar equivalency mentioned above. The issue of utilization of equipment requires further comment.
We noted in the first part of this report (in Section 1.3) the use of capital resources, comparing a three-converter three-line network and a six-converter three-line configuration of the same general topology. It is fair to say that the costs are not the same; that one arrangement costs more than another. But it is not fair (in the sense of to say that it amounts to an additional factor) that the utilization of equipment is itself cost or a benefit. The utilization factor is just an indicator of some relative cost or benefit that has to be calculated in the usual way. It might be useful to show the factor, but it should not be counted along with dollar-income or outflow.
Annualized amounts. Barthold shows a Table like Table IV below. Much skill and understanding has gone into the creation of this Table. The first entries are illustrative: the relationship between the ac voltage (the before case) and the dc voltage (after) is not an obvious one, since there are questions of ac and dc corona and ac and dc insulation that are far from simple to answer, and that to some extent depend on the climate the line will be in.
Table IV Converting 3-phase ac to ac transmission (after Barthold)
AC Voltage 230 kV Years 30 DC Voltage ±200kV Energy Value $60/MWhr Distance 200 km Loss factor 0.5 Conductor 1,272 kcmil Annual ac loss 121,431 MWhr Resistance 0.05 Ω/km Annual dc loss 74,440 MWhr MVA max 514 Annual loss savings 46,991 MWhr MVA op 333 Annual Savings $2.9M DC rating 345 Mw NPV of savings $63M Discount rate 2% Credit/term $94/kw
Page | 27
Barthold has simplified somewhat nevertheless, as must be done sometimes to get a tractable solution. He shows an entry for line resistance. Since there is a slight skin effect for ac but not for dc, dc lines have less resistance than ac for the same conductor, and hence for the same current they have less loss.12
• Barthold comments that energy costs have higher values when transmission losses are at their peak. Dealing with the variability of such costs should become an integral part of the sort of trade-off study that must be done for the HVdc network, because the loading on the dc network is likely to be correlated with the loading on the ac side.
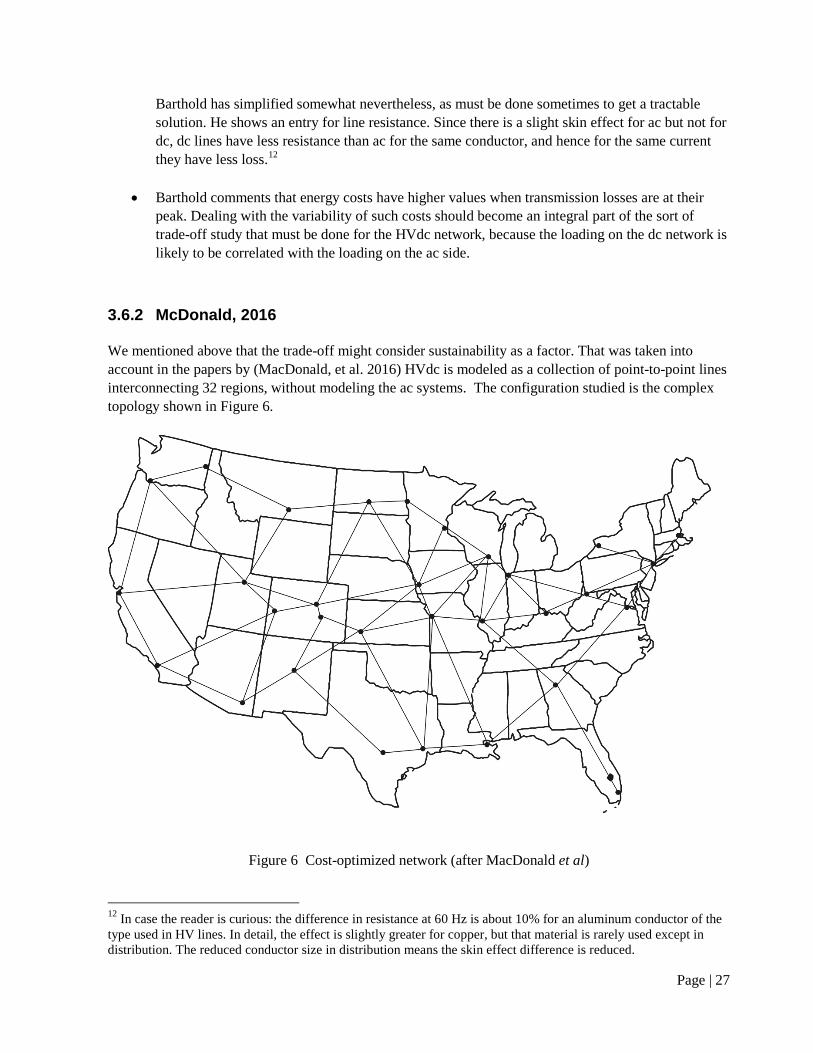
3.6.2 McDonald, 2016 We mentioned above that the trade-off might consider sustainability as a factor. That was taken into account in the papers by (MacDonald, et al. 2016) HVdc is modeled as a collection of point-to-point lines interconnecting 32 regions, without modeling the ac systems. The configuration studied is the complex topology shown in Figure 6.
Figure 6 Cost-optimized network (after MacDonald et al)
12 In case the reader is curious: the difference in resistance at 60 Hz is about 10% for an aluminum conductor of the type used in HV lines. In detail, the effect is slightly greater for copper, but that material is rarely used except in distribution. The reduced conductor size in distribution means the skin effect difference is reduced.

Page | 28
The power generation included 523 GW of wind, and 371 GW of solar generation. In addition there was 461 GW of natural gas, 100 GW of nuclear and 74 GW of hydro, for a total of 1529 GW.
The goal of the HVdc national overlay grid these authors considered was a means to integrate large amounts of wind and solar generation taking advantage of regional diversity of both weather and load. They regarded the use of transmission as a better choice than energy storage, and a better choice than building offshore wind generators. (The dc lines moved the power from the high plains of the US, instead.) Though the cost numbers are not given, that seems to have been an early decision behind the work done. (In this sense, the study is not a trade-off, it is an example of how a goal can be achieved.) HVdc technologies were key in the assumptions and results of these studies.
The study was very detailed: real data for wind speed and insolation for 2006-2008 were used, with a 13-km grid. The study resulted in the network design shown in Figure 6 after some optimization. The point is made that optimization of the nation’s power supply rather than regional operation saves about 1.1 ¢ per kWh, an amount that would save over $47 Bn annually, and is three times the cost of the HVdc system.
McDonald et al suggests that the electricity sector can reduce the likelihood of blackouts, and reduce carbon emissions by 80% at approximately the same cost of electricity as 2012. Demonstrating the carbon reduction was the main goal of the work, and the authors seem to have succeeded spectacularly.
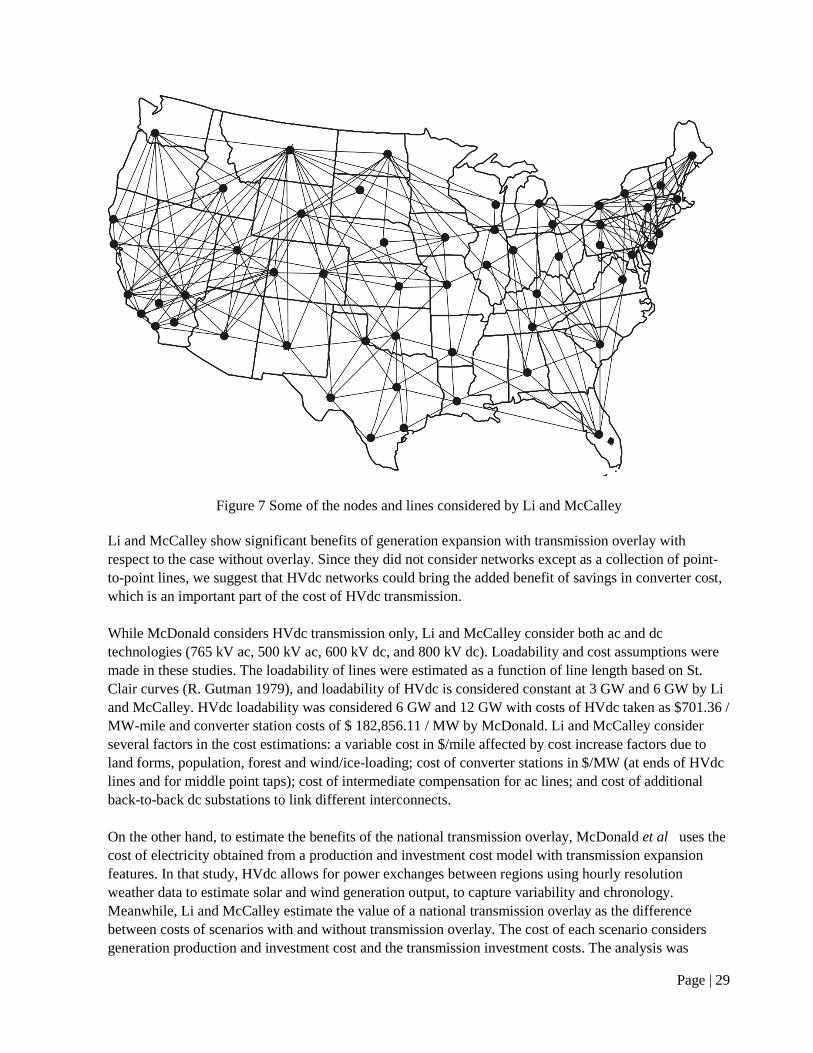
3.6.3 Li & McCalley, 2015 Another paper that considered sustainability is (Li and McCalley 2015). In contrast to the McDonald paper, Li and McCalley model multiple versions of an HVdc overlay as injections in a dc power flow approximation for the ac networks, and allowed for consideration of dc tap connections along the way. Thus, neither study used HVdc networks per se, and still obtained benefits of using HVdc in a national overlay. The dc line options were selected from a set of 383 joining 62 locations across the US. For each of several elements of study, only a few (75 or fewer) of this large number of lines was considered. Figure 7 gives a general impression of the complexity of the totality of options considered. For the studies done with fewer lines, the networks rather resembled those of McDonald et al in Figure 6.
Page | 29
Figure 7 Some of the nodes and lines considered by Li and McCalley Li and McCalley show significant benefits of generation expansion with transmission overlay with respect to the case without overlay. Since they did not consider networks except as a collection of point-to-point lines, we suggest that HVdc networks could bring the added benefit of savings in converter cost, which is an important part of the cost of HVdc transmission. While McDonald considers HVdc transmission only, Li and McCalley consider both ac and dc technologies (765 kV ac, 500 kV ac, 600 kV dc, and 800 kV dc). Loadability and cost assumptions were made in these studies. The loadability of lines were estimated as a function of line length based on St. Clair curves (R. Gutman 1979), and loadability of HVdc is considered constant at 3 GW and 6 GW by Li and McCalley. HVdc loadability was considered 6 GW and 12 GW with costs of HVdc taken as $701.36 / MW-mile and converter station costs of $ 182,856.11 / MW by McDonald. Li and McCalley consider several factors in the cost estimations: a variable cost in $/mile affected by cost increase factors due to land forms, population, forest and wind/ice-loading; cost of converter stations in $/MW (at ends of HVdc lines and for middle point taps); cost of intermediate compensation for ac lines; and cost of additional back-to-back dc substations to link different interconnects. On the other hand, to estimate the benefits of the national transmission overlay, McDonald et al uses the cost of electricity obtained from a production and investment cost model with transmission expansion features. In that study, HVdc allows for power exchanges between regions using hourly resolution weather data to estimate solar and wind generation output, to capture variability and chronology. Meanwhile, Li and McCalley estimate the value of a national transmission overlay as the difference between costs of scenarios with and without transmission overlay. The cost of each scenario considers generation production and investment cost and the transmission investment costs. The analysis was
Page | 30
performed for a 40 year period with a 4 step piecewise load per year, and transmission was allowed to be expanded in years 1, 11, and 26.
3.6.4 Safety Nets The reader might wonder at the difference between the sparse network of Figure 5 and the more interconnected network of Figure 6. Of course, it was never intended to construct a network like the one illustrated in Figure 6; that is just a figure showing all the possible options that could be considered. However, it does illustrate an intriguing possibility. This subsection of the report is unlike most of the section. This small section of the report is not a commentary on the literature, it is instead new material. Safety nets are a relatively new idea: we connect the idea to dc networking. A few authors have discussed the use of a “safety net” for the electric power system. These take various forms and may have slightly different meanings to different people. After all, the various Special Protection Systems (or Remedial Action Schemes) are, in a way, safety nets. Here, we have in mind a more general-purpose kind of safety net, not one that is designed to deal with one specific contingency. We begin by reviewing what little literature there has been specifically on power system safety nets. Following an analysis of an almost total blackout13 in Taiwan, the utility (Taiwan Power Company) recognized the need for some system reinforcement. They also designed and implemented a tiered safety-net system to prevent recurrence (Hsiao, et al. 2002). One tier of the system used phasor-monitoring to limit the power flow on certain selected paths. A second tier was a kind of Special Protection System that was designed to prevent the problems of angle instability and thermal overload on what the authors describe as the “weakest” trunk transmission lines. The third tier involved load-shedding and generator-tripping based on frequency signals, acting to limit the spread of an outage rather than prevent it. The idea of a tiered system is intriguing. However, the PMUs do seem to be under-utilized. That aspect of the system described is the result of its being an “early adopter.” While the PMUs were used to monitor inter-area phase angles, the only purpose of that action was to generate an alarm for the operators. In the nearly 17 years since the blackout, more direct involvement by the PMUs has been contemplated and may be regarded as feasible. Recent work in the area has been done by workers at Washington State University, who have investigated ways to mitigate small-signal instability (Quintero and Venkatasubramanian 2005), (Quintero and Venkatasubramanian 2006). While their work has nothing to do with dc, the authors indicate that it is possible to extract from system measurements the information needed to implement some form of damping control for system modes. Quintero and Venkatasubramanian modeled the system with SVCs providing the damping. That means that the level of power modulation is quite small. The use of SVC in this way is similar to the use of power system stabilizers in some ways. The effect being sought is damping, and the long-term net power flow is very small. Enough variation can be achieved by modulating the voltage—in the case of PSSs, though the generator exciter; with an SVC, by exchanging energy with a storage capacitor.
13 The initial cause of the blackout was a tower collapse resulting from a landslide triggered by heavy rain.

Page | 31
The implication is that such a small amount of power could be put into and taken out of a dc network that would not have to have a very large power rating. What sort of network should be considered? A good starting point would be to see what it would take to connect all generators to their neighbors. Figure 8 shows an example, with the locations of several generators in the western system represented approximately. Not all generators are shown, though the cluster of hydro sources along the Columbia is well-represented. Because the idea of the safety net is to maintain system stability (in the small-signal sense of Quintero and Venkatasubramanian), load centers are not particularly well-represented. Given that the power level on any line does not need to be particularly large, the large number of lines need not translate into a particularly large cost. Perhaps it makes more sense to use a network such as this to connect generators into a cohesive “local group.” Generators that are physically close do tend to react as one machine, and establish (oscillatory) modes that correspond to one large machine. That tendency would be enhanced by this kind of network. In that case, could the PDCI (shown dotted) then be used to stabilize the then-dominant north-south mode? It may well be so.
Figure 8 US-Canada western system safety net Some support for a network whose control system is locally limited comes from the control and communication requirements of a safety net. The safety net on the island of Taipei may cover the whole island, but it is of limited extent compared to the network sketched in Figure 8. Taiwan island is about 400 km end-to-end, a little further than the distance from PNNL in Richland, WA to Portland, OR. The

Page | 32
problem with a geographically bigger network is the communication delays affecting the coordination in the control system. The PDCI is so long that there is a lag of several ms for a signal going from one end to the other. To accommodate that lag, the scheme—like most line-commutated converters—operates without the need for rapid control. Coordination is achieved by having each converter control one of the parameters of the line, usually voltage at the receiving end and current at the sending end. But given that the modes that are to be damped are usually quite slow, it may be possible to calculate the damping signal needed and communicate it to the affected areas quickly enough to be effective. There remain the questions of cost and responsibility. Part of the cost trade-off should allow for a small reduction in ac system losses during normal operation (Daelemans, et al. 2009). While Daelemans finds that the benefit of loss reduction does not justify the cost of HVdc, the benefit is not zero, and so it should be considered part of any trade-off that includes a dc network. The responsibility matter was touched on in our earlier report on HVdc (Kirkham, Elizondo and Dagle 2014) when we discussed the use of damping on the PDCI. One of the problems with damping across large distances is the question of ownership: the two ends of the PDCI have different owners and operators, yet the power that enters one end leaves the other, and if it is modulated, both ends are modulated. That situation may be avoidable by means of a safety net configuration, so that several problems are solved at the same time: ownership issues may be manageable, communication latency may be more manageable, and yet at the same time the overall system might be better utilized.
3.6.5 Bell, et al., 2010 A group in Europe that included TSOs and academics studied options for distributing power from wind farms (Bell, et al. 2010). The group compared several HVdc network topologies, and aimed at a combined ac/dc system that could be optimized in normal and disturbed conditions. The driver was the anticipated large amount of offshore wind in Europe by 2030—150 GW. The authors seem to be in broad agreement with our premise that networked HVdc is worthy of serious consideration. They observe that
The radial connection of off-shore generation appears more and more as being a limited solution in terms of flexibility to reach the EU goals. If some projects are studying the possibility of multi-terminal solutions [reference here to Kriegers Flak], no MTDC (Multi-Terminal Direct Current) links have ever been experimented over the world for collecting and transmitting wind energy.
The authors continue by examining ways to design a dc network to move offshore wind to loads without causing congestion or adversely impacting security. A major motivation is the economic advantages of interconnection of the entire continent, with the capability to exploit the most favorable regions for renewables. 14 Since the goal is to do a trade-off specifically for exploiting wind resources, it is recognized that this can only be done if the wind resource statistics are well understood. It is then argued that network capacity is likely to be fixed by minimum import required in a region that, without other 14 This is an argument that applies across the US, too, and can be seen in the MISO plan for US-wide interconnection. China, it is clear, is well along the path to nation-wide dc interconnectivity.
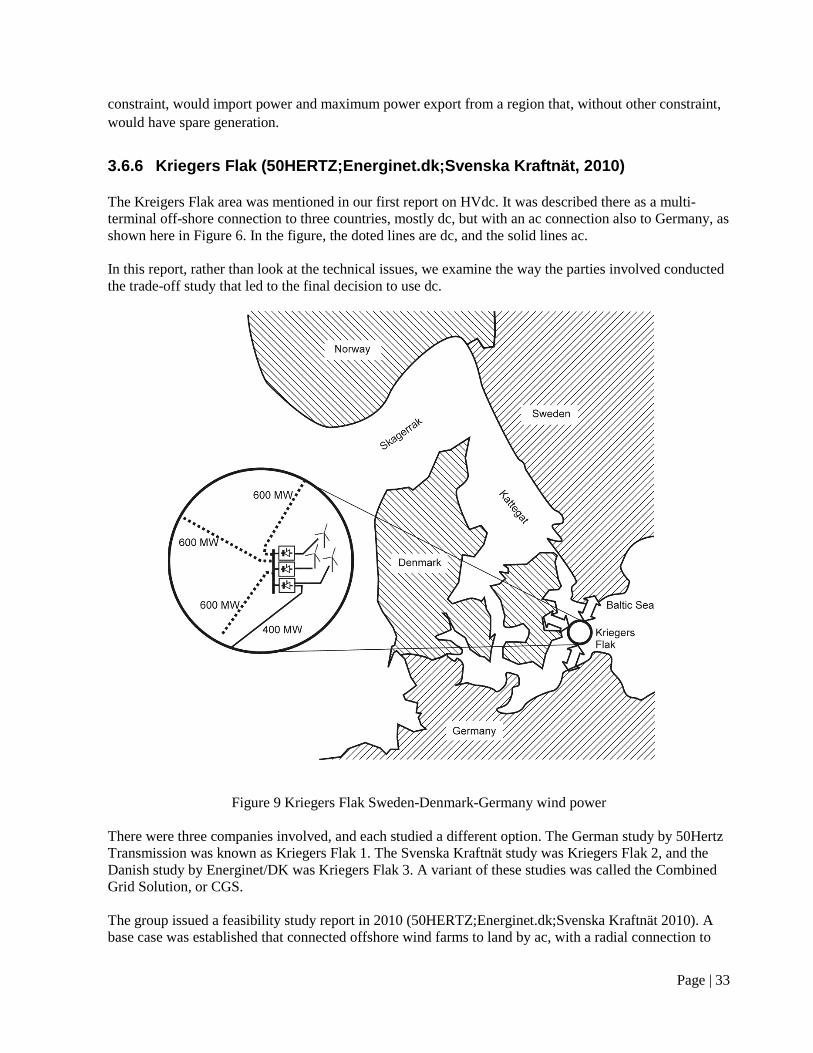
Page | 33
constraint, would import power and maximum power export from a region that, without other constraint, would have spare generation.
3.6.6 Kriegers Flak (50HERTZ;Energinet.dk;Svenska Kraftnät, 2010) The Kreigers Flak area was mentioned in our first report on HVdc. It was described there as a multi-terminal off-shore connection to three countries, mostly dc, but with an ac connection also to Germany, as shown here in Figure 6. In the figure, the doted lines are dc, and the solid lines ac. In this report, rather than look at the technical issues, we examine the way the parties involved conducted the trade-off study that led to the final decision to use dc.
Figure 9 Kriegers Flak Sweden-Denmark-Germany wind power There were three companies involved, and each studied a different option. The German study by 50Hertz Transmission was known as Kriegers Flak 1. The Svenska Kraftnät study was Kriegers Flak 2, and the Danish study by Energinet/DK was Kriegers Flak 3. A variant of these studies was called the Combined Grid Solution, or CGS. The group issued a feasibility study report in 2010 (50HERTZ;Energinet.dk;Svenska Kraftnät 2010). A base case was established that connected offshore wind farms to land by ac, with a radial connection to

Page | 34
land from generation in the area of wind resource from each country separately. Various options for interconnecting the three countries were considered, with dc interconnections. Some options allowed power flow between two of the three countries (say, Germany and Sweden), and had no effect on the flows with the county left out (in this case it would have been Denmark). Other options used mainly ac technology, but used dc converter technology on shore to control the flows. Some alternatives had two converters, and some three. In the case of two converters, all the power flows could be controlled since the system would be constrained in its total power. Nevertheless, a three-converter alternative was considered to allow the marginal costs to be evaluated. When the costs were calculated, a question had to be answered regarding the scope of the costs to be considered. For example, a scheme capable of bringing a large fraction of the available power (more than 1 GW) to a single on-shore location might require reinforcement of the underlying ac system. Should the cost of such reinforcement be included in the trade-off? The conclusion for Kriegers Flak was yes, but when reinforcement was needed to allow increased trade with a neighbor, those costs were not to be included in this trade-off. The trade-off was a project of considerable size requiring expertise and judgment in both ac and dc technology. A lesson here is that time and money must be made available in order to allow a sound result, and the team performing the study must be given good guidance about what to include and what not to include in the study. Each of the studies included both the investment costs and the operating costs (losses and maintenance), which were considered as present values, presumably over the projects’ lifetimes. Altogether, there were perhaps seven alternatives on the table. The total costs were then compared to the reference case. In fact, all the options had higher investment costs and higher operational costs than the base case. However, the base case (radial lines to each country) had no possibility of trading. It was the value of the trading (up to 1 GW capacity) that made the difference. The DGC was the preferred solution of the trade-off study. The reasons for preferring the CGS over the alternatives were a combination of technical and economic. Initially, the decision to build complete CGS was not made. Instead, the Danish and German elements were planned.15 However, the latest information from Denmark16 includes Sweden, and says that a 600 MW system is to begin operation between 2018 and 2020.
3.6.7 CIGRE study of Voltage Source Converter (VSC) HVDC for Power Transmission – Economic Aspects and Comparison with other AC and DC Technologies
CIGRE Working Group B4 (Westermann, et al. 2012) produced a rather extensive review of the state of the art of high voltage dc converters, including a description of some of the applications of the technology
15 See http://wiki-cleantech.com/grids-and-transmission/kriegers-flak-combined-grid-solution-project 16 See http://denmark.dk/en/green-living/sustainable-projects/kriegers-flak-the-worlds-first-offshore-electricity-supergrid/

Page | 35
for such things as reactive support, system damping, and black start capability. The topics (and more) are introduced so they can be included in a value analysis. A multi-page Value Matrix is given for the various functions and the various transmission technologies.
The application of dc to some planning examples is shown. For example, in the case of the Dutch system, with various scenarios for offshore wind farms, it is shown that HVdc is “a possible contender” as part of a meshed ac grid even though the distance involved is quite short. With the assumed costs of overhead lines and underground cables and dc terminal costs, the dc connection examined would be 4 to 5 times more expensive than the ac overhead line option, but 1.45 to 1.75 times cheaper than an ac cable connection.
The key is the amount of underground needed: the “breakeven” distance is calculated to be 30 km of cable.
A further example is given of the use of dc, this one is in the middle of Germany, where a connection of about 200 km from Wahle (near Braunschweig) to Mecklar (North-East of Frankfurt) was studied. It is shown that the system losses are higher (by a factor of about 3) for the dc scenarios considered. Figure 5 is adapted from the CIGRE report.
Figure 10. Evaluation of losses for four scenarios
The situation with respect to the losses arises because while the dc line losses are lower than for ac, the converter losses are larger, and not sufficiently compensated by the line loss savings because the distance is rather short.
The cost of the HVdc scenarios was greater, too, by a factor of over 3.5. It was concluded, nevertheless, “the HVDC option could be a viable choice if the system’s operational advantages are taken into consideration, or in case the system needs (partial) undergrounding.” It should be noted, however, that the following “remark” was attached to another, similar, study within the same CIGRE report:
Remark: The study has been conducted with “old” (before 2010) VSC converter technology. If this study would be performed with current TLC / MMC technology the cost for the VSC HVDC station losses are expected to be only 50% of the figures given here.

Page | 36
The CIGRE report finishes with an examination of a cross-border transmission project, assumed to be a 1500 MW transmission capacity and a distance of 1000 km. It is assumed that the two countries involved are both deregulated markets. Detailed costs (right-of-way, environmental, maintenance) are presented for comparison. Then a cash flow analysis is done under the following assumptions:
• Discount rate: 8% • Power rating: 1500 MW • Transmission distance: 1000 km • Market price difference: 15 €/MWh • Loss compensation price: 65 €/MWh • Availability: 8300 h • Active power utilization 80 - 90% • Reactive power utilization: max. ±650 – ±900 MVar • Black-start / Island-supply applicable: yes • Asset lifetime: 40 years • Period of consideration: 25 years in operation – After 25 years it can be expected that
major investments in the scheme will be necessary to retrofit the functionality
The report says
The cumulated discounted cash flow shows the summary of discounted yearly cash summarized until the considered year. If the cumulated cash flows turn from a negative into a positive value the projects get profitable. This point is called break-even and reached 19 years after project start (see. Figure 5.15) for the considered HVAC OHTL base case.
However, the figure referred to does not show a breakeven time. The dc cases studied do show breakeven times, and if they are to be believed, the VSC-HVdc case is the clear winner. That is the clearly stated conclusion of the CIGRE authors.
The overall conclusion of the document is this:
Power electronic solutions are still undergoing rapid development, with increasing ratings becoming available each year, new technical features becoming available, power losses being reduced, and equipment costs changing with raw material costs and new market players providing additional competition. So, this report gives a snapshot on the current technology, application areas and economic values. With the ongoing developments it can be well expected that VSC-HVDC will become even more attractive for bulk power transmission and might become an economic feasible alternative to other technologies.
It is a shame, therefore that the report is so long and complex that the message is hard to find.

Page | 37
4.0 Conclusions
We can consider the CIGRE effort a guide for our own work. It shows methods that are applicable in the economics of power system planning. But a clearer and more accurate document is needed.
The findings in the CIGRE report are not likely to be directly applicable to the US, because geographic factors are different. For example, there are countries in Europe that would, for all practical purposes, not allow an overhead line to be built. Constrained to go underground, power transmission by direct current will be clearly favored.
However, even if the findings are not representative for us, the manner presentation of some of the results is instructive. In particular, we are of the opinion that the work that lies behind the presentation of the cash-flow situation is the key to the ac/dc trade-off. For example, consider the amount of information in Figure 6, based on Figure 5.19 in the CIGRE report.
Figure 11. 30-year cash flow for assumed overhead line
There are expenditures before construction and commissioning: these include the environmental assessments, for example. For the cable system here, it is just a few years. Commissioning takes place at about year 6, as evidenced by the cash-flow becoming positive. During operation, the various losses and flexibility factors are included in the cash flow, as well as economic factors such as the discount rate.

Page | 38
We think that an interactive spreadsheet could be designed and made to account for such factors as these. Such a spreadsheet would allow the user to change assumptions and examine the outcome in a very realistic way.
The owners of the sort of facilities that would be considering the ac/dc tradeoff surely already have spreadsheets that enable them to do their transmission planning in this kind of way. If we develop our own version, it would be with the intent of illustrating how to incorporate the factors that are hard to pin down: the benefit of flexibility or of damping control for example. With that sort of factor included, a fair assessment might result in a different outcome than if they were not included.
That conclusion, at least, is implied in the statements of several of the papers we have studied.
It is time to verify it.

Page | 39
5.0 Appendix on cost equations
The easy way to convert from present (P) to future (F) is to apply the formula
𝐹𝐹 = 𝑃𝑃(1 + 𝑖𝑖)𝑛𝑛 (1) Thus, for example, if the interest rate is 3%, a dollar now is as good as $1.5579 in 15 years time. If you need to reverse that calculation, to say that a certain amount must be held in reserve, for example, for decommissioning costs, then the exponent becomes negative
𝑃𝑃 = 𝐹𝐹(1 + 𝑖𝑖)−𝑛𝑛 (2) Thus, if the future need is for a dollar, the present need is for ¢64.18, assuming the incoming interest is the same as the outgoing, which it likely won’t be. These calculations are, of course, the reciprocal of one another. Both are functions in Excel, =FV and =PV. To recover the cost of the capital invested in the initial construction of the project, the accountants assume a series of uniform payments made (out of the incoming cash flow after commissioning) for a period of years. The calculation is customarily one in which the amount A is found, given the amount to be paid back (P), the interest rate, and the number of payments. In the case of the HVdc example in the CIGRE report (ref), we see that the project went into the black eleven years after commissioning. In practical terms, it seems conceivable that in a private-sector venture, the project may wish to defer the crossover time so that some returns can be made to the investors early in the life of the project. That is a decision that could be accommodated into a spreadsheet by means of, for example, a pull-down menu. The cash flow diagram for recovering capital reveals the equation that would apply. A certain amount would be put into a project at time zero, and its value would grow according to Equation (1). Regular payments would be made out of this (growing) amount. The balance would be zero at the end of the project. Figure 2 shows the cash-flow diagram.
Figure 12 Cash-flow diagram of capital cost recover in equal installments
The problem here is to find A. The equation for A is

Page | 40
𝐴𝐴 =𝑃𝑃𝑖𝑖(1 + 𝑖𝑖)𝑛𝑛
(1 + 𝑖𝑖)𝑛𝑛 − 1 (3)
Sometimes money is put into what is called a sinking fund. This money is set aside from money coming in in order to be available in the future when needed. For example, the cost of decommissioning the old mercury arc valves in HVdc converters was most likely accounted for via a sinking fund. If the sinking fund contributions are uniform, the amount that must be set aside every year can be calculated given the future amount needed and the interest rate. The amount (A) is given by
𝐴𝐴 =𝐹𝐹𝑖𝑖
(1 + 𝑖𝑖)𝑛𝑛 − 1 (4)
This calculation can be reversed, too, to find the future amount given a uniform payment. This is called an annuity, by the way. The future amount is given by
𝐹𝐹 =𝐴𝐴(1 + 𝑖𝑖)𝑛𝑛 − 1
𝑖𝑖
(5)
It may be that there is some case for calculating with an assumption of “smooth” compounding of interest instead of in chunks at the end of the year. In that case, the various equations can be re-written to use a number usually labelled r instead of I, and the compounding assumed done over a time of n years rather than for n periods. With these assumptions, the future value F of a present asset value P
𝐹𝐹 = 𝑃𝑃(1 + 𝑖𝑖)𝑛𝑛 (1) becomes
𝐹𝐹 = 𝑃𝑃𝑃𝑃𝑟𝑟𝑛𝑛 (1a) The inverse problem, finding the present value of a future asset
𝑃𝑃 = 𝐹𝐹(1 + 𝑖𝑖)−𝑛𝑛 (2) becomes
𝑃𝑃 = 𝐹𝐹𝑃𝑃−𝑟𝑟𝑛𝑛 (2a) The capital recovery problem (also called amortization) describing the amount A required for n periods
𝐴𝐴 =𝑃𝑃𝑖𝑖(1 + 𝑖𝑖)𝑛𝑛
(1 + 𝑖𝑖)𝑛𝑛 − 1
(3)

Page | 41
becomes
𝐴𝐴 =𝑃𝑃(𝑃𝑃𝑟𝑟 − 1)1 − 𝑃𝑃−𝑟𝑟𝑛𝑛
(3a)
The sinking fund payment A needed to pay for some future cost
𝐴𝐴 =𝐹𝐹𝑖𝑖
(1 + 𝑖𝑖)𝑛𝑛 − 1
(4)
becomes
𝐴𝐴 =𝐹𝐹(𝑃𝑃𝑟𝑟 − 1)𝑃𝑃𝑟𝑟 − 1
(4a)
The annuity problem establishing the future amount given a uniform series of payments
𝐹𝐹 =𝐴𝐴(1 + 𝑖𝑖)𝑛𝑛 − 1
𝑖𝑖
(5)
becomes
𝐹𝐹 =𝐴𝐴(𝑃𝑃𝑟𝑟𝑛𝑛 − 1)
1 − 𝑃𝑃𝑟𝑟𝑛𝑛
(5a)
In the matter of a trade-off study, the inflows and outflows of money are at the various times of the project life can be compared in an even-handed way using methods based on the equations in this appendix, and others like them. Provided a good engineering assessment of the situation can be made, and good economic arguments made for the predicted value (or cost) of the various technical alternatives, the spreadsheet may be relatively straightforward.

Page | 42
6.0 Appendix on some interesting HVdc schemes
6.1 PDCI: the Pacific DC Intertie The PDCI is a line from Celilo (near The Dalles on the south bank of the Columbia river between Washington and Oregon), to Sylmar, (at the junction of the 5 freeway and the 210 freeway in the San Fernando Valley north of Los Angeles) (Eriksson, et al. 2014). It presents an interesting example of the problems of straining to do life extension. Originally built in the 1960s (commissioned in 1970) it was aimed at evening the cost of power in the US west, taking advantage of different patterns of demand and different generation costs in the region. (And it is well-known that it has been spectacularly successful in doing this.) The converter technology of the time was based on thyratrons, or mercury arc valves. At each end, three valves were connected in series as part of a six-pulse valve group, with a line voltage of 400 kV (to ground). Two lines (of opposite polarity) carrying 1800 Amps set the path rating at 1440 MW. In 1972, not long after the line was commissioned, there was an earthquake (Richter 6.7) whose epicenter was very close to the southern terminal. There was considerable damage to the terminal, and lessons were learned that have affected subsequent designs.17 Following the earthquake, the southern terminal of the line had to be reconstructed. In 1984, the voltage level was raised by adding another valve group to each pole. This valve group was based on thyristor (that is, solid-state) technology. While it raised the power level only by 100 kV, it allowed the path rating to be increased to 2000 MW. The addition of the thyristors also virtually sealed the fate of the mercury arc valve. A parallel converter was added at each end of the line in 1989, again based on thyristor technology. The path rating was increased to 3100 MW. There was a major fire at the southern terminal in 1993, and much of the terminal was rebuilt, using thyristor technology. The northern terminal at Celilo took the opportunity to acquire spare parts by “raiding” Sylmar. In 2004, the Sylmar terminal was “rationalized” by replacing all the remaining mercury arc valves and all the control systems with new equipment. While some of the station yard was re-used, and much of the control building, the new converter system had just two 12-pulse converters. At the same time, the Celilo end benefitted from the replacement of its remaining mercury arc valves with thyristors. (These happened to be light-fired thyristors.) The end result of all this is that after 40 years of operation, the Sylmar end of the line was a unified system of two 12-pulse converters, whereas the northern end was a collection of different converter 17 For example, it is not routine to suspend the converter valves from the top rather than support them from the bottom. The rigid supports for the mercury-arc valves failed because of the ground motion in Sylmar.

Page | 43
technologies installed over the years and using different control systems. There were four converter systems operating at Celilo. In the view of the present authors, it is a tribute to the talents of the engineering staff at Celilo that they had been able to keep things going for so long. In 2009 a feasibility study was undertaken that compared two options. In one, the four-converter arrangement would be retained, in the other, the more usual two-converter bipole would be used. This latter option, which promised higher reliability and lower losses, was selected by BPA. At the time of this writing, the Celilo station is undergoing this major refurbishment, and is scheduled to be back in service at full power (now upgraded to 560 kV and 3800 MW) this year. This short history of one project reveals the difficulties that may be expected in predicting the outcome of a system reinforcement. Was the overall set of choices made best in the economic sense? It is impossible to say, for as the technical changes were going on over the more than four decades of the project, the economy was going through its own unpredictable movements. No doubt each decision (for example, update Sylmar but not Celilo, because Sylmar had a fire) seemed appropriate at the time. But with the changes in technology that were bypassed because of such decisions, the overall efficiency and reliability doubtless have suffered, and the dependence on the talents of the engineering staff at Celilo increased.
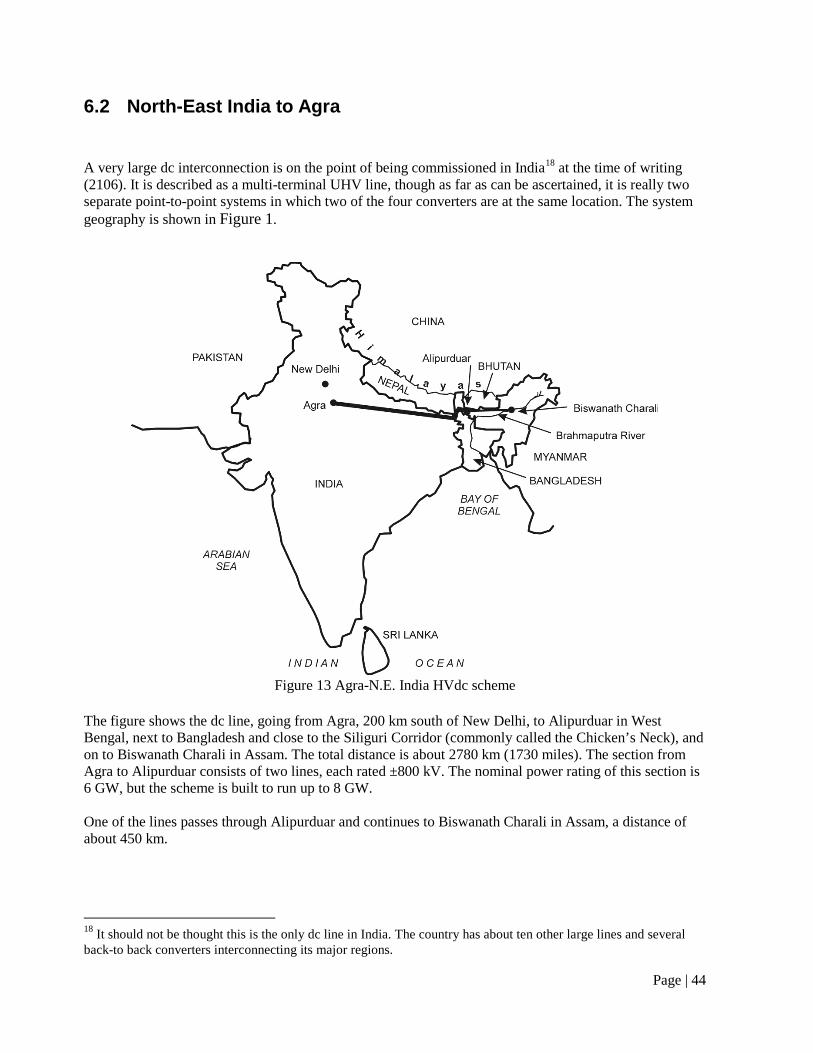
Page | 44
6.2 North-East India to Agra
A very large dc interconnection is on the point of being commissioned in India18 at the time of writing (2106). It is described as a multi-terminal UHV line, though as far as can be ascertained, it is really two separate point-to-point systems in which two of the four converters are at the same location. The system geography is shown in Figure 1.
Figure 13 Agra-N.E. India HVdc scheme
The figure shows the dc line, going from Agra, 200 km south of New Delhi, to Alipurduar in West Bengal, next to Bangladesh and close to the Siliguri Corridor (commonly called the Chicken’s Neck), and on to Biswanath Charali in Assam. The total distance is about 2780 km (1730 miles). The section from Agra to Alipurduar consists of two lines, each rated ±800 kV. The nominal power rating of this section is 6 GW, but the scheme is built to run up to 8 GW. One of the lines passes through Alipurduar and continues to Biswanath Charali in Assam, a distance of about 450 km.
18 It should not be thought this is the only dc line in India. The country has about ten other large lines and several back-to back converters interconnecting its major regions.

Page | 45
The exact details of the power sources have not been identified, but it is known that there are abundant hydro resources on the Brahmaputra River (see Figure 6). In a 2006 report written for the World Bank, the river was said to have a potential of almost 35 GW at 60% load factor.19 The decision has been made to put the Agra converters indoors.20 Though no reason has been given, it is reasonable to assume that the intensity of the monsoon rains may have played a role. (It was mentioned in our earlier report (Kirkham, Elizondo and Dagle 2014) that high voltage dc insulation was sometimes problematic when wetted.) Keeping dry the various bushings would seem to be a simple and reliable way to solve the problem. It may be of interest to overlay the areas of India that were blacked out in 2012. These are shown in Figure 7. The blackouts were the result of problems on the transmission system, the first starting in central India south of Agra, the second in Agra itself. Doubtless, this major dc line will reinforce the system in the area.
Figure 14 Map of India, showing areas blacked out in 2012
19 See http://web.worldbank.org/archive/website01062/WEB/IMAGES/PAPER_6_.PDF page 12. 20 See http://new.abb.com/systems/hvdc/references/north-east-agra

Page | 46
6.3 Russian HVdc
6.3.1 Origins An early book on HVdc21 mentions, in its first paragraph, the Volgograd-Donbass scheme in Russia. It was described as the culmination of development in the USSR. The origins are more interesting than the image created by the book, an image of devoted Soviet engineers and scientists advancing the state of the art. The line was commissioned in 1965, the same year the book was published. It followed an earlier scheme, from Moscow to Kashira, 115 km to the south. That line was based on equipment “liberated” from Berlin at the end of WWII. This equipment had been part of the Elbe Projekt, and was the first static22 dc converter station anywhere. Construction had begun during WWII on a system designed to carry 60 MW at a level of ±200 kV. But it was never completed. The Russian version (Moscow-Kashira) was a 200 kV monopole, rated at 30 MW. It was a somewhat experimental line: various combinations of valves were tried, and although the operation of two valves in series was attempted to allow a higher voltage, there were reliability problems. Uno Lamm, at ASEA in Sweden, was developing a valve with a voltage divider network on the anode structure that solved the problem of series connection. A Russian-designed valve was used on the next Russian line, the Volgograd-Donbass line. The Volgograd-Donbass line was built to move hydro power from the Volga River to Ukraine. It was 475 km long, and operated as a ±400 kV bipole, then the highest dc voltage in the world. . The power rating was 750 MW. Wikipedia reports23 that the line is in poor condition now, and operates at only 100 kV.
6.3.2 Abandoned UHV line in Russia In 1978, a dc line was started connecting Ekibastuz in Kazhakstan to the town of Tambov in Russia, about 450 km SE of Moscow. The line was to be at ±750 kV, and would have moved 6 GW a distance of 2400 km, making it longest line anywhere. (The Indian line described above will be slightly longer and will operate at slightly higher voltage, and have the same nominal rating.) Figure 11 shows the proposed route of the line.
21 High Voltage Direct Current Converters and Systems, B.J. Cory (Ed), McDonald, London, 1965. 22 Meaning there were no rotary converters. 23 https://en.wikipedia.org/wiki/HVDC_Volgograd%E2%80%93Donbass
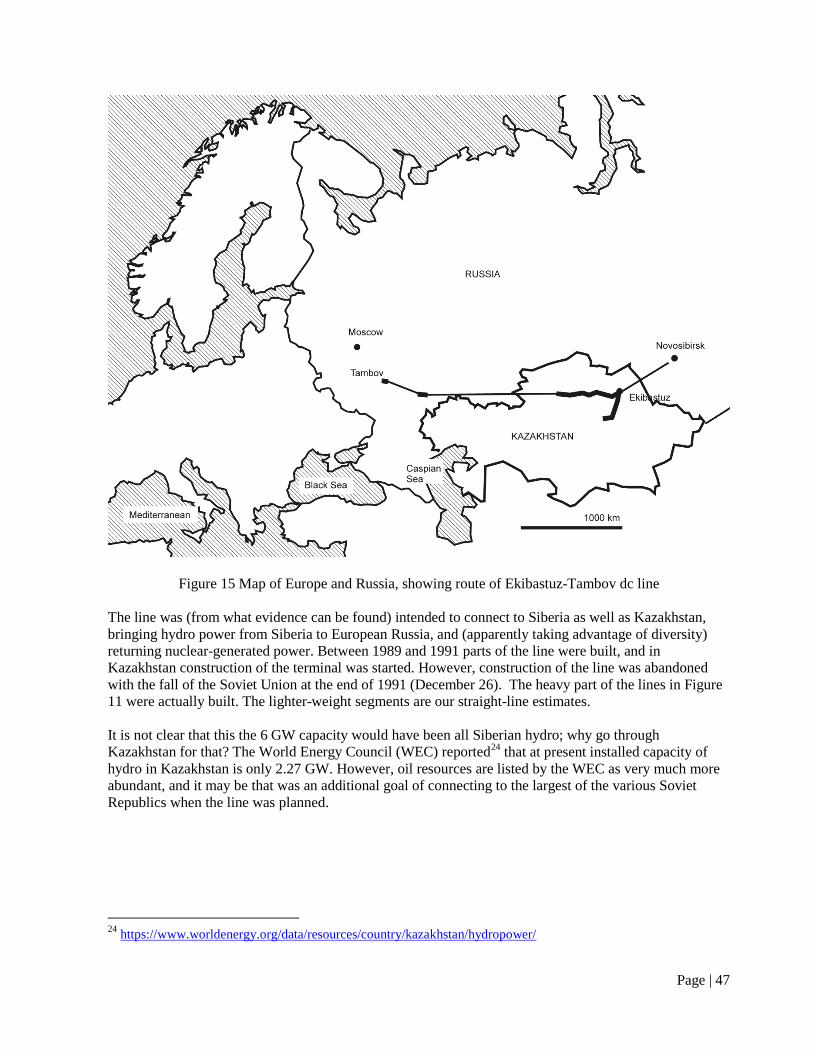
Page | 47
Figure 15 Map of Europe and Russia, showing route of Ekibastuz-Tambov dc line The line was (from what evidence can be found) intended to connect to Siberia as well as Kazakhstan, bringing hydro power from Siberia to European Russia, and (apparently taking advantage of diversity) returning nuclear-generated power. Between 1989 and 1991 parts of the line were built, and in Kazakhstan construction of the terminal was started. However, construction of the line was abandoned with the fall of the Soviet Union at the end of 1991 (December 26). The heavy part of the lines in Figure 11 were actually built. The lighter-weight segments are our straight-line estimates. It is not clear that this the 6 GW capacity would have been all Siberian hydro; why go through Kazakhstan for that? The World Energy Council (WEC) reported24 that at present installed capacity of hydro in Kazakhstan is only 2.27 GW. However, oil resources are listed by the WEC as very much more abundant, and it may be that was an additional goal of connecting to the largest of the various Soviet Republics when the line was planned.
24 https://www.worldenergy.org/data/resources/country/kazakhstan/hydropower/

Page | 48
At this voltage level, it was decided to have tall towers (over 40 m) and use a bundled conductor. Figure 12 shows a tower that is likely on the Siberian side of the interconnection (at least, the caption with the picture—in Russian—mentions Siberia (СИБИРИ ) explicitly.25
Original Caption ВВОД В ЭКСПЛУАТАЦИЮ ЛЕКТРОПЕРЕДАЧИ` ПОСТОЯННОГО TOКA 1500 КВ ЭКИБАСТУ3-ЦЕНТР ПОЗВОЛИТ БЕЗ ДОПОЛНИТЕЛБНОГО СОЗДАНИЯ В ЕВРОПЕЙСКОЙ ЧАСТИ СССР СОБСТВЕННЫХ МAHEBPEHHЫX ЭНЕРГОМОЩНОСТЕЙ ПЕРЕДАТЬ В ЭТОТ РАЙОН ИЗ СИБИРИ ДО 4 млн.кВт ИСПОЛЬЗУЕЮЙ МОШНОСТИ ГЭС С ВОЗВРАТОМ В НОЧНЫЕ ЧАСЫ 5 млн.кВт В ОЭС СИБИРИ ЗА СЧЕТ ИСПОЛЬЗОВАНИЯ БАЗИСНОЙ МОШНОСТИ АЭС. Approximate translation: Commissioning the 1500 kV dc line from Ekibastuz to Center will allow without additional creation of power infrastructure in the European part of the USSR to transmit 4GW of maneuverable [hydro] power from Siberia and return 5 GW [from nuclear generation] at night.
Figure 16 Tower of Russian Ekibastuz to Tambov line
25 See http://museum.moesk.ru/upload/resize_cache/iblock/dbd/957_1800_1/dbd2408f321d289ec95fc33638592302.png accessed March 2016.

Page | 49
7.0 Bibliography
50HERTZ;Energinet.dk;Svenska Kraftnät. "Kriegers Flak Combined Grid Solution Feasibility Study." 2010.
Anderson, J.M., and J.J. Carroll. "Applicability of a Vacuum Interrupter as the Basic Switch Element in HVDC Breakers." IEEE Transactions on Power Apparatus and Systems, 1978: 1893-1900.
Barthold, L.O. "Technical and Economic Aspects of Tripole HVDC." International Conference on Power System Technology. IEEE, 2006. 1-6.
Bell, K., et al. "Economic and technical criteria for designing future off-shore HVDC grids." 2010 IEEE PES Innovative Smart Grid Technologies Conference Europe (ISGT Europe),. 2010.
Beshir, M. J, and H Bjorklund. Upgrading the Intermountain HVDC Project to handle 480 MW additional Wind Power. Paris, France: CIGRE, 2012.
Buijs, P., D. Bekaert, S. Cole, D. Van Hertem, and R. Belmans. "Transmission investment problems in Europe: Going beyond standard solutions." Energy Policy (Elsevier), 2011: 1794-1801.
C4/B4/C1.604, Joint Working Group. Influence of Embedded HVDC Transmission on System Security and AC Network Performance. Paris: CIGRE, 2013.
Campos Barros, J.G., S.o. Frontin, J.A. Jardini, and L.B. Reis. "Engineering Studies for HVdc above + - 600 kV with a view to its application to the trasnmsission of large blocks of power over very long distances." CIGRE 14-01. 1988.
Cole, S., D. Van Hertem, and R. Belmans. "VSC HVDC as an alternative grid investment in meshed grids." First International Conference on Infrastructure Systems and Services: Building Networks for a Brighter Future (INFRA), 2008: 1-6.
Daelemans, G., K. Srivastava, M. Reza, S. Cole, and R. Belmans. "Minimization of steady-state losses in meshed networks using VSC HVDC." IEEE Power & Energy Society General Meeting, 2009., 2009: 1-6.
Dougherty, J.J., and H. Kirkham. "System Aspects of a Tapped DC Line with Dynamic Controls." IEEE Transactions on Power Apparatus and Systems, Vol PAS-89, No 8, 1970: 2066-2074.
Ekstrom, A., H. Haertel, H.P. Lips, and W. Schultz. "Design and Testing of an HVdc Circuit-breaker." CIGRE 13-06. 1976.
Eriksson, K, O Sasksvik, T Holmgren, and K.A. Mitsch. "Celilo Pacific DC Intertie Upgrade presentation." CIGRE meeting. Paris: CIGRE, 2014. 1-8.
Fleeman, J.A., R. Gutman, M. Heyeck, and M. Normark, B Bahrman. "EHV AC and HVDC transmission working together to integrate renewable power." CIGRE/IEEE Joint Symposium on Integration of Wide-Scale Renewable REsources into the Power DElivery SYstem. Calgary: CIGRE IEEE, 2009.
Fuchs, A., and M. Morari. "Placement of HVDC links for power grid stabilization during transients." IEEE PowerTech. Grenoble: IEEE, 2013. 1-6.
Glasdam, J., J. Hjerrild, L.H. Kocewiak, and C.L. Bak. "Review on multi-level voltage source converter based HVDC technologies for grid connection of large offshore wind farms." 2012 International Conference on Communication Systems and Network Technologies (CSNT), 2012: 825-829.
Haileselassie, T.M., and K. Uhlen. "Power System Security in a Meshed North Sea HVDC Grid." Proceedings of the IEEE, Volume: 101 , No 4, 2013: 978-990.
Hsiao, T.Y., C. N. LU, Y. H. Liu, C.L. Cheng, and B.S. Chang. "Safety net design and implementation in taiwan power system." Fifth International Conference on Power System Management and Control. London: IET Conference Publications, 2002. 41-46.
Johansson, S.G., G Asplund, E Jansson, and R Rudervall. "Power System Stability Benefits with VSC DC-Transmision Systems." CIGRE B4-204. CIGRE, 2004.
Jovcic, D., D. Van Hertem, K. Linden, J.-P. Taisne, and W. Grieshaber. "Feasibility of DC transmission networks." Proceedings of ISGT-Europe, 2011. Manchester, England: IEEE, 2011.
Kirkham, H, M Elizondo, and J Dagle. An Introduction to High Voltage dc Networks. Richland: PNNL, 2014.

Page | 50
Li, Yifan, and J.D. McCalley. "Design of a High Capacity Inter-Regional Transmission Overlay for the U.S." IEEE Transactions on Power Systems, January 2015: 513-521.
MacDonald, Alexander E., Christopher T. M. Clack, Anneliese Alexander, Adam Dunbar, James Wilczak, and Yuanfu Xie. "Future cost-competitive electricity systems and their impact on US CO2 emissions." Nature Climate Change, January 2016: 1758-6798.
McAllum, D.' Moreau, G., J. Primeau, D. Soulier, M. Bahrman, and B. Ekehov. "Multiterminal Integration of the Nicolet Converter Station into the Quebec - New England Phase II HVdc Trasnmission System." CIGRE 14-103. 1994.
Melvold, D.J., P.R. Shockley, W.F. Long, and N.G. Hingorani. "Three terminal operation of the Pacific HVDC intertie for dc circuit breaker testing." IEEE Transactions on Power Apparatus and Systems, 1976: 1287-1296.
MISO. MISO Transmission Expansion Planning (MTEP) report. MISO, 2014. Mossadegh, N., and R.K. Aggarwal. "Management and viability of Multi-Terminal HVDC for offshore
renewable energy networking ." 45th International Universities Power Engineering Conference (UPEC), 2010, 2010: 1-6.
Posner, Wood, and Williams. Illinois Commerce Commision vs FERC, Case: 11-3421 Document: 176. Legal, US Court of Appeals, 2013.
Quintero, J, and V Venkatasubramanian. "A Real-Time Wide-Area Control Framework for Mitigating Small-Signal Instability in Large Electric Power Systems." Proceedings of the 38th Annual Hawaii International Conference on System Sciences. Hilton Waikoloa Village, HI: IEEE, 2005.
—. "Results on a Real-Time Wide-Area Control for Mitigating Small-Signal Instability in Large Electric Power Systems." Transmission & Distribution Conference and Exposition: Latin America,. Caracas, Venezuela: IEEE, 2006.
R. Gutman, P. P. Marchenko and R. D. Dunlop,. "Analytical Development of Loadability Characteristics for EHV and UHV Transmission Lines." IEEE Transactions on Power Apparatus and Systems, March 1979: 606-617.
Van Hertem, Dirk, and Marko Delimar. "Technical Limitations towards a SuperGrid – A European Prospective." IEEE International Energy Conference. IEEE, 2010. 302-309.
Westermann, D, et al. Voltage Source Converter (VSC) HVDC for Power Transmission – Economic Aspects and Comparison with other AC and DC Technologies. CIGRE Report, Paris, France: CIGRE, 2012.
Westermann, D., and H. Sauvain. "Experiences with Wide Area Coordinated Control of Facts Devices and HVDC in a Real Time Environment." IEEE Power Tech, 2007, Lausanne, 2007: 1688-1693.