economics of forest fire management: spatial … of forest fire management: spatial accounting of...
TRANSCRIPT
Proceedings of the Fourth International Symposium on Fire Economics, Planning, and Policy: Climate Change and Wildfires
81
Economics of Forest Fire Management: Spatial Accounting of Costs and Benefits1
José J. Sánchez2,3, Ken Baerenklau4, Armando González-Cabán3, and Kurt Schwabe4
Abstract To better evaluate the potential impacts of wildland fire in the San Bernardino National
Forest, we developed a geographic information system (GIS) data layer containing non-
market economic values for the San Jacinto Ranger District. Each pixel in the data layer
contains an estimate of the most prominent nonmarket values at that location. This
information can be used by forest managers as a decision making aid when deciding how to
allocate resources to protect high value areas. To estimate the recreation value component
and potential losses due to wildfire, backcountry hikers entering the San Jacinto Wilderness
were recruited to complete a web-based survey during the summer of 2012. A travel cost
model was used to calculate the associated values. This paper presents preliminary results
from the survey and ongoing modeling work.
Keywords: GIS, Nonmarket valuation, recreation value, travel cost method, viewshed analysis
Introduction Wildland fires affect millions of people worldwide. Globally it is estimated that 350 million hectares are burned annually (González-Cabán 2008). In the U.S., an annual average of 3.5 million hectares of wildlands burned from 2004 to 2008, at an annual average suppression cost of $1.6 billion.
The loss of natural resources, property and life from wildfires is also a major concern. Forested areas are particularly relevant because of their multiple uses (residential, recreation, and carbon sequestration among others). The forest also offers other amenities that are not directly useable but that people enjoy in some other way (e.g., knowledge that unique ecosystems exist, preservation for future
1 An abbreviated version of this paper was presented at the Fourth International Symposium on Fire Economics, Planning, and Policy: Climate Change and Wildfires, November 5-11, 2012, Mexico City, Mexico. 2 Ph.D. student, Department of Environmental Sciences, University of California, Riverside, Riverside, CA. 92521, U.S.A. 3 Economist and Research Economist respectively, Pacific Southwest Research Station, USDA Forest Service, Riverside, CA. 92507, U.S.A. Email: [email protected]; [email protected] 4 Associate Professor, Department of Environmental Sciences, University of California, Riverside, Riverside, CA. 92521, U.S.A.

GENERAL TECHNICAL REPORT PSW-GTR-245
82
generations or future use). To promote efficient land management strategies, it is necessary to determine both the use and nonuse values of those areas. Some use values can be directly identified from market transactions (e.g., the price of residential land, entrance fees). For other nonmarket uses and nonuse values, resource economists use techniques such as the Contingent Valuation Method (CVM) (Loomis and others 2002), Travel Cost Method (TCM) (Hesseln and others 2003), Hedonic Price Method (HPM) (Mueller and others 2009), and Stated Choice Experiment Method (CE) (Louviere and others 2000) to determine economic values. However, traditional nonmarket valuation analyses do not attempt to determine the specific value of each piece of a landscape or how welfare is affected if only part of a forest area is impacted by fire.
Recent increases in computing power have given researchers the ability to make greater use of geographic information systems (GIS). As use of this tool has become more popular, researchers have begun combining GIS software with nonmarket valuation methods to assist land and forest managers (e.g., see Baerenklau and others 2010, González-Cabán and others 2003). This combination has allowed researchers to derive spatially-explicit representations of landscape values; however, such studies are uncommon and little is known about how the aggregate value of a forest area should be allocated to the landscape. Having this information will enable resource managers, stakeholders and policy makers to make better-informed decisions on how to use resources more efficiently.
In this paper we provide a framework to determine the economic value of the San Jacinto Wilderness. The resulting information would allow fire managers plan fire management strategies to reduce potential losses from wildfires. Knowing level of potential losses from fire could help them decide to relocate existing distribution of firefighting resources to reduce losses. The travel cost method is implemented to estimate recreation benefits. Data collection via a web-based survey is ongoing and will be concluded by end of September 2012. Therefore, in this paper we present preliminary results for the forest access value.
Fire management Wildfire has been a constant threat to western United States ecosystems, but it has become a more serious problem in part due to increasingly dry conditions and forest management practices that have promoted ladder fuel accumulation. In a recent annual assessment, the U.S. Department of Agriculture Forest Service (USDAFS) reported that 1.7 million acres burned in the US while it suppressed more than 230 large fires and expended $1.46 billion for firefighting (USDA 2009). Recently fire suppression costs have increased dramatically while congressional funding levels
Proceedings of the Fourth International Symposium on Fire Economics, Planning, and Policy: Climate Change and Wildfires
83
have remained flat (USDA 2009). Therefore, land and forest managers need tools to understand which management strategies are more efficient. However, current tools only consider cost of fire prevention or suppression, not the economic benefits provided by forests.
Forest Benefits A forest provides several benefits to society ranging from conservation of ecosystems to recreation use. Resource economists have different nonmarket valuation methods that can be used to estimate the use and nonuse values associated with natural resources. Loomis and González-Cabán (1998) used a CVM survey to estimate the economic benefits of reducing fires in old growth forest. Fix and Loomis (1998) examined the economic benefits of mountain biking, in Moab, Utah, using a TCM, while Powe and others (1997) used an HPM to estimate the benefits residents received from woodland access. Hanley and others (1998) used CE to estimate the values of environmental assets (forests, rivers). Knowledge of the benefits and values produced from the forests would allow managers to prioritize their decisions to protect most valuable lands potentially affected from fires.
Fire impacts There are many types of natural and human-made disasters that damage or affect natural resources. Although fire is a natural part of many landscapes, catastrophic fires--often produced by a combination of both natural and human factors--are particularly damaging to forests. The impact of fire on natural resources and the associated economic consequences are difficult to estimate (González-Cabán and others 2003). The difficulty arises because there is limited information about the effects of fire on nonmarket values provided by forests. Early studies (Vaux and others 1984, Flowers and others 1985) found that intense fires are likely to have negative impacts on recreation. Recent studies have explored these negative effects. Loomis and others (2001) surveyed visitors of National Forests in Colorado to study the effects of fire on hiking and mountain biking visits and benefits. Using TCM, the authors found that crown fires indirectly affected recreation benefits for mountain bikers, but had no significant effect on hiking trips.
Also using TCM, Hesseln and others (2003) found that both hikers and mountain bikers in New Mexico reacted similarly to recovering prescribed fires and crown fires, with each group decreasing its visitation rate. Hesseln and others (2004) also found similar results when surveying hikers and mountain bikers in four national forests in western Montana. Differences in results between Loomis and others (2001)

GENERAL TECHNICAL REPORT PSW-GTR-245
84
and Hesseln and others (2003, 2004) suggest that the type of recreation activity may help determine how users react to fire.
In studying two hiking trails in the Cascade Mountains affected by a large scale forest fire (40,000 acres), Hilger and Englin (2009) found that the forest ecosystem had a short-run increase in visitation and the trip values were the same as before the fire. Englin and others (2001) examined the long term effects of fire in three different states: Colorado, Wyoming, and Idaho. Using TCM the authors found that visitation increased for recent fire, then decreased for the following 17 years, and then rebounded for the remaining 8 years of their observation period. In a similar study by Boxall and Englin (2008) for canoeing in the Canadian Shield boreal forest, damages occurred immediately following a fire, but after 35 years of regrowth, the forest amenity values returned to pre-fire levels.
Geographic Information Systems Increased computing power has made geographic information systems (GIS) more accessible and useable in conjunction with nonmarket valuation methods to derive spatially explicit landscape values. For example, Eade and Moran (1996) developed an “economic value map” for the Rio Bravo Conservation Area in Belize using the benefit transfer method and GIS to spatially allocate ecosystem service values. Troy and Wilson (2006) used a similar approach to produce a map of ecosystem service flow values based on land cover types for three case studies. González-Cabán and others (2003) estimate the effect of prescribed burning on deer harvest by using time-series data and GIS approaches with TCM and CVM; while Cavailhès and others (2009) evaluated landscape values and their effect on housing prices using GIS and HPM. A more relevant study is the GIS-based landscape valuation application by Baerenklau and others (2010). The authors used recreation permit data and a zonal TCM to estimate aggregate recreation value and spatially allocated the value to the landscape using GIS-based “viewshed” analysis.
Using similar GIS techniques as Baerenklau and others (2010) we will develop an economic data layer, which allows us to allocate the recreation values throughout the wilderness, and thus understand how economic welfare is affected if only part of the forest area is impacted by fire. This approach provides decision makers information to evaluate trade-offs between location based on potential expected losses.
Study Objectives

Proceedings of the Fourth International Symposium on Fire Economics, Planning, and Policy: Climate Change and Wildfires
85
This work uses GIS tools and nonmarket valuation methods to obtain a spatial representation of recreation value for the San Jacinto Wilderness, San Bernardino National Forest, California. The research has four main objectives:
Objective 1-Estimate trailhead access values for hypothetical burn scenarios A web-based survey is being administered in the San Jacinto Wilderness. Using both CVM and TCM, the economic use values (trailhead access) will be estimated and used to help determine how changes in viewshed (due to hypothetical fire intensity, percentage of area burn, and viewing distance) affect trip behavior.
Objective 2-Derive spatially explicit landscape values The study by Baerenklau and others (2010) used TCM and readily available data from recreation permits and census demographics to estimate wilderness access values. The authors also used a viewshed analysis technique to derive spatially explicit landscape values. However, this technique used untested assumptions about perceptions of scenic quality that recreation permit data alone cannot validate. The web-based survey used here also will provide the necessary information to spatially allocate the wilderness recreation value. These values will be compared against Baerenklau and others (2010) to determine if their simpler and less data-intensive method yields reliable results.
Objective 3-Estimate a transferrable hedonic price function The HPM indirectly values environmental characteristics by comparing two closely related goods, with one having extra environmental attributes. A hedonic landscape value function will be produced using parcel characteristics (e.g., slope, elevation, distance from trails, vegetation) collected from the San Jacinto Wilderness and derived landscape values, thus making the results obtained from the more data-intensive method proposed in this study potentially transferrable to other wilderness areas.
Objective 4-Determine how landscape values recover after wildfires Responses to the hypothetical burn scenarios in the survey will provide information about individual preferences and visitation behavior as a result of fire, fire age, and intensity, thus allowing determination of how recreation values recover after

GENERAL TECHNICAL REPORT PSW-GTR-245
86
wildfires and whether if there is significant spatial heterogeneity in the recovery process across the landscape.
Survey Design
Study Site This study focuses on backcountry hikers who visit the San Jacinto Wilderness Area, San Bernardino National Forest, Southern California (Figure 1). The wilderness covers 13,350 hectares and is located within a 2.5 hour drive from Orange, Los Angeles, San Diego, Riverside and San Bernardino counties near the town of Idyllwild. The town has a population of 14,846, average annual household income is $67,061, and 14.3% of the population has at least a bachelor’s degree (U.S. Census Bureau, 2010). Elevations range from 1,800 to 3,300 meters. The wilderness area gets approximately 60,000 visitors annually and another 350,000 people visit Mt. San Jacinto State Park via the Palm Springs Aerial Tramway. The wilderness area is regulated by USDA FS. The most popular activity is day hiking. Recreationists enter the wilderness area via the tramway or by driving to the trailheads located in Idyllwild.
Figure 1— Site location-San Jacinto Wilderness Area. Map provided by Baerenklau and others (2010).
Focus Group and Pre-test An initial version of the survey5 was presented to 3 focus groups (October 2011 to March 2012) to evaluate study design, clarity of wording, use of graphics, range of 5 This survey is being conducted as part of the senior author’s Doctoral thesis research at the University of California Riverside; no Federal Government financial resources were used in the design or implementation of the survey.
Proceedings of the Fourth International Symposium on Fire Economics, Planning, and Policy: Climate Change and Wildfires
87
values used, and to consider if important issues were omitted or obscured. Revised versions of the survey were pre-tested (May and June 2012) to evaluate whether or not respondents were answering questions in a sensible manner, verify that the web-based survey was working properly (i.e., survey link is active, pictures are loading correctly), and verifying the time required to complete the survey (approximately 20 minutes).
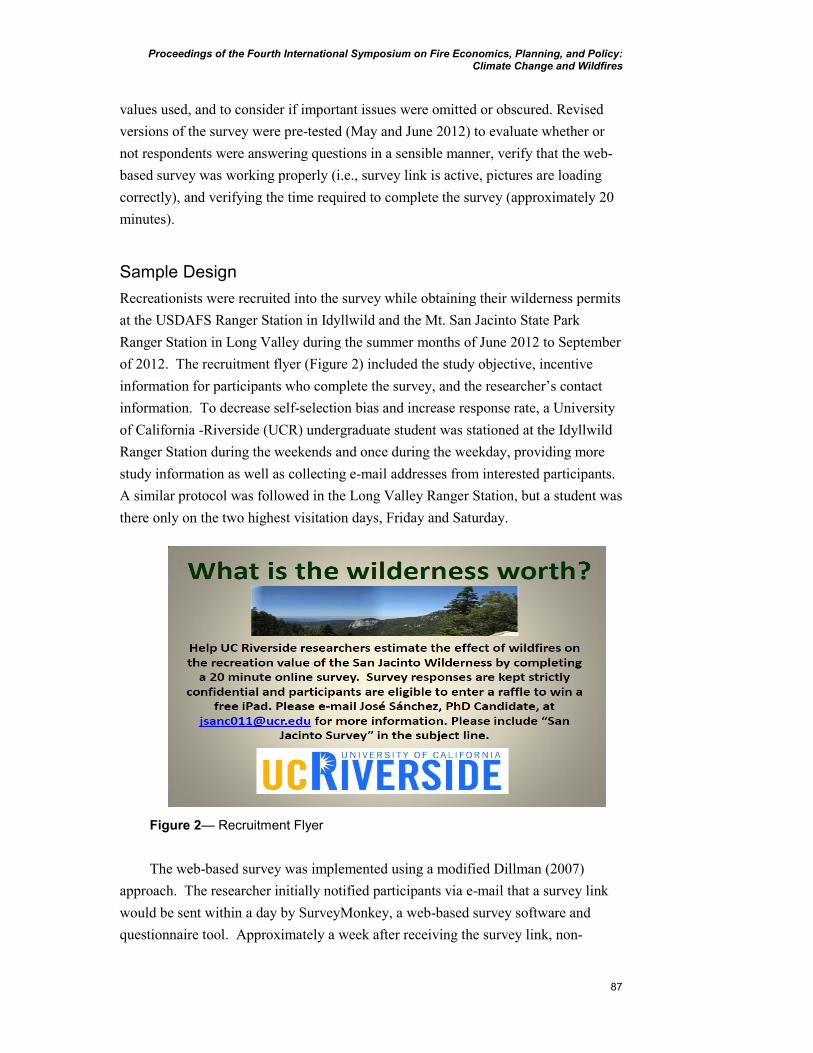
Sample Design Recreationists were recruited into the survey while obtaining their wilderness permits at the USDAFS Ranger Station in Idyllwild and the Mt. San Jacinto State Park Ranger Station in Long Valley during the summer months of June 2012 to September of 2012. The recruitment flyer (Figure 2) included the study objective, incentive information for participants who complete the survey, and the researcher’s contact information. To decrease self-selection bias and increase response rate, a University of California -Riverside (UCR) undergraduate student was stationed at the Idyllwild Ranger Station during the weekends and once during the weekday, providing more study information as well as collecting e-mail addresses from interested participants. A similar protocol was followed in the Long Valley Ranger Station, but a student was there only on the two highest visitation days, Friday and Saturday.
Figure 2— Recruitment Flyer The web-based survey was implemented using a modified Dillman (2007)
approach. The researcher initially notified participants via e-mail that a survey link would be sent within a day by SurveyMonkey, a web-based survey software and questionnaire tool. Approximately a week after receiving the survey link, non-

GENERAL TECHNICAL REPORT PSW-GTR-245
88
responders received a friendly e-mail reminder to complete the survey. The reminder included the link to the survey and incentive information for completing the survey. A final e-mail reminder was sent to non-responders approximately 3 weeks after the initial contact. Non-responders were removed from the participation list a week after sending the final e-mail reminder.
Interested participants who did not provide their e-mail address when obtaining the wilderness permit could e-mail the researcher directly requesting the survey link. Within a day of receiving a participant’s e-mail address, the researcher sent an e-mail thanking them for agreeing to participate. The email from SurveyMonkey followed shortly thereafter.
Survey Instrument The web-based survey is divided into three sections. The first section elicits the recreation trip behavior and cost-related information. The second section consists of hypothetical burn scenarios that contain five attributes of interest: percent of viewshed burned (25%, 50%, and 75%), intensity of fire (low, medium, and high), time since burn (0-5 years, 6-15 years, and more than 15 years), viewing distance (foreground, middle ground, and background), and trail affected by fire; in Idyllwild there are four trails: Deer Springs, Devil’s Slide, Marion Mountain, South Ridge; in Long Valley: Long Valley. The five trails were selected because they have the highest visitation rates based on 2005 data6. The final section of the survey collects demographics and personal information, including gender, ethnicity, age, education level, employment status and income.
There are a total of 405 (34x5) possible treatment combinations for the burn scenarios. A full factorial design was not implemented because higher order interactions are considered negligible. We were only interested in the main effects and 2-way interactions. It was decided that the most efficient strategy was to implement a fractional factorial design (Montgomery 2005) for the burn scenarios to reduce the cognitive burden faced by respondents. A D-efficient design of 100%, which contained 45 runs (treatment combinations), was selected for the fractional factorial design using the %mktruns and %mkteval programs in SAS statistical software (SAS Institute Inc., 2010).
Survey participants were shown a set of five burn pictures, each representing the landscape of the San Jacinto Wilderness if a fire were to occur there in the future. For example, a hypothetical burn scenario would be represented by a picture of a recent low-intensity burn in the foreground along with a description of the extent
6 Out of a total of 34,218 permitted visitors to the San Jacinto Wilderness in 2005, 33,194 visited the 5 trails (Baerenklau and others 2010).

Proceedings of the Fourth International Symposium on Fire Economics, Planning, and Policy: Climate Change and Wildfires
89
(50% of the viewable area) and location (along the Deer Springs trail) of the burn (Figure 3). Participants were asked to report how many trips would have they taken in the past 12 months to each of the 5 trails if the trail conditions changed as in the picture shown.
Figure 3— Web-based survey hypothetical burn scenario example
Econometric Model An incomplete demand system approach (von Haefen 2002) was used to estimate the TCM and associated welfare measures (i.e., forest access value) and welfare changes due to the hypothetical wildfire scenarios.
Travel Cost Model The basic concept of the TCM is that travel cost to the site is used to proxy for the price of access to the site. The method is based on the cost incurred by the individual to visit the resource being valued, which includes both out of pocket expenses and the opportunity cost of time. Out of pocket expenses may include driving costs (e.g., gas, tolls, and vehicle depreciation), food, equipment, etc. Opportunity cost of time is the cost associated with time of traveling to and from the area visited and is an important element of the TCM (see, for example, Hagerty and Moeltner 2005, McConnell and Strand 1981, McKean and others 1995, and Smith and others 1983.) In this study, driving costs are a function of distance (estimated from Google Maps) and the average per-mile cost of operating a typical car ($0.585/mile; AAA, 2012).

GENERAL TECHNICAL REPORT PSW-GTR-245
90
Time costs are a function of travel time (estimated from Google maps) and the
opportunity cost of time is assumed to be one-third of the individual’s reported
average hourly income (Hagerty and Moeltner 2005).
The TCM is estimated using an incomplete demand system approach. An
incomplete demand system provides a theoretically correct framework for modeling
the demand for multiple goods and deriving welfare estimates. Multiple systems have
been developed along with the associated welfare formulas. The demand
specification for trips used here is given by (von Haefen, 2002):
∑ , ∀ 1
where xj is demand for trips to site ∈ 1, … , ; pk is the cost of access site k; each β
is an estimable parameter describing the effect of the cost to access site k on the
demand for trips to site j; y is an individual’s annual household income, αj is an
estimable function, and γj are estimable parameters. To guarantee that we can derive
theoretically correct welfare estimates for the demand system in Eq. (1), we need to
make the following assumptions (LaFrance, 1990, von Haefen, 2002):
0, ∀ (2)
, ∀
0, ∀
0, ∀
Imposing these restrictions on Eq. (1) gives:
, ∀ 3
where ≡ and each is restricted to be negative.
The model parameters are usually estimated using either the Poisson or the
negative binomial distribution because the demand for trips is non-negative 0 .
Here we specify that the individual demand for each site follows an independent
Poisson distribution (Cameron and Trivedi, 1986):
∗
∗
∗! 4
with mean and variance equal to λj. The log-likelihood function is given by:
∑ ∗ ∗! 5

Proceedings of the Fourth International Symposium on Fire Economics, Planning, and Policy: Climate Change and Wildfires
91
with ≡ .
LaFrance (1990) and von Haefen (2002) derived a quasi-indirect utility function
from this system of demand:
, , ∑ 6
The consumer surplus (CS) is derived from the demand curve as the difference
between individual’s willingness to pay (e.g., the entire area under the demand curve)
and what they actually pay (e.g., their travel cost). The average CS per trip is
calculated as:
7
where is the estimated parameter for the travel cost variable.
Results The web-based survey was implemented in June and will conclude on September 30,
2012. Preliminary analysis was done to estimate the forest access value using the
first 100 observations. Observations with travel time greater than 3 hours and travel
cost over $1,000 were removed from the database. A total of 87 observations were
analyzed (51 from Idyllwild and 36 from Long Valley).
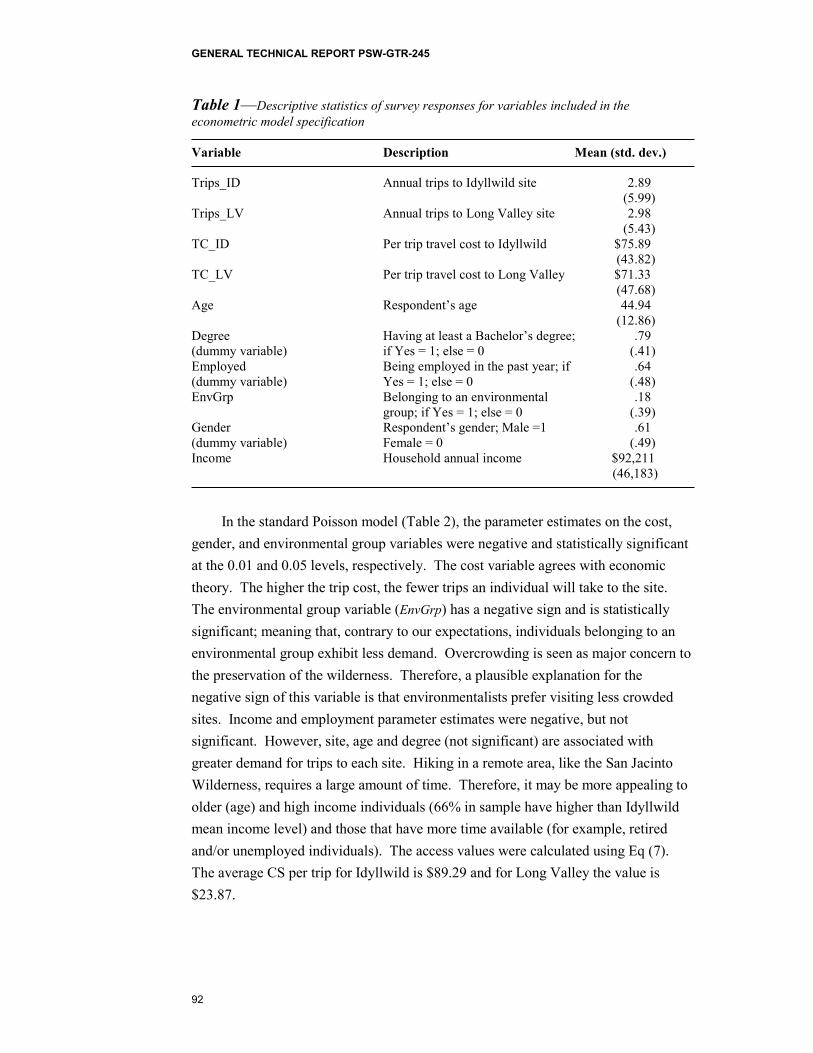
Descriptive statistics for respondent characteristics used in the empirical model
are shown in Table 1. Both sites have similar visitation rates and travel cost (an
average of 3 trips per year and $71 to $75 cost per trip). The most interesting
statistics are the income, age and education (expressed as college degree) variables.
Visitors to the wilderness are high income earners ($92,211), older than Idyllwild
residents (45 years), have more education (79% have at least a Bachelor’s degree)
and take few trips a year.
GENERAL TECHNICAL REPORT PSW-GTR-245
92
Table 1—Descriptive statistics of survey responses for variables included in the econometric model specification Variable Description Mean (std. dev.) Trips_ID Annual trips to Idyllwild site 2.89 (5.99) Trips_LV Annual trips to Long Valley site 2.98 (5.43) TC_ID Per trip travel cost to Idyllwild $75.89 (43.82) TC_LV Per trip travel cost to Long Valley $71.33 (47.68) Age Respondent’s age 44.94 (12.86) Degree Having at least a Bachelor’s degree; .79 (dummy variable) if Yes = 1; else = 0 (.41) Employed Being employed in the past year; if .64 (dummy variable) Yes = 1; else = 0 (.48) EnvGrp Belonging to an environmental .18 group; if Yes = 1; else = 0 (.39) Gender Respondent’s gender; Male =1 .61 (dummy variable) Female = 0 (.49) Income Household annual income $92,211 (46,183)
In the standard Poisson model (Table 2), the parameter estimates on the cost,
gender, and environmental group variables were negative and statistically significant at the 0.01 and 0.05 levels, respectively. The cost variable agrees with economic theory. The higher the trip cost, the fewer trips an individual will take to the site. The environmental group variable (EnvGrp) has a negative sign and is statistically significant; meaning that, contrary to our expectations, individuals belonging to an environmental group exhibit less demand. Overcrowding is seen as major concern to the preservation of the wilderness. Therefore, a plausible explanation for the negative sign of this variable is that environmentalists prefer visiting less crowded sites. Income and employment parameter estimates were negative, but not significant. However, site, age and degree (not significant) are associated with greater demand for trips to each site. Hiking in a remote area, like the San Jacinto Wilderness, requires a large amount of time. Therefore, it may be more appealing to older (age) and high income individuals (66% in sample have higher than Idyllwild mean income level) and those that have more time available (for example, retired and/or unemployed individuals). The access values were calculated using Eq (7). The average CS per trip for Idyllwild is $89.29 and for Long Valley the value is $23.87.

Proceedings of the Fourth International Symposium on Fire Economics, Planning, and Policy: Climate Change and Wildfires
93
Table 2— Poisson model estimates. The dependent variable is the number of trips taken in the past 12 months.
Variable Model Estimate Std. Err. Constant -42.05*** (5.21) Site 31.72*** (5.87) TC_ID -0.0112*** (0.0022) TC_LV -0.0419*** (0.0052) Income -0.0015 (0.00146) Gender -0.2201* (0.1245) Age 0.0452*** (0.0058) EnvGrp -0.3617** (0.1702) Degree 0.1375 (0.1601) Employed -0.0006 (0.0005) N 87 McFadden R2 0.3227 Note: * indicates significance at the 0.10 level, ** indicates significance at the 0.05 level, *** indicates significance at the 0.01 level. N is the number of observations. McFadden R2 is a goodness of fit measure that is based on estimates of the log-likelihood function including the intercept only versus the full model, and ranges between 0 (no explanatory power) and 1(perfect explanatory power.)
Conclusion and Discussion This analysis should be interpreted carefully. Data collection is still ongoing and the sample size used in the analysis represents less than 20% of the expected total. Preliminary results show that the San Jacinto Wilderness visitors are different from the Idyllwild residents. As mentioned above, sample visitors are high income earners ($92,211) and highly educated with 79% having at least a bachelor’s degree, while Idyllwild residents have lower annual household income ($67,061) and only 14.3% have at least a bachelor’s degree (U.S. Census Bureau 2010). We think the same pattern will remain when analyzing the full dataset.
The econometric model used in the analysis shows that the average values of CS per trip are not the same for both sites. Idyllwild has more than double the per person access value than Long Valley. We expected the values to be similar because both sites have access to the same destinations as well as similar travel costs. However, the difference in CS is due to having different demand curves for each site. Having

GENERAL TECHNICAL REPORT PSW-GTR-245
94
larger CS (smaller βTC) means that the demand curve is less elastic (e.g., less sensitive to changes in travel cost), while having smaller CS (larger βTC) demand is more sensitive to travel cost (more elastic). One possible reason for the difference is that campers are being captured in our day use survey. In the sample there were 18 individuals that reported camping as an activity done when visiting the area. Twelve of those visited Idyllwild and six visited Long Valley. Overnight trips are more costly than day trips. This can be seen in our survey data. Individuals that engaged in camping activities had a self-reported trip cost of $150, while non-campers reported $45. A model removing campers from dataset resulted in minor variations in estimates. Therefore, this information can help explain some of the difference in per person access value for Idyllwild and Long Valley.
Overall, our preliminary results show that visitors of the San Jacinto Wilderness are different (high income earners, have higher education, and older) from the Idyllwild population, and potentially have higher welfare estimates than the general Southern California population. The econometric model demonstrated that the per person access values are different for both sites due to possible overnight trips. Further analysis will be done on the entire dataset, considering only individuals on day use trips.
Using GIS techniques, future analyses will estimate specific values for each piece of the landscape and how economic welfare is affected if only part of the forest area is impacted by fire. This information can be used by forest managers and stakeholders as a decision aid for evaluating tradeoffs associated with alternative fire management strategies that would promote more sustainable future wildland fire management programs. Spatially explicit landscape values also could be used for evaluating preservation of wilderness areas, trail network design, campground development, zoning and building regulations for rural communities, location of scenic byways and overlooks, shoreline development regulations, and design of location-specific development impact fees.
Summary To better evaluate the potential impacts of wildland fire in the San Bernardino National Forest, we developed a geographic information system (GIS) data layer containing non-market economic values for the San Jacinto Ranger District. Each pixel in the data layer contains an estimate of the most prominent nonmarket values at that location. This information can be used by forest managers as a decision making aid when deciding how to allocate resources to protect high value areas. To estimate the recreation value component and potential losses due to wildfire, backcountry hikers entering the San Jacinto Wilderness were recruited to complete a

Proceedings of the Fourth International Symposium on Fire Economics, Planning, and Policy: Climate Change and Wildfires
95
web-based survey during the summer of 2012. A travel cost model was used to calculate the associated values. This paper presents preliminary results from the survey and ongoing modeling work. Acknowledgements We thank Andy Smith and the staff at San Bernardino National Forest San Jacinto Ranger District, and Bart Grant and staff at Mount San Jacinto State Park & Wilderness for assistance in distributing recruitment flyers. Also, UC Riverside students Noemi Villegas-Valadez and Yi-Chia Chu, and Hispanic Association of Colleges and Universities intern José Román for field work assistance; and Rich Alldredge, John Loomis, Pete Schuhmann, and Javier Suarez for their useful comments provided in developing the survey design.
References American Automobile Association (AAA), 2012. Cost of Owning and Operating Vehicle in
U.S. Increased 1.9 Percent According to AAA’s 20112 ‘Your Driving Costs’ Study. Available at: <http://newsroom.aaa.com/2012/04/cost-of-owning-and-operating-vehicle-in-u-s-increased-1-9-percent-according-to-aaa%E2%80%99s-2012-%E2%80%98your-driving-costs%E2%80%99-study/>. Accessed July 2012.
Baerenklau, K.A., González-Cabán, A., Paez, C., Chavez, E. 2010. Spatial allocation of forest recreation values. Journal of Forest Economics 16(2):113-126
Boxall, P. and Englin, J. 2008. Fire and recreation values in fire-prone forests: exploring an intertemporal amenity function using pooled RP-SP data. Journal of Agricultural and Resource Economics 33:19-33.
Cameron, A. and Trivedi, P. 1986. Econometric models based on count data: comparisons and applications of some estimators and tests. Journal of Applied Econometrics 1:29-54
Cavailhès, J., Brossard, T., Foltête, JC, Hilal, M., Joly, D., Tourneux, FP, Tritz, C., and Wavresky, P. 2009. GIS-based hedonic pricing of landscape. Environmental Resource Economics 44:571-590.
Dillman, D.A. 2007. Mail and internet surveys, 2nd Edition. John Wiley & Sons, Inc.
Eade, J.D.O. and Moran, D. 1996. Spatial economic valuation: benefit transfer using geographic information systems. Journal of Environmental Management 48:97-110.
Englin, J., Boxall, P., and Watson, D. 1998. Modeling recreation demand in a poisson system of equations: an analysis of the impact of international exchange rates. American Journal of Agricultural Economics 80(2):1837-1844
Englin, J., Loomis, J., and González-Cabán, A. 2001. The dynamic path of recreational values following a forest fire: a comparative analysis of states in the intermountain west. Canadian Journal of Forest Research 31:1837-1844.
ESRI. 2006. ArcMap 9.2. Using ArcGIS Spatial Analyst. Environmental Systems Research Institute, Redlands, CA.
Fix, P and Loomis, J.B. 1997. The economic benefits of mountain biking at one of its meccas: An application of the travel cost method to mountain biking in Moab, Utah. Journal of Leisure Research 29 (3):342-352.

GENERAL TECHNICAL REPORT PSW-GTR-245
96
Flowers, P.J., Vaux, H.J., Jr., Gardner, P.D., and Mills, T.J. 1985. Changes in recreation values after fire in the northern Rocky Mountains. USDA Forest Service Research Note Pac. RN-PSW-373.
González-Cabán, A. 2008. Proceedings of the second international symposium on fire economics, policy, and planning: a global view. Gen. Tech. Rep. PSW-208, Albany, CA: Pacific Southwest Research Station, Forest Service, U.S. Department of Agriculture. pp. 720
González-Cabán, A., Loomis, J., Griffin, D., Wu, E., McCollum, D., McKeever, J., and Freeman, D. 2003. Economic value of big game habitat production from natural and prescribed fire. U.S. Forest Service Pacific Southwest Research Station Research Paper #249. Available at: http://www.fs.fed.us/psw/publications/documents/psw_rp249/ Accessed October 2010.
Hagerty, D. and Moeltner, K. 2005. Specification of driving costs in models of recreation demand. Land Economics 81(1):127-143.
Hanley, N., Wright, R.E, and Adamowicz, V. 1998. Using choice experiments to value the environment. Environmental and Resource Economics 11(3-4):413-428.
Hesseln, H., Loomis, J.B., González-Cabán, A. 2004. The effects of fire on recreation demand in Montana. WJAF 19(1):47-53.
Hesseln, H., Loomis, J.B., González-Cabán, A. and Alexander S. 2003. Wildfire effects on hiking and biking demand in New Mexico: a travel cost study. Journal of Environmental Management 69:359-368.
Hilger, J., and Englin, J. 2009. Utility theoretic semi-logarithmic incomplete demand systems in a natural experiment: Forest fire impacts on recreational values and use. Resource and Energy Economics 31:287-298.
LaFrance, J.T. 1990. Incomplete demand systems and semilogarithmic demand models. Australian Journal of Agricultural Economics 34(2):118-131.
Loomis, J. B., and González-Cabán, A. 1998. A willingness-to-pay function for protecting acres of spotted owl from fire. Ecological Economics 25:315-322.
Loomis, J., González-Cabán, A., and Englin, J. 2001. Testing for differential effects of forest fires on hiking and mountain biking demand and benefits. Journal of Agricultural and Resource Economics 26(2):508-522.
Loomis, J. B., Griffin, D., Wu, E., González-Cabán, A. 2002. Estimating the Economic Value of Big Game Habitat Production from Prescribed Fire Using a Time Series Approach. Journal of Forest Economics 8(2):119-129.
Louviere, J.J., Hensher, D.A., Swait, J.D. 2000. Stated Choice Methods. Cambridge University Press, Cambridge, UK.
Mueller, J., Loomis, J., and González-Cabán, A. 2009. Do repeated wildfires change homebuyers’ demand for homes in high-risk areas? A hedonic analysis of the short and long-term effects of repeated wildfires on house prices in Southern California. Journal of Real Estate Finance Economics 38:155-172.
Powe, N.A., Garrod, G.D., Brunsdon, C.F. and Willis, K.G. 1997. Using a geographic information system to estimate an hedonic price model of the benefits of woodland access. Forestry 70(2):139-149.
SAS Institute Inc. 2010. SAS 9.3. SAS Institute Inc., Cary, NC.
Troy, A. and Wilson, M.A. 2006. Mapping ecosystem services: practical challenges and opportunities in linking GIS and value transfer. Ecological Economics 60(2): 435-449.

Proceedings of the Fourth International Symposium on Fire Economics, Planning, and Policy: Climate Change and Wildfires
97
US Census Bureau. 2010. 2006-2010 American Community Survey. Available at: http://factfinder2.census.gov/faces/nav/jsf/pages/searchresults.xhtml. Accessed July 2012.
USDA. 2009. Fire and Aviation Management Fiscal Year 2008 Accountability Report. United States Department of Agriculture, Forest Service. Washington, DC.
Vaux, H.J., Jr., Gardner, P.D., and Mills, T.J. 1984. Methods for assessing the impact of fire on forest recreation. USDA Forest Service GTR-PSW-79.
von Haefen, R.H. 2002. A complete characterization of the linear, log-linear, and semi-log incomplete demand system models. Journal of Agricultural and Resource Economics 27(2):281-319.