economics 390 the financial system
TRANSCRIPT
Economics 390The Financial System
(9/4/13)
Instructor: Prof. Menzie ChinnUW Madison
Fall 2013
Administrative Issues• Course website:
http://www.ssc.wisc.edu/~mchinn/web390_f13.html
• OH: M1-2, W4-5, 7418 Soc Sci• TA: Ed Zhong• Textbook: Blanchard/Johnston, Macro• Mishkin, Economics of Money, Banking and
Financial Markets; Hester, The Evolution of Monetary Policy and Banking in the US
Administrative Issues• Add’l Readings: IMF, Econbrowser• NYT, FT, WSJ, Economist• Grading: 20% 3×PS, 40% 1×MT, 40% paper• Dates:
- MT on 11/6- Paper due on Fri, 12/13
• Make-ups: None. Points are re-allocated if you have a legitimate excuse. No late assignments accepted (must be handed in during lecture)
Topic Areas• Review – IS/LM, AD/AS• The causes of the financial crisis• the efficacy of fiscal policy• conventional and unconventional monetary
policy at the zero lower bound• post balance sheet crisis recoveries• the global saving glut/global imbalances• determinants of sovereign debt crises• the euro area crisis.
The Global Financial Crisis

Risk

The “Disappearance” of Risk
Source: IMF, WEO update, 11/6/08

Household debt (I)
Source: BIS, Annual Report (2011)
50
60
70
80
90
100
110
120
2000 2001 2002 2003 2004 2005 2006 2007 2008
US
GreatBritain
Ireland
Spain
Household debtto GDP (BIS)
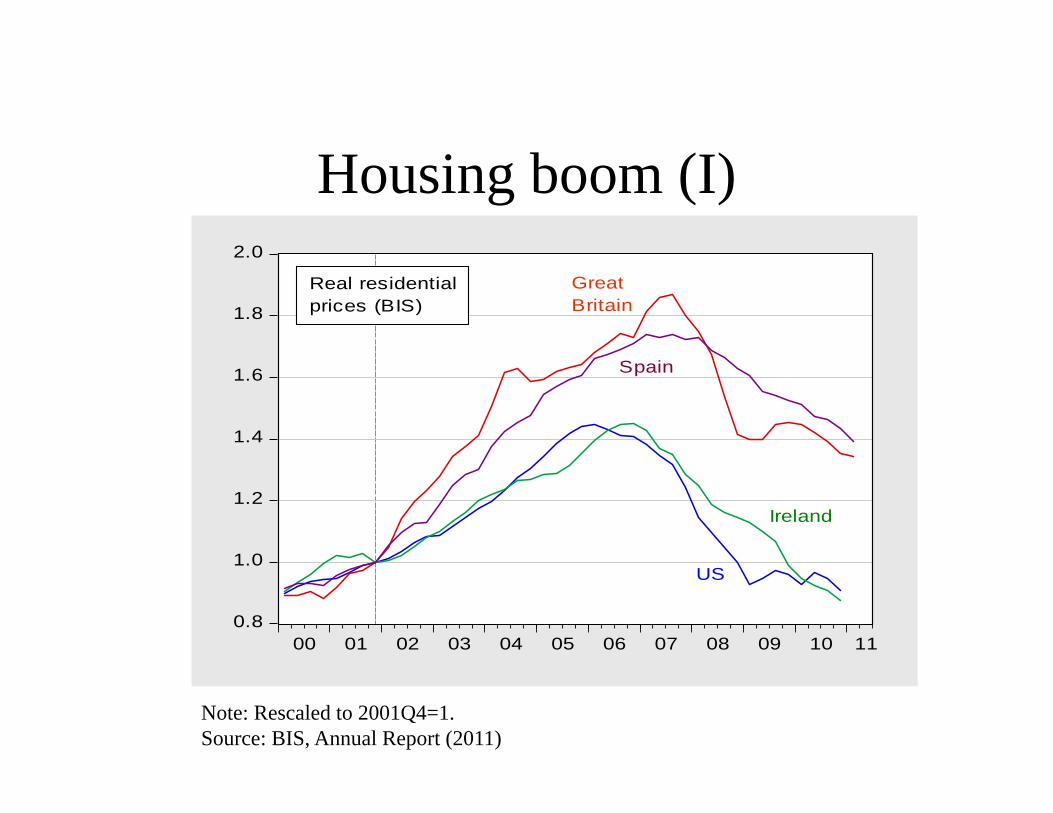
Housing boom (I)
0.8
1.0
1.2
1.4
1.6
1.8
2.0
00 01 02 03 04 05 06 07 08 09 10 11
US
GreatBritain
Ireland
Spain
Real residentialprices (BIS)
Note: Rescaled to 2001Q4=1. Source: BIS, Annual Report (2011)
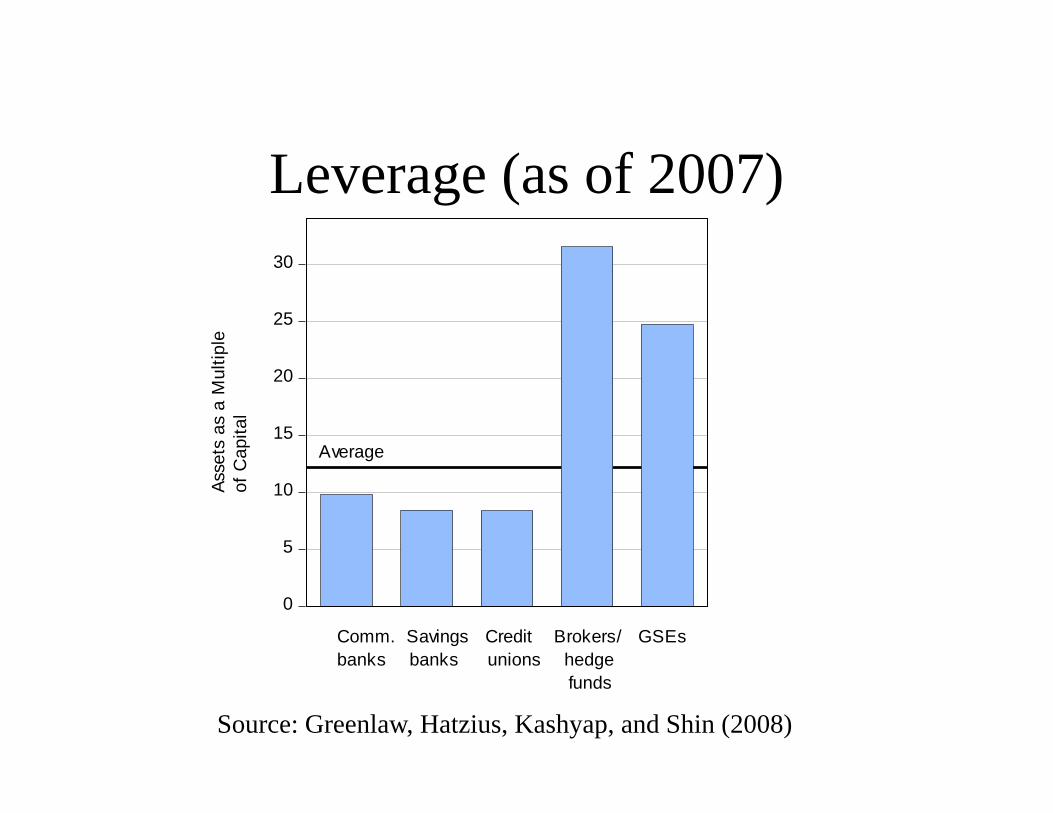
Leverage (as of 2007)
0
5
10
15
20
25
30
Comm. Savings Credit Brokers/ GSEsbanks banks unions hedge funds
Average
Asse
ts a
s a
Mul
tiple
of C
apita
l
Source: Greenlaw, Hatzius, Kashyap, and Shin (2008)

Boom and Bust in the Shadow Financial System
Source: Federal Reserve Board
Fiscal Policy Efficacy

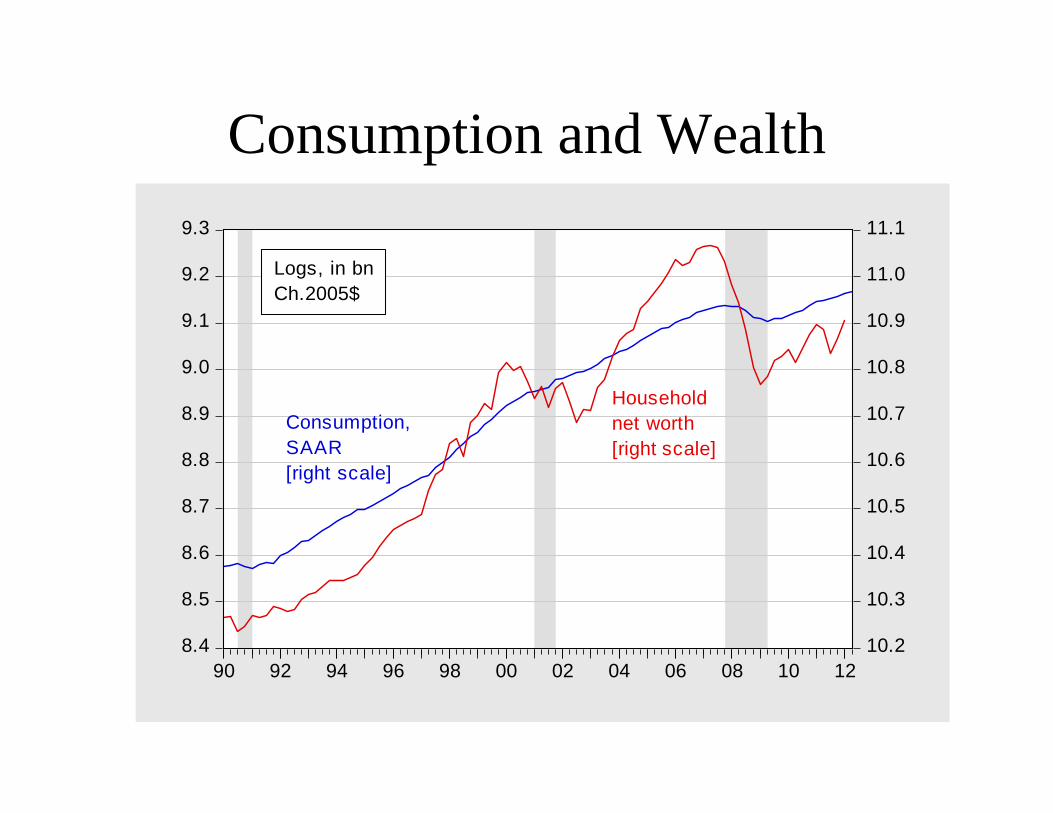
Consumption and Wealth
8.4
8.5
8.6
8.7
8.8
8.9
9.0
9.1
9.2
9.3
10.2
10.3
10.4
10.5
10.6
10.7
10.8
10.9
11.0
11.1
90 92 94 96 98 00 02 04 06 08 10 12
Consumption,SAAR[right scale]
Householdnet worth[right scale]
Logs, in bnCh.2005$

Conventional and Unconventional Monetary Policy

Conventional Monetary Policy
0
2
4
6
8
10
12
90 92 94 96 98 00 02 04 06 08 10 12
FedFunds
3 monthTreasurys
Ten yearconstantmaturity
Baacorporatebonds
8/29
Lehman
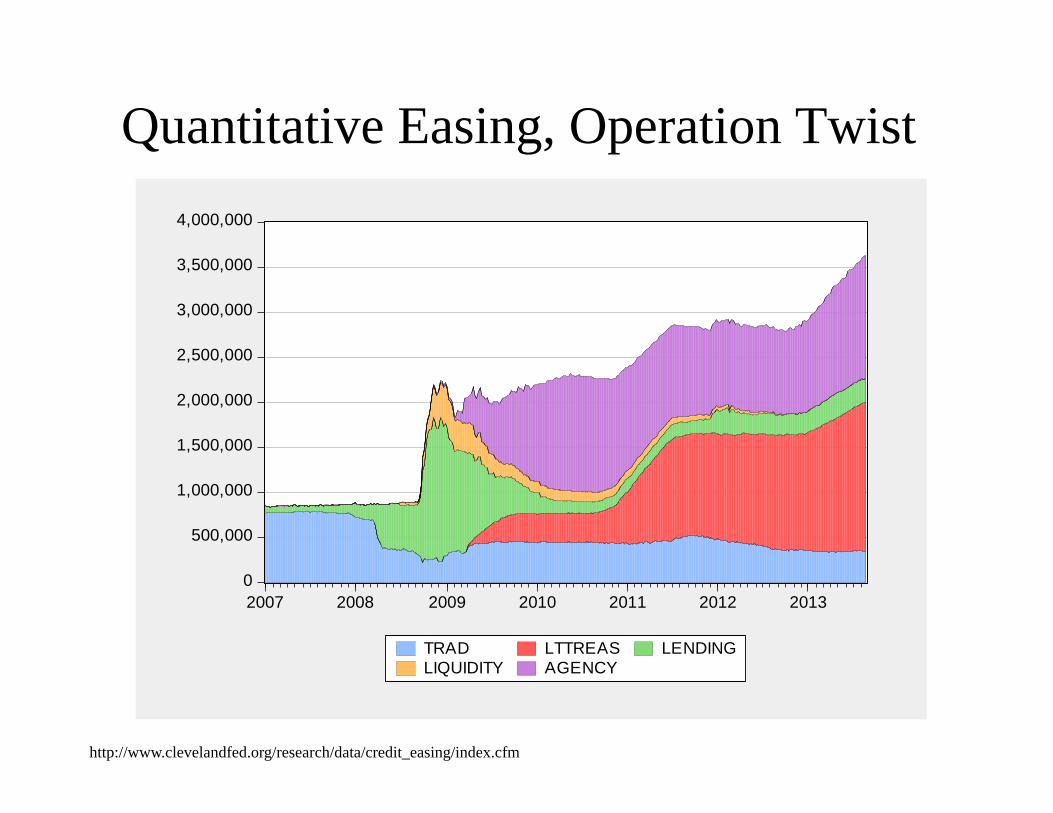
Quantitative Easing, Operation Twist
http://www.clevelandfed.org/research/data/credit_easing/index.cfm
0
500,000
1,000,000
1,500,000
2,000,000
2,500,000
3,000,000
3,500,000
4,000,000
2007 2008 2009 2010 2011 2012 2013
TRAD LTTREAS LENDINGLIQUIDITY AGENCY
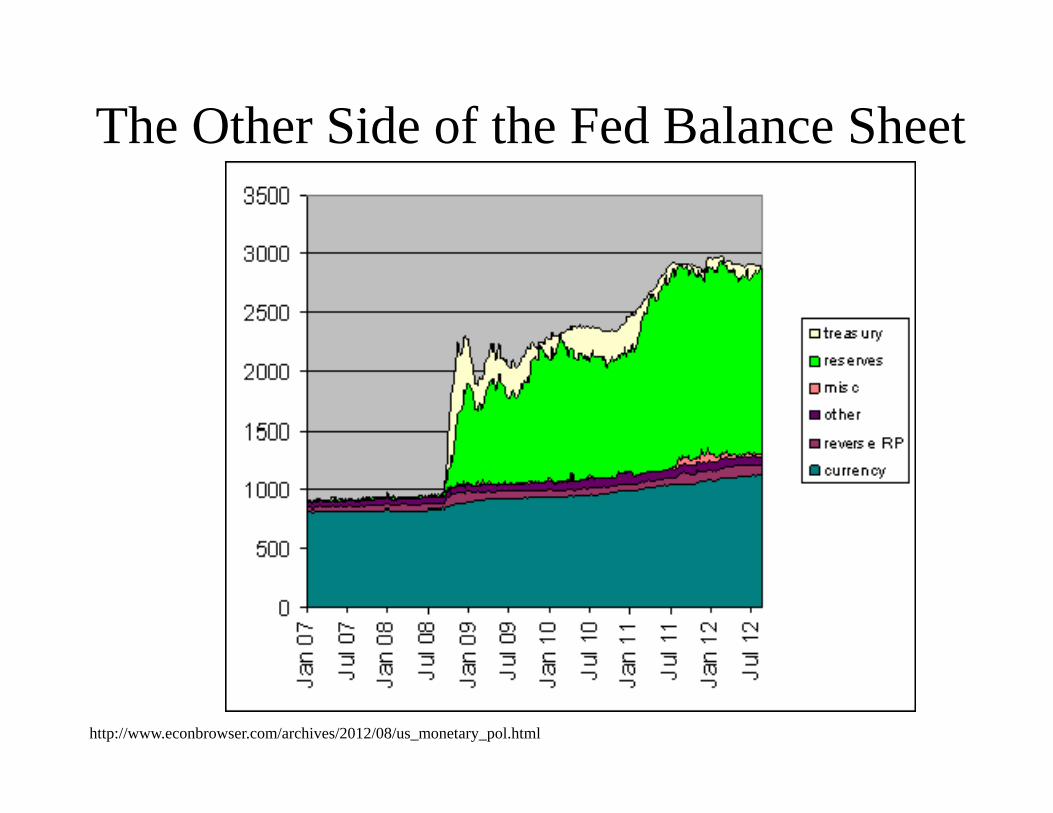
The Other Side of the Fed Balance Sheet
http://www.econbrowser.com/archives/2012/08/us_monetary_pol.html

Post-Balance-Sheet Recessions

GDP and Potential
14,000
14,400
14,800
15,200
15,600
16,000
16,400
16,800
2007 2008 2009 2010 2011 2012 2013
bn. Ch.2009$,SAAR
PotentialGDP
GDP
Source: BEA, 2013Q2 2nd release; CBO (Feb. 2013), adjusted.
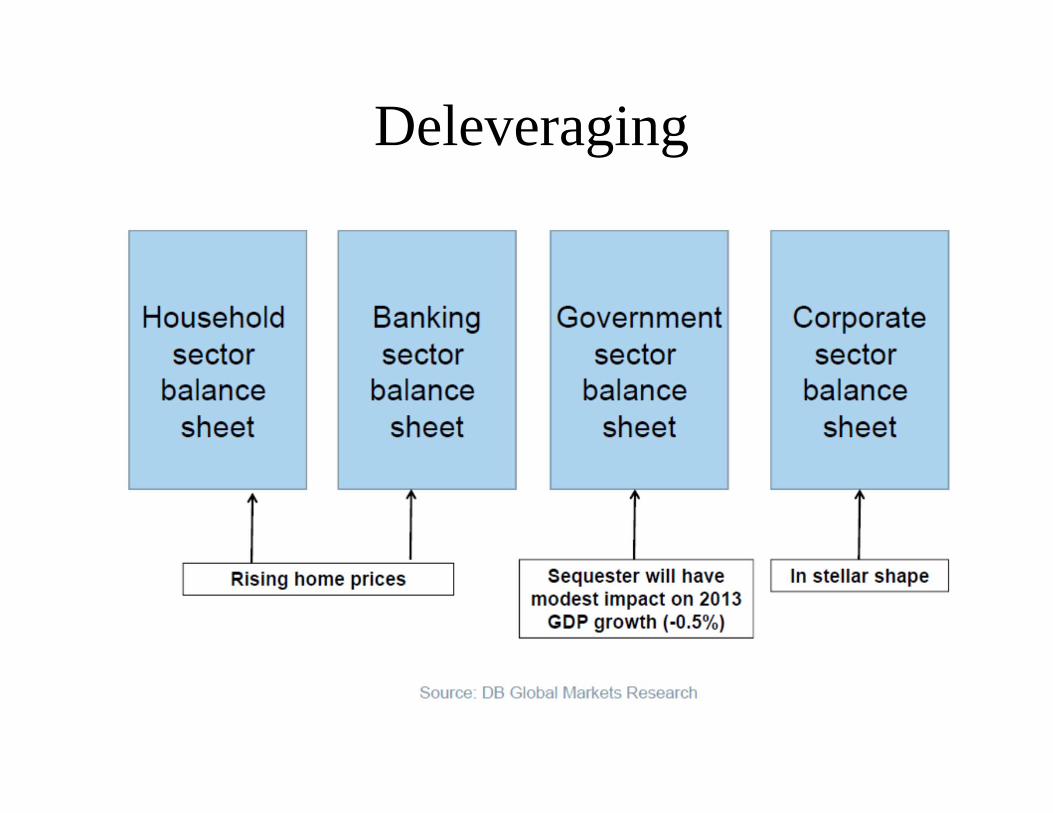
Deleveraging

Household Assets and Liabilities
0
10,000
20,000
30,000
40,000
50,000
60,000
70,000
80,000
90,000
90 92 94 96 98 00 02 04 06 08 10 12
Assets
Liabilities
Householdassets &liabliities, bn.$
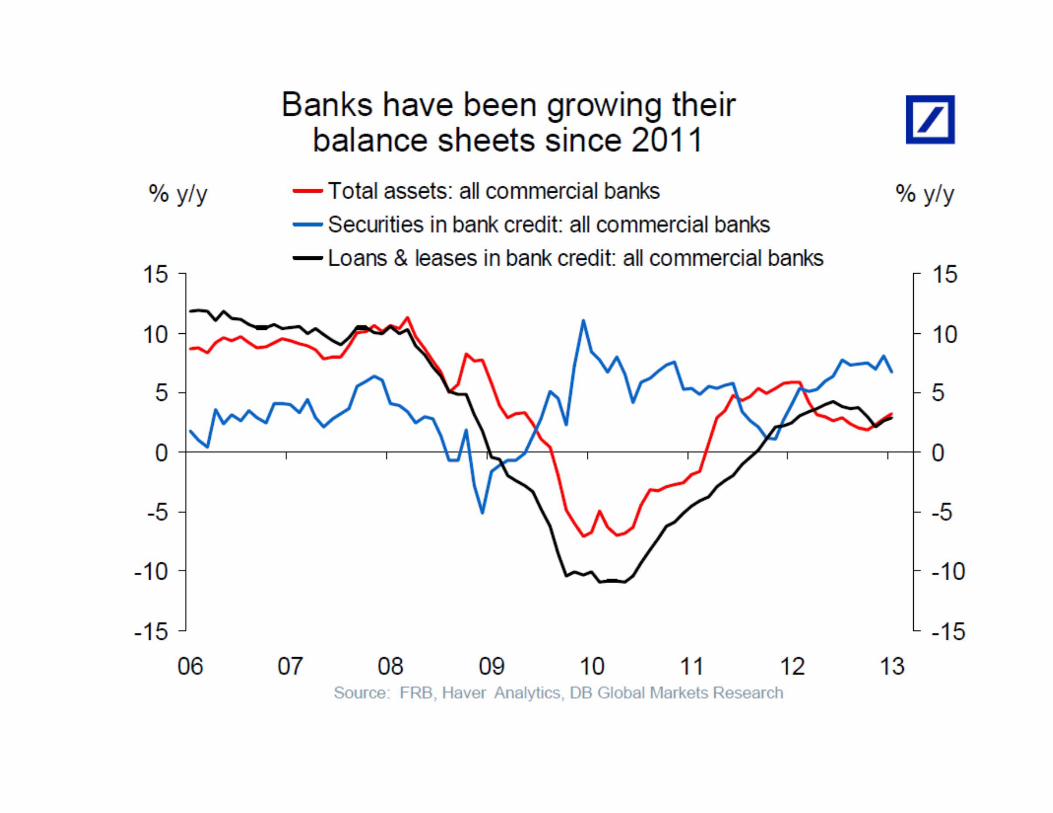

Credit Rationing

Global Saving Glut and Global Imbalances

Sovereign Debt Crises
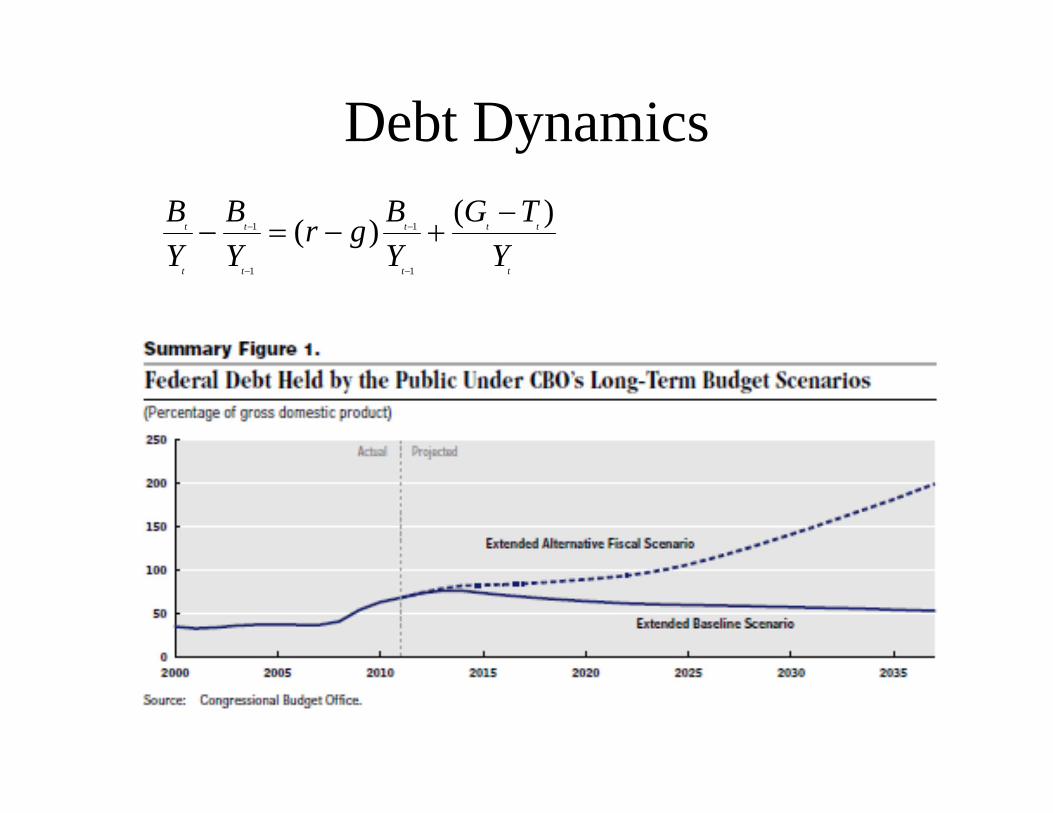
Debt Dynamics1 1
1 1
( )( )t t t t t
t t t t
B B B G Tr gY Y Y Y

The Euro Crisis
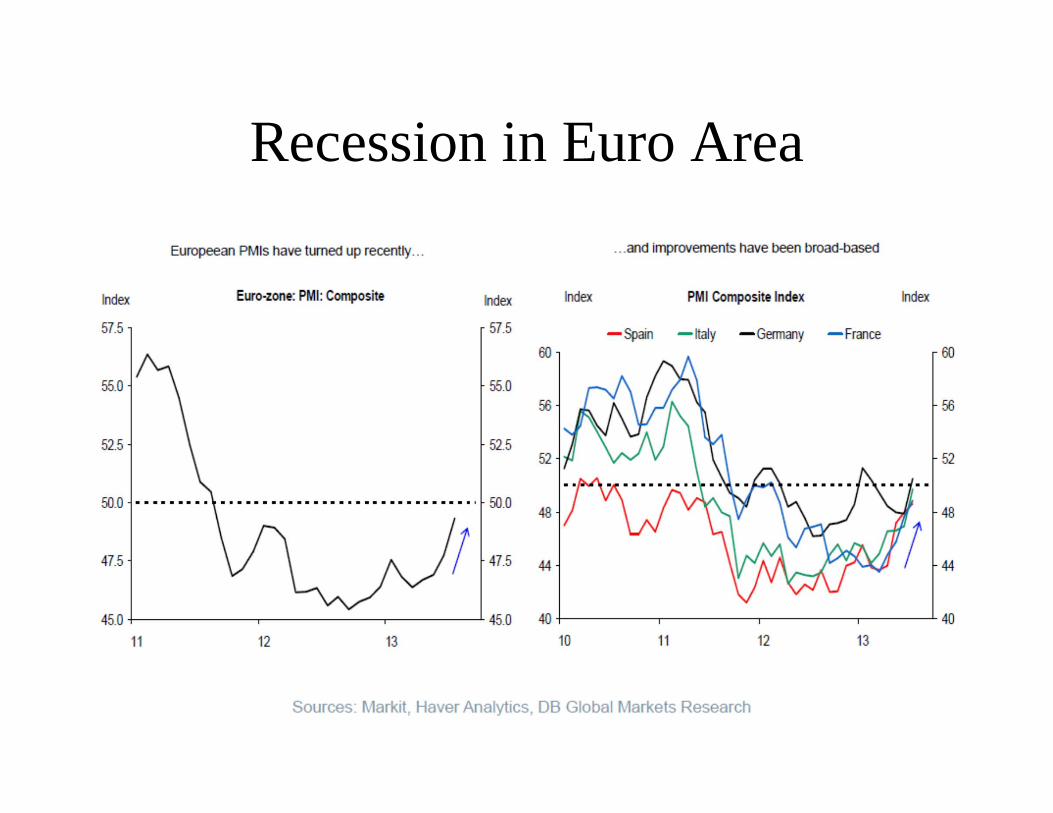
Recession in Euro Area

The Self-Reinforcing Crisis
Source: Shambaugh, “The Euro’s Three Crises,” BPEA Spring 2012.

Europe