economics 113 slides - grasping reality with both hands...
TRANSCRIPT
Economics113SlidesJ. Bradford Delong
http://bradford-delong.com [email protected]
@delong
2017-04-17 #AEH
key: https://www.icloud.com/keynote/0-fVlokcPJk1LVLcWLJAvGDhA pdf: pages: html:

Administra3on:NearTerm• 2017-04-17Mo:Lecture:OurSecondGildedAge|Review:BigIdeas
• 2017-04-19We:OfficeHours11-12Evans691A(506?)• 2017-04-19We:Exercise:SupplyandDemandforSkilledWorkers|
Lecture:OurPresentThroughaPolanyianLens• 2017-04-24Mo:OfficeHours3:30-4:30Evans691A(506?)• 2017-04-24Mo:Review:TheMakingofOurWorld|Lecture:
LookingForward|ProblemSet2due• 2017-04-26We:NOCLASS
• Thefinalexamforthiscoursewillbeon:Friday,May12,3-6PM

ThisWeek’sReadings• ThomasPike]yandEmmanuelSaez:IncomeInequalityintheUnited
Statesh]p://eml.berkeley.edu/~saez/pike]yqje.pdf;• ClaudiaGoldinandLarryKatz:Long-RunChangesintheU.S.Wage
Structure:Narrowing,Widening,Polarizingh]p://www.nber.org/papers/w13568;
• PaulKrugman:WhyWeAreinaNewGildedAgeh]p://www.nybooks.com/aricles/2014/05/08/thomas-pike]y-new-gilded-age/(h]p://delong.typepad.com/why-were-in-a-new-gilded-age-by-paul-krugman.pdf);
• RyanAvent:ThomasPike]y’s“Capital”,SummarisedinFourParagraphsh]p://www.economist.com/blogs/economist-explains/2014/05/economist-explains;
• Video:ThomasPike]y:NewThoughtsonCapitalintheTwenty-FirstCenturyh]ps://www.ted.com/talks/thomas_pike]y_new_thoughts_on_capital_in_the_twenty_first_century

Administra3on—Schedule• Apr19:OfficeHours11-12Evans691A(506?)• Apr19:Exercise:SupplyandDemandforSkilledWorkers|Lecture:Our
PresentThroughaPolanyianLens• Apr19:OfficeHours3:30-4:30Evans691A(506)
• Apr24:Review:TheMakingofOurWorld|Lecture:LookingForward|ProblemSet2due
• Apr26:NOCLASS• Apr28:ExtraOfficeHours?• May1:ExtraofficeHours?• May1:ShortEssayDue|MockExamReview• May5:ExtraOfficeHours?• May5:FinalSynthesizingLecture• May12:FinalExam:Econ113,ExamGroup19,May12,3-6pm
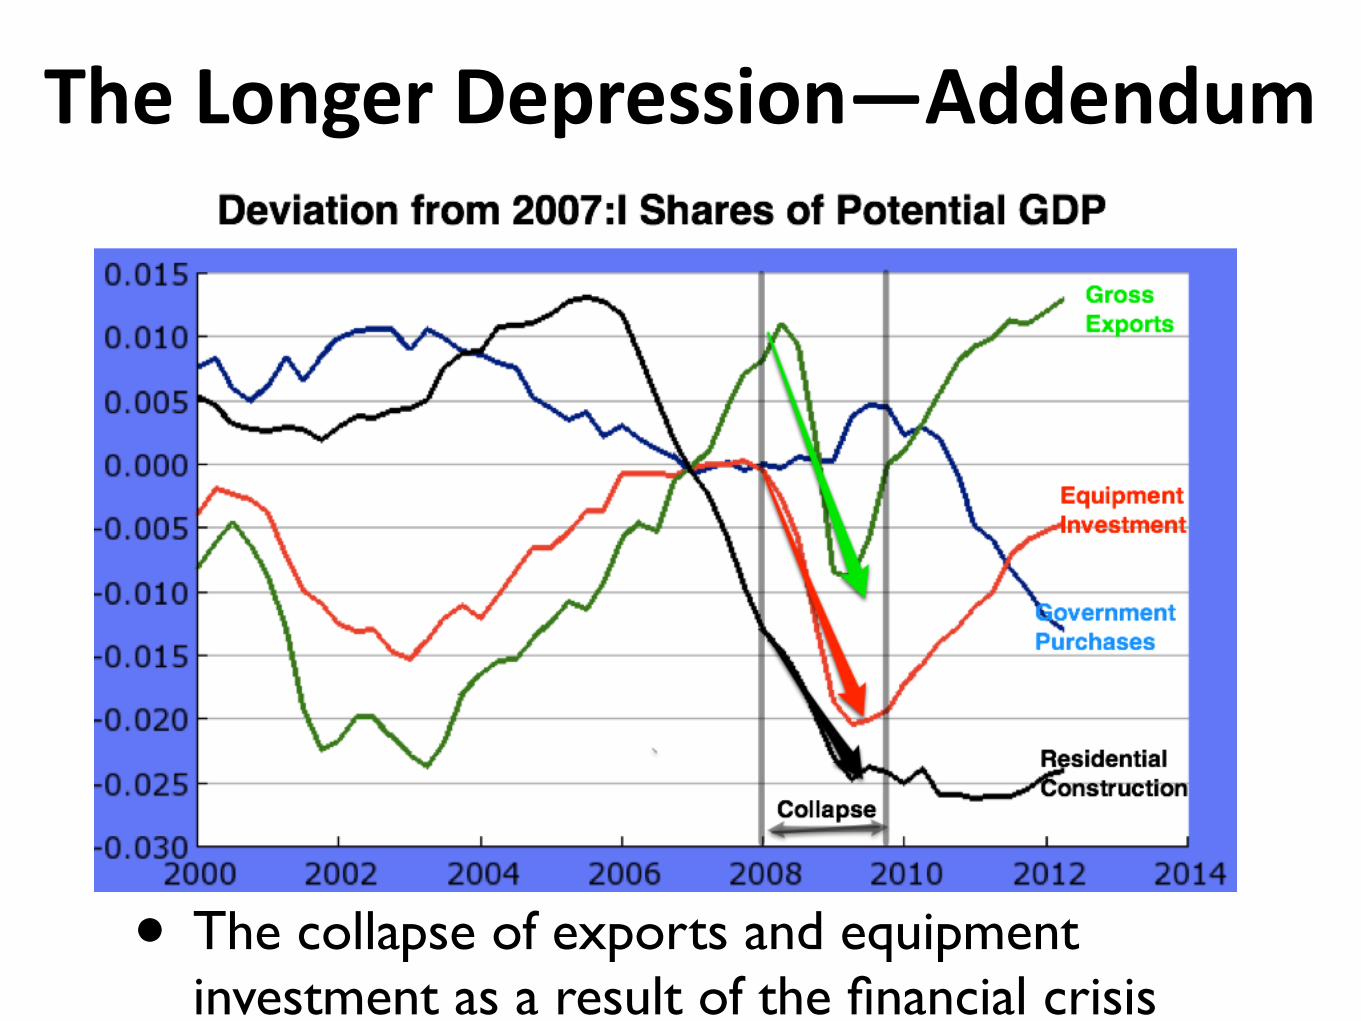
TheLongerDepression—Addendum
• The collapse of exports and equipment investment as a result of the financial crisis
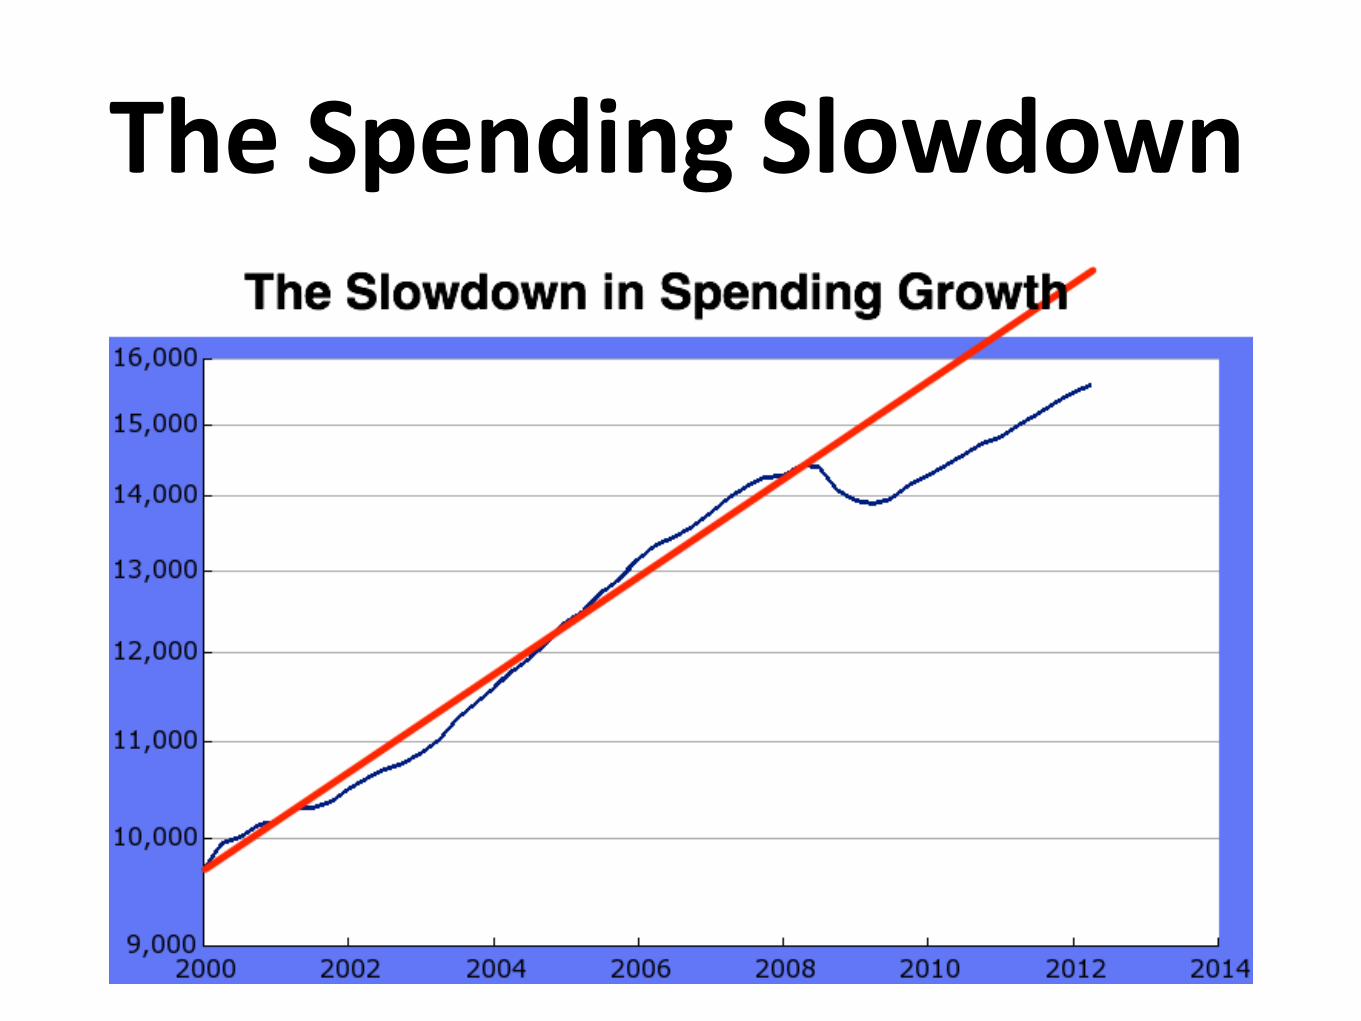
TheSpendingSlowdown

TheLongShort-Run:
• Depressed housing and fiscal austerity

TheWe-Don’t-Do-Our-HomeworkCaucus
• Robert Lucas:
• Christina Romer--here's what I think happened. It's her first day on the job and somebody says, you've got to come up with a solution to this--in defense of this fiscal stimulus, which no one told her what it was going to be, and have it by Monday morning.... [I]t's a very naked rationalization for policies that were already, you know, decided on for other reasons…. If we do build the bridge by taking tax money away from somebody else, and using that to pay the bridge builder--the guys who work on the bridge -- then it's just a wash... there's nothing to apply a multiplier to. (Laughs.) You apply a multiplier to the bridge builders, then you've got to apply the same multiplier with a minus sign to the people you taxed to build the bridge. And then taxing them later isn't going to help, we know that...
• John Cochrane:
• If the government borrows a dollar from you, that is a dollar that you do not spend, or that you do not lend to a company to spend on new investment. Every dollar of increased government spending must correspond to one less dollar of private spending. Jobs created by stimulus spending are offset by jobs lost from the decline in private spending. We can build roads instead of factories, but fiscal stimulus can’t help us to build more of both. This is just accounting, and does not need a complex argument about “crowding out”...

ReasonsNottoDotheObviousThing
• Focus on the terms inside the red oval • Put Y, E on the horizontal axis, and r on the
vertical axis • Use the fact that r is equal to i (controlled by
the Federal Reserve) plus a “spread”

StageI:MonetaryPolicyCanDotheJob
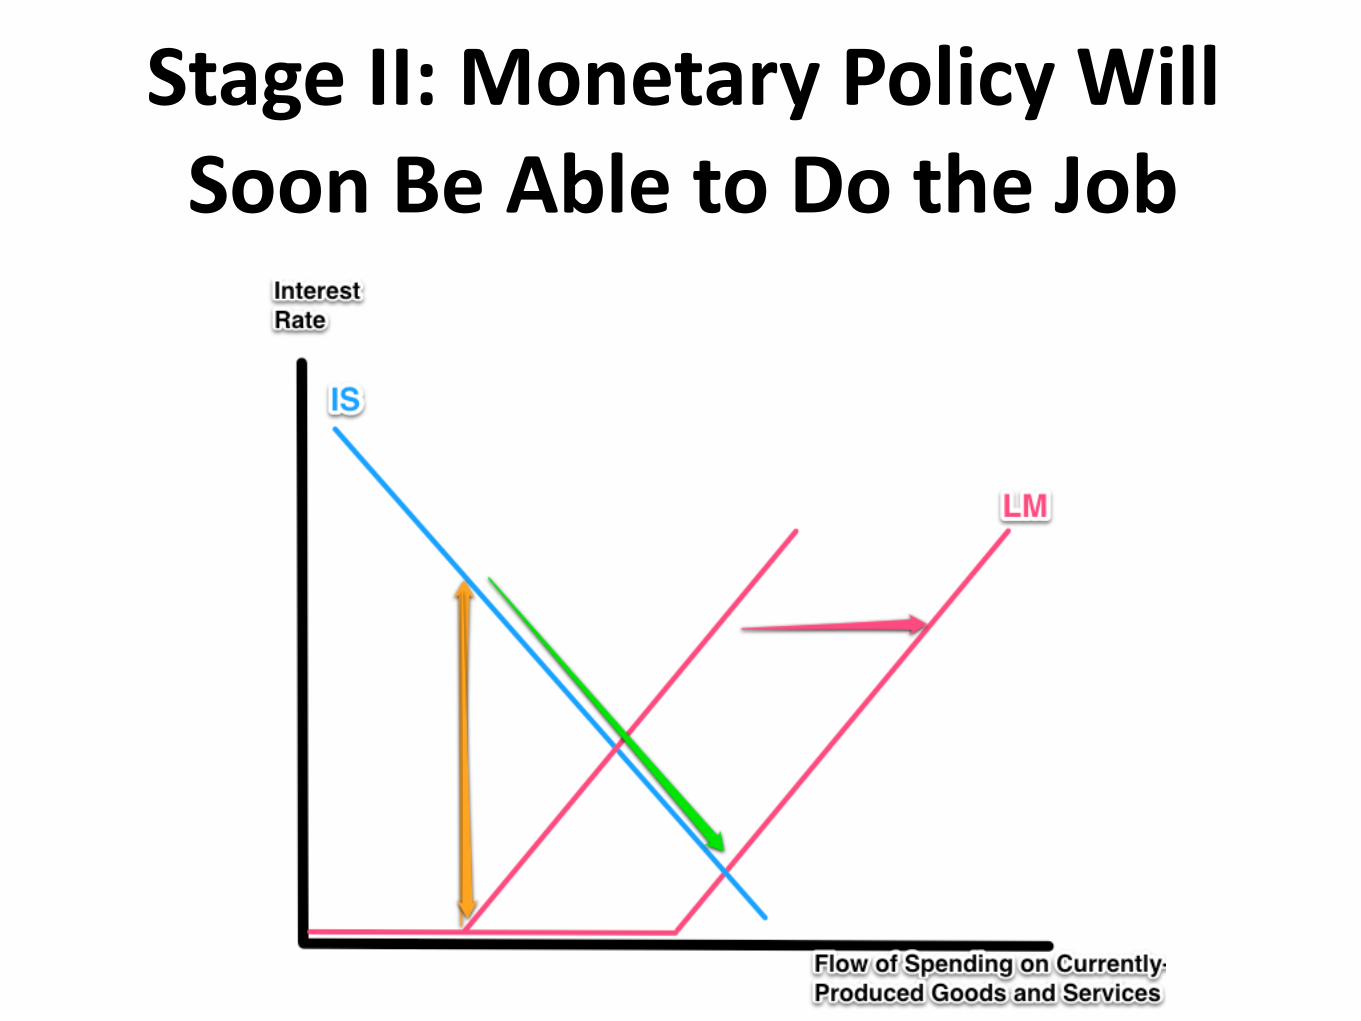
StageII:MonetaryPolicyWillSoonBeAbletoDotheJob

StageIII:TheFederalReserveWillHavetoFightInfla3on

StageIV:SummoningtheConfidenceFairy:CuVngtheDeficitIstheReal
ExpansionaryPolicy

StageV:It’s“Uncertainty”—ButtheStockMarket,andtheCross-State
Pa[ern
FRBSF Economic Letter 2013-04 February 11, 2013
3
�
Does the NFIB survey evidence support this argument? In Figure 2, we show state-level correlations between 2006 household debt-to-income ratios and changes in the percentage of businesses citing poor sales as their top concern from 2007 to 2009. The percentage of businesses citing poor sales increased more in high-household-leverage states, precisely where the largest spending and employment declines in the nontradable sector occurred. This is consistent with the household spending evidence in Mian, Rao, and Sufi (2012). To extend this analysis, we performed a regression, a statistical test of the relationship between state-level job losses in the nontradable sector from 2007 to 2009 and the percentage of businesses in that state citing poor sales. The test showed a significant negative correlation. In other words, states in which businesses cited poor sales also registered disproportionately sharp drops in jobs and household spending. This supports the view that a drop in aggregate demand led to job losses during the recession.
Regulation and taxes: State-level evidence Figure 1 confirms the pattern in Baker, Bloom, and Davis (2013) that small business concerns about regulation and taxes rose after the Great Recession and remained elevated in 2012. Can this explain the job market’s current weak performance? The state-level NFIB survey responses may help answer this question. We focus on the rise from 2008 to 2011 in the percentage of businesses citing regulation or taxes as their primary problem, the period when this concern increased the most. The increase varied significantly from state to state. For example, Rhode Island saw a rise of over 30 percentage points, while New Jersey saw a decrease of almost 10 percentage points. Figure 3 shows there was almost no correlation between job growth in a state from 2008 to 2011 and the increase in the percentage of businesses citing regulation and taxes as their primary concern. In fact, if anything, the correlation is positive.
Figure 2 Household debt ratio and poor sales correlation
Figure 3 Policy uncertainty and job growth correlation
AL
AK
AZ
AR
CA
CO
CTDE
FL
GA
HI
ID
IL
IN
IA
KS KYLA
MEMD
MA
MI
MN
MSMO
MT
NE
NV
NH
NJNM
NY
NC
ND
OH
OK
OR
PA
RI
SC
SD
TNTX
UT
VT
VA
WA
WVWI
WY
5
10
15
20
25
30
1.0 1.5 2.0 2.5 3.0 3.52006 household debt-to-income ratio
% c
hange in b
usin
esses c
itin
g p
oor
sale
s a
s t
op c
oncern,
2007-09
AL
AK
AZARCACO
CTDE
FL
GA
HI
IDIL
IN
IA
KS
KYLAME
MDMA MI MNMSMO
MTNE
NV
NH
NJ
NM
NY
NC
ND
OHOK
OR
PA
RISC
SD
TN
TX
UT
VTVAWA WV
WI WY
-15
-10
-5
0
5
10
-10 0 10 20 30% change in businesses citing regulation and taxes
as top concern, 2008-11
%change in e
mplo
ym
ent,
2008-11
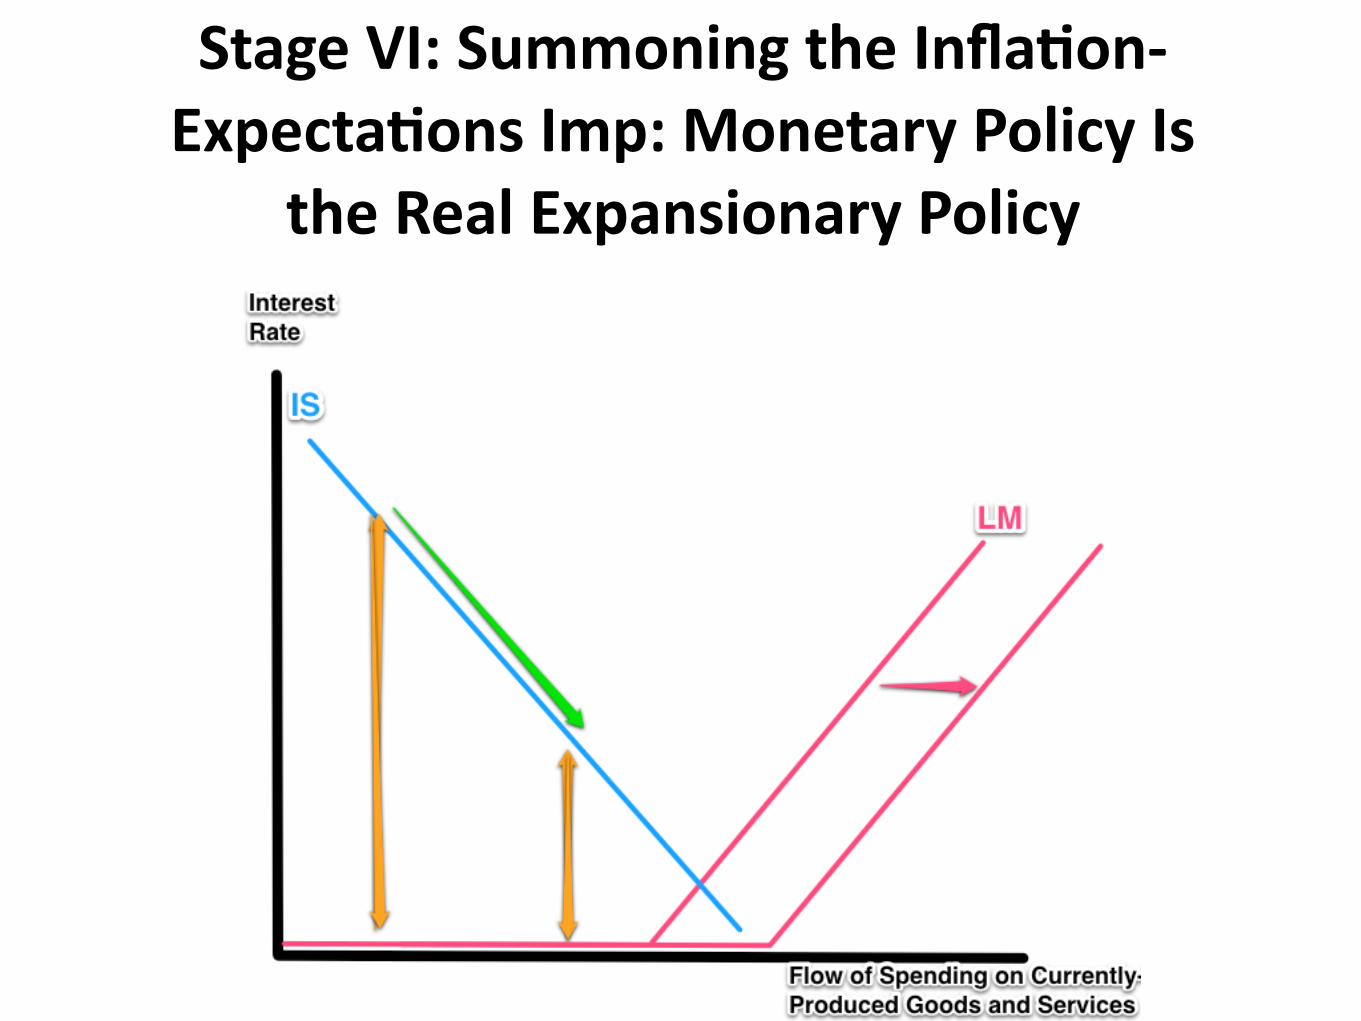
StageVI:SummoningtheInfla3on-Expecta3onsImp:MonetaryPolicyIs
theRealExpansionaryPolicy

StageVII:Mul3pliersAretooSmalltoBotherwith--ButtheCross-European
Pa[ern

StageVIII:NeverMindWhy,CostsofDebtAccumula3onAreVeryHigh

AreWeBackto“Normal”?NotReally
• Interestratesaresillremarkably,insanely,absurdlylow…
• WhatwilltheFederalReservedoifitnextfindstheeconomyina“generalglut”?
• Sincelate2014“austerity”hasbeenonholdintheU.S.
• Butnouilizaionofamplefiscalspace
• Theideaof“secularstagnaion”…
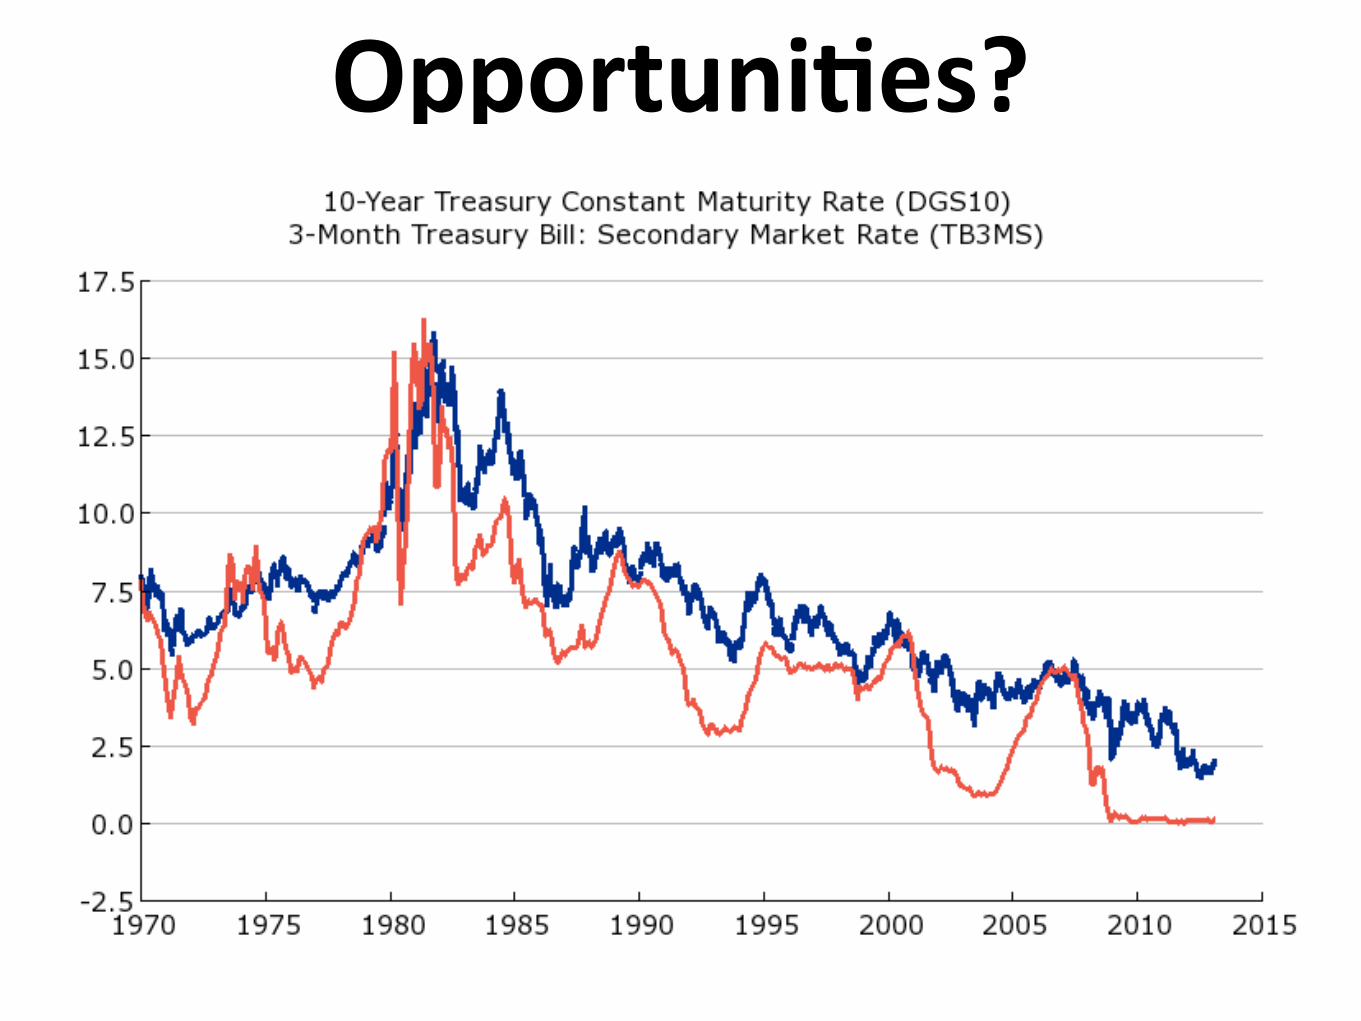
Opportuni3es?

CatchOurBreath…• Comments? • Questions?

TheSecondGildedAge:TheTenth
• The “tenth” are not a constant group: a quarter of people will spend at least two years in the top tenth…

DividingtheTenth
• Nevertheless, the rest of us used to pay 10% of income for being bossed around by and benefiting from the skills of the top 1%. Now it is 20%…

TheOverclass
• And the top 0.01%? We pay 5x as great a share of income now as in the 1970s for whatever they do. 15K households. $750B/year. $60M/year each…

RoughNumbers:OverPast40Years
• Average income 1 • Top tenth: 3.3 —> 5 • Top 1%: 8 —> 22 • Top 0.01%: 100 —> 500
• 15,000 households • 3,000 households in GSF…
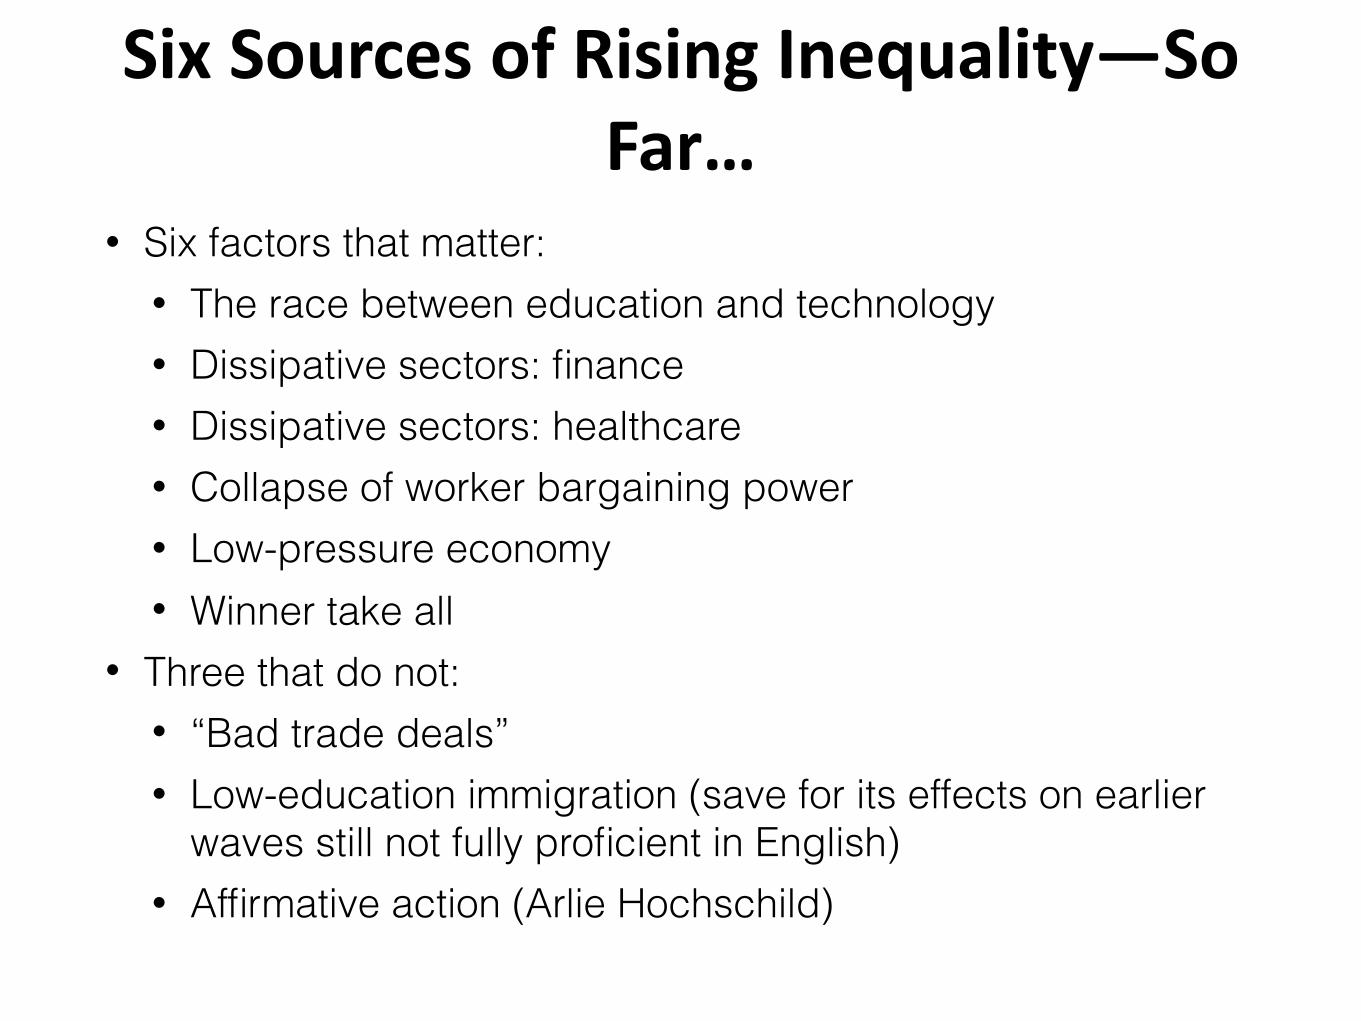
SixSourcesofRisingInequality—SoFar…
• Six factors that matter: • The race between education and technology • Dissipative sectors: finance • Dissipative sectors: healthcare • Collapse of worker bargaining power • Low-pressure economy • Winner take all
• Three that do not: • “Bad trade deals” • Low-education immigration (save for its effects on earlier
waves still not fully proficient in English) • Affirmative action (Arlie Hochschild)

SourcesofRisingInequalityI:TheRaceBetweenEduca3onandTechnology
• America began charging for (public) colleges in the 1970s
• Initially a good-government move—college graduates were going to be rich, and making them pay seemed a progressive reform that took pressure off of state budgets
• But as college became expensive, lots of people who ought to have gone to college didn’t
• We lost the race between education and technology
• And thus income inequality in the form of the college-high school wage premium leaped upward
• This could be fixed—over generations

SourcesofRisingInequalityII:Dissipa3veSectors:Finance
• The rise of superincomes in finance
• And in the related corporate over-structure paid as if they were financiers
• This is a great puzzle: • People pay financiers
voluntarily • Finance is much more
competitive than in the 1960s
• Finance much more steeply peaked than it was in the 1960s

SourcesofRisingInequalityIII:Dissipa3veSectors:HealthCare
• U.S. health care financing becomes dysfunctional starting with the Reagan administration
• Failed 1993 HilaryCare effort blocked by Republicans
• We will see what ObamaCare does
• Elsewhere in the world, doctors are well-paid—not superpaid..

SourcesofRisingInequalityIV:CollapseofWorkerBargainingPower
• The war against the union movement
• “Monopoly” and “voice” face of the union movement
• Strong monopsony employer element
• Deunionization a significant negative for productivity
• A transfer away from workers • Why the collapse of
bargaining power? • Globalization? • Or politics?

SourcesofRisingInequalityV:Low-PressureEconomy

SourcesofRisingInequalityVI:WinnerTakeAll
• Kodak vs. Google • Rochester vs. Mountain
View • Middle-class prosperity
for a region fueled by a critical mass of well-paying engineering and technical jobs
• Winner-take-all billionaires and hundred millionaires…

HowMuchDifferenceDoesItMake?
• The coming of Gilded Age II coincided with the productivity slowdown, and has produced wage and income stagnation for others…
• But remember: social equality—minorities and women
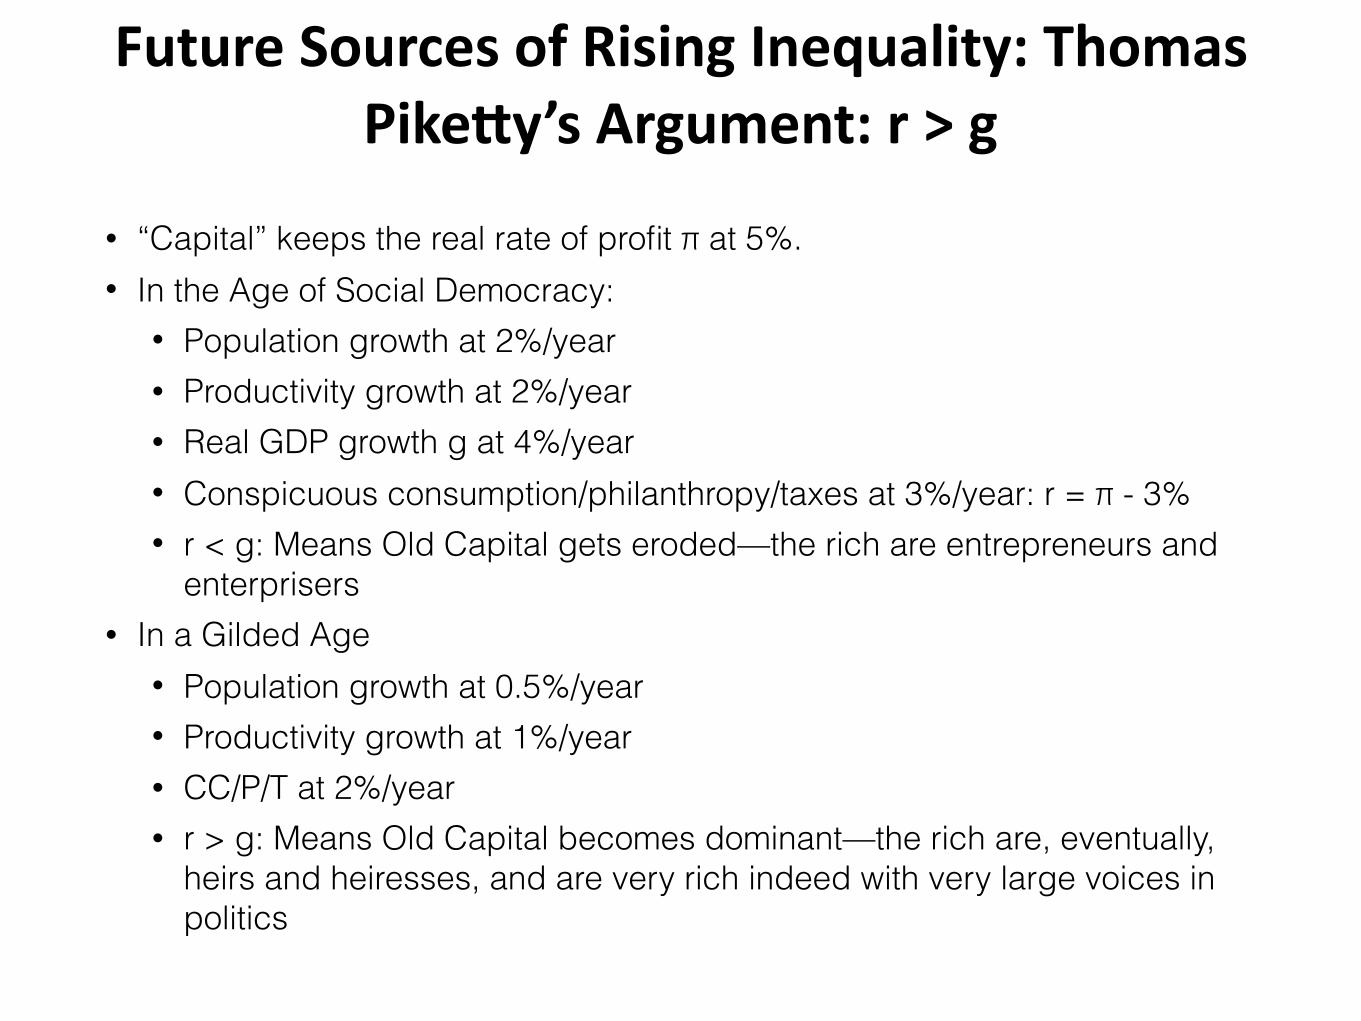
FutureSourcesofRisingInequality:ThomasPike[y’sArgument:r>g
• “Capital” keeps the real rate of profit π at 5%. • In the Age of Social Democracy:
• Population growth at 2%/year • Productivity growth at 2%/year • Real GDP growth g at 4%/year • Conspicuous consumption/philanthropy/taxes at 3%/year: r = π - 3% • r < g: Means Old Capital gets eroded—the rich are entrepreneurs and
enterprisers • In a Gilded Age
• Population growth at 0.5%/year • Productivity growth at 1%/year • CC/P/T at 2%/year • r > g: Means Old Capital becomes dominant—the rich are, eventually,
heirs and heiresses, and are very rich indeed with very large voices in politics
Cri3cismsofPike[y’sArgument• Can “capital” keep the real rate of return at 5%?
• You would think that more capital would compete with itself for the services of workers to operate it, and so the rate of profit would fall…
• What Keynes called “the euthanasia of the rentier” • More a story about Europe than about America
• Europe is the place with ZPG • Europe is the place with less dynamic growth and less creative
destruction • America’s rich are overwhelmingly entrepreneurs and
superincome earners—not (or at least not yet) heirs and heiresses (but Waltons, Kochs, Trump) • Why are they paid so well? • Is a switch about to be flicked?

InequalityandGrowth:Big-PictureEvidence?
• There is basically no pattern—either in the United States or elsewhere • Growth was fastest in the 1940s, 50s, and 60s in which
income inequality was low • Growth was lowest in the 1970s (low), 1980s (low but
rising), and 2000s (high) • Growth had a recovery in the 1990s (moderate but rising) • Growth was fast in the 1920s (high) • But the 1930s were a disaster…
• Think that redistributing income either way is going to unleash growth, and you are mistaken
• In which case why not do the utilitarian thing?

ExceptfortheExperienceofCommunism…
• High Stalinist central planning • Marx’s suspicion of markets as
surplus-extraction devices • Hence, the communists said,
we won’t have any • We will reproduce the
Rathenau-Ludendorff World War I Imperial German war economy
• Communes, economies of scale, GOSPLAN, etc.
• Effect: you throw away a five-fold amplification of productivity by eschewing the market

WhatShouldWeAimFor?1. Wealth: Politics decides on distribution, and then business of
economists to maximize production—boost average incomes… 2. Utility: inequalities “justified” when they lead to a positive
average percentage change in incomes… 3. Rawlsian: inequalities “justified” only when they lead to a better
life for the worst off… 4. Moral Worth; Inequalities justified when they reward the
“worthy”… • Polanyian Perplex
5. Uplift: Inequalities justified when they allow for philosophy… 6. Just Deserts: Inequalities justified when they are the result of a
fair system… • Polanyian Perplex

ButWhatIsThis“Fair”?• In the opening of Plato’s Republic:
• Sokrates: "Well said, Kephalos; but as concerning justice, what is it?"
• Kephalos: "To speak the truth and to pay your debts.”
• The whole point of the opening of Plato’s Republic is that acting fairly—not cheating or stealing from people—does not by itself justice make. • But it is an essential part: people
need to believe that they are neither cheaters nor cheated…

CatchOurBreath…• Comments? • Questions?

ThisWeek’sReadings• ThomasPike]yandEmmanuelSaez:IncomeInequalityintheUnited
Statesh]p://eml.berkeley.edu/~saez/pike]yqje.pdf• ClaudiaGoldinandLarryKatz:Long-RunChangesintheU.S.Wage
Structure:Narrowing,Widening,Polarizingh]p://www.nber.org/papers/w13568
• PaulKrugman:WhyWeAreinaNewGildedAgeh]p://www.nybooks.com/aricles/2014/05/08/thomas-pike]y-new-gilded-age/
• RyanAvent:ThomasPike]y’s“Capital”,SummarisedinFourParagraphsh]p://www.economist.com/blogs/economist-explains/2014/05/economist-explains
• ThomasPike]y:NewThoughtsonCapitalintheTwenty-FirstCenturyh]ps://www.ted.com/talks/thomas_pike]y_new_thoughts_on_capital_in_the_twenty_first_century