economic winter v61 i1 gold versus silver
TRANSCRIPT
8/12/2019 Economic Winter V61 I1 Gold Versus Silver
http://slidepdf.com/reader/full/economic-winter-v61-i1-gold-versus-silver 1/14
Volume 61 Issue 1 . June 17, 2014
E C O N O M I C W I N T E R
T H E L O N G W A V E E C O N O M I C A N D F I N A N C I A L C Y C L E
Gold
versus
Silver
Most commentators that I read are more bullish on silver than gold.
Not me, I am in the minority camp being far more bullish on gold
than I am on silver. Now, let me tell you why I feel this way.
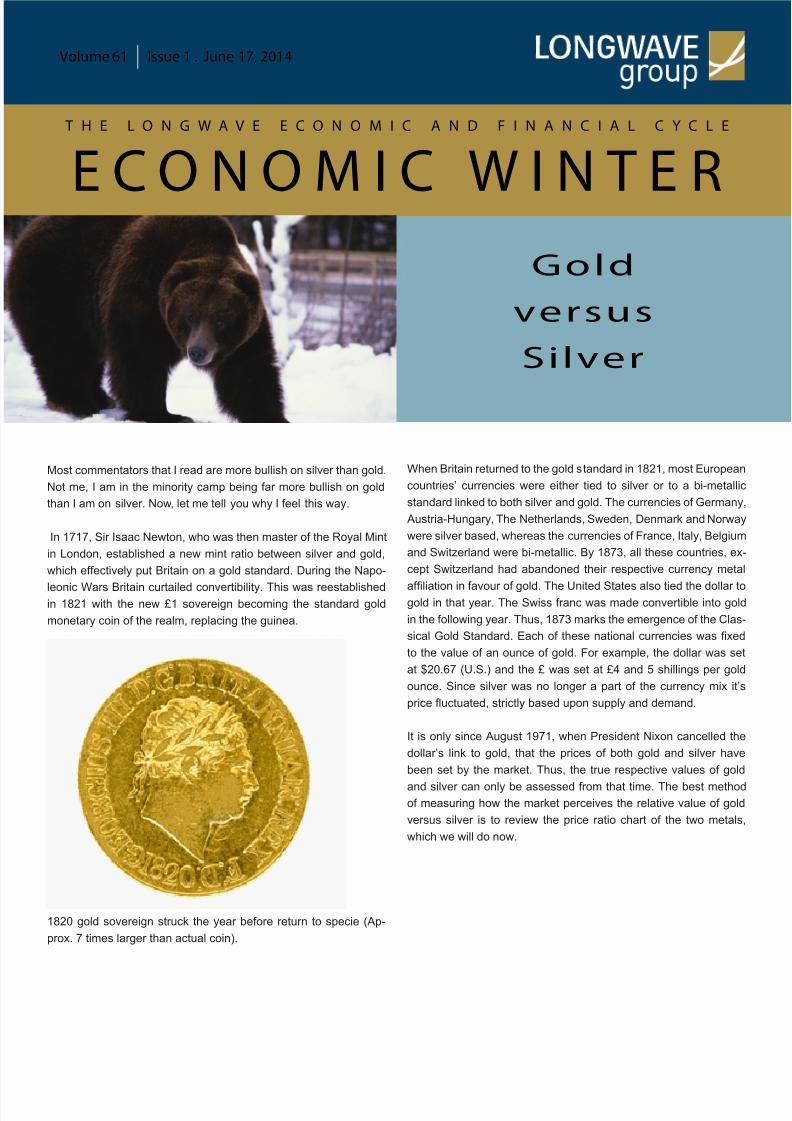
In 1717, Sir Isaac Newton, who was then master of the Royal Mint
in London, established a new mint ratio between silver and gold,
which effectively put Britain on a gold standard. During the Napo-
leonic Wars Britain curtailed convertibility. This was reestablishedin 1821 with the new £1 sovereign becoming the standard gold
monetary coin of the realm, replacing the guinea.
1820 gold sovereign struck the year before return to specie (Ap-
prox. 7 times larger than actual coin).
When Britain returned to the gold standard in 1821, most European
countries’ currencies were either tied to silver or to a bi-metallic
standard linked to both silver and gold. The currencies of Germany
Austria-Hungary, The Netherlands, Sweden, Denmark and Norway
were silver based, whereas the currencies of France, Italy, Belgium
and Switzerland were bi-metallic. By 1873, all these countries, ex
cept Switzerland had abandoned their respective currency meta
afliation in favour of gold. The United States also tied the dollar togold in that year. The Swiss franc was made convertible into gold
in the following year. Thus, 1873 marks the emergence of the Clas
sical Gold Standard. Each of these national currencies was xed
to the value of an ounce of gold. For example, the dollar was se
at $20.67 (U.S.) and the £ was set at £4 and 5 shillings per gold
ounce. Since silver was no longer a part of the currency mix it’s
price uctuated, strictly based upon supply and demand.
It is only since August 1971, when President Nixon cancelled the
dollar’s link to gold, that the prices of both gold and silver have
been set by the market. Thus, the true respective values of gold
and silver can only be assessed from that time. The best methodof measuring how the market perceives the relative value of gold
versus silver is to review the price ratio chart of the two metals
which we will do now.
8/12/2019 Economic Winter V61 I1 Gold Versus Silver
http://slidepdf.com/reader/full/economic-winter-v61-i1-gold-versus-silver 2/14
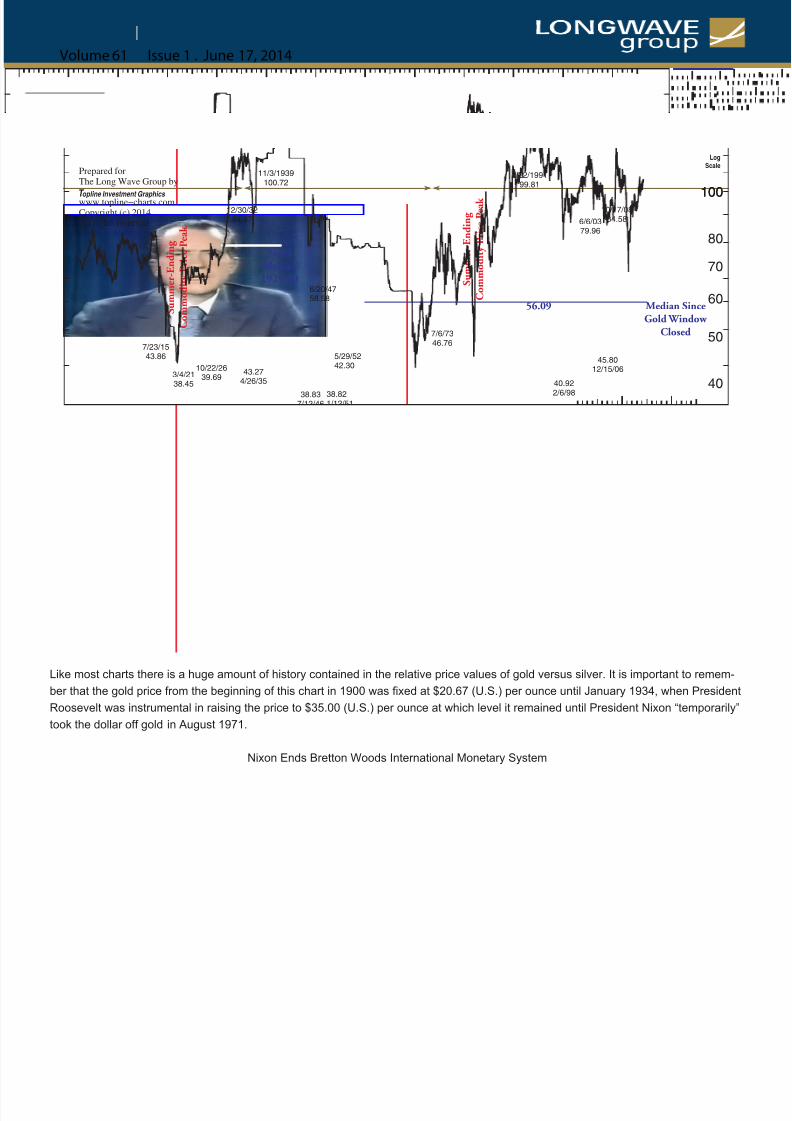
Like most charts there is a huge amount of history contained in the relative price values of gold versus silver. It is important to remem-
ber that the gold price from the beginning of this chart in 1900 was xed at $20.67 (U.S.) per ounce until January 1934, when President
Roosevelt was instrumental in raising the price to $35.00 (U.S.) per ounce at which level it remained until President Nixon “temporarily”
took the dollar off gold in August 1971.
Nixon Ends Bretton Woods International Monetary System
Volume 61 Issue 1 . June 17, 2014
6/20/47
58.58
38.83
7/12/46
38.821/12/51
5/29/52
42.30
$20.67 Fixed Gold Price $35 Official Gold Price US$ Gold Price Set By Market
S u m m e r - E n d i n g
C o m m o d i t y P r i c e P e a k
S u m m e r - E n d i n g
C o m m o d i t y P r i c e P e a k
Median SinceGold Window
Closed
56.09
76.92Median1929-40
1900 10 20 30 40 1950 60 70 80 90 2000 10 20
15
20
25
30
40
50
60
70
80
100100
LogScale
5/2/1465.47
Gold / Silver (weekly)
Prepared forThe Long Wave Group by
T opline Investment Graphics www.topline−charts.comCopyright (c) 2014All rights reserved
15.291/30/1920 14.72
3/14/1968
11/3/1939
100.722/22/1991
99.81
31.63
4/29/11
10/17/08
84.58
40.92
2/6/98
16.15
1/4/80
7/6/73
46.767/23/15
43.86
28.46
9/4/25
3/4/21
38.45
12/30/32
84.47
43.27
4/26/35
10/22/26
39.69
33.10
5/25/28
6/6/03
79.96
45.80
12/15/06

8/12/2019 Economic Winter V61 I1 Gold Versus Silver
http://slidepdf.com/reader/full/economic-winter-v61-i1-gold-versus-silver 3/14
The price charts for silver and gold from 1890 are shown below, so that you can see the price relationship between the two metals and
how these prices are reected in the gold/silver price ratio.
Volume 61 Issue 1 . June 17, 2014
90 1900 10 20 30 40 1950 60 70 80 90 2000 10 20
20
50
100
200
500
1000
2000
LogScale
5/30/141251
Gold (in US$)
Prepared forThe Long Wave Group by
T opline Investment Graphics www.topline−charts.comCopyright (c) 2014All rights reserved
9/2/2011
1875
21
1/3/1890
1/18/80
835
12/23/74
193
5/2/69
44
12/11/87
494
1192
6/28/13
254
8/27/99
287
3/1/85
104
8/27/76
35
1/16/70
90 1900 10 20 30 40 1950 60 70 80 90 2000 10 20
.2
.5
1
2
5
10
20
50
LogScale
5/30/1418.73
Silver (in US$)
Prepared forThe Long Wave Group by
T opline Investment Graphics www.topline−charts.comCopyright (c) 2014All rights reserved
1/18/1980
47.60
4/29/2011
48.55
.24
12/30/1932
1/30/20
1.34
3.54
2/26/93
.47
11/28/02
8/29/90
1.19
.35
7/14/39
4/26/35
.81
7/12/46
.90
5.16
6/18/82
2/22/74
5.91
5/24/68
2.49
.47
7/23/15
.60
6/20/47.54
3/4/21
3/14/08
20.56
9.22
10/24/08
4.07
11/23/01
2/6/98
7.31
2/18/83
14.49
1.29
11/5/71
.73

8/12/2019 Economic Winter V61 I1 Gold Versus Silver
http://slidepdf.com/reader/full/economic-winter-v61-i1-gold-versus-silver 4/14
The Gold/Silver Price Ratio
The spike low of 15.29 recorded at the end of January 1920 occurred at the commodity price peak following the First World War ination
and it heralded the end of the long wave summer and the onset of autumn, which is the massive speculative season (the roaring 20s).
A similar price spike low at 16.15 was recorded in January 1980. That low in conjunction with the commodity price peak on account o
the Viet Nam war ination signaled the end of the fourth long wave summer and the onset of the speculative autumn. The ratio low was
not only attributable to the peak in commodity prices but it was further enabled by the Hunt Brothers desire to corner the silver market.
The low in March 1968 should be addressed. Why was silver in such demand? On November 19, 1967 British Prime Minister Harold Wil
son, following several assurances to the contrary, announced a 14% devaluation of the British pound. “This relatively small devaluation o
one single, non-reserve currency in November of 1967 turned out to be quite a spark in the monetary powder keg of the Bretton Woods
gold exchange system and the London Gold Pool. Within weeks of the devaluation, the group of central bankers known as the London
Gold Pool had to sell 1,000 tonnes of their own gold into the public market, 20-times the normal amount.” Silver Bear Cafe.
1967: Wilson Defends ‘Pound in Your Pocket’
Volume 61 Issue 1 . June 17, 2014
1967 1968 1969 1970 1971
1.4
1.6
1.8
2
2.2
2.4
2.6
LogScale
12/30/71 1.380
Silver (Handy and Harman base)
Prepared forThe Long Wave Group by
T opline Investment Graphics www.topline−charts.comCopyright (c) 2014All rights reserved
6/12/1968
2.565
1.288
11/3/1971
11/3/69
2.000
1.650
9/6/67
1.575
5/26/701.560
6/23/69
11/18/68
2.120
1.810
2/13/68
11/27/67
2.170
1.850
10/17/68
8/26/70
1.860
4/19/71
1.719
1.572
1/27/71
7/18/67
1.870
1.305
7/5/67
British Pound Devalued Saturday, 11/18/1967.Friday’s value: US$ 2.7823Monday’s value: US$ 2.4198
Nixon ClosesGold Window
Ending OfficialConvertibility

8/12/2019 Economic Winter V61 I1 Gold Versus Silver
http://slidepdf.com/reader/full/economic-winter-v61-i1-gold-versus-silver 5/14
The demand for gold became so intense following this devaluation that European commercial banks attempted to restrict private gold
purchases. “Of greater concern, however was the fact the drain on the pool (London Gold Pool) was accelerating again....the measures
taken by the Swiss commercial banks and by some other continental banks to impede private demand for gold worked quite well; although
it was clear from the start that such measures could only serve as a stop-gap until some fundamental change was agreed upon.” William
Martin, Federal Reserve chairman December 12, 1967; quoted in R. I. P-The London Gold Pool, 1961-1968, Jake Towne, June 14, 2009
published in the Silver Bear Cafe.
With gold being relatively difcult to obtain, investors purchased silver as the next best hedge against further competitive monetary de-
valuations.
Let’s now move forward to examine this gold/silver price ratio chart from the time that President Nixon took the dollar off gold in Augus
1971 to the present. Incidentally, the huge gold drain from the London Gold Pool, of which the U.S. was a 50% partner was the prime
reason for the U.S. to abandon gold backing for the dollar. Gold’s monetary role, which had lasted just short of 100 years (1873-1971)
and much longer than that if we trace the peg of the £ to gold, was eliminated. From this point on, the prices of both metals should have
been based upon the law of supply and demand. Unfortunately, gold and perhaps silver, has since been subjected to frequent ofcial andunpublicized sales in an effort to control the price.
Once the gold price peg had been lifted, as one should expect, it began to rise from the articial price base at which it had been held for
so long. By January 1980, it had reached $850.00 (U.S.) per ounce, which amounted to a gain of better than 2,400% in a little less than
eight and a half years. Of course, this price increase was also attributable to the most virulent period of the summer long wave ination
Over the same period, the price of silver performed better than gold. As I have suggested some of that silver price increase was almost
certainly attributable to the Hunt Brothers attempt to corner silver.
Since that ratio low of 16.15 in January 1980, the ratio has moved strongly in favour of gold. The best that silver has achieved since then
is a low of 1 /31.63 in April 2011. It was then that silver reached its price peak of $49.51 (U.S.) versus a gold price of $1,570 (U.S.) per
ounce. Gold was to reach its price peak of $1,920 (U.S.) ve months later in September at which time the ratio had risen to 1/45.4.
Overall, the ratio median since August 1971 has been 1/ 56.01. (the price of 56.01 ounces of silver equal to the price of 1 ounce of gold).
Now let us examine the gold/silver price ratio during a period, which I consider to be the most relevant to where we are currently positioned
within the long wave cycle. In my opinion, the stock market is close to replicating the 1929 autumn stock bull market price peak, followed
by the stock market crash. I am sure that many of you presume that we have gone beyond that period as evidenced by the 2000-2002
stock bear market or the 2007-2009 stock bear market, which was the result of a worldwide credit collapse. This threatened most major
western banks, many of which were bailed out by concerted central bank interventions. However, the huge credit/debt problem has no
gone away, indeed it has continued to multiply, and sits over all of our heads like a sword of Damocles. It is only a matter of time before
the international debt bubble bursts and when it does, the central banks, this time, will be powerless to stop the utter destruction of the
international nancial system and the world economy.
When the great roaring 20’s autumn stock bull market peaked in early September 1929, there was no indication of a brewing credit col-
lapse that would almost bring down the entire U.S. banking system. Indeed, there was no sign of a stock bull market price peak (no one
rings a bell at the top of the stock market), and what was to follow would be a bear market that would reduce the value of the Dow Jones
Industrials by 90%.
The stock market crash in October 1929 was viewed by many as detached from the real economy. E. H. Simmons, President of the NY
stock exchange, on January 26, 1930 put it this way, “The psychological effect of the stock market on business is, I think, usually over-
emphasized.... I do not think that the fall in security prices will cause any great curtailment in consumption, and the trade gures thus far
available seem to bear out this view.” In like manner, Charles M. Schwab, Chairman, Bethlehem Steel Corporation on December 10, 1929
Volume 61 Issue 1 . June 17, 2014

8/12/2019 Economic Winter V61 I1 Gold Versus Silver
http://slidepdf.com/reader/full/economic-winter-v61-i1-gold-versus-silver 6/14

8/12/2019 Economic Winter V61 I1 Gold Versus Silver
http://slidepdf.com/reader/full/economic-winter-v61-i1-gold-versus-silver 7/14
“When the world credit crisis began in October 1929, there was rst a ight from questionable securities into strong securities. The sec-
ond phase saw an intense liquidation of inventories and commodities. The third phase involved the liquidation of commercial real estate
houses and farms, both through foreclosures and sacrice sales at a fraction of prior values. The fourth stage was a ight from the banks
into cash and gold (which ultimately caused the whole U. S. banking system to collapse) and the fth and nal phase was the ight from
the dollar to gold.” The Donald J. Hoppe Analysis. This had nothing to do with ination of the currency or ination fears; the crisis was one
of deation and debt liquidation. It was simply the recognition that gold is the only nancial asset that is not someone else’s liability and
therefore, the only asset that cannot be defaulted and become worthless.
Many years before, Donald Hoppe wrote the sequence of liquidity events following the onset of the world credit crisis in 1929, John Exter
who had been a vice president of the New York Federal Reserve Bank produced his famous inverted liquidity pyramid in which he outlined
what happens during a debt deationary collapse. Investors ee from increasingly illiquid assets to stronger and more liquid assets and
down into treasury bills and thence into Federal Reserve notes and nally to the ultimately most liquid and most secure asset of gold
Essentially, this followed the path that Hoppe had described, following the 1929 stock market crash.
Note: Everything above gold is a paper asset. Certainly gold equities are paper assets but are a direct claim on gold.
Volume 61 Issue 1 . June 17, 2014
Small Business
Real Estate
Diamonds and Gemstones
OTC Stock
CommoditiesMUNI Bonds
Listed Stocks
Government Bonds
Treasury Bills
Fed Reserve Notes
(Paper Money)
GOLDand Gold
Equities
Corporate Bonds
Flight to Liquidity During a Longwave Winter Debt Collapse
John Exter's - Inverse PyramidModified by Longwave Group
Small Business
Real Estate
Diamonds and Gemstones
OTC Stock
CommoditiesMUNI Bonds
Listed Stocks
Government Bonds
Treasury Bills
Fed Reserve Notes
(Paper Money)
Corporate Bonds
Gold and Gold Equitites

8/12/2019 Economic Winter V61 I1 Gold Versus Silver
http://slidepdf.com/reader/full/economic-winter-v61-i1-gold-versus-silver 8/14
Following the 1929 stock market crash and the ensuing credit collapse, Donald Hoppe described the massive ight to gold in this way,
“Foreigners cashed in not only their American stocks and bonds, but also their dollars and hauled American gold away by the boatload
Americans converted their paper dollars and bank deposits into gold coins and stashed them in mattresses, hid them in basements o
attics or took them on one way trips to Bermuda or the Bahamas. By July of 1932, Treasury Secretary Mellon secretly informed Presiden
Hoover that the Treasury, the Fed and the banking system were being drained of gold at such an accelerating rate that a collapse of the
gold standard was imminent, and if the U. S. went off gold the dollar itself could suffer a severe decline in the foreign exchange markets”
The Kondratieff Wave Analyst, Hoppe, Donald, January 1986. P.9.
It was not only gold itself that frightened investors turned to as their ultimate safe haven asset, but it was also to invest in the companies
that mined gold and even those that explored for the precious metal. In fact, following the stock market crash in 1929, what remained o
capital owed almost exclusively to gold and shares in gold companies both miners and explorers.
According to the U.S. Bureau of Mines, there were 9,000 operating gold mines in the U.S. by 1940. Of course, some of these were smal
Mom and Pop operations, especially some of the Placer operations located mainly in Alaska, but there were also several very large pro-
ducing mines. I doubt that there are one tenth of that number operating in the United States today.
In Canada, there was a huge exploration boom, particularly along the Abitibi greenstone belt stretching from north/central Ontario into
Quebec. Many of the mines discovered and placed into operation along that belt in the 1930s are currently being explored and in some
cases are being mined at this time. Here are a few of the many examples that I have been able to research. 1935, in North Western Que
bec, the Arneld, Canadian Malartic and Lamaque gold mines came into production; Canadian Malartic has been rejuvenated by Osisko
Mining (OSK/T) into a multi-million ounce deposit. Lamaque is being successfully explored by Integra Gold Corp (ICG/V) . 1935, milling
commenced at Pickle Crow mine in Patricia district, NW Ontario now owned by PC Gold (PKL/T). 1938, Hallnor Mine, Porcupine district
Ontario brought into production; now being successfully explored by Temex Resources (TME/V). 1938, Lapa Cadillac mine, Western
Quebec commenced milling; currently being mined by Agnico Eagle Mines (AEM/T.)
I have a copy of The Chronological Record of Canadian Mining Events from 1604 to 1943 and Historical Tables of the Mineral Production
of Canada, submitted by the Dominion Bureau of Statistics to Canada’s Department of Trade and Commerce. From this copy I have beenable to deduce that between 1929 and 1940 over 100 gold mines throughout Canada were placed into operation. These properties had
to be explored successfully, which in itself cost a large amount of capital, before they could be placed into operation by milling the ore
and that required further signicant capital. This inux of so many new gold mines naturally added to Canada’s gold production between
1929 and 1940.The following table shows that between these dates gold production in Canada rose from 1,928,308 ne oz. in 1929 to
5,311,145 ne oz. in 1940, which amounted to a 175% increase.
Total ne Gold Oz-Canada 1929 1930 1931 1932 1933 1934 1935 1936 1937 1938 1939 1940
1,928,308 2,102,068 2,693,892 3,044,387 2,949,309 2,972,074 3,284,890 3,748,028 4,096,213 4,725 ,117 5,094,379 5,311145
By contrast, silver production in Canada over the same period showed no discernible increase.
Total ne Silver Oz- Canada1929 1930 1931 1932 1933 1934 1935 1936 1937 1938 1939 1940
23,143,261 26,443,823 20,562,247 18,347,907 15,187,950 16,415,282 16,618,558 18,334,487 22,977,751 22,2191,95 23,163,629 23,833,75
Volume 61 Issue 1 . June 17, 2014

8/12/2019 Economic Winter V61 I1 Gold Versus Silver
http://slidepdf.com/reader/full/economic-winter-v61-i1-gold-versus-silver 9/14
As the world credit crisis unfolded following the 1929 stock market crash in New York, the desire to own gold and invest in gold mining
companies was not only a North American pheneomen but an international one, since almost all countries were mired in an economic
depression. The following chart shows that between 1929 and 1940 gold production worldwide more than doubled. As I have already
written, but I think it is a point that needs to be emphasised, that could not happen without a major inux of capital into the gold mining
industry. Following the destructive stock bear market of 1929 to 1932, capital was very scarce and what remained owed almost exclu
sively to the gold mining industry.
Volume 61 Issue 1 . June 17, 2014

8/12/2019 Economic Winter V61 I1 Gold Versus Silver
http://slidepdf.com/reader/full/economic-winter-v61-i1-gold-versus-silver 10/14
Below, I show the share prices from 1929-1936 of two gold mining companies . These spectacular gains were not unique to just these two
companies. I was told by a South African gold fund manager that that the junior gold mining shares in South Africa experienced record
gains in the 1930s.
Homestake Mining Dome Mines
Share Price Dividend Share Price Dividend
1929 low price $65.00 $7.00 $6.00 $1.00
1930 high price $83.00 $8.00 $10.375 $1.00
1931 high price $138.00 $8.45 $13.50 $1.00
1932 high price $163.00 $10.60 $12.875 $1.30
1933 high price $373.00 $15.00 $39.50 $1.80
US Ofcial Gold Price Raised from $20.67 to $35.00 per ounce effective January 1934.
1934 high price $430.00 $30.00 $46.25 $3.50
1935 high price $495.00 $56.00 $44.875 $4.001936 high price $544.00 $36.00 $61.50 $4.00
Note that the share prices of both Homestake Mining and Dome Mines increased by 6 times from their 1929 price lows to their 1933 price
highs. These price increases occurred without any increase in the price of gold which was xed at $20.67 (U.S.) per ounce until January
1934 when the price was ofcially raised to $35.00 (U.S.) per ounce.
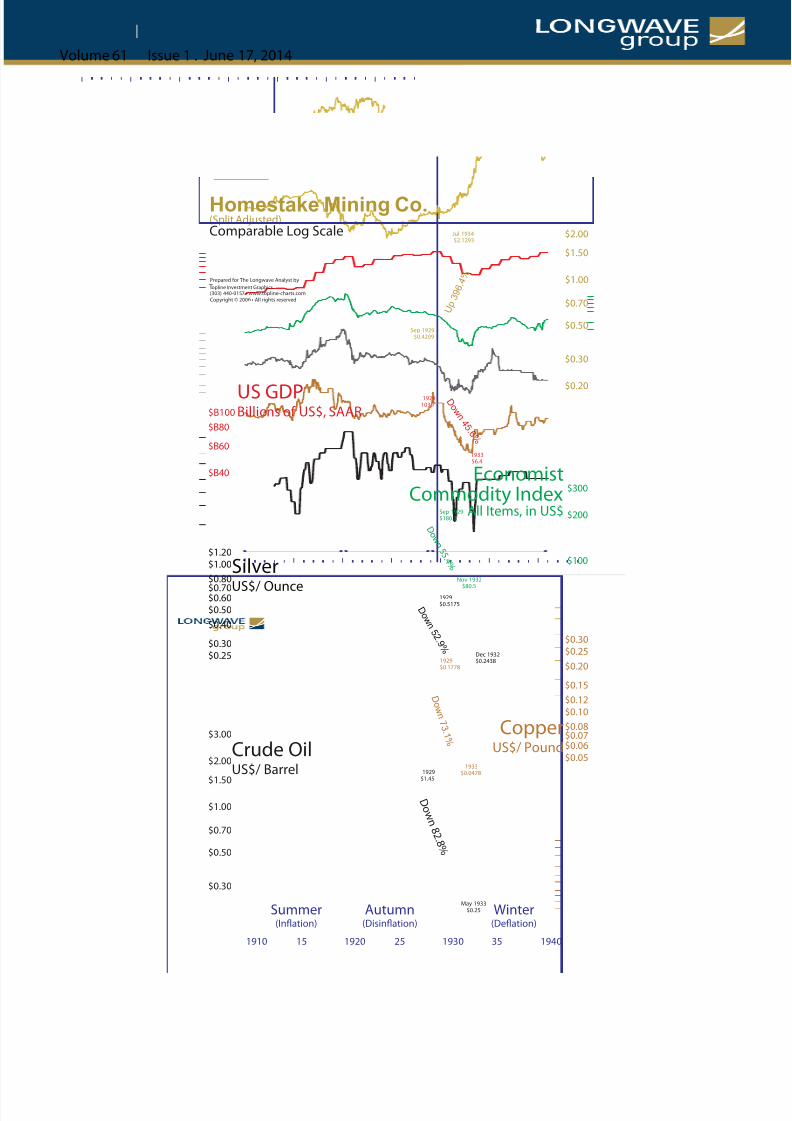
They say “a picture speaks a thousand words”, and the following chart does just that. Following the 1929 stock market crash, the U.S
economy collapsed, falling by more than 45% into 1933. This in turn fostered a deationary spiral leading to a collapse in commodity
prices, including the price of silver, which fell by 50% into December 1932. In the face of this deation the price of gold stocks, here de-
picted by the price of Homestake Mining (See prices in table above) increased by several hundred percent. During that time, the price o
gold itself was xed, initially at $20.67 (U.S.)and after January 1934 at $35.00 (U.S.) per ounce.
Volume 61 Issue 1 . June 17, 2014
8/12/2019 Economic Winter V61 I1 Gold Versus Silver
http://slidepdf.com/reader/full/economic-winter-v61-i1-gold-versus-silver 11/14
Volume 61 Issue 1 . June 17, 2014
$300
$200
$100
$B80
$B40
$B60
$B100
$0.25
$0.30
$0.40
$0.50
$0.60$0.70
$0.80
$1.00
$1.20
Comparable Log Scale
Homestake Mining Co.(Split Adjusted)
EconomistCommodity Index
All Items, in US$
US GDPBillions of US$, SAAR
Silver
US$/ Ounce
Crude OilUS$/ Barrel
1929103.7
Sep 1929$0.4209
193356.4
Jul 1934$2.1293
D o w
n 4 5 . 6 %
U p
3 9 6
. 4 %
1929$1.45
May 1933$0.25
D o w n 8 2 . 8 %
1929$0.1778
1933$0.0478
D o w n 7 3 . 1 %
Sep 1929$180.3
Nov 1932
$80.5
D o w n 5 5
. 4 %
1929$0.5175
Dec 1932$0.2438
D o w
n 5 2
. 9 %
opline Investment Graphics TPrepared for The Longwave Analyst by
(303) 440-0157 • www.topline-charts.comCopyright © 2006 • All rights reserved
Summer(Inflation)
1910 15 1920 25 1930 35 1940
Autumn(Disinflation)
Winter(Deflation)
$3.00
$2.00
$1.50
$1.00
$0.70
$0.50
$0.30
$2.00
$1.50
$1.00
$0.70
$0.50
$0.30
$0.20
$0.20
$0.15
$0.12
$0.10
$0.08$0.07$0.06
$0.05
$0.25
$0.30
CopperUS$/ Pound
8/12/2019 Economic Winter V61 I1 Gold Versus Silver
http://slidepdf.com/reader/full/economic-winter-v61-i1-gold-versus-silver 12/14
8/12/2019 Economic Winter V61 I1 Gold Versus Silver
http://slidepdf.com/reader/full/economic-winter-v61-i1-gold-versus-silver 13/14
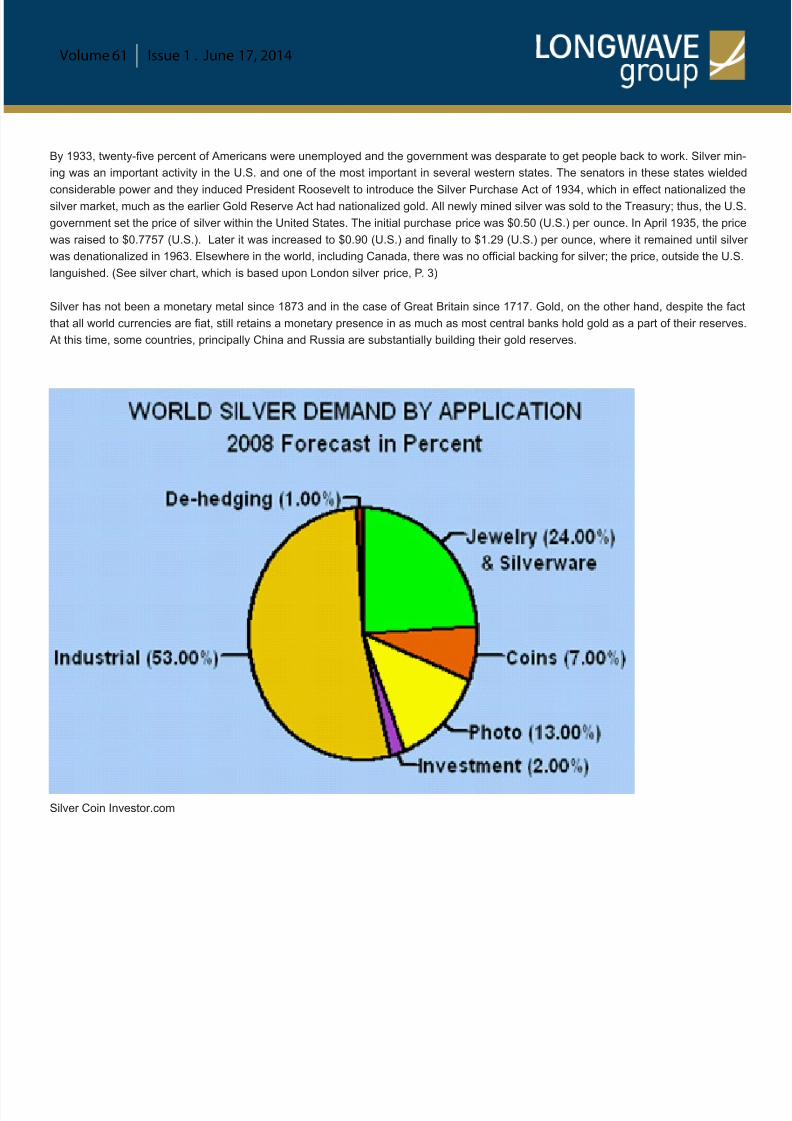
The predominant use for silver is industrial (53%); if photo usage is added to industrial, it increases the industrial demand for silver to 66%
In the coming economic deationary depression industrial demand for silver will be considerably reduced.
Economic depressions are by nature, deationary, because debt is wrung out of the economy. Usually that process is chaotic as a resul
of an inordinate number of bankruptcies caused by the failure of both debtors and creditors alike. This process leads to a signicant reduc
tion in the money supply. Between 1929 and 1933 debt liquidation in the U.S. led to a 30% collapse in the money supply.
In this, the fourth Long Wave winter, debt is signicantly greater and more international in scope than it was at the onset of the third Long
Wave winter after the 1929 stock market price peak. This is because the currencies of all countries are at paper. Paper money is deb
money. When the debt bubble bursts the deationary shock will be much larger than it was in the 1930s and far more pervasive.
Ludwig von Mises, the Austrian school economist wrote, “There is no means of avoiding the nal collapse of a boom brought about by
credit expansion. The alternative is only whether the crisis should come sooner as a result of a voluntary abandonment of further credi
expansion, or later as a nal and total catastrophe of the currency system involved.” There has been “no voluntary abandonment of fur-
ther credit expansion.” Indeed, since 2008 there has been a massive worldwide expansion of credit expansion, most of it assumed bygovernments.
In 1933, Robert L. Smitley wrote, “It is a delusion to think that a depression caused by an overexpansion of credit can be resisted. All the
panaceas, nostrums and quack remedies invented by all the politicians in the world cannot hold off the eventual day of reckoning.” The
“panaceas, nostrums and quack remedies” are evident by programs like ‘Quantitative Easing and TARP’, which are merely pseudonyms
for money printing.
Governments and central banks have been printing even more money in an effort to stop the debt collapse. It won’t work. The day o
reckoning is close at hand. When the bubble bursts it is likely to be sudden and catastrophic.
The worldwide debt bubble is about to burst into a deationary depression. We know that once deation begins in earnest that there
begins a sequence of events as investors bailout of illiquid assets like small business real estate and commodities. After this, the bail outcontinues via corporate bonds, stocks, government bonds and even treasury bills, as investors seek the safe haven of cash. Since cash
is paper investors turn to the ultimate safe haven asset, which is gold. (See John Exter’s Inverse Pyramid on Page 8). As we have docu
mented at some length in this writing, it is not only physical gold, but also the companies that explore for and mine gold that are sought as
the safest investments during such frightening times. “Gold money does better against paper money in deation than in ination, because
in deation the market runs from paper assets, including the dollar itself, that are falling in price or actually defaulting. Gold never defaults
and compared with paper is unbelievably scarce.” John Exter.
There is no historical evidence that during times of deation silver assumes a monetary role. Indeed, as we have demonstrated the price
of silver dropped by 50% during the last deationary winter. Silver prices, at least in the United States were set by the government after
1934, but elsewhere in the world silver prices languished throughout the depression. The median value of the gold/silver ratio from 1929
to 1940 was 76.92, even though the gold price was xed.
In these times silver has assumed an even greater role as an industrial metal than was the case in 1929. Thus, the price of silver is
predominately governed by industrial demand. In the forthcoming long wave winter deationary depression that demand is going to be
seriously curtailed and the price of silver will reect this.
The gold/silver price ratio should widen dramatically in gold’s favour when debt deation hits. The demand for gold will reach unprec-
edented levels. John Exter put it this way, “It will be far the biggest run out of paper money into gold in history, and ... gold mining shares
will soar to unheard of prices in the coming deationary collapse.” The demand for silver on the other hand will, if history is our guide, fall
appreciably and hence its price will do likewise.
Volume 61 Issue 1 . June 17, 2014

8/12/2019 Economic Winter V61 I1 Gold Versus Silver
http://slidepdf.com/reader/full/economic-winter-v61-i1-gold-versus-silver 14/14
The bursting debt bubble will likely bring about a major currency crisis, which without doubt will add even greater demand for gold. This
makes it likely that physical gold will be unobtainable at any price. In this case, investors will turn to silver as an alternative, as they did
during the days of the British pound devaluation. Hence, it makes sense to retain some silver as a store of value, but given all the evidence
gold should be considered the primary safe haven asset, particularly, as there may come a day not that far into the future when you wil
be unable to purchase it.
Written By: Ian Gordon
Ian A. Gordon, The Long Wave Analyst, www.longwavegroup.com
Disclaimer : This information is made available by Long Wave Analytics Inc. for information purposes only. This information is not intended to be and should not to be construed as investment advice, and a
recommendations that may be contained herein have not been based upon a consideration of the investment objectives, nancial situation or particular needs of any specic reader. All readers must obta
expert investment advice before making an investment. Readers must understand that statements regarding future prospects may not be achieved. This information should not be construed as an offer
sell, or solicitation for, or an offer to buy, any securities. The opinions and conclusions contained herein are those of Long Wave Analytics Inc. as of the date hereof and are subject to change without notic
Long Wave Analytics Inc. has made every effort to ensure that the contents have been compiled or derived from sources believed reliable and contain information and opinions, which are accurate and co
plete. However, Long Wave Analytics Inc. makes no representation or warranty, express or implied, in respect thereof, takes no responsibility for any errors and omissions which may be contained herein, a
accepts no liability whatsoever for any loss arising from any use of or reliance on this information. Long Wave Analytics Inc. is under no obligation to update or keep current the information contained here
The information presented may not be discussed or reproduced without prior written consent. Long Wave Analytics Inc., its afliates and/or their respective ofcers, directors or employees may from time t
time acquire, hold or sell securities mentioned herein. In addition, the companies referred to herein may pay a fee to Long Wave Analytics Inc. to be listed on www.longwavegroup.com. Copyright © Longwa
Group 2014. All Rights Reserved.
”Those who cannot remember the past are condemned to repeat it”. Santayana
Volume 61 Issue 1 . June 17, 2014