economic tools of the us government american budgetary and fiscal policies
TRANSCRIPT

Economic Tools of the US Government
American Budgetary and Fiscal Policies

I. The Federal Budget: An Overview
Who pays? Who gets what?

Reminder: The Macroeconomic Effect of Fiscal Policy
Government policies that increase aggregate demand are called expansionary policies.
Government policies that decrease aggregate demand are called contractionary policies.

A. Revenues: Microeconomic Effects (Who pays?)
1. Tax code is best place for political favors.
Why?
a. Permanence -- Tax law remains unless someone repeals it. Spending requires reauthorization every year.
b. Less visible -- Public doesn’t understand tax code

2. Class differencesa. Progressive taxes (Wealthy pay higher % of
income) Income Tax: Tax on earned income. Does not apply to investments.
Capital-Gains Tax: Tax on investment income. Estate Tax: Tax on wealth over $1.6 million
($3.2 million if married) after death (2006 figures)

Class differencesb. Regressive taxes(Poor pay higher % of
income) Excise Taxes: Tobacco, Alcohol, Gasoline, etc. Exception may be gasoline taxes (Multiple cars, Low Fuel
Economy for SUVs) State Taxes:
Sales tax (poor consume larger fraction of income) Property tax: Effect on rent tends to make tax regressive (poor pay
larger share f income for housing)
Depending on definition: Payroll Tax: Social Security and Medicare taxes. Paid only on the
first $90,000 of wages. Not paid on investments or on wages over $90,000 (2005 figure).

Class differencesc. Flat Taxes
Also known as Proportional Taxation Definition: Everyone pays same % of income, regardless of
source US System
Consists of progressive and regressive taxes Federal taxes > State taxes Only moderately progressive: Middle income range is
nearly “flat” If progressive taxes become flat taxes, overall
system becomes regressive


State and Local Taxes: Regressive

Is the US Tax System Flat?

d. Which federal taxes are most important?

B. Spending: Who gets what?

1. Categories of Spending Mandatory –
About 2/3 of the Budget
Discretionary – About 1/3 of the budget

a. “Mandatory” Spending Some laws commit Congress to spend
money in the future. These programs get funding each year if Congress does nothing: Social Security Medicare Medicaid Income Security Interest

Mandatory Spending Increases Every Year…

…partly due to new benefits…

…but mostly due to an aging population…

…and increasing health care costs.

Interest will grow as well.

b. Discretionary Spending
i. Must be renewed by Congress or funding ceases
ii. Defense is largest discretionary expenditure

iii. Defense Spending: Stability and Change

0 50 100 150 200 250 300 350 400 450 500
Next 50
USA
China Russia Japan UK France Italy India Israel Iran North Korea
Germany S. Arabia S. Korea Syria
iv. US vs. Everyone Else

C. Programs of Interest
These are already included in the earlier figures
BUT These programs have generated public and
Congressional debate out of proportion to their budgets

1. Programs of Interest: Homeland Security

a. Department Creation = “Must Pass” – Perfect for Interest Groupsi. Unrelated Amendments:
Eli Lilly: Immunizes drug makers from lawsuits over vaccines Allows formerly American companies that move to foreign tax
havens like the Cayman Islands to win federal contracts
ii. Winners: Technology companies (databases) Shipping / Trucking / Air companies (subsidized security) Corporate tax evaders Eli Lilly and other vaccine manufacturers
iii. Losers: Airport screeners (no unions allowed) Plaintiffs suing over old vaccines

b. Large Increases in Funding = Further Opportunities for Interest Groups Authorized in the FY2004 budget:
$2,000,000 to the Great Lakes Region to purchase an Icebreaker so that commercial ships can go through during the winter
$200,000 to project Alert, a school-based drug prevention program for middle grade youth.
$2.5 billion for “highway security,” which consists of building and improving roads.
$70,000,000 for the Homeland Security Fellowship Program for students and universities.
$50,000,000 to the National Exercise Program to provide an exercise program that meets the intent of the Oil Pollution Act of 1990.
$6,400,000 for the Intellectual Property Rights Center. The center’s focus is to combat intellectual property right crime—a long time FBI project.

2. Programs of Interest: Welfarea. No budget for “welfare”
Social welfare programs include Social Security, Medicare, Medicaid, many others
Most people mean cash, food, and medical aid to the poor: “Means-Tested Assistance”
b. Jointly funded: States pay about one-third

c. Welfare Reform: Cases have gone down….

…and more single mothers are working outside the home….

…but putting them to work is expensive!

d. Where does TANF money go?-- Less cash than AFDC, more Child Care and Work

e. TANF State flexibility: Many states spend money on unique programs
3. Programs of Interest: Foreign Aid
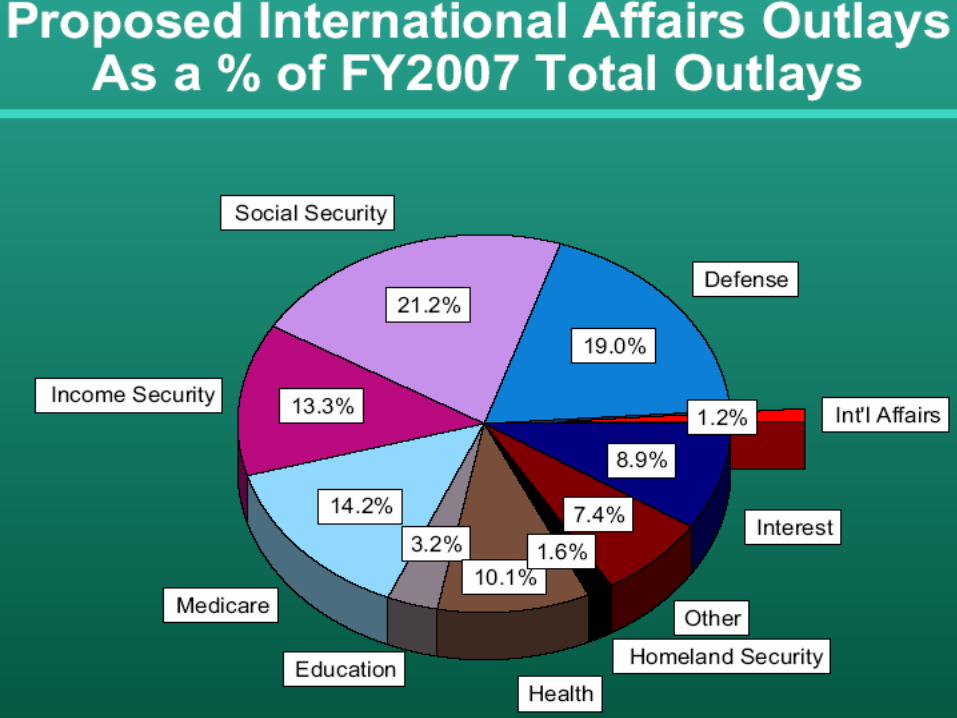

a. US Gives Very Low % of GDP for development…

…but still manages to be the largest donor

b. Top Three Recipients of US Aid: FY 2000 – FY 2007
2000 2001 2002 2003 2004 2005 2006 2007
1st Israel Israel Israel Israel Iraq Israel Israel Israel
2nd Egypt Egypt Egypt Egypt Israel Egypt Egypt Egypt
3rd Colom Jordan Pakist Russia Egypt Afgh Afgh Afgh
Israel and Egypt are two of the top three every year for the past 25 years. Why?

4. Programs of Interest: Research

D. Budget Deficits
Definition: Spending > Revenue Balanced Budget = No Budget Deficit
Technically, no surplus either, but no one objects to a little surplus.

1. Dangers of Budget Deficitsa. Interest payments – If economy grows slower than
interest paid on debt, interest becomes larger fraction of GDP
b. Reduced private investment – Government borrowing tends to reduce overall savings and “crowd out” private investment
c. Increased interest rates – All else being equal, government borrowing raises the cost of borrowing for everyone else
d. Key variable: Does deficit spending generate high enough real growth (growth after inflation) to offset future interest payments and decreased investment?
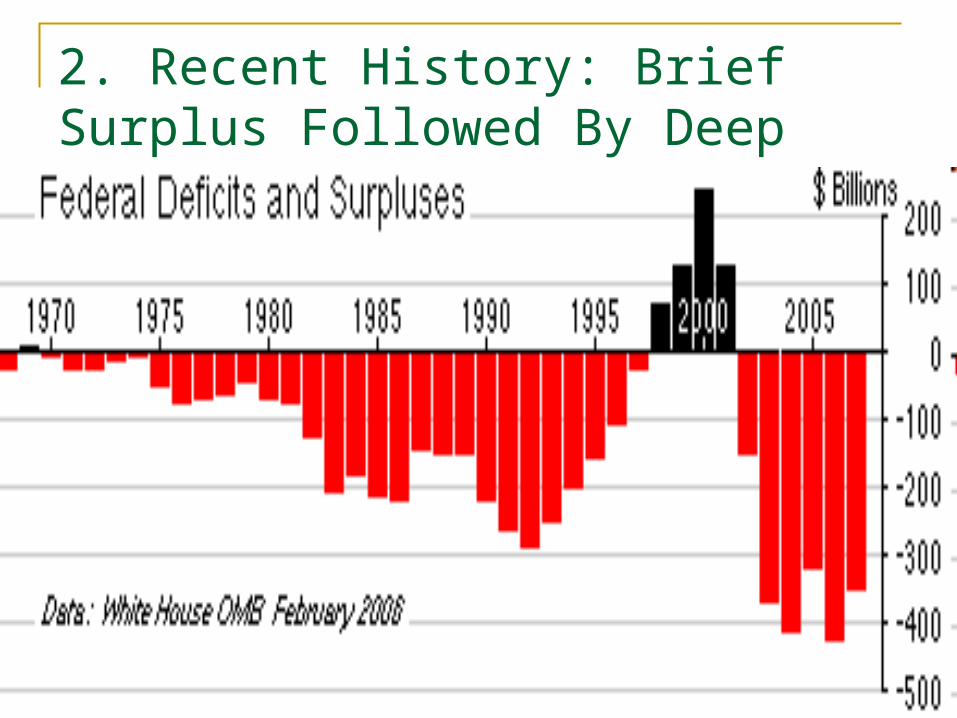
2. Recent History: Brief Surplus Followed By Deep Budget Deficits

3. The National Debt: Accumulated Deficits


4. Who Does the US Owe?

E. Who is Responsible?1. Formal procedure
a. Since 1921 (Budget and Accounting Act): Budget submissions by President focused responsibility
b. Since 1974 (Budget Act): Competing Congressional budget resolutions diffused responsibility
2. Informal process: Veto gives President power to prevent higher spending, but not to raise spending (use of continuing resolutions can prevent spending increases)
3. Relationship between requests and authorization: Congress usually appropriates about what the President requests


Mandatory Spending Binds Both Branches: Presidential Requests (Solid) vs. Congressional Authorization (Dashed)

National Security Funding: Does Congress Follow the Leader? Presidential Requests (Solid) vs. Congressional Authorization (Dashed)

Discretionary Spending: Congress Frequently Alters Presidential Requests

4. Public Opinion a. Low Salience: Balanced Budgets Don’t Win Elections
b. Popular Reaction to the Budget Deficit1. Voters generally assign blame/credit to
President for economy, not Congress. BUT…
2. 1988 study: Voters who listed deficit as critical issue more likely to vote Republican (Reagan not blamed for 1980s deficits – or people voting prospectively for Bush?)

5. Partisanship and the Deficit1. Division of government between parties increases
deficit
2. Moderates of both parties most likely to vote for both higher taxes and lower spending
3. Comparison of projections by the Federal Reserve Board, Congress, and the Executive finds that Executive estimates are least reliable
a. Democratic Presidents exaggerate unemployment
b. Republican Presidents exaggerate inflation
c. No clear partisan divide on growth estimates until 1980s: Reagan/Bush I were too optimistic, Clinton was too pessimistic

II. Monetary Policy: The Federal Reserve Board and the Banking SystemA. The Federal Reserve Board

1. Organization of the Federal Reserve Systema. Federal Reserve System created by action of the U.S.
Congress in 1913• Prior to 1913, U.S. had no Central Banking System• Occasional Financial Panics (1880’s, 1890’s, and finally, 1907)
– Public demanded that government take steps to prevent such panics
• The Federal Reserve System to become the “lender of last resort” should commercial banks begin to fail

2. The Federal Reserve Districts Each of the 12 Federal Reserve District Banks
is owned by the member commercial District Banks in its District
Fed is a quasi public-private enterprise, not controlled by the President or Congress
3. The Board of Governors
Seven Members appointed by the President & confirmed by the Senate
Appointed for a single fourteen year term A Board position is scheduled for replacement every two years Chairman is public voice of Federal Reserve Board, but is only
one vote
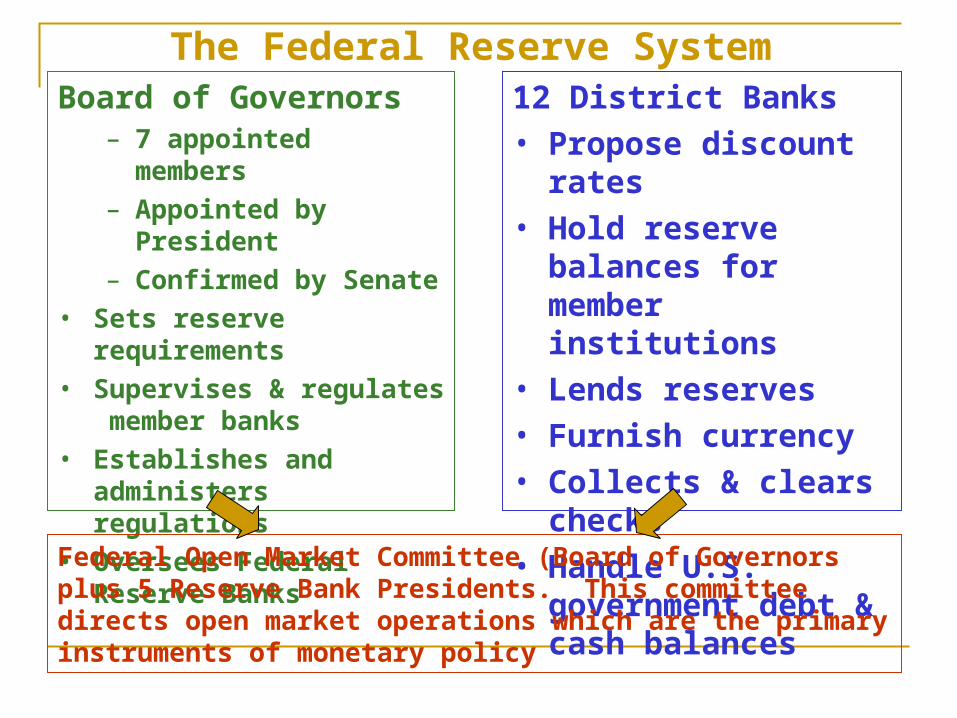
The Federal Reserve SystemBoard of Governors
– 7 appointed members
– Appointed by President
– Confirmed by Senate
• Sets reserve requirements
• Supervises & regulates member banks
• Establishes and administers regulations
• Oversees Federal Reserve Banks
12 District Banks
• Propose discount rates
• Hold reserve balances for member institutions
• Lends reserves
• Furnish currency
• Collects & clears checks
• Handle U.S. government debt & cash balances
Federal Open Market Committee (Board of Governors plus 5 Reserve Bank Presidents. This committee directs open market operations which are the primary instruments of monetary policy

4. Functions of the Federal Reservea. Conduct Monetary Policy
• Formal mandate: Low inflation and Low Unemployment
• Actual policy emphasizes low inflation over full employment or economic growth
b. Serve as a lender of last resort to commercial banks within the District
c. Issue Currency – “In God we Trust”
d. Provide Banking Services to the U.S. Government
e. Supervise and regulate financial institutions

B. Monetary Policy - How it works

1. The FRB’s Toolkita. Buying/selling government securities Stimulation: Fed purchases U.S. Government Securities in the
bond market (U.S. Treasury Notes) – Raises bond prices; reduces interest rates
• Cash flows from the Fed to sellers of bonds; sellers deposit cash in their banks, thereby increasing the nation’s deposits and the excess reserves of the banking industry
Restraint: Fed sells U.S. Government Securities in the bond market (U.S. Treasury Notes) – Lowers bond prices; increases interest rates
• Cash flows from the banks to buyers of bonds and ultimately to the Fed, thereby reducing the deposit accounts and restricting the ability of commercial banks to loan money

b. Alter the Fed Funds Rate /Discount Rate Fed Funds Rate: the interest rate commercial
banks must charge one another to lend or borrow on an overnight basis for reserve management purposes
Discount Rate: the interest rate commercial banks must pay the Fed to borrow directly from the Fed for reserve management purposes

c. The reserve rate: The Fed’s ultimate weapon Use of this tool would be perceived as a
reaction to extraordinary events Amount of cash banks have to keep on hand
to cover withdrawals Fed will be very cautious and publicize its
intentions well in advance Last time required reserves changed – 1980
– resulted in a credit crunch that plunged the economy into the worst recession since the Great Depression
2. The role of Banks in Monetary Policya. Banks Create Money: Banks can be viewed
as counterfeit operations authorized by the government, and are an essential tool in affecting monetary policy
• Banks lend money that they don’t have -- so they are essentially minting their own currency!
• Reserve requirements set by the government determine the extent to which banks can counterfeit

b. Banks depend on confidence• Customers could bankrupt a bank simply by
asking for all of their reserves back, which they can do at any time.
• Customers don’t ask for their money back when “counterfeiting” is profitable and they earn a part of the returns (interest)
• Customers will tolerate the behavior only as long as they believe that the bank is reputable in this activity

c. Money creation through fractional reserves
The money creation process: Making one loan creates the opportunity to make another loan, a process which continues in perpetuity.
Step 1: Bank issues a promissory note for which there is no “direct” reserve. (ie. the bank makes a loan and gives the borrower a receipt against that banks reserves)
Step 2: This receipt (loan) is traded for a good or service (promissory note is passed on to a new holder)
Step 3: The promissory note is deposited back into a bank by the new holder, creating a new deposit (bank liability).
Step 4: The promissory note is available once again to be loaned.

Money Creation Example
•A bank receives $100 Million in deposits, keeps $20 million in reserve.•But the $80M in loans returns to the banking system somewhere else -- the second generation bank
Assets: Liabilities:
Reserve: $16 M Dep. of loan from 1st bank: $80 M
Loans from new deposit: $64 M
Assets: Liabilities:
Reserve: $12.8 M Dep. Of loan from 2nd bank: $64 M
Loans from new deposit: $51.2 M
The third generation bank receives $64 million of new loan deposits, allowing another $51.2 million in loans

Money creation in perpetuityNew Deposits New loans/
InvestmentsCash reservebalances
Original Bank $100 M $80 M $20 M
2nd generation bank 80 64 16
3rd generation bank 64 51.2 12.8
4th generation bank 51.2 41.0 10.2
5th generation bank 40.9 32.8 8.2
6th generation bank 32.8 26.2 6.5
7th generation bank 26.2 21.0 5.2
8th generation bank 21.0 16.8 4.2
9th generation bank 16.8 13.4 3.4
10th generation bank 13.4 10.7 2.7
Sum of first 10 banks $446 M $357 M $89 M
Sum or remaining banks $54 M $43 M $11 M
Total for banking system $500 M $400 M $ 100 M

3. Effectiveness of Monetary Policy Easy to curb inflation, at cost of lower growth /
recession and increased unemployment Harder to stimulate growth
Fed can lower interest rates, increase the banks’ deposits BUT
It cannot force a broke person (business) to borrow Good risks in prosperous times become poor risks in
recessionary times Fed ability to stimulate often compared to problem of
trying to push a string – no matter how much effort you give it, it just doesn’t move much