economic survey 2008 - 09 - im4change.org
TRANSCRIPT

Government of Bihar Finance Department
Economic Survey 2008 - 09
February 2009
fcgkj ljdkj

Government of Bihar
Finance Department
Economic Survey 2008 - 09
February 2009


Contents Chapter Title
Glossary of Technical Terms and Abbreviations i-v
Index of Tables vi-xiii
Executive Summary xiv-xxxii
Chapter I : Macro Overview 1-55 1.1 State Domestic Product 1-9 1.2 Regional Disparity 10-13 1.3 Consumer Price Indices 13-14 1.4 Governance 14-36 1.5 Disaster Management 36-46 Appendices 47-55
Chapter II : Agriculture and Allied Sectors 56-87 2.1 Rainfall 57-59 2.2 Land Utilisation 60 2.3 Production and Productivity 61-69 2.4 Irrigation 69-70 2.5 Agricultural Inputs 70-74 2.6 Agricultural Credit 74-80 2.7 Animal Husbandry 80-83 2.8 Road Map for Agriculture 83-87
Chapter III : Industry and Allied Sectors 88-115 3.1 Structure of Industries 88-89 3.2 Large and Medium Industries 89-90 3.3 Small Scale Industries 90-91 3.4 Agro-based Industries 91-95 3.5 Non-Agro-based Industries 95-98 3.6 Industrial Sickness 99 3.7 Support Institutions 99 3.8 Udyog Mitra 100 3.9 Bihar Industrial Areas Development Authority (BIADA) 100-101 3.10 District Industries Centres (DIC) 101-102 3.11 Prime Minister Rojgar Yojana (PMRY) 102 3.12 Information Technology 102-105 3.13 Investment Proposals 106-107 3.14 Tourism 107-108 3.15 Problems and Prospects of Industrialisation in Bihar 108-109 Appendices 110-115
I

Chapter IV : Physical Infrastructure 116-145
4.1 Roads and Bridges 117-120
4.2 Motor Vehicles 120-124
4.3 Bihar Police Building Construction Corporation 124-125
4.4 Energy Sector 125-132
4.5 Irrigation 133-137
4.6 Airways 137
4.7 Telecommunication 138
4.8 Postal Facilities 138-140
Appendices 141-145 Chapter V : Social Sectors 146-206
5.1 Literacy and Education 146-158
5.2 Demography and Health 158-170
5.3 Labour, Employment and Poverty 170-184
5.4 Interventions for Marginalised Sections 184-192
Appendices 193-206 Chapter VI : Banking and Allied Sectors 207-238
6.1 Banking Infrastructure 208-211
6.2 Deposits, Credits and Credit-Deposit Ratio 211-217
6.3 CD Ratio of Different SCBs 217-218
6.4 CD Ratio of Different Districts 218-219
6.5 Investment Plus Credit to Deposit (ICD) Ratio 219-221
6.6 Regional Rural Banks (RRB) 221-222
6.7 Industry Share in Total Bank Credit 222-223
6.8 Advances under Annual Credit Plan (ACP) 224-225
6.9 Primary Agricultural Credit Societies 225
6.10 State Cooperative Banks 226
6.11 State Cooperative Agricultural and Rural Development 226-227 Banks (SCARDB)
6.12 Kisan Credit Cards (KCC) 227-228
6.13 National Bank for Agriculture and Rural 229-231 Development (NABARD)
6.14 Micro Finance 231-232
6.15 Evaluation of Selected Government Schemes 232-235
6.16 Summing Up 235-236
Appendices 237-238
II

III
Chapter VII : Public Finance 239-340
7.1 Introduction 239-241
7.2 Overall Financial Position 241-244
7.3 Fiscal Performance 244-249
7.4 Sustainability, Flexibility and Vulnerability of State Finances 250-253
7.5 Deficit Management 254-257
7.6 Receipt and Expenditure of Bihar Government: 258-263
Revenue Account
7.7 Debt Management 263-265
7.8 FRBM Act and Fiscal Correction Path 265-266
7.9 Resource Mobilisation 266-278
7.10 Performance Analysis of State Tax Departments 278-283
7.11 Expenditure Management 284-287
7.12 Revenue Expenditure 287-288
7.13 Expenditure on Salary and Pension 288-290
7.14 Quality of Expenditure 290-291
7.15 Sectoral Expenditure 291-294
7.16 Per Capita Expenditure on Social and Economic Services 295-296
7.17 State Budget for 2008-09 297-300
7.18 Central Funds Bypassing the State Budget 300-302
7.19 Plan and Non-Plan Expenditure in Districts 302-304
7.20 Centrally Sponsored Schemes 305-306
7.21 State Public Sector Undertakings and Corporations 306-311
7.22 Disparity in Government Expenditure on Social Sectors 311-320
across the Districts
7.23 Panchayati Raj Institutions 320-325
Appendices 326-340

Glossary of Technical Terms and Abbreviations
ACP Annual Credit Programme
ADB Asian Development Bank
ADV Advertisement Tax
AIBP Accelerated Irrigation Benefit Programme
AICTE All India Council of Technical Education
ANM Auxiliary Nurse-cum-Midwife
APDRP Accelerated Power Development and Reforms Programme
APHC Additional Primary Health Centre
APMB Agricultural Produce Marketing Board
APMC Agricultural Produce Marketing Cooperative
AREP Accelerated Rural Electrification Programme
ASHA Accredited Social Health Activist
ASI Annual Survey of Industries
ATMA Agricultural Technology Management Agency
AWC Anganwadi Centre
AWW Anganwadi Worker
B2C Business to Citizen
BADP Border Area Development Programme
BAPMC Bihar Agricultural Produce Marketing Corporation
BCR Balance of Current Revenue
BDRM Bihar Disaster Risk Management
BHEL Bharat Heavy Electricals Limited
BIADA Bihar Industrial Area Development Authority
BISCICO Bihar State Credit and Investment Corporation
BISWAN Bihar State Wide Area Network
BPSM Bihar Prashashanik Sudhar Mission
BRAIN DC Bihar Revenue and Integrated Data Centre
BREDA Bihar Renewable Energy Development Agency
BSEB Bihar State Electricity Board
BSFC Bihar State Financial Corporation
i

BSHPC Bihar State Hydro Electric Power Corporation
BSIDC Bihar State Industrial Development Corporation
BSLIDC Bihar State Leather Industry Development Corporation
BSSC Bihar State Sugar Corporation
BSTDC Bihar State Tourism Development Corporation
CBR Crude Birth Rate
CCB Central Cooperative Bank
CD Credit Deposit
CDPO Child Development Project Officer
CDR Crude Death Rate
CEA Central Electrical Authority
CEC Continuing Education Centre
CEP Continuing Education Programme
CST Central Sales Tax
CGG Centre for Good Governance
COMFED Cooperative Milk Producers Federation Limited
CPI Consumer Price Index
Cr.PC Criminal Procedure Code
CRF Calamity Relief Fund
CRF Central Road Fund
CSO Central Statistical Organisation
CSS Common Service Centre
DDG Dicentralised Distribution and Generation
DFID Department for International Development
DIC District Industries Centre
DME Directorate of Mass Education
EBC Extremely Backward Caste
ED Electricity Duty
ENT Entry Tax
EOC Emergency Operation Centre
ET Entertainment Tax
FCP Fiscal Correlation Path
ii

FRBMA Fiscal Responsibility and Budget Management Act
G 2 C Government to Citizen
GDDP Gross District Domestic Product
GFD Gross Fiscal Deficit
GP Gram Panchayat
GSDP Gross State Domestic Product
HDI Human Development Index
HLT Hotel Luxury Tax
IAY Indira Awas Yojna
ICD Investment Plus Credit to Deposit
ICDS Integrated Child Development Services
ICICI Industrial Credit and investment Corporation of India
ID Investment : Deposit
IDBI Industrial Development Bank of India
IFCI Infrastructure Finance Corporation of India
IMFL Indian Made Foreign Liquor
IMR Infant Mortality Rate
IPD In-patient Department
IT Information Technology
ITI Industrial Training Institute
IWAI Inland Waterways Authority of India
IWDMS Integrated Work Flow and Document Management Software
JBSY Janani Evam Bal Suraksha Yojna
KCC Kisan Credit Cards
KSY Kisan Samman Yojna
KVK Krishi Vigyan Kendra
LAN Local Area Network
MDMS Mid Day Meal Scheme
MMR Maternal Mortality Rate
MMSNY Mukhya Mantri Setu Nirman Yojna
NABARD National Bank of Agricultural and Rural Development
NCEC Nodal Continuing Education Centre
iii

NDMA National Disaster Management Authority
NDRF National Disaster Relief Fund
NHDP National Highways Development Project
NHM National Horticulture Mission
NHPC National Hydro Power Corporation
NLM National Literacy Mission
NPA Non Performing Assets
NREGS National Rural Employment Guarantee Scheme
NRHM National Rural Health Mission
NSDP Net State Domestic Product
NSSO National Sample Survey Organisation
NTPC National Thermal Power Corporation
OFPPC On Farm Primary Processing Centre
OPD Out Patient Departments
PACS Primary Agricultural Cooperative Societies
PCRDB Primary Cooperative Agricultural and Rural Development Bank
PDS Public Distribution Shop
PGCIL Power Grid Corporation of India Limited
PHC Primary Health Centre
PIM Participatory Irrigation Management
PLF Plant Load Factor
PLP Post Literacy Programme
PMRY Prime Minister’s Rozgar Yojana
PPP Public Private Partnership
PQLI Physical Quality of Life Index
PRD Panchayati Raj Department
PRI Panchayati Raj Institution
PS Panchayat Samiti
QE Quick Estimates
RGGVY Rajeev Gandhi Gramin Vidyutikarn Yojna
RIDF Rural Infrastructure Development Fund
RRB Regional Rural Bank
iv

v
RSVY Rashtriya Sam Vikas Yojna
RUDSETI Rural Development and Self - Training Institution
SAP Special Auxiliary Police
SCA Service Centre Agency
SCARDB State Cooperative Agricultural and Rural Development Bank
SCB Schedule Commercial Bank
SDC State Data Centre
SDRF State Disaster Relief Fund
SFC State Food Corporation
SFC State Finance Commission
SGRY Sampoorna Gramin Rojgar Yojana
SGSY Swarnajayanti Gramin Swarojgar Yojana
SHGs Self Help Groups
SIDBI Small Industries Development Bank of India
SIPB State Investment Promotion Board
SRR Seed Replacement Ratio
SSA Sarva Shiksha Abhiyan
SSI Small Scale Industry
SWAN State Wide Area Network
TFC Twelfth Finance Commission
TINXSYS Tax Information Exchange System
TLC Total Literacy Campaign
UNDP United Nations’ Development Programme
VAT Value Added Tax
VDA Variable Dearness Allowance
VPGCL Vaishali Power Generating Company
VTF Village Task Force
WPI Wholesale Price Index
WPR Work Participation Ratio
WUA Water Users' Association
ZP Zila Parisad

Index of Tables
Table No.
Content Page No.
1.1 Gross State Domestic Product (GSDP) at Factor Cost at Current Prices 2
1.2 Gross State Domestic Product (GSDP) at Factor Cost at Constant (1999-00) Prices
3
1.3 Net State Domestic Product (NSDP) at Factor Cost at Current (1999-00) Prices
4
1.4 Net State Domestic Product (NSDP) at Factor Cost at Constant Prices 5
1.5 Per Capita Net State Domestic Product at Current Prices for Major Indian States
6
1.6 Percentage Distribution of Sectoral Composition of Gross State Domestic Product at Factor Cost at Constant (1999-00) Prices
8
1.7 Yearly Growth Rate of Gross State Domestic Product at Constant (1999-00) Prices
9
1.8 Gross District Domestic Product (GDDP) and Per Capita GDDP in Bihar
10
1.9 Districtwise Consumption of Petroleum Products (2007-08) 11
1.10 Districtwise Small Saving in Post offices and Publics Provident Fund 12
1.11 Wholesale and Consumer Price Indices in Bihar and India 14
1.12 Sanctioned Strength of Different Departments in State Government 16-17
1.13 Working Strength of Different Departments in State Government (In Percentage)
18-19
1.14 Distribution of Departments of the State Government by Percentage of Post Filled Up
20
1.15 Gradewise Sanctioned and Working Strength in Different Departments of State Government
21-22
1.16 Statewide IPC Crime Rate During 2007 25
1.17 Number of IPC Crimes in Bihar (2001-2008) 26
1.18 Overview of Naxal Violence in Bihar 27
1.19 Convictions of Criminals (January 2006 to November, 2008) 28
1.20 Crime against Scheduled Castes & Tribes 29
1.21 Manpower in Jail Administration 34
1.22 Earthquakes in Bihar 38
1.23 Overview of 2002 Floods in Bihar 39
vi

Table No.
Content Page No.
1.24 Overview of 2004 Floods in Bihar 40
1.25 Overview of 2007 Floods in Bihar 41
1.26 Overview of 2008 Floods in Bihar 42
1.27 Overview of Kosi Floods 2008 42
1.28 Highlight of Relief Work for Kosi Floods 44
1.29 Overview of Flood Relief Work in Bihar 44
2.1 Annual Districtwise Rainfall in Bihar 58
2.2 Districtwise Rainfall in Bihar for Different Seassions (2007 and 2008) 59
2.3 Land Utilisation Pattern in Bihar 60
2.4 Area and Production of Major Crops in Bihar (2000-01 to 2003-04) 62-63
2.5 Average Area Production and Yield of Major Crops (for the Period 2002-03 to 2006-07)
64
2.6 Productivity of Major Crops in Bihar (2000-01 to 2007-08) 65
2.7 Area, Production and Yield of Miscellaneous Crops in Bihar (2004-05 to 2007-08)
66
2.8 Districtwise Area, Production and Yield of Major Crops in 2006-07 67
2.9 Advance Estimates of Area, Production and Yield of Major Crops in Bihar for 2008-09
68
2.10 Sourcewise Irrigated Area in Bihar 70
2.11 Distribution of Certified Seeds and Seed Replacement Rate (SRR) for Important Crops in Bihar (2006-07 to 2008-09)
71
2.12 Cosumption of Fertilizer in Bihar (2004-05 to 2007-08) 72
2.13 Minikit Demonstration in Bihar (2006-07 to 2008-09) 73
2.14 Credit Flow to Agricultural Sector in Bihar (2003-04 to 2008-09) 75
2.15 Distribution of Cooperative Credit in Bihar 76
2.16 Distribution of Kisan Credit Cards (KCC) in Bihar 77
2.17 Districtwise Achievement of Kisan Credit Card (KCC) 78
2.18 Extent of Crop Insurance in Bihar 79
2.19 Districtwise Livestock Wealth in Bihar (2003) 81
2.20 Districtwise Breakup of Achievement of Livestock Breading and Health in Bihar (2003)
82
2.21 Financial Requirement for Road Map of Agriculture and Allied Sector in Bihar
87
vii

Table No.
Content Page No.
3.1 Size of Selected Agro-Based Industries in Bihar and India (2004-05) 88
3.2 Large and Medium Industry Units in Bihar (2008-09) 90
3.3 Permanent Registered SSI Units in Bihar 90
3.4 Percentage of Small, Tiny and Artisan-based Industries in Bihar 91
3.5 Area and Production of Vegetables and Fruits in Bihar (2006-07) 92
3.6 Livestock Population in Bihar (2003) 94
3.7 Status of Debt Waiver Scheme for Weavers 96
3.8 Proposed Physical Target during the Eleventh Five Year Plan 98
3.9 Reserve of Important Minerals in Bihar (2005-06) 98
3.10 Physical and Financial Achievement of Udyog Mitra (2004-05 to 2007-08)
100
3.11 Outlay for BSWAN Project ( 2009-10) 103
3.12 Plan Outlay for Information Technology Department (2009-10) 104
3.13 Details of SIPB Approved Proposals (upto December, 2008) 106
3.14 Status of Proposals Approved by SIPB (upto December, 2008) 107
4.1 Ranking of States According to Infrastructure Index 116
4.2 Road Density in Selected States and India 117
4.3 Length of Roads in Bihar (2008) 118
4.4 Number of Vehicles Registered 120
4.5 Revenue Collected by Transport Department 121
4.6 Important Corridors to be Upgraded 122
4.7 Fixed Assets, Turnover and Profit for BRPNN 123
4.8 Expenditure and Income of the Bihar Police Building construction Corporation
125
4.9 Installed Capacity of Power in India and Bihar (2008) 125
4.10 Installed Capacity of Power Station in Bihar 126
4.11 Power from Central Power Stations for Bihar 126
4.12 Consumption of Power in Bihar and India (2005) 127
4.13 Supply-Consumption Pattern of Energy in Bihar 128
4.14 Statement Showing Categorywise Number of Consumers 128
4.15 Energy Requirement : Forecasts 129
4.16 Implementation of Bihar Sub-Transmission Scheme in Phases 130
4.17 Financial Status of Sub-Transmission Scheme (December, 2007) 130
viii

Table No.
Content Page No.
4.18 New Proposed Power Plants 131
4.19 Sourcewise Irrigated Area 133
4.20 Status of AIBP Schemes in Bihar 135
4.21 Details of Expenditure of On-going Projects under AIBP 135
4.22 Potential and Utilisation of Minor Irrigation in Bihar 136
4.23 Progress on Transfer of Maintenance to WUAs 137
4.24 Air Passenger Traffic from Patna (January – December, 2008) 137
4.25 GSM Subscribers in Bihar 138
4.26 Companywise Revenue Collection in Bihar 138
4.27 Postal Facilities in Bihar 139
4.28 Postal Traffic in Bihar 139
4.29 Post Office Accounts in Bihar 140
5.1 Districtwise Literacy Rates in Bihar (2001) 147
5.2 Total Enrolment By Education Levels in Bihar 148
5.3 Dropout Rates at Primary, Upper Primary and Secondary Levels 149
5.4 Expenditure on Education 149
5.5 Districtwise Coverage of MDMS (Class I-V ) (2008-09) 151
5.6 Districtwise Coverage of MDMS (Class VI-VIII) (2008-09) 152
5.7 Fund Utilisation in MDMS 153
5.8 Gorss Enrolment Ratio in Higher Education (18-24 Years) 154
5.9 Percentage of Reserved Seats for Various Social Groups in Universities and Colleges in Bihar
154
5.10 Institutions of Higher Education in Bihar 155
5.11 Coursewise Enrolment is Higher Education in Bihar 155
5.12 Coursewise Enrolment of SC Students in Higher Education in Bihar 156
5.13 Coursewise Enrolment of ST Students in Higher Education in Bihar 157
5.14 Districtwise Demographic Profile of Bihar 159
5.15 Work Participation Rates in Bihar 160
5.16 Status of Health Infrastructure (as on December 2008) 162
5.17 Financial Overview of Health Expenditure 166
5.18 ICDS – Districtwise Projects 167
5.19 ICDS – Number of Projects 167
ix

Table No.
Content Page No.
5.20 ICDS – Staffing Position 167
5.21 ICDS — Resource Utilisation 168
5.22 Districtwise Coverage Achieved for NC and PC Habitations 169
5.23 Poverty Ratios in Bihar and India 170
5.24 SGSY – Physical and Financial Overview (2007-08) 172
5.25 SGSY – Training and Economic Assistance (2007-08) 173
5.26 Employment Generation under NREGS (2007-08) 175
5.27 NREGS – Physical and Financial Overview (2007-08) 176
5.28 Overview of IAY Upto 2007-08 178
5.29 IAY – Physical and Financial Overview - 2007-08 (New + Upgraded + Credit & Subsidy)
179
5.30 Overview of Public Distribution System 181
5.31 Allotment and Lifting of Rice and Wheat under PDS (2007-08) 183
5.32 Demographic Profile of Dalits 185
5.33 District Demographic Overview of Mahadalit Population 186
5.34 Districtwise Composition of Population based on Religion 191
6.1 Distribution of Branches of SCBs in Bihar 209
6.2 Distribution of Branches of SCBs among States (2007-08) 209
6.3 Distribution of Employees of SCBs ( March, 2007) 210
6.4 Number of Branches of RRBs 210
6.5 Number of Branches of State and District Central Cooperative Banks (As on March 31)
211
6.6 Statewise Deposits and Credit of SCBs 212
6.7 Statewise Per Capita Deposits and Credit of Scheduled Commercial Banks
213
6.8 Deposits and Credits of Different Bank Groups by Branch Locations in Bihar (2007-08)
215
6.9 Credit Deposit Ratio in Bihar for All Banks (2007-08) 216
6.10 Credit Deposit Ratio of SCBs 217
6.11 CD Ratio of Different Commercial Banks in Bihar 218
6.12 Districtwise CD Ratios in Bihar 219
6.13 Statewise Distribution of Investments of SCBs 220
6.14 ICD Ratios of Scheduled Commercial Banks 220
x

Table No.
Content Page No.
6.15 CD and ID Ratios of RRBs 221
6.16 Loans Disbursed by RRBs 222
6.17 Sectoral Share in the Credit of Scheduled Commercial Banks in Bihar 222
6.18 Outstanding Agricultural Advances 223
6.19 ACP Achievement - All Banks 224
6.20 Agencywise Analysis of ACP Achievement (March 2008) 224
6.21 Sectoral Share of Advances (2006-07) 225
6.22 Selected Indicators on Primary Agricultural Credit Societies (March 31, 2007)
225
6.23 Working Results of State Cooperative Banks 226
6.24 Working Results of SCARDBs (end March) 227
6.25 Number of Kisan Credit Card Issued by Banks 228
6.26 Cumulative Disbursements under RIDF till March 2008 229
6.27 Sectorwise Refinancing by NABARD in Bihar 230
6.28 Sanctions and Disbursements in Bihar under RIDF till March, 2008 231
6.29 Microfinancing in Bihar 232
6.30 Microfinancing by RRBs (2007-08) 232
6.31 Target and Achievement under PMRY 233
6.32 Performance of Banks Under SGSY: Individuals 234
6.33 Performance of Banks Under SGSY (SHGs) 234
7.1 Receipts and Expenditure of the Bihar Government 243
7.2 Major Fiscal Indicators 246-247
7.3 Fiscal and Financial Performance Indicators 253
7.4 Deficit/Surplus position of States 254
7.5 Gross Fiscal Deficit 255
7.6 Decomposition of Gross Fiscal Deficit of Bihar 256
7.7 Financing of Gross Fiscal Deficit of Bihar 257
7.8 Revenue Account of Bihar 258
7.9 Expenditure of Bihar Government 259
7.10 Interest Payment and Receipt 261
7.11 Cash Balance of Bihar 261
7.12 Other Parameters of Expenditure 262
xi

Table No.
Content Page No.
7.13 Transfer of Resources from Centre to Bihar 263
7.14 Outstanding Liabilities 263
7.15 Net Debt Received 264
7.16 Repayment Liabilities 264
7.17 Targets and Achievement under Fiscal Correction path (2007-08) 266
7.18 Revenue Receipts of the State 268
7.19 Tax Revenue of Bihar Government 268
7.20 Composition of Tax Revenue of Bihar Government 269
7.21 Growth of Tax Revenue of Bihar Government 269
7.22 Structure of Taxation in Bihar 270
7.23 Major Non-Tax Revenues of Bihar 271
7.24 Composition of Non-Tax Revenues of Bihar 272
7.25 Variation between the Estimated and Actual Realisation of Tax and Non-Tax Revenue (2007-08)
273
7.26 Cost of Collection of Taxes 274
7.27 Tax and Non-tax Revenue as Percentage of GSDP 275
7.28 Tax : GSDP Ratio of States (2007-08) 275
7.29 Buoyancy of Important Tax and Non-Tax Revenue Sources 276
7.30 Grants and Contributions from the Central Government 276
7.30 A Comparative Commoditywise Collection of Sales Tax 277-278
7.31 Actwwise Comparative Collection (2003-04 to 2008-09) 279
7.32 Yearwise Percentage share of Commercial Taxes in Total Revenue 279
7.33 Revenue from Excise 281
7.34 Revenue from Stamp Duty and Registration Fees 282
7.35 Districtwise Revenue from Stamp Duty and Registration Fees 283
7.36 Expenditure from Consolidated Fund 284
7.37 Structure of Expenditure from the Consolidated Fund 285
7.38 Growth of Expenditure from Consolidated Fund 286
7.39 Expenditure on Repair and Maintenance of Buildings, Roads and Bridges and Irrigation Facilities
287
7.40 Revenue Expenditure 288
7.41 Expenditure on Salaries and Pensions 289
7.42 Quality Parameters of Expenditure 291
7.43 Expenditure on Social Services 292
xii

xiii
Table No.
Content Page No.
7.44 Achievements against TFC Projections in respect of Non-Plan Revenue Expenditure
293
7.45 Expenditure on Economic Services 294
7.46 Per Capita Expenditure on Social and Economic Services 295
7.47 Summary of Budget, 2008-09 (Surplus -, Deficit +) 298
7.48 Structure of Receipts and Expenditure of Consolidated Fund (%) 299
7.49 Details of Central Funds Bypassing the State Budget 2006-07 and 2007-08
301
7.50 Districtwise Expenditure (2007-08) 303
7.51 Districtwise Per Capita Expenditure (2007-08) 304
7.52 Financial Performance under SSA 305
7.53 Financial Performance of : Schemes under DRDA (2007-08) 306
7.54 Sectorwise State Government Companies and Corporations 307
7.55 Consolidated Financial Results of Public Sector in Bihar, 2005-06 and 2006-07
307
7.56 Financial Results of BSEB 308
7.57 Summarised Results of Public Sector in Bihar as per Their Latest Accounts
310-311
7.58 Government Revenue Expenditure on Education and Health 312
7.59 Per capita Expenditure on Social Sectors (Rs), 2007-08 313
7.60 District wise expenditure on Some Other Social Sectors during 2007-2008 (Rs.Crore)
317
7.61 Districtwise Per Capita Expenditure during 2007-08 (Rupees) 318
7.62 Per Capita Minimum and Maximum District Expenditure during (2007-08)
320
7.63 Financial Assistance to PRIs and ULBs 321
7.64 Receipts and Expenditure of PRIs till 2005-06 321
7.65 Summary of Total Works executed by PRIs till 2005-06 322
7.66 Grants for 12 Zila Parishads : 1996-97 to 2005-06 324
7.67 Grants for 65 Panchayat Samities: 2001-02 to 2005-06 (Rs Crore) 325
7.68 Grants for 195 Gram Panchayats : 2001-02 to 2005-06 (Rs Crore) 325

EXECUTIVE SUMMARY
Macro Overview
1. The medium term growth rate of NSDP at constant prices, during the period 1999-00 to
2008-09, is estimated to be 5.57 percent. Although this growth rate is lower than the national
gowth rate of about 6-7 percent, it indicates an improved growth performance compared to
the recent past when the state economy managed to grow at barely 3-4 percent. The per
capita NSDP of Bihar has grown at 3.61 percent. The growth rate for NSDP at constant
prices has been very good for at least three sectors — Construction (21.53 percent),
Communications (16.01 percent) and Trade, Hotels and Restaurants (12.08 percent).
Agriculture, because of two consecutive severe floods, has grown at a slower rate of only
1.38 percent.
2. Bihar suffers not only from its comparatively lower trend growth rates, but from substantial
year-to-year variation in growth rates as well. During the past decade, the growth rate has
varied between (-) 21.92 to 37.22 percent in Primary sectors; between (-)2.26 to 22.80
percent in Secondary sectors; and between 2.03 to 18.44 percent in Tertiary sectors. For the
aggregate GSDP, the yearly growth rate varies from (-) 4.73 percent to 11.31 percent.
3. Bihar like most other states also suffers from regional disparities within the State. In the
ranking of the districts with respect to Per Capita GDDP, Patna appears at the top with a
figure of Rs. 29,482.
4. In 2007-08 and first eight months of 2008-09, it is observed that Consumer Price Index for
industrial labourers has increased more in Bihar than in the country as whole. For urban non-
manual employees (for which indices for 2008-09 are not available), one again notices that
CPI in Bihar has been rising faster than in the country as a whole. However, in the rural
areas, the CPI has been increasing at a slower pace in Bihar.
5. In the last three years, there has been a paradigm shift in the quality of governance. There is
a concerted effort to make the work atmosphere congenial to both staff and as well as
visitors. To understand the travails and trauma of the people, the Chief Minister has started
the innovative practice of direct feedback by organizing the weekly ‘Janta Ke Darbar Me
Mukhyamantri’. After completion of the three year tenure of the present government, the
Chief Minister has also started 'Vikash Yatra' in select districts to understand the impact of
governance in rural Bihar.
xiv

6. The Bihar Prashasnik Sudhar Mission (BPSM) is an initiative of the State Government to
strengthen its administrative machinery. This mission will encompass the entire state, from
the state capital to the districts. The BPSM was launched by the Chief Minister on
November, 2008. The Mission enables the state government to deliver better quality services
to all its citizens, particularly the poorest and the excluded.
7. Among all States and union territories, Bihar with a crime rate of 118 stood at 28th position
in the country. There has been a decline in major crimes including murder (-3.2 percent),
dacoity (-10.10 percent), robbery (-4.99 percent), kidnapping for ransom (-23 percent), bank
robbery (-15.03 percent), etc. during the period 2001-08. There has been a sharp decline of
around 50 percent or more in the cases of dacoity, kidnapping, road dacoity and bank
robbery in 2008 over 2001. Most of the districts reported a drop in murder.
8. There has also been an appreciable drop in the major cases of extremism in the state over the
last 3-4 years. As against 382 cases reported in 2004, only 79 cases have been reported in
2008. The drop in the number of cases is largely due to holistic development programme. 'Ap
Ki Sarkar Ap Ke Dwar' (government at your door step) programme. Apart from social
cooption, the security apparatus of the state administration was strengthened by deployment
of para-military and special training to police personnel.
9. The IPC cases against women at the national level have recorded an increase of 7.4 percent
during the five year period (2002-2006). During 2007, Bihar's rank was 28th among the
major states, with the rate of total cognizable crimes at 8.1 percent in the state. Due to State
initiatives, the crimes against scheduled castes has declined from 9.3 percent in 2006 to 7.5
percent in 2007. Similarly, a drop in crime from 1.2 percent to 1.0 percent has also been
recorded in the case of tribal population
10. In order to have an effective control over corruption in the state, the Bihar Vigilance
Investigation Bureau is functioning in heightened manner. Through vigorous publicity of
mobile phone numbers, the Bureau could catch hold of a number of corrupt public servants.
During 1995-2005, a total of only 47 trap cases were registered. In 2007, there were 108 trap
cases and 126 arrests, and in 2008 (upto November), the numbers were 78 and 92
respectively.
xv

Agriculture and Allied Sectors
1. During the period 2000-01 to 2005-06, the share of land under tree crops increased from
2.47 to 2.57 percent, which implies that an additional 10 thousand hectares of land is under
the trees. It is most likely that the fallow land is being gradually converted into tree-bearing
land, because of which the share of fallow land in total geographical area has recorded a
small decline. That the soil of Bihar is very fertile is revealed by the high share of net sown
area in the total geographical area (60 percent). There has not been any change in the share
of net sown area in the recent years, but the gross sown area has increased much during the
period and the cropping intensity for the agricultural economy now stands at 2.06. This
implies that, on an average, every piece of agricultural land is double-cropped in Bihar.
2. Taking the five-year period of 2003-04 to 2007-08, the average levels of production of major
crops in Bihar are — 43.7 lakh tonnes (rice), 36.0 lakh tonnes (wheat), and 14.9 lakh tonnes
(maize). Adding to this, the production of other cereals (which are all considered as coarse
cereals), the total production of cereals is 95.4 lakh tonnes. Further, taking into consideration
the total production of pulses at 4.9 lakh tonnes, the total production of foodgrains is 100.3
lakh tonnes, for a population of about 99.0 million.
3. Nearly 95 percent of the area under major crops is devoted to foodgrains. Within that
category, the share of cereals production has been increasing — it was 87.21 percent in
2000-01 to 94.20 percent in 2007-08. Consequently, the share of area under pulses has
decreased from 8.77 percent in 2000-01 to only 1.42 percent in 2006-07.
4. For rice, the average productivity is 1287 kgs/hectare, although for aghani rice (the most
important among three rice varieties), the productivity is a little higher at 1327 kgs/ hectare.
The productivity of wheat is higher and stands at 1749 kgs/ hectare. The most satisfactory
levels of productivity is attained by maize (2367 kgs/ hectare) and here again rabi maize (the
most important among the three varieties of maize) has an even higher productivity at 3030
kgs/hectare. For the pulses, the productivity of kharif pulses (929 kgs/hectare) is found be
higher than the productivity of rabi pulses (738 kgs/hectare).
5. Among the remaining miscellaneous crops grown of farmers in Bihar, those which are
important under the category of vegetables include potato, cauliflower, tomato and
brinjal. The production level of these vegetables in 2006-07 were — 11.8 lakh tonnes
(potato), 10.1 lakh tonnes (cauliflower), 9.2 lakh tonnes (tomato) and 11.2 lakh tonnes
(brinjal). The category of fruits also include a number of species, but the four most important
xvi

ones are — mango, litchi, guava and banana. The production levels of these fruits in 2006-07
were — 13.1 lakh tonnes (mango), 2.1 lakh tonnes (litchi), 2.5 lakh tonnes (guava) and 11.3
lakh tonnes (banana).
6. The top five districts in terms of rice production are Nalanda (2.3 lakh tonnes), Bhojpur (2.3
lakh tonnes), Rohtas (4.7 lakh tonnes), Bhabhua (3.1 lakh tonnes) and Aurangabad (4.4 lakh
tonnes). The top five districts in terms of productivity are — Bhojpur (2654 kgs/hectare),
Nalanda (2382 kgs/ hectare), Aurangabad (2598 kgs/ hectare), Sheikhpura (2399
kgs/hectare) and Banka (2595 kgs/hectare). The highest and the lowest levels of productivity
in the districts is very large for all the crops — rice, wheat and maize. For rice, the two
extreme levels of productivity are 2808 kgs/hectare (Bhabhua) and 522 kgs/hectare
(Sheohar). Similarly, for wheat, the two extreme levels of productivity are 2789 kgs/hectare
(Samastipur) and 698 kgs/hectare (Araria). Finally, for maize, the two extreme levels of
productivity are 4108 kgs/hectare (Khagaria) and 115 kgs/hectare (Jamui). because of the
devastating floods in the Kosi region of Bihar, the state is expected to face a considerable
loss of crop production in 2008-09. These losses are expected for all the crops for which
advanced estimates are available, except aghani rice and jowar.
7. The Seed Replacement Rate (SRR) is one of the lowest in Bihar Among the important kharif
crops, the SRR for paddy in 2008-09 was 19.0 percent, compared to only 12.0 percent in
2006-07. In case of kharif maize, there has been a modest increase in SRR from 50.0 percent
in 2006-07 to 57.0 percent in 2008-09. Among the important rabi crops, the SRR is available
only for 2006-07 and 2007-08. Between these two years, the SRR for two crops has gone up
substantially — maize (from 60.0 to 74.0 percent) and rape/mustard (from 40.0 to 73.0
percent).
9. The consumption of chemical fertiliser in Bihar has been rising steadily in recent years. Over
a four-year period, consumption has increased by 62.2 percent which shows the eagerness of
the farmers in Bihar to utilize this valuable input. The per hectare consumption of fertiliser
stands at 155.60 kgs. in 2007-08. Between the two important crop seasons, the use of
fertiliser is higher in rabi season (195.80 kgs/ha) which is more than one and a half times the
consumption in kharif season (120.10 kgs/ha). Among the different types of fertilisers, the
use of urea is the widest, as it alone accounts for about half the fertilisers consumption.
10. Mainly because of limited staff strength of the concerned department, the extension services
for agricultural development has been rather limited in Bihar. Among the extension services
xvii

that the state government is presently providing at a large scale is the Minikit
Demonstrations for important crops. In kharif season, such demonstrations were only 27.3
thousand in 2006-07, but it has increased to 85.6 thousand in 2008-09. Similarly, for rabi
season, such demonstrations were 17.7 thousand in 2006-07, which has increased to 43.8
thousand next year.
11. Among the three principal sources of credit, the commercial banks are most important,
which account for about 65 percent of the total credit disbursement; the shares of regional
rural banks and central cooperative banks are about 25 and 10 percent respectively. Since the
commercial banks are the most important source of credit, it is a matter of concern that the
achievement rates for these banks have also shown a declining trend. In 2007-08, the
achievement rate for the three types of banks were — 81.47 percent (commercial banks),
75.80 percent (regional rural banks) and 57.42 percent (central commercial banks). The
cooperative banks presently account for only 10 percent of the agricultural credit in Bihar.
One of the main reason for such limited reach of cooperative banks is that such banks are
absent in no less than 16 districts of Bihar
12. As regards, the scheme for Kisan Credit Card (KCC), as on September, 2008, there were
20.88 lakh farmers in Bihar who were issued KCCs. Compared to the target of 44.60 lakh
farmers, the achievement rate for KCC is only 46.81 percent. There is not much difference
among the achievement rates for three sources of credit — commercial banks (48.24
percent), regional rural banks (47.49 percent) and central commercial banks (44.40 percent).
13. By the end of 2007-08, there were only 9.13 lakh farmers who were able to insure their
crops. By a broad calculation, this implies a coverage of less than 10 percent of the farmers
under crop insurance. However, over the years, the practice of crop insurance is increasing in
the state. Among the districts where more than 50 thousand farmers avail crop insurance are
included — Patna, Nalanda, Muzaffarpur, East Champaran, Sitamarhi, Samastipur and
Begusarai.
14. The total livestock population in the state, according to Census 2003, is 407.83 lakh. Of this,
39.8 percent are milch animals with population of cows being 104.7 lakhs, and that of
buffaloes being 57.66 lakhs. The state also has a substantive number of goats (96.06 lakhs).
The strength of poultry in the state is quite large at 139.68 lakhs. With such a huge livestock
wealth, there is abundant growth potential of livestock products in the state. There is
considerable variation in the districtwise endowment of livestock wealth. To strengthen the
xviii

animal husbandry sector in Bihar, the concerned department of the state government
provides a number of useful services like breeding, sterilisation, immunization and free
distribution of fooder seeds.
15. The state government has prepared a Road Map of Agriculture and Allied Sectors in Bihar
which identifies a number of development interventions during the period of 2008-12. The
Road Map has identified a number of programmes that together cover all aspect of
agriculture and its allied sectors.
Industry and Allied Sectors
1. The Net State Domestic Product (NSDP) at current prices for the present Bihar in 2007-08
was Rs. 94,489 crore, of which manufacturing sector accounted for only Rs. 4,664 crore
(5.16 percent). There are practically no mineral based industries left in Bihar and the agro-
based industries including textiles, leather, wood and paper accounted for nearly 43 percent
of the gross value added. The share of gross value added of petroleum and atomic fuel, was
around 48 percent. Bihar constituted a very nominal share of 0.48 percent in the total
production of agro-based industries at the all-India level.
2. Of the total of 263 large and medium industrial units, the highest concentration (38 percent)
is in Patna division with Tirhut division ranking a distant second (22.5 percent). Magadh and
Darbhanga divisions have only 9.5 percent and 7.3 percent respectively as their share. The
Kosi division, however, does not report any large or medium industries. Out of 38 districts in
the state, as many as 10 districts do not have any large/ medium industrial unit and in another
11 districts, there are only less than 5 units in each.
3. The industrial sector of present Bihar is characterised not only by the small size units, but
also by the predominance of unregistered units which account for one-third of the total units.
The small industries sector is dominated by tiny and artisan-based units. Although not highly
productive, the small scale, tiny and artisan-based industries play a crucial role in providing
employment opportunities outside agriculture. As on December, 2008, there were 1,74,278
permanent registered units in Bihar, which consisted of 1502 small scale units, 1,02,676 tiny
units and 70,100 artisan-based units. The total investment in these units was to the tune of
Rs. 1,017.62 crore and it provided employment to 5.68 lakh workers.
4. The pattern of concentration of small, tiny and artisan-based industries remained similar to
large/ medium units. The highest concentration of these units was in Tirhut division (20
xix

percent), followed by Patna (17.4 percent). Magadh and Purnea divisions reported around 10
percent share each, with Bhagalpur (4.9 percent) and Kosi (5.8 percent) reporting the least
share.
5. Among the agro-based industries, along with the fruits and vegetables, milk and eggs are
very important for employment generation. The efforts are also continuing to expand
horticulture in Bihar through the National Horticulture Mission, launched by the central
government in half of its districts. The Chief Minister's Horticulture Mission has been
launched in the remaining 19 districts which were not covered under the National
Horticulture Mission.
6. The food processing industry has a great potential in the state. It may generate additional
employment to atleast 5 lakh persons. Besides processing of cereals, great potential remains
to be tapped in fruits and vegetables. In view of huge potential for development of food
processing industry in Bihar, the Industries Department has planned a Rs. 1760 crore project
for development of food processing infrastructure and other facilities in the state.
7. The sugar has a significant position in the agro-based industry of the state. It generates
employment in the farm sector, directly as well as through ancillaries and related activities.
An estimated 5 lakh farmers are engaged in the cultivation of sugarcane and another half a
lakh skilled and unskilled persons in sugar industries. The objectives during the Eleventh
Plan are to enhance the sugarcane production by augmenting the area under cultivation as
also its productivity. The long term goal is to gradually increase its area to 4.6 lakh hectares.
8. The handloom industry is primarily concentrated in the districts of Patna, Gaya, Bhagalpur,
Banka, Darbhanga, Arwal, Jehanabad, Aurangabad, Nawada, Nalanda, Bhabua, Khagaria,
Madhubani and Siwan. There are around 1071 weavers' cooperative societies in the state,
with 10,817 handlooms. Besides, 23,503 handlooms exist outside the cooperative sector.
Around 1.33 lakh weavers are engaged in this sector, of which nearly a lakh are outside the
cooperative sector. The state government has introduced welfare schemes for weavers in the
form of marketing assistance, modernisation of training centres and repair of shed-cum-
housing.
9. Bihar had 12 support institutions. Out of these, BSFC and BISCICO, the two financial
support institutions are in the process of revival. The revival of BSIDC has also been
initiated. Similarly, the reorganisation of Udyog Mitra is on anvil. BIADA is responsible for
xx

providing developed infrastructure in industrial estates like water, roads, drainage,
electricity, etc. It also provides information and assistance to prospective entrepreneurs to set
up industry.
10. A beginning has been made in the state to exploit the great potential in the field of
Information and Communication Technology (ICT) with a view to expand knowledge base
and employment in various sectors of the economy. Video-conferencing in all the 38 districts
has already been in operation. Computerisation of treasury, finance, provident fund, tax
collection, electricity bills, registration of properties, e-governance, etc. is planned on a
public-private partnership basis with Beltron as an important player.
11. In 2008-09 (upto December, 2008), the cumulative total of proposals approved by the State
Industrial Promotion Board (SIPB) has gone upto 164 with an aggregate investment of Rs.
91.75 thousand crore and employment potential of 1.23 lakh persons. Out of 164 approved
proposals, 15 proposals have already been implemented and are working, one is ready for
production, and as many as 49 with a total investment of Rs. 22.91 thousand crore are in the
advanced stage of implementation. The remaining 99 proposals are, however, under different
stages of implementation.
12. The State Tourism Development Corporation (STDC) has taken a number of measurers to
develop tourism. With improvement in law and order as well as infrastructural facilities at
various tourist destinations, the number of both foreign and domestic tourists has recorded an
increase from 69.44 lakh in 2005 to 107.65 lakh in 2006 and to 105.30 lakh in 2007.
Physical Infrastructure
1. The existing low level of infrastructure facilities are the major bottleneck in accelerating the
process of development in the state. In pursuance of the Bihar Infrastructure Development
Enabling Act, the state government has already begun to explore and introduce the option of
Public-Private Partnership (PPP) in some sectors and is planning to expand these initiatives.
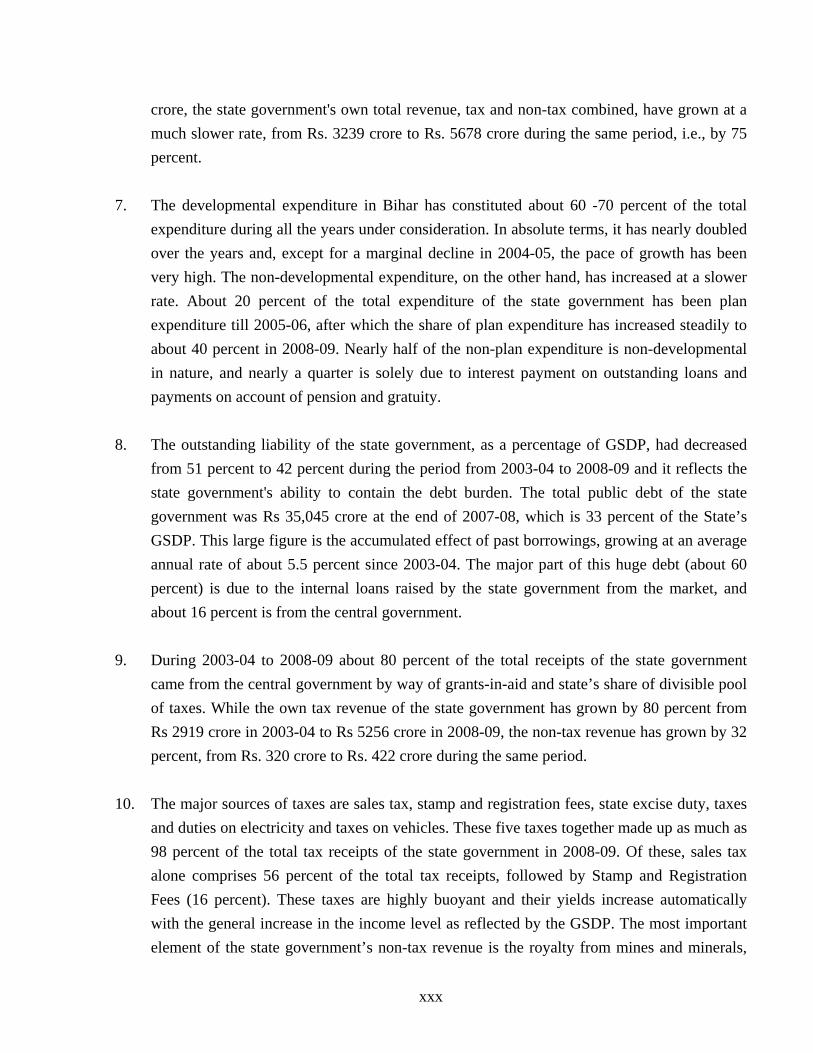
2. Being a densely populated state, the road density per lakh population in Bihar stands at only
111 kms.; while for the country as a whole this density is more than three times (360 kms.).
The proportion of the villages connected through roads is only 57 percent as against 62
percent for all-India and 99 percent for Gujarat. In Bihar, the total road length in 2008 was
82,959 kms. which constituted National Highways (4.50 percent), State Highways (4.81
percent), Major District Roads (9.83 percent), Other District Roads (4.60 percent) and
xxi

Village Roads (76.26 percent). However, part of the roads under the last two categories are
unpaved. There is vast inter-district variation in terms of the road length in the state. During
the Eleventh Five year Plan, besides the national highways, the state highways and major
district roads are also to be upgraded.
3. The number of motor vehicles in Bihar has increased by 239 percent in 2007. This is
indicative of the fact that the increase in road network was not commensurate with the
increase in transport in the state. Keeping in view the phenomenal increase in the motor
vehicles, all the important corridors in the state are to be upgraded to four lanes under
NHDP.
4. Presently, there are 1055 bridges, small and big, on the state highways and 3049 on the
major district roads. For maintaining the connectivity, there is a need of a bridge at a
distance of every 50 kms. on of the important rivers in the state. Besides, bridges are
proposed to be constructed on smaller rivers too. There is a target to complete 1844 schemes
during the year 2008-09, under the Mukhya Mantri Setu Nirman Yojana.
5. Practically, airways in Bihar are yet to develop. Patna, being the capital of the state, is on the
air route from Delhi to Kolkata. It is also connected with Mumbai by air. Regular air services
from Patna are also available for Ranchi and Lucknow. Among the districts, Gaya has also
an international airport. Besides Indian Airlines, Jetlite, Kingfisher and Jet Airways also
operate from Patna airport.
6. In the field of telecommunication, there are various players — BSNL, Reliance, Bharti
Airtel, ABTL (IDEA), Vodaphone Essar and Dishnet wireless. The total number of GSM
subscribers in November 2008 registered a phenomenal increase to 1.24 crore, compared to
only 9.70 lakh subscribers in 2004-05. Among different operators, Bharati Airtel reported
the highest number of subscribers (64.19 lakh).
7. Post offices have been playing the role of providing connectivity to the remotest places in
rural areas. Upto March, 2008, there were as many as 9,057 post offices in the state, of
which around 95 percent were in rural areas. But the rural areas were mostly serviced by
extra-departmental post offices (92 percent). Nearly all the post offices, either departmental
or extra departmental, were granted permanent status.
xxii

8. There is severe power shortage in the state and only 41 percent of its villages and 10 percent
of the households are electrified. The peak availability is about 950 MW, causing a peak
shortfall of 550 MW, which results in widespread shortage in supply to all categories of
consumers. Bihar has only 592 MW of installed capacity, of which 540 MW is thermal and
the remaining 47 MW is hydel and 5 MW is renewable energy. However, generation from its
own thermal power stations is negligible, and most of the power requirement is met by
purchases from the central generating plants. The annual per capita consumption of
electricity in Bihar is only 76 units. There still remains a substantial energy shortage in the
state. In 2006-07, the shortage was 1049 MU (15.31 percent) and it stepped upto 1471 MU
(11.50 percent) in the next year.
9. Bihar has a total irrigation capacity of 98.38 lakh hectares, of which 53.53 lakh hectares are
under major and medium irrigation and 49.56 lakh hectares are under minor irrigation. While
more than half the area gets irrigation through minor sources, around 98 percent of minor
irrigation is through tubewells. Since state tubewells are less in number, it is the private
tubewells which are very important as an irrigation source in Bihar. In 2006-07, 5130 state
tubewells were in operation, out of a total of 5556 state tubewells. Again, out of a total of
10.97 lakh private tubewells, 9.55 lakh were operational. The area under major/medium
sources of irrigation has fluctuated much over the years. Among the different components of
minor irrigation, it is the area irrigated thorough tubewells that has registered a steady
increase over the years.
10. To meet the irrigation needs, about 1.65 thousand hectare of additional potential will be
created and 4 lakh hectares of lost potential will be restored through minor irrigation
schemes. Such schemes will also include rennovation and restoration of Ahars and Pynes.
Under the Bharat Nirman Programme, the irrigation potential of 80 thousand hectares will be
added by completing surface schemes under RIDF (Phase XII). The state government has
made significant progress in transferring the operation, maintenance and upkeep of 32
distributaries to Water Users Associations (WUAs), involving 1,10,549 hectares of
command area. The overall strategy is to decentralise the delivery system of all the irrigation
system to the WUAs by the end of the Eleventh Plan period.
Social Sectors
1. Bihar has been at the lowest position among the major states in India in 1981, 1991 and
2001. The same pattern is replete in its ranking with respect to Per Capita Income. In Bihar,
the twin challenges of economic growth and human development are further accentuated by
xxiii

its high poverty ratios and low per capita income. However, the rate of decline of poverty
has been higher in Bihar compared to the national average.
2. The overall literacy rate in India in 2001 was 65.4 percent while in Bihar it was 47.0 percent.
The female literacy rate in Bihar in 2001 was much lower at 33.6 percent, as against a
national average of 54.2 percent. Bhojpur and Rohtas are relatively high on the literacy
indicator with literacy rates at 59.0 and 61.3 percent respectively. However, the female
literacy rates in the two districts are 41.8 percent and 45.7 percent respectively. Patna is the
only district in Bihar where 50 percent of the female population is literate. In Kishanganj,
less than 20 percent of the women are literate. The male literacy rate is also the lowest in
Kishanganj.
3. The overall enrolment at the primary and upper primary level has increased by 34.5 percent.
There has been a 41.5 percent increase in enrolment of children from SC communities and
80.7 percent increase for ST communities. The enrolment has significantly improved in
upper primary level with an overall increase of 72.8 percent. For SCs, the enrolment in upper
primary has increased by 97.4 percent while, for STs, it has increased by 126.0 percent.
4. The dropout rates in Bihar in primary education level have declined by 5 percentage points
between 2004-05 and 2005-06. The decline has been higher in the case of boys, as compared
to girls. However, at upper primary level, there was a very modest decline by just 1
percentage point. At the secondary level, the position has deteriorated with a marginal
increase of dropout rate by 0.01 percent.
5. With a Gross Enrolment Ratio (GER) in higher education at 6.71 percent in Bihar, it is well
below the national average of 9.21 percent. While male GER is close to the national average,
there is a huge gap once again in female GER between Bihar (3.50 percent) and the national
average (7.65 percent).
6. Though there are 12 universities, one open university and 504 colleges and institutes in
Bihar for higher education, it still lags behind in the number of medical colleges (23) and
engineering and technical colleges (7). The enrolment of female SC students, among all
female students in general streams like arts, science and commerce, is low at 5-6 percent; for
males, it is much higher at 11-15 percent. In medicine and engineering, however, the
enrolments are the same for male and female SC students. Among ST students, male and
xxiv

female enrolment in percentage terms are almost equal in all courses measured within the
same population cohorts.
7. Of Bihar’s total population, 89.5 per cent live in rural area, making the state the least
urbanized. Patna is the most urbanized district with a rural population of 58.4 percent.
Munger comes next at 72.1 percent. All other districts have a rural population of over 80
percent, with 7 districts having a rural population of over 95 percent. The sex ratio in Bihar
at 919 females per thousand males is slightly lower than the national ratio at 933. The total
share of SC in the population is 15.7 percent.
8. The average rate of work participation is 32.9 percent for Bihar. Saran, Siwan, Vaishali,
Buxar, Munger, Bhojpur and Gopalganj have Work Participation Ratio (WPR) below 30
percent. The WPR is higher than 40 percent in Supaul, Jamui and Madhepura and higher
than 35 percent in another 14 districts. The gender gap is stark with the female WPR for the
state at 18.4 percent while the male WPR is 46.3 percent.
9. Vaccination coverage increased in Bihar between 1998-99 and 2004-05, from 12 percent to
33 percent while there was only a 2 percent increase in the national average in the same
period. Infant mortality in Bihar decreased from 72 to 68 per 1000 live births in the same
period. This was mainly attributable to rise in institutional deliveries from 15 to 22 percent in
the same period.
10. There are 11,107 health centres of all types in Bihar. For every lakh of population, there are
13 health centres. There are wide variations in coverage at the district level. While Khagaria
has 153 health centres and Gopalganj has 89 centres for every lakh of population, Nawada
has only 8. Apart from Goplaganj and Khagaria, no district has more than 19 centres for
every lakh of population. While 28 districts have atleast one rural referral hospital, the
remaining 10 have none. The total number of referral hospitals in the state is 70.
11. There are 4643 regular and 2369 contractual posts sanctioned for doctors in the state. At
present, 58.4 percent of the regular and 58.8 percent of the contractual posts have been filled
up. There are 5 doctors in position and working for every lakh of population in the state.
There are districtwise differences in availability of doctors. While 49 doctors are available
per lakh of population in Khagaria and 38 in Gopalganj, there is only 1 doctor available per
lakh population in Arwal. There are only 2 Grade A staff nurses in position and working for
every lakh of population. For such nurses, 57.1 percent of the regular 26.4 percent of the
xxv

contractual posts have been filled up. The same pattern is replete in the availability of
ANMs. There are 16 ANMs working for every lakh of population in the state.
12. The incidence of rural poverty in Bihar has come down from a level of 64.4 percent in 1983-
84 to 45.7 percent in 2004-05. Urban poverty has declined from 47.3 percent to 34.6 percent
during the same period. Nevertheless, the poverty ratio for 2004-05 is still quite high
compared to the corresponding ratios at the national level — rural (28.3 percent) and urban
(25.7 percent).
13. SGSY is a scheme to promote self-employment among the communities through SHGs as
well as individual self-employment programmes. A total of 14,036 SHGs were formed in
2007-08 under SGSY compared to 8324 in the pervious year. In 2007-08, a total of 85,355
swarojgari members of SHGs and 18,205 individual swarojgaris were given assistance for
economic activities under SGSY. Likewise NREGS is a demand based guaranteed
employment programme. The job cards were issued to 81,24,997 households in 2007-08
under this programme. Only 1.3 percent (49,945 households) of total number of households
were provided with 100 days of employment in 2007-08. The Indira Awas Yojana is an
important intervention for affordable housing for people below the poverty line.
14. The Public Distribution System (PDS) for essential commodities has been an important part
of the measures to promote food security in the state. Under Antyodaya, BPL families are
provided foodgrains at the very nominal price; whereas, Annapurna provides homeless
senior citizens with free foodgrains.
15. New initiatives through the Bihar Mahadalit Development Mission have been taken to
benefit the extremely deprived Mahadalits among the Dalits. Similarly, a Mukhya Mantri
Nari Shakti Yojana is being implemented to sensitise, empower and assist women to lead a
life based on self-respect and confidence through strengthening their economic states. The
necessary welfare measures are also being taken up for the overall development of the
backwards, extremely backwards and minorities of the state.
Banking and Allied Sectors
1. There are three kinds of financial institutions functioning in the state: (i) Scheduled
Commercial Banks (SCB), (ii) Regional Rural Banks (RRB) and (iii) Cooperative Banks
their numbers being 3769, 1465 and 293 respectively.
xxvi

2. While there has been significant growth in total deposits in Bihar in 2007-08 over the
previous year by Rs 11,681 crore, the credit expanded by only Rs 3,712 crore. But Bihar’s
share in the total credit of scheduled commercial banks has remained practically the same at
0.9 percent over the years. In terms of both per capita deposit and credit, Bihar ranks the
lowest among the major Indian states. While the per capita deposit of Bihar has increased
significantly in 2007-08, the increase in per capita credit has not been appreciable.
3. The CD ratio of Bihar currently stands at 32.35 percent, far below the national average of
72.4 percent, and way behind the CD ratios of states like Maharastra (102.2 percent),
Rajasthan (82 percent), West Bengal (62.6 percent) and Madhya Pradesh (61.4 percent). In
absolute terms, it means that if the current CD ratio of about 32 percent in the state were to
increase to the national level of around 72 percent, investments in the state would go up by
Rs. 27,000 crore, which is more than the current annual plan outlay of the state and would
provide the much-needed impetus to economic activities. The poor CD ratio of the state can
be attributed to a number of factors such as poor credit absorption capacity, poor basic
infrastructure, apart from higher incidence of NPA (Non Performing Assets) accounts.
4. Among the Lead Banks, UCO Bank has the highest CD ratio of nearly 38.78 percent, down
from 41.21 percent in the previous year. Among others, Syndicate Bank has the highest CD
ratio of nearly 53.80 percent. For some banks, the CD ratios were very low, like the
Corporation Bank (6.95 percent) or the Indian Overseas Bank (12.05 percent).
5. During 2007-08, the CD ratios across the districts showed wide variations, from 20.66
percent in Siwan to 48.99 percent in neighbouring West Champaran to 55.59 percent in
Katihar. It is less than 25 percent in Bhojpur, Lakhisarai, Munger, Saran and Siwan. It is
above 50 percent in Araria, Katihar, Kishanganj, Purnea and West Champaran. However, the
high CD ratios in many districts are related to high accumulated interests on previous loans.
6. The total involvement of the banks in the economic activities of a state is truly reflected not
by the Credit-Deposit ratios alone, but by the Investment plus Credit to Deposit (ICD) ratios.
As of March 2007, Bihar had an ICD ratio of 57.9 percent, compared to its CD ratio of 32.35
percent. Nevertheless, even the ICD ratio of Bihar is much lower as compared to that of
states like Rajasthan (104.5 percent), Madhya Pradesh (74.4 percent) and Orissa (82.4
percent) as well as a national average of 79.8 percent.
xxvii

7. Under the Annual Credit Plan of banks in Bihar, the total credit flow in Bihar has gone up
from Rs. 8738 crore in 2006-07 to Rs 10763 crore in 2007-08, registering a growth of 23
percent growth. In 2006-07, the priority sector advances constituted 62 percent of the total
advances, of which agriculture accounted for nearly half the total priority sector advances
and more than one third of the total advances within the state. The advances made to the
small scale industries were very low.
8. While for the commercial banks, the achievement figures for Kisan Credit Cards were
consistently high during the entire period from 1999-00 through 2008-09, the RRBs have
been showing higher performance of late. The cooperative banks, however, are yet to gear up
fully for the job. Overall, the achievement in the state has been only around 45.07 percent of
the target for the entire period.
9. Till December 2007, NABARD had sanctioned 9,372 projects in the state under the RIDF,
of which as many as 7,951 are related to minor irrigation. The total credit disbursed by
NABARD by way of refinancing the banks amounted to Rs 184 crore during 2007-08. The
total disbursements made by NABARD under the various tranches of the RIDF till March,
2008 in Bihar is only Rs 747 crore out of total sanctioned amount of Rs 2309 crore, or 31.19
percent of the sanctioned amount leaving a huge shortfall between sanction and
disbursement.
10. The Self-Help Groups (SHGs) and the SHG-Bank Linkage Programme, implemented by
commercial banks, RRBs and cooperative banks, have emerged as the major microfinance
programme in the country. Bihar is gradually catching up with other states in SHG-Bank
Linkages. As on March 31, 2008, an impressive cumulative number of 141,377 SHGs were
credit-linked to banks and the total credit flow to these SHGs was Rs. 296.12 crore.
11. Among different rural poverty alleviation schemes, Pradhan Mantri Rojgar Yojana (PMRY)
and Swarnjayanti Grammeen Swarojgar Yojana (SGSY) are important anti-poverty
programmes in the state. For SGSY and PMRY schemes, the recovery rates are only around
31 percent and 25 percent respectively in 2006-07.
Public Finance
1. In 2004-05, for the first time, Bihar had a revenue surplus of more than Rs 1000 crore. This
surplus has been increasing continuously, from Rs 82 crore in 2005-06 to Rs 4647 crore in
2007-08. In the budget estimates of 2008-09 also, the state government projected to keep it
xxviii

at almost the same level. This has been made possible not by squeezing the expenditure
necessary for maintaining the pace of development, but by increasing the revenue (especially
since 2005-06) and efficient debt management.
2. The gap between plan and non-plan expenditure has also been closing since 2005-06. As on
March 2008, the non-plan expenditure was less than twice the plan expenditure, compared to
three times 4 years ago. The year 2005-06 also marks the beginning of a declining Gross
Fiscal Deficit (GFD), from Rs 3,700 crore in 2005-06 to Rs 1,703 crore in 2007-08. As a
percentage of Gross State Domestic Product (GSDP), it came down from 4.64 to 1.62
percent, well within the FRBMA target of 3 percent. In the budget estimates of 2008-09, the
GFD will be contained at 2.96 percent of the GSDP.
3. Its debt management, while the total debt stock in the economy has not been allowed to
increase, the interest payments have also been contained at nearly the same level by reducing
borrowings, from Rs 5,653 crore in 2003-04 to Rs 1,612 crore in 2007-08.
4. At the end of 2007-08, the finances of the state government were on a much stronger footing
than ever before in the past. All key fiscal indicators pointed to a marked improvement in the
fiscal position of the state government. The sustainability parameters had improved
significantly, though the tax potential remains substantially untapped and the tax efforts
leave much scope for improvement. Tax revenues were buoyant, though non-tax revenues
showed no responsiveness to increasing the state income. The state government still remains
overwhelmingly dependent on external resources, i.e., central funds, for meeting its own
expenditure needs.
5. The revenue deficit of Bihar was contained effectively and as a result, from 2006-07
onwards, there was a growing surplus in the revenue account. In the combined revenue and
capital accounts of Bihar, the budget deficit could also be reduced from Rs 1724 crore in
2007-08 to only Rs 501 crore in the 2008-09, largely due to surplus on revenue account.
6. From 2003-04 to 2008-09, revenue receipts and expenditure grew at nearly the same rate.
With receipts outgrowing the expenditure during the last 4 years, it has resulted in a revenue
surplus. The state government's own revenue, tax and non-tax combined, barely meets 20
percent of its revenue expenditure needs, and the rest has to come from its share of taxes and
grants from the central government. While the total revenue of the state government has
grown nearly threefold during the period 2003-2009, from Rs 12,456 crore to Rs 33,551
xxix
crore, the state government's own total revenue, tax and non-tax combined, have grown at a
much slower rate, from Rs. 3239 crore to Rs. 5678 crore during the same period, i.e., by 75
percent.
7. The developmental expenditure in Bihar has constituted about 60 -70 percent of the total
expenditure during all the years under consideration. In absolute terms, it has nearly doubled
over the years and, except for a marginal decline in 2004-05, the pace of growth has been
very high. The non-developmental expenditure, on the other hand, has increased at a slower
rate. About 20 percent of the total expenditure of the state government has been plan
expenditure till 2005-06, after which the share of plan expenditure has increased steadily to
about 40 percent in 2008-09. Nearly half of the non-plan expenditure is non-developmental
in nature, and nearly a quarter is solely due to interest payment on outstanding loans and
payments on account of pension and gratuity.
8. The outstanding liability of the state government, as a percentage of GSDP, had decreased
from 51 percent to 42 percent during the period from 2003-04 to 2008-09 and it reflects the
state government's ability to contain the debt burden. The total public debt of the state
government was Rs 35,045 crore at the end of 2007-08, which is 33 percent of the State’s
GSDP. This large figure is the accumulated effect of past borrowings, growing at an average
annual rate of about 5.5 percent since 2003-04. The major part of this huge debt (about 60
percent) is due to the internal loans raised by the state government from the market, and
about 16 percent is from the central government.
9. During 2003-04 to 2008-09 about 80 percent of the total receipts of the state government
came from the central government by way of grants-in-aid and state’s share of divisible pool
of taxes. While the own tax revenue of the state government has grown by 80 percent from
Rs 2919 crore in 2003-04 to Rs 5256 crore in 2008-09, the non-tax revenue has grown by 32
percent, from Rs. 320 crore to Rs. 422 crore during the same period.
10. The major sources of taxes are sales tax, stamp and registration fees, state excise duty, taxes
and duties on electricity and taxes on vehicles. These five taxes together made up as much as
98 percent of the total tax receipts of the state government in 2008-09. Of these, sales tax
alone comprises 56 percent of the total tax receipts, followed by Stamp and Registration
Fees (16 percent). These taxes are highly buoyant and their yields increase automatically
with the general increase in the income level as reflected by the GSDP. The most important
element of the state government’s non-tax revenue is the royalty from mines and minerals,
xxx

the other important source being the interest receipts. The receipt from these two together
was about 46 percent of the total non-tax receipts in 2008-09, down from more than 66
percent the year before, due to a substantial drop in the interest receipts. In 2007-08, sales
tax, stamp and registration fees, taxes on goods and passengers, taxes on vehicles and state
excise were far more buoyant than the total tax revenues of the state government.
11. There has been a change in the structure of expenditure of the state government since 2007-
08. Prior to 2007-08, the expenditure on General Services, mostly incurred on running the
day-to-day administration of the state government, used to account for the bulk of
expenditure from the Consolidated Fund, followed by Social Services and Economic
Services. Since 2007-08, General Services no longer holds that predominant position. Now
Social Services account for the bulk of the expenditure which reflects the state government’s
changed priority, in view of the importance accorded to education, health and social
development. Capital expenditure that has the potential of generating income and
employment has also been accorded high priority and accounts for a quarter of the total
expenditure of the state government.
12. With a 75 percent share, revenue expenditure constitutes the bulk of total expenditure. The
total expenditure and the revenue expenditure respectively are at 34 percent and 19 percent
of GSDP for Bihar. From the buoyancy ratios, it can be seen that revenue expenditure is
increasing much faster than GSDP, but not faster than revenue receipts. The salary of the
state government employees alone accounted for more than one quarter of the state
government's revenue expenditure at 28 percent
13. The quality of expenditure in Bihar has undergone significant improvement over these 5
years. The capital outlay has increased from a meager 7 percent to nearly a fifth of total
expenditure, while revenue expenditure has practically remained the same at 75 percent of
total expenditure. The remaining components of expenditure is accounted for by discharge of
public debt and loans and advances made by the state government. The salary component of
developmental revenue expenditure has declined from 54 percent to only 23 percent during
this period, whereas the non-salary component has gone up from 46 percent to 77 percent of
total developmental expenditure. The share of plan expenditure in total expenditure has also
increased from 23 percent to 34 percent.
14. The per capita capital outlay has been continuously rising since 2005-06 and now stands at
Rs 770 compared to the per capita expenditure on social services at Rs 1374 and on
xxxi

xxxii
economic services at Rs 1193. However, the low level of per capita expenditure on medical
and public health as well as drinking water supply and sanitation are matters of concern. The
per capita expenditure on general education (i.e. primary, secondary and higher education)
increased from 2004-05 and stood at Rs 726 at the end of 2008-09, compared to only Rs 143
for medical and public health and only Rs 97 for water supply and sanitation.
15. In 2007-08, 67 percent of the total state government revenue expenditure on education were
made on primary education, followed by 17 percent in secondary education and 14 percent
on university and higher education. This signifies the priorities the state government places
upon primary education. In medical and public health, 50 percent of the total expenditure
were made on rural areas, as compared to 46 percent last year, followed by 30 percent on
urban areas and 10 percent on medical training and research and the rest 6 percent on public
health.

CHAPTER I
MACRO OVERVIEW
Bihar's economy is now set on a development path which would ensure that it reaches its targets
under the Eleventh Five Year Plan period (2007-12). Essentially, these targets include an
accelerated growth which is inclusive as well, implying higher levels of development in social
sector and improved delivery of social services. In 2008-09, the population of Bihar is estimated to
be 99.0 million, implying a population density of 951 persons per sq. km. But, fortunately, in spite
of such high demographic pressure on land, the present Bihar has abundant natural resources in the
form of its fertile land and plentiful water to pursue its development goals.
Although a number of crucial steps have been taken to accelerate the growth process in Bihar, it
has had to face a major challenge this year in the form of an unprecedented flood, devastating a
large part of its population in the north-eastern region. In this flood, about 50 lakh people were
marooned and nearly all their houses and assets were destroyed. For rescue operations alone, the
state government had to spend a huge amount. This, however, has not deterred the state
government from continuing its efforts to strengthen the economy through higher levels of
expenditure in infrastructure and social sectors.
This Economic Survey presents the details of the current status of the state's economy and the
progress made in different sectors in the recent past. Apart from the Macro Overview, the survey
is divided into six chapters — Agriculture, Industry and Allied Sectors, Physical Infrastructure,
Social Sector, Banking and Allied Sectors and, finally, Public Finances.
1.1 State Domestic Product
Following the national pattern, the State Domestic Product of Bihar is now estimated both at
current and constant (1999-00) prices. These estimates are also prepared separately for both Gross
State Domestic Product (GSDP) and Net State Domestic Product (NSDP). Tables 1.1 and 1.2
present the estimates of GSDP in current and constant prices respectively; similarly, Tables 1.3
and 1.4 present the estimates of NSDP again in current and constant prices respectively.
1

Table 1.1 : Gross State Domestic Product (GSDP) at Factor Cost at Current Prices (Rs. crore)
Sector 1999-00 2000-01 2001-02 2002-03 2003-04 2004-05 2005-06 2006-07
(P) 2007-08
(Q) 2008-09 Advance
Growth Rate
1. Agriculture/ An. Hus.
15202.45 19732.38 17666.38 21144.54 19040.88 19717.33 19575.16 24597.99 23470.31 22231.34 4.31
2. Forestry / Logging
910.61 1007.82 1083.73 1151.37 1243.03 1351.46 1465.93 1589.17 1722.20 1837.31 8.11
3. Fishing 696.66 825.32 1031.79 1126.67 1189.94 1135.66 1167.44 1323.42 1448.68 1388.95 7.97
4. Mining / Quarrying
94.44 109.08 165.69 51.27 44.95 40.25 95.29 81.34 81.22 61.76 -4.61
Sub Total (Primary)
16904.16 21674.60 19947.59 23473.85 21518.80 22244.70 22303.82 27591.92 26722.41 25441.32 4.65
5. Manufacturing 3614.00 3470.43 3237.16 3686.05 3719.63 4290.94 4879.59 5425.99 5970.15 6910.25 7.47
5.1 Registered 1150.65 871.15 749.08 1025.59 738.33 1119.07 1334.01 1591.05 1892.59 2450.19 8.76
5.2 Un-registered 2463.35 2599.28 2488.08 2660.46 2981.30 3171.87 3545.58 3834.94 4077.56 4533.76 7.01
6. Construction 1929.19 1941.37 2235.18 2688.81 2775.68 3433.37 5973.34 7721.36 8130.28 11858.30 22.36
7. Elec. /Wat. Sup/ Gas
718.52 1008.37 727.18 740.17 906.59 1082.21 1163.88 1159.09 1299.17 1330.53 7.09
Sub Total (Secondary)
6261.71 6420.17 6199.52 7115.03 7401.90 8806.52 12016.81 14306.44 15399.60 19404.37 13.39
8. Trans. Storage/ Comm.
3723.96 3904.94 3898.86 4190.78 3969.28 4338.87 4868.60 5411.68 5555.32 5891.18 5.23
8.1 Railways 1563.75 1711.05 1716.13 1822.88 1413.74 1558.15 1756.15 2053.14 2053.14 1965.71 2.57
8.2 Other Trans. / Storage
1392.61 1472.07 1496.17 1621.67 1720.17 1863.77 2032.27 2228.68 2372.32 2586.15 7.12
8.3 Comm. 767.60 721.82 686.56 746.23 835.37 916.95 1080.18 1129.86 1129.86 1399.27 6.90
9. Trade/ Hotel / Restaurant
7540.85 8614.05 9582.62 11936.37 12761.66 16045.27 16844.34 22923.76 27612.78 31599.60 17.26
Sub Total (8&9) 11264.81 12518.99 13481.48 16127.15 16730.94 20384.14 21712.94 28335.44 33168.10 37163.68 14.18
10. Banking / Insurance
1819.14 2056.00 2735.69 2723.18 2889.89 2908.21 2938.59 3567.48 3567.48 3603.05 7.89
11. REODB 2097.09 2358.44 2583.31 2900.14 3401.22 3737.55 4251.33 4831.28 5514.18 6238.96 12.88
Sub Total (10&11) 3916.23 4414.44 5319.00 5623.32 6291.11 6645.76 7189.92 8398.76 9081.66 9725.24 10.63
12. Public Administration
3793.61 4113.73 4540.48 4084.96 4903.03 5367.87 5542.50 6895.30 7187.76 7767.72 8.29
13. Other Services 8059.41 8127.83 8200.03 8576.07 9408.29 9771.83 11390.53 13428.91 13588.82 15555.42 7.58
Sub Total (Tertiary)
27034.06 29174.99 31540.99 34411.50 37333.37 42169.60 45835.89 57058.41 63026.34 70066.48 11.16
Total GSDP 50199.93 57269.76 57688.10 65000.38 66254.07 73220.82 80156.52 98956.77 105148.35 112424.35 9.37
Per Capita GSDP (Rs.)
6304.00 6995.00 6836.00 7596.00 7604.00 8258.00 8890.00 10799.00 11298.00 11917.60 7.33
Note : REODB = Real Estate, Ownership of Dwelling & Business
2

Table 1.2 : Gross State Domestic Product (GSDP) at Factor Cost at Constant (1999-00) Prices (Rs. crore)
Sector 1999-00 2000-01 2001-02 2002-03 2003-04 2004-05 2005-06 2006-07
(P) 2007-08
(Q) 2008-09 Advance
Growth Rate
1. Agriculture/ An. Hus.
15202.45 20861.35 16287.60 20666.04 16899.48 19417.48 16983.80 21729.49 19083.25 17804.05 1.77
2. Forestry / Logging
910.61 962.94 987.71 1023.17 1066.04 1116.76 1166.02 1216.03 1267.56 1313.54 4.15
3. Fishing 696.66 769.24 984.79 1069.27 1091.47 1095.34 1144.70 1069.06 1148.74 1145.09 5.68
4. Mining / Quarrying
94.44 133.42 242.54 67.95 55.70 43.82 74.76 64.19 64.00 35.39 -10.33
Sub Total (Primary)
16904.16 22726.95 18502.64 22826.43 19112.69 21673.40 19369.28 24078.77 21563.55 20198.02 2.00
5. Manufacturing 3614.00 3389.89 3143.56 3386.16 3317.22 3526.58 3789.47 4002.46 4183.01 4524.25 2.53
5.1 Registered 1150.65 785.84 677.24 841.63 621.81 790.40 871.55 963.61 1061.33 1283.86 1.22
5.2 Un-registered 2463.35 2604.05 2466.32 2544.53 2695.41 2736.18 2917.92 3038.85 3121.68 3236.37 3.08
6. Construction 1929.19 1952.50 2159.39 2574.73 2517.52 3103.99 5698.33 7419.19 7750.18 11148.97 21.52
7. Elec. /Wat. Sup/ Gas
718.52 778.00 602.14 615.71 631.70 654.44 727.82 771.98 821.52 828.90 1.60
Sub Total (Secondary)
6261.71 6120.39 5905.09 6576.60 6466.44 7285.01 10215.62 12193.63 12754.71 15662.63 10.72
8. Trans. Storage/ Comm.
3723.96 4053.84 4050.59 4357.25 4070.67 4390.91 4890.87 5396.72 5425.28 5623.87 4.69
8.1 Railways 1563.75 1755.17 1802.44 1836.62 1383.12 1485.20 1613.19 1758.55 1758.55 1573.43 0.07
8.2 Other Trans. / Storage
1392.61 1503.87 1497.88 1575.46 1582.05 1655.99 1674.54 1778.25 1806.81 1828.96 3.07
8.3 Comm. 767.60 794.80 750.27 945.17 1105.50 1249.72 1603.14 1859.92 1859.92 2506.27 14.05
9. Trade/ Hotel / Restaurant
7540.85 8700.94 9529.99 11357.42 11419.66 13880.69 13571.04 17413.14 19600.68 20943.37 12.02
Sub Total (8&9) 11264.81 12754.78 13580.58 15714.67 15490.33 18271.60 18461.91 22809.86 25025.96 26494.43 9.97
10. Banking / Insurance
1819.14 2014.32 2473.59 2366.69 2295.32 2424.91 2602.62 3199.76 3199.76 3203.83 6.49
11. REODB 2097.09 2209.78 2304.39 2399.66 2508.55 2637.63 2782.37 2947.23 3128.82 3257.40 5.01
Sub Total (10&11) 3916.23 4224.10 4777.98 4766.35 4803.87 5062.54 5384.99 6146.99 6328.58 6467.83 5.73
12. Public Administration
3793.61 4129.39 4461.52 3846.02 4362.53 4587.63 4431.99 5210.40 5091.62 5149.91 3.45
13. Other Services 8059.41 8295.06 8267.58 8328.77 8663.59 8683.54 9530.42 10613.98 10229.45 10910.55 3.42
Sub Total (Tertiary)
27034.06 29403.33 31087.66 32655.81 33320.32 36605.31 37809.31 44781.23 46675.61 48907.34 6.81
Total GSDP 50199.93 58250.67 55495.39 62058.84 58899.45 65563.72 67394.21 81053.63 80993.87 82947.52 5.74
Per Capita GSDP (Rs.)
6304 7115 6576 7253 6760 7395 7475 8846 8703 8794 3.77
Note : REODB = Real Estate, Ownership of Dwelling & Business
3

Table 1.3 : Net State Domestic Product (NSDP) at Factor Cost at Current (1999-00) Prices (Rs. crore)
Sector 1999-00 2000-01 2001-02 2002-03 2003-04 2004-05 2005-06 2006-07
(P) 2007-08
(Q) 2008-09 Advance
Growth Rate
1. Agriculture/ An. Hus.
14322.92 18735.97 16522.50 19896.05 17671.26 18152.64 17815.67 22387.03 21360.71 19898.49 3.72
2. Forestry / Logging
878.63 973.49 1046.70 1110.02 1197.71 1301.05 1412.69 1531.45 1659.65 1768.04 8.08
3. Fishing 628.22 737.17 901.99 974.99 1012.88 938.27 972.36 1102.28 1206.60 1132.65 6.77
4. Mining / Quarrying
74.84 87.34 131.73 42.86 37.13 33.91 80.33 68.57 68.47 52.96 -3.77
Sub Total (Primary)
15904.61 20533.97 18602.92 22023.92 19918.98 20425.87 20281.05 25089.33 24295.43 22773.35 4.07
5. Manufacturing 3153.14 2947.19 2656.42 3050.22 2990.49 3401.11 3817.97 4242.86 4664.89 5325.61 6.00
5.1 Registered 999.95 699.87 557.30 818.83 510.24 853.07 1020.05 1216.60 1447.17 1931.03 7.59
5.2 Un-registered 2153.19 2247.32 2099.12 2231.39 2480.25 2548.04 2797.92 3026.26 3217.72 3483.41 5.49
6. Construction 1890.26 1885.96 2168.36 2620.57 2688.64 3321.66 5805.86 7504.87 7902.32 11559.54 22.29
7. Elec. /Wat. Sup/ Gas
407.87 568.93 322.32 384.11 469.86 566.47 574.15 571.79 640.89 675.75 5.77
Sub Total (Secondary)
5451.27 5402.08 5147.10 6054.90 6148.99 7289.24 10197.98 12319.52 13208.10 16958.59 13.44
8. Trans. Storage/ Comm.
3039.31 3238.80 3227.67 3438.83 3182.78 3390.48 3828.89 4296.73 4419.61 4538.50 4.56
8.1 Railways 1207.04 1350.45 1360.33 1446.00 1021.54 1073.40 1241.10 1501.86 1501.86 1342.99 1.19
8.2 Other Trans. / Storage
1239.77 1314.51 1319.51 1415.26 1499.04 1593.40 1738.51 1906.53 2029.41 2178.10 6.46
8.3 Comm. 592.50 573.84 547.83 577.57 662.20 723.68 849.28 888.34 888.34 1085.03 6.95
9. Trade/ Hotel / Restaurant
7427.58 8483.11 9454.98 11803.75 12611.02 15876.34 16654.80 22665.81 27302.07 31274.96 17.32
Sub Total (8&9) 10466.89 11721.91 12682.65 15242.58 15793.80 19266.82 20483.69 26962.54 31721.68 35420.61 14.51
10. Banking / Insurance
1766.89 1988.58 2649.98 2645.45 2807.97 2821.03 2848.04 3467.52 3467.52 3508.62 7.92
11. REODB 1357.97 1492.92 1495.86 1632.55 1919.79 1921.75 2138.35 2430.06 2773.54 2960.53 9.05
Sub Total (10&11) 3124.86 3481.50 4145.84 4278.00 4727.76 4742.78 4986.39 5897.58 6241.06 6439.71 8.37
12. Public Administration
3228.44 3445.69 3776.69 3385.62 4047.84 4453.00 4572.29 5688.28 5929.55 6428.89 7.95
13. Other Services 7920.88 7961.63 7999.17 8351.55 9142.56 9430.20 10975.88 12940.06 13094.15 14921.33 7.29
Sub Total (Tertiary)
24741.07 26610.73 28604.35 31257.75 33711.96 37892.80 41018.25 51488.46 56986.44 62998.12 10.94
Total NSDP 46096.95 52546.78 52354.37 59336.57 59779.93 65607.91 71497.28 88897.31 94489.97 100138.36 9.00
Per Capita NSDP (Rs.)
5789.00 6418.00 6204.00 6934.00 6861.00 7400.00 7930.00 9702.00 10153.00 10616.30 6.97
Note : REODB = Real Estate, Ownership of Dwelling & Business
4

Table 1.4 : Net State Domestic Product (NSDP) at Factor Cost at Constant Prices (Rs. crore)
Sector 1999-00 2000-01 2001-02 2002-03 2003-04 2004-05 2005-06 2006-07
(P) 2007-08
(Q) 2008-09 Advance
Growth Rate
1. Agriculture/ An. Hus.
14322.92 19882.95 15220.43 19537.87 15702.42 18157.17 15646.30 20018.26 17580.41 16202.30 1.38
2. Forestry / Logging
878.63 929.03 952.81 985.33 1025.78 1075.44 1124.47 1172.70 1222.39 1266.64 4.15
3. Fishing 628.22 684.57 867.33 932.04 935.73 932.75 987.02 921.80 990.50 981.29 5.08
4. Mining / Quarrying
74.84 112.34 211.45 60.48 48.96 38.77 63.53 54.55 54.39 29.12 -9.96
Sub Total (Primary)
15904.61 21608.89 17252.02 21515.72 17712.89 20204.13 17821.32 22167.31 19847.69 18380.36 1.62
5. Manufacturing 3153.14 2890.62 2618.42 2823.16 2701.19 2835.30 3014.39 3179.68 3317.90 3542.17 1.30
5.1 Registered 999.95 623.34 503.59 657.03 423.78 574.02 628.78 695.20 765.70 937.30 -0.72
5.2 Un-registered 2153.19 2267.28 2114.83 2166.13 2277.41 2261.28 2385.61 2484.48 2552.20 2592.73 2.09
6. Construction 1890.26 1899.99 2098.71 2513.39 2441.78 3011.60 5566.27 7247.25 7570.57 10929.24 21.53
7. Elec. /Wat. Sup/ Gas
407.87 352.92 232.16 298.83 255.63 243.37 284.26 301.51 320.86 339.03 -2.03
Sub Total (Secondary)
5451.27 5143.53 4949.29 5635.38 5398.60 6090.27 8864.92 10728.44 11209.33 14093.45 11.13
8. Trans. Storage/ Comm.
3039.31 3413.10 3424.02 3675.11 3410.52 3679.58 4151.77 4598.94 4623.37 4737.53 5.06
8.1 Railways 1207.04 1406.00 1464.50 1490.71 1068.71 1158.24 1286.33 1415.28 1415.28 1233.50 0.24
8.2 Other Trans. / Storage
1239.77 1354.59 1335.37 1387.28 1382.19 1424.22 1432.77 1521.51 1545.94 1529.14 2.36
8.3 Comm. 592.50 652.51 624.15 797.12 959.62 1097.12 1432.67 1662.15 1662.15 2255.70 16.01
9. Trade/ Hotel / Restaurant
7427.58 8576.88 9414.07 11238.29 11289.47 13745.02 13426.30 17227.42 19391.63 20729.03 12.08
Sub Total (8&9) 10466.89 11989.98 12838.09 14913.40 14699.99 17424.60 17578.07 21826.36 24015.00 25372.84 10.34
10. Banking / Insurance
1766.89 1950.31 2395.92 2297.35 2224.53 2354.58 2533.45 3126.84 3126.84 3141.04 6.60
11. REODB 1357.97 1377.23 1333.40 1301.22 1276.17 1276.42 1285.54 1361.71 1445.61 1383.43 0.21
Sub Total (10&11) 3124.86 3327.54 3729.32 3598.57 3500.70 3631.00 3818.99 4488.55 4572.45 4531.00 4.21
12. Public Administration
3228.44 3478.39 3754.17 3217.96 3618.02 3848.41 3689.12 4337.06 4238.19 4289.44 3.21
13. Other Services 7920.88 8136.00 8084.43 8128.06 8436.69 8414.79 9221.92 10270.41 9898.32 10514.43 3.20
Sub Total (Tertiary)
24741.07 26931.91 28406.01 29857.99 30255.40 33318.80 34308.10 40922.38 42723.96 44593.62 6.76
Total GSDP 46096.95 53684.33 50607.32 57009.09 53366.89 59613.20 60994.34 73818.13 73780.98 75112.14 5.57
Per Capita NSDP (Rs.)
5789.00 6557.00 5997.00 6662.00 6125.00 6724.00 6765.00 8056.00 7928.00 7963.05 3.61
Note : REODB = Real Estate, Ownership of Dwelling & Business
5

The medium term growth rate of NSDP at constant prices, taking the period 1999-00 to 2008-09,
is estimated to be 5.57 percent. Although this growth rate is lower than the national gowth rate of
about 6-7 percent, it indicates an improved growth performance compared to the recent past when
the state economy had managed to grow at barely 3-4 percent. With the current population growth
rate of about 1.96 percent for Bihar, the per capita NSDP in Bihar has grown at 3.61 percent. For
the comparative position of Bihar, one can see from Table 1.5 that, in 2005-06, while the per
capital NSDP for the whole country at current prices stood at Rs. 25,716, the figure for Bihar was
Rs. 7,875 which was barely 30.6 percent of the national average.
Table 1.5 : Per Capita Net State Domestic Product at Current Prices for Major Indian States
(Rupees)
State 1999-00 2000-01 2001-02 2002-03 2003-04 2004-05 2005-06
Andhra Pradesh 15507 17243 18630 19568 22041 23729 26211
Assam 12269 12797 13153 14600 15687 16825 18598
Bihar 5766 6396 6197 6928 6913 7464 7875
Chhattisgarh 11761 10985 12443 13145 16098 18068 20151
Gujarat 18864 18392 19823 22683 26922 29468 34157
Haryana 21966 24138 26077 28259 31509 35044 38832
Himachal Pradesh 20806 22795 24608 26627 28333 31140 33805
Jharkhand 12747 10294 10972 11865 12941 17493 19066
Karnataka 16758 17464 17776 19041 20515 24199 27291
Kerala 19294 19917 21047 23207 25645 27864 30668
Madhya Pradesh 12384 11862 12697 12303 14306 14534 15647
Maharashtra 23340 22992 24450 26697 29770 32979 37081
Orissa 10567 10452 11075 11788 14252 16306 17299
Punjab 25615 27863 28949 29443 31192 32945 34929
Rajasthan 13477 12897 14165 13126 16704 16800 17863
Tamil Nadu 19378 20927 20924 21813 24106 27137 29958
Uttar Pradesh 9405 9541 9781 10435 11250 11941 13262
West Bengal 15826 16521 17826 18746 20806 22522 25223
India 15839 16648 17800 18899 20936 22946 25716
Source : Economic Survey, 2007-08, Government of India
6

Among the major sectors, the medium term growth rate for NSDP at constant prices has been
satisfactory for at least three sectors — Construction (21.53 percent), Communications (16.01
percent) and Trade, Hotels and Restaurants (12.08 percent). Apparently, Agriculture with a growth
rate of only 1.38 percent appears as one of the lagging sectors; but it should be noted that the two
consecutive floods in 2007-08 and 2008-09 had caused substantial loss of agricultural income in
both the years, resulting in a low growth rate of NSDP from the sector. In the absence of this
calamity, agricultural growth rate would have been much higher. Because of lower growth rate of
the primary sectors, the sectoral composition of the NSDP has been undergoing a slow but steady
change over the years (Table 1.6). In the beginning of the current decade, the sectoral composition
of NSDP was as follows — Primary (35 percent), Secondary (11 percent) and Tertiary (54
percent). At present, the changed composition stands at — Agriculture (27 percent), Secondary
(17 Percent) and Tertiary (56 percent).
The disadvantaged economy of Bihar suffers not only from its comparatively lower growth rates,
but from substantial year-to-year variation in growth rates as well. Agricultural growth is possibly
the most important source of this variation, but many other sectors too are not free from this
structural weakness (Table 1.7). During the past decade, the growth rate has varied between
(-) 21.92 to 37.22 percent in Primary sectors; between (-)2.26 to 22.80 percent in Secondary
sectors; and between 2.03 to 18.44 percent in Tertiary sectors. For the aggregate GSDP, the yearly
growth rate varies from (-) 4.73 percent to 11.31 percent.
As regards the performance of the state economy in 2008-09, as revealed by the advance estimate
of GSDP (Table 1.2), it might be noted that this year the estimated growth rate is lower than the
average. This is largely because of the unprecedented floods in 2008 which has badly affected the
agricultural sector. But two buoyant sectors of the state economy are estimated to grow at an even
higher rate this year — Construction (43.85 percent) and Communications (34.75 percent).
Because of strong policy interventions, the registered Manufacturing sector is also estimated to
grow at 20.97 percent in 2008-09.
7

Table 1.6 : Percentage Distribution of Sectoral Composition of Gross State Domestic Product at Factor Cost at Constant (1999-00) Prices
Sector 1999-00 2000-01 2001-02 2002-03 2003-04 2004-05 2005-06 2006-07
(P) 2007-08
(Q) 2008-09 Advance
1. Agriculture/ An. Hus.
30.28 35.81 29.35 33.30 28.69 29.62 25.20 26.81 23.56 21.46
2. Forestry / Logging
1.81 1.65 1.78 1.65 1.81 1.70 1.73 1.50 1.57 1.58
3. Fishing 1.39 1.32 1.77 1.72 1.85 1.67 1.70 1.32 1.42 1.38
4. Mining / Quarrying
0.19 0.23 0.44 0.11 0.09 0.07 0.11 0.08 0.08 0.04
Sub Total (Primary)
33.67 39.02 33.34 36.78 32.45 33.06 28.74 29.71 26.62 24.35
5. Manufacturing 7.20 5.82 5.66 5.46 5.63 5.38 5.62 4.94 5.16 5.45
5.1 Registered 2.29 1.35 1.22 1.36 1.06 1.21 1.29 1.19 1.31 1.55
5.2 Un-registered 4.91 4.47 4.44 4.10 4.58 4.17 4.33 3.75 3.85 3.90
6. Construction 3.84 3.35 3.89 4.15 4.27 4.73 8.46 9.15 9.57 13.44
7. Elec. /Wat. Sup/ Gas
1.43 1.34 1.09 0.99 1.07 1.00 1.08 0.95 1.01 1.00
Sub Total (Secondary)
12.47 10.51 10.64 10.60 10.98 11.11 15.16 15.04 15.75 18.88
8. Trans. Storage/ Comm.
7.42 6.96 7.30 7.02 6.91 6.70 7.26 6.66 6.70 6.78
8.1 Railways 3.12 3.01 3.25 2.96 2.35 2.27 2.39 2.17 2.17 1.90
8.2 Other Trans. / Storage
2.77 2.58 2.70 2.54 2.69 2.53 2.48 2.19 2.23 2.20
8.3 Comm. 1.53 1.36 1.35 1.52 1.88 1.91 2.38 2.29 2.30 3.02
9. Trade/ Hotel / Restaurant
15.02 14.94 17.17 18.30 19.39 21.17 20.14 21.48 24.20 25.25
Sub Total (8&9) 22.44 21.90 24.47 25.32 26.30 27.87 27.39 28.14 30.90 31.94
10. Banking / Insurance
3.62 3.46 4.46 3.81 3.90 3.70 3.86 3.95 3.95 3.86
11. REODB 4.18 3.79 4.15 3.87 4.26 4.02 4.13 3.64 3.86 3.93
Sub Total (10&11) 7.80 7.25 8.61 7.68 8.16 7.72 7.99 7.58 7.81 7.80
12. Public Administration
7.56 7.09 8.04 6.20 7.41 7.00 6.58 6.43 6.29 6.21
13. Other Services 16.05 14.24 14.90 13.42 14.71 13.24 14.14 13.10 12.63 13.15
Sub Total (Tertiary)
53.85 50.48 56.02 52.62 56.57 55.83 56.10 55.25 57.63 58.96
Total GSDP 100.00 100.00 100.00 100.00 100.00 100.00 100.00 100.00 100.00 100.00
Note : REODB = Real Estate, Ownership of Dwelling & Business
8

Table 1.7 : Yearly Growth Rate of Gross State Domestic Product at Constant (1999-00) Prices
Sector 2000-01 2001-02 2002-03 2003-04 2004-05 2005-06 2006-07
(P) 2007-08
(Q) 2008-09 Advance
1. Agriculture/ An. Hus.
37.22 -21.92 26.88 -18.23 14.90 -12.53 27.94 -12.18 -6.70
2. Forestry / Logging
5.75 2.57 3.59 4.19 4.76 4.41 4.29 4.24 3.63
3. Fishing 10.42 28.02 8.58 2.08 0.35 4.51 -6.61 7.45 -0.32
4. Mining / Quarrying
41.27 81.79 -71.98 -18.03 -21.33 70.61 -14.14 -0.30 -44.70
Sub Total (Primary)
34.45 -18.59 23.37 -16.27 13.40 -10.63 24.31 -10.45 -6.33
5. Manufacturing -6.20 -7.27 7.72 -2.04 6.31 7.45 5.62 4.51 8.16
5.1 Registered -31.70 -13.82 24.27 -26.12 27.11 10.27 10.56 10.14 20.97
5.2 Un-registered 5.71 -5.29 3.17 5.93 1.51 6.64 4.14 2.73 3.67
6. Construction 1.21 10.60 19.23 -2.22 23.30 83.58 30.20 4.46 43.85
7. Elec. /Wat. Sup/ Gas
8.28 -22.60 2.25 2.60 3.60 11.21 6.07 6.42 0.90
Sub Total (Secondary)
-2.26 -3.52 11.37 -1.68 12.66 40.23 19.36 4.60 22.80
8. Trans. Storage/ Comm.
8.86 -0.08 7.57 -6.58 7.87 11.39 10.34 0.53 3.66
8.1 Railways 12.24 2.69 1.90 -24.69 7.38 8.62 9.01 0.00 -10.53
8.2 Other Trans. / Storage
7.99 -0.40 5.18 0.42 4.67 1.12 6.19 1.61 1.23
8.3 Comm. 3.54 -5.60 25.98 16.96 13.05 28.28 16.02 0.00 34.75
9. Trade/ Hotel / Restaurant
15.38 9.53 19.18 0.55 21.55 -2.23 28.31 12.56 6.85
Sub Total (8&9) 13.23 6.47 15.71 -1.43 17.95 1.04 23.55 9.72 5.87
10. Banking / Insurance
10.73 22.80 -4.32 -3.02 5.65 7.33 22.94 0.00 0.13
11. REODB 5.37 4.28 4.13 4.54 5.15 5.49 5.93 6.16 4.11
Sub Total (10&11) 7.86 13.11 -0.24 0.79 5.38 6.37 14.15 2.95 2.20
12. Public Administration
8.85 8.04 -13.80 13.43 5.16 -3.39 17.56 -2.28 1.14
13. Other Services 2.92 -0.33 0.74 4.02 0.23 9.75 11.37 -3.62 6.66
Sub Total (Tertiary)
8.76 5.73 5.04 2.03 9.86 3.29 18.44 4.23 4.78
Total GSDP 16.04 -4.73 11.83 -5.09 11.31 2.79 20.27 -0.07 2.41
Per Capita GSDP 12.86 -7.58 10.30 -6.80 9.39 1.08 18.34 -1.62 1.04
Note : REODB = Real Estate, Ownership of Dwelling & Business
9

1.2 Regional Disparity
Besides being the state with the lowest per capita income, Bihar also suffers from high regional
disparities within the state. To obtain an idea of about such disparity, the Directorate of Statistics
and Evaluation of the state government has estimated Gross District Domestic Product (GDDP)
for 2003-04 and 2004-05. (Table 1.8). Taking the average of the GDDP estimates of two years,
Table 1.8 also presents the average Per Capita GDDP in 38 districts of Bihar. In the ranking of the
districts with respect to Per Capita GDDP, Patna appears at the top with a figure of Rs. 29,482.
Munger, appearing as the second most prosperous district, has a Per Capita GDDP figure of Rs.
9,763. The two districts at the bottom the ranking are Sitamarhi (Rs. 4,392) and Sheohar (Rs.
3,967). Broadly speaking, the Per Capita GDDP figures indicate that the districts in south Bihar
are relatively more prosperous than those in the north.
Table 1.8 : Gross District Domestic Product (GDDP) and Per Capita GDDP in Bihar
GDDP (1999-00 Prices)
(Rs. crore) GDDP (1999-00 Prices)
(Rs. crore) Division / District
2003-04
2004-05
Average
Per Capita GDDP (Rs.)
Division / District 2003-
04 2004-
05 Average
Per Capita GDDP (Rs.)
Patna 13721 15924 14823 29842 (1) Buxar 793 795 794 5365 (21)
Munger 1141 1198 1169 9763 (2) Kishanganj 699 763 731 5355 (22)
Begusarai 1871 2342 2106 8525 (3) Samastipur 1757 2075 1916 5322 (23)
Bhagalpur 2002 2129 2066 8059 (4) Arwal 306 297 302 5301 (24)
Muzaffarpur 2674 3031 2852 7225 (5) Madhepura 804 886 845 5255 (25)
Rohtas 1780 1864 1822 7056 (6) Saran 1716 1831 1774 5172 (26)
East Champaran 2067 2287 2177 6784 (7) Jehanabad 532 522 527 5138 (27)
Katihar 1519 1744 1632 6474 (8) Supaul 854 1032 943 5124 (28)
Saharsa 972 1064 1018 6405 (9) Gopalganj 1123 1167 1145 5050 (29)
Gaya 2259 2245 2252 6163 (10) Sekhpura 285 274 279 5039 (30)
Lakhisarai 495 516 506 5986 (11) Banka 805 903 854 5031 (31)
Khagaria 758 850 804 5970 (12) Siwan 1371 1440 1405 4920 (32)
Bhojpur 1395 1373 1384 5876 (13) Jamui 695 743 719 4879 (33)
Kaimur 807 756 781 5766 (14) Nawada 942 911 927 4857 (34)
Nalanda 1425 1409 1417 5673 (15) W. Champaran 1901 1997 1949 4699 (35)
Purnea 1486 1550 1518 5664 (16) Araria 997 1071 1034 4613 (36)
Madhubani 1648 2599 2124 5639 (17) Sitamarhi 1210 1263 1237 4392 (37)
Vaishali 1402 1738 1570 5488 (18) Sheohar 226 205 215 3967 (38)
Aurangabad 1167 1143 1155 5463 (19) Total 59386 65913 62650 7168
Darbhanga 1783 1976 1880 5425 (20)
Source : Directorate of Statistics and Evaluation, Government of Bihar
10

Table 1.9 : Districtwise Consumption of Petroleum Products (2007-08)
Consumption ( '000 tonne) Share of Population
District Petrol Diesel Retail LPG
Kerosene
Patna 5.69 29.90 (19.1) 120.27 (11.6) 55.87 (21.0) 39.52 (6.0)
Nalanda 2.86 3.22 (2.1) 32.21 (3.1) 7.67 (2.9) 18.56 (2.8)
Bhojpur 2.70 3.35 (2.1) 27.48 (2.7) 9.17 (3.4) 17.51 (2.6)
Buxar 1.69 2.21(1.4) 22.62 (2.2) 4.52 (1.7) 11.00 (1.7)
Rohtas 2.95 5.21 (3.3) 56.28 (5.4) 8.79 (3.3) 19.76 (3.0)
Kaimur 1.55 1.76 (1.1) 21.04 (2.0) 1.89 (0.7) 7.73 (1.2)
Gaya 4.18 5.96 (3.8) 41.02 (4.0) 10.01 (3.8) 27.18 (4.1)
Jahanabad 1.20 1.05 (0.7) 10.46 (1.0) 3.73 (1.4) 7.74 (1.2)
Arwal 0.63 0.31 (0.2) 2.22 (0.2) 0.47 (0.2) 4.04 (0.6)
Nawada 2.18 1.42 (0.9) 15.33 (1.5) 3.37 (1.3) 14.14 (2.1)
Aurangabad 2.43 3.99 (2.5) 32.48 (3.1) 4.52 (1.7) 15.14 (2.3)
Bhagalpur 2.92 5.99 (3.8) 40.58 (3.9) 9.59 (3.6) 19.99 (3.0)
Banka 1.94 1.62 (1.0) 9.78 (0.9) 3.08 (1.2) 11.82 (1.8)
Munger 1.37 2.13 (1.4) 9.84 (1.0) 7.03 (2.6) 9.98 (1.5)
Sheikhpura 0.63 0.65 (0.4) 8.60 (0.8) 9.91 (3.7) 4.02 (0.6)
Jamui 1.69 1.39 (0.9) 9.36 (0.9) 1.96 (0.7) 10.89 (1.6)
Lakhisarai 0.97 0.66 (0.4) 10.00 (1.0) 0.98 (0.4) 5.16 (0.8)
Khagaria 1.54 1.06 (0.7) 15.17 (1.5) 1.92 (0.7) 10.69 (1.6)
Begusarai 2.83 4.23 (2.7) 61.39 (5.9) 8.69 (3.3) 18.70 (2.8)
Muzaffarpur 4.51 1.07 (6.9) 60.52 (5.9) 14.95 (5.6) 32.80 (4.9)
Sitamarhi 3.23 3.25 (2.1) 19.40 (1.9) 6.78 (2.5) 25.02 (3.8)
Sheohar 0.62 0.26 (0.2) 1.43 (0.1) 1.28 (0.5) 1.76 (0.3)
VaishaliI 3.28 6.65 (4.3) 34.89 (3.4) 9.41 (3.5) 21.74 (3.3)
E. Champaran 3.67 6.43 (4.1) 51.51 (5.0) 7.92 (3.0) 29.228 (4.4)
W. Champaran 4.75 4.25 (2.7) 29.99 (2.9) 6.28 (2.4) 26.84 (4.0)
Darbhanga 3.97 5.64 (3.6) 28.29 (2.7) 10.35 (3.9) 28.03 (4.2)
Madhubani 4.31 4.92 (3.1) 20.85 (2.0) 7.70 (2.9) 29.15 (4.4)
Samastipur 4.09 5.15 (3.3) 32.13 (3.1) 3.28 (1.2) 27.50 (4.1)
Saran 3.91 5.75 (3.7) 34.79 (3.4) 6.64 (2.5) 25.36 (3.8)
Siwan 3.27 4.95 (3.2) 27.76 (2.7) 6.08 (2.3) 21.22 (3.2)
Gopalganj 2.59 4.55 (2.9) 25.45 (2.5) 5.03(1.9) 16.87 (2.5)
Saharsa 1.82 1.84 (1.2) 10.48 (1.0) 8.08 (3.0) 12.00 (1.8)
Supaul 2.09 1.75 (1.1) 8.10 (0.9) .92 (0.3) 11.37 (1.7)
Madhepura 1.84 2.33 (1.5) 15.81 (1.5) 2.66 (1.0) 14.32 (2.2)
Purnea 3.07 4.17 (2.7) 35.06 (3.4) 6.87 (2.6) 19.87 (3.0)
Araria 2.60 2.98 (1.9) 20.83 (2.0) 2.99 (1.1) 16.88 (2.5)
Katihar 2.88 2.90 (1.9) 21.95 (2.1) 5.29 (2.0) 19.29 (2.9)
Kishanganj 1.56 1.94 (1.2) 8.28 (0.8) 0.79 (0.3) 10.10 (1.5)
Grand Total 100.00 156.52 (100) 103.44 (100) 266.44 (100) 662.89 (100)
Sources : Indian Oil Corporation
11

Table 1. 10 : Districtwise Small Saving in Post offices and Publics Provident Fund
2007-08 2008-09 (upto November)
District Target in (In crore)
Achievement (Rs. Crore)
Per Capita Saving (Rs.)
Target (In
Crore)
Achievement (In Crore)
Per Capita Saving (Rs.)
Patna 400.00 111.02 208.14 200.00 91.56 168.67
Nalanda 100.00 58.97 220.06 50.00 58.95 216.17
Bhojpur 90.00 27.96 110.27 45.00 23.03 89.25
Buxar 50.00 17.01 107.30 25.00 15.03 93.16
Rohtas 90.00 25.92 93.56 45.00 24.04 85.27
Kaimur 35.00 10.08 69.17 18.00 9.42 63.52
Gaya 75.00 29.24 74.47 37.00 23.65 59.19
Jahanabad 15.00 7.74 68.80 8.00 7.63 66.65
Arwal 10.00 4.98 84.86 5.00 4.87 81.55
Nawada 40.00 30.70 150.07 20.00 21.00 100.87
Aurangabad 45.00 24.57 107.97 22.00 23.95 103.42
Bhagalpur 60.00 7.96 29.06 30.00 14.40 51.66
Banka 15.00 9.58 52.68 8.00 6.75 36.47
Munger 35.00 10.69 83.11 17.00 10.88 83.12
Sheikhpura 10.00 2.88 48.48 5.00 2.98 49.29
Jamui 15.00 7.54 47.68 8.00 7.37 45.80
Lakhisarai 10.00 2.97 32.75 5.00 2.94 31.86
Khagaria 10.00 3.08 21.28 5.00 2.53 17.18
Begusarai 55.00 16.57 62.39 27.00 13.07 48.36
Muzaffarpur 80.00 22.86 53.97 40.00 26.58 61.67
Sitamarhi 25.00 8.69 28.66 12.00 9.46 30.65
Sheohar 5.00 1.96 33.60 3.00 2.28 38.41
Vaishali 70.00 38.11 124.02 35.00 29.43 94.11
E. Champaran 50.00 29.51 85.78 25.00 23.71 67.72
W. Champaran 25.00 13.80 30.99 13.00 14.55 32.10
Darbhanga 70.00 28.39 76.20 35.00 38.80 102.34
Madhubani 55.00 31.10 76.95 27.00 21.94 53.34
Samastipur 50.00 20.63 53.76 25.00 19.40 49.68
Chhapra 140.00 76.32 207.82 70.00 62.79 168.01
Siwan 70.00 38.39 125.12 35.00 29.54 94.60
Gopalganj 45.00 29.15 119.79 22.00 24.82 100.23
Saharsa 25.00 13.19 77.37 13.00 13.18 75.97
Supaul 15.00 9.74 49.73 8.00 9.76 48.97
Madhepura 15.00 9.66 55.98 7.00 9.51 54.15
Purnea 40.00 13.08 45.48 20.00 14.91 50.95
Araria 15.00 4.62 18.93 8.00 5.75 23.16
Katihar 30.00 10.88 40.23 15.00 10.27 37.31
Kishanganj 15.00 5.54 37.80 7.00 4.60 30.85
Total 2000.00 815.08 86.87 1000.00 735.33 77.01
12

As further indicators of regional disparity, two more tables present the districtwise data on —
consumption of petroleum products (Table 1.9) and small savings in post-office and public
provident funds (Table 1.10). Taking into account petroleum consumption only, one notices that
Patna accounts for 19.1 percent of total petroleum consumption in Bihar. Other districts whose
share in petroleum consumption is substantially higher than their share in population are —
Rohtas, Bhagalpur, Begusarai, Vaishali, Darbhanga, Saran and Gopalganj. The districts with very
low consumption of petroleum are — Jehanabad, Arwal, Nawada, Sheikhpura, Jamui, Lakhisarai,
Khagaria and Sheohar. As regards the small savings in post-office and public provident fund, the
per capita savings in 2008-09 was the highest in Nalanda (Rs. 216), followed by Patna (Rs. 169),
Chhapra (Rs. 168), Aurangabad (Rs. 103), Darbhanga (Rs. 102), Nawada (Rs. 101) and Gopalganj
(Rs. 100). The four districts with the lowest per capita saving in 2008-09 are — Sitamarhi
(Rs. 31), Araria (Rs. 23) and Khagaria (Rs. 17).
1.3 Consumer Price Indices
Apart from computing an index of wholesale prices for the whole of the country, the central
government also prepares consumer price indices (CPI) for Industrial Labourers, Urban Non-
manual Employees, Agricultural Labourers and Rural Labourers, separately for different states.
These indices, however, have different base years — 1993-94 for Wholesale Price Indices, 2000-
01 for Industrial Labourers, 1984-85 for Urban Non-manual workers and 1986-87 for both for
Agricultural and Rural Labourers. Table 1.11 presents these Indices.
In 2007-08 and first eight months of 2008-09, it is observed that CPI for industrial labourers has
increased more in Bihar than in the country as whole. For urban non-manual employees (for
which indices for 2008-09 are not available), one again notices that CPI in Bihar has been rising
faster in Bihar than in the country as a whole. However, in the rural areas, the CPI has been
increasing at a slower pace in Bihar. This is true for CPI of both agricultural labourers as well as
rural labourers.
In November, 2009, the month for which the latest indices are available, the CPI stood at — 148
(Bihar) and 144 (India) for industrial labourers; 444 (Bihar) and 460 (India) for agricultural
labourers; and 444 (Bihar) and 460 (India) for rural labourers.
13

Table 1.11 : Wholesale and Consumer Price Indices in Bihar and India
Wholesale Price Index
(Base : 1993-94=100)
Industrial Labourers (Base : 2000-2001=100 )
Urban Non-Manual
Employees (Base : 1984-
85=100)
Agricultural Labourers
(Base : 1986- 1987=100)
Rural Labourers (Base : 1986-1987=100) Year
India Bihar India Bihar India Bihar India Bihar India
2001-02 161.3 98 100 359 390 290 311 292 313
2002-03 166.8 102 104 366 405 299 323 301 325
2003-04 180.0 109 108 382 420 311 322 313 335
2004- 05 187.3 112 112 396 436 324 342 326 344
2005- 06 195.6 120 117 418 456 347 358 348 360
2006-07 206.2 128 125 451 486 376 380 377 382
2007-08 215.8 136 133 484 515 403 409 403 409
Apr 211.5 130 128 464 501 391 394 391 395
May 212.3 128 129 461 503 385 395 386 396
Jun 212.3 130 130 463 506 385 399 385 400
Jul 213.6 134 132 475 514 390 404 391 404
Aug 213.8 138 133 482 515 400 408 400 408
Sep 215.1 141 133 490 516 408 410 408 410
Oct 215.2 142 134 494 520 415 413 415 413
Nov 215.9 142 134 495 519 413 414 413 414
Dec 216.4 139 134 492 518 411 413 411 413
Jan 218.2 136 134 496 520 409 413 409 414
Feb 219.9 136 135 496 523 413 417 413 417
2007
- 08
Mar 225.5 140 137 501 528 416 423 417 423
Apr 228.5 140 138 - - 422 429 422 429
May 231.1 140 139 - - 419 431 419 431
Jun 238.4 141 140 - - 421 434 421 435
Jul 240.7 145 143 - - 433 442 433 442
Aug 241.4 151 145 - - 440 450 440 450
Sep 241.3 151 146 - - 443 455 444 455
Oct 238.5 (P) 155 148 - - 446 459 446 459
2008
-09
Nov 233.6 (P) 154 148 - - 444 460 444 460
1.4 Governance
In the last three years, there has been a paradigm shift in the quality of governance. The various
recommendations of the Administrative Reform Commission, constituted earlier, are being
implemented gradually. All the instruments of the state which facilitate social justice, reform and
development are being strengthened either by technological upgradation or by massive training of
the personnel. Most of the government offices, after years of neglect, are now being
14

technologically equipped. The offices are being furnished appropriately and its exterior is getting
the necessary facelifts to make them presentable. There is a concerted effort to make the work
atmosphere congenial to both staff and as well as visitors. To understand the travails and trauma of
the people, the Chief Minister has started the innovative practice of direct feedback by organizing
the weekly ‘Janta Ke Darbar Me Mukhyamantri’. Earlier, the interactions were on general topic,
but later these 'Durbars' were organized around specific issues. An immediate fallout of this
process is that this process is now being duplicated by District Magistrates on a weekly or
fortnightly basis, thereby helping to alleviate miseries of a vast majority of the public After
completion of the three year tenure of the present government, the Chief Minister has also started
'Vikash Yatra' in select districts, to understand the impact of governance in rural Bihar. The 'Yatra'
would also reveal whether a bridge has been built between the state machinery and the people, so
that there is inbuilt mechanism for inclusive governance. The governance in Bihar is no more
considered as an esoteric concept, but it is being tested on a concurrent basis to assess its
fructification on ground.
Structure of Public Administration
In 2007-08, the total sanctioned strength of the state administration was 5.79 lakh employees, but
only 76.0 percent of these post were filled up. (Tables 1.12 and 1.13). During the last six years
(2002-03 to 2007-08), the total strength of the state administration in terms of sanctioned posts has
increased only marginally (1.2 percent), but their composition has changed, as some departments
have experienced expansion, just as others have faced shrinkage. Among the departments that
have faced substantial shrinkage are included — Large/Medium Irrigation (82.8 percent), Flood
Control and Damage (38.3 percent), Industry (35.5 percent) and Tourism (39.4 percent). On the
other hand, the departments that have experienced substantial expansion include — Vehicle Tax
(25.3 percent), Treasury Administration (270.8 percent), Family Welfare (1074.4 percent) and
Water Supply and Sanitation (190.3 percent).
As regards the actual strength of public administration, it was 76.0 percent of the sanctioned
strength in 2007-08, implying about 4.40 lakh state government employees. Over the years, this
ratio of filled up posts has varied between 80.7 percent in 2002-03 to 76.0 percent in 2007-08.
However, the extent of filling up posts is not uniform across the departments. While only 21.7
posts of the Department of Urban Development is filled up, there are several departments
where the ratio is close to 100 percent. Table 1.14 presents the distribution of departments of the
15

Table 1.12 : Sanctioned Strength of Different Departments in State Government
Department 2002-03 2003-04 2004-05 2005-06 2006-07 2007-08 Increase/ Decrease
(%)
State Legislative 2026 2784 2851 2228 1822 1925 -5.0
Governor office 158 154 154 155 155 155 -1.9
Administration (Judiciary) 11686 11467 11470 11480 11689 11687 0.0
Election Commission 401 398 397 397 397 397 -1.0
Land Revenue 14520 14519 15076 15045 15041 15042 3.6
Stamp and Registration 1960 2005 2010 1915 1915 1916 -2.2
State Excise 1883 1877 1877 1876 1876 1876 -0.4
Sale Tax 2291 2275 2299 2298 2266 2266 -1.1
Vehicle tax 364 364 364 478 456 456 25.3
Other Tax 59 60 60 62 68 67 13.6
Other Fiscal Services 252 252 252 233 237 237 -6.0
Public Service Commission 285 318 315 351 339 351 23.2
Secretariat General Services 4116 4146 4388 2741 3444 3475 -15.6
District Administration 7711 8142 8142 8027 8027 8027 4.1
Treasury Administration 452 452 452 1782 1670 1676 270.8
Police 105176 104884 104920 110536 110977 110793 5.3
Prison 2989 2989 2989 2989 2989 2989 0.0
Stationary and Printing 1417 1508 1508 1549 1551 1551 9.5
Public Work 6797 6781 6673 6503 6499 6493 -4.5
Other Administrative Services 4530 4519 4526 3838 4008 3993 -11.9
General Education 230480 230966 230966 218410 221992 221945 -3.7
Technical Education 1442 1442 1442 1475 1475 1475 2.3
Sports and Youth Services 1117 1118 1109 1115 1114 1114 -0.3
Art and Culture 492 512 512 506 493 472 -4.1
Medical and Public Health 44617 44600 44602 52943 53013 56303 26.2
Family Welfare 172 172 172 2020 2020 2020 1074.4
Water Supply and Sanitation 3799 9458 9217 8859 8847 11030 190.3
Urban Development 284 339 284 247 253 253 -10.9
Information / Advertisement 854 849 849 829 794 790 -7.5
Welfare of SC/ ST/ OBC 3026 3026 3026 3596 3596 3596 18.8
Labour and Employment 3927 3929 3839 3852 3862 3860 -1.7
Social Security and Welfare 1502 1508 1544 1597 1371 1292 -14.0
Disaster management 0 154 150 150 150 150 100.0
Other Social Services 68 71 70 54 54 75 10.3
Secretariat Social Services 776 855 935 887 937 875 12.8
…..(Contd.)
16

Table 1.12 : (Contd.)
Department 2002-03 2003-04 2004-05 2005-06 2006-07 2007-08Increase/ Decrease
(%)
Agriculture 13479 12809 12802 12480 12268 12267 -9.0
Soil and Water Protection 373 377 377 379 379 379 1.6
Animal Husbandry 8492 8479 8191 7916 7905 9998 17.7
Dairy Development 328 328 348 351 316 335 2.1
Pisciculture 991 990 987 1158 1158 1158 16.9
Horticulture / Wild Life 2248 2453 2453 2528 2528 2401 6.8
Agricultural Research and Extension 271 462 462 271 271 271 0.0
Cooperative 3485 3813 3687 3553 3556 3556 2.0
Other Agricultural Programme 112 106 106 107 107 107 -4.5
Other Rural Development Work 24403 24389 24389 23709 23709 23696 -2.9
Major Irrigation - - - 6318 6415 6415 -
Large/ Medium Irrigation 20189 17154 10656 6857 6847 3471 -82.8
Minor Irrigation 10711 10711 10361 10366 10366 10366 -3.2
Flood Control and Drainage 4723 4212 3313 3078 2913 2913 -38.3
Rural / Small Scale Industry 1321 1296 1295 1256 1518 1518 14.9
Industry 1265 1285 1295 956 956 816 -35.5
Non-Ferous Mining / Industry 576 578 576 579 570 571 -0.9
Civil Aviation 55 55 55 54 56 56 1.8
Roads and Bridges 12819 12820 12820 12864 12939 12860 0.3
Other Transport Services 31 32 32 31 31 30 -3.2
Secretariat Economic Services 979 1044 1082 1076 1161 1150 17.5
Tourism 277 277 277 240 221 168 -39.4
Census/ survey/ Statistics 1438 1546 1546 1439 1439 1439 0.1
Civil Supply 1725 1739 1803 2145 2146 2155 24.9
Other General Economic Services 492 500 500 488 492 492 0.0
Total 572412 576348 568853 571222 575664 579210 1.2
(Concluded)
state government by percentage of posts filled up. Some of the department whose role in
governance and development is very important, but suffer from inadequate strength are —
Agriculture (43.4 percent), Census, Survey and Statistics (55.4 percent), Labour and Employment
(54.3 percent), Civil Supply (53.2 percent) and Medical and Public Health (57.3 percent).
17

Table 1.13 : Working Strength of Different Departments in State Government (In Percentage)
Department 2002-03 2003-04 2004-05 2005-06 2006-07 2007-08
State Legislative 63.7 56.5 57.5 67.1 82.0 82.5
Governor office 100.0 99.4 99.4 97.4 100.0 98.7
Administration (Judiciary) 98.7 98.8 99.6 99.4 95.4 95.5
Election Commission 75.8 74.1 71.5 67.8 74.8 76.6
Land Revenue 80.8 80.4 80.5 80.0 78.7 79.4
Stamp and Registration 79.0 78.9 79.2 92.8 93.0 93.1
State Excise 83.2 80.9 80.8 81.0 86.1 86.1
Sale Tax 66.2 66.2 66.7 66.8 66.6 66.5
Vehicle tax 86.5 86.3 77.5 64.6 68.0 74.6
Other Tax 61.0 55.0 58.3 46.8 50.0 47.8
Other Fiscal Services 69.0 67.5 67.5 70.8 57.0 57.0
Public Service Commission 89.8 87.7 89.5 78.9 85.0 83.8
Secretariat General Services 59.4 58.2 54.1 63.7 67.5 66.0
District Administration 84.5 81.4 81.4 15.3 83.0 84.3
Treasury Administration 89.6 89.6 89.6 18.5 59.9 59.8
Police 85.5 82.1 81.7 77.1 77.6 77.5
Prison 78.3 70.7 70.7 71.2 70.7 67.0
Stationary and Printing 49.3 47.5 47.5 43.2 40.9 41.0
Public Work 70.7 72.1 68.9 69.1 68.3 66.6
Other Administrative Services 59.0 59.3 59.4 51.8 51.9 50.6
General Education 85.1 84.1 84.1 92.2 81.2 81.4
Technical Education 78.0 78.0 78.0 59.5 57.8 56.7
Sports and Youth Services 77.6 74.3 69.2 70.9 72.8 72.0
Art and Culture 78.5 76.4 75.2 72.7 74.2 75.8
Medical and Public Health 81.9 71.3 69.7 52.1 61.3 57.3
Family Welfare 98.3 98.3 94.2 8.0 66.4 67.9
Water Supply and Sanitation 80.8 90.6 86.9 88.6 88.7 91.4
Urban Development 41.5 37.8 36.6 21.9 23.7 21.7
Information / Advertisement 67.3 66.7 65.6 64.8 67.4 64.1
Welfare of SC/ ST/ OBC 67.5 59.5 59.6 51.3 67.2 69.8
Labour and Employment 64.5 62.6 55.4 51.3 51.6 54.3
Social Security and Welfare 88.7 77.3 74.6 63.0 70.8 81.1
Disaster management - 76.0 78.7 74.7 70.7 70.7
Other Social Services 64.7 60.6 62.9 1.9 50.0 57.3
Secretariat Social Services 66.6 65.5 62.7 57.6 69.8 74.3
…..(Contd.)
18

Table 1.13 : (Contd.)
Department 2002-03 2003-04 2004-05 2005-06 2006-07 2007-08
Agriculture 16.8 52.7 47.0 43.4 43.7 43.4
Soil and Water Protection 70.0 66.0 56.2 53.0 51.5 51.2
Animal Husbandry 47.8 66.6 68.8 63.8 62.1 65.5
Dairy Development 75.9 73.5 73.0 0.0 73.7 61.5
Pisciculture 69.1 61.4 66.0 0.0 61.5 56.7
Horticulture / Wild Life 83.6 80.5 80.5 81.6 73.1 77.8
Agricultural Research and Extension 66.8 78.4 77.1 75.3 78.2 75.3
Cooperative 61.6 60.0 61.1 50.6 51.7 51.7
Other Agricultural Programme 40.2 95.3 91.5 92.5 92.5 89.7
Other Rural Development Work 79.3 76.3 73.8 75.5 71.5 70.8
Major Irrigation - - - 129.4 115.8 118.0
Large/ Medium Irrigation 78.1 78.5 119.7 56.8 93.2 93.2
Minor Irrigation 87.8 87.8 85.1 80.1 79.7 79.3
Flood Control and Drainage 74.5 78.9 97.2 100.2 96.2 101.9
Rural / Small Scale Industry 73.4 68.2 61.3 56.8 52.2 51.8
Industry 73.2 65.0 60.5 48.1 46.9 52.3
Non-Ferous Mining / Industry 85.9 86.2 87.2 84.3 71.8 71.8
Civil Aviation 70.9 65.5 65.5 64.8 62.5 58.9
Roads and Bridges 84.2 82.2 81.8 81.5 79.7 80.5
Other Transport Services 58.1 56.3 68.8 61.3 54.8 56.7
Secretariat Economic Services 74.4 71.8 68.8 66.7 66.1 68.4
Tourism 73.3 73.3 73.3 59.2 49.8 51.8
Census/ survey/ Statistics 64.3 56.3 53.0 52.5 55.3 55.4
Civil Supply 56.4 48.6 46.9 50.3 46.3 53.2
Other General Economic Services 13.6 58.6 58.4 48.0 50.2 53.0
Total 80.7 79.7 79.9 77.9 76.2 76.0
(Concluded)
19

Table 1.14 : Distribution of Departments of the State Government by Percentage of Post Filled Up
Percentage of post filled up
No of Department
Name of Departments
Less than 40 Percent
1 Urban Development
41 to 50 Percent
3 Other Tax/ Agriculture/ Stationary and Printing
50 to 60 Percent
18
Treasury and A G Administration/ Civil Aviation/ Other Social Services/ Other Fiscal Services/ Pisciculture/ Technical Education/ Statistics (Census/ survey) / Labour and Employment/ Civil Supply/ Industry/ Tourism/ Rural / Small Scale Industry/ Soil and Water Protection/ Other Administrative Services/ Medical and Public Health/ Other Transport Services/ Other General Economic Services/Cooperative
51 to 60 Percent
10 Welfare (SC/ ST/ OBC) /Secretariat Economic Services /Family Welfare/
Public Work/ Sale Tax /Secretariat General Services /Information and Advertisement /Dairy Development/ Prison /Animal Husbandry
70 to 80 Percent
13
Land Revenue/ Minor Irrigation/ Horticulture and Wild Life/ Election Commission/ Art and Culture/ Agricultural Research and Extension/ Secretariat Social Services/ Sports and Youth Services/ Industry (Non-Ferous Mining) / Police/ Vehicle tax/ Other Rural Development Work/ Disaster management
80 to 90 Percent
8 Other Agricultural Programme/ State Excise/ District Administration/ State Legislative/ General Education/ Social Security and Welfare/ Public Service Commission/ Roads and Bridges
Above 90 Percent
7 Major Irrigation/ Flood Control and Drainage/ Governor office/ Irrigation (Large/ Medium) / Stamp and Registration/ Water Supply and Sanitation/ Administration (Judiciary)
Apart from being distributed among the various departments, the state government employees are
also divided into four major grades. The percentage distribution of the employees among these
grades in various departments is presented in Table 1.15. For the entire state government
employees, taking into account the sanctioned post, the distribution of posts is as follows — Grade
1 (1.4 percent), Grade 2 (4.1 percent), Grade 3 (64.9 percent) and Grade 4 (29.6 percent). This
indicates that Grade 4 employees, whose productivity is rather low, comprise more than one-
fourth of state government employees. If one takes into account, the working employees, the share
of Grade 4 employees is even higher at 33.0 percent.
20

Table 1.15 : Gradewise Sanctioned and Working Strength in Different Departments of State Government
Number of employees Department
Sanctioned/ Working Grade 1 Grade 2 Grade 3 Grade 4
Total
Sanctioned 45 (6.9) 129 (19.9) 157 (24.2) 317 (48.9) 648 (100.0) State Legislative Working 32 (6.5) 115 (23.3) 102 (20.7) 244 (49.5) 493 (100.0) Sanctioned — 9 (47.4) — 10 (52.6) 19 (100.0)
Parliamentary Work Working — 5 (50.0) — 5 (50.0) 10 (100.0) Sanctioned 69 (15.1) 3 (0.7) 54 (11.8) 330 (72.4) 456 (100.0)
Personnel & Administrative Reforms Working 64 (28.2) 2 (0.9) 25 (11.0) 136 (59.9) 227 (100.0) Sanctioned 5 (4.2) 1 (0.8) 33 (27.7) 80 (67.2) 119 (100.0)
Governor office Working 5 (4.8) 1 (1.0) 34 (32.4) 65 (61.9) 105 (100.0) Sanctioned 87 (42.6) 7 (3.4) 106 (52.0) 4 (2.0) 204 (100.0)
Patna High Court Working 73 (39.0) 7 (3.7) 103 (55.1) 4 (2.1) 187 (100.0)
Sanctioned 32 (0.8) 839 (19.8) 1832 (43.2) 1535 (36.2) 4238 (100.0) Finance
Working 22 (0.9) 465 (19.5) 811 (34.0) 1088 (45.6) 2386 (100.0)
Sanctioned 1564 (13.6) 2 (0.0) 4939 (43.0) 4985 (43.4) 11490 (100.0) Legal
Working 1233 (11.9) 0 (0.0) 4868 (47.0) 4247 (41.0) 10348 (100.0) Sanctioned 2 (1.0) 87 (42.4) 108 (52.7) 8 (3.9) 205 (100.0)
Election Commission Working 3 (3.4) 46 (52.9) 34 (39.1) 4 (4.6) 87 (100.0)
Sanctioned 75 (5.1) 150 (10.1) 1248 (84.10) 11 (0.7) 1484 (100.0) Planning and Development
Working 36 (4.6) 53 (6.8) 689 (87.9) 6 (0.8) 784 (100.0)
Sanctioned 773 (5.1) 928 (6.1) 9361 (61.8) 4074 (26.9) 15136 (100.0) Land Revenue
Working 613 (5.2) 567 (4.8) 7453 (62.7) 3253 (27.4) 11886 (100.0)
Sanctioned 46 (1.2) 132 (3.5) 2221 (59.4) 1339 (35.8) 3738 (100.0) Stamp and Registration
Working 40 (1.2) 101 (3.1) 1847 (56.7) 1272 (39.0) 3260 (100.0)
Sanctioned 81 (2.5) 308 (9.6) 31 (1.0) 2794 (86.9) 3214 (100.0) Commercial Tax
Working 58 (2.1) 275 (10.1) 28 (1.0) 2370 (86.8) 2731 (100.0) Sanctioned 0 (0.0) 16 (48.5) 16 (48.5) 1 (3.0) 33 (100.0)
Bihar Public Service Commission Working 1 (4.2) 10 (41.7) 12 (50.0) 1 (4.2) 24 (100.0) Sanctioned 36 (1.9) 34 (1.8) 1705 (92.1) 77 (4.2) 1852 (100.0)
Secretariat Working 21 (1.5) 15 (1.1) 1285 (93.4) 55 (4.0) 1376 (100.0)
Sanctioned 64 (0.7) 9 (0.1) 8696 (95.1) 379 (4.1) 9148 (100.0) Panchayati Raj
Working 45 (0.7) 7 (0.1) 5944 (95.2) 247 (4.0) 6243 (100.0)
Sanctioned 110 (11.5) 62 (6.5) 233 (24.4) 550 (57.6) 955 (100.0) Art and Culture
Working 99 (13.3) 29 (3.9) 139 (18.7) 477 (64.1) 744 (100.0)
Sanctioned 1344 (2.4) 5728 (10.2) 24776 (44.1) 24301 (43.3) 56149 (100.0) Health
Working 776 (2.1) 4257 (11.6) 14865 (40.5) 16850 (45.9) 36748 (100.0) Sanctioned 100 (1.3) 219 (2.8) 3504 (45.5) 3885 (50.4) 7708 (100.0)
Public Health Engineering Working 72 (1.2) 87 (1.5) 2544 (42.6) 3266 (54.7) 5969 (100.0) Sanctioned 217 (0.3) 1364 (1.8) 21889 (29.4) 51011 (68.5) 74481 (100.0)
Home Working 148 (0.3) 985 (1.7) 14947 (26.1) 41086 (71.9) 57166 (100.0) Sanctioned 20 (16.0) 42 (33.6) 62 (49.6) 1 (0.8) 125 (100.0)
Urban Development Working 3 (10.0) 6 (20.0) 20 (66.7) 1 (3.3) 30 (100.0) Sanctioned 305 (0.1) 3729 (1.8) 199294 (97.7) 726 (0.4) 204054 (100.0)
Human Resource Development Working 234 (0.2) 2902 (2.1) 135614 (97.4) 447 (0.3) 139197 (100.0)Sanctioned 18 (3.3) 44 (8.0) 276 (50.3) 211 (38.4) 549 (100.0)
Information / Public Relation Working 13 (3.9) 22 (6.6) 141 (42.6) 155 (46.8) 331 (100.0) Sanctioned - 7 (53.8) 6 (46.2) - 13 (100.0)
Information Technology Working - 0 (0.0) 3 (100.0) - 3 (100.0) Sanctioned 182 (11.8) 32 (2.1) 1207 (78.0) 127 (8.2) 1548 (100.0)
Science and Technology Working 119 (18.9) 11 (1.7) 399 (63.3) 101 (16.0) 630 (100.0)
…..(Contd.)
21

Table 1.15 : (Contd.)
Number of employees Sanctioned/ Working
Department Grade 1 Grade 2 Grade 3 Grade 4
Total
Sanctioned 52 (1.9) 168 (6.2) 1865 (68.3) 645 (23.6) 2730 (100.0) Welfare of SC/ ST/ OBC
Working 43 (2.3) 161 (8.5) 1251 (66.2) 435 (23.0) 1890 (100.0) Sanctioned - 58 (59.8) - 39 (40.2) 97 (100.0)
Welfare of BC/ EBC Working - 58 (65.9) - 30(34.1) 88 (100.0) Sanctioned 2 (5.1) 9 (23.1) 22 (56.4) 6 (15.4) 39 (100.0)
Welfare of BC/ EBC Working 0 (0.0) 8 (28.6) 14 (50.0) 6 (21.4) 28 (100.0) Sanctioned 103 (0.6) 1489 (8.6) 15592 (89.8) 172 (1.0) 17356 (100.0)
Labour Resource Working 47 (0.5) 961 (9.5) 8942 (88.3) 177 (1.7) 10127 (100.0)Sanctioned 11 (0.70) 87 (5.4) 202 (12.6) 1299 (81.2) 1599 (100.0)
Social Welfare Working 10 (1.1) 18 (2.1) 79 (9.0) 771 (87.8) 878 (100.0) Sanctioned 3 (4.0) 1 (1.3) 58 (77.3) 13 (17.3) 75 (100.0)
Disaster management Working 3 (4.8) 0 (0.0) 51 (81.0) 9 (14.3) 63 (100.0) Sanctioned 27 (1.8) 58 (3.8) 1303 (85.8) 131 (8.6) 1519 (100.0)
Food & Consumer Protection Working 20 (2.4) 1 (0.1) 715 (86.0) 95 (11.4) 831 (100.0) Sanctioned 136 (0.6) 1126 (4.6) 20179 (82.6) 2991 (12.2) 24432 (100.0)
Agriculture Working 94 (0.6) 662 (4.2) 13584 (86.4) 1389 (8.8) 15729 (100.0)Sanctioned 29 (0.4) 1445 (18.8) 4123 (53.6) 2089 (27.2) 7686 (100.0)
Animal Husbandry /Pisciculture Working 14 (0.3) 869 (21.5) 1610 (39.9) 1541 (38.2) 4034 (100.0) Sanctioned 12 (0.5) 14 (0.6) 1609 (71.8) 605 (27.0) 2240 (100.0)
Energy Working 10 (0.5) 1 (0.0) 1077 (51.7) 996 (47.8) 2084 (100.0)
Sanctioned 42 (2.1) 28 (1.4) 736 (36.6) 1207 (60.0) 2013 (100.0) Environment / Forestry
Working 35 (2.2) 37 (2.3) 562 (35.2) 964 (60.3) 1598 (100.0) Sanctioned 36 (1.1) 947 (29.0) 2282 (69.9) 1 (0.0) 3266 (100.0)
Cooperative Working 20 (1.3) 672 (42.7) 881 (56.0) 1 (0.1) 1574 (100.0)
Sanctioned 7 (0.1) 1561 (13.5) 9915 (86.0) 50 (0.4) 11533 (100.0)Rural Development
Working 3 (0.0) 1193 (16.1) 6206 (83.6) 22 (0.3) 7424 (100.0)
Sanctioned 12 (1.6) 89 (12.1) 99 (13.5) 536 (72.8) 736 (100.0) Rural Work
Working 8 (1.0) 69 (8.5) 101 (12.4) 636 (78.1) 814 (100.0) Sanctioned 49 (0.1) 24 (0.0) 8496 (14.0) 52325 (85.9) 60894 (100.0)
Water Resource Working 29 (0.1) 11 (0.0) 7676 (15.1) 43069 (84.8) 50785 (100.0)Sanctioned 46 (0.6) 18 (0.2) 5701 (73.8) 1963 (25.4) 7728 (100.0)
Minor Irrigation Working 27 (0.4) 5 (0.1) 4582 (73.4) 1626 (26.1) 6240 (100.0) Sanctioned 51 (2.2) 42 (1.8) 1595 (69.0) 623 (27.0) 2311 (100.0)
Industry Working 31 (2.3) 19 (1.4) 979 (71.3) 345 (25.1) 1374 (100.0) Sanctioned 18 (3.0) 155 (25.6) 411 (67.8) 22 (3.6) 606 (100.0)
Sugarcane Industry Working 5 (2.8) 37 (20.6) 125 (69.4) 13 (7.2) 180 (100.0) Sanctioned 17 (3.4) 66 (13.1) 273 (54.4) 146 (29.1) 502 (100.0)
Non-Ferous Mining / Industry Working 13(3.5) 25 (6.7) 230 (62.0) 103 (27.8) 371 (100.0) Sanctioned 53 (1.9) 406 (14.5) 1273 (45.4) 1070 (38.2) 2802 (100.0)
Building Construction Working 21 (0.9) 208 (8.7) 790 (32.9) 1382 (57.6) 2401 (100.0) Sanctioned 78 (1.2) 85 (1.3) 3139 (49.0) 3099 (48.4) 6401 (100.0)
Roads Construction Working 57 (1.1) 59 (1.2) 2360 (47.0) 2543 (50.7) 5019 (100.0) Sanctioned 17 (6.1) 96 (34.5) 157 (56.5) 8 (2.9) 278 (100.0)
Transport Services Working 15 (7.9) 77 (40.7) 91 (48.1) 6 (3.2) 189 (100.0)
Sanctioned 1 (1.3) 21 (26.9) 56 (71.8) 78 (100.0) Tourism
Working 1 (2.9) 7 (20.6) 26 (76.5) 34 (100.0) Sanctioned 1786 (29.2) 1055 (17.2) 3025 (49.5) 250 (4.1) 6116 (100.0)
Vigilance Working 1238 (27.6) 681 (15.2) 2366 (52.8) 198 (4.4) 4483 (100.0) Sanctioned 7763 (1.4) 22929 (4.1) 363865 (65.0) 166046 (29.6) 560603 (100.0)
Total Working 5454 (1.4) 15807 (4.0) 246205 (61.7) 131737 (33.0) 399203 (100.0)
(Concluded)
22

Bihar Prashasanik Sudhar Mission (BPSM)
The BPSM is an initiative of the government to strengthen the state administrative machinery.
This mission will encompass the entire state, from the state capital to the districts. The BPSM was
launched by the Chief Minister on November, 2008. The Mission enables the government to
deliver better quality services to all its citizens, particularly the poorest and the excluded. It is now
supported by DFID, a development agency of the British Government, by providing technical
expertise and finance. The major objectives of the Mission are :
(i) Faster, more transparent and more efficient government administration to serve the people
better.
(ii) Better trained and motivated public servants to work with a citizen-oriented approach.
(iii) Better delivery of government services which is measurable, initially in land revenue and
land registration, education, personnel, commercial taxes etc.
(iv) Establish a 'Centre for Good Governance' (CGG), oriented to Bihar's specific needs and
situation.
The Mission is a public commitment to deliver tangible improvements in the delivery of services
at all levels of governance through people-centered tools including citizen's charters, score cards,
public information dissemination and more responsive public grievance systems. These objectives
are to be achieved through a series of reforms so as to benefit citizens with increased efficiency in
government functioning and motivation among the public servants. Some of the important
measures are (i) modernization of district collectorates, through improved procedures, better staff
structure and e-governance; (ii) land registration information on internet, (iii) online access to
different certificates, (iv) digitization of old registration records; (v) better records management;
(vi) speedy disposal of files through e-file movement at selected collectorates on pilot basis; (vii)
modern and comprehensive HR policy, (viii) greater and better compliance of RTI requests; (ix)
better management of litigations; and (x) strengthening of training institutions.
In order to make administrative reform effective, it will first be started at the departmental level
and the identified departments are : (a) Department of Personnel and Administrative Reforms; (b)
23

Revenue and Land Reforms (including District Collectorates), (c) Commercial Taxes, (d)
Registration and Prohibition; (e) Human Resource Development (Education), (f) Home (Police
and Jail) and (g) Transport department. The dedicated Reform Support Units (RSU) are proposed
to be created within focal departments to : (i) design a departmental reform strategy with target,
timeline, etc., (ii) identify the existing bottlenecks with plans to overcome them; and (iii) support
department head in implementing reform strategy, monitoring and communicating with public.
The key beneficiaries will include the citizens of the state, particularly the poor and the excluded,
senior decision makers in the state government, and the state government employees benefiting
from better skills and motivation. The district collectorates will be modernized in terms of E-
PABX facilities, provision of modern storage of records, simplification of procedures, ISO
certification of collectorates, filling up of vacancies, adoption of suitable e-governance, etc. The
Department of Information Technology will execute e-governance related activities and for
expansion of Information Technology in the state.
Law and Order
Governance and development are directly correlated. Responsive governance is important for
speedy development of the state and its economy. In particular, the law and order situation of any
state is an important indicator of governance. If law and order is maintained properly and crime is
controlled, it creates a conducive atmosphere for investments, both domestic as well as foreign,
thereby bringing about overall economic growth and socio-cultural development.
Comparative Crime Rates : During the year 2007, the all-India average crime rate (number of
crime per lakh of population) was 175 with Pondicherry (475) at the top, followed by Chandigarh
(348), and Delhi (335). Among the major states, the highest crime rate of 319 was reported from
Kerala (319), closely followed by Madhya Pradesh (296) and Tamilnadu (262). The states which
reported crime rate of less than 100 during the reference year were West Bengal (93), Meghalaya
(83), Lakhshadweep (82), Uttar Pradesh (80) and Nagaland (54). Among all the 35 states and
union territories, Bihar with a crime rate of 118 stood at 28th position in the country. The details
may be obtained from the Table 1.16. From the table, it is derived that Bihar has come a long way
24

in improving its law and order situation and consequently lowering of the crime rates as compared
to other states. Table 1.16 : Statewide IPC Crime Rate During 2007
Sl. No.
States & Uts Crime Rate &
Ranking
Sl. No.
States & Uts Crime Rate &
Ranking 1 Pondicherry 475.40 19 D & N Haveli 165.40 2 Chandigarh 348.30 20 Goa 155.30 3 Delhi 335.10 21 Assam 152.90 4 Kerala 319.10 22 Daman & Diu 141.30 5 Madhya Pradesh 295.60 23 Orissa 138.50 6 Tamil Nadu 261.70 24 Punjab 135.60 7 Rajasthan 232.90 25 Jharkhand 129.40 8 Gujarat 220.50 26 Manipur 125.10 9 Haryana 219.30 27 Tripura 122.80 10 Himachal Pradesh 218.50 28 Bihar 117.90 11 Andhra Pradesh 214.60 29 Sikkim 113.20 12 Mizoram 214.30 30 Uttarakhand 102.10 13 Karnataka 211.70 31 West Bengal 93.00 14 A & N Islands 199.30 32 Meghalaya 82.70 15 Chhattisgarh 196.00 33 Lakshadweep 82.40 16 Arunachal Pradesh 192.10 34 Uttar Pradesh 79.70 17 Maharastra 184.70 35 Nagaland 54.40 18 Jammu & Kashmir 177.20 All India Average 175.10
Statewise IPC Crime Rate During 2007
475.
40
348.
30
335.
10
319.
10
295.
60
261.
70
232.
90
220.
50
219.
30
218.
50
214.
60
214.
30
211.
70
199.
30
196.
00
192.
10
184.
70
177.
20
165.
40
155.
30
152.
90
141.
30
138.
50
135.
60
129.
40
125.
10
122.
80
117.
90
113.
20
102.
10
93.0
0
82.7
0
82.4
0
79.7
0
54.4
0
0.00
50.00
100.00
150.00
200.00
250.00
300.00
350.00
400.00
450.00
500.00
Pon
dich
erry
Cha
ndig
arh
Del
hi
Ker
ala
Mad
hya
Pra
desh
Tam
il N
adu
Raj
asth
an
Guj
arat
Har
yana
Him
acha
l Pra
desh
And
hra
Pra
desh
Miz
oram
Kar
nata
ka
A &
N I
slan
ds
Chh
attis
garh
Aru
nach
al P
rade
sh
Mah
aras
tra
Jam
mu
& K
ashm
ir
D &
N H
avel
i
Goa
Ass
am
Dam
an &
Diu
Ori
ssa
Pun
jab
Jhar
khan
d
Man
ipur
Tri
pura
Bih
ar
Sik
kim
Utta
rakh
and
Wes
t Ben
gal
Meg
hala
ya
Lak
shad
wee
p
Utta
r P
rade
sh
Nag
alan
d
Crime Rate& R ki
25

With the present government coming to power, one of its priorities in governance was
improvement in law and order and, accordingly, police organisation has strengthened with
provisions of required basic infrastructure. These endeavors have brought positive results and
there has been an appreciable improvement in law and order. No significant caste or communal
clash has been reported. As may be discerned from Table 1.17, there has been a decline in major
crimes including murder (-3.2 percent), dacoity (-10.16 percent), robbery (-4.99 percent),
kidnapping for ransom (-22.9 percent), bank robbery (-15.03 percent), etc. during 2001-08. The
decline became very sharp since 2004. It was the sharpest in the case of kidnapping for ransom.
Table 1.17 : Number of IPC Crimes in Bihar from 2001-2008
Number of Crime CAGR Name of Crime
2001 2002 2003 2004 2005 2006 2007 2008 2001-08 2004-08
Murder 3619 3634 3652 3861 3423 3225 2963 3029 -3.23 -6.10
Dacoity 1293 1259 1203 1297 1191 967 646 640 -10.16 -18.33
Robbery 2175 2236 2425 2909 2379 2138 1729 1536 -4.99 -14.75
Kidnapping for Ransom
385 396 335 411 251 194 89 66 -22.99 -37.47
Road Dacoity 257 252 247 287 224 211 151 146 -8.26 -16.02
Road Robbery 1296 1323 1430 1875 1310 1251 1109 897 -4.90 -15.14
Bank Dacoity 22 28 14 30 26 15 19 16 -4.77 -14.54
Bank Robbery 18 15 15 27 8 5 9 7 -15.03 -22.76
Extremism: There has also been an appreciable drop in the cases of extremism in the state over the
years. As against 382 cases reported in 2004, only 79 cases have been reported in 2008. The drop in
the number of cases is largely due to the holistic development programme 'Apke Sarkar Apke Dwar'
and other initiatives of the state government aimed at employment and income generation in the
affected areas. Apart from social cooption, the security apparatus of the state administration was
strengthened by deployment of para-military, special training to police personnel and strengthened
police infrastructure etc. The details of extremist scenario can be obtained from Table 1.18.
26

Table 1.18 : Overview of Naxal Violence in Bihar
Description 2004 2005 2006 2007 2008
Drop(-) / Increase(+)
in 2008 over 2004
No. of Violent attacks 382 210 63 73 79 -79.32
No. of civilian deaths 199 114 49 39 43 -78.39
No. of attacks on Police 19 14 7 10 5 -73.68
No. of killed extremists (encounter attack on police)
3 15 6 10 31 933.33
No. of arrested Naxalites 107 277 446 579 450 320.56
No. of Naxalites surrendered
1 74 21 29 20 1900.00
No. of seized police arms 6 14 9 21 18 200.00
No. of seized ammunition 85 275 146 162 133 56.47
No. of seized bullets 1050 2125 1193 4810 17098 1528.38
Amount of seized explosives (kgs.)
80 49 2500 7459 -
No. of seized Detonators 7401 472 480 2916 24147 226.27
No. of seized cane bomb/ landmines
- 19 17 65 192 -
Levy Money seized - 70820 30470 591131 729700 -
Crime Rates in Districts: The lowering of crime rate is also reflected at nearly all the districts. The
improvement in 2008 over 2005 is almost uniformly visible in all the districts (Appendix I to VI).
Most of the districts reported a drop in murder, ranging from the highest of 42 percent in
Sheikhpura to the lowest of 1.5 percent in West Champaran. The districts of Vaishali, Darbhanga
and Saharsa recorded an increase of around 76 percent each during the period. Other crimes like
dacoity, robbery, road robbery, kidnapping, etc. also registered a uniform drop in 2008 over 2005.
However, while the districts like West Champaran, Railway Katihar and Saharsa showed higher
increase in dacoity cases, the districts of West Champaran, Saharsa, Samastipur and Sheohar
reported an increase in robbery cases over the period. As may be seen, only a few stray cases of
kidnapping, road dacoity and road robbery were reported from some of the districts and that too had
recorded a decline.
Conviction: It is an admitted fact that the crime rate is directly related to the conviction of
criminals. The absence of conviction tends to embolden the criminals to commit more crimes,
whereas their quick conviction acts as a major deterrent. From this perspective, it is noticed that the
total number of IPC cases were 2178 (2006), 3695 (2007) and 4461 (Upto November, 2008). This
27

implied a growth of 70 percent (between 2006 and 2007) and 20 percent (between 2007 and 2008).
In cases relating to the Arms Act, the growth rate in number was actually negative. The conviction
rates have been very high in all the three years of 2006, 2007 and 2008. For IPC cases, the growth
rate in number of criminals convicted has been 68 percent (between 2006 and 2007) and 25 percent
(between 2007 and 2008) (Table 1.19)
Table 1.19 : Convictions of Criminals (January 2006 to November, 2008)
No. of Cases No. of Convicted
Criminals Category of Punishment
Month
IPC Arms Act
IPC Arms Act
Death sentence
Life Imprisonment
More than 10
yrs.
Less than 10 yrs.
Total Conviction
2006 2178 1156 5230 1609 17 1389 366 5067 6839
2007 3695 800 8774 1154 39 2168 680 6966 9853
2008 4461 706 10994 1018 27 2307 610 9063 12007
Grand Total 10334 2662 24998 3781 83 5864 1656 21096 28699
% Change from 2006 to 2007
69.65 -30.80 67.76 -28.28 129.41 56.08 85.79 37.48 44.07
% Change from 2007 to 2008
20.73 -11.75 25.30 -11.79 -30.77 6.41 -10.29 30.10 21.86
Crime against Women : From the data of NCRB, it is gathered that the IPC cases against women at
the national level has recorded an increase of 7.4 percent during the five years period (2002-2006).
Infact, except in the years 2002 and 2003, there has been a continuous increase in the cases against
women since 1996. Analysis of crime data relating to women reveals that a sizeable proportion of
cases (38.3 percent) are related to assault on them by their husbands and relations, whereas the rape
and kidnappings were on the third and fourth position respectively. Again, a glance through the
national data on crime against women reveals that the states of Andhra Pradesh, Uttar Pradesh and
Maharashtra ranked high. During 2007, Bihar's rank was 28th among the major states, with the rate
of total cognizable crimes at 8.1 percent in the state (Appendix VII).
28

The state government is quite serious with regard to atrocities against women. In this regard, all
Superintendents of Police have been suitably sensitised to focus their efforts against such crime.
Specifically, Creation of Women Atrocities Cell is being planned in each district in the office of
Superintendent of Police. The CID is working in consultation with United Nations Organisation
on Drugs and Crime (UNODC) to curb the women trafficking under the programme Anti Human
Trafficking (AHT).
Crime against Scheduled Castes / Tribes: Both the scheduled castes and scheduled tribes are quite
vulnerable. Therefore, to meet the demands of social justice, it becomes imperative to check crimes
committed against them. The state government is committed towards this end, and due to some
initiatives, the crime against scheduled castes has declined from 9.3 percent in 2006 to 7.5 percent
in 2007. Similarly, a drop in crime from 1.2 percent to 1.0 percent has also been recorded in the
case of tribal population.
Table 1.20 : Crime against Scheduled Castes & Tribes Crime in percentage
SCs STs State
2006 2007 2006 2007
Bihar 9.3 7.5 1.2 1.0
Andhra Pradesh 11.3 14.4 13.6 13.7
Madhya Pradesh 13.7 15.6 27.1 25.9
Rajasthan 13.9 14.4 20.1 16.7
Uttar Pradesh 20.5 18.3 - -
Gujarat 3.5 3.7 2.8 2.8
Maharashtra 3.9 3.9 4.3 4.6
Orissa 4.5 4.3 7.1 6.0
Tamil Nadu 5.8 3.7 - -
Karnataka 6.1 6.4 3.7 3.7
Jharkhand - - 4.8 5.7
Chhattisgarh - - 11.1 10.1
Kerala - - 1.6 1.3
Other States 7.5 7.8 2.6 8.5
As may be observed from Table 1.20, more cases of crime against scheduled castes / tribes were
reported both in 2006 and 2007 from the states of Uttar Pradesh, Madhya Pradesh, Rajasthan and
Andhra Pradesh. It may also be seen that the states of Andhra Pradesh, Madhya Pradesh,
Rajasthan and Gujarat have all recorded an increase in crime rate against the scheduled castes.
29

Gujarat, 3.5%/3.7%Maharashtra, 3.9%/3.9%
Orissa, 4.5%/4.3%
Tamil Nadu, 5.8%/3.7%
Karnataka, 6.1%/6.4%
Other States, 7.5%/7.8%
Bihar, 9.3%/7.5%Andhra Pradesh, 11.3%/14.4%
Madhya Pradesh, 13.7%/15.6%
Rajasthan, 13.9%/14.4%
Uttar Pradesh, 20.5%/18.3%
Bihar, 1.2% / 1.0%
Andhra Pradesh, 13.6%/13.7%
Madhya Pradesh, 27.1%/25.9%
Rajasthan, 20.1%/16.7%Gujarat, 2.8%/2.8%
Maharashtra, 4.3%/4.6%
Orissa, 7.1%/6.0%
Karnataka, 3.7%/3.7%
Jharkhand, 4.8%/5.7%
Chhattisgarh, 11.1%/10.1%
Other States, 2.6%/8.5%Kerala, 1.6%/1.3%
In order to ensure that all the crimes committed against scheduled castes / tribes are reported
fearlessly to the police, a helpline has been established at the SC/ST police station at Patna with its
30

jurisdiction throughout the state. Officials have been deputed at this police station for 24 hours
duty and they have been directed to take immediate action on any information about crime against
SC/ST. This is being monitored by a Superintendent of Police at the Police Headquarters.
Police Administration
The Bihar Police Act, 2007 is an important initiative taken by the state government, which takes
into account the promotion of Human Rights and redefines the role of the police. The state
government has taken adequate steps to modernize the police force. In 2006-07, the expenditure
on police administration recorded a substantial growth of 27.4 percent over 2005-06. The state
government has recruited over 7000 ex-servicemen to help the police administration. The Bihar
Police Building Construction Corporation, so far non-functional, has been revived. Besides, Rs.
2650 uniform allowance has been sanctioned for police personnel. The daily allowances of home
guards have also been enhanced and 20,000 new volunteers have been enrolled. A Bihar Police
Academy is being established on 133.28 acres of land being acquired at Rajgir (Nalanda) for the
purpose. To Meet the terrorist attacks, the state government has created an ATS (Anti Terrorist
Squad) which is being equipped with modern gadgets to fight in the difficult situations. Many new
police stations, office of SDPOs and two posts of city SP in Patna have been created to stream line
the police administration in the capital.
With the active cooperation of the police, a total of 1, 84,987 poor and orphaned children have
been admitted to schools. This endeavor by the police has made them popular among the people
and they are now called 'Police uncle' by the children. The police are also actively cooperating
with the state government in undertaking various development programmes in the state.
The state government is committed to zero tolerance as far as corruption cases are concerned. In
order to have an effective control over corruption in the state, the Bihar Vigilance Investigation
Bureau is functioning in heightened manner. Through vigorous publicity of mobile phone
31

numbers, the Bureau could catch hold of a number of corrupt public servants based on the
information obtained on these mobile phones. During 1995-2005, a total of only 47 trap cases
were reported. But, during 2006 alone, there were 60 trap cases and 68 public servants were
arrested. In 2007, there were 108 trap cases and 126 arrests, and in 2008 (upto November), the
numbers were 78 and 92 respectively.
4.5
60
108
78
0
20
40
60
80
100
120
AnnualAverage (1996-
2005)
2006(ARST.68)
2007 (ARSt.1262008 (Arst.92,upto 31/12/08
Comparative Data on Trap Cases
Cases
Based on the trap cases of corruption, 103 cases were registered in 2006, 133 in 2007 and 110 in
2008 (upto December). In 2007, a campaign was launched to investigate cases pending since 1985.
The number of corruption cases investigated were 99 in 2006, 277 in 2007 and 89 in 2008 (upto
December). As a result, in the cases relating to disproportionate assets, more than Rs. 10 core worth
of wealth were identified and cases filed. Similarly, various irregularities have been unearthed by
the Bureau which related to State Food Corporation and its transporters.
For speedy trial of trap cases, a special court has been newly constituted. The state government has
decided to appoint officials in the Bureau through proper screening, grant them 15 percent of
special pay during the deputation period, and also grant one rank promotion to them. For
strengthening of the Bihar Vigilance Investigation Bureau, creation of additional posts is under
consideration. The complainants will be compensated for the amount given as bribes immediately,
and a fund of Rs. 20.00 lakh has been made available to the Bureau for the purpose.
32

28.5
103
133
110
0
20
40
60
80
100
120
140
Annual Average(1996-2005
2006 2007 2008 (upto31/12/2008
Number of Cases Registered under Corruption
Number of Cases
15
99
277
89
0
50
100
150
200
250
300
Annual Average(1996-2005
2006 2007 2008 (upto31/12/2008
No.of Corruption Cases Investigated
No.of Cases Investigated
Jail Administration
There are 6 central jails, 33 district jails and 17 sub-jails in Bihar (Table 1.21). The sub-jail at Uda-
Kishanganj is not functional. The jails, by and large, were housing much higher number of
prisoners than their capacity. However, in case of the central jails, figures reveal that the number of
prisoners lodged (11,312) is less than capacity (12,349). An examination of figures of the individual
central jails brings out that the model central jail at Patna and the central jail at Gaya are having
33

prisoners more than their capacities. Muzaffarpur and Buxar central jails were having the number of
prisoners almost in accordance with the capacity. The special central jail and the central jail at
Bhagalpur were having inmates much less than their capacity. But the 33 district jails taken
together were having 23,105 prisoners, as against the capacity of 15,860. Another noteworthy
feature relates to the female prisoners whose number was more (885) against the capacity of only
587. (Appendix VIII).
Table 1.21 : Manpower in Jail Administration
Sl. No.
Designation Already
Sanctioned Post
New Sanctioned
Post
Total Sanctioned
Post
Functioning Force
Vacant Vacancy in
Percent
Security Related Designation
1 Jail Superintendent
57 (Including
2 Head Offices)
- 57 33 24 42.11
2 Jailor 31 12 43 31 11 25.58 3 Assistant Jailor 108 93 201 64 137 68.16 4 Chief Head Warder 7 32 39 4 35 89.74 5 Head Warder 266 284 550 210 340 61.82
Warder 1233 75.78
6 Ex. Servicemen working against Warder
2247 2844 5091 74
3858 —
7 Lady warder 157 0 157 105 52 33.12
8 Special Auxiliary Police
0 770 770 0 770 100.00
Total 2873 4035 6908 1754 5227 75.67
Medical Related Designation
(A) Jail Doctor 64 - 64 47 17 26.56 9 (B) Jail Doctor
(Out Source) - 43 43 0 43 100.00
10 Compounder (Misrak) 58 43 101 10 91 90.10 11 Dresser (Paridhapak) 51 50 101 13 88 87.13
Total 173 136 309 75 239 77.35
Other Designation 12 Account Officer 0 6 6 0 6 100.00 13 Accountant 0 32 32 0 32 100.00 14 Account Clerk 0 23 23 0 23 100.00 15 Lower Division Clerk 15 21 36 14 22 61.11 16 Jail Clerk 117 0 117 87 30 25.64 17 Barber 0 105 105 0 105 100.00 18 Safai Mazdoor 22 503 525 22 503 95.81 Total 154 690 844 123 721 85.43 Grand Total 3200 4861 8061 1947 6187 76.75
Source: Department of Home, Government of Bihar
34

For proper security and care of the jail inmates, the personnel for security and medical care are
posted at the jails. In view of more convictions, number of prisoners in jail is expected to rise. In
this backdrop, some new posts of security personnel were also created, thereby increasing the total
number of sanctioned posts from 2873 to 6908. Even though the number of sanctioned posts has
increased, 5227 posts (75.67 percent) of security personnel remained vacant. Similarly, under
medical posts, 75 posts were filled up (24.27 percent) against the total sanctioned posts of 309. In
the accounts and other sections, there were 85.43 percent vacant posts against the total sanctioned
post of 844. Thus, out of the total sanctioned posts of 8061 in all the categories, a total of 6187
posts were vacant (77 percent).
A number of initiatives is planned by the state government towards reforming the jail
administration. Some of these initiatives are :
(i) In order to make the jail administration more effective, measures are being taken to appoint/
depute officers and staff against the existing vacancies. One Jail Reforms Institute has been
established at the Model Central Jail, Beur, Patna.
(ii) Under non-plan scheme, a total of Rs. 179.43 crore has been allotted against centrally
sponsored scheme of jail reforms for 5 years beginning from 2002-03. For the scheme, the
central and state contributions are in the ratio of 75 and 25. For 2005-06 and 2006-07, a sum
of Rs. 63.86 crore and Rs. 103.13 crore have been approved respectively. The amounts were
meant for construction of district jails/ sub-jails, prisoners cells, watch towers, warden and
guard barracks, toilets, modern kitchens in 50 jails, installation of hand pumps, etc.
(iii) For maintaining sanitation inside the jails, 503 posts of sanitation personnel have been
created.
(iv) For regular monitoring and checking of the jail accounts, 6 posts of accounts officers, 32
posts of accountants and 23 posts of accounts clerks have been created.
(v) A Prisoners Welfare Fund is planned to be established for providing financial help to
prisoners for health care and proper treatment in the case of serious diseases like cancer and
kidney failures. Besides the state government's contribution to the Fund, some contribution
from inmates' own earnings inside jail is also planned.
35

(vi) The recommendations of Women and Children Development Committee of the Bihar
Legislative Assembly are being implemented for prevention of exploitation and torture of
female and child prisoners.
(vii) In order to ensure the security of jails, provisions have been made for video conferencing,
close circuit TVs, and security equipments like metal detector, walki-talkies, scanner, etc.
(viii) Electric fans, black and white TVs have been installed in the jails and, in 12 jails, LPG
cooking system has been introduced. In the remaining jails, this is being taken up in 2008-
09. The establishment of a Bakery Plant in Beur jail, Patna is also underway. The printing
machines, handloom for blanket weaving, masala grinding machines, etc. are being
introduced in some of the jails and necessary training for skill development is are imparted
to the prisoners.
(ix) An open jail is planned to be constructed at Buxar and for this a sum of Rs. 4.10 crore has
been approved.
(x) In all the central and in a few of the district jails, there are workshops for manufacturing of
prisoners' clothes, tents, tripoline, carpets, soaps, blankets, etc. The prisoners are imparted
training in the trades and they are paid @ Rs. 8, Rs. 10 and Rs. 12 per day depending upon
the light, medium and hard work rendered by them. In 2007-08, the Jails Department had a
revenue of Rs. 9.35 crore from the sale of the items prepared by jail inmates.
(xi) The prisoners are also imparted training in the art of living, yoga, etc., in collaboration with
Yoga School at Munger for their physical and moral development.
(xii) For the children living with women prisoners, there is a provision for separate utensils and
bottles for milk feeding. The children are also given vaccines.
(xiii) There is also a Public Grievances Cell for the jails and one officer has been nominated for
the purpose.
1.5 Disaster Management
Bihar has been historically prone to many disasters. The state is particularly vulnerable to two
kinds of disasters – floods and earthquakes.
36

Earthquake
Bihar is bounded on the north by the Himalayan Frontal Thrust. Some of the major earthquakes of
India have occurred in Bihar which lies in a high seismic zone. Eight districts lies in Zone V
(Sitamarhi, Sheohar, Madhubani, Supual, Saharsa, Araria, Madhepura and Darbhanga), 20 in Zone
IV (East Champaran, West Champaran, Gopalganj, Siwan, Saran, Muzaffarpur, Vaishali,
Samastipur, Begusarai, Purnea, Katihar, Munger, Bhagalpur, Lakhisarai, Sheikhpura, Jamui,
Banka, Khagaria, Patna and Nalanda) and the rest in Zone III. Patna lies in Zone IV and has a
population more than 17 lakhs. Any earthquake striking this city can turn into a major disaster.
The earthquake on January 15, 1934 which affected both India and Nepal had an intensity of 8.0
on Richter scale. Close to 10,700 people were killed in north Bihar and caused heavy damage in
the towns of Muzaffarpur, Motihari, Dharbhanga and Munger. Tremors were felt all over the
Indian subcontinent, as far as Mumbai and even Kerala. Other earthquakes which occurred in the
state are listed in Table 1.22.
37

Table 1.22 : Earthquakes in Bihar
Date Affected Area
Intensity
in Richter
Scale
04 June 1764 Bihar WB Border 6.0
23 Aug 1833 Nepal Border 7.7
23 May 1866 Nepal Border 7.0
23 May 1866 Jharkhand Bihar Border 5.5
30 Sept 1868 Hazaribagh 5.7
07 Oct 1920 Bihar –UP Border 5.5
15 Jan 1934 Indo – Nepal Border 8.0
11 Jan 1962 Indo – Nepal Border 6.0
21 Aug 1988 Bihar Nepal Border 6.8
Floods
Floods are a regular annual calamitous event in Bihar, though of varying intensity. Bihar is India’s
most flood-prone state, with about 73.06 percent of its area (68,800 sq. kms.) being flood prone.
The plains of north Bihar are particularly vulnerable to floods and 76 percent of its population is
flood prone. This area has recorded the highest number of floods during the last 30 years. In the
years 1978, 1987, 1998, 2002, 2004, 2007 and 2008, Bihar witnessed high magnitudes of floods.
The total area affected by floods has also increased over the years.
In 2002, the floods in Bihar had affected 25 districts. A total of 489 persons died in the floods
while 160.11 lakh persons were affected by it. The highest number of deaths were in Darbhanga
(74). In this flood, 1450 animals died, out of which 671 died in Samastipur alone. A total of 9.26
lakh hectares of cropped area was affected. In addition, 4,19,014 houses were damaged, out of
which 2,10,382 were in Madhubani (Table 1.23).
The flood of 2004 demonstrated the increasing intensity of the problem in the state, when a vast
area of 23,490 sq. kms. in 20 districts of north Bihar were affected by flooding of Bagmati,
38

Kamala and Adhwara group of rivers. A total of 885 persons died in the floods while 213.19 lakh
persons were affected by it. The highest number of deaths were again in Darbhanga (251). Further,
3292 animals died in the floods out of which 718 died in Sitamarhi alone. A total of 13.99 lakh
hectares of cropped area was affected. Out of a total of 9,29,773 houses that were damaged,
2,19,500 were in Araria (Table 1.24).
Table 1.23 : Overview of 2002 Floods in Bihar
Lives lost District
Persons (In lakh)
Cropped Area (In
lakh hec.)
Houses damaged Human Animal
Muzaffarpur 10.53 0.48 4108 41 85
W. Champaran 0.85 0.18 4200 0 152
E. Champaran 2.7 0.41 2861 1 0
Sitamarhi 22.47 0.8 30812 47 15
Sheohar 3.53 0.3 30456 20 55
Saran 4.93 0.25 36 15 22
Siwan 2.13 0:15 4109 4 2
Gopalganj 6.96 1.02 8161 42 56
Darbhanga 26.26 1.32 36235 74 23
Samastipur 12.31 0.63 38676 86 671
Madhubani 24.7 1.71 210382 35 102
Saharsa 5.99 0.23 8072 20 2
Supaul 3.02 0.44 4406 5 2
Madhepura 0.79 0.06 37 2 0
Purnea 6.98 0.23 3139 6 0
Araria 5.83 0.26 7332 22 1
Kishanganj 2.39 0.05 3135 0 0
Katihar 6.98 0.4 9746 5 252
Begusarai 2.15 0.09 1006 10 6
Khagaria 7.37 0.3 7207 47 4
Lakhisarai 0.02 0.01 479 0 0
Bhagalpur 0.04 0.004 322 0 0
Patna 0.52 0.07 0 0 0
Nalanda 0 0 685 7 0
Sheikhpura 0.66 0.005 3412 0 0
Total 160.11 9.259417 419014 489 1450
39

Table 1.24 : Overview of 2004 Floods in Bihar
Lives lost District
Persons (In lakh)
Cropped Area (In
lakh hec.)
Number of
Houses damaged Human Animal
Muzaffarpur 16.44 0.73 40103 91 168
Sitamarhi 28.59 0.45 118903 102 718
Sheohar 5.17 0.35 41300 25 33
E. Champaran 20.01 1.89 52365 15 534
W. Champaran 0.81 0.28 652 0 0
Vaishali 0.89 0.04 1093 0 0
Darbhanga 32.12 0.94 117202 251 664
Madhubani 29.29 2.18 122205 93 579
Samastipur 18.06 0.61 70999 161 350
Shaharsa 6.74 0.67 5996 8 0
Supaul 4.21 0.47 15131 7 3
Madhepura 5.14 0.49 4790 18 42
Purnea 6.06 1.31 2245 6 8
Araria 16.5 1.56 219500 14 32
Kishanganj 2.48 0.02 9690 4 0
Katihar 6.09 0.6 2830 19 0
Khagaria 9.22 0.9 68500 39 125
Begusarai 3.34 0.25 27257 10 8
Bhagalpur 1.45 0.2 9012 20 28
Gopalganj 0.58 0.05 0 2 0
Total 213.19 13.99 929773 885 3292
In 2007, the entire north Bihar was hit by severe floods due to heavy rainfall in catchments of
nearly all the rivers. There were 28 breaches at different locations of the embankments during
2007 flood season, and 22 districts were affected. The scale of human deaths has also been
increasing with every flood in Bihar. In 2007 floods, 1287 persons had died with the highest death
toll in Samastipur (201). The loss to cropped area was 10.60 lakh hectares. The number of houses
damaged was 742330 with 1,45,517 house damages in Madhubani (Table 1.25).
40

Table 1.25 : Overview of 2007 Floods in Bihar
Lives lost District
Persons (In lakh)
Cropped
(In lakh hec.) Houses
damaged Human Animal
Muzaffarpur 32.63 0.88 37450 154 882
Sitamarhi 28.39 0.8 90318 59 201
Shaohar 3.54 0.12 50728 10 4
E. Champaran 37.08 0.41 71564 122 151
W. Champaran 7.07 0.73 21201 22 4
Vaishali 14.37 0.78 4 l998 47 78
Darbhanga 33.61 0.81 83489 158 378
Madhubani 18.01 0.79 145517 89 59
Samastipur 19.47 1.25 56397 201 64
Shaharsa 3.65 0.27 14024 42 0
Supaul 2.37 0.12 11671 1 0
Madhepura 0.7 0.05 2100 19 0
Purnea 0.14 0.003 716 0 0
Araria 0.01 0.00 99 0 0
Katihar 5.4 0.19 2312 37 2
Gopalganj 1.64 0.13 3701 13 0
Siwan 0.00 0 0 0
Patna 7.48 0.27 55457 5 0
Nalanda 6.04 0.69 16760 20 21
Khagaria 10.14 0.5 36720 155 290
Begusarai 6.58 1.31 18385 92 289
Bhagalpur 6.1 0.50 23721 41 0
Total 246.42 10.60 742330 1287 2423
In 2008, there were 19 districts affected by floods. In all, 117 out of 533 blocks were inundated.
This covered 928 Panchayats and 2,534 villages. In this flood, 608 persons died with the highest
death toll in Madhepura (270). The loss to cropped area was 2.70 lakh hectares. The number of
houses damaged was 2,95,041 with 1,30,207 houses damaged in Supaul (Table 1.26).
41

Table 1.26 : Overview of 2008 Floods in Bihar
Lives lost District
Persons (In lakh)
Cropped Area (In
lakh hec.)
Houses damaged Human Animal
Muzaffarpur 1.41 0.00 4 12 0 Patna 1.83 0.12 1243 3 0 Katihar 6.75 0.30 206 23 0 Nalanda 1.37 0.02 1571 2 0 W. Champaran 0.2 0.0002 74 0 0 Khagaria 1.99 0.06 1626 5 24 Seikhpura 0.10 0.00 3 14 0 Saran 0.49 0.14 441 0 0 Begusarai 0.00 0.00 0 0 0 Bhagalpur 1.58 0.20 1536 16 0 Vaishali 0.39 0.00 1279 3 0 Kishanganj 0.06 0.00 428 3 0 Bhojpur 0.78 0.005 0 3 0 Saharsa 4.49 0.29 26124 40 0 Supaul 6.71 0.43 130207 211 0 Madhepura 14.2 0.58 114545 270 0 Purnea 1.64 0.15 7682 1 0 Araria 6.28 0.40 8439 2 0 Sitamarhi 0.00 0.00 0 0 4 Total 50.274 2.69655 295401 608 28
Kosi Flood 2008
While the state was yet to recover from the 2007 floods, on August 18, 2008, the Kosi unleashed
its destructive powers as the river breached its left embankment at Kusaha, twelve kilometers
upstream the barrage. Five districts in the state bore the brunt of the floods with severe damages
that led to the declaration of the flood as a National Calamity.
Table 1.27 : Overview of Kosi Floods 2008
Detail Supaul Madhepura Araria Saharsa Purnea Total
No of Blocks Affected 5 11 4 6 9 35
No. of Panchayats Affected 65 140 71 59 77 412
No. of Villages Affected 178 370 141 169 140 998
Population Affected 670709 1419856 626062 448796 164000 3329423
No. of Families Affected 186661 374798 140895 130000 41645 873999
Livestock Affected 132500 303640 80000 161000 35000 712140
Area Affected (Lakh Ha) 1 2 0 0 0 3
No. of House Damage (Pucca, Kuchha =& Jhopadi)
130207 114545 8439 26124 7562 286877
No of Persons Evacuated 370000 335110 107937 115945 65000 993992
No of Human Death 211 272 2 44 1 530
No. of Livestock Death 97 3322 0 22 0 3441
42

The resulting floods have affected 35 blocks of five districts of the state (Saharsa, Supaul,
Madhepura, Araria and Purnea), drowning 412 panchayats and 998 villages. A total of about 33.29
million people have been affected, of which about 9,93,992 had to be evacuated. The deluge has
so far taken 530 human lives, with the numbers likely to go up, as people return to their villages.
An area of 3 lakh hectares has been affected while about 2,86,877 houses have been damaged. An
area of about 2.84 lakh hectares has suffered siltation, of which 2.69 lakh hectares is agricultural
land (Table 1.27).
About 92 percent of the existing rural road network of the five affected districts (721.2 kms. out of
782.5 kms.) has been damaged. About 251 kms. of state highways and major district roads and 61
kms of national highways in these districts have also been damaged. Likewise, 351 bridges/
culverts have been completely damaged in the affected districts. Similarly, massive damage has
been done to power infrastructure in those five districts, as well as adjoining districts of Katihar,
Kishanganj and Bhagalpur. Likewise, educational and health infrastructure in the affected areas
too has been severely damaged.
The financial damage done by the Kosi floods is not limited to loss of infrastructure and cost of
relief and rehabilitation alone. In fact, even more significant aspect of damage is the indirect
damage done to the economy of the affected region. Due to severely damaged infrastructural
capacity, and a badly dented agricultural production capacity (due to sandy-silt deposition on the
fields), the state is set to face a major output loss. This loss of output, while important for the
state’s overall economy, is of immediate importance to the lives of millions affected, as their basic
existence was threatened because of these losses. Table 1.28 provides an overview of foodgrain,
cash and kits distributed in the aftermath of the Kosi disaster for immediate relief.
Kosi Floods : Relief Measures
855 volunteers with boats from the local administration and the National Disaster Response Force was deployed along with 35 columns of military and 11 Air Force Helicopters
1000 boats were deployed for rescue and relief work
350 mega camps were established lodging 4.5 lakh flood victims
Holistic convergence of services for a full and normal life in camps ensured through schools, Anganwadi centres, Health Services, Vocational Training & Sports and Cultural activities.
43

Table 1.28 : Highlight of Relief Work for Kosi Floods
Detail Supaul Madhepura Araria Saharsa Purnea Total
Foodgrain Distributed (In Qntl) 145157 353877 168282 111020 87955 866292
Cash Distributed (In Lakh) 3283 8351 3357 2493 1609 19095
No. of Kits Distributed from C.M.R.F.
53844 66435 42541 20804 14412 198036
Kosi Calamity : Rehabilitation and Reconstruction Policy
Kosi Rehabilitaion and Reconstruction Project is a comprehensive multi-sectoral project for
the people affected by the calamity to
reconstruct the houses
provide community facilities
restore and develop infrastructure
provide livelihood support based on sustainable economy and environment
ensure social development and empowerment
The main components of the project are housing, removal of debris, temporary shelter
construction, repair and reconstruction of public buildings, livelihood programmes, social and
physical infrastructure, social and community development.
Table 1.29 : Overview of Flood Relief Work in Bihar
Detail 1998 2002 2004 2007 2008 upto (22-12-08)
Foodgrains distributed (quintals) 794475 634992 843145 4685707.15 1098344.25
Total Allocation for Flood Relief (Rs Lakh) of which
17817 6757.35 23132.75 93364.86 57353.03
Foodgrains 9647.74 596 7500.00 35079.22 15582.79
Cash Grants 4505.68 276.00 5777.50 11355.81 3604.50
Agricultural Input Subsidy 0 225 3550 14000.00 4982.00
Ex-gratia payment for human deaths 169.05 263 305.16 926.50 786.00
Compensation for house damage 0.00 - 87 22442.50 11123.605
44

Table 1.29 provides an overview of flood relief allocation in the state since 1998. The allocation in
2008 is in proportion to the scale of floods which was much more intense, but spread over fewer
districts than in 2007. The emphasis on agricultural input subsidy and compensation of house
damage in 2007 and 2008 shows that, going beyond immediate relief, the concern of rehabilitation
of lives and livelihood underlines the allocations.
Preparing for the Future
As regards floods, several measures have been planned to mitigate the situation. Over the years
embankments have been constructed alongside the above river systems, but the continuous
load of silt being carried down has reduced the sustainability of these embankments.
Sustainability is planned to be improved by (a) treatment of the catchments area in Nepal, (b)
dams across the rivers in the higher reaches, (c) dredging of rivers; and (d) inter-basin
transfers. Since only little control is there over the first two options, the immediate measures
within the control of the state government are dredging of rivers and inter-basin transfers. It is
estimated that desilting/ dredging would cost Rs. 5098 crores over five years, and the cost of
interlinking rivers will be Rs.3580 crore over five years.
For earthquake, the proposed measures are training of engineers, masons, architects, builders,
officials of urban local bodies in earthquake resistant construction. In addition, there will also
be IEC (information, education and communication) materials like pamphlets, documentary,
hoardings, short films, etc for self-constructed houses.
The state government also proposes to raise a specialist response team for different kinds of
disasters. One battalion of NDRF should be stationed at Patna, for which 74.47 acres of land at
a cost of Rs. 27 crore has been acquired. In addition, four battalions of State Disaster Response
Force (SDRF) would be constituted at Begusarai, Muzaffarpur, Saharsa and Darbhanga, at a
cost of Rs. 511 crore (as per NDRF norms). One battalion of Bihar Home guards is also to be
trained for disaster management. Further, 2000 ex-service men (SAP) are to be recruited and
trained. There will also be fire-fighting support in each block (439) at a cost of Rs. 560.60
crore. Finally, since the Fire Stations will be the nodal agency for rescue during earthquake and
fire, these will be provided with proper search and rescue equipments at a cost of Rs. 75 crore.
Other measures for effective disaster management include :
45

(i) 10 motor boats for each district will be provided to 28 flood prone districts, at a tentative
cost Rs. 9.80 crore.
(ii) One helicopter for immediate deployment of NDRF/SDRF as well as for air dropping of
relief material and deployment of personnel will be acquired at a tentative cost of Rs. 35
crore. The state government will also construct 50 helipads in selected places for rescue
and relief work, at a cost of Rs. 1.50 crore (Rs. 5.00 lakh per helipad).
(iii) Emergency Operation Centre (EOC) will be established in all the 38 districts. The total
cost of building (Rs. 6.00 lakh per district) and equipment (Rs. 45.00 lakh per district)
would be Rs. 19.38 crore.
(iv) Warehouses will be constructed at Patna, Muzaffarpur, Purnea and Darbhanga for storage
of relief materials like tent, prefabricated shelter, etc. The total cost of 1 warehouse, with
10,000 ton capacity on an area of 6000 sq.fts, would be Rs. 6.30 crore (excluding land
cost).
(v) The Civil Defense organization will be strengthened. The coverage will be extended to all
vulnerable districts. At the district level, it is estimated to cost Rs. 6.90 crore per district.
At the state level, the estimated cost is Rs. 9.80 crore, distributed among transport (Rs.
2.00 crore), equipment (Rs. 5.00 crore) and training (Rs. 2.80 crore).
(vi) The PRIs would be provided funds for disaster preparedness like vulnerability mapping,
training, mock drill, equipment etc. Arrangements will be made for integration of the
working of PRIs and Civil Defence organisations.
(vii) Multi-purpose community hall-cum-shelter will be built in each major habitation. The
double-storied building will have a floor area of 4000 sq.fts. and it will be earthquake
resistant. In normal time, it will be used for school / community purposes. It is proposed to
construct 500 such shelters per year. The estimated cost of one shelter is Rs. 35.00 lakh. The
land area of these community centres will also be raised to serve as helipad for emergencies.
46

Appendix I : Murders in Bihar
No. of Murders Drop (-)/
Increase(+) between 2005
and 2008 District
2005 2006 2007 2008 Patna 436 387 320 341 -21.79 Nalanda 158 137 121 120 -24.05 Bhojpur 158 127 107 108 -31.65 Buxar 68 53 35 49 -27.94 Rohtas 107 102 89 112 4.67 Bhabhua 57 59 55 43 -24.56 Gaya 158 158 157 141 -10.76 Nawada 78 77 75 79 1.28 Aurangabad 58 82 67 70 20.69 Jehanabad 52 39 38 35 -32.69 Arwal 28 22 17 28 0.00 Saran 118 106 85 75 -36.44 Siwan 89 93 74 99 11.24 Gopalganj 74 72 48 74 0.00 East Champaran 107 119 111 120 12.15 Bagha 40 48 34 27 -32.50 West Champaran 68 72 61 67 -1.47 Muzaffarpur 130 134 149 138 6.15 Vaisali 60 99 120 106 76.67 Samastipur 62 45 51 72 16.13 Sheohar 10 16 23 9 -10.00 Darbhanga 41 62 76 72 75.61 Sitamarhi 121 102 74 81 -33.06 Madhubani 69 62 76 56 -18.84 Saharsa 17 44 50 30 76.47 Madhepura 52 60 68 34 -34.62 Supaul 34 31 36 39 14.71 Purnea 113 57 90 71 -37.17 Katihar 78 59 63 63 -19.23 Araria 62 63 48 50 -19.35 Kishanganj 25 18 23 32 28.00 Bhagalpur 101 119 92 90 -10.89 Banka 49 65 46 70 42.86 Naugachhia 52 35 30 31 -40.38 Munger 103 74 74 88 -14.56 Sheikhpura 33 25 19 19 -42.42 Lakhisarai 52 47 35 40 -23.08 Jamui 81 66 44 35 -56.79 Khagaria 47 53 48 55 17.02 Begusarai 121 87 96 101 -16.53 Railway (Patna) 15 16 15 25 66.67 Railway (Jamalpur) 7 5 7 9 28.57 Railway (Muzaffarpur) 23 18 10 17 -26.09 Railway (Katihar) 11 10 6 8 -27.27 Total 3423 3225 2963 3029 -11.51
Source: Department of Home, Government of Bihar
47

Appendix II : Dacoity in Bihar
No. of dacoities
District 2005 2006 2007 2008
Drop(-) / Increase (+)
between 2005 and 2008
Patna 127 87 58 63 -50.39 Nalanda 41 27 16 10 -75.61 Bhojpur 32 32 10 14 -56.25 Buxar 30 28 12 8 -73.33 Rohtas 23 20 7 22 -4.35 Bhabhua 18 30 7 3 -83.33 Gaya 112 72 48 34 -69.64 Nawada 19 7 8 8 -57.89 Aurangabad 21 23 30 23 9.52 Jehanabad 35 16 11 15 -57.14 Arwal 10 2 4 1 -90.00 Saran 50 41 33 29 -42.00 Siwan 51 37 22 15 -70.59 Gopalganj 10 25 11 16 60.00 East Champaran 52 42 25 32 -38.46 Bagha 1 9 4 6 500.00 West Champaran 26 14 12 8 -69.23 Muzaffarpur 47 50 31 34 -27.66 Vaishali 14 19 9 13 -7.14 Samastipur 20 34 24 26 30.00 Sheohar 11 2 1 5 -54.55 Darbhanga 25 25 9 16 -36.00 Sitamarhi 19 12 13 8 -57.89 Madhubani 45 50 17 22 -51.11 Saharsa 6 1 7 13 116.67 Madhepura 17 16 10 7 -58.82 Supaul 39 7 9 3 -92.31 Purnea 38 21 28 25 -34.21 Katihar 19 8 9 16 -15.79 Araria 37 43 40 49 32.43 Kishanganj 15 7 11 7 -53.33 Bhagalpur 14 14 15 10 -28.57 Banka 33 17 20 14 -57.58 Naugachhia 6 4 2 1 -83.33 Munger 19 19 5 6 -68.42 Sheikhpura 4 5 3 2 -50.00 Lakhisarai 8 6 5 7 -12.50 Jamui 38 25 14 13 -65.79 Khagaria 12 14 8 7 -41.67 Begusarai 9 7 6 10 11.11 Railway (Patna) 15 18 11 9 -40.00 Railway (Jamalpur) 10 7 10 8 -20.00 Railway (Muzaffarpur) 11 15 3 2 -81.82 Railway (Katihar) 2 9 8 5 150.00 Total 1191 967 646 645 -45.84
48

Appendix III : Robbery in Bihar
No. of robberies
District 2005 2006 2007 2008
Drop(-)/ Increase(+)
between 2005 and 2008
Patna 635 535 381 311 -51.02 Nalanda 91 56 48 23 -74.73 Bhojpur 46 57 42 44 -4.35 Buxar 35 35 29 25 -28.57 Rohtas 26 37 20 49 88.46 Bhabhua 18 16 19 15 -16.67 Gaya 129 100 90 70 -45.74 Nawada 31 24 17 25 -19.35 Aurangabad 27 34 26 20 -25.93 Jehanabad 35 16 16 18 -48.57 Arwal 14 7 4 4 -71.43 Saran 60 80 82 57 -5.00 Siwan 122 100 71 55 -54.92 Gopalganj 53 40 32 41 -22.64 East Champaran 66 55 41 50 -24.24 Bagha 4 7 10 15 275.00 West Champaran 30 38 15 21 -30.00 Muzaffarpur 91 102 70 50 -45.05 Vaishali 52 59 51 35 -32.69 Samastipur 15 33 28 36 140.00 Sheohar 4 3 0 9 125.00 Darbhanga 18 25 20 10 -44.44 Sitamarhi 61 50 42 28 -54.10 Madhubani 33 21 16 23 -30.30 Saharsa 28 34 55 70 150.00 Madhepura 38 40 34 33 -13.16 Supaul 35 24 36 30 -14.29 Purnea 96 70 47 27 -71.88 Katihar 34 14 26 23 -32.35 Araria 44 48 50 51 15.91 Kishanganj 10 11 11 17 70.00 Bhagalpur 58 50 31 34 -41.38 Banka 14 18 27 24 71.43 Naugachhia 16 15 12 5 -68.75 Munger 64 47 38 43 -32.81 Sheikhpura 14 16 11 5 -64.29 Lakhisarai 33 13 19 21 -36.36 Jamui 42 60 21 18 -57.14 Khagaria 39 31 26 17 -56.41 Begusarai 53 52 65 46 -13.21 Railway (Patna) 28 30 10 12 -57.14 Railway (Jamalpur) 9 5 10 3 -66.67 Railway (Muzaffarpur) 15 22 16 14 -6.67 Railway (Katihar) 13 8 14 9 -30.77 Total 2379 2138 1729 1536 -35.44
Source : Department of Home, Government of Bihar
49

Appendix IV : Kidnapping for Ransom in Bihar
No. of kidnappings for ransom District
2005 2006 2007 2008
Drop(-)/ ncrease(+)
between 2005 and 2008
Patna 25 28 14 13 -48.00 Nalanda 16 5 0 0 -100.00 Bhojpur 3 5 0 0 -100.00 Buxar 8 10 1 4 -50.00 Rohtas 6 1 0 3 -50.00 Bhabhua 4 3 1 2 -50.00 Gaya 7 9 1 2 -71.43 Nawada 12 6 6 1 -91.67 Aurangabad 1 1 2 0 -100.00 Jehanabad 3 2 0 0 -100.00 Arwal 2 0 0 1 -50.00 Saran 6 7 0 0 -100.00 Siwan 5 8 7 5 0.00 Gopalganj 3 4 2 4 33.33 East Champaran 31 10 7 7 -77.42 Bagha 18 27 5 3 -83.33 West Champaran 30 16 1 3 -90.00 Muzaffarpur 12 4 5 2 -83.33 Vaishali 3 2 6 0 -100.00 Samastipur 4 2 2 0 -100.00 Sheohar 3 0 0 0 -100.00 Darbhanga 3 4 1 1 -66.67 Sitamarhi 4 2 2 0 -100.00 Madhubani 4 0 0 1 -75.00 Saharsa 1 1 2 2 100.00 Madhepura 0 0 5 0 - Supaul 1 0 0 1 0.00 Purnea 6 1 0 0 -100.00 Katihar 1 3 2 0 -100.00 Araria 1 0 0 0 -100.00 Kishanganj 1 0 0 0 -100.00 Bhagalpur 3 3 2 4 33.33 Banka 1 1 2 0 -100.00 Naugachhia 1 1 1 0 -100.00 Munger 0 3 3 0 - Sheikhpura 1 1 1 1 0.00 Lakhisarai 3 4 1 1 -66.67 Jamui 12 5 3 3 -75.00 Khagaria 2 4 0 0 -100.00 Begusarai 3 7 2 2 -33.33 Railway (Patna) 0 2 1 0 - Railway (Jamalpur) 0 0 0 0 - Railway (Muzaffarpur) 1 2 0 0 -100.00 Railway (Katihar) 0 0 1 0 - Total 251 194 89 66 -73.71
Source : Department of Home, Government of Bihar
50

Appendix V : Road Dacoities in Bihar
No. of dacoities District
2005 2006 2007 2008
Drop(-)/ Increase(+)
between 2005 and 2008
Patna 25 21 22 11 -56.00 Nalanda 5 11 6 4 -20.00 Bhojpur 12 11 2 5 -58.33 Buxar 13 8 4 5 -61.54 Rohtas 10 7 3 11 10.00 Bhabhua 7 9 3 0 -100.00 Gaya 13 16 10 5 -61.54 Nawada 9 3 5 4 -55.56 Aurangabad 2 10 13 10 400.00 Jehanabad 6 3 4 1 -83.33 Arwal 2 0 0 1 -50.00 Saran 7 3 5 3 -57.14 Siwan 5 4 2 4 -20.00 Gopalganj 1 2 4 5 400.00 East Champaran 7 6 1 10 42.86 Bagha 0 2 2 4 - West Champaran 1 3 1 1 0.00 Muzaffarpur 7 7 8 2 -71.43 Vaishali 7 6 5 2 -71.43 Samastipur 0 2 1 1 - Sheohar 1 0 0 1 0.00 Darbhanga 1 2 1 2 100.00 Sitamarhi 2 1 3 0 -100.00 Madhubani 0 5 1 0 - Saharsa 0 0 4 5 - Madhepura 0 3 1 3 - Supaul 5 3 2 0 -100.00 Purnea 9 4 0 4 -55.56 Katihar 5 0 2 3 -40.00 Araria 2 2 7 7 250.00 Kishanganj 2 0 0 1 -50.00 Bhagalpur 6 9 5 6 0.00 Banka 9 7 6 1 -88.89 Naugachhia 3 3 1 0 -100.00 Munger 15 12 4 3 -80.00 Sheikhpura 1 0 0 1 0.00 Lakhisarai 3 0 2 3 0.00 Jamui 9 8 5 5 -44.44 Khagaria 9 12 3 5 -44.44 Begusarai 3 6 3 7 133.33 Railway (Patna) 0 0 0 0 - Railway (Jamalpur) 0 0 0 0 - Railway (Muzaffarpur) 0 0 0 0 - Railway (Katihar) 0 0 0 0 - Total 224 211 151 146 -34.82
Source : Department of Home, Government of Bihar
51

Appendix VI : Road Robbery in Bihar
No. of robberies District
2005 2006 2007 2008
Drop(-)/ Increase(+)
between 2005 and 2008
Patna 296 229 216 143 -51.69 Nalanda 28 25 21 8 -71.43 Bhojpur 29 35 32 35 20.69 Buxar 16 20 18 19 18.75 Rohtas 13 29 15 32 146.15 Bhabhua 10 11 7 10 0.00 Gaya 69 69 61 39 -43.48 Nawada 17 16 8 16 -5.88 Aurangabad 13 26 20 16 23.08 Jehanabad 22 9 5 11 -50.00 Arwal 9 6 1 4 -55.56 Saran 40 60 60 38 -5.00 Siwan 96 87 56 49 -48.96 Gopalganj 34 32 26 28 -17.65 East Champaran 46 40 29 25 -45.65 Bagha 2 2 5 5 150.00 West Champaran 15 12 8 10 -33.33 Muzaffarpur 54 57 47 36 -33.33 Vaishali 34 47 38 22 -35.29 Samastipur 9 8 14 2 -77.78 Sheohar 2 1 0 3 50.00 Darbhanga 15 15 15 2 -86.67 Sitamarhi 36 41 33 15 -58.33 Madhubani 21 14 8 16 -23.81 Saharsa 21 23 42 48 128.57 Madhepura 26 38 28 25 -3.85 Supaul 24 23 26 22 -8.33 Purnea 56 59 30 18 -67.86 Katihar 20 7 13 15 -25.00 Araria 33 38 41 34 3.03 Kishanganj 6 6 9 13 116.67 Bhagalpur 34 17 20 17 -50.00 Banka 9 7 21 17 88.89 Naugachhia 11 10 6 3 -72.73 Munger 33 20 25 32 -3.03 Sheikhpura 9 9 7 2 -77.78 Lakhisarai 11 8 14 12 9.09 Jamui 26 38 15 15 -42.31 Khagaria 23 21 17 10 -56.52 Begusarai 38 36 48 29 -23.68 Railway (Patna) 1 0 0 0 -100.00 Railway (Jamalpur) 0 0 1 0 - Railway (Muzaffarpur) 2 0 2 0 -100.00 Railway (Katihar) 1 0 1 1 0.00 Total 1310 1251 1109 897 -31.53
Source : Department of Home, Government of Bihar
52

Appendix VII : Incidence & Rate of Crime Committed Against Women In States, UTs (2007)
Sl. No.
State / UT Incidence
Percentage ContributionTo All-India
Total
EstimatedMid-YearPopulation
(In Lakhs) #
Rate Of Total Cognizable
Crimes
Rank as perRate of
total cognizable
crimes
Rank as per
percentageshare
States 1 Andhra Pradesh 24738 13.3 816 30.3 2 1 2 Arunachal Pradesh 185 0.1 11.9 15.5 16 25 3 Assam 6844 3.7 296.2 23.1 4 12 4 Bihar 7548 4.1 928.3 8.1 28 10
5 Chhattisgarh 3775 2.0 233.9 16.1 14 16
6 Goa 80 0.0 16 5 34 29
7 Gujarat 8260 4.5 558.8 14.8 18 7
8 Haryana 4645 2.5 235.3 19.7 10 15 9 Himachal Pradesh 1018 0.5 65.1 15.6 15 22
10 Jammu & Kashmir 2521 1.4 121 20.8 9 19
11 Jharkhand 3317 1.8 297.3 11.2 24 17
12 Karnataka 6569 3.5 569.8 11.5 23 13
13 Kerala 7837 4.2 340.1 23 5 8 14 Madhya Pradesh 15370 8.3 684.6 22.5 6 4
15 Maharashtra 14924 8.1 1059.7 14.1 19 5
16 Manipur 188 0.1 26.1 7.2 30 24
17 Meghalaya 172 0.1 25.2 6.8 32 27
18 Mizoram 151 0.1 9.7 15.5 17 28
19 Nagaland 32 0.0 21.7 1.5 35 32 20 Orissa 7304 3.9 396.2 18.4 12 11
21 Punjab 2694 1.5 263.9 10.2 26 18
22 Rajasthan 14270 7.7 639.1 22.3 7 6
23 Sikkim 55 0.0 5.9 9.3 27 31
24 Tamilnadu 7811 4.2 660.2 11.8 21 9
25 Tripura 1067 0.6 34.8 30.7 1 21 26 Uttar Pradesh 20993 11.3 1885.4 11.1 25 2
27 Uttarakhand 1097 0.6 94 11.7 22 20
28 West Bengal 16544 8.9 871.8 19 11 3
Total states 180009.0 97.1 11168.0 16.1
Union territories: 0.0
29 A & N Islands 56 0.0 4.1 13.8 20 30 30 Chandigarh 230 0.1 10.5 22 8 23
31 D & N Haveli 18 0.0 2.6 7 31 33
32 Daman & Diu 11 0.0 1.8 6 33 34
33 Delhi 4804 2.6 167.3 28.7 3 14
34 Lakshadweep 5 0.0 0.7 7.4 29 35
35 Pondicherry 179 0.1 10.6 16.8 13 26
Total (UTS) 5303 2.9 197.6 26.8
Total (all -India) 185312 100.0 11365.6 16.3
# Total Population including women
53

Appendix VIII : Prisoners Statistics of the State of Bihar (August 2008)
Capacity No. of Prisoners % of Nos. to Capacity Sl. No. Name of Jail
M F Total M F Total M F Total 1 C. J. Beur, Patna 2260 100 2360 2588 89 2677 114.5 89.0 113.4 2 C. J. Muzaffarpur 1992 143 2135 2066 100 2166 103.7 69.9 101.5 3 C. J. Buxar 1126 0 1126 1124 0 1124 99.8 - 99.8 4 C. J. Bhagalpur 3288 0 3288 2010 0 2010 61.1 - 61.1 5 C. J. Bhagalpur 1962 0 1962 1344 0 1344 68.5 - 68.5 6 C. J. Gaya 1464 14 1478 1928 63 1991 131.7 450.0 134.7
Total 12092 257 12349 11060 252 11312 91.5 98.1 91.6 1 D.J. Motihari 1388 35 1423 1290 38 1328 92.9 108.6 93.3 2 D.J. Betia 489 20 509 766 30 796 156.6 150.0 156.4 3 D.J. Sitamarhi 262 24 286 620 25 645 236.6 104.2 225.5 4 D.J. Hajipur 728 25 753 949 36 985 130.4 144.0 130.8 5 D.J. Madhubani 621 25 646 519 15 534 83.6 60.0 82.7 6 D.J. Darbhanga 391 10 401 574 29 603 146.8 290.0 150.4 7 D.J. Samastipur 860 20 880 863 68 931 100.3 340.0 105.8 8 D.J. Katihar 719 40 759 686 39 725 95.4 97.5 95.5 9 D.J. Nawada 200 18 218 852 30 882 426.0 16.7 404.6
10 D.J. Ara 639 25 664 1364 43 1407 213.5 172.0 211.9 11 D.J. Bhabhua 83 2 85 515 17 532 620.5 850.0 625.9 12 D.J. Purnea 400 12 412 1190 53 1243 297.5 441.7 301.7 13 D.J. Sheikhpura 150 6 156 208 6 214 138.7 100.0 137.2 14 D.J. Biharsharif 474 25 499 851 27 878 179.5 108.0 176.0 15 W.D.J. Bhagalpur 0 83 83 0 92 92 - 110.8 110.8 16 D.J. Phulwarisharif 700 0 700 509 0 509 72.7 - 72.7 17 D.J. Madhepura 0 0 0 0 0 0 - - - 18 D.J. Saharsa 547 10 557 1006 35 1041 183.9 350.0 186.9 19 D.J. Chhapra 662 12 674 957 33 990 144.6 275.0 146.9 20 D.J. Begusarai 947 10 957 1241 40 1281 131.0 400.0 13.9 21 D.J. Sasaram 960 10 970 765 39 804 79.7 390.0 82.9 22 D.J. Kishanganj 211 10 221 272 19 291 128.9 190.0 131.7 23 D.J. Aurangabad 286 23 309 572 19 591 200.0 82.6 191.3 24 D.J. Gopalganj 500 50 550 592 17 609 118.4 34.0 110.7 25 D.J. Supaul 126 12 138 392 16 408 311.1 13.3 295.7 26 D.J. Munger 450 32 482 568 14 582 126.2 43.8 120.7 27 D.J. Lakhisarai 432 7 439 488 6 494 113.0 85.7 112.5 28 D.J. Araria 160 2 162 514 12 526 321.3 600.0 324.7 29 D.J. Siwan 664 20 684 497 18 515 74.8 90.0 75.3 30 D.J. Khagaria 180 3 183 725 8 733 402.8 266.7 400.5 31 D.J. Jamui 184 4 188 625 13 638 339.7 325.0 339.4 32 D.J. Banka 726 6 732 596 23 619 82.1 383.3 84.6 33 D.J. Jehanabad 134 6 140 654 25 679 488.1 416.7 485.0
Total 15273 587 15860 22220 885 23105 145.5 150.8 145.7 (Contd.)
54

55
Appendix VIII : (Contd.)
Capacity No. of Inmates % of Nos. to Capacity Sl. No. Name of Jail
M F Total M F Total M F Total 1 Sub Jail Bagha 456 25 481 329 19 348 72.1 76.0 72.3 2 Sub Jail Benipur 200 15 215 190 7 197 95.0 46.7 91.6 3 Sub Jail Rosera 100 0 100 244 0 244 244.0 - 244.0 4 Sub Jail Jhanjharpur 100 20 120 203 7 210 203.0 35.0 175.0 5 Sub Jail Dalsinghsarai 149 15 164 107 4 111 71.8 26.7 67.7 6 Sub Jail Navgachhiya 200 20 220 308 4 312 154.0 20.0 141.8 7 Sub Jail Hilsa 200 10 210 423 19 442 211.5 190.0 210.5 8 Sub Jail Birpur Prisoners shifted to district Jail Supaul 9 Sub Jail Masaurhi 180 13 193 187 4 191 103.9 30.8 99.0
10 Sub Jail Patna City 37 0 37 144 0 144 389.2 - 389.2 11 Sub Jail Barh 165 2 167 595 13 608 360.6 650.0 364.1 12 Sub Jail Danapur 87 0 87 261 0 261 300.0 - 300.0 13 Sub Jail Buxar 51 3 54 102 30 132 200.0 1000.0 244.4 14 Sub Jail Sherghati 240 10 250 232 12 244 96.7 120.0 97.6 15 Sub Jail Bikramganj 282 25 307 188 4 192 66.7 16.0 62.5 16 Sub Jail Daudnagar 500 60 560 130 2 132 26.0 3.3 23.6
17 Sub Jail Udakishanganj Not in Function
Total 2947 218 3165 3643 125 3768 123.6 57.3 119.1
Grand Total 30312 1062 31374 36923 1262 38185 121.8 118.8 121.7
(Concluded)

CHAPTER II
AGRICULTURE AND ALLIED SECTORS
The agricultural sector of Bihar's economy is extremely important not merely because 90 percent
of its population earn their livelihood from this sector, but it is this sector wherein lies the great
potential of its economy. Being situated in the Gangetic plains, Bihar is endowed with both
extremely fertile soil and abundant water resources. Because of its geographical location, the state
is also endowed with high bio-diversity and, consequently, the farmers here are capable of
growing a large number of crops like foodgrains, oilseeds, fibres, fruits and vegetables. In
addition, the agricultural sector also lends a base for the animal husbandry sector of the state's
economy which again is an important source of income for its rural population. It is against this
background that the development of agricultural sector demands the highest attention of the state
government, although its share in the Gross State Domestic Product (GSDP) has decreased over
the years and presently stands at about one-fourth only.
Bihar has a geographical area of 93.6 lakh hectares, which can be categorized in the following
three agro-climatic zones :
(i) North-West Zone : This zone comprises 13 districts — West Champaran, East Champaran,
Saran, Siwan, Gopalganj, Muzaffarpur, Sitamarhi, Sheohar, Vaishali, Darbhanga,
Madhubani, Samastipur and Begusarai. The zone receives an annual rainfall of about 1040-
1450 mms. and its soil is mostly sandy loam and loam.
(ii) North-East Zone : This zone comprises 8 districts — Supaul, Saharsa, Madhepura, Purnea,
Katihar, Kishanganj, Araria and Khagaria. The annual rainfall in the district ranges between
1200-1700 mms. and its soil is mostly sandy loam and clay loam.
(iii) South Zone : This is the largest zone, comprising 17 districts. It is generally divided into 2
sub-zones in the eastern and western parts. In the eastern sub-zone, these are 6 districts —
56

Sheikhpura, Lakhisarai, Jamui, Munger, Bhagalpur and Banka. The remaining 11 districts in
the western sub-zone are — Patna, Nalanda, Gaya, Aurangabad, Nawadah, Jehanabad,
Arwal, Bhojpur, Buxar, Rohtas and Bhabhua. This zone receives about 990-1240 mms. of
annual rainfall and has a variety of soils — sandy loam, clay loam, loam and clay.
The details of the agricultural and allied sectors of the state's economy is presented in this Chapter
under the major heads of — Rainfall, Land Utilisation, Production and Productivity, Irrigation,
Agricultural Inputs (Seed, Fertiliser and Extensions Services) and Agricultural Credit. Finally, the
chapter also presents a summary of the Road Map that the state government has recently prepared
for the development of the agriculture and its allied sectors.
2.1 Rainfall
The average annual rainfall in Bihar is about 1098 mms., but it shows considerable year-to-year
variation. During 2001 to 2006, it has varied between 866 mms in 2005 (about 20 percent less than
average) to 1365 mms. in 2001 (about 22 percent more than average) (Table 2.1). There is also
considerable variation among the districts with respect to annual rainfall. The average annual
rainfall per district is 1098 mms., but there are at least 3 districts (Buxar, Arwal and Sheikhpura)
where the average annual rainfall is less than 800 mms and, on the other hand, there are 8 districts
(East Champaran, West Champaran, Begusarai, Supaul, Purnea, Araria, Kishanganj and Katihar)
where the annual rainfall exceeds 1300 mms.
During 2008 (upto September), the total rainfall in Bihar was 1016 mms. which is very close to
the average of 1098 mms. (Table 2.2). However, there were several districts which had received
less than 800 mms. of rainfall in 2008 — Sheohar, East Champaran, Darbhanga, Begusarai,
Supaul, Madhepura and Purnea. The districts with excess rainfall (more than 1300 mms) were —
Buxar, Arwal, Saran, Sitamarhi, West Champaran, Araria and Kishanganj. It may be noted here
that the devastating floods in Bihar in 2008 was not caused by excess rainfalls, but because of a
breach in a barrage in Kosi river, located in Nepal.
57

Table 2.1 : Annual Districtwise Rainfall in Bihar
Annual Rainfall (mm) Districts
2001 2002 2003 2004 2005 2006 Average Patna 923.8 918.6 744.8 608.2 710.2 1065.2 828.5 Nalanda 835.5 940.7 1121.4 499.8 493.7 944.0 805.9 Bhojpur 1155.2 901.5 1045.6 683.7 851.8 1040.4 946.4 Buxar 884.3 816.8 921.8 454.2 734.6 777.3 764.8 Rohtas 930.6 862.4 930.3 661.3 731.2 901.6 836.2 Kaimur 1108.5 1022.4 1334.4 763.4 848.2 1079.6 1026.1 Gaya 968.0 957.4 1010.8 694.4 499.8 1073.7 867.4 Jehanabad 746.9 1121.9 968.9 639.2 776.4 1002.2 875.9 Arwal - 686.9 737.5 593.8 844.4 974.9 767.5 Nawada 840.4 1065.0 1061.1 654.1 661.1 1211.2 915.5 Auragabad 991.8 1023.7 1344.5 608.2 601.3 966.7 922.7 Saran 1147.8 953.8 1082.0 837.0 930.8 941.2 982.1 Siwan 1198.0 1031.8 1419.8 1014.8 802.5 811.1 1046.3 Gopalganj 1458.1 813.8 859.8 1219.8 857.8 1104.6 1052.3 Muzaffarpur 1284.0 1118.0 1051.1 957.5 845.7 1058.5 1052.5 Vaishali 1211.2 - - - 713.7 875.2 933.4 Sitamarhi 1503.1 1053.4 1627.6 1342.7 978.5 956.5 1243.6 Sheohar 1340.4 1161.0 - 1747.5 1269.2 858.6 1275.3 E. Champaran 1645.2 1271.9 1235.9 1633.8 1071.1 1090.8 1324.8 W. Champaran 1743.4 1452.9 1774.9 1270.4 1099.5 1707.0 1508.0 Darbhanga 922.9 703.0 822.4 896.2 907.8 825.6 846.3 Samastipur 1197.4 1066.9 1268.9 827.6 577.1 1031.0 994.8 Begusarai 8136.6 1205.0 1224.6 804.2 732.3 685.7 2131.4 Munger 998.3 835.8 - 1005.3 1002.6 969.5 962.3 Lakhisarai 465.2 1076.3 1236.2 724.1 1028.0 832.9 893.8 Madhubani 1139.3 776.1 653.9 878.2 781.2 1529.3 959.7 Sheikhpura 521.0 - 885.4 489.1 571.2 1143.4 722.0 Jamui 1026.6 1051.8 1242.4 828.9 510.3 1270.1 988.4 Khagaria 1497.4 937.0 1512.1 905.6 1006.5 1027.6 1147.7 Bhagalpur 1022.8 - - - 1134.0 1177.9 1111.6 Banka 828.5 1046.3 967.3 1448.8 1027.3 1297.9 1102.7 Saharsa 1168.4 787.8 982.8 971.6 612.1 794.6 886.2 Supaul 1448.5 1117.3 1647.9 1791.4 1089.0 889.0 1330.5 Madhepura 1530.3 1167.3 1363.1 1386.3 1023.8 1189.8 1276.8 Purnea 1576.2 940.0 1654.0 2298.6 1149.1 1201.3 1469.9 Araria 1611.3 1488.8 1787.5 1581.9 1137.7 1136.0 1457.2 Kishanganj 2049.3 1539.7 1416.6 2938.4 1288.8 1034.0 1711.1 Katihar 1453.7 1441.1 1801.6 2194.0 992.9 1146.3 1504.9
Bihar 1365.1 1038.7 1198.2 1079.3 865.6 1042.7 1098.3
Note : The missing data has been estimated on the base of state average.
58

Table 2.2 : Districtwise Rainfall in Bihar for Different Seassions (2007 and 2008)
Annual Rainfall (mm)
2007 2008 (Upto September) Districts
Winter Rain
Hot-Wether
Rain
South-West
Monsoon
North-West
Monsoon Total
Winter Rain
Hot-Wether
Rain
South-West
Monsoon Total
Patna 3.6 88.0 1345.9 24.0 1461.5 60.8 47.7 1168.2 1276.7Nalanda 24.6 60.4 1136.4 36.2 1257.6 60.5 4.6 941.2 1006.3Bhojpur 32.1 91.4 1605.4 293.7 2022.6 59.9 66.4 757.0 883.3Buxar 7.0 7.1 919.4 10.5 944.0 27.5 48.9 1270.0 1346.4Rohtas 56.1 11.9 868.9 40.2 977.1 55.9 47.0 742.4 845.3Kaimur 139.2 0.3 896.4 9.7 1045.6 11.2 1.2 791.3 803.7Gaya 36.0 56.3 971.9 69.2 1133.4 96.9 27.0 925.9 1049.8Jehanabad 23.6 58.8 1163.0 35.1 1280.5 66.6 25.2 1171.2 1263.0Arwal 40.9 56.5 1201.5 47.0 1345.9 50.0 61.7 1196.5 1308.2Nawada 38.3 37.8 990.0 67.0 1133.1 61.5 35.7 1054.2 1151.4Auragabad 51.4 49.8 931.6 59.9 1092.7 86.3 56.9 964.8 1108.0Saran 19.7 80.2 1435.9 67.0 1602.8 20.3 50.3 1375.4 1446.0Siwan 21.7 101.4 1253.8 9.2 1386.1 0.0 0.0 1197.8 1197.8Gopalganj 20.6 95.6 1667.3 38.8 1822.3 0.0 50.4 1202.6 1253.0Muzaffarpur 31.6 132.9 2009.0 121.7 2295.2 13.3 18.9 1237.8 1270.0Vaishali 31.0 72.7 1927.8 10.8 2042.3 6.8 97.1 1195.5 1299.4Sitamarhi 44.3 80.2 1911.5 49.5 2085.5 0.0 110.9 1234.1 1345.0Sheohar 1.8 0.0 1723.1 0.0 1724.9 1.5 53.1 680.5 735.1E. Champaran 1.6 12.7 1562.2 0.0 1576.5 0.0 113.0 605.9 718.9W. Champaran 32.2 96.0 1560.3 49.2 1737.7 11.4 23.2 949.9 34.6Darbhanga 20.3 69.5 1484.8 36.1 1610.7 1.3 44.8 726.0 772.1Samastipur 10.9 38.7 1718.7 36.9 1805.2 0.0 0.0 682.8 682.8Begusarai 19.5 86.8 1618.6 70.5 1795.4 19.9 15.0 713.9 748.8Munger 30.1 142.7 1379.8 64.8 1617.4 2.4 0.0 831.6 834.0Lakhisarai 25.0 97.0 1464.5 35.3 1621.8 33.4 50.6 798.6 882.6Madhubani 13.1 41.8 1192.6 8.4 1255.9 68.4 18.2 916.3 1002.9Sheikhpura 8.5 73.0 1334.5 36.7 1452.7 27.9 62.8 894.8 985.5Jamui 72.3 36.6 1083.2 36.7 1228.8 0.0 0.0 628.3 628.3Khagaria 26.6 125.3 1370.8 19.5 1542.2 26.8 50.9 801.1 878.8Bhagalpur 5.6 104.6 1118.0 20.2 1248.4 29.8 46.1 809.0 884.9Banka 69.8 153.5 1364.8 28.7 1616.8 67.7 36.6 751.9 856.2Saharsa 12.7 64.9 1161.1 32.0 1270.7 32.5 186.6 866.8 1085.9Supaul 26.1 178.3 1239.2 6.5 1450.1 18.0 238.8 443.5 700.3Madhepura 52.2 101.4 1193.5 11.9 1359.0 16.9 47.3 561.8 626.0Purnea 16.2 38.9 1336.2 16.4 1407.7 23.4 122.2 618.7 764.3Araria 0.0 259.0 1906.9 9.6 2175.5 26.7 188.4 1959.6 2174.7Kishanganj 0.0 0.0 1571.9 0.0 1571.9 6.0 180.6 1434.4 1621.0Katihar 10.6 101.2 1092.0 29.9 1233.7 19.3 106.5 993.3 1119.1
Bihar 28.3 76.4 1360.9 40.5 1506.1 29.2 61.4 949.9 1015.5
59

2.2 Land Utilisation
The distribution of the 93.6 lakh hectare geographical area of the state among different uses is
presented in Table 2.3. From the table, it is first observed that the forests are very limited in the
state, accounting for barely 6.64 percent of the total geographical area. Among other non-
agricultural use of land, those under tree crops are important, as they yield some additional income
for the rural people to supplement their income from crop production. During the period 2000-01
to 2005-06, it is interesting to note that the share of land under tree crops has increased from 2.47
to 2.57 percent, which implies that about an additional 10 thousand hectares of land has been
brought under the trees. It is most likely that the fallow land is being gradually converted into tree-
bearing land, because of which the share of fallow land in total geographical area has recorded a
small decline. That the soil of Bihar is very fertile is revealed by the high share of net sown area in
the total geographical area, nearly 60 percent. There has not been any change in the share of net
sown area in the recent years, but the gross sown area has increased much during the period and
the cropping intensity for the agricultural economy now stands at 2.06. This implies that, on an
average, every piece of agricultural land is double-cropped in Bihar.
Table 2.3 : Land Utilisation Pattern in Bihar
Percentage of Geographical Area Under Land use
2000-01 2001-02 2002-03 2003-04 2004-05 2005-06
(1) Forests 6.59 6.64 6.64 6.64 6.64 6.64
(2) Barren and Unculturable Land 4.66 4.66 4.66 4.66 4.66 4.66
(3) Land put to Non-agricultural use 17.51 17.55 17.55 17.57 17.59 17.58
Land Area 13.63 13.67 13.69 13.71 13.73 13.74
Water Area 3.88 3.88 3.86 3.86 3.86 3.84
(4) Culturable Waste 0.49 0.49 0.49 0.49 0.49 0.49
(5) Permanent Pastures 0.19 0.19 0.19 0.19 0.19 0.19
(6) Land Under Tree Crops 2.47 2.51 2.53 2.55 2.56 2.57
(7) Fallow Land (excl. current fallow) 1.44 1.44 1.42 1.39 1.42 1.38
(8) Current Fallow 6.15 6.01 5.33 5.48 6.92 7.12
Total Unculturable Land (1 to 8) 39.50 39.49 38.81 38.97 40.47 40.63
Net Sown Area 60.50 60.51 61.19 61.03 59.53 59.37
Gross Sown Area 85.39 84.37 85.02 84.22 79.06 122.02
Cropping Intensity 1.41 1.39 1.39 1.38 1.33 2.06
60

2.3 Production and Productivity
Because of its rich bio-diversity, the farmers in Bihar are able to produce a large number of crops
— cereals, pulses, oilseeds, fibre crops, fruits and vegetables. Table 2.4 presents the area and
production of major crops in Bihar in last eight years — 2000-01 to 2007-08. Since the production
level varies considerably from year to year, Table 2.5 presents the average figures taking the five-
year period of 2003-04 to 2007-08. From this table, one can see that the average levels of
production of major crops in Bihar are — 43.7 lakh tonnes (rice), 36.0 lakh tonnes (wheat), and
14.9 lakh tonnes (maize). Adding to this, the production of other cereals (which are all considered
as coarse cereals), the total production of cereals is 95.4 lakh tonnes. Further, taking into
consideration the total production of pulses at 4.9 lakh tonnes, the total production of foodgrains is
100.3 lakh tonnes, for a population of about 99.0 million. In addition to foodgrains, the major
crops also include oilseeds and fibres and the average levels of their production are 1.3 lakh tonnes
(oilseeds) and 13.1 lakh bales of (fibre crops).
Percentage of area
Crops 2000-01 2001-02 2002-03 2003-04 2004-05 2005-06 2006-07
2007-08 (2nd Adv
Esti)
Foodgrains 95.98 96.01 96.09 96.12 53.34 62.96 49.99 46.84
Cereals 87.21 87.79 87.81 89.79 34.13 39.64 31.60 28.64
Pulses 8.77 8.22 8.28 6.33 19.21 23.32 18.38 18.20
Oilseeds 1.85 1.91 1.95 1.80 12.69 14.67 12.14 12.37
Fibres 2.17 2.07 1.97 2.09 33.97 22.38 37.87 40.78
Total 100.00 100.00 100.00 100.00 100.00 100.00 100.00 100.00
Since the agricultural economy of Bihar is still basically oriented toward subsistence, the
foodgrains account for a very large part of the area under major crops. From the table below, it is
observed that nearly 95 percent of the area under major crops is devoted to foodgrains. Within that
category, the share of cereals production has been increasing — it was 87.21 percent in 2000-01,
but has reached 94.20 percent in 2007-08. Consequently, the share of area under pulses has
decreased from 8.77 percent in 2000-01 to only 1.42 percent in 2006-07. There is also a small
increase in the share of area under oilseeds; from 1.85 percent in 2000-01 it has increased to 2.03
percent in 2007-08. For fibres, the share of area has remained nearly unaltered around 2.23
percent.
61

Table 2.4 : Area and Production of Major Crops in Bihar (2000-01 to 2003-04)
(Area in `000 ha/Production in `000 tonne)
2000-01 2001-02 2002-03 2003-04 Crops
Area Prodn Area Prodn Area Prodn Area Prodn Total Cereals 6455.6 11495.1 6379.6 11187.9 6447.6 10578.2 6364.7 10696.0 Total Rice 3656.8 5444.4 3552.2 5202.9 3584.7 5085.6 3578.0 5447.8 Aghani Rice 2939.8 4444.4 2843.6 4244.6 2881.1 4205.0 2907.2 4589.7 Autumn Rice 591.7 786.9 593.8 736.3 583.3 682.9 553.9 688.2 Summer Rice 125.3 213.2 114.9 222.0 120.4 197.6 116.9 169.9 Wheat 2067.3 4438.0 2126.3 4391.1 2130.9 4040.6 2076.8 3688.9 Total Maize 620.5 1497.3 594.3 1488.3 603.6 1349.8 616.4 1473.6 Autumn Maize 273.0 477.1 244.6 460.3 255.0 428.2 259.0 438.0 Rabi Maize 191.5 559.1 185.8 593.6 187.7 489.9 196.3 594.7 Summer Maize 156.0 461.1 163.9 434.4 160.9 431.6 161.1 440.8 Total Coarse Cereals 110.9 115.5 106.8 105.7 128.4 102.2 93.4 85.7 Jowar 1.1 1.0 4.4 3.7 4.4 4.4 1.5 1.5 Bajra 1.5 1.3 0.8 0.6 1.0 1.0 1.6 1.6 Ragi 22.5 24.7 19.6 16.7 28.7 14.2 15.2 10.4 Barley 22.6 26.5 21.6 26.7 20.3 23.4 21.4 24.0 Small Millets 7.8 4.3 7.0 5.1 9.8 7.9 7.0 5.3 Other Coarse Cereals 55.5 57.7 53.4 52.8 64.2 51.1 46.7 42.9 Total Pulses 717.2 621.5 694.2 547.1 697.8 560.9 680.9 434.2 Total Rabi Pulses 613.1 522.8 597.5 461.8 604.5 479.5 592.8 351.9 Gram 76.2 78.7 68.2 65.3 71.4 72.1 80.3 78.6 Lentil 172.2 169.8 172.6 137.8 179.6 156.6 171.0 159.8 Khesari 157.1 143.7 157.0 129.7 141.6 114.7 133.1 Pea 25.7 24.8 23.8 23.4 23.3 20.8 23.7 22.2 Summer Moong 177.8 103.4 172.7 103.3 185.1 112.8 181.4 88.9 Other Rabi Pulses 4.1 2.3 3.1 2.2 3.5 2.5 3.3 2.5 Total Kharif Pulses 104.1 98.8 96.8 85.2 93.3 81.4 88.0 82.4 Tur 43.6 58.9 41.3 47.7 37.7 43.0 38.9 48.1 Moong 9.2 5.2 7.9 3.9 10.7 5.7 8.4 4.2 Urad 32.1 20.3 32.0 21.5 25.1 18.6 24.2 18.0 Ghaghra 0.6 0.4 0.8 0.4 0.8 0.4 0.4 0.2 Kulthi 17.5 13.5 14.3 11.5 13.1 10.4 15.4 11.4 Other Kharif Pulses 1.1 0.6 0.5 0.3 5.9 3.3 0.7 0.4 Total Oilseeds 153.7 131.0 1427.8 1260.1 137.2 104.9 140.5 123.7 Groundnut 0.1 0.1 2.5 1.4 0.4 0.2 0.5 0.2 Castor Seeds 0.3 0.2 0.6 0.7 0.3 0.3 0.2 0.2 Seasamum 3.4 1.8 31.0 79.9 3.8 2.7 3.8 2.8 Rape & Mustard 97.0 84.4 931.2 780.8 90.1 62.0 83.7 69.0 Linseed 41.8 28.5 357.5 256.1 29.2 22.2 34.7 27.2 Safflower 0.3 0.2 2.6 2.1 0.2 0.1 0.2 0.2 Sunflower 10.8 15.8 102.3 139.2 13.4 17.4 17.5 24.2 Total Fiber Crops 169.7 1381.6 1605.6 11037.4 232.1 1096.6 178.0 1288.7 Jute 135.3 1133.7 1426.3 9964.4 147.8 973.5 154.6 1147.4 Mesta 31.9 246.3 153.7 1052.9 80.0 120.0 20.0 138.9 Sanhemp 2.4 1.7 25.6 20.1 4.2 3.0 3.4 2.5
…. (Contd.)
62

Table 2.4 : (Contd. )
2004-05 2005-06 2006-07 2007-08(2nd Adv Esti)
Crops Area Prodn Area Prodn Area Prodn Area Prodn
Total Cereals 5922.4 7473.7 5995.6 7926.8 6142.0 11005.4 5913.5 8411.3 Total Rice 3188.2 2625.1 3249.5 3677.4 3357.1 4989.2 3302.0 3775.4 Aghani Rice 2519.7 1957.7 2604.8 3023.0 2736.6 4333.7 3302.0 3775.4 Autumn Rice 554.2 505.7 533.8 502.0 511.1 491.5 - - Summer Rice 114.3 161.7 111.0 152.4 109.4 164.0 - - Wheat 2022.3 3279.9 2003.7 2763.3 2049.7 4211.4 2049.7 3474.2 Total Maize 626.9 1491.2 649.1 1397.2 641.9 1714.8 472.9 1076.3 Autumn Maize 271.0 443.8 277.0 456.1 259.5 397.6 269.2 432.4 Rabi Maize 195.1 592.9 208.9 551.8 382.4 1317.2 203.7 644.0 Summer Maize 160.8 454.5 163.2 389.3 - - - - Total Coarse Cereals 84.9 77.4 93.3 88.8 93.3 90.0 89.0 85.4 Jowar 2.0 2.0 4.1 4.2 3.4 3.5 3.7 3.8 Bajra 1.2 1.3 4.3 4.6 4.1 4.4 4.8 5.1 Ragi 15.4 10.9 14.5 11.3 14.3 12.5 14.7 12.1 Barley 18.4 20.3 16.3 18.8 18.7 19.9 17.7 18.9 Small Millets 5.5 4.2 7.4 5.5 6.2 4.6 3.7 2.7 Other Coarse Cereals 42.5 38.7 46.6 44.4 46.6 45.0 44.5 42.7 Total Pulses 649.2 471.4 597.4 447.1 607.8 431.2 448.7 365.4 Total Rabi Pulses 567.2 387.3 517.5 368.9 519.6 356.6 365.2 285.7 Gram 73.3 61.0 62.2 56.1 56.7 46.4 64.2 55.5 Lentil 179.4 131.2 162.5 114.5 166.5 117.3 - - Khesari 118.0 84.9 92.1 78.6 101.7 80.3 - Pea 23.1 20.9 24.1 21.5 23.7 22.0 - - Summer Moong 171.2 87.5 174.1 96.2 168.7 88.7 - - Other Rabi Pulses 2.3 1.8 2.4 1.9 2.4 1.9 301.0 230.2 Total Kharif Pulses 82.0 84.1 79.9 78.2 88.1 74.7 83.5 79.7 Tur 35.3 49.2 33.3 43.0 35.9 35.5 35.1 43.5 Moong 6.8 3.9 8.2 4.9 10.1 5.5 8.4 4.8 Urad 24.4 18.1 25.2 19.4 25.5 19.8 25.0 19.1 Ghaghra 0.5 0.2 0.5 0.2 0.9 0.6 - - Kulthi 14.3 12.4 11.7 10.1 14.0 12.1 - - Other Kharif Pulses 0.7 0.4 0.9 0.5 1.8 1.2 14.9 12.4 Total Oilseeds 136.9 116.3 139.0 137.6 142.9 147.4 127.5 116.8 Groundnut 0.8 0.4 0.9 0.5 0.9 0.5 0.9 0.4 Castor Seeds 0.2 0.1 0.1 0.1 0.1 0.1 0.1 0.1 Seasamum 3.5 2.7 3.6 2.9 3.3 2.5 3.3 2.6 Rape & Mustard 83.3 59.8 82.1 77.1 86.9 89.4 84.6 75.3 Linseed 27.8 24.0 29.5 26.4 28.6 24.3 27.8 23.8 Safflower 0.2 0.2 0.2 0.2 0.2 0.1 0.8 0.6 Sunflower 21.2 29.1 22.6 30.4 22.8 30.5 9.9 13.8 Total Fiber Crops 160.8 1373.9 150.7 1389.1 144.5 1392.5 147.9 1415.4 Jute 140.9 1223.7 133.0 1298.6 127.1 1253.3 133.0 1272.9 Mesta 16.1 147.3 14.5 88.0 14.1 136.5 14.9 142.5 Sanhemp 3.9 3.0 3.2 2.4 3.2 2.6 0.0 0.0
(Concluded)
63

Table 2.5 : Average Area Production and Yield of Major Crops (for the Period 2002-03 to 2006-07)
(Area : '000 hectares, Production : '000 tonne : Yield: kg/hec)
Crops Area Prodn Yield Crops Area Prodn Yield Total Cereals 6174 9536 1544 Pea 24 21 911 Total Rice 3392 4365 1287 Summer Moong 176 95 539 Aghani Rice 2730 3622 1327 Other Rabi Pulses 3 2 757 Autumn Rice 547 574 1049 Total Kharif Pulses 86 80 929 Summer Rice 114 169 1478 Tur 36 44 1209 Wheat 2057 3597 1749 Moong 9 5 548 Total Maize 628 1485 2367 Urad 25 19 755 Autumn Maize 264 433 1637 Ghaghra 1 0 561 Rabi Maize 234 709 3030 Kulthi 14 11 822 Summer Maize 161 429 2657 Other Kharif Pulses 2 1 567 Total Coarse Cereals 99 89 900 Total Oilseeds 139 126 904 Jowar 3 3 1021 Groundnut 1 0 493 Bajra 2 3 1064 Castor Seeds 0 0 965 Ragi 18 12 673 Seasamum 4 3 765 Barley 19 21 1120 Rape & Mustard 85 71 839 Small Millets 7 6 770 Linseed 30 25 828 Other Coarse Cereals 49 44 900 Safflower 0 0 801 Total Pulses 647 493 763 Sunflower 20 26 1349 Total Rabi Pulses 560 413 738 Total Fiber Crops 173 1308 7553 Gram 69 63 913 Jute 141 1179 8383 Lentil 172 136 791 Mesta 29 126 4358 Khesari 117 96 820 Sanhemp 4 3 755
As regards productivity of different crops, they are presented in Table 2.6. Since these
productivity figures again vary substantially over the years, it is desirable to consider the average
figures which are presented in Table 2.5. For rice, the average productivity is 1287 kgs/hectare,
although for aghani rice (the most important among three rice varieties), the productivity is a little
higher at 1327 kgs/ hectare. The productivity of wheat is higher and stands at 1749 kgs/ hectare.
The most satisfactory levels of productivity is attained by maize (2367 kgs/ hectare) and here
again rabi maize (the most important among the three varieties of maize) has an even higher
productivity at 3030 kgs/hectare. For the pulses, the rabi season is more important as it accounts
for more than 80 percent pulse production; but the productivity of kharif pulses (929 kgs/hectare)
is found be higher than the productivity of rabi pulses (738 kgs/hectare).
As mentioned before, bio-diversity is very wide in Bihar and, therefore, the farmers in Bihar
produce a large number of fruits and vegetables, besides the major crops listed in Table 2.4.
64

Table 2.6 : Productivity of Major Crops in Bihar (2000-01 to 2007-08)
(Productivity in kg./ha)
Crops 2000-01 2001-02 2002-03 2003-04 2004-05 2005-06 2006-07 2007-08 (2nd Adv Esti)
Total Cereals 16862.6 16639.6 15585.1 16289.5 15544.6 14904.5 14281.2 13305.8 Total Rice 1488.8 1464.7 1418.7 1522.6 823.4 1131.7 1486.1 1143.4 Aghani Rice 1511.8 1492.7 1459.5 1578.7 776.9 1160.6 1583.6 1143.4 Autumn Rice 1329.8 1240.0 1170.9 1242.4 912.5 940.5 961.6 - Summer Rice 1700.5 1932.7 1642.0 1453.6 1415.1 1372.9 1498.4 - Wheat 2146.7 2065.1 1896.2 1776.2 1621.9 1379.1 2054.7 1695.0 Total Maize 7622.3 7726.7 6972.3 7457.1 7503.5 6673.9 4976.6 4767.9 Autumn Maize 1748.0 1881.6 1678.9 1691.0 1637.9 1646.7 1532.2 1606.0 Rabi Maize 2919.6 3194.3 2610.2 3029.1 3038.6 2641.0 3444.4 3161.9 Summer Maize 2954.7 2650.8 2683.2 2737.0 2827.0 2386.2 - - Total Coarse Cereals 5604.8 5383.2 5297.9 5533.6 5595.9 5719.8 5763.8 5699.5 Jowar 914.4 851.0 1010.0 1009.3 1014.0 1030.2 1032.4 1024.1 Bajra 825.3 722.2 1029.5 1044.6 1097.2 1058.3 1075.4 1077.7 Ragi 1098.7 850.3 496.1 683.2 706.7 777.4 873.4 827.3 Barley 1173.9 1238.7 1152.8 1119.4 1104.8 1154.0 1067.8 1069.0 Small Millets 551.5 731.3 813.6 759.6 761.6 747.2 750.4 741.8 Other Coarse Cereals 1040.9 989.6 796.0 917.6 911.6 952.7 964.3 959.6 Total Pulses 9490.3 9126.8 9166.8 9313.1 9042.3 9292.3 9078.2 5027.2 Total Rabi Pulses 5044.9 4870.7 4907.1 5000.6 4465.0 4704.0 4559.1 1628.8 Gram 1033.7 958.5 1009.8 978.4 831.9 900.8 819.0 864.0 Lentil 986.2 798.5 872.1 934.0 731.4 704.6 704.4 - Khesari 914.6 826.3 809.7 921.2 720.0 854.0 789.2 - Pea 965.1 984.1 893.1 934.0 905.0 891.0 929.8 - Summer Moong 581.3 598.0 609.5 490.2 511.4 552.6 525.8 - Other Rabi Pulses 563.9 705.2 712.9 742.9 765.3 801.1 790.8 764.8 Total Kharif Pulses 4445.4 4256.1 4259.7 4312.5 4577.3 4588.3 4519.1 3398.3 Tur 1349.8 1155.1 1140.3 1237.9 1394.4 1292.1 989.2 1237.8 Moong 559.6 486.6 539.1 503.8 563.9 593.9 544.6 568.5 Urad 633.0 672.3 740.6 744.2 740.1 771.6 777.5 763.1 Ghaghra 608.9 581.9 491.4 551.1 494.0 494.8 704.0 - Kulthi 772.7 802.8 795.5 739.0 865.1 860.1 863.1 - Other Kharif Pulses 521.2 557.4 552.8 536.5 519.8 575.9 640.9 829.0 Total Oilseeds 6268.5 7878.5 5766.4 6027.0 5973.5 6228.6 6171.2 6223.0 Groundnut 1104.2 561.0 493.3 493.6 495.4 494.0 489.1 494.3 Castor Seeds 827.1 1047.6 987.3 993.5 940.0 947.4 916.7 1000.0 Seasamum 523.7 2575.1 720.5 748.4 783.8 800.1 774.4 786.1 Rape & Mustard 869.5 838.5 688.4 824.4 717.6 939.8 1028.4 890.0 Linseed 682.3 716.2 760.1 784.0 862.8 895.1 848.9 855.9 Safflower 802.9 779.5 814.8 805.0 799.1 807.7 777.8 797.5 Sunflower 1458.8 1360.7 1302.0 1378.1 1374.8 1344.6 1336.0 1399.2 Total Fiber Crops 16781.7 14620.7 8798.2 15080.6 18625.3 16596.5 20338.2 19125.4 Jute 8379.4 6986.2 6587.1 7422.0 8686.3 9764.2 9860.2 9570.0 Mesta 7717.4 6848.8 1499.9 6941.6 9173.1 6060.6 9655.6 9555.3 Sanhemp 684.8 785.8 711.2 716.9 766.0 771.7 822.4 -
65

Table 2.7 : Area, Production and Yield of Miscellaneous Crops in Bihar (2004-05 to 2007-08)
(Area : '000 hectares, Production : '000 tonne : Yield : kg/hec)
2004-2005 2005-2006 2006-2007 Crops
Area Prodn Yield Area Prodn Yield Area Prodn Yield Potato 145.0 1110.7 7658.0 142.3 1232.7 8663.0 151.4 1178.1 7781.1 Onion 14.2 104.7 7378.9 15.9 128.1 8078.1 15.1 120.5 7988.7 Sweet Potato 5.0 69.0 13877.7 - - - 5.5 73.5 13386.2 Sugarcane 104.5 3769.2 36083.8 101.3 4337.9 42826.8 117.2 5338.8 45561.0 Tobacco 16.0 18.6 1161.0 14.9 17.3 1160.9 1.4 16.1 11446.8 Chillies(dry) 3.0 2.2 728.8 3.1 3.1 998.7 2.9 3.0 1048.6 Ginger(dry) - 0.6 1512.7 0.8 1.2 1495.0 - 0.8 1551.0 Turmaric 2.8 2.7 964.6 3.5 3.4 957.5 3.0 3.0 980.3 Coriander 2.2 1.6 737.7 2.3 1.7 724.2 2.3 1.7 740.1 Garlic 2.6 3.9 1506.3 2.8 4.1 1461.5 - 3.8 15916.7 Cauliflower 59.7 955.2 16000.0 19.9 1.4 71.3 60.1 1009.0 16778.5 Cabbage 36.5 598.8 16400.0 9.6 - - 37.0 623.5 16849.0 Tomato 46.0 735.8 16000.0 2.3 - 174.1 46.5 916.8 19732.0 Bhindi 56.2 730.2 13000.0 12.3 - - - - - Bringer 53.7 1073.0 20000.0 - 1.2 2415.7 54.1 1120.6 20723.8 Pumpkin 29.1 582.9 20000.0 9.9 6.1 617.9 - - - Cucumber - - - 1.3 13.9 11078.2 1.5 15.7 10671.2 Bittergourd 8.4 50.5 6000.0 8.5 49.3 5800.0 8.7 59.4 6803.7 Par wale 4.6 45.9 10000.0 4.6 47.8 10300.1 - - - Bode 11.6 69.5 6000.0 11.6 86.1 7399.3 - - - Pea - - - 8.1 50.5 6243.8 8.7 53.1 6072.8 Radish - - - 14.4 217.3 15136.6 14.9 226.6 15178.7 Carrot - - - 4.0 46.1 11642.0 - - - Mango 140.1 865.6 6178.3 140.2 1222.7 8720.0 140.8 1306.9 9283.2 Guava 27.7 256.1 9257.3 27.7 199.0 7180.0 28.0 248.0 8857.6 lichy 28.4 204.9 7219.0 28.4 200.1 7044.5 28.8 211.9 7368.6 Lemon 16.8 122.9 7310.5 16.8 112.3 6670.0 17.1 121.6 7102.0 Banana 28.0 920.0 32872.8 28.0 959.3 34210.0 29.0 1125.1 38779.1 Pineapple 4.2 122.5 29077.8 4.2 108.0 25540.1 4.5 121.1 27179.4 Cocunet 15.2 150.8 9952.3 15.2 123.8 8160.0 - - - Others Fruits 30.9 277.5 8970.3 31.0 267.0 8615.0 31.3 291.9 9331.3
Table 2.7 presents the list of these fruits and vegetables, along with their levels of area, production
and productivity in 2004-05, 2005-06 and 2006-07. As can be seen from the table, sugarcane is an
extremely important crop in Bihar which had a production level of 53.4 lakh tonnes in 2006-07.
Among the remaining miscellaneous crops, those which are important in Bihar under the category
of vegetables include potato, cauliflower, tomato and brinjal. The production level of these
66

Table 2.8 : Districtwise Area, Production and Yield of Major Crops in 2006-07
(Area : hectares, Production : tonne : Yield: kg/hec)
Rice Wheat Maize Districts
Area Prodn Yield Area Prodn Yield Area Prodn Yield
Patna 88480 145350 1643 57643 123775 2147 11965 28545 2386
Nalanda 95385 227246 2382 82238 157209 1912 4973 7847 1578
Bhojpur 85454 226802 2654 75252 190165 2527 3651 7002 1918
Buxar 82536 187071 2267 60699 123162 2029 4286 4855 1133
Rohtas 166681 468067 2808 135644 330444 2436 591 1010 1709
Bhabhua 133136 310928 2335 61071 131927 2160 356 470 1320
Gaya 54595 80617 1477 73663 156981 2131 6256 11225 1794
Jahanabad 84720 156043 1842 32803 72142 2199 1280 3067 2396
Nawada 73308 147689 2015 45191 97142 2150 2678 5985 2235
Aurangabad 171133 444650 2598 61320 124774 2035 591 999 1690
Saran 86752 97669 1126 88112 206367 2342 27777 53835 1938
Siwan 106790 148459 1390 91888 191136 2080 19410 44212 2278
Gopalgunj 75801 89959 1187 83202 208168 2502 14925 28159 1887
Muzaffarpur 139377 95559 686 85448 163884 1918 22543 48798 2165
E.Champaran 212875 166100 780 98681 199138 2018 17184 19858 1156
W.Champaran 168920 167909 994 83627 159715 1910 16620 24811 1493
Sitamarhi 92512 64415 696 68215 118146 1732 6149 12560 2043
Sheohar 23671 12351 522 14075 19128 1359 972 3597 3701
Vaishali 59596 46071 773 47880 120298 2512 34162 69797 2043
Darbhanga 74855 65429 874 67181 126518 1883 13418 36367 2710
Madhubani 158929 141393 890 82150 131494 1601 1217 3278 2694
Samastipur 70238 41689 594 51367 143248 2789 44568 161829 3631
Begusarai 24451 33919 1387 52751 114505 2171 63287 131759 2082
Munger 30027 59693 1988 18205 33736 1853 7788 15461 1985
Sheikhpura 39302 94300 2399 30061 74091 2465 8152 12203 1497
Lakhisarai 24520 56289 2296 20530 41845 2038 1431 1906 1332
Jamui 50289 88727 1764 11777 17647 1498 5033 5611 1115
Khagaria 22217 19132 861 32229 47665 1479 54737 224875 4108
Bhagalpur 48200 114228 2370 44159 73965 1675 44438 104899 2361
Banka 99429 258065 2595 28781 53142 1846 12214 29779 2438
Saharsa 87740 86432 985 42621 82012 1924 30479 110101 3612
Supaul 102061 120735 1183 50795 94125 1853 11902 54673 4594
Madhepura 78281 89689 1146 36629 53177 1452 39810 114837 2885
Purnea 123851 118237 955 46296 62224 1344 42968 150671 3507
Kishanganj 138639 142541 1028 21676 27904 1287 1549 4659 3008
Araria 82768 75595 913 57551 40153 698 20765 74704 3598
Katihar 106491 138899 1304 35316 44389 1257 41090 141705 3449
Total 3364010 5027947 1495 2076727 4155541 2001 641215 1755949 2738
67

vegetables in 2006-07 were — 11.8 lakh tonnes (potato), 10.1 lakh tonnes (cauliflower), 9.2 lakh
tonnes (tomato) and 11.2 lakh tonnes (brinjal). The category of fruits also include a number of
species, but the four most important ones are — mango, litchi, guava and banana. The production
levels of these fruits in 2006-07 were — 13.1 lakh tonnes (mango), 2.1 lakh tonnes (litchi), 2.5
lakh tonnes (guava) and 11.3 lakh tonnes (banana).
Table 2.9 : Advance Estimates of Area, Production and Yield of Major Crops in Bihar for 2008-09 (Area : `000 hectares, Production : `000 tonne : Yield : kg/hec)
Crops Area Production Yield Rice Bhadai 546.33 435.43 797 Rice Agahani 2997.09 3914.19 1306 Jowar 5.17 4.83 933 Bajara 2.68 2.53 944 Maize 223.33 264.87 1186 Ragi 10.11 5.98 592 Small Millets 2.98 1.98 666 Tur - - - Urad 18.38 13.22 719 Mung 7.26 4.13 569 Other Kharif Pulses 12.30 9.71 790 Groundnut 0.98 0.49 494 Seasmum 2.05 1.42 691 Castorseed - - - Nigerseed - - - Soyabean - - - Sunflower 3.44 3.75 1091 Cotton - - - Jute 133.04 1260.21 9472 Mesta 22.07 203.79 9233 Sugercane 107.59 4351.59 40446
Note : Production of Cotton in '000 bales of 170 kgs. Production of Jute and Mesta in '000 bales of 180 kgs.
As regards the status of agricultural economy among the districts, Table 2.8 presents the area,
production and productivity of three most important crops in Bihar (rice, wheat and maize) in
2006-07 for all the 38 districts. Taking into consideration rice, the top five districts in terms of
production are Nalanda (2.3 lakh tonnes), Bhojpur (2.3 lakh tonnes), Rohtas (4.7 lakh tonnes),
Bhabhua (3.1 lakh tonnes) and Aurangabad (4.4 lakh tonnes). The top five districts in terms of
productivity are — Bhojpur (2654 kgs/hectare), Nalanda (2382 kgs/ hectare), Aurangabad (2598
kgs/ hectare), Sheikhpura (2399 kgs/hectare) and Banka (2595 kgs/hectare). It can also be
68

observed from the table that the gap between the highest and the lowest levels of productivity in
the districts is very large for all the crops — rice, wheat and maize. For rice, the two extreme
levels of productivity are 2808 kgs/hectare (Bhabhua) and 522 kgs/hectare (Sheohar). Similarly,
for wheat, the two extreme levels of productivity are 2789 kgs/hectare (Samastipur) and 698
kgs/hectare (Araria). Finally, for maize, the two extreme levels of productivity are 4108
kgs/hectare (Khagaria) and 115 kgs/hectare (Jamui).
To help the state government in planning its agricultural strategy, the Directorate of Statistics and
Evaluation prepares advance estimates of area and production of major crops in Bihar. Table 2.9
presents these advanced estimates for the year 2008-09. If one compares these advanced estimates
of production with the average levels of production (Table 2.5), it is noted that, because of the
devastating floods in the Kosi region of Bihar, the state is expected to face a considerable loss of
crop production in 2008-09. These losses are expected for all the crops for which advanced
estimates are available, except aghani rice and jowar.
2.4 Irrigation
To free agriculture from the uncertainities of monsoon, it is extremely important to provide
assured irrigation facilities to the sector. Not only does it provide stability of agricultural
production, assured irrigation is also a necessary pre-requisite for adoption of high yielding variety
(HYV) seeds. In view of the abundant water resources in the state, the provision of adequate
irrigation facilities should not be a major challenge in Bihar, but unfortunately, only about 60
percent of the cultivated area is endowed with some irrigation facility in the state.
During the period 2000-01 to 2007-08, the total irrigation area in Bihar has increased from 28.20
lakh hectares to 32.24 lakh hectares (Table 2.10). This implies a growth of 14.3 percent, over a
period of 7 years. One of the major constraints in the spread of irrigation is that tubewells are now
the major source of irrigation and, in the absence of adequate supply of electricity, the tubewells
are often run on diesel, an expensive input for the farmers. With some expected improvement in
the power sector, because of recent initiatives of the state government, the situation is likely to
improve.
69

Table 2.10 : Sourcewise Irrigated Area in Bihar (lakh hectares)
Year Canal Surface
M.I
Tank (including Aher & Pyne
system)
Tubewell (Private &
State)
Other Well (irrigation well)
Other Sources (L.I & Barge
L.I)
Total irrigated Area
2000-01 29.22 (1.0) 332.56 (11.8) 2310.06 (81.9) 145.84 (5.2) 3.26 (0.1) 2820.93 (100.0)
2001-02 23.25 (0.8) 332.56 (11.8) 2308.71 (82.0) 145.79 (5.2) 3.56 (0.1) 2813.87 (100.0)
2002-03 28.69 (1.0) 332.56 (11.1) 2474.77 (82.9) 145.79 (4.9) 3.19 (0.1) 2985.00 (100.0)
2003-04 34.88 (1.1) 332.56 (10.5) 2650.38 (83.7) 145.79 (4.6) 1.95 (0.1) 3165.56 (100.0)
2004-05 17.56 (0.5) 431.21 (13.3) 2664.00 (82.2) 121.01 (3.7) 6.23 (0.2) 3240.01 (100.0)
2005-06 19.86 (0.6) 332.56 (10.5) 2643.21 (83.4) 145.79 (4.6) 28.23 (0.9) 3169.65 (100.0)
2006-07 29.34 (0.9) 332.56 (10.3) 2710.50 (83.6) 145.79 (4.5) 23.33 (0.7) 3241.52 (100.0)
2007-08 29.80 (0.9) 332.56 (10.3) 2701.19 (83.8) 145.79 (4.5) 15.12 (0.5) 3224.45 (100.0)
As regards the contribution of different sources towards irrigation facilities, it is observed that
tubewell irrigation is the most important source, accounting for 83.8 percent of the irrigated area
in 2007-08. Over the years, this share has increased from 81.9 percent in 2000-01 to its present
level of 83.8 percent. The share of other sources of irrigations (canal, tanks, other wells and other
sources) has either remained unaltered or decreased marginally.
As mentioned later, the Raod Map for Agriculture for Bihar, prepared by the state government
visualises creation of additional irrigation capacity through a number of projects. Among these
projects are included Western Kosi Canal, Durgawati Waterbody, Sone Canal Modernisation,
Barnar Waterbody, Bateswarnath Ganga Pump Canal (Phase I), Jamania Pump Canal, North Koel
Waterbody, Punpun Barrage, Batane Waterbody, Uderasthan Barrage and Bagmati Multipurpose
Plans. The state government is also planning the interlinking of rivers in the state as a step towards
integrated water management of the state. Apart from generating additional irrigation capacity, the
project will also alleviate the problems of flood and drought. For this, a river basin will be taken
up as a unit and an integrated plan will be made for irrigation, flood control and water drainage.
2.5 Agricultural Inputs
Besides irrigation facilities, agricultural development also requires supply of adequate and quality
inputs, particularly seed, fertilisers and extension services.
Seed
For realising the full potential of land and irrigation inputs, availability of quality seeds is
extremely important for raising the productivity of cultivation. For various reasons, the Seed
70

Replacement Rate (SRR) is one of the lowest in Bihar among the major states in India and the
state government has made substantial efforts in recent years to improve the situation. This
improvement is visible for both Kharif and Rabi crops (Table 2.11).
Among the kharif crops, the SRR for paddy in 2008-09 was 19.0 percent, compared to only 12.0
percent in 2006-07. In case of kharif maize, there has been a modest increase in SRR from 50.0
percent in 2006-07 to 57.0 percent in 2008-09. However, in case of arhar, urad and moong, the
increase in SRR is only marginal. Among the rabi crops, the SRR is available only for 2006-07
and 2007-08. Between these two years, the SRR for two crops has gone up substantially — maize
(from 60.0 to 74.0 percent) and rape/mustard (from 40.0 to 73.0 percent). For other crops (wheat,
gram and masoor), the increase in SRR is moderate, while the same for peas has recorded a small
decrease.
Table 2.11 : Distribution of Certified Seeds and Seed Replacement Rate (SRR) for Important Crops in Bihar (2006-07 to 2008-09)
(Requirement and supply in qntl. / SRR in percentage)
2006-07 2007-08 2008-09 Year/Crops Require-
ment Supply SRR
Require-ment
Supply SRR Require-
ment Supply SRR
Kharif Crops
Paddy 207200 203977 12.0 222000 204824 14.0 282080 267620 19.0
Maize 41500 20880 50.0 40000 42390 56.0 41580 42850 57.0
Arhar 3500 360 5.0 1280 410 4.0 1440 940 6.0
Urad 1400 167 8.0 600 550 9.0 720 610 10.0
Moong 420 325 9.0 300 918 30.0 360 315 10.0
Rabi Crops
Wheat 320000 265400 11.0 34500 342340 15.0 470000 - -
Maize 55000 54200 60.0 75000 74340 74.0 80000 - -
Gram 13000 5230 6.0 8325 6950 8.0 9990 - -
Pea 2700 1700 7.0 3000 1520 5.0 3600 - -
Masoor 6000 4100 7.0 6600 3208 5.0 7920 - -
Rape/ Mustard
1500 3200 40.0 2310 4840 73.0 2640 - -
Realising the importance of supply of quality seeds, the state government has taken several steps
to improve seed management. While the Bihar State Seed Corporation was revived from a state of
liquidation in 2006-07, all the seed multiplication farms were operationalised in 2007-08.
71

Fertiliser
The consumption of chemical fertiliser in Bihar has been rising steadily in recent years (Table
2.12). The consumption levels were — 2250.19 thousand tonnes (2004-05), 2772.79 thousand
tonnes (2005-06), 3225.31 thousand tonnes (2006-07) and, finally, 3649.32 thousand tonnes
(2007-08). Thus, over a four-year period, consumption has increased by 62.2 percent which shows
the eagerness of the farmers in Bihar to utilize this valuable input. The per hectare consumption of
fertiliser stands at 155.60 kgs. in 2007-08. Between the two important crop seasons, the use of
fertiliser is higher in rabi season (195.80 kgs/ha) which is more than one and a half times the
consumption in kharif season (120.10 kgs/ha). Among the different types of fertilisers, the use of
urea is the widest, as it alone accounts for about half the fertiliser consumption.
Table 2.12 : Cosumption of Fertilizer in Bihar (2004-05 to 2007-08) (000' tonne)
2004-05 2005-06 Fertiliser
Kharif Rabi Total Kharif Rabi Total Urea 616.76 663.61 1280.37 647.32 733.94 1381.26 DAP 23.60 75.15 98.75 62.16 116.36 178.52 SSP 2.40 2.37 4.77 5.71 24.88 30.59 MOP 1.34 49.92 51.26 43.10 80.38 123.48 Complex 15.23 68.13 83.36 42.69 102.83 145.52 Total (NPK) 309.48 422.20 731.68 389.58 523.84 913.42
N 290.13 328.67 618.80 314.91 373.15 688.06 P 16.11 54.79 70.90 42.66 88.36 131.02 K 3.24 38.74 41.98 32.01 62.33 94.34
Total 968.81 1281.38 2250.19 1190.56 1582.23 2772.79
Consumption of Fertiliser (kg/ha.)
- - 92.15 101.65 138.11 119.78
2006-07 2007-08 Fertiliser
Kharif Rabi Total Kharif Rabi Total Urea 666.51 931.59 1598.10 783.80 1067.92 1851.72 DAP 95.90 167.32 263.22 103.81 209.14 312.95 SSP 16.96 9.83 26.79 15.52 4.58 20.10 MOP 26.86 63.52 90.38 33.19 71.86 105.06 Complex 75.28 106.74 182.02 81.38 72.65 154.03 Total (NPK) 430.21 634.59 1064.80 495.24 710.24 1205.47
N 333.59 475.12 808.71 391.32 538.16 929.48 P 69.86 108.86 178.72 73.96 117.60 191.57 K 26.76 50.61 77.38 29.96 54.47 84.43
Total 1311.72 1913.59 3225.31 1512.93 2136.39 3649.32
Consumption of Fertiliser (kg/ha.)
113.10 171.00 141.70 120.10 195.80 155.60
72

Extension Services
Mainly because of limited staff strength of the concerned department, the extension services for
agricultural development has been rather limited in Bihar. For several agricultural operations like
seed management, optimum mix of different chemical fertilisers, introduction of new varieties of
crops and adoption of new cropping patterns that are likely to raise the income of farmers, it is
very necessary to strengthen the extension services in Bihar. Responding to this need, the state
government has already prepared a document for wider extension services which is expected to
reach upto the Panchayat level.
Table 2.13 : Minikit Demonstration in Bihar (2006-07 to 2008-09)
Number of demonstration Season / Crops
2006-07 2007-08 2008-09
Kharif Season
Paddy (20 kg) - 9118 -
Paddy (HYV) (10 kg) 15040 - -
Paddy (5 kg) - - 35880
Paddy (HYV) (2 kg) 2550 - -
Maize (2 kg) 1000 7000 10000
Arhar (4 kg) 5000 2750 5000
Urad (4 kg) 900 7500 30000
Moong (4 kg) - 5450 2225
Castor (2 kg) 800 - 2500
Sesamum (1 kg) 2000 500 -
Rabi Season
Wheat (40 kg) 26513 - -
Wheat (10 kg) - -
Wheat (5 kg) - 151500 -
Maize (2 kg) 10000 - -
Gram (8 kg) 11200 81900 -
Masoor (4 kg) 2850 18100 -
Pea (8 kg) 3600 3767 -
Rai/ Tori (2 kg) 122550 182289 -
Rajmah (8 kg) 50 - -
Rajmah (3 kg) - 500 -
Garma Season
Maize (2 kg) 500 20000
Urad (4 kg) 1000 7000 23000
Moong (4 kg) - 13275 37525
Sesamum (1 kg) 500 1000 1500
Safflower (2kg) 500 1000 -
73

Among the extension services that the state government is presently providing at a large scale is
the Minikit Demonstrations for important crops (Table 2.13). For kharif season, these crops
include — paddy, maize, arhar, urad, moong, castor and sesamum; for rabi season, the selected
crops are — wheat, maize, gram, masoor, peas, rai/ tori and rajmah; and finally, for garma season,
the selected crops are — maize, urad, moong, sesamum and safflower. There has been a steady
increase in the number of Minikit Demonstrations over the years. For example, in kharif season,
such demonstrations were only 27.3 thousand in 2006-07, but it has increased to 85.6 thousand in
2008-09. Similarly, for rabi season, such demonstrations were 17.7 thousand in 2006-07, which
has increased to 43.8 thousand next year (the data for rabi season of 2008-09 is yet to be
compiled). One can also discern a similar trend for garma crops.
2.6 Agricultural Credit
As modern and scientific methods of production take root in agriculture, cultivation comes to be
directly connected with market, both for its input and output. While production for market is not
yet the predominant characteristic of agriculture in Bihar, its dependence on the market for inputs
is quite large. This dependence on the market for inputs in an agriculture, where marginal and
small holdings together account for 96.50 percent of total number of holdings, and 67.36 percent
of total owned area, makes agricultural credit a critical input in agricultural production.
The relevant information on credit flow to the agricultural sector in Bihar is presented in Table
2.14. Since the figures for 2008-09 related to the first six months of the year, the low achievement
rates for 2008-09 is not surprising. For previous years, one may first note that the achievement rate
for disbursement of credit from all banks has shown a declining trend since 2003-04, except for a
single year in 2004-05. This is an extremely serious phenomenon, specially when one bears in
mind that the targets themselves are much lower than the actual requirement of the farmers.
Starting from an achievement rate of 82.01 percent in 2003-04, it stands 76.96 percent in 2007-08.
Among the three principal sources of credit, the commercial banks are most important, which
account for about 65 percent of the total credit disbursement; the shares of regional rural banks
and central cooperative banks are about 25 and 10 percent respectively. Since the commercial
banks are the most important source of credit, it is a matter of concern that the achievement rates
for these banks have also shown a declining trend. In 2007-08, the achievement rate for the three
74

types of banks were — 81.47 percent (commercial banks), 75.80 percent (regional rural banks)
and 57.42 percent (central commercial banks).
Table 2.14 : Credit Flow to Agricultural Sector in Bihar (2003-04 to 2008-09)
Bank Groups 2003-04 2004-05 2005-06 2006-07 2007-08 2008-09
Target 1220.15 1386.39 1645.57 2274.36 3003.58 4355.35
Achievement 792.44 1325.06 1489.33 1915.93 2447.04 1388.80 Commercial Bank
Percentage 64.95 95.58 90.51 84.24 81.47 31.89
Target 376.98 550.86 644.26 938.67 1256.34 1821.69
Achievement 204.87 431.30 450.09 797.07 952.36 552.13 RRBs
Percentage 54.35 78.30 69.86 84.91 75.80 30.31
Target 303.21 402.71 407.65 509.34 619.75 898.69
Achievement 561.11 273.75 234.61 272.04 355.85 97.02 CCB
Percentage 185.06 67.98 57.55 53.41 57.42 10.80
Target 1900.34 2339.96 2697.48 3722.37 4879.67 7075.73
Achievement 1558.42 2030.11 2174.03 2985.04 3755.25 2037.95 All Bank
Percentage 82.01 86.76 80.59 80.19 76.96 28.80
Note : Value of 2008-09 upto release September
Since the commercial banks and even regional rural banks are often reluctant to expand
agricultural credit, the cooperative banks are often regarded as an ideal source of credit for the
farmers. Unfortunately, as mentioned before, cooperative banks presently account for only 10
percent of the agricultural credit in Bihar. One of the main reason for such limited reach of
cooperative banks is that such banks are absent in no less than 16 districts of Bihar (Table 2.15).
Among the 22 districts where they exist, the achievement rate is often less than 40 percent. For six
districts, the achievement rates are less than 10 percent.
The scheme for Kisan Credit Card (KCC) is one of the most important efforts of the banking
sector for promoting agricultural credit. The scheme had started in 1999 and it allows for a
maximum credit of Rs. 50 thousand to farmers. As on September, 2008, there were 20.88 lakh
farmers in Bihar who were issued KCCs (Table 2.16). Compared to a target of 44.60 lakh farmers,
the achievement rate for KCC is only 46.81 percent. There is not much difference among the
achievement rates for three sources of credit — commercial banks (48.24 percent), regional
75

Table 2.15 : Distribution of Cooperative Credit in Bihar
Target (in Rs. Lakh) Distribution (in Rs. Lakh) Achievement (Percentage) District
2006-07 2007-08 2008-09 2006-07 2007-08 2008-09 2006-07 2007-08 2008-09
Patna 26.0 21.5 25.0 18.2 22.3 6.9 69.9 103.7 27.5
Nalanda 35.0 14.0 23.0 8.7 17.2 3.6 25.0 123.1 15.8
Bhojpur 36.0 21.5 32.5 7.7 13.8 3.4 21.5 64.3 10.6
Buxar - - - - - - - - -
Rohtas 36.0 11.0 26.0 6.0 9.3 2.7 16.5 85.0 10.2
Bhabhua 27.0 15.0 21.0 13.1 9.2 2.9 48.7 61.4 13.9
Gaya 25.0 11.0 17.0 3.3 4.2 0.7 13.2 37.8 4.1
Jahanabad - - - - - - - - -
Arwal - - - - - - - - -
Nawada 27.0 14.0 24.0 10.3 12.5 5.6 38.3 89.1 23.2
Aurangabad 26.0 19.0 25.5 17.5 11.3 8.6 67.4 59.5 33.6
Saran - - - - - - - - -
Siwan 18.0 13.0 19.0 12.4 11.5 3.0 68.6 88.2 15.9
Gopalganj 27.0 14.5 26.0 7.6 15.3 4.6 28.1 105.7 17.6
Muzaffarpur 26.0 11.0 30.0 6.7 13.2 2.8 25.8 120.0 9.3
E.Champaran 35.0 17.0 38.0 23.5 25.1 15.9 67.0 147.5 41.7
W.Champaran 31.0 15.0 31.0 7.4 11.6 7.5 24.0 77.6 24.2
Sitamarhi 32.0 13.0 28.0 5.4 12.1 0.3 17.0 92.9 1.1
Sheohar - - - - - - - - -
Vaishali 23.0 10.0 22.0 11.4 4.1 1.1 49.7 41.1 5.1
Darbhanga - - - - - - - - -
Madhubani 28.0 20.0 27.0 19.9 19.5 4.5 71.1 97.7 16.6
Samastipur 36.0 23.0 40.0 27.5 30.4 7.4 76.5 132.1 18.6
Begusarai 66.0 30.0 60.0 28.1 30.2 11.5 42.5 100.6 19.1
Munger 22.0 12.0 17.0 5.3 10.4 1.6 24.1 86.5 9.6
Sheikhpura - - - - - - - - -
Lakhisarai - - - - - - - - -
Jamui - - - - - - - - -
Khagaria 34.0 17.5 33.0 6.4 9.4 3.1 18.8 53.9 9.4
Bhagalpur - - - - - - - - -
Banka - - - - - - - - -
Saharsa - - - - - - - - -
Supaul - - - - - - - - -
Madhepura - - - - - - - - -
Purnea 57.0 35.0 55.0 46.7 44.8 10.3 82.0 127.9 18.7
Kishanganj 26.0 14.0 30.0 9.7 18.4 11.0 37.4 131.5 36.6
Araria - - - - - - - - -
Katihar - - - - - - - - -
76

Table 2.16 : Distribution of Kisan Credit Cards (KCC) in Bihar
(No. of cards)
Bank Groups 2000-01 2004-05 2005-06 2006-07 2007-08 2008-09 (Sept.08)
Total
Target 101501 174850 143866 250000 300000 861429 1831646
Achievement 65750 140793 131618 203935 222478 119050 883624 Commercial Banks
Percentage 64.78 80.52 91.49 81.57 74.16 13.82 48.24
Target 28617 150500 129719 190000 228000 478571 1205407
Achievement 13576 76891 66332 140071 168529 107045 572444 RRBs
Percentage 47.44 51.09 51.14 73.72 73.92 22.37 47.49
Target 180000 470350 293166 160000 160000 160000 1423516
Achievement 107094 245907 120653 55374 75533 27422 631983 CCB
Percentage 59.50 52.28 41.16 34.61 47.21 17.14 44.40
Target 310118 795700 566751 600000 688000 1500000 4460569
Achievement 186420 465744 318603 399380 466540 253517 2088051 Total
Percentage 60.11 58.53 56.22 66.56 67.81 16.90 46.81
Source : Dept. of institutional Finance, GoB.
rural banks (47.49 percent) and central cooperative banks (44.40 percent). If one compares the
achievement rates over the years, it is noticed that it was 60.11 percent in 2000-01 and then had
gradually decreased to 56.22 in 2005-06. However, in the next two years (2006-07 and 2007-08),
the banks have performed better to raise the achievement rate to 66.56 and 67.81 percent
respectively. In 2008-09, even when six months were over in September, the achievement rate is
only 16.90 percent. If the distribution of KCC in the next six months is not accelerated, one might
again see a low performance for the entire year of 2008-09.
Among the 38 districts, the achievement of the KCC scheme has been quite varied (Table 2.17).
Comparing the share of population and the share of KCCs for the different districts, it is observed
that there are 14 districts where the distribution of KCCs is relatively wider. These districts are —
Nalanda, Bhojpur, Rohtas, Bhabhua, Nawadah, Aurangabad, West Champaran, Darbhanga,
Begusarai, Munger, Khagaria, Bhagalpur, Purnea and Kishanganj. It is interesting to note that
there are a few districts (like Patna and Buxar) where the agricultural economy is relatively better
and yet the speed of KCC implementation is rather limited.
77

Table 2.17 : Districtwise Achievement of Kisan Credit Card (KCC)
District Upto 2003 2004 2005 2006 2007 2008 Total Percentage
of cards
Percentage of population
(2001)
Patna 52977 23113 20036 10801 26204 18048 151179 4.77 5.69
Nalanda 37361 20562 18229 13266 16297 16175 121890 3.85 2.86
Bhojpur 44944 32437 21830 4833 17683 15918 137645 4.34 2.70
Buxar 9042 2862 4279 4051 8824 6775 35833 1.13 1.69
Rohtas 37508 22363 7777 6674 15272 19590 109184 3.44 2.95
Bhabua 17184 5685 15015 5205 9624 12094 64807 2.04 1.55
Gaya 29817 22998 18865 8601 19716 16371 116368 3.67 4.18
Jehanabad 7086 1807 3818 2381 5681 5348 26121 0.82 1.82
Arwal 923 1275 2058 1052 2698 2932 10938 0.35 1.82
Nawada 36160 27525 11264 7668 11281 11217 105115 3.32 2.18
Aurangabad 23875 31358 17569 12707 9272 8638 103419 3.26 2.43
Saran 21812 4677 8845 9190 8881 14127 67532 2.13 3.91
Siwan 33983 18995 10809 7074 10551 14545 95957 3.03 3.27
Gopalganj 16867 19734 12938 5413 11205 13396 79553 2.51 2.59
Muzaffarpur 19520 14331 22390 7517 15170 20050 98978 3.12 4.51
Vaishali 23416 18707 15312 12409 15141 17144 102129 3.22 3.28
Sitamarhi 37243 29720 9027 6814 10883 24403 118090 3.73 3.23
Sheohar 508 173 425 1309 1538 2617 6570 0.21 0.62
E. Champaran 19812 19515 19279 14701 21053 26210 120570 3.80 4.75
W. Champaran 47373 26005 27614 31407 35212 32431 200042 6.31 3.67
Darbhanga 23831 1459 6751 3816 7783 8011 51651 1.63 3.97
Samastipur 50512 38406 20970 21759 14954 22783 169384 5.34 4.09
Begusarai 32333 24782 35001 21426 9352 14712 137606 4.34 2.83
Munger 17492 19611 10244 2869 3967 5608 59791 1.89 1.37
Lakhisarai 2439 1225 2447 2353 3422 4587 16473 0.52 0.97
Madhubani 33458 29187 25258 12656 9559 15598 125716 3.97 4.31
Sheikhpura 2047 880 1503 2216 2317 3532 12495 0.39 0.63
Jamui 3823 1828 3352 4113 3777 7382 24275 0.77 1.69
Khagaria 25820 18483 19707 9028 5528 9296 87862 2.77 1.54
Bhagalpur 70632 40851 9366 4726 9223 11477 146275 4.61 2.92
Banka 3433 896 3395 3138 4141 4282 19285 0.61 1.94
Saharsa 3696 1118 2906 2135 5513 7250 22618 0.71 1.82
Supaul 5350 1216 3424 2838 5593 6296 24717 0.78 2.09
Madhepura 17651 854 2844 2962 4679 6056 35046 1.11 1.84
Purnea 75725 39782 25036 11791 12350 13477 178161 5.62 3.07
Araria 4175 1988 6264 13238 9170 8558 43393 1.37 2.60
Kishanganj 3115 1287 4977 8952 5484 7393 31208 0.98 1.56
Katihar 27923 26457 23531 12329 9565 12213 112018 3.53 2.88
Total 920866 594152 474355 315418 398563 466540 3169894 100.00 100.00Source : Dept. of institutional Finance, GoB.
78

Table 2.18 : Extent of Crop Insurance in Bihar
2005-06 2006-07 2007-08
No of Farmers No of Farmers No of Farmers District
Covered Benefited Covered Benefited Covered Benefited Patna 27548 10395 43881 7754 53496 19461 Nalanda 31574 14908 48378 274 68109 11977 Bhojpur 6524 32 22820 34 20856 0 Buxar 4142 873 14787 2125 14123 0 Rohtas 6898 2348 18673 466 16798 2508 Bhabhua 9232 3204 19873 1125 22158 2741 Gaya 19890 16286 32867 0 38008 0 Jahanabad 3637 2570 7035 0 8025 0 Arwal 1590 658 3150 453 3025 0 Nawada 8624 5325 19178 0 15980 0 Aurangabad 23074 19631 22148 1636 18752 1178 Saran 40 0 683 0 4197 621 Siwan 5351 2626 12391 2370 14732 1686 Gopalgunj 2583 1785 18029 4216 24483 10198 Muzaffarpur 16258 9542 27101 1712 59955 50537 E.Champaran 33933 21281 56836 31713 119045 78666 W.Champaran 16570 5860 14697 6059 38814 35181 Sitamarhi 14743 9741 22022 1043 55741 8218 Sheohar 1878 637 5314 28 8068 0 Vaishali 12475 9292 21117 13595 21088 8844 Darbhanga 4215 886 6185 243 11632 4210 Madhubani 20118 11389 27610 12 40524 3448 Samastipur 34162 15491 47568 13207 69401 45247 Begusarai 26747 17980 52863 18842 52327 40061 Munger 1721 2 2757 289 2097 0 Sheikhpura 1484 670 2352 0 2580 0 Lakhisarai 1849 1115 2508 0 2427 80 Jamui 5691 4422 8044 1470 8985 2667 Khagaria 12476 0 13213 6322 26511 22000 Bhagalpur 5590 3878 8781 2958 8830 1977 Banka 3597 2547 12773 3598 4629 0 Saharsa 5512 3912 1024 0 2585 91 Supaul 73 36 1308 0 1310 0 Madhepura 468 0 1179 12 1526 1 Purnea 4550 3277 21900 8532 13756 4604 Kishanganj 4770 1865 6064 1049 7348 1291 Araria 16101 15752 23799 13326 20576 11511 Katihar 14258 8671 13527 1505 10511 5975
Total 409946 228887 684435 145968 913008 374979
79

Because of uncertain rains and menace of floods, the farmers in Bihar often face unexpected loss
of crops, decreasing not only their income, but sometimes pushing them towards high levels of
debt. In this background, the expansion of crop insurance is a very necessary step towards helping
agricultural growth in Bihar. But, unfortunately, by the end of 2007-08, there were only 9.13 lakh
farmers who were able to insure their crops (Table 2.18). By a broad calculation, this implies a
coverage of less than 10 percent of the farmers under crop insurance. However, it is heartening to
note that, over the years, the practice of crop insurance is increasing in the state. In 2005-06, there
were only 4.10 lakh farmers opting for crop insurance and, in two years, their number has
increased to 9.13 lakh farmers in 2007-08, implying a growth of 122.7 percent. Among the
districts where more than 50 thousand farmers avail crop insurance are included — Patna,
Nalanda, Muzaffarpur, East Champaran, Sitamarhi, Samastipur and Begusarai. The functioning of
the KCC scheme is particularly poor in Arwal, Saran, Munger, Sheikhpura, Lakhisarai, Banka,
Saharsa, Supaul and Madhepura.
2.7 Animal Husbandry
Total livestock population in the state, according to Census 2003, is 407.83 lakh. Of this, 39.8
percent are milch animals with population of cows being 104.7 lakhs, and that of buffaloes being
57.66 lakhs (Table 2.19). The state also has a substantive number of goats (96.06 lakhs), which are
known as the poor man’s cow. The strength of poultry in the state is quite large at 139.68 lakhs.
With such a huge livestock wealth, there is abundant growth potential of livestock products in the
state. Though livestock income forms an important component of rural income in Bihar, its
character is that of subsistence rather than of prosperity. The development of livestock wealth and
higher production from this sector can provide a very sound base of economic prosperity in the
villages of Bihar
As regards the districtwise endowment of livestock wealth (Table 2.19), it can be observed that
there is considerable variation among the districts with respect to their respective share in total
livestock wealth of the state. For bovine population (cows and buffaloes), the districts with
relatively larger livestock wealth are — Patna, Bhojpur, Rohtas, Gaya, Muzaffarpur, West
Champaran, Madhubani and Purnea. For goats and poultry animals, the north-eastern region of the
state is seen to be particularly suitable and their concentration in the districts of Purnea, Araria,
Kishanganj and Katihar very high.
80

Table 2.19 : Districtwise Livestock Wealth in Bihar (2003)
(Figures in 000')
District Cow Buffalo Pigs Lambs Goat Poultry Patna 315.1(3.0) 265.8(4.6) 51.0(8.1) 17.5(5.0) 196.6(2.0) 383.7(2.7) Nalanda 199.5(1.9) 219.3(3.8) 23.1(3.7) 6.2(1.8) 171.1(1.8) 395.6(2.8) Bhojpur 213.8(2.0) 228.6(4.0) 17.2(2.8) 43.6(12.6) 133.4(1.4) 238.3(1.7) Buxar 138.2(1.3) 161.8(2.8) 8.5(1.3) 20.0(5.8) 70.8(0.7) 126.6(0.9) Rohtas 254.7(2.4) 321.9(5.6) 12.5(2.0) 28.8(8.3) 195.1(2.0) 315.2(2.3) Kaimur 212.8(2.0) 191.1(3.3) 4.7(0.7) 29.6(8.5) 104.5(1.1) 216.3(1.5) Gaya 640.2(6.1) 278.1(4.8) 119.1(19.0) 18.0(5.2) 442.6(4.6) 886.1(6.3) Jehanabad 80.0(0.8) 105.7(1.8) 19.0(3.0) 4.5(1.3) 63.5(0.7) 124.1(0.9) Arwal 52.0(0.5) 38.5(0.7) 2.5(0.4) 4.6(1.3) 39.6(0.4) 58.4(0.4) Nawada 321.3(3.1) 121.6(2.1) 47.3(7.5) 6.0(1.7) 226.7(2.4) 315.2(2.3) Auranqabad 405.5(3.9) 175.2(3.0) 20.7(3.3) 47.6(13.7) 227.5(2.4) 365.0(2.6) Saran 243.8(2.3) 154.7(2.7) 10.7(1.7) 7.9(2.3) 196.5(2.0) 237.6(1.7) Siwan 249.9(2.4) 140.7(2.4) 12.3(2.0) 2.4(0.7) 210.7(2.2) 248.3(1.8) Gopalganj 188.6(1.8) 118.3(2.1) 7.6(1.2) 1.2(0.3) 216.3(2.3) 215.4(1.5) Muzaffarpur 411.4(3.9) 299.9(5.2) 12.3(2.0) 1.7(0.5) 451.0(4.7) 434.0(3.1) Vaishali 181.1(1.7) 145.0(2.5) 2.1(0.3) 4.5(1.3) 235.9(2.5) 411.4(2.9) Sitamarhi 216.9(2.1) 169.5(2.9) 12.6(2.0) 1.3(0.4) 307.3(3.2) 316.8(2.3) Sheohar 31.3(0.3) 25.9(0.4) 1.4(0.2) - 72.5(0.8) 75.4(0.5) E. Champaran 294.6(2.8) 223.7(3.9) 12.8(2.0) 2.8(0.8) 529.9(5.5) 518.8(3.7) W. Champaran 427.5(4.1) 222.3(3.9) 21.6(3.4) 4.5(1.3) 510.6(5.3) 762.4(5.5) Darbhanga 216.0(2.1) 170.3(3.0) 6.6(1.1) 0.7(0.2) 197.4(2.1) 417.8(3.0) Samastipur 362.0(3.5) 213.2(3.7) 2.9(0.5) 5.8(1.7) 284.2(3.0) 230.0(1.6) Begusarai 278.9(2.7) 101.6(1.8) 3.8(0.6) 1.3(0.4) 141.4(1.5) 187.2(1.3) Munger 143.3(1.4) 53.7(0.9) 6.4(1.0) 0.7(0.2) 140.1(1.5) 102.8(0.7) Lakhisarai 114.5(1.1) 53.2(0.9) 7.5(1.2) 0.1(0.0) 92.9(1.0) 57.7(0.4) Madhubani 451.8(4.3) 255.1(4.4) 12.0(1.9) 41.6(12.0) 321.2(3.3) 322.1(2.3) Sheikhpura 58.8(0.6) 46.4(0.8) 8.2(1.3) 0.7(0.2) 59.3(0.6) 86.2(0.6) Jamui 388.3(3.7) 67.2(1.2) 50.4(8.0) 16.5(4.8) 299.0(3.1) 266.4(1.9) Khagaria 174.5(1.7) 82.7(1.4) 4.4(0.7) 0.0(0.0) 191.9(2.0) 130.9(0.9) Bhagalpur 345.5(3.3) 132.3(2.3) 5.0(0.8) 0.7(0.2) 349.5(3.6) 425.6(3.0) Banka 472.9(4.5) 120.5(2.1) 18.6(3.0) 10.7(3.1) 368.3(3.8) 360.2(2.6) Saharsa 259.4(2.5) 126.5(2.2) 6.3(1.0) 0.3(0.1) 275.0(2.9) 180.5(1.3) Supaul 399.8(3.8) 149.8(2.6) 7.5(1.2) 5.5(1.6) 394.6(4.1) 275.7(2.0) Madhepura 248.3(2.4) 122.1(2.1) 9.2(1.5) 1.2(0.3) 285.7(3.0) 143.9(1.0) Purnea 413.4(3.9) 192.6(3.3) 26.7(4.3) 0.2(0.1) 433.9(4.5) 895.9(6.4) Araria 395.6(3.8) 155.8(2.7) 13.0(2.1) 0.6(0.20 441.1(4.6) 827.6(5.9) Kishanganj 267.5(2.6) 45.2(0.8) 4.3(0.7) 0.2(0.1) 282.9(2.9) 1051.5(7.5) Katihar 401.3(3.8) 69.9(1.2) 15.3(2.4) 6.7(1.9) 445.3(4.6) 1360.9(9.7)
Grand Total 10470.2 (100.0)
5765.7 (100.0)
627.0 (100.0)
346.3 (100.0)
9605.7 (100.0)
13967.8 (100.0)
Note : Figures in bracket show district share.
81

Table 2.20 : Districtwise Breakup of Achievement of Livestock Breading and Health in Bihar (2003)
(Free distribution of fodder seed in Quintal & other figures in lakh)
2006-07 2007-08
District Animals treated
Sterilisat-ion
Immunisa-tion
Free Distribu-tion of
fodder seed
Animals treated
Sterilisation
Immunisa-tion
Free Distribu-tion of
fodder seed
Patna 1.5 0.09 1.35 9.9 1.69 0.08 2.26 12.02 Nalanda 0.7 0.08 0.04 4.8 0.68 0.06 1.67 6.58 Bhojpur 1.22 0.15 0.04 9.9 1.16 0.11 1.8 10.52 Buxar - - - - - - - - Rohtas 1.32 0.16 9.9 1.59 0.18 2.56 9.72 Kaimur - - - - - - - - Gaya 1.24 0.1 0.09 2.55 1.13 0.1 3.74 5.91 Jehanabad 0.36 0.04 0.06 2.85 0.34 0.03 0.09 2.16 Arwal - - - - - - - - Nawada 0.71 0.08 0.22 4.5 0.75 0.08 1.52 5.91 Auranqabad 0.74 0.09 - 3.45 0.72 0.07 1.59 10.34 Saran 1.2 0.1 0 9.2 1.06 0.09 1.98 3.19 Siwan 0.95 0.07 - 5.45 0.88 0.05 0.84 3.19 Gopalganj 0.55 0.07 3.8 0.78 0.06 1.53 3.19 Muzaffarpur 1.12 0.06 0.18 9.72 2.16 0.03 2.96 3.82 Vaishali 0.7 0.05 0.42 2.67 1.12 0.04 2.31 3.8 Sitamarhi 0.57 0.02 - 2.67 1.06 0.02 1.87 3.8 Sheohar - - - - - - - - E. Champaran 0.6 0.07 - 2.67 0.87 0.05 2.55 3.8 W. Champaran 0.54 0.03 - 2.67 0.83 0.02 2.93 3.8 Darbhanga 0.75 0.02 0.2 8.94 1.18 0.02 2.76 3.18 Samastipur 0.83 0.04 0.1 8.19 1.38 0.02 2.87 6.48 Begusarai 0.89 0 0.11 9.69 0.78 0.04 0.93 3.16 Munger 1.83 0.2 0.02 10.85 1.61 0.1 3.33 7.41 Lakhisarai Madhubani 0.95 0.07 0.1 9.78 1.34 0.05 3.66 3.16 Sheikhpura - - - - - - - - Jamui - - - - - - - - Khagaria 0.49 0.04 0.3 3.8 0.62 0.03 2.1 7.41 Bhagalpur 1.22 0.11 10.85 1.07 0.09 2.48 7.41 Banka - - - - - - - - Saharsa 1.38 0.14 6.63 1.44 0.12 3.7 6.3 Supaul - - - - - - - - Madhepura 0.39 0.03 0.35 8.67 0.62 0.03 1.6 3.15 Purnea 0.76 0.1 0.1 3.6 0.67 0.07 1.68 2 Araria 0.43 0.03 0.31 3 0.48 0.03 1.91 1.34 Kishanganj 0.3 0.03 0.2 3.45 0.39 0.02 1.25 1.34 Katihar 0.66 0.06 0 3.3 0.69 0.05 1.48 2 Total 24.90 2.13 4.19 177.45 29.09 1.74 61.95 146.09
82

To strengthen the animal husbandry sector in Bihar, the concerned department of the state
government provides a number of useful services like breeding, sterilisation, immunization and
free distribution of fooder seeds (Table 2.20). If one compares the extent of these services in 2006-
07 and 2007-08, it is observed that breeding and immunisation services have increased, but the
services has been lower for other two components of sterilisation and free distribution of fooder
seeds. While a total of 24.96 lakh animals were treated in 2006-07, their number has gone up to
29.09 lakh in 2007-08. For sterilisation, the figures are — 2.21 lakh (2006-07) and 1.74 lakh
(2007-08). The improvement in immunisation services was extremely high — compared to 4.41
lakh animals in 2006-07, it was 61.95 lakh animals in 2007-08. Finally, there was a drop of about
18 percent in the free distribution of fooder seeds, from 177.45 quintals in 2006-07, it fell to
146.09 quintals in 2007-08.
2.8 Road Map for Agriculture
Given the substantial yield gaps in agriculture on one hand and low farmers' income and
widespread rural poverty on the other, and also taking into account the richness of natural
resources and high level of people's aspirations, a gradual approach for liberating the people of
Bihar from the trap of poverty will neither be economically sound, nor socially expedient. The
entire challenge calls for a concerted time-bound development effort that could substantially
change the technical base of Bihar's agricultural sector. In this background, the state government
has prepared a Road Map of Agriculture and Allied Sectors in Bihar which identifies a number of
development intervention during the period of 2008-12. The five major goals of the road map are :
(i) To ensure increase in income of farmers to viable levels, especially considering the small
size of holdings.
(ii) To ensure food security through increase in productivity, combined with profitability.
(iii) To foster nutritional security through raising levels of productivity as well as raising living
standards of rural people.
(iv) To revitalise farming in order to create gainful employment and check migration.
(v) To ensure agricultural growth with justice, with programmes focusing on gender and human
aspects.
83

In order to achieve the above objectives, the Road Map has identified a number of programmes
that together cover all aspect of agriculture and its allied sectors. In all, there are seven dimensions
along which the Road Map presents its agenda and a brief description of them is presented below.
Agriculture
The programmes for agricultural sector fall into four major groups — (a) input, access, supply and
quality, (b) transfer of technology and extension, (c) income generation schemes and (d)
marketing. The specific programmes for agricultural development have been divided into the
following 12 heads :
(i) Seed Plan : Achievement of ideal Seed Replacement Rate (SRR) for major crops through
strengthening of seed infrastructure in the state — Bihar Rajya Beej Nigam (BRBN), Bihar
State Seed Certification Agency (BSSCA), Seed Multiplication Farms (SMF) and, finally,
fully Mechanised Agricultural Farm (MAF).
(ii) Horticulture : Provision of quality planting materials and establishment of a Tissue Culture
Laboratory.
(iii) Soil Health Management : Improvement of soil health through use of balanced nutrients
(N P and K), promotion of bio-fertilisers, and use of gypsum/ pyrites in 24 districts where
the soil has alkaline reaction.
(iv) Crop Protection : Prevention of crop losses by promoting Integrated Pest Management,
operationalisation of Plant Protection Centres and Bio-Control Laboratory.
(v) Farm Mechanisation : Promotion of mechanised farming through provision of financial
subsidy for modern agricultural implements.
(vi) Transfer of Technology : Undertaking measures like Farmer's Field School, Field
Demonstration, Farmers' Training and Exposure Visits, Awards to Progressive Farmers and
Training of Officers at the Rajendra Agricultural University.
84

(vii) Agricultural Extension : Rejuvenation of the Department of Agriculture through appointment
of officials at district, block and panchayat level for extension work.
(viii) Integrated Farming Model : Promotion of integrated farming based on the model of the
Indian Council of Agricultural Research (ICAR) through financial support to farmers.
(ix) Soil and Water Conservation : Promotion of soil and water conservation through
construction of Water Harvesting Structures, Silt Detention Dams, Earthen Check Dam and
also promotion of dryland horticulture and agro-forestry.
(x) Mini Weather Stations : Establishment of Mini Weather Stations which could supply useful
weather-related information to the farmers.
(xi) Micro-Irrigation Project : Promotion of micro-irrigation through drip and sprinklering
methods to about 2 lakh hectares of agricultural land, spread over all the 38 districts.
(xii) Agricultural Marketing : Establishment of a wide agricultural marketing infrastructure
having three levels. At the top will be Model Terminal Markets (MTM), followed by Agri-
Business Centres (ABC) and Rural Hats (RH). There will be 5 MTMs (at Patna,
Muzaffarpur, Purnea, Bhagalpur and Gaya), 40 ABCs and 1500 RHs.
Animal Husbandry
The schemewise programmes for the development of animal husbandry sector includes — (i)
Doorstep Veterinary Service, (ii) Door-to-Door Vaccination and Drenching (iii) Strengthening of
Animal Husbandry offices, (iv) Extension services for animal husbandry, (v) Goat Breeding and
Rearing Farm, (vi) Disposal of Carcass, (vii) Buffalo development, and (viii) Development of
Rural Poultry.
Dairy Development
With a share of about 5.6 percent of the total livestock population of the country, the dairy sector
is very important in the state's economy. However, its potential is not fully utilised for several
constraints. The Road Map visualises the removal of these constrains throng several measures like
85

animal input programmes (breeding facility, animal health care and animal nutrition), building of
specialised infrastructure (dairy plants, chilling centres and bulk coolers) and arrangements for
efficient marketing.
Fisheries Development
Aquaculture and culture-based fisheries are valuable options for enhancing rural income. Overall,
the proposed road map envisages development of fisheries sector through (a) construction of water
bodies like ponds and tanks, (b) intensive and semi-intensive fish culture in ponds, and (c)
construction of inlet and outlet for easier passage in mauns (oxbow lakes) for culture-based
fisheries,. The specific programmes for the sector includes arrangement of fingerlings as seed,
development of fisheries in water-logged areas, feed production, marketing infrastructure, training
and extension services, and establishment of Fisheries Research Centre.
Cooperative Sector
The cooperative sector will continue to play a major role in the development of agriculture and
allied sector in the state. In the recent years, the cooperative sector has been weakened due to their
poor financial conditions. The Road Map plans to reverse this trend so that it could help the
agricultural development. In particular, the Road Map visualises a critical role for the cooperative
sector in five distinct areas — short term agricultural credit, supply of agricultural inputs, crop
insurance, storage and marketing and, finally, agricultural extension services.
Institutional Finances
Institutional finance is expected to play a major role in promoting agricultural development.
However, an analysis of Annual Credit Plans in Bihar reveals that the credit disbursement in only
about 80 percent of the target, even when the absorption capacity is much higher than the target.
The Road Map has estimated the total credit requirement for different components like short term
credit for production and marketing, credit for investment, credit for non-farm activities, micro-
credit and other priority and non-priority sector credit.
Financing the Road Map
The total financial requirement for all the programmes under the Road Map is Rs. 6135.37 crore,
spread over five years. The details of this amount for different sectors and years are presented in
Table 2.21.
86

87
Table 2.21 : Financial Requirement for Road Map of Agriculture and Allied Sector in Bihar
(Rs. crore)
Sector
Year Agriculture
Animal Husbandry
Dairy Fisheries Cooperative Total
2008-09 922.13 180.99 115.97 122.34 60.75 1402.18
2009-10 916.70 196.02 116.07 157.31 118.10 1504.2
2010-11 977.02 213.45 114.38 199.41 92.92 1597.18
2011-12 941.27 228.65 125.34 197.63 139.48 1632.37
Total 3757.12 819.13 471.78 676.69 411.25 6135.97

CHAPTER III
INDUSTRY AND ALLIED SECTORS
Industrial growth in Bihar has been stunted greatly by severe infrastructural constraints. This is
coupled with non-delivery of services expected of both national and state governments as well as
para-statal agencies. While the overall industrial sector in the country saw a surge in output and
productivity during the economic reform period since 1991-92, Bihar was not benefited precisely
on account of its weak infrastructure and dysfunctional support institutions. Even before
bifurcation, the state lagged much behind other states in respect of industrialisation. After division,
however, the situation became worse, since most of the large and medium industries and their
ancillaries fell in the newly created Jharkhand state. The Net State Domestic Product (NSDP) at
current prices for the present Bihar in 2007-08 was Rs. 94,489 crore, of which manufacturing
sector accounted for only Rs. 4,664 crore (5.16 percent).
3.1 Structure of Industries
The vivisection of the state brought about major changes in the overall structure of industries in
the present Bihar. There are practically no mineral based industries left in Bihar and the agro-
based industries including textiles, leather, wood and paper accounted for nearly 43 percent of the
gross value added. The share of gross value added of petroleum and atomic fuel, was around 48
percent (Appendix I). That the performance level of agro-based industries in the state is not
satisfactory is clear from the fact that such industries in Bihar constituted a very nominal share of
only 0.48 percent in the total production of agro-based industries at the all-India level. In absolute
terms, Bihar's production value in 2004-05 was only Rs. 1,922 crore, as against India's Rs.
4,03,572 crore (Table 3.1)
Table 3.1 : Size of Selected Agro-Based Industries in Bihar and India (2004-05) Production Value (Rs. 000 Crore)
NIC Code
Industrial Group All India Bihar
Bihar's share (%)
15 Food/ Beverages 204255 1209 0.59
16 Tobacco Products 12336 332 2.69
17-18 Textile/ Textile Products 134831 62 0.05
19 Leather/ Leather Products 12324 69 0.56
20 Wood/ Wood Products 4187 20 0.48
21-22 Paper/ Printing/ Publication 35639 230 0.65
Total 403572 1922 0.48
Source : Annual Survey of Industries, 2004-05
88

2042
5512
09
1233
633
2
1348
31
62 1232
4
69 4187
20
3563
9
230
0
50000
100000
150000
200000
250000
Food
/Beverages
Tob
acco Prod
ucts
Textile/T
extile Prod
ucts
Leath
er/Leath
er Prod
ucts
Wood
/Wood
Prod
ucts
Pap
er/Prin
ting/P
ub
lication
Size of Agro-based Industries in Bihar and India (2004-05)
All-India
Bihar
3.2 Large and Medium Industries
As discussed above, as a result of bifurcation of the state, most of the large and medium industries
fell into the area of Jharkhand. Bihar is now left with a few large industries along with some
medium units. These units are also concentrated only in a few divisions of the state and in a few
industrial groups only. As may be seen from Table 3.2, of the total of 263 large and medium
industrial units, the highest concentration (38 percent) is in Patna division with Tirhut division
ranking a distant second (22.5 percent). Magadh and Darbhanga divisions have only 9.5 percent
and 7.3 percent respectively as their share. The Kosi division, however, does not report any large
or medium industries. An examination of districtwise spread of large and medium industrial units
reveals that out of 38 districts in the state, as many as 10 districts do not have any large/ medium
industrial unit and in another 11 districts, there are only less than 5 units in each. Again, the agro-
based industries including food, beverages and tobacco as also cotton, jute, leather, etc. accounted
for around 60 percent of the large and medium industries. This leaves a large scope for
development of agro-based industries in the state. With the development of proper and adequate
infrastructure, all the regions including Kosi can have fairly good number of agro-based industries.
After declaration of the new liberalised Industrial Policy of 2006 by the state government, a
number of proposals for setting up large and medium industries have been received and they are
likely to materialise in near future.
89

Table 3.2 : Large and Medium Industry Units in Bihar (2008-09)
Division Food,
Beverage, Tabacco
Cotton, wool, Jute,
paper, Leather
Rubber, Plastic,
chemicals
Material, metal,
machine, Transport, equipments
Total % share
Patna 22 18 7 53 100 38.0 Magadh 6 1 9 9 25 9.5 Bhagalpur 2 3 2 3 10 3.8 Munger 2 3 12 1 18 6.8 Saran 12 1 0 1 14 5.3 Tirhut 24 6 13 16 59 22.5 Darbhanga 9 9 1 - 19 7.3 Kosi - - - - - 0.0 Purnea 8 6 1 3 18 6.8 Bihar 85 (32.3) 47 (17.9) 45 (17.1) 86 (32.7) 263
(100.0) 100
Source : Department of Industry, GOB
3.3 Small Scale Industries
The industrial sector of present Bihar is characterised not only by the small size units, but also by
the predominance of unregistered units which account for one-third of the total units. The small
industries sector is dominated by tiny and artisan-based units. Although not highly productive, the
small scale, tiny and artisan-based industries play a crucial role in providing employment
opportunities outside agriculture. As on December, 2008, there were 1,74,278 permanent
registered units in Bihar, which consisted of 1502 small scale units, 1,02,676 tiny units and 70,100
artisan-based units. The total investment in these units was to the tune of Rs. 1,017.62 crore and it
provided employment to 5.68 lakh workers (Table 3.3).
Table 3.3 : Permanent Registered SSI Units in Bihar
Year SSI Tiny/ micro
Artisan Total Investment (Rs. lakh)
Employment (in No.)
Upto 31-03-2000 1261 72767 44413 118441 44701.38 433808
2000-01 35 3249 2530 5814 3805.15 14015
2001-02 31 3206 3314 6551 4192.04 15283
2002-03 24 3290 2983 6297 4638.07 13622
2003-04 21 3462 2616 6099 5430.39 14346
2004-05 17 3335 2897 6249 5371.79 13346
2005-06 24 3584 3333 6941 4697.31 15732
2006-07 20 3472 3612 7104 7279.79 16738
2007-08 46 2754 4402 7202 13482.98 19963
2008-09 (Upto to Dec. 08) 23 3557 - 3580 8163.14 10739
Total 1502 102676 70100 174278 101762.04 567592
Source : Department of Industry, Government of Bihar
90

An analysis of the divisionwise dispersal of small, tiny and artisan-based industries reveals that
their pattern of concentration remained similar to large/ medium units. The highest concentration
of small, tiny and artisan based units was in Tirhut division (20 percent), followed by Patna (17.4
percent). Magadh and Purnea reported around 10 percent share each with Bhagalpur (4.9 percent)
and Kosi (5.8 percent) reporting the least share.
Table 3.4 : Percentage of Small, Tiny and Artisan-based Industries in Bihar
(As on October, 2008)
Percentages
Divisions Small Tiny
Artisan-based
Total
Percentage share of
Population
Patna 43.4 26.4 22.8 25.1 17.4
Magadh 5.8 14.1 13.9 14.0 10.6
Bhagalpur 4.5 4.3 3.5 3.9 4.9
Munger 10.3 7.9 8.3 8.1 9.0
Saran 7.8 9.9 4.8 7.8 9.8
Tirhut 10.2 17.4 18.3 17.7 20.0
Darbhanga 3.1 9.4 15.1 11.8 12.4
Koshi 1.9 3.7 5.6 4.5 5.8
Purnea 13.2 7.0 7.8 7.4 10.1
Bihar 100.0 100.0 100.0 100.0 100.0
Source : Department of Industry, GOB
3.4 Agro-based Industries
Based on the industrial units covered by Annual Survey of Industries (ASI), the agro-based
industries in Bihar accounted for nearly half of the gross value added. If the remaining smaller
units are also taken into account, the share of agro-based industries will be still higher. However,
the potential of agro-based industries is not fully utilised. The development of agro-based
industries is largely dependent on the importance assigned to fruits and vegetables vis-à-vis other
crops. In 2006-07, the area under fruits and vegetables was 2.79 lakh hectares and 8.24 lakh
hectares respectively, with their total production being 34.26 lakh tonne and 136.08 lakh tonne
respectively.
91

Tabke 3.5 : Area and Production of Vegetables and Fruits in Bihar (2006-07)
Vegetables Area
(hect.) Production
(tonne) Fruits
Area (hect.)
Production (tonne)
Cauliflower 60135 1008975 Mango 140786 1306944
Cabbage 37003 623463 Guava 27994 247960
Onion 50472 962705 Lichi 28758 211905
Tomato 46461 916769 Lemon 17122 121601
Potato 322840 5741290 Banana 29013 1125099
Brinjal 54072 1120579 Pineapple 4454 121057
Other 253174 3234683 Others 31284 291919
Total 824157 13608464 Total 279411 3426485
Source : Department of Agriculture, GOB
The increase in the area and production of vegetables and fruits has not been satisfactory in
recent years. In order to increase the volume of agro-based industries, it would be worthwhile to
push both area and production much ahead of the present level so as to add to both income and
employment to a large number of farmers. In honey, the state's average yield is 60 kgs per box,
which is three times more than the national average of 20 kgs. Over one lakh families are directly
engaged in the honey sector.
Along with the fruits and vegetables, milk and eggs are very important for employment
generation. The efforts are also continuing to expand horticulture in Bihar through the National
Horticulture Mission, launched by the central government in half of its districts. The Chief
Minister's Horticulture Mission has been launched in the remaining 19 districts which were not
covered under the National Horticulture Mission.
Food Processing : The food processing industry has a great potential in the state. If developed
properly, it may generate additional employment to atleast 5 lakh persons. Besides processing of
cereals, great potential remains to be tapped in fruits and vegetables. The processing of mango,
litchi, banana, etc. will also take care of seasonal gluts, storage and retention of their nutritive
value, apart from providing income and employment. Makhana is another leading crop that may
help to enhance the income and employment of rural people. Makhana cultivation is spread over
an area of 16.90 thousand hectares in about 10 districts in the north and north-eastern part of the
state. Already a Makhana Processing Plant is successfully functioning at Patna. In view of huge
92

potential for development of food processing industry in Bihar, the Industries Department has
planned a Rs. 1760 crore project for development of food processing infrastructure and other
facilities in the state. Under the project, Rs. 500 crore would be spent on 100 rural commercial and
primary processing centres. Another Rs. 250 crore is earmarked for creation of two integrated food
zones. For fish industry, there is a provision of Rs. 200 crore. In order to help the food processing
units, a food park is being established at Hajipur by the central government with state's
contribution in the form of land. For the entire Eleventh Plan period, the plan outlay for the
purpose is Rs. 4.00 crore.
As a step towards promoting agro-industries, Kishanganj area has been identified as an ideal zone
for tea plantation. The state government welcomes private investment for comprehensive
development of tea industry. Capital subsidy is available for setting up tea processing units in the
area. Further, the potential for development of farming and processing of medicinal, herbal and
aromatic plants in the state is abundant because of its natural environment. The active participation
of private sector and non-governmental organisations is encouraged and incentives are provided
under the new industrial policy.
Dairy : The dairy industry in the cooperative sector under the brand name 'Sudha' is very
successful in Bihar. The COMPFED markets milk and milk products and provides opportunities
for significant rural employment and income, particularly for women. There is a growing
consensus that the dairy sector has enough potential because of its symbiotic relationship with
agriculture. Though Bihar is a milk deficit state producing 54.50 lakh tonnes of milk in 2006-07,
efforts in right direction can yield better results here, remembering the successful performance of
COMFED. The rearing of high milk yielding variety of cows and buffaloes will go a long way in
enhancing the employment and income in the farm sector.
Leather and Leather Products : According to Annual Survey of Industries (ASI), 2004-05, leather
and leather products in Bihar has a small share (0.56 percent) in its total production of Rs. 1922
thousand crore from the agro-based industries. However, considering the magnitude and quality of
livestock wealth, there appears to be a good potential for industries relating to leather and leather
products in the state.
93

Table 3.6 : Livestock Population in Bihar (2003)
Item No.
Cows 10470230
Buffaloes 5765670
Goat 9605722
Sheep 346325
Pigs 626999
Horses & Ponies 115049
Other livestock 26874
Annual Availability of Hides Skins (in thousand no.) (2005-06)
17292
Annual availability of bones (in MT) (2005-06)
22025
Source : Department of Animal Husbandry, GOB
Sugar : Sugar has a significant position in the agro-based industry of the state. It generates
employment in the farm sector, directly as well as through ancillaries and related activities. An
estimated 5 lakh farmers are engaged in the cultivation of sugarcane and another half a lakh skilled
and unskilled persons in sugar industries. In 2006-07, the area under sugarcane in the state was
117.18 thousand hectares and the production was 5338.84 thousand tonnes (Appendix II).
Based on this, the productivity per hectare works out to around 46 tonne per hectare which is
much below the national average of 70 tonne. Again, Bihar has the lowest sugar recovery rate at 9
percent in the country, compared to the national average of 10.36 percent. Several sugar mills
under the state-run Bihar Sugar Corporation had to be closed, as they did not modernise their
plants and equipments, nor did they reorient their personnel through training in modern
techniques. Those mills which are functional, have far lower capacity rendering them non-viable.
Another problem is non-availability of high quality sugarcane for crushing. As a result, the
crushing duration of the mills is only 122 days in a year.
In view of favourable agro-climatic conditions for growing sugarcane in the state, there exists vast
potential to increase the farm as well as the non-farm incomes. The objectives during the Eleventh
Plan are to enhance the sugarcane production by augmenting the area under cultivation as also its
productivity. The long term goal is to gradually increase its area to 4.6 lakh hectares. The
Sugarcane Research Institute, Pusa and the Rajendra Agriculture University are engaged in
research in developing appropriate varieties for different agro-climatic conditions in the state and
also to improve the quality of its yield. The state government has also announced incentives like
94

rebates for co-generation of power and manufacture of ethanol from molasses and waivers on
administrative charges on molasses consumption by distilleries. The state government has already
come out with a Sugarcane Policy to help the sugar mills. Some reputed companies have been
given the responsibility of operation of 11 closed sugar mills in the state. The new Policy for
Sugar Industry also grants the following incentive :
(i) To reimburse central excise duty on sugar for 5 years.
(ii) To exempt purchase tax on sugarcane for five crushing years.
(iii) To exempt stamp and registration fees for land transfer.
(iv) To grant 10 percent subsidy on capital investment or a maximum of Rs. 10 crore, whichever
is less, on machinery, after completion of first year of commercial production.
Jute : Jute is produced chiefly in the districts of Kishanganj, Purnea, Katihar and Araria. Nearly
all jute mills in Bihar are closed and the jute producers in the state face acute problems in
marketing their products. The factors for development of area under jute are establishment of jute
park, modernization of looms, modern jute service centre, processing and dying centre, nodal
centre for product and design development, and jute raw material bank. In order to provide
infrastructure and technical assistance to jute producers, there is a proposal to establish a Jute
Park, for which a diagnostic survey and pre-feasibility study report has been prepared by IL&FS,
New Delhi. Theoretically, the cabinet has agreed to the business plan prepared by the agency. An
outlay of Rs. 100 lakh has been planned for the development of jute production during the
Eleventh Plan period.
3.5 Non-Agro-Based Industries
Handloom : The handloom industry assumes great significance in the context of Bihar, because of
a large number of weavers in the state. They are primarily concentrated in the districts of Patna,
Gaya, Bhagalpur, Banka, Darbhanga, Arwal, Jehanabad, Aurangabad, Nawada, Nalanda, Bhabua,
Khagaria, Madhubani and Siwan. There are around 1071 weavers' cooperative societies in the
state, with 10,817 handlooms. Besides, 23,503 handlooms are outside the cooperative sector.
Around 1.33 lakh weavers are engaged in this sector, of which nearly a lakh are outside the
cooperative sector. The state government has introduced welfare schemes for weavers in the form
of marketing assistance, modernisation of training centres and repair of shed-cum-housing. Under
95

the debt waiver scheme, the state government has approved waiving of loans worth Rs. 12.24
crore.
Table 3.7 : Status of Debt Waiver Scheme for Weavers
Approved Sent to District Magistrate for
Name of Bank Amount (Rs. lakh)
No. of Accounts Payment to bank
Amount in Rs. lakh No. of
Account
State Bank of India 108.11 4086 139.48 3331
Central Bank of India 93.84 4330 143.03 3279
United Bank of India 2.38 128 18.00 261
Koshi Regional Rural Bank 1.30 31 32.27 779
Central Bihar Regional Rural Bank 351.88 3093 224.80 3087
Central Cooperative Bank 264.41 528 206.96 7054
Punjab National Bank 181.89 595 17.86 248
UCO Bank 198.15 2056 175.04 1748
Union Bank of India 22.28 457 24.89 461
Indian Bank — — 0.65 07
Total 1224.24 15304 982.98 20255
If proper training, designing and marketing facilities are extended, this sector, including the
powerloom sector, has great potential of providing employment and enhanced income to an
appreciable number of families.
During the Eleventh Five Year Plan, the Central Design Centre at Rajendra Nagar, Patna has been
revived to provide the theoretical and practical training to the weavers for preparation of
sophisticated and designed clothes. Two training sessions of 6 months each are conducted at the
Centre, and 18 trainees are imparted training in each session. The trainees are paid a stipend of Rs.
300 per month. Besides, for door to door marketing of the handloom products in rural and urban
areas, there is a scheme of providing bicycles to the weavers. Under the 20 Points Programme, the
weavers in both cooperative and non-cooperative sector are provided Rs. 1500 each as 100 percent
subsidy for purchasing equipments and furnishing the looms. Under modernisation scheme, during
2007-08, there has been a provision of Rs. 47 lakh for 470 weavers of 94 societies in 10 districts
of Patna, Gaya, Nalanda, Aurangabad, Rohtas, Siwan, Gopalganj, East Champaran, Madhubani
and Banka.
96

Textile : For development of textile and handoom sectors, the state government has planned to
establish a Textile Park with public-private partnership. Of the total cost of this plan, 40 percent or
a maximum of Rs. 40 crore will be invested by the central government as share money and 9
percent by the state government as subsidy and share money. Again, a Handloom Park at
Bhagalpur is also being planned wherein all the necessary basic infrastructure and other facilities
like raw material bank, pre- and post-processing facilities, artisan village, R& D Centre, testing
laboratory, information and training centre, etc. will be made available for the weavers. A detailed
project report, prepared by IL&FS, for Rs. 34.03 crore has been submitted and the state
government has already transferred 25 acres of land as part of its contribution.
Handloom Cluster Scheme : For the integrated development of weavers in seven districts of
Bhagalpur, Patna, Gaya, Darbhanga, Madhubani, Siwan and Nalanda, a diagnostic study and
business plan has been prepared by IL&FS, New Delhi. It recommended the project cost of Rs.
68.65 crore, of which a sum of Rs. 24.00 crore is to be borne by the state government and the
remaining by the beneficiaries. Under this scheme, the looms of the weavers within the cluster will
be modernized and a handloom park with all its amenities and facilities will be established.
Powerloom : There are around 11.36 thousand powerlooms in the state. One powerloom service
centre has been established in the state by the Union Ministry of Textiles. Under the scheme, 120
trainees are imparted training for two months each in one year with a stipend of Rs. 300 each.
There is also a scheme under the Industrial Policy, 2006 to provide generators at 50 percent
subsidy to weavers in the powerloom sector.
Sericulture : The tussar and silk units are located mainly in and around Bhagalpur. The silk
weaving and printing works are carried out here. There is a plan for physical infrastructure
development during the Eleventh Plan, under which 5 pilot project centres and one marketing
centre for tussar will be developed. In order to increase production, this will provide tussar silk
cocoons to the persons engaged in this industry and also help in its marketing. With training
facilities for the technical personnel through the Central Silk Board, there is also a provision of
rewarding the best three cocoon rearers and silk producers, besides consolation prizes. There is
also a scheme for providing cycles to the cocoon rearers and silk producers. The physical target
for production of raw silk during the Eleventh Plan has been fixed at 162.5 tonne (Table 3.8).
97

Table 3.8 : Proposed Physical Target during the Eleventh Five Year Plan
Type of Silk Production
(MT)
Mulberry 62.50
Tussar 80.00
Castor 20.00
Total 162.50
Earlier, a four-year graduation course was being conducted at Bihar Silk and Textile Institute,
Nathnager in Bhagalpur district. However, this was suspended in the absence of basic
infrastructure like building, equipments, laboratory and library, as per the standard of All India
Council of Technical Education. (AICTE). From 2005-06, a vocational course in silk technology
has again started. There is a proposal to develop infrastructure of the Institute as per the standard
prescribed by AICTE. There is also a proposal to develop research cum training along with
courses on fashion designing at the Institute.
Mineral Based Industries : Consequent upon bifurcation, Bihar is left with only limited number
of mineral based industries. Now the state is left with only one percent of the total minerals
deposits in the country which include limestone, pyrite, magnesite, mica, china clay and saltpeter.
Bihar is the sole producer of pyrite in India. The limestone deposits are located in Rohtas. The
pyrite deposit is located at Amjhor in Rohtas district. In Bihar, soapstone is produced at
Shankarpur in Jamui District. The quartz deposits are located in Jamui and Gaya districts. Among
the minor minerals, sand, brick, stone quartzite, slate, moram, and granite, are found in Bihar. The
reserves of important minerals in the state during the year 2005-06 are presented in Table 3.9:
Table 3.9 : Reserve of Important Minerals in Bihar (2005-06)
Name of Minerals Reserve in million tonne Limestone 210.85 Pyrite 53.41 Quartz/ Silica sand 9.738 Felspar 4.84 Quartzite 203.30 Bauxite 2.11 Magnetite 2.66 Chinaclay 1.2 Ornamental Granite 35.9 (m.cu.m.) Slate Phylite 4.07 (m.cu.m.) Steatite/ Talc/ Soapstone 0.08 Haemalite 0.033 Fire clay 0.03 Gold ore 128.88 (Gold content
0.167 gm. per tonne)
98

3.6 Industrial Sickness
The industrial sector in Bihar is handicapped not only by its small size, it also suffers from the
more severe problem of a large number of its industrial units falling sick compared to other states.
Such sick industries include large, medium as well as small units. The rehabilitation of sick/
closed units is not satisfactory. The shortage of working capital, non-availability or inadequacy of
raw material, inadequate connectivity, irregular power supply, inadequate research and
development (R & D) facilities, delayed and inadequate bank loans are some of the important
factors rendering the units sick.
3.7 Support Institutions
The state government, on the pattern of the central government, has taken up the responsibility of
promotion of industries through establishing various support institutions. Bihar has had as many as
12 such institutions. Out of these, 2 were meant for providing the financial support to industries,
viz., Bihar State Financial Corporation (BSFC) and Bihar State Credit and Investment Corporation
(BISCICO). These two financial institutions had practically stopped lending operations, primarily
on account of extremely poor recovery of loans. The state government has now taken up the
revival of these two institutions and the process is on to clear most of its liabilities. IDBI and
SIDBI have already waived the interest upto the 2003-04 which amounted to Rs. 271.74 crore.
The BSFC has repaid the loans obtained from SIDBI, and steps have been taken to repay the loan
to IDBI as well. BISCICO had financed 273 units, out of which 114 have settled the loan. It has
also introduced an one-time-settlement (OTS) scheme and, during 2002-06, as many as 74 units
have opted for this scheme. It has already paid most of the loans to IDBI and SIDBI and the
process is on to repay the remaining loan amount. After settling all the liabilities, the seed money
will be provided to new units to initiate their operations. Again, for revival of Bihar State
Industrial Development Corporation (BSIDC), a study has already been completed in March, 2007
and the process of its revival has been initiated. In accordance with the recommendation of the
study, BSIDC took a decision to lease out the three viable public sector units on 'as is where is
basis' by inviting tenders. These units are — High Tension Insulator Factory, Namkum (Ranchi),
Electrical Equipment Factory, Tatisilwai (Ranchi) and Bihar Paper Mills (Saharsa).
99

3.8 Udyog Mitra
Udyog Mitra is an institution established in the state which helps the entrepreneurs to establish
industrial units, guides in preparation of project profiles, provides assistance in sorting out the
problems faced and makes available the desired data. It organises seminars and discussions for the
entrepreneurs and also publishes books and bulletins relevant for them. It provides computer
training to the employees of the industries department from time to time. Besides, it takes part in
India International Trade Fair at Delhi as also in the state level industrial fairs. The physical and
financial achievements of Udyog Mitra during the period 2004-08 are given in Table 3.10.
Table 3.10 : Physical and Financial Achievement of Udyog Mitra (2004-05 to 2007-08)
Year
Amount Allotted (Rs. in lakh)
Amount spent
(Rs. in lakh)
No. of Entrepreneurs
benefited
2004-05 11.00 11.00 443
2005-06 25.00 25.00 957
2006-07 50.00 50.00 717
2007-08 (Dec. 07)
30.00 27.66 512
The reorganisation of Udyog Mitra is on the anvil through obtaining the services of professional
experts on contract basis. A committee has been formed to remove the obstacles that the new units
face after the approval of the State Investment Promotion Board (SIPB). The committee will, from
time to time, assess various stages of works and pursue with different departments to remove the
problems. The total outlay for the entire Eleventh Plan period for Udyog Mitra is Rs. 2.50 crore.
3.9 Bihar Industrial Ares Development Authority (BIADA)
The Bihar Industrial Area Development Authority (BIADA) is a statutory body constituted under
the Bihar Industrial Area Development Authority Act, 1974 with the main objective of promoting
and assisting the rapid development of industries in the industrial areas and estates under its
jurisdiction. BIADA is responsible for providing developed infrastructure in industrial estates like
water, roads, drainage, electricity, etc. It also provides information and assistance to prospective
entrepreneurs to set up industry. The activity details are :
100

No. of Industrial Areas 46
Acquired land 4370.85 Acres
Export Promotion Industrial Park 94.43 Acres land at Hajipur with developed infrastructure
Software Technology Park Biscomaun Bhawan, Patna
Agri-Export Zone Patna
Growth Centres With Modern Facilities / Infrastructure at Kahalagaon, Begusarai, Aurangabad, Gidha, Maranga (Purnia), Khagaria
At present, BIADA has plans for extending its activities and the projects include :
(i) Strengthening and upgradation of Fatuha Industrial Area under Integrated Infrastructure
Upgradation Scheme (IIUS)
(ii) Establishment of Food Park in 100 acres at Begusarai and 100 acres at Hazipur.
(iii) Establishment of Mega Industrial Park in 1000 acres at Bihta and 1000 acres at Hazipur.
(iv) To implement District Rural Industries Project through NABARD in Gaya, Muzaffarpur,
Vaishali, Bhojpur, Nalanda and Purnea.
(v) To develop Air Cargo Complex at Patna Airport
(vi) To construct an Integrated Textile Park
(vii) To construct Inland Container Depot at Shitalpur
3.10 District Industries Centres (DICs)
The DICs came into being as a result of recommendations of the central government's Industrial
Policy of 1977. It was thought necessary to provide an integrated administrative framework at
district level to support micro, small and artisan-based industries which are widely dispersed in
rural areas and small towns. All the services and support required by small entrepreneurs, ranging
from pre- to post-investment stages of each project, are envisaged to be provided under the single
roof of DIC. These include identification of local resources, supply of machinery and equipment,
provision of raw materials, arrangements for credit facilities, marketing, quality input, consultancy
and extension services.
At present, DICs are functioning in all the 38 districts in the state. Upto 2005-06, there were 27
DICs and, in 2006-07, 11 more were opened in the newly created districts. These centres are
performing regulatory as well as developmental roles on behalf of the state government. These
101

centres provide all initial information, guidance and facilities to willing entrepreneurs in setting up
the small scale industrial units, besides granting provisional/ permanent registration, raw material
assistance and sponsoring of loan applications to banks and other financial institutions. The DICs
are functioning as nodal agency for the implementation of Prime Minister Rojgar Yojna in the
concerned districts.
During 2007-08, against the target of providing permanent registration to 7000 tiny industries,
only 4176 units with an investment of Rs. 8636 lakh and employment potential of 12793 persons
were permanently registered through DICs. All the DICs are being computerised and necessary
approval has already been accorded for purchase of equipments.
3.11 Prime Minister Rojgar Yojana (PMRY)
The PMRY is a scheme of self-employment launched in 1993. The purpose is to provide
sustainable self-employment opportunities to educated unemployed youths between 18-35 years of
age with a relaxation of 10 years for SC/ST, ex-serviceman, physically handicapped and women.
Under this scheme, the youths, both male and female, are being given loans from banks for
investments in service sector in order to make them self-employed. During 2007-08, against the
target of making 15,000 youths self-employed, only 8,187 unemployed were granted loans
amounting to Rs. 9522 crore. The districtwise progress report for the last 5 years is given in
Appendix III.
3.12 Information Technology
There is an independent Department of Information Technology (IT) to execute e-governance
related activities and for expansion of Information Technology in the state. Many basic
infrastructures and projects related to IT are being developed by the Department. During 2009-10,
the provisions for extension of the current projects and the new ones have been made as under :
(i) SWAN : This is a centrally sponsored project. Under this project, arrangements are being
made for vertical network connectivity from state headquarters to all the block headquarters.
The basic infrastructure for this network is being set up by a consultancy firm and 2 mbps
band width is being provided by BSNL. The implementation of this project was started in
2007-08. For 2009-10, an outlay of Rs. 3710 crore has been made for SWAN.
102

The funds approved for SWAN project are meant to be used for vertical connectivity;
whereas there is a need for horizontal connectivity of all the PoPs (Point of Presence) to the
local offices also. This will ensure connectivity of all the state government offices. It is
proposed to implement horizontal connectivity scheme in 2009-10. This will result in
BSWAN (Bihar SWAN) ensuring implementation of centrally sponsored SWAN Project.
The outlays for complete BSWAN project for 2009-10 has been earmarked (Table 3.11).
Table 3.11 : Outlay for BSWAN Project for 2009-10
(Rs. in lakh)
Vertical Bandwidth 1250.00
Operator QGR Payment State Share 100.00
Horizontal Bandwidth 60.00
Horizontal Operator QGR Payment 800.00
PCs for Horizontal Offices 1500.00
Total 3710.00
After connectivity of regional offices under BSWAN is completed, it is estimated that 7,500
personal computers shall be installed in the regional offices in 2009-10. A sum of Rs. 15
crore has been earmarked for this.
(ii) State Data Centre : The centrally sponsored State Data Centre (SDC) Project is to be
implemented by the state government. A provision of Rs. 30 crore has been made for
2009-10 under this project.
(iii) Sec-LAN : In the current financial year of 2008-09, all the offices in the secretariat
buildings, including CMs residence and residential offices are being connected through a
fibre optic Local Area Network (LAN). An outlay of Rs. 9.55 crore has been made for all the
components of the Sec-LAN Project for the financial year 2009-10.
Under the Sec-LAN Project, computerization of all the government departments has also
been planned. In the last financial year of 2007-08, an approval was granted for installation
of 1100 computers, 250 printers and EPABX/VoIP in all the government departments up to
103

the section level. For the current year (2008-09), it has been decided to provide personal
computers upto the assessment level for which an outlay of Rs. 4.00 crore has been provided.
(iv) Other projects : For other relevant projects of IT department, including knowledge city, IT
Bhavan, IT Park, IT academy, IT Fairs and Conferences and other capacity building
measures, an outlay of Rs. 48.70 crore has been made for the financial year 2009-10.
Table 3.12 : Plan Outlay for Information Technology Department (2009-10)
Projects Amount (Rs. in lakh)
BSWAN 3710
SDC 3000
Sec-LAN 955
Knowledge City 4000
IT Bhawan 300
Capacity Building 520
DPR Preparation 50
Total 12535
A beginning has been made in the state to exploit the great potential in the field of Information and
Communication Technology (ICT) with a view to expand knowledge base and employment in
various sectors of the economy. It will also disseminate very fast the latest technical know-how to
the different sectors, particularly agriculture, industries and marketing. Video-conferencing in all
the 38 districts has already been in operation. Computerisation of treasury, finance, provident
fund, tax collection, electricity bills, registration of properties, e-governance, etc. is planned on a
public-private partnership basis with Beltron as an important player.
104

Bihar's 'Jankari' Simplest and Best
Bihar has made its presence felt in e-governance through 'Jankari', which has been given the 'Gold award'. The people can seek information under the Right to Information (RTI) Act. from this centre. 'Jankari' is the first effort of its kind in the country where technology has been used to bring RTI to the masses. There was no additional cost and no fresh appointments were made for the project.
'Jankari' is developed as an additional mode for seeking information under RTI apart from the conventional way of giving applications to the office concerned. It enables people living in the remotest area of the state to submit applications for information under RTI by using private or public telephone by dialing 155311. The operator, receiving the call, drafts the application under RTI Act and sends the same to the authorities concerned for providing the requisite information to the applicant. The applicant is provided with a reference number of the application by the call centre. In case the information is not provided by the authorities, the applicant is entitled to file the first appeal and later the second appeal to the appellate authority and the State Information Commission respectively.
'Jankari' model is simple and universally accessible. The handicaps like illiteracy, geographical remoteness and financial hardships do not come in the way.
Under the Prime Minister Rojgar Yojana, there is a provision for giving 20 percent subsidy for an
investment, subject to a maximum of Rs. 20 thousand for encouraging the purchase of machines
and equipments to computer trained unemployed women and youth for establishing information
technology centre. Besides computer and printer, the centres shall have fax machine, photocopier
machine, telephone and internet facility. The beneficiaries will be provided with computer sets and
other accessories through Beltron. For the financial year 2007-08, there has been an provision of
Rs. 1.00 crore.
IT industry has been added in Schedule 1 of Bihar Shops and Establishment Act, 1953 and
concessions under Sections 7, 8 and 12(A) are now extended to it. The industry would be given
exemption in provisions relating to hours of opening and closing of establishment, hours of
business and weekly closures. The hours of work for women employees has been relaxed under
Section 66 of the Factory Act, 1948. Women would be able to work between 5 a.m. to 10 p.m.,
instead of 6 a.m. to 7 p.m. IT Industry is also eligible for exemption under Section 87 of
Employees State Insurance Act, 1948.
105

3.13 Investment Proposals
With a series of initiatives taken by the state government and improvement in the law and order
situation and infrastructural facilities in the state, a number of proposals to start new ventures are
being received by the state government. The State Investment Promotion Board (SIPB) examines
the proposals submitted to it and approves for further implementation. During 2006-07 (upto
January 2007), a total of 72 proposals were approved by the SIPB which increased to 115 in 2007-
08 (upto December, 2007). Again in 2008-09 (upto December, 2008), the cumulative total of
proposals approved by SIPB has gone upto 164 with an aggregate investment of Rs. 91.75
thousand crore and employment potential of 1.23 lakh persons. The sectorwise break-up of
approved proposals is given in Table 3.13.
Table 3.13 : Details of SIPB Approved Proposals (upto December, 2008)
Sector No. of
Proposals (Approved)
Sugar Mills 23
(a) New 14
(b) Expansion of working Mills 07
(c) Ethanol Plant by working Mills 02
Ethanol Plant 14
Power Plant 20
Food Processing 24
Steel Processing and Cement Plant 16
Technical Institutions (Engineering & Management)
15
Medical Institutions (Medical College & Hospital)
17
Others 35
Total 164
Out of 164 approved proposals, 15 proposals have already been implemented and are working, one
is ready for production, and as many as 49 with a total investment of Rs. 22.91 thousand crore are
in the advanced stage of implementation. The remaining 99 proposals are, however, under
different stages of implementation. The status of approved proposals is presented in Table 3.14.
106

Table 3.14 : Status of Proposals Approved by SIPB (upto December, 2008)
Sector No.
Implemented and Working 15
Ready for Production 1
Advanced Stage of Implementation 49
Different Stages of Implementation 99
Total 164
3.14 Tourism
Despite great potential to emerge as the leading industry in Bihar, the tourism sector remained
neglected in the past. Apart from a few places intensely involved with tourism, the sector has not
made much impact in Bihar. Due to the lack of better connectivity and coordination among the
related departments, tourism has remained neglected all through. No state is as much privileged as
Bihar in terms of possessing a variety of treasure of history, civilisation, religion and culture to
attract tourists, both domestic and international. The State Tourism Development Corporation
(STDC) has taken a number of measurers to develop tourism. With improvement in law and order
as well as infrastructural facilities at various tourist destinations, the number of both foreign and
domestic tourists has recorded an increase from 69.44 lakh in 2005 to 107.65 lakh in 2006 and to
105.30 lakh in 2007. However, there remains much potential to be exploited. As may be seen from
Appendix IV, besides the capital town of Patna, places like Gaya, Bodh Gaya, Rajgir, Sonepur fair
and Shravani Mela at Sultanganj are favourite destinations of tourists.
There are various religious destinations in the state which are being developed to attract tourists
like Gaya, Bodh Gaya, Rajgir, Vaishali, Pawapuri, as also Patna Sahib Gurudwara. With the
UNESCO World Heritage status granted to the Mahabodhi temple complex at Bodh Gaya, 'the
distance travelled by Bihar tourism has been wonderful'. The tourism department acts not only as a
promoter, facilitator and infrastructure provider, but is seriously involved in improving the
standards of tourism products and services in Bihar. The tourism department's recent tour
packages of Pindadaan and Yoga has been very popular with NRIs during the three-day Pravasi
Bharatiya Diwas celebration at Chennai in January, 2009. Yoga has become very popular among
the NRIs. For the tourists willing to take Yoga course, the department has prepared two and three
weeks' packages and tied up with Munger Yogashram. Last year, the department introduced a
special package 'Pindadaan' during 'Pitripaksh Mela at Gaya'. The third notable package developed
107

is "Trace Your Roots" to attract tourists from West Indies, Mauritius, Fiji, Indonesia, Surinam, etc.
This has also become a very popular package among the NRIs. Similarly, special packages related
to Buddhist and Jain circuits have also been prepared.
3.15 Problems and Prospects of Industrialisation in Bihar
Bihar is the victim of apathetic national policies which created constraints, both structural and
institutional, for industrialisation of the state. The Policy of Freight Equalisation introduced
immediately after independence stayed for long period and played havoc in de-industrialisation of
the state. Again, whatever industries worth the name were in the erstwhile Bihar, went to
Jharkhand as a result of bifurcation. The de-industrialisation of the state on a large scale led to
weak infrastructural development with specific implications for the industrial sector. This had an
obvious negative impact on the overall economic growth of the state.
The problems of backward areas in the country and districts within the states have received
attention from policy makers and planners which led to specially designed packages for their
accelerated development. In 1977, the Planning Commission appointed a committee for
identification of hundred most backward districts in the country. On the basis of indicators of (a)
deprivation, (b) social infrastructure, and (c) economic infrastructure, the Committee identified
100 districts spread over several states, many of them falling in Bihar. However, these endeavours
did not make any significant impact and inter-state and intra-state disparities persisted.
The high growth performance of the national economy during the economic reform period also
bypassed Bihar and, in complete contrast with southern and western states, growth had decelerated
in the state. As a result, Bihar remained at the bottom in terms of both human development and
economic infrastructure. Industrialisation of any region, prima facie, depends on natural
endowment, infrastructural support, local availability of skilled manpower, size of market
including export markets, and industrial policies of the central and state governments. In
undivided Bihar, all these factors, except natural endowment, were not favourable for industrial
development.
Infrastructure, both trunk and arterial, are very critical for industrial development. The power
plants and transmission network, major highways, waterways, railways, airports and
108

telecommunications are broadly trunk infrastructure. For industrial development in any region,
this trunk infrastructure needs to be supplemented by adequate and well developed arterial
infrastructure. In the absence of their proper network in Bihar, the states' economy remained
unchanged, rather it became worse. Again, the industry specific special infrastructure like cold
storages, dry ports, etc. is quite inadequate posing problems in industrialisation in the state. The
poor roads and transport condition served as a major deterrent for private investments. The
inadequate and irregular power supply forced many of the industrial units to flee out of the state.
On the other hand, the units which ventured to stay back, many of them are either sick or closed
due to paucity of fund and proper marketing facilities. Over and above, the banks' apathetic
attitude and their poor spread played truant and, as a result, the credit-deposit (CD) ratio in 2007-
08 remained far below (32 percent) the national average of 73 percent in 2006.
With the adoption of Industrial Incentive Policy, 2006 and grant of pre- and post-production
subsidies, new investment proposals have started flowing in Bihar and 164 proposals have already
been approved and more are in the pipeline. Bihar's economy is primarily an agricultural one and,
therefore, agro-based industries have a place of prominence in the overall industrial scenario.
Based on the Annual Survey of Industries too, the agro-based industries have a major role in
Bihar's industrialisation. In order to expand horticulture in Bihar, 19 districts are covered under the
Chief Minister's Horticulture Mission. The remaining 19 are covered under the National
Horticulture Mission. There are great potentials in food processing, sugarcane, dairy, leather and
leather products in the state. The size of non-agro-based industries in the state is very small, most
of them catering to local demands. However, there remains a great potential in non-agro-based
industries too. Again, the artisan based industries including handloom have started showing better
prospects in the state due to the initiatives of the state government. This sector requires support of
finance, marketing, training, designing, etc. for better income and employment generation. Most of
these requirements are being taken care of during the Eleventh Plan period.
109

Appendix – I
Structure of Industries in Bihar (Annual Survey of Industries 2004-05)
Percentage share
NIC Code
Industrial Cluster No. of
Factories
Factories in
operation
Total Output (Rs. In Crore)
Grosse value Added (Rs. In Crore)
Factories in
operation
Total Output
Gross value
Added
15-16 Food / Beverages/ Tobacco 280 251 1541 346 17.45 12.61 30.87
17 Textile/Textile Products 21 17 62 20 1.18 0.51 1.78
19 Leather/Leather Products 8 8 69 16 0.56 0.56 1.43
20 Wood/Wood Products 119 105 20 3 7.30 0.16 0.27
21-22 Paper/Printing/Publication 55 45 230 95 3.13 1.88 8.47
23 Coal/Petroleum/Atomic fuel 46 40 9495 543 2.78 77.68 48.44
24 Chemical 51 46 78 5 3.20 0.64 0.45
25 Rubber/Plastic Products 20 20 53 10 1.39 0.43 0.89
26 Glass and Glass products 779 642 275 45 44.65 2.25 4.01
27-28 Basic Metals/ Metal Products 88 72 300 20 5.01 2.45 1.78
29 General Purpose Machinery 49 49 30 7 3.41 0.25 0.62
31 Electric Motors/Generators/ Transformers
11 11 17 1 0.76 0.14 0.09
35 Building & Repair of Ship, boats, Transport Equipment etc.
4 3 12 1 0.21 0.10 0.09
36 Furniture, Musical instruments/ Export Goods, etc.
5 4 4 0 0.28 0.03 0.00
Other 137 125 37 9 8.69 0.30 0.80
Total 1673 1438 12223 1121 100.00 100.00 100.00
110

Appendix II
Area, Production & Productivity of Sugarcane (Kg / Hec.)
2004-2005 2005-2006 2006-2007 Average Name of Districts Area
(ha.) Production
(M.T.) Area(ha.)
Production(M.T.)
Area(ha.)
Production(M.T.)
Area (ha.)
Production(M.T.)
Productivity
Saran 283 10434 283 11965 0 0 189 7466 39574Siwan 4989 178224 3775 135391 4190 163135 4318 158917 36803Gopalganj 19279 765619 17759 856202 30634 1515989 22557 1045937 46368Muzaffarpur 730 28014 354 14017 614 27068 566 23033 40694E.Champaran 6152 246419 6238 206380 6596 206209 6329 219669 34710W.Champaran 55330 2349844 55993 2377461 57227 2678711 56183 2468672 43940Sitamarhi 2222 77119 2232 120358 2451 108086 2302 101854 44252Sheohar 1174 40092 1923 76145 2019 76621 1705 64286 37697Vaishali 122 4609 114 4514 113 4981 116 4701 40413Darbhanga 152 2024 105 3068 670 23328 309 9473 30658Madhubani 713 9399 586 18392 205 6510 501 11434 22807Samastipur 2707 36187 2719 78762 2508 88181 2645 67710 25602Begusarai 2937 79407 2035 77770 1998 79459 2323 78879 33951
Total 96790 3827391 94116 3980425 109225 4978278 100044 4262031 42602Saharsa 22 1056 29 1291 58 2638 36 1662 45734Supaul 0 0 0 0 0 0 0 0 0Madhepura 179 6531 273 11353 273 12458 242 10114 41851Purnea 0 0 2 82 0 0 1 27 41000Araria 144 5254 0 0 0 0 48 1751 36486Kisanganj 0 0 0 0 83 3788 28 1263 45639Katihar 39 1423 8 327 168 7621 72 3124 43586Khagaria 142 3780 142 5550 0 0 95 3110 32852
Total 526 18044 454 18603 582 26505 521 21051 40430Patna 452 17156 422 17445 341 15321 405 16641 41088Nalanda 169 7021 182 7651 193 8370 181 7681 42357Bhojpur 233 9563 126 5278 184 7860 181 7567 41807Buxer 379 15885 370 15580 454 23883 401 18449 46008Rohtash 118 4948 178 7485 0 0 99 4144 42003Bhabhua 359 15046 285 12001 246 6073 297 11040 37213Gaya 922 33154 825 22228 1451 51789 1066 35724 33512Jahanabad 206 7407 327 8602 275 9769 269 8593 31903Nawada 84 3020 118 3192 142 5045 115 3752 32724Aurangabad 231 8306 223 5866 216 7673 223 7282 32604Munger 0 0 0 0 0 0 0 0 0Lakhisarai 0 0 0 0 0 0 0 0 0Sheikhpura 38 1824 18 234 31 1258 29 1105 38115Jamui 491 23159 287 4747 207 2511 328 10139 30880Bhagalpur 2341 84534 2052 82616 2245 122824 2213 96658 43684Banka 850 35264 1260 48510 1387 71681 1166 51818 44454
Total 6873 266287 6673 241435 7372 334057 6973 280593 40242Grand Total 104189 4111722 101243 4240463 117179 5338840 107537 4563675 42438
Source : Directorate of Statistics & Evaluation, Bihar
111

Appendix III
Progress of Prime Minister Rojgar Yojana (PMRY) (2003-04 to 2007-08)
2003-04 2004-05 2005-06
Disbursement Disbursement Disbursement
DIC Target
No. Amount
Disbursement against Target
(%)
TargetNo. Amount
Disbursement against Target
(%)
Target No. Amount
Disbursement against Target
(%)
1 2 3 4 5 6 7 8 9 10 11 12 13
Araria 278 184 184.57 66.19 310 236 203.92 76.13 449 140 102.63 31.18
Arwal 122 53 45.12 43.44 212 57 48.00 26.89
Aurangabad 280 129 108.96 46.07 312 170 135.88 54.49 519 232 192.73 44.70
Banka 293 180 140.28 61.43 326 177 166.40 54.29 542 262 215.49 48.34
Begusarai 566 337 261.95 59.54 360 480 393.62 133.33 903 610 532.59 67.55
Bhagalpur 523 316 258.88 60.42 580 340 279.17 58.62 942 507 365.85 53.82
Bhojpur 413 250 184.84 60.53 458 278 210.94 60.70 734 354 255.70 48.23
Buxar 281 181 133.06 64.41 312 190 162.78 60.90 498 233 179.45 46.79
Darbhanga 558 413 361.46 74.01 620 380 303.58 61.29 990 465 392.87 46.97
E. Champaran 502 370 296.64 73.71 555 430 373.04 77.48 796 446 373.50 56.03
Gaya 606 419 348.09 69.14 704 443 465.80 62.93 1048 607 527.80 57.92
Gopalganj 266 199 173.41 74.81 295 194 142.15 65.76 457 165 124.71 36.11
Jamui 221 141 115.21 63.80 246 169 204.40 68.70 375 197 160.46 52.53
Jahanabad 305 195 140.00 63.93 218 156 134.28 71.56 330 189 166.32 57.27
Kaimur 272 186 191.06 68.38 300 195 166.34 65.00 468 206 180.84 44.02
Katihar 401 308 263.24 76.81 445 303 267.34 68.09 680 267 233.86 39.26
Khagaria 206 158 125.26 76.70 230 176 146.97 76.52 332 210 187.40 63.25
Kishanganj 167 107 81.01 64.07 184 105 93.83 57.07 306 124 93.28 40.52
Lakhisarai 170 124 106.70 72.94 190 116 115.35 61.05 304 197 168.20 64.80
Madhepura 266 217 190.00 81.58 296 238 223.69 80.41 416 293 260.57 70.43
Madhubani 486 365 310.00 75.10 541 438 428.60 80.96 758 440 489.00 58.05
Munger 243 160 121.04 65.84 270 213 203.10 78.89 384 254 221.64 66.15
Muzaffarpur 764 371 301.81 45.56 858 404 343.78 47.09 1457 476 383.34 32.67
Nalanda 512 229 183.84 44.73 572 327 327.00 57.17 929 440 442.00 47.36
Nawada 324 136 111.71 41.98 298 156 125.62 52.35 642 217 169.34 33.80
Patna 1257 843 756.23 67.06 1475 813 683.23 55.12 2198 1141 1132.90 51.91
Purnea 318 280 243.30 88.05 351 318 284.41 90.60 467 342 285.76 73.23
Rohtas 372 243 232.63 65.32 422 304 318.43 72.04 615 229 211.38 37.24
Saharsa 301 204 169.41 67.77 336 168 83.83 50.00 575 263 245.99 45.74
Samastipur 518 334 303.15 64.48 583 280 226.26 48.03 991 403 244.87 40.67
Saran 581 405 303.54 69.71 647 433 311.28 66.92 997 485 394.80 48.65
Sheikhpura 147 131 88.46 89.12 165 121 69.72 73.33 244 138 116.61 56.56
Sheohar 105 25 16.90 23.81 120 19 19.00 15.83 246 69 66.90 28.05
Sitamarhi 450 306 286.25 68.00 500 371 358.00 74.20 734 393 392.00 53.54
Siwan 439 328 302.59 74.12 492 317 277.91 64.43 770 322 264.40 41.82
Supaul 188 108 90.51 57.45 223 157 140.69 70.40 336 168 143.86 50.00
Vaishali 443 318 269.39 71.78 493 339 277.65 68.76 750 344 262.06 45.87
W. Champaran 378 320 259.29 84.66 420 322 241.23 76.67 606 491 424.82 81.02
Total 14400 9520 8014.67 66.11 15829 10329 8954.34 65.25 25000 12376 10653.92 49.50
(Contd.)
112

Appendix III : (Contd.)
2006-07 2007-08
Disbursement Disbursement DIC Target
No. Amount
Disbursement against Target (%)
Target No. Amount
Disbursement against Target (%)
14 15 16 17 18 19 20 21 22
Araria 206 101 82.54 49.03 270 119 135.90 44.07
Arwal 135 72 83.00 53.33 180 76 135.00 42.22
Aurangabad 230 141 109.77 61.30 299 130 93.45 43.48
Banka 231 166 180.42 71.86 300 195 276.00 65.00
Begusarai 440 342 312.79 77.73 580 295 367.63 50.88
Bhagalpur 405 254 253.30 62.72 530 263 275.84 49.62
Bhojpur 330 185 123.60 56:06 440 200 139.87 45.45
Buxar 220 142 123.69 64.55 290 161 186.25 55.52 Darbhanga 430 335 269.72 77.91 565 389 445.41 68.85
E. Champaran 400 266 188.62 66.50 527 251 256.00 47.63
Gaya 480 398 352.69 82.92 631 367 452.60 58.16
Gopalganj 210 178 129.77 84.76 278 162 199.50 58.27
Jamui 180 149 148.40 82.78 239 122 130.68 51.05
Jahanabad 200 125 105.72 62.50 265 173 192.48 65.28
Kaimur 230 146 120.62 63.48 301 166 278.00 55.15
Katihar 314 217 190.53 69.11 415 226 272.46 54.46
Khagaria 164 123 106.00 75.00 215 153 178.14 71.16
Kishanganj 134 96 96.00 71.64 180 111 107.90 61.67
Lakhisarai 140 89 79.17 63.57 185 103 87.77 55.68
Madhepura 206 171 148.45 83.01 300 195 242.64 65.00
Madhubani 385 247 176.10 64.16 507 238 312.50 46.94
Munger 194 185 154.30 95.36 257 256 309.40 99.61
Muzaffarpur 584 382 320.59 65.41 724 340 428 46.96
Nalanda 394 250 250.00 63.45 514 162 222.00 31.52
Nawada 254 139 121.01 54.72 329 154 189.64 46.81
Patna 920 638 505.71 69.35 1204 569 469.91 47.26
Purnea 255 214 172.28 83.92 335 253 273.63 75.52
Rohtas 294 226 204.28 76.87 388 265 248.31 68.30
Saharsa 242 230 230.00 95.04 350 180 199.32 51.43
Samastipur 397 271 207.02 68.26 520 237 183.99 45.58
Saran 446 374 325.29 83.86 587 406 616.95 69.17
Sheikhpura 124 130 114.82 104.84 164 117 115.05 71.34
Sheohar 100 76 69.85 76.00 130 79 95.54 60.77
Sitamarhi 350 216 200.10 61.71 459 231 307.77 50.33
Siwan 350 253 250.30 72.29 459 226 445.95 49.24
Supaul 176 113 109.00 64.20 229 150 223.10 65.50
Vaishali 350 238 176.46 68.00 460 231 231.97 50.22
W. Champaran 300 218 210.86 72.67 394 236 195.07 59.90
Total 11400 8096 7002.77 71.02 15000 8187 9521.62 54.58
(Concluded)
113

Appendix IV
Statistics of Domestic and Foreign Tourist Visit to the State of Bihar 2005-08 (upto September, 2008)
(Figure in 000)
2005 2006
Place Tourist Jan to March
April to June
July to Sept
Oct to Dec
Total Jan to March
April to June
July to Sept
Oct to Dec
Total
Domestic 427.2 314.7 376.1 370.0 1487.9 634.3 385.7 481.9 506.7 2008.6Patna
Foreign 0.8 0.1 0.2 0.8 1.9 1.1 0.5 0.6 1.7 4.0
Domestic 219.4 188.1 701.7 16.8 1126.0 215.5 196.6 705.0 19.6 1136.7Gaya
Foreign 2.4 0.3 0.7 0.6 4.0 1.9 0.4 0.5 0.6 3.3
Domestic 77.6 49.2 39.4 130.9 297.2 180.1 64.0 81.1 139.6 464.8Bodh Gaya
Foreign 11.5 1.1 6.0 18.5 37.0 40.1 6.2 0.6 6.0 52.9
Domestic 71.2 16.9 69.0 165.5 322.6 77.5 28.5 72.2 170.1 348.3Rajgir
Foreign 0.8 0.6 0.6 3.5 5.5 1.7 0.3 1.6 7.3 10.9
Domestic 35.3 28.5 30.0 41.0 134.8 37.8 28.3 30.0 45.5 141.5Raxual
Foreign 0.5 0.2 0.4 0.7 1.8 0.6 0.4 0.6 0.9 2.5
Domestic 12.4 10.8 12.1 10.8 46.1 14.3 12.0 14.0 11.4 51.6Munger
Foreign 0.0 0.0 0.0 0.0 0.0 0.0 0.0 0.0 0.0 0.0
Domestic 18.8 100.7 93.5 20.9 234.0 26.3 121.2 89.6 24.2 261.2Vaishali
Foreign 0.5 1.6 2.1 4.7 8.9 2.7 4.1 4.5 0.1 11.5
Domestic 18.1 21.5 18.8 9.9 68.2 20.7 19.3 12.6 13.0 65.6Muzaffarpur
Foreign 1.5 1.1 0.9 0.3 3.7 0.2 8.3 0.2 0.0 8.7
Domestic 0.0 0.0 0.0 2008.3 2008.3 0.0 0.0 0.0 4001.0 4001.0Sonepur Fair
Foreign 0.0 0.0 0.0 0.7 0.7 0.0 0.0 0.0 0.7 0.7
Domestic 0.0 0.0 1155.6 0.0 1155.6 0.0 0.0 2125.9 0.0 2125.9Shrawani Mela Sultanganj (Bhagalpur) Foreign 0.0 0.0 0.0 0.0 0.0 0.0 0.0 0.0 0.0 0.0
Domestic 0.0 0.0 0.0 0.0 0.0 0.0 14.9 30.5 19.6 64.9Bhagalpur
Foreign 0.0 0.0 0.0 0.0 0.0 0.0 0.0 0.0 0.0 0.0
Domestic 0.0 0.0 0.0 0.0 0.0 0.0 0.0 0.0 0.0 0.0Other
Foreign 0.0 0.0 0.0 0.0 0.0 0.0 0.0 0.0 0.0 0.0
Domestic 879.9 730.4 2496.3 2774.1 6880.7 1206.5 870.3 3642.9 4950.6 10670.3Total
Foreign 18.0 5.0 10.8 29.6 63.3 48.3 20.3 8.6 17.3 94.4
Grand Total 897.9 735.4 2507.0 2803.7 6944.0 1254.8 890.5 3651.5 4967.9 10764.7
(Contd.)
114

115
Appendix IV : (Contd.) (Figure in 000)
2007 2008 Upto September
Place Tourist Jan to March
April to June
July to Sept
Oct to Dec
Total Jan to March
April to June
July to Sept
Total
Domestic 167.3 176.9 280.3 94.2 718.7 597.5 530.3 1541.4 2669.2Patna
Foreign 1.4 0.3 0.8 1.3 3.8 1.8 0.4 0.4 2.6
Domestic 241.4 221.5 791.3 105.1 1359.3 284.2 194.8 1959.5 2438.4Gaya
Foreign 0.6 0.3 0.7 0.6 2.2 3.8 1.4 52.8 58.1
Domestic 170.1 46.5 64.4 198.8 479.9 298.6 33.8 218.9 551.4Bodh Gaya
Foreign 64.4 1.2 3.1 51.8 120.4 66.9 3.0 7.3 77.2
Domestic 83.0 482.0 155.2 170.4 890.6 284.4 106.0 169.0 559.4Rajgir
Foreign 5.1 1.5 4.4 21.5 32.6 43.8 8.7 83.0 135.5
Domestic 16.7 24.4 16.3 14.4 71.7 21.3 15.6 13.5 50.3Raxual
Foreign 4.6 0.9 0.7 0.7 6.9 1.2 0.8 0.8 2.8
Domestic 8.6 11.6 13.6 6.6 40.5 3.6 3.4 0.0 7.1Munger
Foreign 0.0 0.0 0.0 0.0 0.0 0.0 0.0 0.0 0.0
Domestic 85.2 90.9 43.3 6.7 226.1 10.7 94.8 9.1 114.6Vaishali
Foreign 3.5 0.7 2.9 2.3 9.5 6.4 6.3 1.6 14.2
Domestic 12.1 7.5 217.7 3.3 240.7 4.5 4.2 284.2 292.9Muzaffarpur
Foreign 0.0 0.0 0.5 0.2 0.7 0.0 0.0 0.0 0.0
Domestic 0.0 0.0 0.0 4019.5 4019.5 0.0 0.0 0.0 0.0Sonepur Fair
Foreign 0.0 0.0 0.0 1.2 1.2 0.0 0.0 0.0 0.0
Domestic 0.0 0.0 2198.4 0.0 2198.4 0.0 0.0 0.0 0.0Shrawani Mela Sultanganj (Bhagalpur) Foreign 0.0 0.0 0.0 0.0 0.0 0.0 0.0 0.0 0.0
Domestic 21.9 22.2 21.6 22.6 88.3 23.9 51.7 720.5 796.2Bhagalpur
Foreign 0.0 0.0 0.0 0.0 0.0 0.0 0.0 0.0 0.0
Domestic 3.1 6.7 5.7 3.9 19.3 7.9 17.8 10.5 36.1Other
Foreign 0.0 0.0 0.0 0.0 0.0 0.0 0.8 0.0 0.9
Domestic 809.3 1090.2 3807.9 4645.4 10352.9 1536.6 1052.4 4926.6 7515.5Total
Foreign 79.6 5.0 13.2 79.6 177.4 123.9 21.4 146.0 291.3
Grand Total 888.9 1095.2 3821.1 4725.0 10530.2 1660.5 1073.8 5072.6 7806.8
(Concluded)

CHAPTER IV
PHYSICAL INFRASTRUCTURE
Developed infrastructure is the sine qua non for the growth of an economy. During the colonial
period, the development of infrastructure in a landlocked state like Bihar was entirely oriented
towards ensuring better colonial control and exploitation of raw material from rural areas for
feeding the British industries. In the post independence era too, nothing concrete has been done to
improve and expand the infrastructure in Bihar. The existing low level of infrastructure facilities
are the major bottleneck in accelerating the process of development in the state. Bihar has the
weakest infrastructural base among the major states of India. According to an infrastructure index
used by the Twelfth Finance Commission for devolution of funds to states, Bihar alongwith the
north eastern states and Jammu and Kashmir stands at the bottom level (Table 4.1). The
infrastructural poverty of Bihar pervades all sectors. Whatever trunk infrastructures exists in the
state, are not exploited fully on account of the absence of the adequately developed arteries.
Table 4.1 : Ranking of States According to Infrastructure Index
Category States
Low North Eastern States, Assam, Bihar, Jammu & Kashmir, Rajasthan
Low-medium Himachal Pradesh, Madhya Pradesh, Orissa, Uttar Pradesh, West Bengal
Medium-medium Andhra Pradesh , Karnataka
High-medium Gujarat, Haryana, Kerela, Tamil Nadu
High Goa, Maharashtra, Punjab
Source : Report of Twelfth Finance Commission, GOI
Thus, there is a consensus that the issue of infrastructure development has to be taken up on a
priority basis in Bihar. However, in view of the volume of investment and technical efficiency,
there is a growing realization that the dependence on the government alone may not be a good
proposition. The private sector, on the other hand, may fear to tread the underdeveloped remote
areas. Therefore, an appropriate policy framework may have to be evolved so as to attract the
private players in this endeavour through Public-Private Partnership (PPP). Indeed, in pursuance
116

of the Bihar Infrastructure Development Enabling Act, the state government has already begun to
explore and introduce the option of PPP in some sectors and is planning to expand these
initiatives. It will also actively encourage direct private investments in large infrastructure projects
in power, road, etc. Major institutional reforms have been undertaken and more have been
proposed to increase transparency and reduce the time taken to clear investment proposals.
4.1 Roads and Bridges
Density of Roads : The density of roads in the state determines the extent of links established
throughout the area. Presently, there are 0.98 kms. of roads per sq. km. of area against the national
average of 1.25 kms. (Table 4.2). But the difference between Bihar and India in terms of road
density is larger when one takes into account the population. Being a densely populated state, the
road density per lakh population in Bihar stands at only 111 kms.; while for the country as a whole
this density is more than three times higher (360 kms.). Similarly, the proportion of the villages
connected through roads is only 57 percent as against 62 percent for all-India and 99 percent for
Gujarat. The road density of Bihar vis-à-vis other states in 2001 is given in Appendix I.
Table 4.2 : Road Density in Selected States and India
Density of Roads India Uttar
Pradesh Andhra Pradesh
Karnatka Gujarat Bihar
Road length / sq. km. 1.25 1.02 1.02 0.82 0.75 0.98
Road length / lakh population
360 185 297 289 275 111
Village Connectivity (%) 62 60 67 59 99 57
Length : Connectivity is a cardinal determinant of economic growth and roads capacitate the
people of all corners to share the fruits of growth. Considering from this angle, the road
infrastructure in Bihar appears very weak in all its dimensions including its riding quality. Over
and above, the construction and maintenance of roadways in the flood hit north Bihar poses a great
problem. The length of roads in Bihar has not been at par or even closer to the national average
(Appendix I). In terms of roads, the state always remained far behind the fast growing states like
Gujarat, Punjab and Haryana. Since 1990, the road network at national level has registered an
increase of 99.6 percent, whereas in Bihar this increase was only 27.7 percent.
117

In Bihar, the total road length in 2008 was 82,959 kms. which constituted National Highways
(4.50 percent), State Highways (4.81 percent), Major District Roads (9.83 percent), Other District
Roads (4.60 percent) and Village Roads (76.26 percent) (Table 4.3). However, part of the roads
under the last two categories are unpaved.
Table 4.3 : Length of Roads in Bihar (2008)
Road Length (kms.)
Category Pucca (Paved)
Kutcha (Unpaved)
Total Percentage
share
National Highway (NH) 3734.00 0.00 3734.00 4.57
State Highway (SH) 3989.00 0.00 3989.00 4.81
Major District Roads (MDR) 8156.00 0.00 8156.00 9.83
Other District Roads (ODR) 2828.00 990.00 3818.00 4.60
Village Roads (VR) 27400.00 35861.63 63261.63 76.26
Total 46107.00 36851.63 82958.63 100.00
Source : Department of Road Construction, GOB
There is vast inter-district variation in terms of the road length in the state. As may be seen from
Appendix II, Munger (119 kms.), Lakhisarai (136 kms.) and Sheikhpura (152 kms.) districts are at
the lowest position; whereas the districts like Patna (915 kms), Supaul (789 kms), Rohtas (450
kms) and Muzaffarpur (704 kms) are higher on road length. It is also discerned that the districts of
Banka, Jamui and Kishanganj are devoid of national highways. On the other hand, Patna (395
kms), Muzaffarpur (229 kms) and Madhubani (208 kms) are on the higher side of the scale in this
regard.
Type and Quality : Invariably, the quality of roads is judged on the basis of their being surfaced or
unsurfaced. The road infrastructure in Bihar is not only besieged with lower density, but also with
its low quality. Less than half of state's roads are surfaced, whereas, at the all-India level, around
60 percent of the roads come under this category. In the richer states, the proportion is even
higher. In terms of the quality of national highways too, Bihar stands at the lowest position. The
share of 4-lane and 2-lane national highways is much lower in Bihar (5 percent and 38 percent
respectively), as compared to all-India (9 percent and 56 percent respectively). The single lane
national highways are around 57 percent in the state as against 35 percent for the country.
The accessibility of villages in Bihar is poor compared to the national average. This is despite the
fact that density of population being much higher in Bihar, connecting urban areas with rural
118

population is relatively less costly here. In spite of that, only 57 percent of habitations are
connected, the smaller habitations suffering most in this regard.
Upgrading Road Network : The poor road network in the state has been a great constraint in the
state's development. However, this constraint is now being gradually removed throughout the
state. Normally, the national and state highways are of better quality compared to district and other
roads. In all, 27 National Highways pass through 35 districts of the state and connect international
borders of Nepal and adjacent states of Uttar Pradesh, Jharkhand and West Bengal. The state
government is pushing for completion of the Golden Quadrilateral Project within the state.
Upgrading the road network in the state will involve four laning of NH2 which is part of Golden
Quadrilateral (205.7 kms.) and it is nearing completion. In addition, work on the East-West
Corridor is in progress (513.3 kms.) and roads under NHDP-III will be taken up soon (890 kms.).
Four laning of some of the important national highways are also being taken up. During the
Eleventh Five year Plan, besides the national highways, the state highways and major district
roads are also to be upgraded. The strategies to achieve the targets during the Eleventh Plan have
also been evolved which interalia includes constitution of a flexible autonomous body for project
development, project management, maintenance policy, online monitoring, quality control
laboratories and special project cell. The action points for the Eleventh Plan have been identified
as follows :
(i) Developing a road network equal to the best in the country
(ii) Upgrading, 1,600 km of National Highways in Bihar to four lanes, two-laning all State
Highways and upgrading all Major District Roads in intermediate lane.
(iii) Providing all-weather connectivity to all unconnected villages with a population of over 500
within five years.
(iv) Implementing the new road maintenance policy like introducing tolls on some stretches and
use the revenue for maintenance of the road
(v) Setting up a non-lapsable road fund
(vi) Setting up a central tribunal for dispute resolution
(vii) Setting up a specialised cell to expedite the process of appraisal and approval of detailed
project reports (DPR) for roads
(viii) Upgrading quality control laboratories at the headquarters and in the division
(ix) Monitoring all projects in real time.
(x) Exploring options for levying a road cess
119

The state government has also estimated the expenditure for all these plans — 4-laning of national
highways (Rs. 11400 crore), State Highways (Rs. 4000 crore) and Major District Roads (Rs. 2500
crore), all totaling to Rs. 17,900 crore.
4.2 Motor Vehicles
Adequacy of road infrastructure is also related to the availability of motor vehicles in the state. As
compared to 1990, the number of motor vehicles at the all India level has increased by 197 percent
in 2007; for Bihar, this increase was 239 percent. This is indicative of the fact that the increase in
road network was not commensurate with the increase in transport in the state. As can be noted
from Table 4.4, the number of motor vehicles has increased manifold in the last three years. The
total number of motor vehicles registered increased considerably in 2008-09, compared to the
previous years. The number increased from 80,363 in 2005-06 to 1,42,991 in 2008-09 (till
December 2008). This upward trend is mainly due to the lowering of the registration charges and
other effective measures introduced since 2005-06.
Table 4.4 : Number of Vehicles Registered
Year Truck Bus Car Taxi Jeep Auto Two
WheelerTractor Trailer Other Total
2005-06 579 113 5062 427 2321 3273 61333 3509 2440 1306 80363
2006-07 1989 921 7409 1326 4430 5027 112985 6160 5281 1781 147309
2007-08 2161 1276 7425 2744 3904 5523 110213 7609 5084 2563 148502
2008-09 2053 675 6961 2131 3511 4791 106618 6681 8561 1009 142991
Note : For 2008-09, the figures relate upto December, 2008
Source : Department of Transport, GOB
The highest revenue collected by the Department of Transport was Rs. 308.72 crore in 2005-06
and it subsequently declined to Rs. 202.14 crore in 2006-07. The decline in the revenue was
mainly due to reduction in registration charges in 2006. The Department has collected Rs. 245.83
crore in 2007-08 and Rs. 217.08 crore in 2008-09, till December, 2008 (Table 4.5).
120

Table 4.5 : Revenue Collected by Transport Department
Year Target (Rs.
crore)
Actual (Rs.
crore)
Percentage of
Collection
2001-02 160.00 133.10 83.19
2002-03 205.00 177.54 86.60
2003-04 275.00 217.91 79.24
2004-05 308.00 257.08 83.47
2005-06 310.00 308.72 99.60
2006-07 350.00 202.14 57.75
2007-08 375.00 245.83 65.55
2008-09 (upto Dec. 2009) 314.19 217.08 69.09
Source : Department of transport, GOB
A list of new initiatives taken by the Department to improve transport facilities in the state is
presented in Appendix III. In addition, the following steps have been taken by the Department to
retionalise certification of vehicles and revenue collection :
Pollution and fitness test have been made mandatory for certifying vehicles for registration.
In order to meet this requirement, 106 licenses have been granted to private enterprises to
establish Fitness Testing Stations and Pollution Testing Stations. This is an addition to the
available arrangements of fitness test by the Motor Vehicles Inspectors.
The process of granting and renewal of permit, particularly on inter-state routes, has been
speeded up by signing an inter-state transport agreement with Jharkhand and West Bengal.
Similar negotiations are in progress for entering into inter-state transport agreements with
other neighbouring states.
Farmers using tractor/trailer for agricultural purpose have been provided with the scheme of
one-time tax payment.
Keeping in view the phenomenal increase in the motor vehicles, all the important corridors in the
state are to be upgraded as four lanes under NHDP, keeping in view the administrative, economic
and tourists needs. The list of such roads is presented in Table 4.6.
121

Table 4.6 : Important Corridors to be Upgraded
Corridors Length (kms)
Mohania-Sasaram-Aurangabad-Dobhi, Barhi under Golden Quadrilateral Part of Delhi-Calcutta Raod
205.7 (NH-2-GT Road)
Gopalganj-Muzaffarpur-Darbhanga-Araria-Kishanganj part of East West Corridor
513.3 (NH-28, 57)
Hajipur-Muzaffarpur-Sitamarhi-Sonbarsa 138.20 (NH-77)
Pipra Kothi-Motihari-Raxaul 67.00 (NH-28A)
Patna-Hajipur-Chhapra 80.00 (NH-19)
Ara-Buxar 74.00 (NH-84)
Patna-Gaya-Dobhi 125.00 (NH-83)
Bakhtiarpur-Mokama 255.00 (NH-31)
Mokamah-Munger 70.00 (NH-80)
Bakhtiarpur-Fatuha-Patna-Ara 100.80 (NH-30)
Chhapra-Gopalganj 92.00 (NH-85)
Forbesganj-Jogbani 13.00 (NH-57A)
Total 1734
Besides, the following important roads have been identified for four-laning :
Bakhtiarpur-Biharsarif-Nawada-Rajauli
Gaya-Bodhgaya-Rajgir-Nalanda-Biharsarif (under Buddhist Circuit Development
Programme).
Munger-Bhagalpur
Bihta-Mahabalipur-Aurangabad
Bridges : During the rainy season most of the road networks in Bihar are submerged under water
and get destroyed obstructing the regular flow of transport. This is one of the main reasons for the
sluggish growth of the state. The Bihar State Bridge Construction Corporation is responsible for
construction of bridges in the state. The Bihar Rajya Pul Nirman Nigam (BRPNN) was formed in
1975 as a state government company. It main objectives are : (i) Construction of Bridges and
Roads, (ii) Maintenance of Bridges; and (iii) Toll Collection.
The Corporation was working well initially, but in late nineties it almost became non-functional.
In 2002-03, its net worth was reduced to Rs. (-) 13.17 crore and remained negative till 2005-06.
However, from 2006-07, it showed an upward trend with net worth becoming Rs. 3.25 crore. The
122

profit after tax, which was almost negative upto 2004-05, became Rs. 5.34 crore in 2005-06 and
doubled to Rs. 11.19 crore in 2006-07. In 2007-08 it set off all its accumulated loss and its profit
is expected to increase to Rs. 23.00 crore with a total turnover of Rs. 410.00 crore. The details are
given in Table 4.7.
Table 4.7 : Fixed Assets, Turnover and Profit for BRPNN
(Rs. crore)
Year Fixed Assets
Net worth
Turnover (work
execution)
Profit After Tax
2002-03 2.83 -13.17 17.99 -2.62 2003-04 2.62 -12.73 42.75 0.53 2004-05 2.43 -12.82 42.62 0.02 2005-06 2.44 -7.67 57.38 5.34 2006-07 3.80 3.25 95.88 11.19 2007-08 (Estimated)
7.20 23.25 410.00 23.00
Presently, there are 1055 bridges, small and big, on the state highways and 3049 on the major
district roads. The Ganges flows through the state for about 400 kms, but it has only 4 bridges. For
maintaining the connectivity, there is a need of a bridge at a distance of every 50 kms. on of the
important rivers in the state. There is a proposal to construct 18 bridges on the important rivers of
the state during the Eleventh Plan period at a total cost of Rs. 2810 crore. Besides, bridges are
proposed to be constructed on smaller rivers too.
Since November, 2007, as many as 78 big bridges have been constructed by the Nigam under
plan, non-plan and Rashtriya Sam Vikas Yojana. Presently, the Nigam is executing 517 schemes
at a total cost of Rs. 1132 crore under the Chief Minister Bridge Construction programmes in the
state. Out of these, the works on 169 bridges at a cost of Rs. 113.17 crore have been completed. At
a total cost of Rs. 307 crore, 8 railway over-bridges are also under construction. Besides, 39 major
road bridges for an amount of Rs. 352 crore have also been taken up. Thus, presently, the Nigam
is executing schemes worth Rs. 2700 crore.
There is a target to complete 1844 schemes during the year 2008-09, under the Mukhya Mantri
Setu Nirman Yojana. Out of these, 1319 bridges with a cost of upto Rs. 25 lakh are to be taken up
by the district administration and the remaining 525 bridges by the Bihar State Bridge
Construction Corporation. Based on the achievements in the last two years, the Bihar Rajya Pul
123

Nirman Nigam may be termed as a success story. The Nigam, with an increase in its professional
efficiency, is expected to play a major role in development of infrastructure.
4.3 Bihar Police Building Construction Corporation
The Bihar Police Building Construction Corporation was established in 1974 by the state
government to cater to various needs of the Police department. The Corporation was able to
construct a number of police buildings, including a few most prestigious ones. After remaining
dormant for several years, the Corporation was revived on April 04, 2007. To inject further vitality
into the organization, the state government has sanctioned adequate schemes and provided
required funds for their execution. In addition, the responsibility of maintenance of the police
buildings was also vested with the Bihar Police Building Construction Corporation.
The state government has provided Rs. 89.67 crore for the construction of new police stations and
other buildings, including residential accommodation, and also for the repair and maintenance of
old buildings. In addition, the Corporation has been entrusted with the task of constructing one
Model Police Station in each district, each with an estimated cost of Rs. 1.28 crore.
In order to carry out the responsibility efficiently, the Corporation management has made a series
of efforts to enhance its technical capacity on one hand and to streamline the general
administration as well as financial administration on the other. Till date, 40 additional Junior
Engineers have been appointed on contractual basis and have been posted in each district of the
state to look after the construction work. Also, in order to ensure better coordination with the
district police administration and to achieve impeccable quality of police buildings, the offices of
Junior Engineers and Assistant Engineers have been located in the respective District Police
Offices, thereby bringing the grassroot technical wing of the Corporation directly under the
command and control of the district police administration. As a result of efficient financial
management, a number of old pending financial demands of the employees of the Corporation
have been met.
During 2008-09, the construction of new buildings for 36 Rural Police Stations (Grade-III), 9
Urban Police Stations (Grade-IV), 34 Model Police Stations, augmenting the infrastructure
facilities in training centres, 600 residential units for various staff, construction of office of Senior
124

Superintendent of Police, Patna and that of the new Police Training College at Rajgir in near
future will go a along way in creating substantial housing infrastructure for the state Police (details
of schemes given in Appendix IV). The income and expenditure of the Corporation for 2007-08
and 2008-09 are presented in Table 4.8.
Table 4.8 : Expenditure and Income of the Bihar Police Building construction Corporation
(Rs. in lalh)
Particulars 2007-08 (Actual)
2008-09 (Estimated)
2009-10 (Expected)
Total Expenditure of the Corporation 3,98.86 7,58.00 15,25.00
Total Income of the Corporation 3,90.85 8,55.92 19,75.00
Operational Income 55.65 3,05.92 11,25.00
Non-Operational Income 3,35.20 5,50.00 8,50.00
4.4 Energy Sector
The energy sector in India has exhibited impressive expansion and development since 1951.
However, in Bihar, this sector remained far behind the national average in respect of all the
indicators including per capita consumption of power.
Installed Capacity : India as a whole has an installed capacity of 1.46 lakh MW, of which thermal
power constitutes around 64 percent and hydroelectric power about 25 percent. Besides,
wind/renewable energy and nuclear power plants are also there, though with a very low installed
capacity. As compared to the all India scenario, Bihar presents a very dismal picture (Table 4.9).
With a total installed capacity of only 592 MW in the state, the thermal power plants have the
major share (91 percent) in capacity. The hydro and renewable energy constituted a negligible
proportion each (8 percent and 1 percent respectively).
Table 4.9 : Installed Capacity of Power in India and Bihar (2008)
Installed capacity (MW)
Hydro Thermal Nuclear
Renewable Energy
Total
India 36347.7 92892.6 4120 12194.5 145555
Bihar 47.1 540 – 5.0 592.1
125

The details of the installed capacity of hydro and thermal power is presented in Table 4.10.
Table 4.10 : Installed Capacity of Power Station in Bihar
Name of Power Station Installed Capacity (MW) Agency
Hydro BSHPC*
Kosi (4 x 4.8) 19.2 BSHPC
Sone E & W Canal (2 x 1.65 + 4 x 1.65)
9.9 BSHPC
East Gandak Canal (3 x 5) 15 BSHPC
Agnoor 1.0 BSHPC
Dhelabagh 1.0 BSHPC
Nasariganj 1.0 BSHPC
Hydro Total 47.1
Thermal
Barauni (2 x 50 + 2 x 110) 320 BSEB
Muzaffarpur (2 x 110) 220 BSEB**
Thermal Total 540
* BSEB transferred the project to BSHPC on 16th November 2003. ** Now transferred to new JV Kanti Bijlee Utpadan Nigam Ltd. (KBUNL) Source : Report of special task force on Bihar Power Sector, Government of India, 2007
Bihar's Share in Central Sector Power Stations : Consequent upon the bifurcation of the erstwhile
state of Bihar, 70 percent of the generating capacity was transferred to Jharkhand, leaving 70
percent load with present Bihar. The state is now left with only 2 thermal power stations at
Barauni and Muzaffarpur, which are in a dilapidated condition and generates almost no power.
Therefore, Bihar is entirely dependent on the centre for its power requirement. As shown in Table
4.11, around 25 percent of the capacity of 8 central power stations is made available Bihar.
Table 4.11 : Power from Central Power Stations for Bihar
Bihar's share Name of Stations
Capacity (MW) MW Percentage
Farakka STPS 1600 393.92 24.62
Talcher STPS 1000 370.00 37.00
Kahalgaon STPS-I 840 190.76 22.71
Kahalgaon STPS-II 500 33.35 6.67
Tala HPS 1020 260.10 25.50
Chukha HPS 270 80.00 29.63
Rangit HPS 60 21.00 35.00
Teesta HPS 510 108.38 21.25
Total 5800 1457.51 25.13
Source : Bihar State Electricity Board (BSEB)
126

There is severe power shortage in the state and only 41 percent of its villages and 10 percent of the
households are electrified. The peak availability is about 950 MW, causing a peak shortfall of 550
MW, which results in widespread shortage in supply to all categories of consumers. As mentioned
above, Bihar has only 592 MW of installed capacity, of which 540 MW is thermal and the
remaining 47 MW is hydel and 5 MW is renewable energy. However, generation from its own
thermal power stations is negligible, and most of the power requirement is met by purchases from
the central generating plants.
The annual per capita consumption of electricity in Bihar is only 76 units, as against a national
average of 612 units in 2005 (Table 4.12). The National Electricity Policy aims to increase the
average annual per capita consumption to 1,000 units by 2012. This is sought to be achieved by
increasing generation to remove peak electricity shortfalls, as well as implementation of the Rajiv
Gandhi Grameen Vidyutikaran Yojana (RGGVY). Under RGGVY, the aim is to electrify all
villages by 2009 with the help of central government grants.
Table 4.12 : Consumption of Power in Bihar and India (2005)
India Bihar
Villages electrified (%) 84 41
Household electrification (%) 55.8 10.3
Per Capita consumption (units) 612 76
Supply of Energy : Though the supply position from various sources has improved over the years,
there still remains a substantial energy shortage in the state. In 2006-07, the shortage was 1049
MU (11.49 percent) and it stepped upto 1471 MU (15.31 percent) in the next year. The situation in
2008-09 is expected to remain unaltered (Table 4.13).
127

Table 4.13 : Supply-Consumption Pattern of Energy in Bihar Energy in (MU)
Drawal / Consumption 2006-07 2007-08 2008-09
(up to Oct' 08)
Drawal from Central Sector 8051.511 8004.186 4812.94
BSEB Generation after Aux. Consumption
26.593 114.353 28.563
KBUNL Generation to BSEB 00.00 20.711 66.851
Sugar Mill to BSEB 00.00 2.315 2.895
Demand Met 8078.104 8141.565 4911.248
Energy Requirement 9126.900 9613.000 NA
Energy Shortage 1048.796 1471.435 NA
Energy shortage (Percentage) 11.49 15.31 —
Source : Bihar State Electricity Board (BSEB)
During 2004-05, there were over 22.5 lakh consumers of different categories. Out of these, the
major category was domestic consumers (17.3 lakh) and commercial consumers (2.7 lakh). The
details of remaining categories of consumers are presented in Table 4.14.
Table 4.14 : Statement Showing Categorywise Number of Consumers
Number of consumers as on 31st March Category of consumers
1999-00 2000-01 2001-02 2002-03 2003-04 2004-05
Domestic or residential 1600631 1735982 1319096 1465290 1519806 1733195
Commercial 326423 336942 245241 243430 255705 266672
Industrial
(a) Low and Medium Voltage 88434 91216 70207 62879 62440 68098
(b) High Voltage 1710 1778 810 855 870 861
Traction 16 16 7 12 12 12
Irrigation 274671 276953 251180 172086 172141 17498
Public Water Works and Sewage pumping
1391 1449 1187 1199 1208 1203
Public Lighting 6108 6108 4069 1478 1480 1500
Supplies in bulk to distributing licensees
1 1 1 1 1 1
Total 2299385 2450445 1891798 1947230 2013663 2246522
Rural Electrification : There are 39,015 villages in the state, out of which 20,503 villages were
electrified upto 2006. This reveals that a little more than 50 percent villages were electrified in
128

2006 as against only 41 percent in 2005. Again, out of 38 districts in the state, 9 districts do not
have a single electrified village. The Bihar Renewable Energy Development Authority (BREDA),
apart from being responsible for renewable energy based power in Bihar, has been made the nodal
agency for the rural electrification in the state. It will take up rural electrification work in those
villages which are not easily inaccessible. The preparatory survey work of such villages has
started. The selected villages and households will be provided access to electricity under the Rajiv
Gandhi Grameen Vidyutikaran Yojana (RGGVY) of the central government.
Energy Requirement Forecasts : The Special Task Force on Bihar's Power Sector of the central
government in its report in 2007 has made energy requirement forecasts upto the year 2021-22
(Table 4.15). It clearly indicates the widening gap between the peak load and energy requirement.
These forecasts warrant an emphasis on increasing the peak load to more than six times by the
year 2021-22 so as to equal the energy requirement.
Table 4.15 : Energy Requirement : Forecasts
Year Peak Load
(MW) Energy Requirement
(MU)
2006-07 1570 9629
2007-08 1842 11194
2008-09 2177 12874
2009-10 2575 14886
2010-11 3046 17213
2011-12 3607 19905
2016-17 5598 32857
2021-22 9567 58248
Source : Report of the Special Task Force on Bihar's Power Sector; GOI, 2007
Transmission System : The supply of electricity in Bihar by the BSEB is organised through its
seven area boards. With a view to strengthen the sub-transmission and distribution system, a
comprehensive scheme has been formulated to be implemented in phases as presented in Tables
4.16 and 4.17.
129

Table 4.16 : Implementation of Bihar Sub-Transmission Scheme in Phases
Phase
Approved Estimated
Cost (Rs. Crore)
Works status Implemen-tation by agency
Remarks
Phase-I 552.00 Construction of 18 Nos. of Sub station with associated transmission lines.
PGCIL Completed
Phase-II
PGCIL portion Construction of 9 no GSS with associated transmission lines, re-conductoring of old lines, augmentation of 22 nos GSS and stringing of second circuit etc – to be done by PGCIL.
PGCIL Work under execution.
Part-I 629.22 (Original) 1005.72 (Revised)
BSEB portion Spillover work of Begusarai GSS. Begusarai – Purnea line and Renovation and Modernization of 8 no. GSS by BSEB – Work under execution at
Begusarai GSS and R&M of 04 No. GSS.
– Tender under finalisation of Begusarai Purnea line and GSS.
– Tender re-invited for R&M of 04. no. GSS.
BSEB Work under execution
Sanctioned under Part-II of Phase-II Under implementati
on
PGCIL Portion. Completion of 16 no. GSS with associated transmission lines, augmentation of 12 no. GSS etc.
PGCIL Work awarded
initial activity started
Part-II 1240.86
BSEB Portion. Spillover work of Hajipur GSS, Restoration of Over Head Ganga Crossing etc.
BSEB Tender invited.
Tender under process.
Table 4.17 : Financial Status of Sub-Transmission Scheme as on December 31, 2007
Amounts (Rs. crore)
Description Phase-I
Phase-II Part-I
Phase-II Part-II
Total Sanctioned Project Cost 552.40 1005.72 1240.86
Fund Received 552.40 409.66
Payment Released to Agency 442.00 393.00
Available fund 110.40 16.66
130

Future Power Generation : The state government is concerned about the existing poor power
position in the state and is making new efforts to ameliorate the situation. The BSEB and BSHPC
has proposed to set up 2 thermal power plants and 6 hydro plants with a total installed capacity of
4146 MW. The details of proposed power projects in the state are presented in Table 4.18.
Table 4.18 : New Proposed Power Plants
Name of Project Installed Capacity
(MW) Agency
Hydro
Indrapuri Reservoir 450 BSHPC
Telhar Kund PSS 400 BSHPC
Sinafdar PSS 345 BSHPC
Panchghotia PSS 225 BSHPC
Hathiadah-Durgawati PSS
1600 BSHPC
Dagmara Barrage 126 BSHPC
Sub Total 3146
Thermal
Barauni Extention 500 BSEB
Muzaffarpur Extention 500 BSEB
Sub Total 1000
Total 4146
Under the joint venture of BSEB and NTPC, a new power plant is being installed at Nabinagar in
the district of Aurangabad. Again, three thermal power stations are proposed to be set up under
public and private sector at Chausa in Buxar, Kajra in Lakhisarai and Pirpainti in Bhagalpur. A
nuclear power plant with a capacity of 2800 MW is also planned at Rajauli, for which the central
government has already been requested (Appendix V).
During the Eleventh Plan, the peak demand for electricity is expected to surge as Bihar is a major
beneficiary of the RGGVY scheme which will give new villages and households access to
electricity. The industrial demand for power is also expected to increase substantially in the wake
of the state government's new Industrial Policy, 2006. The Electricity Act, 2003 and the National
Electricity Policy provide an enabling framework for the power sector at the national level. In
order to realise the objectives of the Eleventh Plan, the state government has also adopted a state-
131

level power policy, keeping in mind its specific requirements. The state has also begun the process
of unbundling state electricity services for improving the functioning of the BSEBs.
Renewable Energy Sources : The generation of renewable energy has a significant role in Bihar,
especially in the biomass and small hydro section. Given the predominantly agrarian nature of the
economy, such energy is both sustainable and economically viable in Bihar. Further, since both
the plateau and riverine belts in Bihar have sufficient wind speeds, the state is also suitable for
wind power generation. The potential for wind energy in Bihar is shortly to be taken up for
assessment under the sanction of the Ministry of Non-Conventional Energy Sources. To encourage
local private participation in renewable power generation projects, the incentives are being worked
out. These projects may also include solid waste management projects and decentralized
distribution generation (DDG).
Power Reforms
In the power sector, the state government is planning a number of reforms. In particular, this
includes :
(i) To augment generation and distribution by encouraging private investment.
(ii) To bring down Average Transmission and Commercial losses (AT&C) by 5 percent p.a. in
the next five years.
(iii) To stop cross-subsidy and recover costs
(iv) To reorganise SEB into 8 companies. The Power Finance Corporation has appointed
consultants for the proposed reorganization.
(v) State Regulatory Commission is in place and application has been filed for tariff revision.
(vi) To appointment franchisee in all 11 KV distribution lines is to be completed for improving
customer services and boosting revenue collection. Already 31 such lines have been handed
over to private parties for maintenance, minor repairs, fuse calls, billing and revenue
collection and revenue has increased substantially in most of them and in some nearly by 100
percent.
132

4.5 Irrigation
Bihar's economy is primarily agricultural and, therefore, irrigation assumes great significance for
its overall growth. Though the state lies in a humid zone with annual rainfall of around 1200 mm
which is sufficient for kharif crops, its occurrence and spread are highly erratic and seasonal in
character. Therefore, in order to save agriculture from the uncertainties of monsoon and facilitate
multi-cropping, assured irrigation becomes a sine qua non for agricultural development. Against
this backdrop, it becomes imperative to assess the ultimate irrigation potential existing in the state.
Taking both the surface and groundwater sources, the ultimate irrigation potential of the state is
estimated at 103 lakh hectares, which works out to 7.34 percent of India's 140 million hectares.
Thus, the state has enough of irrigation potential to take care of a situation where the cropping
intensity increases to 200 percent from the present 143 percent.
Bihar has a total irrigation capacity of 98.38 lakh hectares, of which 53.53 lakh hectares are under
major and medium irrigation and 49.56 lakh hectares are under minor irrigation. The sourcewise
irrigated area under different sources is presented in Table 4.19. From the table, it may be
discerned Table 4.19 : Sourcewise Irrigated Area
(`000 hectares)
Minor Irrigation
Year Major / Medium
Canal surface
M.I
Tank (including
Aher & Pyne
system)
Tube well (Private & State)
Other Well
(irrigation Well)
Other Sources (L.I. &
Barge L.I
Total
2000-01 1211.55 29.22 332.56 2310.06 145.84 3.26 2820.93 2001-02 1082.03 23.25 332.56 2308.71 145.79 3.56 2813.87 2002-03 1150.12 28.69 332.56 2474.77 145.79 3.20 2985.00 2003-04 1170.36 34.88 332.56 2650.38 145.79 1.95 3165.56 2004-05 1043.47 17.56 431.21 2664.00 121.01 6.23 3240.01 2005-06 998.30 19.86 332.56 2643.21 145.79 28.23 3169.65 2006-07 1086.79 29.34 332.56 2710.60 145.79 23.33 3241.52 2007-08 1155.79 29.80 332.56 2701.19 145.79 15.12 3224.45 2008-09 1263.43 Not updated, Final figure will be possible in April, 2009
Explanation :
Canal Surface M.I. : Schemes of Weirs, Sluicegates, Dams of M.I. Sector
Tank including Ahars & Pynes : Irrigation Tanks, Ahar & Pyne (Traditional Irrigation system under M.I. sector.
Tubewell : It includes both State Tubewells beyond 70 m. depth having (150 mm. x 200 mm.) diameter and private tubewells having upto 70 m. depth and 100 mm. diameter.
Other sources : It includes mostly surface Lift Irrigation Schemes with lifting arrangement on floating barges, stationary pump houses or stationary river pump sets.
133

that, while more than half the area gets irrigation through minor sources, around 98 percent of
minor irrigation is through tubewells. Since state tubewells are less in number, it is the private
tubewells which are very important as an irrigation source in Bihar. In 2006-07, 5130 state
tubewells were operation, out of a total of 5556 state tubewells. Again, out of a total of 10.97 lakh
private tubewells, 9.55 lakh were operational. It is also observed from the above table that the the
area under major/medium sources of irrigation has fluctuated much over the years. Among the
different components of minor irrigation, it is the area irrigated thorough tubewells that has
registered a steady increase over the years.
Interlinking of Rivers : The state suffers from the endemic problem of both floods and drought at
the same time. While the entire north Bihar is prone to recurrent floods, southern portion is prone
to acute droughts. Keeping these menaces in view, interlinking of rivers has been identified as a
viable initiative for proper water management in the state. An Expert Committee constituted by
the state government has recommended that the state should opt for intra-state linking of rivers,
rather than the inter-state part of the scheme.
In the light of the recommendations of the Expert Committee, 4 schemes have been identified in
the flood sector and 9 in the irrigation sector by the state government and more are in the process
of identification. The state government is planning to conduct the feasibility studies of the
identified schemes of intra-state linking of rivers during the first half of Eleventh Plan period.
After prioritising the schemes, their implementation will commence as an important component of
the Eleventh Plan. The support of the central government will be sought for implementation of the
scheme.
Accelerated Irrigation Benefit Programme (AIBP) : The central government has brought
significant changes in its Accelerated Irrigation Benefit Programme (AIBP) initiated in 1996-97.
Under this programme, the loans given to the state governments is being treated as grant with
effect from 2007-08. The list of schemes taken up under the programme so far alongwith their
status presented in Table 4.20.
134

Table 4.20 : Status of AIBP Schemes in Bihar
Name of Projects Year of
Inclusion Status
Western Kosi Canal Project 1996-97 Under Progress
Upper Kiul Reservoir Project 1996-97 Completed
Durgawati Reservoir Project 1996-97 Pending due to Forest Clearance
Orni Reservoir Project 1997-98 Completed
Bilasi Reservoir Project 1997-98 Completed
Bansagar Reservoir Project 1997-98 Execution Under M.P. Government
Sone Canal Modernization Project 1998-99 Under Progress
Batane Reservoir Project 2000-01 Under Progress
Punpun Barrage Project 2007-08 Under Progress
As may be observed, out of the above nine projects, three projects, namely, Bilasi Reservoir
Project, Upper Kiul Reservoir Project and Orni Reservoir Project have been completed and the
remaining six projects are under different stages of execution. The details of expenditure for on-
going projects under execution in Bihar under AIBP are presented in Table 4.21. It is discerned
from the table above that, under these six projects, around 1973 thousand hectares of irrigation
potential has been created by the end of 2007-08.
Table 4.21 : Details of Expenditure of On-going Projects under AIBP (Rs. crore)
Name of the Project Total
Estimated Cost / year
CLA received
upto 3/2008
Exp. on works upto
3/2008
Target date of
completion
Ultimate Irrigation Potential
Potential Created
upto 3/2008 in thousand
hect.
W Kosi Canal Project 1383.02/06 212.968 627.78 June, 09 234.80 150.000
Durgawati Res Project 529.38/02 65.09 268.115 March, 09 36.317 16.020
Sone Canal Mod. Project 745.54/05 163.749 498.209 Dec., 08 906.412 890.000
Batane Res. Project 63.00/04 3.335 66.501 March, 09 9.870 7.380
Punpun Barrage Project 199.41/05 11.25 38.97 March, 09 13.680 Nil
Bansagar Res. Project (State Share)
263.74/98 83.500 219.562 — Stabilization of 909.41 thousand hect. of Sone
Canal
135

Minor Irrigation : To meet the irrigation needs, about 1.65 thousand hectare of additional
potential will be created and 4 lakh hectares of lost potential will be restored through minor
irrigation schemes. Such schemes will also include rennovation and restoration of Ahars and
Pynes, which are traditional methods of irrigation. Under the Bharat Nirman Programme, the
irrigation potential of 80 thousand hectares will be added by completing surface schemes under
RIDF (Phase XII) through repair, rennovation and restoration during the first two years of the
Eleventh Plan period. An additional 85,000 hectares of potential will be created under minor
irrigation scheme during the next three years of the Plan. Under RSVY, about 8000 Ahars and
Pynes will be repaired and renovated, thereby restoring about 4 lakh hectare of lost potential.
The ultimate potential of groundwater resources for irrigation is 48.57 lakh hectares, of which 29
lakh hectares of potential has been created by 2006-07. Similarly, out of the irrigation potential of
15.44 lakh hectare under surface scheme including Ahars and Pynes, 7.27 lakh hectares potential
has already been created. As may be seen from Table 4.22, out of a total minor irrigation potential
of 64.01 lakh hectares, a potential of 36.26 lakh hectares has been realized and 31.70 lakh hectares
have been utilised.
Table 4.22 : Potential and Utilisation of Minor Irrigation in Bihar (Area lakh hectare)
Minor Irrigation Potential in Bihar Surface schemes including traditional ahar and pynes 15.44
Groundwater utilisation schemes of open wells, shallow tube wells, deep tube wells
48.57
Total 64.01
Minor Irrigation Potential Realised
Groundwater schemes 28.99
Surface water schemes 7.27
Total 36.26
Irrigation Potential Utilised
Surface water including lift and barge schemes 0.49
Surface water ahar, pynes and traditional system 3.32
State Tubewells 0.25
Private tubewells and irrigation wells 27.64
Total 31.70
Participatory Irrigation Management (PIM) : There is a growing acceptance of the fact that the
maintenance and management of the irrigation system should be transferred to the beneficiaries
themselves. The National Water Policy also subscribes to this view. The state government has
made significant progress in this direction by transferring the operation, maintenance and upkeep
of 32 distributaries aggregating a total command area of 1,10,549 hectares, to Water Users
136

Associations (WUAs) (Table 4.23). The overall strategy is to decentralise the delivery system of
all the irrigation system to the WUAs by the end of the Eleventh Plan period.
Table 4.23 : Progress on Transfer of Maintenance to WUAs
Number of systems transferred to WUA 32 Number of farmers societies registered 07 Number of societies who have applied for registration
38
Number of societies whose applications are being formalised
15
Number of societies in the process of being formed
518
4.6 Airways
Practically, airways in Bihar are yet to develop. Patna, being the capital of the state, is on the air
route from Delhi to Kolkata. It is also connected with Mumbai by air. Regular air services from
Patna are also available for Ranchi and Lucknow. Among the districts, Gaya has also an
international airport connecting Bangkok for facilitating the visit of foreign tourists to Bodh Gaya.
Other district headquarters, except the newly created ones, have airstrips with landing facilities for
small aircrafts.
Besides Indian Airlines, Jetlite, Kingfisher and Jet Airways also operate from Patna airport.
During 2008, Indian Airlines ferried 1.23 lakh passengers to and from Patna, generating a revenue
of Rs. 21.85 crore. The Kingfisher, which operates only on Patna-Delhi and Patna-Kolkata sectors,
had a passenger traffic of 40 thousand, whereas Jetlite operating on four sectors, had a little over
27 thousand passengers during the period. Jet Airways operated only on Patna – Delhi sector and
reported only 17.4 thousand passengers. The details are presented in Table 4.24. In order to attract
tourists and investors to Bihar, it is necessary to develop the airports so that different airways may
introduce their flights in various sectors with better connectivity.
Table 4.24 : Air Passenger Traffic from Patna (January – December, 2008)
Traffic Indian
Airlines Jetlite Kingfisher Jet
Passenger Traffic (No.)
Patna-Delhi Sector 51967 14222 28273 17352 Delhi-Patna Sector 65098 - - - Patna-Bombay Sector 2637 9682 - - Patna-Kolkata Sector - - 11757 - Patna-Lucknow Sector - 599 - - Patna-Ranchi Sector 3390 2519 - -
Revenue Generation (Rs. Crore) Patna-Delhi Sector 21.85 - - -
137

4.7 Telecommunication
In the field of telecommunication, there are various players — BSNL, Reliance, Bharti Airtel,
ABTL (IDEA), Vodaphone Essar and Dishnet wireless. The total number of GSM subscribers in
November 2008 registered a phenomenal increase to 1.24 crore, compared to only 9.70 lakh
subscribers in 2004-05. Among different operators, Bharati Airtel reported the highest number of
subscribers (64.19 lakh). Among the major operators, each with more than 2 lakh subscribers, the
growth in number of subscribers was the highest for Bharti Airtel and the lowest for BSNL
(Table 4.25).
Table 4.25 : GSM Subscribers in Bihar
Operators 2004-05 2005-06 2006-07 2007-08 2008-09
CAGR (%) of (Base year) to 2007-08
Reliance Telecom 360755 510396 1120530 1719183 2471519 73 BSNL 405447 927557 1267858 1629977 2136482 57 Bharti Airtel 203782 907913 2302105 4335371 6419357 175 Dishnet Wireless - - 27080 664991 1162312 2356 ABTL (IDEA) - - - - 149037 - Vodafone Essar - - - - 76349 -
Total 969984 2345866 4717573 8349522 12415056 105
As regards revenue collection, among the reporting operators, Bharti Airtel showed the highest
collection in 2007-08 which was an account of more number of subscribers. Bharti Airtel also
reported a little more than 100 percent growth between 2006-07 and 2007-08 (Table 4.26).
Table 4.26 : Companywise Revenue Collection in Bihar
Operators 2006-07 2007-08 2008-09 (Upto
September)
CAGR (%) of 2004-05 to
2007-08 Reliance Telecom 201.81 306.53 186.73 51.89 Bharti Airtel 509.33 1022.27 706.66 100.71 Dishnet Wireless - 41.40 40.32 -
Total 711.14 1370.20 933.71 92.68
4.8 Postal Facilities
Post offices have been playing the role of providing connectivity to the remotest places in rural
areas. Upto March, 2008, there were as many as 9,057 post offices in the state, of which around 95
percent were in rural areas (Table 4.27). But the rural areas were mostly serviced by extra-
departmental post offices (92 percent). Nearly all the post offices, either departmental or extra
138

departmental, were granted permanent status. There were only 6 night post offices and these were
located in urban areas only. In all, around 25 thousand letter boxes were there in the state in 2008.
Post boxes, numbering 911, were operating only from urban areas.
Table 4.27 : Postal Facilities in Bihar
Postal Facilities (Nos.) (As on 31.03.2008)
Urban Rural Total
Post Office 432 8625 9057
Departmental Post Office 397 646 1043
Extra Departmental Post Office 35 7979 8014
Permenant Post Office 411 8528 8939
Temporary/Experimental Post Office 23 92 115
Night Post Offices 6 0 6
Letter Boxes 2831 22129 24960
Post Boxes 911 0 911
Source : Chief Postmaster General, Bihar Circle
The total unregistered postal traffic in the state in the year 2007-08 was of the order of 9.54 crore;
whereas the number of the registered articles were 23 lakh only (Table 4.28).
Table 4.28 : Postal Traffic in Bihar
2006-07 2007-08
Total Unregistered Articles of Letter Mail 96725915 95877483
Total Registered Articles of Letter Mail 1939606 2308012
Source : Chief Postmaster General, Bihar Circle
Again, during the year 2007-08, there were 13.26 lakh accounts of different categories in the post
offices of the state with the total deposited amount of Rs. 2,600 crore. The term and recurring
deposits attracted the highest amount of Rs. 733 crore each, followed by Monthly Income Scheme
having deposit of Rs. 522 crore (Table 4.29)
139

Table 4.29 : Post Office Accounts in Bihar
Category of Accounts 2007-08
Savings 165.31
Recurring Deposits 722.86
Term Deposits 733.76
Monthly Income Scheme 522.73
Public Provident Fund 32.84
Senior Citizen's Account 423.35
Total 2600.84 Source : Chief Postmaster General, Bihar Circle
140
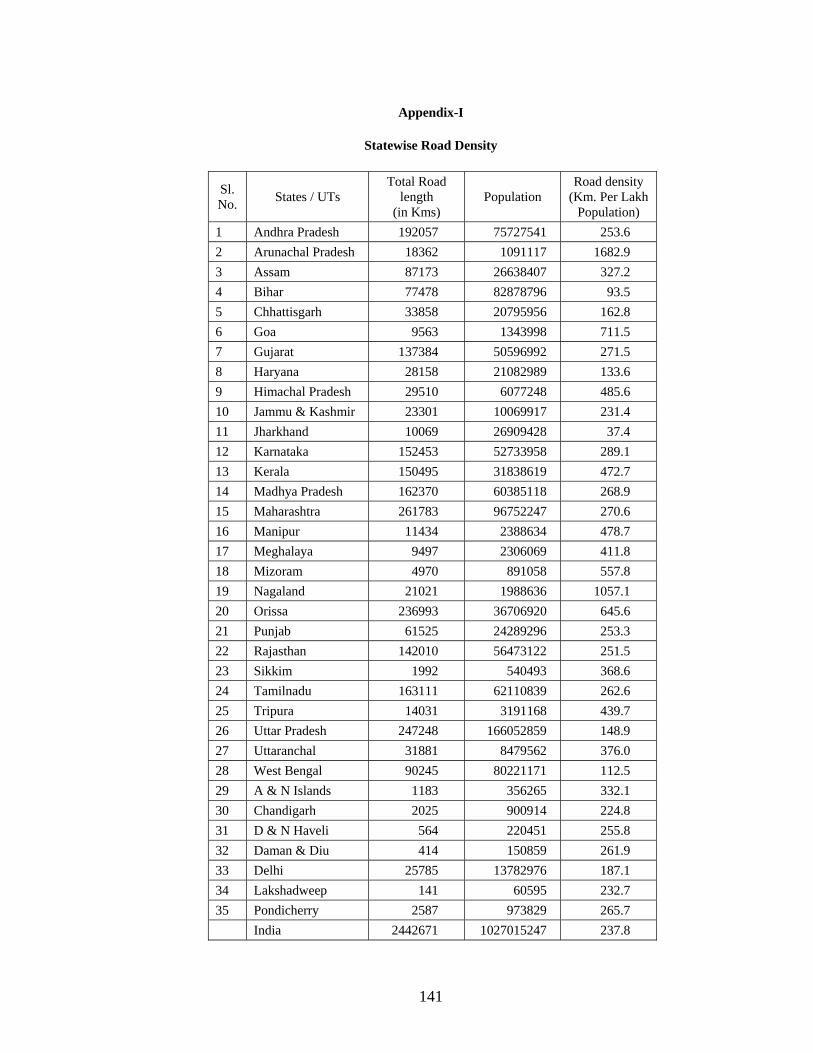
Appendix-I
Statewise Road Density
Sl. No.
States / UTs Total Road
length (in Kms)
Population Road density
(Km. Per Lakh Population)
1 Andhra Pradesh 192057 75727541 253.6
2 Arunachal Pradesh 18362 1091117 1682.9
3 Assam 87173 26638407 327.2
4 Bihar 77478 82878796 93.5
5 Chhattisgarh 33858 20795956 162.8
6 Goa 9563 1343998 711.5
7 Gujarat 137384 50596992 271.5
8 Haryana 28158 21082989 133.6
9 Himachal Pradesh 29510 6077248 485.6
10 Jammu & Kashmir 23301 10069917 231.4
11 Jharkhand 10069 26909428 37.4
12 Karnataka 152453 52733958 289.1
13 Kerala 150495 31838619 472.7
14 Madhya Pradesh 162370 60385118 268.9
15 Maharashtra 261783 96752247 270.6
16 Manipur 11434 2388634 478.7
17 Meghalaya 9497 2306069 411.8
18 Mizoram 4970 891058 557.8
19 Nagaland 21021 1988636 1057.1
20 Orissa 236993 36706920 645.6
21 Punjab 61525 24289296 253.3
22 Rajasthan 142010 56473122 251.5
23 Sikkim 1992 540493 368.6
24 Tamilnadu 163111 62110839 262.6
25 Tripura 14031 3191168 439.7
26 Uttar Pradesh 247248 166052859 148.9
27 Uttaranchal 31881 8479562 376.0
28 West Bengal 90245 80221171 112.5
29 A & N Islands 1183 356265 332.1
30 Chandigarh 2025 900914 224.8
31 D & N Haveli 564 220451 255.8
32 Daman & Diu 414 150859 261.9
33 Delhi 25785 13782976 187.1
34 Lakshadweep 141 60595 232.7
35 Pondicherry 2587 973829 265.7
India 2442671 1027015247 237.8
141

Appendix-II
Districtwise Road Length
Length (Km) Sl. No.
District NH SH MDR Total
1 Banka 0.00 175.35 128.10 303.45
2 Bhagalpur 146.00 82.00 123.75 351.75
3 Jamui 0.00 220.00 142.55 362.55
4 Lakhisarai 45.21 58.84 31.79 135.83
5 Munger 38.57 35.00 45.20 118.77
6 Sheikhpura 12.00 52.90 87.25 152.15
7 Bhojpur 85.00 93.57 282.83 461.40
8 Kaimur 52.24 99.40 208.30 359.94
9 Buxar 55.00 80.15 99.67 234.82
10 Rohtas 145.24 234.80 369.70 749.74
11 Nalanda 177.07 157.00 167.95 502.02
12 Patna 394.90 151.36 368.56 914.82
13 Aurangabad 137.23 90.10 150.05 377.38
14 Gaya 119.50 226.80 256.72 603.02
15 Jehanabad & Arwal 134.23 42.40 177.70 354.33
16 Nawada 84.30 137.63 106.40 328.33
17 Begusarai 95.89 42.00 199.47 337.36
18 Madhubani 207.75 107.00 221.90 536.65
19 Darbhanga 49.00 202.06 276.10 527.16
20 Samastipur 65.51 132.00 316.80 514.31
21 Saran 180.50 117.70 203.94 502.14
22 Gopalganj 96.43 52.15 310.89 459.47
23 Vaishali 127.61 84.00 168.74 380.35
24 Siwan 54.00 125.40 208.51 387.91
25 West Champaran 112.00 47.20 305.95 465.15
26 East Champaran 94.00 95.60 285.68 475.28
27 Muzaffarpur 229.20 70.33 404.07 703.60
28 Sheohar 22.00 13.64 33.00 68.64
29 Sitamarhi 102.00 50.42 199.20 351.62
30 Araria 85.00 112.00 267.16 464.16
31 Katihar 90.00 54.00 379.46 523.46
32 Kishanganj 0.00 78.60 412.30 490.90
33 Purnea 103.00 120.80 249.15 472.95
34 Khagaria 92.30 0.00 184.55 276.85
35 Madhepura 109.00 100.48 94.60 304.08
36 Supaul 133.00 181.54 474.87 789.41
37 Saharsa 59.70 43.00 213.69 316.39
Source : Road Construction Department, Bihar
142

Appendix - III
New Initiatives Taken by Department of Transport
1. All 38 districts Transport Offices and 9 RTA Offices are being computerized. Under the
computerization plan driving license and vehicle registration are to be issued in Smart-card.
This is being done on the software 'Vahan and Sarathi' developed by NIC. Presently the
driving license based on Smart-card is being issued by the District Transport Office, Patna
since May 2008 on pilot basis. Now this will be implemented in other district also. The
Central Ministry of Road Transport & Highways has agreed to supply computer hardware
amounting to nearly Rs. 6.00 crore for computerisation of District Transport Offices.
Government of Bihar has provided Rs. 3.70 crore for computerisation.
2. To promote Inland Water Transport, RITES has been appointed as consultant to survey Kosi,
Gandak, and Sone rivers in order to make them navigable.
3. Transport Department has plans to build building for the District Transport Offices in all the
districts. The Transport Department intends to develop District Transport Office as a
transport public service complex under the PPP model. Infrastructure Development
Authority has been requested to prepare the plan and implement the scheme for the new
DTO buildings and service complexes.
4. Integrated check-post are being built at six entry points in the State. Each check-post will
have 4 to 6 weigh-bridges. This will facilitate transport department to enforce motor vehicle
rules and check overloading. In addition, the Transport Department is also installing 3 to 4
weight-bridges at different points at major cross roads.
5. Transport Department has taken initiative to strengthen the RTAs/STAs to rationalise of tax
structure and to strengthen the enforcement mechanism. For this purpose, the department is
collaborating with Administrative Reforms Mission on following works–
(i) Tax reforms/ rationalisation in transport sector in Bihar-Policy Document.
(ii) Suggesting appropriate regulatory framework for strengthening/ restructuring RTAs/
STAs and devising a framework for route allocation and technology interventions- First
Phase Report : Patna & Gaya RTAs.
(iii) Restructuring/ strengthening of enforcement framework of Transport Department.
143

Appendix IV
Details of Schemes – Under Execution by the Corporation
Schemes against fund received
Sl. No. Name of Schemes Target Taken up
No. of Schemes to be taken up against the fund to be received
Remarks
1 2 3 4 5 6
1. Model P.S. 34 34
2. Grade IV P.S. 09 08
3. Grade III P.S. 36 35
4. District Communication Centre
31 30
5. District Control Room 40 39
6. State Plan 07-08 69 65
7. Training works 27 27
8. L.S.Qr (Lower Subordinate Quarter)
1452 1190 98
9. U..S.Qr (Upper Subordinate Quarter)
622 450 28
10. Mahila Police Barrack 24 23 -
11. Community Toilets - - 21
12.
13. New Buildings 4
14. Repairs 7
15. RCC roof with Column 16
16. Barrack with toilet 37
17. Water supply system 24
18. Solar light 24
19. Compound wall 2
20. Safety by Solar Light System 1
144

145
Appendix-V
Upcoming Power Projects of Bihar
Place Capacity Agency
(A) Under Public Sector
BSEB (i) Extension of BTPS, District – Begusarai 2 x 250 MW BSEB
(ii) Extension of MTPS, Kanti, District-Muzaffarpur 2 x 250 MW BSEB
(B) Under Joint Venture
(i) Installation of new Power Plant under JV of GOB / BSEB & NTPC at Nabinagar, District – Aurangabad
3 x 660 MW BSEB
(C) Under Private / Public Sector through tariff based bidding
(i) Buxar Thermal Power Station at Chausa, District-Buxar 2 x 660 MW BSEB
(ii) Lakhisarai Thermal Power Station at Kajra, District-Lakhisarai 3 x 660 MW BSEB
(iii) Pirpainti Thermal Power Station at Pirpainti, District-Bhagalpur 2 x 660 MW BSEB
(D) Under PP through MOU signed
(i) M/s Jas Infrastructure Capital Pvt. Ltd., Patna at Banka, Bhagalpur 3 x 660 MW BSEB
(ii) M/s Vikas Metal and Power Ltd., Kolkata, at Begusarai 500 MW BSEB
(iii) M/s Nalanda Power Company Ltd., Kolkata, at Pirpainti, Bhagalpur 2000 MW BSEB
(iv) M/s Adhunik Power and Natural Resources Ltd., Kolkata, at Pirpainti 1000 MW BSEB
(E) Approved by SIPB
(i) M/s Subhas Project & Marketing Ltd., Kolkata at Lakhisarai 1200 MW BSEB
(ii) M/s IL & FS, New Delhi, at Motipur Block, Muzaffarpur 500 MW BSEB
(iii) M/s India Power Corporation Ltd., Kolkata, place not identified 1650 MW BSEB
(iv) M/s Triton Energy Ltd., Gurgaon, Haryana, at Nabinagar, Aurangabad 1320 MW BSEB
(v) M/s Krishak Bharti Co-operative Ltd., New-Delhi (place not identified) 1320 MW BSEB
(vi) M/s Cement Manufacturing Company, Ltd., Kolkata (place not identified) 500 MW BSEB
(F) Nuclear Power Project
(i) NPCIL has been requested for installation of Nuclear Power Plant at Rajauli 4 x 700 MW BSEB
* BSEB has also initiated to procure 1200 MW power through competitive based bidding process under case-I as per guidelines of MOP, GOI vide resolution dated 19-01-2005

CHAPTER V
SOCIAL SECTORS
In terms of human development, as measured by the Planning Commission in its National Human
Development Report, 2001, Bihar was at the lowest position among the major states in India in
1981, 1991 and 2001. The same pattern is replete in its ranking with respect to Per Capita Income.
It must be noted that in the period since 1999, while India’s per capita GDP has increased very
fast, its international ranking in HDI has slipped from 115 in 1999 (Human Development Report
2001) to 128 in 2005 (Human Development Report 2007/2008). Thus, the quality of human life in
the country as a whole compared to the rest of the world has not improved in the period of
accelerated economic growth. The annual growth rate of Bihar’s per capita income has been 3.77
percent in the last ten years. In Bihar, the twin challenges of economic growth and human
development are further accentuated by its high poverty ratios and low per capita income.
However, the rate of decline of poverty has been higher in Bihar compared to the national average.
In the following sections, a detailed overview of developments in social sector in Bihar has been
presented, emphasizing its various aspects like literacy and education, demography and health,
labour, employment and poverty, rural development and interventions for oppressed and
marginalised groups.
5.1 Literacy and Education
Literacy
The overall literacy rate in India in 2001 was 65.4 percent while in Bihar it was 47.0 percent. The
female literacy rate in Bihar in 2001 was much lower at 33.6 percent, as against a national average
of 54.2 percent. The female literacy rate is the single most crucial indicator of social development
of a region. For example, compared to the national average, Bhojpur and Rohtas are relatively
high on the literacy indicator with literacy rates at 59.0 and 61.3 percent respectively (Table 5.1).
However, the female literacy rates in the two districts are 41.8 percent and 45.7 percent
respectively, as compared to the national average of 54.2 percent. Thus, the gender gap in literacy
in these two districts are the highest at 32.5 percent and 29.6 percent respectively. The distance
from the national average in female literacy was 23 percentage points in Bihar. Patna is the only
district in Bihar where 50 percent of the female population is literate. In Kishanganj, less than 20
146

percent of the women are literate. The male literacy rate is also the lowest in Kishanganj. There is
a 24 percentage point difference in literacy between males and females in Kishanganj. Sheohar
and Madhepura have the lowest literacy rate among SCs at 16.9 and 17.1 percent respectively,
while the highest literacy rate for SC is in Munger (42.6 percent).
Table 5.1 : Districtwise Literacy Rates in Bihar (2001)
Overall Scheduled Castes
District
Total Male Female Total Male Female
Schedu-
led Tribe
General Gender Gap SC
Araria 35.00 46.40 22.40 18.90 21.20 7.10 21.90 24.00 18.20 Aurangabad 57.00 71.10 41.90 35.70 39.10 15.80 49.70 29.20 23.30 Banka 42.70 55.30 28.70 27.60 31.20 10.90 22.20 26.60 20.30 Begusarai 48.00 59.10 35.60 31.40 33.40 14.50 78.60 23.50 18.90 Bhagalpur 49.50 59.20 38.10 33.70 35.30 15.90 37.20 21.10 19.40 Bhojpur 59.00 74.30 41.80 39.10 43.80 16.20 46.70 32.50 27.60 Buxar 56.80 71.90 39.90 37.90 43.70 13.60 44.60 32.00 30.10 Darbhanga 44.30 56.70 30.80 24.70 27.60 9.90 49.50 25.90 17.70 Gaya 50.40 63.30 36.70 26.30 28.80 11.60 49.10 26.60 17.20 Gopalganj 47.50 63.00 32.20 32.10 36.60 13.60 37.80 30.80 23.00 Jamui 42.40 57.10 26.30 24.50 28.30 10.00 26.70 30.80 18.30 Jehanabad 55.30 70.10 39.40 32.60 36.50 13.60 32.40 30.70 22.90 Kaimur 55.10 69.70 38.80 40.50 43.90 16.90 38.60 30.90 27.00 Katihar 35.10 45.30 23.80 26.30 28.30 11.70 24.20 21.50 16.60 Khagaria 41.30 51.80 29.40 24.20 25.70 10.20 46.70 22.40 15.50 Kishanganj 31.10 42.70 18.60 28.20 31.00 11.90 15.30 24.10 19.10 Lakhisarai 48.00 60.70 34.00 26.30 29.50 11.40 12.90 26.70 18.10 Madhepura 36.10 48.80 22.10 17.10 19.40 5.80 33.60 26.70 13.60 Madhubani 42.00 56.80 26.30 22.20 26.10 7.50 35.80 30.50 18.60 Munger 59.50 69.90 47.40 42.60 43.60 23.30 37.30 22.50 20.30 Muzaffarpur 48.00 59.10 35.80 28.90 30.50 14.00 50.40 23.30 16.50 Nalanda 53.20 66.40 38.60 29.40 32.80 11.80 29.80 27.80 21.00 Nawada 46.80 60.60 32.20 22.40 25.90 8.60 20.50 28.40 17.30 W. Champaran 38.90 51.10 25.20 22.30 25.80 7.90 24.10 25.90 17.90 Patna 62.90 73.30 50.80 38.60 40.30 19.40 68.70 22.50 20.90 E. Champaran 37.50 49.30 24.30 20.60 23.60 7.40 34.30 25.00 16.20 Purnea 35.10 45.60 23.40 18.50 20.40 7.40 24.50 22.20 13.00 Rohtas 61.30 75.30 45.70 41.30 44.50 18.10 30.00 29.60 26.40 Saharsa 39.10 51.70 25.30 18.50 20.90 6.70 24.50 26.40 14.20 Samastipur 45.10 57.60 31.70 25.10 27.60 10.40 22.00 25.90 17.20 Saran 51.80 67.30 35.80 33.60 38.00 13.50 48.50 31.50 24.50 Sheikhpura 48.60 61.90 33.90 25.20 28.20 9.60 45.60 28.00 18.60 Sheohar 35.30 45.30 23.90 16.90 19.00 6.40 38.80 21.40 12.60 Sitamarhi 38.50 49.40 26.10 22.20 24.60 8.50 31.40 23.30 16.10 Siwan 51.60 67.30 36.90 35.60 39.30 15.90 44.00 30.40 23.40 Supaul 37.30 52.50 20.80 19.60 23.60 5.70 26.90 31.70 17.90 Vaishali 50.50 63.30 36.60 29.40 31.90 13.00 29.90 26.70 18.90
147

Table 5.1 also shows that, in all the districts of Bihar, the gender gap in literacy among SCs is
lower than it is for the overall population. Historically, the SC population has been more
concentrated in south Bihar. In the four districts of south Bihar where SC population is more than
20 percent of the total, the gender gap in literacy is much lower than the average for the district.
The gender gap among the SC population is 11 percent in Nawada, 9 percent in Gaya and 6
percent in Aurangabad. In Darbhanga in north Bihar, the gender gap is also significantly lower at 8
percent. The overall gender gap is the highest in Bhojpur (the district with the highest proportion
of literate males) at 32.5 percent and the lowest in Bhagalpur at 21.2 percent. Thus, an overall
emphasis on female literacy at the district level to close the gender gap is warranted.
Primary and Secondary Education
Table 5.2 shows the number of children enrolled in primary and upper primary schools in Bihar
between 2003-04 and 2006-07. The overall enrolment at the primary and upper primary level has
increased by 34.5 percent in this period. There has been a 41.5 percent increase in enrolment of
children from SC communities and 80.7 percent increase for ST communities. The enrolment has
significantly improved in upper primary level with an overall increase of 72.8 percent. For SCs,
the enrolment in upper primary has increased by 97.4 percent while, for STs, it has increased by
126.0 percent. The districtwise patterns of enrolment are stated in Appendix I. Araria, Samastipur,
Purnea, Bhojpur and Begusari have seen more than 50 percent overall increase in enrolment. All
the districts, except Begusarai, have also seen more than 100 percent increase in SC enrolment in
the corresponding period.
Table 5.2 : Total Enrolment By Education Levels in Bihar
2003-04 2004-05 2005-06 2006-07 Percentage Increase in Four Years
Primary (I-V) 9732357 10917135 11233590 12527117 28.72
Upper Primary (VI-VIII) 1482460 1936213 2163453 2562318 72.84 All Total (I-VIII) 11214817 12853348 13397043 15089435 34.55
Primary (1- V) 1630643 1803005 1819098 2212091 35.66
Upper Primary (VI-VIII) 170731 236506 250377 336970 97.37 SC Total (I-VIII) 1801374 2039511 2069475 2549061 41.51
Primary ( I-V) 129334 122421 149785 228181 76.43
Upper Primary (VI-VIII) 12240 17037 22101 27666 126.03 ST Total (I-VIII) 141574 139458 171886 255847 80.72
148

Table 5.3 shows the dropout rates at various levels of school education in Bihar in 2004-05 and
2005-06. The dropout rates in Bihar in primary education level have declined by 5 percentage
points between 2004-05 and 2005-06. The decline has been higher in the case of boys, as
compared to girls. However, at upper primary level, there was a very modest decline by just 1
percentage point. At the secondary level, the position has deteriorated with a marginal increase of
dropout rate by 0.01 percent. Indeed, the enrolment figures from Table 5.2 for 2006-07 suggest a
possibility of a larger decline in dropout rates in 2006-07.
Table 5.3 : Dropout Rates at Primary, Upper Primary and Secondary Levels
Primary Year
Total Girls Boys
Upper Primary
Secondary
2004-05 51.59 48.62 53.37 74.69 83.06
2005-06 46.55 45.25 47.37 73.37 83.07
The state government has stepped up both its plan and non-plan expenditure in education as can be
seen in Table 5.4. The expenditure on education has been in keeping with the Twelfth Finance
Commission recommendations since 2005-06. The expenditure is close to 100 percent or more of
both budget and targets.
Table 5.4 : Expenditure on Education
(Rs crore)
Non-Plan Plan
Year 12th FC Target
Expenditure Percent Budget Expenditure Percent
2005-06 3822.65 3776.57 99 438.77 435.48 99
2006-07 4183.58 4189.71 100 594.00 587.74 99
2007-08 4581.02 - 100 300.44 300.44 100
149

Interventions in Primary and Secondary Education
For enrolment of 6-14 year olds among Mahadalit children and to ensure their regular
attendance, UTHAN KENDRA scheme has been implemented in their hamlets.
Talimi Markaj scheme has been started to ensure primary education for disadvantaged
sections in the minority community with targeted teaching facilities in their
hamlets/villages.
Unnayan scheme has been commenced to start residential centres for primary education
of 50 children rescued from child labour in each block
Free textbooks have been distributed among children of Class I to VIII from most
backward castes and minority communities.
Free vocational training for girls between 10-16 years from minority background under
Hunar to attract them to education.
Mukhya Mantri Balika Cycle Yojana has been extended to aided schools including
minority schools. 1.63 lakh girls came under the scheme in 2007-08. in 2007-08.
Mid-Day Meal Scheme (MDMS)Mid-Day Meal Scheme (MDMS)
The Mid Day Meal Scheme, based on the child’s right to enhancement of nutrition, educational
advancement, social equity and hygiene and sanitation, has been an important intervention in both
increasing enrolment and retaining students at the primary level. The MDMS was universalized in
2005 in Bihar covering all primary schools, including learning centres.
Table 5.5 shows the total coverage of children under MDMS at the primary level (Class I-V). The
total number of children covered under MDMS at the primary level is 99.83 lakh. The total
coverage is 72 percent, up from 60 percent in 2006-07, but there is high variation among the
districts. Some of the low coverage districts are Sitamarhi and Supaul (25 percent each), Kaimur
(26 percent), Purnea (29 percent) and Darbhanga (35 percent). The districts with 100 percent
coverage are Gopalganj, Jamui, Munger, Nawada, Saharsa and Sheikhpura.
150

Table 5.5 : Districtwise Coverage of MDMS (Class I-V ) (2008-09)
District Total
Enrolment
No of Children Covered
under MDMS
Coverage (Percentage)
Araria 386949 309559 80 Aurangabad 357841 258349 72 Banka 221394 218959 99 Begusarai 472643 254729 54 Bhagalpur 434422 416937 96 Bhojpur 389878 262363 67 Buxar 225681 187202 83 Darbhanga 750788 261397 35 E. Champaran 789410 681442 86 Gaya 550745 381951 69 Gopalganj 93034 93569 101 Jamui 282770 282770 100 Jehanabad 170063 133054 78 Jehanabad (Arwal) 104381 76593 73 Kaimur 223257 57900 26 Katihar 465566 283103 61 Khagaria 252450 289073 115 Kishanganj 236495 183596 78 Lakhisarai 118077 118077 100 Madhepura 281277 192132 68 Madhubani 588133 430470 73 Munger 146616 146616 100 Muzaffarpur 635214 600086 94 Nalanda 303178 242526 80 Nawada 270183 280916 104 Patna 559075 436563 78 Purnea 502555 147525 29 Rohtas 329926 290637 88 Saharsa 215914 215914 100 Samastipur 641639 483305 75 Saran 435439 347771 80 Sheikhpura 87925 87925 100 Sheohar 102547 43762 43 Sitamarhi 378276 92775 25 Siwan 463359 385842 83 Supaul 371860 94583 25 Vaishali 529560 351482 66 W. Champaran 501570 361625 72 Total 13870190 9983078 72
The scheme has been now extended to the upper primary level in all the districts of Bihar. The
implementation has been far more uniform at this level in the various districts (Table 5.6). The
overall percentage of students covered under MDMS is 81 percent. The districts of Jamui,
151

Jehanabad and Muzaffarpur have 100 percent coverage. All other districts have a coverage of 80
percent, the only exception being Gaya which is at 76 percent.
Table 5.6 : Districtwise Coverage of MDMS (Class VI-VIII) (2008-09)
District Total
Enrolment
No of Children Covered
under MDMS
Coverage (Percentage)
Araria 72161 57729 80 Aurangabad 115965 92772 80 Banka 60107 48086 80 Begusarai 108568 86854 80 Bhagalpur 93269 74615 80 Bhojpur 82873 66298 80 Buxar 69498 55598 80 Darbhanga 126252 101010 80 E. Champaran 214927 171942 80 Gaya 189827 143390 76 Gopalganj 136648 109318 80 Jamui 54255 54255 100 Jehanabad 41200 41200 100 Jehanabad (Arwal) 42968 42968 100 Kaimur 79951 63961 80 Katihar 96403 77122 80 Khagaria 63364 50691 80 Kishanganj 55989 44791 80 Lakhisarai 39459 31567 80 Madhepura 66709 53367 80 Madhubani 168580 134864 80 Munger 43561 34849 80 Muzaffarpur 130276 132764 102 Nalanda 124368 99494 80 Nawada 125158 100126 80 Patna 126942 101554 80 Purnea 100540 80432 80 Rohtas 104400 83520 80 Saharsa 113796 91037 80 Samastipur 169997 135998 80 Saran 231547 185238 80 Sekhpura 26049 20839 80 Sheohar 22413 17930 80 Sitamarhi 154867 123894 80 Siwan 181425 145140 80 Supaul 57826 46261 80 Vaishali 102233 81786 80 W. Champaran 85808 68646 80 Total 3880189 3151907 81
152

The funds sanctioned under MDMS increased from Rs 7.20 crore in 2006-07 to Rs 8.30 crore in
2007-08 under three major components – school level expenses, management and supervision,
internal monitoring and evaluation, and external monitoring and evaluation. All funds sanctioned
for MDMS in 2006-07 were utilized. In 2007-08, the funds under the various components of
school level expenses, management and supervision, training, and internal monitoring and
evaluation were utilised fully. However, an allocation of Rs 1.24 crores for external monitoring
and evaluation could not be utilised leading to an overall utilization of 85 percent (Table 5.7).
Table 5.7 : Fund Utilisation in MDMS
2006-07 2007-08
School Level Expenses Sanctioned (Rs. lakh)
Utilised (Rs. lakh)
Percentage of Utilisation
Sanctioned (Rs. lakh)
Utilised (Rs. lakh)
Percentage of Utilisation
Weighing Machines & Height Recorder
— — — 412.86 412.86 100
Replacement/Repair/Maintenance of cooking devices, utensils, weighing machines etc.
383.11 383.11 100 0 0 -
Management, Supervision, Training and Internal Monitoring & Evaluation
-
Staff salary including salaries for MIS coordinators and data entry operators
220.54 220.54 100 241.88 241.88 100
Transport & Contingencies 10.00 10.00 100 23.46 23.46 100
Other incidental expenses (inc.work related to State, Dsitrict & Block level SMCs
3.25 3.25 100 0.00 0.00 -
Furniture, Computer Hardware and consumables and other incidental expenses
2.50 2.50 100 2.00 2.00 100
Capacity building and training of staff involved in MDM
12.16 12.16 100 21.66 21.66 100
Preparation of relevant manuals for training and capacity building
3.53 3.53 100 0.00 0.00 -
External Monitoring & Evaluation 82.91 82.91 100 123.86 0.00 0
Total 717.99 717.99 100 825.72 701.86 85
153

Higher Education
With a Gross Enrolment Ratio (GER) in higher education at 6.71 percent in Bihar, it is well below
the national average of 9.21 percent. While male GER is close to the national average, there is a
huge gap once again in female GER between Bihar (3.50 percent) and the national average (7.65
percent). The low achievement for girl students accounts for Bihar’s gap with respect to the
national average.
Total 5.8 : Gorss Enrolment Ratio in Higher Education (18-24 Years)
Boys Girls Total
Bihar 9.50 3.50 6.70
India 10.60 7.70 9.20
Note : Figures includes enrolment in Polytechnics
In keeping with the state government’s policy of affirmative action for marginalised and oppressed
sections of society, reservation for various social groups are guaranteed in universities and
colleges (Table 5.9). In addition to caste, community and gender based reservation, 3 percent of
the seats are also reserved for the physically challenged within each category.
Table 5.9 : Percentage of Reserved Seats for Various Social Groups in Universities and Colleges in Bihar
Category Percentage of
Reserved Seats
Schedule Caste 10
Schedule Tribe 1
Economical Backward Class 16
Backward Class 12
Minorities(If any) 0
Women of Backward Classes 3
While there are 12 universities, one open university and 504 colleges and 11 research institutes in
Bihar for higher education, it still lags behind in the number of medical colleges (23) and
engineering and technical colleges (7) (Table 5.10). This is also reflected in the low proportion of
enrolment in medical and engineering/technology courses (Table 5.11-5.13).
154

Table 5.10 : Institutions of Higher Education in Bihar
Type of Institution GovernmentUniversities 12 Open Universities 1 Research Institutes 11 Total Number of Colleges/Institute 504
Government 255 Private (Aided) 4 Private (Unaided) 245
Education/Teacher Training 15 Medical Colleges 23 Engineering/technical College 7 Others 63
Table 5.11 : Coursewise Enrolment is Higher Education in Bihar
Enrolment (in '000)
Courses Ph.D / M.Phil
Post Graduate Degree
Programmes
Bachelor Degree
Programmes Total
Arts Boys 896 14186 179151 194233 Girls 610 1272 31614 33496 Total 1506 15458 210765 227729
Commerce Boys 5748 81575 87323 Girls 778 19686 20464
Total 6526 101261 107787 Science/Computer Science/ Application
Boys 10923 77076 87999 Girls 948 25510 26458
Total 11871 102586 114457 Engineering/ Technology
Boys 5495 5495 Girls 881 881
Total 6376 6376 Medical
Boys 5895 5895 Girls 3858 3858
Total 9753 9753 Education/Teacher Training
Boys 7805 7805 Girls 1088 1088
Total 8893 8893 Others
Boys 28891 28891 Girls 7151 7151
Total 36042 36042
155

Table 5.12 : Coursewise Enrolment of SC Students in Higher Education in Bihar
Enrolment (in '000)
Courses Ph.D / M.Phil
Post Graduate Degree
Programmes
Bachelor Degree
Programmes Total
Arts
Boys 100 1998 18551 20649
Girls 5 114 1527 1646
Total 105 2112 20076 22293
Commerce
Boys 465 13180 13645
Girls 75 995 1070
Total 540 14175 14715
Science/Computer Science/ Application
Boys 1023 12073 13096
Girls 196 1458 1654
Total 1219 13531 14750
Engineering/ Technology
Boys 697 697
Girls 112 112
Total 809 809
Medical
Boys 748 748
Girls 491 491
Total 1239 1239
Education/ Teacher Training
Boys 1303 1303
Girls 22 22
Total 1325 1325
Others
Boys 3572 3572
Girls 935 935
Total 4507 4507
156
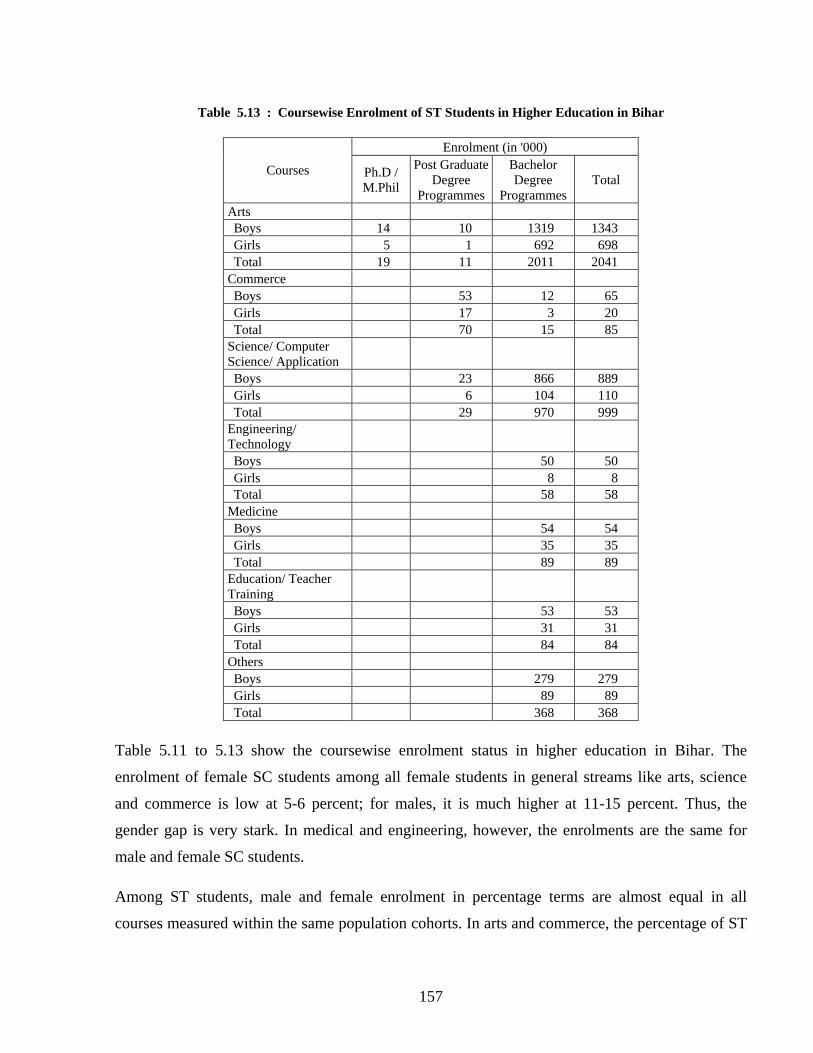
Table 5.13 : Coursewise Enrolment of ST Students in Higher Education in Bihar
Enrolment (in '000)
Courses Ph.D / M.Phil
Post Graduate Degree
Programmes
Bachelor Degree
Programmes Total
Arts Boys 14 10 1319 1343 Girls 5 1 692 698 Total 19 11 2011 2041
Commerce Boys 53 12 65 Girls 17 3 20 Total 70 15 85
Science/ Computer Science/ Application Boys 23 866 889 Girls 6 104 110 Total 29 970 999
Engineering/ Technology Boys 50 50 Girls 8 8 Total 58 58
Medicine Boys 54 54 Girls 35 35 Total 89 89
Education/ Teacher Training Boys 53 53 Girls 31 31 Total 84 84
Others Boys 279 279 Girls 89 89 Total 368 368
Table 5.11 to 5.13 show the coursewise enrolment status in higher education in Bihar. The
enrolment of female SC students among all female students in general streams like arts, science
and commerce is low at 5-6 percent; for males, it is much higher at 11-15 percent. Thus, the
gender gap is very stark. In medical and engineering, however, the enrolments are the same for
male and female SC students.
Among ST students, male and female enrolment in percentage terms are almost equal in all
courses measured within the same population cohorts. In arts and commerce, the percentage of ST
157

males among all males is lower than the percentage of ST females among all females. Overall, the
share of women in higher education is the highest in medicine (39.6 percent), but very low both in
engineering (13.8 percent) and in general courses (between 15 and 20 percent). Education and
teacher training is often assumed to be a ‘feminine occupation’; however, female enrolment is the
lowest in this stream at 12 percent.
Interventions in Higher Education
Classes have started for the first batch of 60 students for Chandragupta Management
Institute.
A bill to establish Aryabhatt Gyan Vishwavidyalaya has been prepared of
accreditation/affiliation and development of all technical and management institutes
in the state.
Upgradation of all medical colleges and teaching hospitals have been undertaken.
5.2 Demography and Health
Bihar had a population of 83.0 million in 2001 implying a high population density of 880 persons
per sq. km. Patna, Darbhanga and Vaishali are the most densely populated districts with density
above 1300 while Kaimur and Jamui have a population density of less than 500. Of Bihar’s total
population, 89.5 per cent live in rural area, making the state the least urbanized among all the
major states in India. Patna is the most urbanized district with a rural population of 58.4 percent.
Munger comes next at 72.1 percent. All other districts have a rural population of over 80 percent,
with 7 districts having a rural population of over 95 percent. The sex ratio in Bihar at 919
females per thousand males is slightly lower than the national ratio at 933, but the child sex ratio
in Bihar is higher than the national average at 942. The sex ratio is the lowest in Munger (872),
Patna (873) and Bhagalpur (876). It is the highest in Gopalganj (1001) and Siwan (1031),
predominantly due to high proportion of male migration. The child sex ration is lower than 920 in
five districts – Saharsa, Munger, Darbhanga, Sheohar and Jehanabad, but it is more than 960 in 9
districts – Araria, Jamui, Gopalganj, Banka, Bhagalpur, Katihar, Purnea, Gaya and Nawada. Some
of these distrtricts are districts with high shares of religious minority and scheduled caste
population. The total share of SC in the population is 15.7 percent. Nalanda, Vaishali, Kaimur,
Aurangabad, Nawada and Gaya have more than 20 percent SC population, while the proportion is
less than 10 percent in Kishanganj and Katihar. The share of religious minorities is more than 35
percent in Purnea, Araria, Katihar and Kishanganj while it is the lowest in Lakhisarai at 4.4
158

percent (Table 5.14). The detailed break up of districtwise population by religion is available in
Table 5.34.
Table 5.14 : Districtwise Demographic Profile of Bihar
Population Density Rural
Population (%)
Sex RatioChild Sex
Ratio
Schedule Caste of
Population (%)
Schedule Tribe of
Population (%)
Minority (%) of
Population
Bihar 82998509 880 89.5 919 942 15.7 0.9 16.6
Araria 2158608 751 93.9 913 963 13.6 1.4 41.1 Aurangabad 2013055 607 91.6 934 943 23.5 0.1 9.7 Banka 1608773 533 96.5 908 965 12.4 4.7 11.8 Begusarai 2349366 1222 95.4 912 946 14.5 0.1 13.4 Bhagalpur 2423172 946 81.3 876 966 10.5 2.3 17.5 Bhojpur 2243144 903 86.1 902 940 15.3 0.4 7.3 Buxar 1402396 864 90.8 899 925 14.1 0.6 6.2 Darbhanga 3295789 1442 91.9 914 915 15.5 0.0 22.7 E. Champaran 3939773 991 93.6 897 937 13.0 0.1 19.2 Gaya 3473428 699 86.3 938 968 29.6 0.1 11.6 Gopalganj 2152638 1057 93.9 1001 964 12.4 0.3 17.1 Jamui 1398796 451 92.6 918 963 17.4 4.8 12.2 Jehanabad 1514315 963 92.6 929 917 18.9 0.1 8.2 Kaimur (Bhabhua) 1289074 382 96.8 902 940 22.2 2.8 9.5 Katihar 2392638 782 90.9 919 966 8.7 5.9 42.5 Khagaria 1280354 859 94.0 885 932 14.5 0.0 10.3 Kishanganj 1296348 687 90.0 936 947 6.6 3.6 67.6 Lakhisarai 802225 652 85.3 921 951 15.8 0.7 4.4 Madhepura 1526646 853 95.5 915 927 17.1 0.6 11.4 Madhubani 3575281 1020 96.5 942 939 13.5 0.0 17.9 Mungher 1137797 800 72.1 872 914 13.3 1.6 7.9 Muzaffarpur 3746714 1180 90.7 920 928 15.9 0.1 15.3 Nalanda 2370528 1006 85.1 914 942 20.0 0.0 7.5 Nawada 1809696 726 92.6 946 978 24.1 0.1 11.3 Patna 4718592 1471 58.4 873 923 15.5 0.2 10.1 Purnea 2543942 787 91.3 915 967 12.3 4.4 36.8 Rohtas 2450748 636 86.7 909 951 18.1 1.0 10.1 Saharsha 1508182 885 91.7 910 912 16.1 0.3 14.4 Samastipur 3394793 1175 96.4 928 938 18.5 0.1 10.5 Saran 3248701 1231 90.8 966 949 12.0 0.2 10.4 Sheikhpura 525502 762 84.5 918 955 19.7 0.0 7.2 Sheohar 515961 1161 95.9 885 916 14.4 0.0 15.5 Sitamarhi 2682720 1214 94.3 892 924 11.8 0.1 21.2 Siwan 2714349 1221 94.5 1031 934 11.4 0.5 18.2 Supaul 1732578 724 94.9 920 925 14.8 0.3 17.4 Vaishali 2718421 1332 93.1 920 937 20.7 0.1 9.5 W. Champaran 3043466 582 89.8 901 953 14.3 1.5 21.2
159

Table 5.15 : Work Participation Rates in Bihar
All SCs STs District
Person Male Female Person Male Female Person Male FemaleBihar 32.9 46.3 18.4 38.2 47.5 28.2 45.2 52.9 36.9 Araria 39.5 52.1 25.8 48.2 53.9 42.0 51.1 55.7 46.2 Aurangabad 0.0 0.0 0.0 39.1 48.0 29.6 41.0 51.8 29.0 Banka 39.6 49.9 28.2 42.5 50.7 33.7 48.6 54.7 42.1 Begusarai 31.8 46.2 15.9 35.5 47.0 23.0 27.6 41.9 10.4 Bhagalpur 35.3 47.4 21.4 38.4 47.5 28.0 40.8 48.5 32.1 Bhojpur 29.1 44.1 12.6 35.8 47.1 23.1 30.2 44.8 13.4 Buxar 29.1 44.6 11.9 35.1 46.6 22.3 31.3 46.6 13.2 Darbhanga 31.2 46.1 14.9 36.1 47.9 23.2 44.2 56.7 28.6 E. Champaran 32.7 48.8 14.7 38.3 50.9 24.3 37.5 52.1 21.5 Gaya 36.8 47.4 25.5 43.7 50.1 36.9 41.2 51.2 30.4 Gopalganj 29.8 44.6 15.1 36.5 46.6 26.1 36.0 47.5 25.2 Jamui 42.7 49.9 34.8 47.7 52.7 42.5 47.4 52.1 42.4 Jehanabad 38.4 48.1 27.9 44.8 50.3 38.9 61.0 67.6 53.3 Kaimur 34.4 46.6 20.7 39.3 47.0 30.8 42.6 51.8 32.6 Katihar 37.5 50.9 23.1 42.3 50.9 33.1 45.8 53.7 37.4 Khagaria 36.5 48.5 22.9 42.2 50.1 33.5 53.0 64.3 39.3 Kishanganj 32.2 52.7 10.2 36.6 53.0 19.1 50.0 60.0 39.6 Lakhisarai 36.5 48.6 23.3 44.9 51.5 37.8 49.6 53.9 44.9 Madhepura 44.8 51.7 37.3 49.6 52.6 46.5 51.6 53.4 49.7 Madhubani 34.3 47.8 20.1 39.6 49.8 28.7 30.6 47.4 12.7 Munger 29.1 42.9 13.4 34.0 44.7 21.9 39.1 48.7 29.0 Muzaffarpur 30.4 46.7 12.7 35.2 48.5 20.9 31.9 45.1 17.8 Nalanda 38.1 48.3 27.0 44.7 50.3 38.5 54.3 63.9 43.0 Nawada 37.3 48.1 25.8 0.0 0.0 0.0 48.0 54.4 41.0 Patna 30.2 44.9 13.3 37.6 47.4 26.5 46.1 58.1 29.5 Purnea 37.8 51.0 23.3 46.9 52.8 40.5 47.1 53.1 40.7 Rohtas 30.4 45.7 13.5 36.1 47.5 23.4 39.4 50.9 26.8 Saharsa 39.1 48.9 28.4 46.3 51.3 40.9 47.2 51.8 42.2 Samastipur 31.6 46.8 15.1 35.7 48.1 22.3 62.9 71.0 28.2 Saran 26.5 42.1 10.4 32.3 43.5 20.6 30.2 42.6 17.4 Sheikhpura 37.0 48.1 25.0 46.1 50.7 41.0 48.3 60.9 33.3 Sheohar 31.2 50.3 9.8 35.0 51.7 16.2 23.4 40.0 3.4 Sitamarhi 31.9 50.3 11.2 35.9 52.1 17.8 31.6 50.1 10.6 Siwan 26.9 41.5 12.8 32.8 42.6 23.0 30.2 42.2 18.3 Supaul 42.0 50.4 33.0 46.6 51.7 41.1 45.8 49.9 41.5 Vaishali 28.8 45.3 10.9 33.4 47.3 18.4 45.9 55.7 35.3 W. Champaran 37.9 50.8 23.6 44.8 53.5 35.3 46.3 53.7 38.5
The average rate of work participation is 32.9 percent for Bihar. Saran, Siwan, Vaishali, Buxar,
Munger, Bhojpur and Gopalganj have Work Participation Ratio (WPR) below 30 percent. The
WPR is higher than 40 percent in Supaul, Jamui and Madhepura and higher than 35 percent in
another 14 districts. The SC population has much higher WPR of 38.2 percent with 17 districts
160

having higher than 45 percent WPR and only 3 below 35 percent. Among the ST population, WPR
is much higher at 45.2 percent, with two districts above 60 percent and only two districts below 30
percent. There are 17 districts where WPR for ST is above 40 percent and another 5 where it is
above 50 percent.
The gender gap is stark with the female WPR for the state at 18.4 percent while the male WPR is
46.3 percent. The gender gap is less among SCs with female WPR at 28.2 percent while the male
WPR is at 47.5 percent. For STs, the gap is even less at 36.9 and 52.9 percent respectively. Thus,
while the difference in WPR among men is much less, gap in women’s WPR is much higher
between the SC and ST communities and the rest of the population. In 20 districts, the female
WPR is higher than 20 percent for the overall population. For SC women, WPR is less than 20
percent in only 4 districts. It is higher than 30 percent in 16 districts. The WPR for ST women is
higher than 30 percent in 20 districts.
Thus Work Participation Ration, like literacy, shows a profound gender bias in the general
population as compared to SC and ST. While poverty is relevant as an explanation, it must be
noted that since there is not such a wide variation for male WPR among different sections of the
population, gender bias is a more important social issue in accounting for the differences in WPR.
Health
Vaccination coverage increased in Bihar between 1998-99 and 2004-05, from 12 percent to 33
percent while there was only a 2 percent increase in the national average in the same period. Infant
mortality in Bihar decreased from 72 to 68 per 1000 live births in the same period. This was
mainly attributable to rise in institutional deliveries from 15 to 22 percent in the same period
(Appendix VI and IX).
Health Infrastructure
The status of health infrastructure in the state is summarised in Table 5.16. There are 11,107
health centres of all types in Bihar. Of these, 415 are rural Primary Health Centres (PHCs), 69
urban PHCs, 9588 sub-centres and 1035 Additional PHCs. For every lakh of population, there are
13 health centres. There are wide variations in coverage at the district level. While Khagaria has
153 health centres and Gopalganj has 89 centres for every lakh of population, Nawada has only 8.
Apart from Goplaganj and Khagaria, no district has more than 19 centres for every lakh of
population. While 28 districts have atleast one rural referral hospital, the remaining 10 have none.
The total number of referral hospitals in the state is 70.
161

Table 5.16 : Status of Health Infrastructure (as on December 2008)
No. of CHC No. of Referral
Hospital
No. of Sub. Div.
Hosp.
No. of PHC No. of Sub -
Centre District
Population
Rural Urban Rural Urban Rural Urban
Addition Primary Health Centre
(APHC)
Total of PHC,
APHCs and Sub-
Centres
Health Centre Cover-
age Per
lakh of popu-lation
Araria 2400000 0 0 1 2 1 7 2 425 23 457 19Arwal 666942 0 0 0 0 0 5 0 64 21 90 13Augangabad 2351819 0 0 3 0 0 10 1 212 57 280 12Banka 2000000 0 0 2 1 1 1 9 265 15 290 15Begusarai 2254573 0 0 2 0 0 18 0 288 27 333 15Bhagalpur 2700000 0 0 0 2 1 11 2 280 41 334 12Bhojpur 2233415 0 0 3 0 0 13 0 284 10 307 14Buxar 1400000 0 0 0 1 1 7 1 162 15 185 13Darbhanga 3600000 0 0 2 0 0 18 0 261 36 315 9E. Champaran 4300000 0 0 3 0 0 19 1 315 46 381 9Gaya 3800000 0 0 1 1 0 18 4 643 37 702 18Gopalganj 250000 0 0 3 0 1 11 3 186 22 222 89Jamui 1600000 0 0 2 1 1 5 1 166 22 194 12Jehanabad 924000 0 0 1 1 0 5 2 81 27 115 12Kaimur 1453379 0 0 3 0 1 9 1 197 19 226 16Katihar 2690738 0 0 3 0 0 12 1 257 25 295 11Khagaria 140000 0 0 1 0 0 6 1 193 14 214 153Kishanganj 1584006 0 0 1 0 1 7 0 136 8 151 10Lakhisarai 939776 0 0 1 0 1 3 1 102 12 118 13Madhepura 1749637 0 0 0 0 0 6 1 196 17 220 13Madhubani 4178606 0 0 2 0 1 18 0 429 57 504 12Munger 1281149 0 0 1 0 0 7 2 123 8 140 11Muzaffarpur 4148855 0 0 1 0 0 14 0 473 43 530 13Nalanda 2368327 0 0 3 0 1 16 4 301 17 338 14Nawada 2000000 0 0 2 0 0 13 1 125 21 160 8Patna 5600000 0 0 4 0 3 19 4 418 60 501 9Purnea 3000000 0 0 3 0 0 10 1 278 34 323 11Rohtas 2700000 0 0 2 0 1 17 2 186 32 237 9Saharsa 1427403 0 0 0 0 0 10 2 163 15 190 13Samastipur 3700000 0 0 1 0 3 20 3 354 31 408 11Saran 3700000 0 0 0 4 0 1 14 503 43 561 15Sheikhpura 594144 0 0 0 1 1 6 0 73 16 95 16Sheohar 600000 0 0 0 0 1 3 0 34 17 54 9Sitamarhi 2669887 0 0 1 0 0 13 1 213 38 265 10Siwan 2552994 2 0 0 0 0 14 1 316 24 355 14Supaul 1900000 0 0 1 1 1 11 0 178 19 208 11Vaishali 2531766 0 0 0 0 1 16 1 339 36 392 15W. Champaran 3300000 0 0 2 0 1 16 2 369 30 417 13Total 87291416 2 0 55 15 23 415 69 9588 1035 11107 13
162

Human Resource
There are 4643 regular and 2369 contractual posts sanctioned for doctors in the state. At present,
58.4 percent of the regular 58.8 percent of the contractual posts have been filled up. The power to
transfer doctors has been delegated to the District Magistrate. 5 doctors are in position and
working for every lakh of population in the state. There are districtwise differences in availability
of doctors. While 49 doctors are available per lakh of population in Khagaria and 38 in Gopalganj,
there is only 1 doctor available per lakh population in Arwal. Except for Khagaria and Gopalganj,
no district has more than 18 doctors per lakh of population (Appendix II).
The situation is even more acute for staff nurses. There are only 2 Grade A staff nurses in position
and working for every lakh of population. For such nurses, 57.1 percent of the regular 26.4 percent
of the contractual posts have been filled up. While 41 Grade A nurses is working for every lakh of
population in Khagaria, the corresponding figure is less than one for Buxar, West Champaran and
Sheohar. Except for Khagaria, no district has more than 8 Grade A nurses per lakh of population
(Appendix III).
The same pattern is replete in the availability of ANMs. There are 11251 regular and 10946
contractual posts sanctioned for ANMs in the state and 86.4 percent of the regular 41.7 percent of
the contractual posts have been filled up. There are 16 ANMs working for every lakh of
population in the state. Except for Khagaria and Gopalganj, no district has more than 29 ANMs
per lakh of population (Appendix IV).
The appointment of ASHA workers have been much closer to target. About 92 percent of the
74350 positions have been filled and 87 percent of the workers have been trained. While 806
ASHAs, out of whom 747 are trained, are available per lakh of population in Gopalganj, the
corresponding figures are 715 and 691 respectively for Khagaria. Less than 137 ASHAs are posted
in other districts for every lakh of population (Appendix V).
Interventions in Health Service Delivery
Involving Private Sector in Support Services for cleaning, pathological and radiological services.
Free Drug Distribution and Indoor Treatment Speeding up appointments of medical and other staff in the health service Recruitment and training of ASHAs
163

The reforms in the health sector in Bihar since November 2005 have begun to be reflected in the
outcome figures. Earlier, there were low turnouts at Out Patient Departments (OPD) in rural Bihar,
95 percent of patients going to private doctors for treatment. In January 2006, only 39 patients
visited government hospitals per day. In Januray 2007, the figure went upto 2243 and further
increased to 2522 in Januray 2008. In October, 2008, the corresponding figure was as high as
4380.
Average Number of Patients Visiting Government Hospitals
0 1000 2000 3000 4000 5000 6000
Jan 06
May
Sep
Jan 07
May
Sep
Jan 08
May
Sep
Mo
nth
Number
Janani Evam Bal Suraksha Yojana (JBSY)
Janani Evan Bal Suraksha Yojana was launched on July 1, 2006. The number of institutional
deliveries went up very rapidly and is estimated to be approximately 8,38,481 in 2007-08. The
monthwise progress since 2006 in number of institutional deliveries is phenomenal (Chart 4.2).
The districtwise monthly figures of institutional deliveries are provided in Appendix VI. The
payments of Rs 1400 in rural areas and Rs 1000 in urban areas to mothers of neonatals availing
institutional delivery have acted as a strong incentive.
164

Monthwise Coparision of Institutional Delivery Over the Period 2006-07-08-09
3200
3716 38
05 7233
3655 11
042
1168
6
1216
2
1088
2
1393
6
1773
0
1801
5
2280
4
2786
5
3417
4
5220
5
7866
5
1089
81
1095
63
1028
86
7273
3
7814
7
7404
7
7641
1
6063
2
6538
5
6519
6 8025
5
1081
68
1273
35
1440
02
1303
80
0
20000
40000
60000
80000
100000
120000
140000
160000
April May June July Aug Septr Oct Nov Dec Jan Feb Mar
2006-07
2007-08
2008-09
Free Drug Distribution
Free drug distribution has been stepped up since 2005-06. The expenditure on procurement of
drugs for free distribution went up from Rs 3.5 crore in 2005-06 to Rs 68 crore in 2008-09.
Total Expenditure in Drug Procurement (Rs Crore)
0
10
20
30
40
50
60
70
80
2004-05 2005-06 2006-07 2007-08 2008-09
Rs
. in
Cro
res
TotalExpendit
165

Fund Utilization
The total funds allocated for health to the State Health Society increased from Rs 398.22 crore in
2005-06 to Rs 889.21 crore in 2008-09. Out of this, the actual release went up from Rs 124.33
crore in 2005-06 to Rs 351.17 crore. The utilisation against receipts has gone up from 31 percent
in 2005-06 to 57 percent in 2007-08. It must be noted that for the first three quarters of 2008-09,
utilization has already reached 62.9 percent. Although the utilization against approved budget is
low, it has improved from 9.7 perecnt in 2005-06 to 34.9 percent in 2007-08.
Table 5.17 : Financial Overview of Health Expenditure (Rs crore)
Fund Received
Year Approved
Budget GOI (NRHM)
GOB Total
Received Total
Expenditure
Percentage Utilization
against Receipts
Percentage Utilization
against Approved
Budget 2005-06 398.22 124.33 - 124.33 38.62 31.1 9.7 2006-07 571.42 328.75 51.84 380.59 92.14 24.2 16.1 2007-08 680.70 240.20 175.37 415.57 237.80 57.2 34.9 2008-09 889.21 350.48 0.69 351.17 220.92 62.9 24.8
Total 2539.55 1043.76 227.9 1271.66 589.48 46.4 23.2
Integrated Child Development Scheme (ICDS)
The ICDS programme is unique because of its integrated approach to early childhood
development. It provides improved childcare, early stimulation and learning, health and nutrition,
water and environmental sanitation. It is a targeted programme for young children, and expectant
and nursing mothers, which is implemented through trained community-based Anganwadi
workers and helpers, and supportive community structures. The ICDS encompasses interventions
in Health (Immunisation, Health Check-ups, Referral Services and Treatment of minor illness),
Nutrition (Supplementary feeding, Growth monitoring and promotion, Nutrition and Health
Education) and Education (Early Childhood Care and Pre-School Education) for children in the
age-group 3-6 years. This is done through a five point programme:
Improve the nutritional and health status of children below the age of six years.
Lay the foundation for the proper psychological, physical and social development of the child.
Reduce the incidence of mortality, morbidity, malnutrition and school dropouts.
Achieve effective coordination of policy and implementation among various departments to
promote child development.
Enhance the capability of the mother to look after the normal health and nutritional needs of
the child, through proper health and nutrition education.
166

Table 5.18 : ICDS – Districtwise Projects
No. of ICDS Project No. of ICDS Project District
Sanctioned OperationalDistrict
Sanctioned Operational Patna 23 23 Darbanga 19 19 Nalanda 20 20 Madhubani 21 21 Rohatas 20 20 Samastipur 21 21 Kaimur 11 11 Saharsa 10 10 Buxar 10 10 Supaul 11 11 Bhojpur 15 15 Madhepura 13 13 Gaya 25 25 Purnea 15 15 Jahanabad 7 7 Araria 9 9 Arwal 5 5 Kishanganj 7 7 Nawada 14 14 Katihar 15 15 Aurandabad 11 11 Bhagalpur 17 17 Saran 21 21 Banka 11 11 Siwan 19 19 Munger 10 10 Gopalganj 14 14 Sheikhpura 6 6 Muzaffarpur 17 17 Lakhisarai 6 6 Sitamarhi 18 18 Jamui 10 10 Sheohar 5 5 Bagusarai 18 18 W. Champaran 17 17 Khagaria 7 7 E. Champaran 29 29 Total 544 544 Vaishali 17 17
By 2007-08, 544 ICDS projects were operational in Bihar covering all development blocks in all
38 districts (Table 5.18). In 2008-09, 5440 Anganwadi Centres (AWCs) and an equal number of
mini-AWCs were added. A total of 86237 AWCs are now operational in Bihar (Table 5.19).
Table 5.19 : ICDS – Number of Projects
Year No.of
Projects No.of AWCs
No.of Mini
AWCs
2005-06 532 60153 —
2006-07 5 19516 —
2007-08 7 1128 —
2008-09 0 5440 5440
Total 544 86237 5440
Table 5.20 : ICDS – Staffing Position
Posts Sanction Strength
Actual Strength
Vacant
CDPO 544 485 59 Lady Supervisor 3288 274 3014 Anganwadi Worker 80797 80211 586 Anganwadi Helper 80797 80211 586
167

The actual number of Anganwadi workers and helpers is 99.3 percent of the sanctioned posts
(Table 5.19). Thus, at the level of the AWCs, the staffing is adequate. The shortage of supervisory
personnel reported in last year’s survey has been addressed through appointment of Child
Development Project Officers or CDPOs (the executive officers at the project level in the block).
The actual strength as a percentage for sanctioned strength has increased from 33.8 percent in
2006-07 to 89.2 percent. However, with just 8.3 percent of the 3288 sanctioned posts for Lady
Supervisors filled, there is still shortage of supervisory staff.
Table 5.21 ICDS — Resource Utilisation
Items 2004-05 2005-06 2006-07 2007-08
Total Budget for ICDS Bihar (Rs Lakhs)
23874.2 43268.3 60130.1 78785.6
Total Amount of Funds Released to Bihar (Rs Lakhs)
15524.4 18393.3 36931 72619.4
Total Expenditure Reported by Bihar (Rs Lakhs)
14234.4 36238.6 40729.5 60688.9
Fund Released as Percentage of Budget
65 42.5 61.4 92.17
Expenditure as Percentage of Fund Released
91.7 197 110.3 82.57
Expenditure as Percentage of Budget
59.6 83.8 67.7 77.03
Both resource allocation and utilization has increased in ICDS Bihar (Table 5.21). The total
budget has increased from Rs 238.74 crore in 2004-05 to Rs 787.85 crore in 2007-08. Breaking
from the earlier pattern of low share of actual fund release, 92 percent of the budgeted funds were
released in 2007-08 compared to a little over half in previous years. The expenditure as percentage
of budget has increased to 77 percent in 2007-08 from 68 percent in 2006-07. Thus, both overall
allocation and utilization has increased in 2007-08 as compared to previous years. In keeping with
importance accorded to ICDS, the state government has constituted a separate Directorate for
ICDS.
Public Health
Water supply and sanitation are an integral part of public health. According to a survey done by
the state government in 2003-04, out of the total habitations of 1,05,303 in the state, 32,911 had
been fully covered for potable water supply and sanitation, 44,930 had been partially covered (PC)
168

and 27,462 were not covered (NC) at all. The districtwise annual progress in coverage from 2006-
07 to November 2008, is provided in Table 5.22.
Table 5.22 : Districtwise Coverage Achieved for NC and PC Habitations
2006-07 2007-08 2008-09 (Upto
November 2008) Total Covered
Name of District
NC PC Total NC PC Total NC PC Total NC PC Total Patna 160 134 294 0 0 0 102 300 402 262 434 696Nalanda 184 184 368 3 29 32 170 240 410 357 453 810Gaya 790 419 1209 19 0 19 420 205 625 1229 624 1853Jehanaba/ Arwal 48 194 242 0 13 13 33 167 200 81 374 455Nawada 52 134 186 5 24 29 63 153 216 120 311 431Aurangabad 173 157 330 25 25 50 130 126 256 328 308 636Rohtas 150 132 282 0 0 0 108 202 310 258 334 592Kaimur 181 60 241 23 54 77 20 150 170 224 264 488Bhojpur 70 53 123 0 0 0 22 268 290 92 321 413Buxar 198 30 228 121 30 151 250 54 304 569 114 683Muzaffarpur 362 198 560 34 317 351 124 131 255 520 646 1166Vaishali 60 103 163 10 7 17 305 348 653 375 458 833Sitamarhi 109 305 414 14 47 61 71 304 375 194 656 850Sheohar 0 73 73 0 0 0 0 50 50 0 123 123Saran 276 261 537 5 21 26 78 560 638 359 842 1201Siwan 216 94 310 395 176 571 377 82 459 988 352 1340Gopalganj 674 654 1328 342 610 952 6 465 471 1022 1729 2751E. Champaran 333 384 717 130 123 253 190 544 734 653 1051 1704W. Champaran 0 43 43 0 0 0 0 248 248 0 291 291Darbhanga 167 342 509 0 215 215 95 584 679 262 1141 1403Samastipur 0 405 405 0 370 370 0 558 558 0 1333 1333Begusarai 945 0 945 200 276 476 127 97 224 1272 373 1645Madhubani 107 218 325 15 41 56 167 487 654 289 746 1035Bhagalpur 372 161 533 139 84 223 212 164 376 723 409 1132Banka 236 172 408 0 0 0 125 138 263 361 310 671Mungher 0 22 22 0 0 0 0 73 73 0 95 95Sheikhpura 0 35 35 0 0 0 0 46 46 0 81 81Lakhisarai 125 65 190 29 22 51 160 34 194 314 121 435Jamui 570 125 695 75 10 85 162 108 270 807 243 1050Saharsa 0 599 599 0 147 147 0 310 310 0 1056 1056Supaul 0 954 954 0 34 34 0 406 406 0 1394 1394Khagaria 0 0 0 0 0 0 0 0 0 0 0 0Madhepura 0 301 301 0 37 37 0 392 392 0 730 730Purnea 853 208 1061 134 66 200 259 197 456 1246 471 1717Kishanganj 200 90 290 804 459 1263 124 55 179 1128 604 1732Araria 95 186 281 77 83 160 40 298 338 212 567 779Katihar 55 174 229 4 25 29 28 203 231 87 402 489Total 7761 7669 15430 2603 3345 5948 3968 8747 12715 14332 19761 34093
169

With 34,093 habitations covered till November 2008, the percentage of habitations under coverage
have increased from 31.3 percent to 63.3 percent in the last three years.
Interventions in Public Health
Lohia Swachchhata Yojana has been launched for achieving 100 percent coverage.
50 burning ghats are being upgraded under Muktidham scheme.
Increase in achievement of Birth and Death Registration targets (Appendix VIII)
5.3 Labour, Employment and Poverty
Incidence of poverty has been very high in Bihar compared to the national average for decades.
Estimates of poverty by the NSSO surveys, also establishes this point. The incidence of rural
poverty in Bihar has come down from a level of 64.4 percent in 1983-84 to 45.7 percent in 2004-
05 (Table 5.23). Urban poverty has declined from 47.3 percent to 34.6 percent during the same
period. Nevertheless, the poverty ratio for 2004-05 is still quite high compared to the
corresponding ratios at the national level — rural (28.3 percent) and urban (25.7 percent).
Table 5.23 : Poverty Ratios in Bihar and India
Sector Year Bihar India
1983-84 64.4 45.7
1987-88 52.6 39.1
1993-94 58.2 37.3
1999-00 44.3 27.1
Rural
2004-05 42.1 28.3
1983-84 47.3 40.8
1987-88 48.7 38.2
1993-94 34.5 32.4
1999-00 32.9 23.6
Urban
2004-05 34.6 25.7
1983-84 62.2 44.5
1987-88 52.1 38.9
1993-94 55.0 36.0
1999-00 42.6 26.1
Combined
2004-05 41.4 27.5
170

Poverty as a basic deprivation of basic human needs is related to lives and livelihoods issues in
many ways. The employment pattern of different social groups is an indicator of the link between
livelihood issues and poverty. The Work Participation Ratio (WPR) is the highest among ST (45.2
percent), followed by SC (39.7 percent) while the overall WPR for the state is 33.7 percent
(Appendix X).
The sectoral distribution of main workers further establishes that the share of agricultural
labourers, whose lives are fraught with insecure and seasonal employment and landlessness, is
very high among SC (77.6 percent) and ST (62.5 percent) compared to the state average (48
percent). While there is great inter-district variation in proportion of agricultural labourers for the
entire population with a range between 32.5 percent in Jamui and 63.3 percent in Purnea, the
proportion of SC agricultural labourers is uniformly high in all the districts (from 61 percent in
Munger to 90.4 perecent in Sheohar) with only 3 districts below 70 percent. The proportion of ST
agricultural labourers show much wider variations due to the thin spread of the population in most
districts. But it is over 70 percent in Saharsa, West Champaran, Araria, Purnea, Sitmarhi, Katihar
and Kishanganj (Appendix XI).
The proportion of cultivators among various social groups is also further indicative of economic
status. It is well known that less than 5 percent of the state’s cultivators own more than 10 acres of
land each. Most cultivators are small or marginal farmers. But even within this, the proportion of
cultivators is very low for SC (7.9 percent) compared to the state average of 29.3 percent. For ST,
the corresponding figure is 21.3 percent. Thus, landlessness is directly associated with SC status
(Appendix XI). The same pattern can be seen in the broad classification of ‘other workers’. The
only exception is the household industry sector where the patterns are much less divergent, but
this accounts for only 4 percent of main workers in the state (Appendix XI). Income generation
and employment, food security and housing are integral to immediate basic needs.
Various programmes have been designed and implemented over the years to address these
deprivations. Performance of some of the major programmes is discussed below.
Self- Help Groups (SHGs) and Swarnajayanti Grameen Swarozgar Yojana (SGSY)
SGSY is a scheme to promote self-employment among the communities through SHGs as well as
individual self-employment programmes. A total of 14,036 SHGs were formed in 2007-08 under
SGSY compared to 8,324 in the pervious year. Of these new SHGs, 8,120 were women SHGs
(57.9 percent). Upto the month of December, 2008, 47 percent of the funds available for SGSY
has been utilised at the state level, compared to 52 percent in the same period in the previous year.
171

Table 5.24 : SGSY – Physical and Financial Overview (2007-08)
District No.of Members of SHGs assisted for
Economic activities
No.of Individual Swarojgaries assisted
for Economic Activities
No.of members of SHGs Trained
No.of Individual swarozgaris Trained
Total SC Women Total SC Women Total SC Women Total SC Women Araria 2185 253 2161 392 50 51 3627 297 3320 438 21 114 Arwal 250 108 93 74 50 6 17 8 9 2 1 1 Aurangabad 1665 1015 1601 189 122 13 2261 1079 2174 0 0 0 Banka 920 215 872 218 43 19 2612 506 1357 0 0 0 Begusarai 2242 334 1608 519 221 184 2775 896 2389 17 5 10 Bhagalpur 2558 639 2065 395 117 0 2558 639 2065 0 0 0 Bhojpur 1852 584 800 166 72 23 550 332 370 87 34 6 Buxar 976 493 441 139 71 57 944 485 286 531 263 165 Darbhanga 479 196 479 17 5 3 290 110 290 0 0 0 East Champaran 6453 1796 4551 1650 777 293 4788 1402 3064 80 26 29 Gaya 1656 838 601 3629 1725 1228 1656 838 601 3629 1725 1228 Gopalganj 1428 529 898 574 276 147 3059 800 1821 355 197 147 Jamui 236 85 236 442 162 17 236 85 236 442 162 17 Jehanabad 1284 650 448 205 123 47 1248 650 448 205 123 47 Kaimur 390 170 100 111 45 10 300 150 50 0 0 0 Katihar 1980 170 198 244 51 61 602 59 61 0 0 0 Khagaria 2292 1146 917 145 72 58 2292 1146 917 0 0 0 Kishanganj 424 44 310 0 0 0 424 44 310 0 0 0 Lakhisarai 789 244 162 161 51 28 789 244 162 0 0 0 Madhepura 1938 715 702 167 62 35 1938 715 702 167 62 35 Madhubani 5250 700 4140 856 330 125 5250 700 4140 856 330 125 Munger 1519 392 1086 252 133 155 6895 2886 5421 0 0 0 Muzaffarpur 4303 2124 3678 335 77 76 6131 1763 5439 20 0 0 Nalanda 2302 604 1182 122 89 42 2485 790 809 651 0 0 Nawada 1994 917 1946 497 228 43 2649 1081 2428 226 68 7 Patna 4889 1911 2983 8 1 0 7697 3453 3809 3 3 3 Purnea 1993 698 640 671 130 141 2000 700 650 670 150 220 Rohtas 1130 360 410 334 110 82 150 48 65 49 22 16 Saharsa 2748 974 1369 553 298 74 7847 2221 4146 276 101 53 Samastipur 11510 6837 347 334 185 11 4060 2250 122 0 0 0 Saran 1260 810 806 598 386 127 3537 2261 2546 0 0 0 Sheikhpura 498 170 297 5 5 4 2336 896 1389 0 0 0 Sheohar 1140 326 512 15 4 3 540 135 205 5 2 3 Sitamarhi 2690 231 855 1148 26 20 5675 478 2715 0 0 0 Siwan 1937 974 1126 1544 930 475 886 435 464 369 161 172 Supaul 1760 880 704 715 358 42 2000 1005 830 784 668 315 Vaishali 1804 913 944 0 0 0 5727 3031 3471 0 0 0 West Champaran 4631 2038 1604 781 302 307 1172 510 380 174 68 62Total 85355 32083 43872 18205 7687 4007 100003 35128 59661 10036 4192 2775Percentage Shares 37.6 51.4 42.2 22.0 35.1 59.7 41.8 27.7
172

Table 5.25 : SGSY – Training and Economic Assistance (2007-08)
Details of Funds Available/Utilised Physical Achievements
Fund (Rs Lakh)
No.of SHGs formed during
current year upto
dec.2008
District Available Utilised Rate of
Utilisation
No.of women SHGs formed during
current year upto
dec.2008
Women SHGs (%)
Muzaffarpur 1841.89 885.55 48.1 2149 841 39.1 Araria 1518.99 321.65 21.2 830 1218 146.7 East Champaran 1102.23 466.43 42.3 784 313 39.9 Saharsa 772.90 500.51 64.8 782 361 46.2 Gopalganj 381.19 260.44 68.3 710 475 66.9 Vaishali 879.45 333.85 38.0 595 335 56.3 Darbhanga 1578.96 1013.75 64.2 580 515 88.8 Madhubani 1677.02 844.27 50.3 564 451 80.0 Patna 804.90 767.80 95.4 456 186 40.8 Banka 358.01 187.94 52.5 448 0 0.0 Samastipur 2699.09 739.89 27.4 406 17 4.2 Supaul 664.09 432.83 65.2 378 190 50.3 Begusarai 1210.33 597.39 49.4 369 198 53.7 Munger 408.61 302.89 74.1 356 251 70.5 Rohtas 657.26 242.20 36.9 323 96 29.7 Bhojpur 692.28 366.02 52.9 310 109 35.2 Sheohar 189.52 166.84 88.0 305 195 63.9 Jamui 834.98 461.83 55.3 305 305 100.0 Katihar 1012.61 473.10 46.7 301 70 23.3 Kaimur 374.91 98.79 26.4 300 175 58.3 West Champaran 1158.53 638.04 55.1 280 325 116.1 Nawada 812.39 377.24 46.4 266 310 116.5 Jehanabad 457.80 364.70 79.7 260 27 10.4 Khagaria 1155.67 523.87 45.3 250 230 92.0 Nalanda 521.99 273.30 52.4 236 86 36.4 Madhepura 447.50 247.73 55.4 229 187 81.7 Aurangabad 609.12 289.41 47.5 222 159 71.6 Buxar 316.99 164.06 51.8 200 96 48.0 Purnea 1168.44 386.67 33.1 194 68 35.1 Siwan 470.44 284.25 60.4 141 112 79.4 Saran 806.14 306.64 38.0 130 30 23.1 Sheikhpura 221.42 91.56 41.3 117 54 46.2 Gaya 1401.53 535.79 38.2 111 71 64.0 Kishanganj 485.48 260.10 53.6 75 10 13.3 Sitamarhi 1092.89 362.49 33.2 49 37 75.5 Arwal 160.57 20.73 12.9 25 11 44.0 Bhagalpur 920.17 442.38 48.1 0 0 - Lakhisarai 462.85 140.66 30.4 0 6 -
Total 32329.14 15173.58 46.9 14036 8120 57.9
173

A wide inter-district variation is seen in performance of SGSY, both in terms of financial
utilisation and physical achievements. While the recently created Arwal district has utilised 12.9
percent of the funds available to it in 2007-08 compared to 7.5 percent last year, Patna saw a high
utilisation of 95.4 percent of funds. The highest number of SHGs were formed in Muzaffarpur
(2149), followed by Araria (830), East Champaran (784) and Saharsa (782). At the other end,
there are two districts where no SHG has been formed — Bhagalpur and Lakhisarai, repeating the
pattern from last year with a fund utilisation of 48 and 30 percent respectively.
In 2007-08, a total of 85,355 swarojgari members of SHGs and 18,205 individual swarojgaris
were given assistance for economic activities under SGSY. Similarly, 1,00,003 swarojgari
members of SHGs and 10,036 individual swarojgaris were trained under the programme. The
women swarojgari members of SHGs accounted for 51 percent of total swarojgari members of
SHGs who got economic assistance and 60 percent of those who got training. The corresponding
figures for individual women swarojgaris were 22 and 27 percent. Thus, SHGs are seen to offer a
better instrument for women’s access to self-employment, as opposed to individual self-
employment efforts. The SC swarojgari members of SHGs accounted for 38 percent of total
swarojgari members of SHGc who got economic assistance and 35 percent of those who got
training. The corresponding figures for individual SC swarojgaris were 42 and 41 percent. Thus,
for SCs again, the access through SHGs has not been a better option for women's self-
employment.
National Rural Employment Guarantee Scheme (NREGS)
The NREGS is a demand based guaranteed employment programme. Any applicant is entitled as a
right to 100 days of employment under the programme. The job cards were issued to 81,24,997
households in 2007-08 for this programme. Out of these, 45.1 percent were SC households.
Among the card-holding households, 48.3 percent had demanded employment in 2007-08, and
39,25,748 of them (48.3 percent) were provided employment. Only 1.3 percent (49,945
households) of total number of households were provided with 100 days of employment in
2007-08, as stipulated in the NREG Act.
174

Table 5.26 : Employment Generation under NREGS – 2007-08
District
No.of Hhds
issued job cards upto Dec. (SC)
No.of Hhds issued job cards upto
Dec. (Total)
No.of Hhds.demanding wage
employment
No.of Hhds.provid
ed empl.
Cumulative no.of
Hhds.which have
completed 100 days
empl.
% of SC Hhds issued
job card
% of Hhds.deman
ding empl.amongHhds.issued
jobcards
% of Hhds completing 100 days of employment among Hhds
provided employment
Khagaria 34849 87093 74596 74596 40.0 85.7 Banka 33650 124375 106350 105376 32 27.1 85.5 0.0 Jehanabad 54714 91188 76480 76480 1289 60.0 83.9 1.7 Begusarai 110300 249500 201000 201000 44.2 80.6 0.0 Saran 141160 271231 215134 215134 52.0 79.3 Jamui 65940 146446 102777 102777 9980 45.0 70.2 9.7 Munger 33297 136614 92451 92451 4345 24.4 67.7 4.7 Bhojpur 74327 169454 109577 109577 2 43.9 64.7 0.0 E. Champaran 164762 417656 263878 263878 361 39.4 63.2 0.1 W. Champaran 131117 331612 207379 207379 39.5 62.5 Aurangabad 100599 160735 109887 100230 4572 62.6 62.4 4.6 Arwal 23428 40423 25024 25024 108 58.0 61.9 0.4 Lakhisarai 36205 118664 66176 66176 1835 30.5 55.8 2.8 Katihar 39453 232076 127459 127459 0 17.0 54.9 0.0 Gaya 186118 261104 142046 142046 0 71.3 54.4 0.0 Nawada 100512 153882 81917 81917 7675 65.3 53.2 9.4 Sheohar 28294 74640 39206 39165 445 37.9 52.5 1.1 Darbhanga 195210 325177 170120 170120 60.0 52.3 0.0 Patna 126439 292660 152948 152948 2351 43.2 52.3 1.5 Madhepura 110983 187685 93341 93341 59.1 49.7 Rohtas 96594 198124 97356 97356 6 48.8 49.1 0.0 Nalanda 141581 291969 133040 133040 12546 48.5 45.6 9.4 Araria 59692 242540 109902 109887 1262 24.6 45.3 1.1 Muzaffarpur 205298 342162 136864 136864 60.0 40.0 Sitamarhi 112639 270535 104600 104600 41.6 38.7 Saharsa 137297 246789 94379 94379 55.6 38.2 Samastipur 209311 318208 101501 101501 320 65.8 31.9 0.3 Supaul 33396 220159 69729 69729 15.2 31.7 Siwan 49927 172989 53764 53764 28.9 31.1 Kishanganj 29795 199106 59880 59880 15.0 30.1 Gopalganj 64815 176725 53018 53018 1007 36.7 30.0 1.9 Vaishali 215943 408723 122317 122317 52.8 29.9 Bhagalpur 47178 195889 56874 56874 270 24.1 29.0 0.5 Purnea 137891 352917 82091 82091 412 39.1 23.3 0.5 Buxar 66872 119232 23120 23120 1127 56.1 19.4 4.9 Sheikhpura 27773 61561 11171 11171 45.1 18.1 Kaimur 57636 120755 18452 18452 47.7 15.3 Madhubani 179215 314399 150631 150631 57.0 4.8 Bihar 3664210 8124997 3926912 3925748 49945 45.1 48.3 1.3
175

Table 5.27 : NREGS – Physical and Financial Overview - 2007-08
District Total
Beneficiary Hhds
Persondays (in Lakh)
No.of days
work by women
No.of Land
reform/ IAY
Total Fund
Available (Rs Lakh)
Total Fund
Utilised (Rs Lakh)
Fund Utilisation
( %)
% of Workdays by women
Supaul 69729 53.30 29.50 2150 5100.71 4641.7 91.0 55.3 Gaya 142046 47.62 16.66 82000 8074.83 6298.5 78.0 35.0 Muzaffarpur 136864 45.67 17.35 359 6440.43 5884.4 91.4 38.0 East Champaran 263878 35.619 4.63 7120 4774.31 3595.5 75.3 13.0 Munger 92451 35.26 11.66 30245 5391.86 5036.6 93.4 33.1 Jamui 102777 35.162 12.64 108000 4956.04 4461.5 90.0 35.9 Katihar 127459 31.98 10.55 19690 4879.18 4465.4 91.5 33.0 Darbhanga 170120 31.486 9.44 12 5610.6 4374.6 78.0 30.0 Saharsa 94379 31.37 10.48 832 4709.57 4287.5 91.0 33.4 West Champaran 207379 26.55 6.35 3817 4278.99 3530.2 82.5 23.9 Madhepura 93341 26.45 8.72 332 4223.25 3615.1 85.6 33.0 Nawada 81917 25.76 8.499 15 4739.48 2932.5 61.9 33.0 Lakhisarai 66176 25.71 6.01 30820 3944.35 3005.9 76.2 23.4 Siwan 53764 25.66 0.44 4927 3941.46 2938.5 74.6 1.7 Patna 152948 24.59 7.09 90 5064.82 3413.5 67.4 28.8 Araria 109887 24.50 7.39 13041 5313.13 3274.4 61.6 30.1 Nalanda 133040 24.01 7.81 1318 3210.27 2345.1 73.1 32.5 Vaishali 122317 23.49 1.03 21185 4483.92 2935 65.5 4.4 Jehanabad 76480 21.71 5.47 20303 3918.47 2932.1 74.8 25.2 Aurangabad 100230 20.37 4.27 14967 3539.98 2410.4 68.1 21.0 Sitamarhi 104600 20.28 4.09 1750 4312.68 2201.5 51.0 20.2 Buxar 23120 17.94 5.56 613 1725.57 1517.7 88.0 31.0 Madhubani 150631 17.68 3.56 5945.95 3044 51.2 20.1 Saran 215134 17.20 0.86 24729 3680.47 1841.9 50.0 5.0 Begusarai 201000 14.61 2.60 7240 6166.55 1930.1 31.3 17.8 Samastipur 101501 13.95 3.07 530 5365 3820.4 71.2 22.0 Rohtas 97356 13.86 4.50 138589 2627.31 1973.8 75.1 32.5 Sheohar 39206 13.82 4.83 4538 2781.85 1939.9 69.7 34.9 Bhojpur 109577 12.83 0.41 2018 1923.04 1362.4 70.8 3.2 Bhagalpur 56874 12.58 1.39 2992 2151.63 1303.8 60.6 11.1 Gopalganj 53018 12.25 1.35 4286 2225.45 1605.3 72.1 11.1 Banka 105376 11.36 1.72 864 1773 1315 74.2 15.2 Arwal 25024 10.51 1.61 253 2043.59 1010.3 49.4 15.3 Kaimur 18452 10.08 2.21 1292 1391.10 1159.2 83.3 21.9 Kishanganj 59880 9.04 1.77 185300 1672.54 1190.2 71.2 19.6 Purnea 82091 8.31 2.80 14720 1210.14 820.24 67.8 33.7 Sheikhpura 11171 4.17 0.60 5068 1474.66 455.87 30.9 14.3 Khagaria 74596 3.86 0.86 - 2221.94 464.6 20.9 22.2Total 3863370 840.58 229.80 756005 147288 105335 71.5 27.3
176

The district level variations remain high with respect to proportion of households demanding
employment. In Madhubani, only 4.8 percent of the card-holding households were reported to be
demanding employment. In Banka, Begusarai, Khagaria and Jehanabad, more than 80 percent of
card-holding households had demanded for employment. Along with Madhubani, other districts
where less than 20 percent of card-holding households had demanded employment were Buxar,
Kaimur and Sheikhpura (Table 5.26).
The programme has generated about 841 lakh persondays of employment for 38,63,370
households in 2007-08. Of this, 27.3 percent of workdays were for women. About 20 percent of
households were also beneficiaries under IAY or Land Reforms. The inter-district variations are
high in this programme and there is no correspondence between levels of fund utilization and
employment generation in many districts. Supaul, Gaya and Muzaffarpur generated more than 40
lakh persondays of work with high fund utilization rates (close to 80 percent or above). In Supaul,
55.3 percent of workdays were for women. At the other end, Kishanganj, Khagaria, Purnea and
Sheikhpura generated less than 10 lakh persondays of employment. However, the fund utilization
was close to 70 percent or more in Kishanganj and Purnea, while it was 21 percent in Khagaria
and 31 perecent in Sheikhpura. The highest level of fund utilisation was 93.4 percent in Munger.
In Siwan, the workdays for women were less than 2 percent of the total. Bhojpur and Vaishali also
follow closely regarding the share of women in employment at 3.2 and 4.4 percent respectively.
The fund utilisation for the state as a whole in 2007-08 was 71.5 percent (Table 5.27).
Indira Awas Yojana (IAY)
The Indira Awaz Yojana is an important intervention for affordable housing for people below the
poverty line. It is mandatory under the scheme to provide housing to a minimum of 60 percent of
SC and ST, 15 percent to minorities and 3 percent to the handicapped.
In 2007-08, the state government completed 73 percent of the physical target with a fund
utilization of 72 percent. The share of SCs and STs in the total houses completed was 55 percent
which was below the stipulated of at least 60 percent. Similarly, the share of minorities was 8.5
percent, against the stipulation of 15 percent (Table 5.28).
177

Table 5.28 : Overview of IAY Upto 2007-08
IAY Components IAY New IAY
Upgraded
IAY Credit Cum
Subsidy
Total
Percentage Share of different
population categories
in the scheme
Total target - - - 567171 -
Houses Completed 377453 24740 2414 404607 -
Houses Completed (SC) 198417 12642 1129 212188 51.5
Houses Completed (ST) 12640 917 186 13743 3.3
Houses Completed (Minorities) 34251 928 19 35198 8.5
Houses Completed (Others) 132145 10253 1080 143478 34.8
Total funds Available (Rs Lakhs) 196448.107 7303.708 771.594 204523.409
Total Funds Utilized (Rs Lakhs) 141790.12 3598.70 326.28 145715.09
Percentage of Utilzation 72.2 49.3 42.3 71.2
178

Table 5.29 : IAY – Physical and Financial Overview - 2007-08 (New + Upgraded + Credit & Subsidy)
Districts Annual target House completedPhysical achievement as percent of annual target
Percentage utilisation of available fund
Araria 33812 20235 59.8 74.1 Arwal 1701 2344 137.8 68.6 Aurangabad 6422 3865 60.2 78.1 Banka 4715 2505 53.1 51.7 Begusarai 11766 9990 84.9 68.1 Bhagalpur 9637 7146 74.2 72.4 Bhojpur 7174 2640 36.8 56.5 Buxar 4368 3089 70.7 59.0 Darbhanga 22106 10095 45.7 86.3 E. Champaran 34142 19281 56.5 57.0 Gaya 13384 11986 89.6 84.3 Gopalganj 15872 11460 72.2 56.2 Jamui 4646 4813 103.6 87.0 Jehanabad 2419 2202 91.0 90.2 Kaimur 4188 2169 51.8 92.2 Katihar 23813 24271 101.9 65.4 Khagaria 9992 515 5.2 70.0 Kishanganj 13783 7818 56.7 52.8 Lakhisarai 2331 2402 103.0 92.6 Madhepura 21645 21249 98.2 86.6 Madhubani 37122 16651 44.9 43.0 Munger 3725 3751 100.7 92.4 Muzaffarpur 34884 45507 130.5 92.2 Nalanda 6180 3065 49.6 77.2 Nawada 5533 4538 82.0 58.3 Patna 9414 8184 86.9 87.5 Purnea 38196 17497 45.8 83.5 Rohtas 6567 2677 40.8 64.3 Saharsa 18126 23462 129.4 84.9 Samastipur 23081 12095 52.4 67.4 Saran 14077 8424 59.8 64.5 Sheikhpura 1256 1076 85.7 94.2 Sheohar 7773 4512 58.0 69.8 Sitamarhi 23617 16983 71.9 59.5 Siwan 12701 15381 121.1 99.4 Supaul 26349 22531 85.5 70.9 Vaishali 18980 9108 48.0 67.7 W. Champaran 31674 19090 60.3 68.1 Total 567171 404607 71.3 71.3
179

The districtwise implementation of IAY shows wide variations. In Muzaffarpur, Saharsa,
Lakhisari and Jamui, the programme had not only achieved the physical targets, but exceeded
them with fund utilization between 85 and 93 percent. In Madhepura, Munger, Katihar, Arwal and
Jehanabad also more than 90 percent of the physical targets have been achieved with fund
utilization varying from 65 to 91 percent. At the other end lies Khagaria, where 70 percent of the
funds had been utilized, but only 5.2 percent of the houses had been completed.
Food Security and Public Distribution System
The Public Distribution System (PDS) for essential commodities has been an important part of the
measures to promote food security in the state. Four essential commodities (wheat, rice, sugar and
kerosene oil) are distributed through PDS outlets. The consumers are divided into Above Poverty
Line (APL) and Below Poverty Line (BPL) categories based on the correction to the state
government’s original survey carried out in 2006. Under the PDS, 39,93,973 BPL households
were being provided with 35 kgs of foodgrains per month (25 kgs of rice and 10 kgs of wheat).
Under Antyoday, 24,28,523 BPL families are being provided with 35 kgs of foodgrains per month
— 21 kgs of rice at the rate of Rs 2 per kg and 14 kgs of wheat at the rate of Rs 3 per kg.
Annapurna provides 1,66,600 homeless senior citizens with 6 kgs of wheat and 4kgs of rice free of
cost.
180

Table 5.30 : Overview of Public Distribution System
PDS Shops No of beneficiaries ('000)
(as on October 2008)
District Number (as on Dec 2008)
Per lakh of population (Midyear
2008 estimates)
BPL Antyoday Annapurna Total
% of Total
Population Share
Patna 2646 49.6 301.0 160.8 13.8 475.6 4.0 5.7
Nalanda 1081 40.3 245.3 108.0 5.2 358.5 3.0 2.9
Bhojpur 1335 52.6 177.9 84.0 3.7 265.6 2.2 2.7
Buxar 756 47.7 133.2 43.8 3.6 180.6 1.5 1.7
Rohtas 1013 36.6 222.1 76.2 4.1 302.4 2.5 3.0
Kaimur 636 43.6 129.8 58.6 2.5 190.9 1.6 1.6
Gaya 1973 50.2 255.5 120.0 5.5 381.1 3.2 4.2
Jehanabad 517 46.0 69.5 31.6 2.8 103.8 0.9 1.2
Arwal 294 50.1 55.4 24.8 2.0 82.2 0.7 0.6
Aurangabad 1202 52.8 161.9 72.6 2.6 237.1 2.0 2.4
Nawada 857 41.9 137.2 61.4 3.7 202.3 1.7 2.2
Saran 2460 67.0 283.8 128.6 5.7 418.1 3.5 3.9
Siwan 1824 59.4 241.6 79.7 4.8 326.0 2.7 3.3
Gopalganj 1104 45.4 185.6 83.8 4.4 273.8 2.3 2.6
Muzaffarpur 2155 50.9 424.1 190.7 6.7 621.4 5.2 4.5
Vaishali 1371 44.6 358.9 118.7 4.1 481.7 4.0 3.3
Sitamarhi 1072 35.3 344.1 111.9 4.7 460.7 3.9 3.2
Sheohar 234 40.1 61.5 20.3 0.8 82.5 0.7 0.6
E.Champaran 2194 63.8 345.7 153.0 5.1 503.8 4.2 3.7
W.Champaran 1694 38.0 414.4 186.8 8.7 609.9 5.1 4.7
Darbhanga 1344 36.1 268.2 117.6 6.6 392.5 3.3 4.0
Madhubani 1579 39.1 465.1 207.3 8.3 680.7 5.7 4.3
Samastipur 1438 37.5 321.7 143.5 5.9 471.1 4.0 4.1
Saharsa 682 40.0 167.2 54.0 3.9 225.1 1.9 1.8
Supaul 717 36.6 235.7 76.6 3.9 316.2 2.7 2.1
Madhepura 619 35.9 180.8 58.9 2.9 242.7 2.0 1.8
Purnea 1250 43.5 371.4 122.1 4.5 497.9 4.2 3.1
Araria 998 40.9 220.8 96.8 4.2 321.8 2.7 2.6
Kishanganj 669 45.7 184.7 83.8 2.2 270.8 2.3 1.6
Katihar 1056 39.0 232.8 76.0 3.1 311.9 2.6 2.9
Munger 664 51.6 109.5 48.4 3.3 161.3 1.4 1.4
Jamui 724 45.8 146.1 62.1 2.2 210.4 1.8 1.7
Lakhisarai 293 32.3 63.7 20.6 2.6 86.9 0.7 1.0
Sheikhpura 266 44.8 48.5 15.6 0.9 65.1 0.5 0.6
Begusarai 1005 37.8 223.1 99.8 6.0 328.9 2.8 2.8
Khagaria 714 49.3 165.1 73.7 3.2 241.9 2.0 1.5
Bhagalpur 1407 51.4 226.1 76.5 4.3 306.9 2.6 2.9
Banka 937 51.5 158.8 51.3 4.1 214.2 1.8 1.9
Total 42780 1714.8 8337.9 3400.0 166.6 11904.5 100.0 100.0
181

The districtwise share of beneficiaries is more or less in proportion to population shares of
districts. The number of PDS outlets per lakh of population varies from district to district. Saran
(67 PDS shops per lakh of population) followed by East Champaran (64) and Aurangabad (53) are
some of high coverage districts. Other districts having more than 50 PDS shops per lakh of
population are Bhojpur, Munger, Banka, Bhagalpur, Muzaffarpur, Gaya and Arwal. On the other
extreme, Lakhisarai has only 32 shops per lakh of population. There are ten other districts with
less than 40 shops per lakh of population (Table 5.30).
The number of beneficiaries per thousand of population is highest in Madhubani (681), followed
by Muzaffarpur (621), West Champaran (610), and East Champaran (504). Less than 100
beneficiaries per thousand of population is observed in Lakhisarai (87), Sheohar (83), Arwal (82)
and Sheikhpura (65) (Table 5.30).
182

Table 5.31 : Allotment and Lifting of Rice and Wheat under PDS (2007-08)
(’000 quintal) Wheat Rice
District
Allotment Lifting Lifting Percentage
Allotment Lifting Lifting Percentage
Patna 369.34 374.76 101.47 685.56 674.81 98.43
Nalanda 267.55 135.80 50.76 525.61 203.35 38.69
Bhojpur 164.05 150.74 91.89 287.57 264.95 92.13
Buxar 99.17 87.07 87.80 189.86 151.09 79.58
Rohtas 170.60 107.21 62.85 332.85 205.06 61.61
Kaimur 107.51 86.06 80.05 200.16 179.31 89.58
Gaya 311.52 246.86 79.25 586.42 396.60 67.63
Jehanabad 89.23 80.83 90.58 175.74 157.53 89.64
Arwal 56.39 52.64 93.35 108.42 99.92 92.15
Aurangabad 166.05 139.81 84.20 314.65 228.50 72.62
Nawada 167.35 130.89 78.22 323.10 218.03 67.48
Saran 262.42 151.14 57.60 493.30 222.66 45.14
Siwan 167.33 159.43 95.28 315.36 279.79 88.72
Gopalganj 161.89 150.52 92.98 302.23 267.47 88.50
Muzaffarpur 657.72 536.40 81.55 1433.86 635.10 44.29
Vaishali 343.35 238.11 69.35 755.35 282.34 37.38
Sitamarhi 302.41 191.98 63.48 631.88 280.40 44.38
Sheohar 86.85 63.18 72.75 196.59 80.43 40.91
E.Champaran 349.42 320.77 91.80 675.16 522.67 77.42
W.Champaran 342.61 250.86 73.22 654.03 388.02 59.33
Darbhanga 349.10 273.03 78.21 695.20 458.80 65.99
Madhubani 449.39 212.15 47.21 914.27 139.04 15.21
Samastipur 409.84 332.58 81.15 817.58 597.34 73.06
Saharsa 175.37 169.46 96.63 375.16 287.62 76.67
Supaul 273.42 112.57 41.17 607.09 135.74 22.36
Madhepura 189.62 101.64 53.60 412.88 151.85 36.78
Purnea 328.12 151.93 46.30 718.46 224.18 31.20
Araria 280.17 138.27 49.35 560.11 164.69 29.40
Kishanganj 271.58 162.04 59.67 618.46 320.76 51.86
Katihar 307.96 277.93 90.25 675.99 413.36 61.15
Munger 116.60 91.36 78.35 232.37 162.82 70.07
Jamui 148.40 136.61 92.05 266.15 154.10 57.90
Lakhisarai 67.02 38.64 57.65 129.70 53.18 41.00
Sheikhpura 49.19 35.42 72.01 101.68 71.00 69.82
Begusarai 343.93 248.91 72.37 718.29 391.96 54.57
Khagaria 173.06 139.62 80.68 358.07 282.17 78.80
Bhagalpur 233.98 142.49 60.90 485.87 180.62 37.17
Banka 137.86 63.49 46.05 272.46 63.82 23.42
Total 8947.37 6483.19 72.46 18147.49 9991.09 55.05
Note: Patna shows 101.47 percent lifting in wheat which is possibly an accounting error.
183

Amount of foodgrain lifted as a percentage of allotment is an important indicator of functioning of
PDS. Lifting of rice is the highest in Patna at 98.43 percent. It is above 75 percent in Saharsa, East
Champaran, Khagaria, Buxar, Gopalganj, Siwan, Kaimur, Jehanabad, Bhojpur and Arwal with
lifting being more tha 90 percent in the last two. But Madhubani, Supaul, Banka and Araria show
very low lifting at less than 30 percent. Similarly, for wheat, while lifting is higher than 90 percent
in Katihar, Jehanabad, East Champaran, Bhojpur, Jamui, Gopalganj, Arwal, Siwan, Saharsa and
Patna, it is less than 50 percent in 5 districts (Table 5.31).
It must be noted that Madhubani has the highest share of beneficiaries per thousand of population,
but the lowest share of lifting in rice and very low levels of lifting in wheat. Lakhisarai has the
lowest share of beneficiaries per thousand of population and also low lifting levels. For the better
working of the PDS which is the main source of food security for the poor, measures are needed
for more effective and uniform patterns of lifting, distribution and coverage.
5.4 Interventions for Marginalised Sections
Mahadalit
The state government formed the State Mahadalit Commission for the development of the most
deprived amongst the Scheduled castes. The Commission observed that out of the 22 scheduled
castes in Bihar, 20 are acutely deprived in terms of educational, economic, socio-cultural and
political status. The Commission identified these 20 castes primarily on the basis of their literacy
rate. While the total literacy rate of Bihar is 47 percent, and that for all scheduled castes is 28.5
percent, it is only 16.7 percent in case of Mahadalits. It noted that populations belonging to these
castes had not benefited from affirmative action meant exclusively for Scheduled Castes.
184

Table 5.32 : Demographic Profile of Dalits
Dalit Castes Person Male Female % of All
Dalits
Bantar 101223 52403 48820 0.78
Bauri 2097 1074 1023 0.02
Bhogta 12659 6713 5946 0.10
Bhuiya 568403 293027 275376 4.37
Bhumij 2333 1197 1136 0.02
Chamar 4090070 2122732 1967338 31.41
Chaupal 100111 52021 48090 0.77
Dabgar 3590 1813 1777 0.03
Dhobi 647491 336880 310611 4.97
Dom 155383 80855 74528 1.19
Dushadh 4029411 2107535 1921876 30.94
Ghasi 674 365 309 0.01
Halalkhor 3960 2069 1891 0.03
Hari 181748 94035 87713 1.40
Kanjar 1620 860 760 0.01
Kurariar 6566 3366 3200 0.05
Lalbegi 809 445 364 0.01
Mushahar 2112136 1093077 1019059 16.22
Nat 38615 19976 18639 0.30
Pan 3653 1959 1694 0.03
Pasi 711389 370599 340790 5.46
Rajwar 213795 109831 103964 1.64
Turi 33638 17344 16294 0.26
Generic Caste 27234 14500 12734 0.21
Total 13021374 6770176 6251198 100.00
Note : Mahadalit includes all scheduled castes, except Chamar and Dusadh
185

Table 5.33 : Districtwise Demographic Overview of Dalit Population
District Total
Population Total SCs Population
Dalit Population
Araria 2158608 293488 293279 Aurangabad 2013055 472766 472227 Banka 1608773 200059 198589 Begusarai 2349366 341173 340872 Bhagalpur 2423172 254686 252386 Bhojpur 2243144 343598 343428 Buxar 1402396 198014 196854 Darbhanga 3295789 511125 510392 East Champaran 3939773 514119 513437 Gaya 3473428 1029675 1028978 Gopalganj 2152638 267250 266241 Jamui 1398796 242710 241902 Jehanabad 1514315 286217 286126 Kaimur 1289074 286291 285345 Katihar 2392638 208384 207541 Khagaria 1280354 185122 184959 Kishanganj 1296348 85833 84477 Lakhisarai 802225 126575 126299 Madhepura 1526646 260461 260211 Madhubani 3575281 481922 481603 Munger 1137797 150947 150620 Muzaffarpur 3746714 594577 593865 Nalanda 2370528 473786 473758 Nawada 1809696 435975 435138 Patna 4718592 729988 728896 Purnea 2543942 312088 310459 Rohtas 2450748 444333 442965 Saharsa 1508182 242612 242309 Samastipur 3394793 628838 628397 Saran 3248701 389933 388926 Sheikhpura 525502 103732 103712 Sheohar 515961 74391 74352 Sitamarhi 2682720 315646 315087 Siwan 2714349 309013 306701 Supaul 1732578 256444 256165 Vaishali 2718421 562123 561947 West Champaran 3043466 434714 432931
Total 82998509 13048608 13021374
186

On the recommendation of the Commission, the state government has taken initiatives for the
development of the 20 Mahadalit Scheduled castes.
Mahadalit Welfare
Bihar Mahadalit Development Mission – For the implementation of the special schemes and to have focused approach, the Mission has been established.
Mahadalit Residential Land Scheme, Mahadalit Awas Yojna, Mahadalit Potable Water Scheme, Mahadalit Toilet Construction Scheme, Mahadalit Basti Sampark Path Yojna, Mahadalit Anganwadi, Mahadalit Crèche, Special School or Hostel for Mahadalits, Mukhyamantri Mahadalit Poshak Yojna, Dashrath Manjhi Shramik Training Institute, Mukhyamantri Nari Jyoti Scheme, Dhanvantari Mobile Ayurvedic Chikitsha, Mobile Public Distribution System, Eradication of Scavenging System, Construction of Community Hall-cum-Workshade, Mukhyamantri Jeevan Drishti Programme are the major schemes launched by the state government for welfare of Mahadalits.
Survey, Research Study, Advertisement, Innovative scheme – To understand the existing condition and problem of Mahadalit communities, a detailed survey of Mahadalit families is required. Their problems should be carefully analyzed and by using Information, Education and Communication (IEC), a favorable environment can be generated.
District & Block Resource Centre for Training and Research- The Mission will establish a District and Block Resource Centre to provide scheme-related information to the Mahadalit Communities. These centres can be used as training centres for those officials who are involved in the Mahadalit Development Mission. These centres will also function as data centres for the movement and channelizing of information.
Vikas Mitra - Vikas Mitra is a very important concept of the Mission. The Vikas Mitra will be the link between Block Resource Centre and the Mahadalit Tolas.
Community Radio - Under the awareness programme, Mahadalit hamlets will have Community Radios.
Women’s Empowerment
With a sex ratio of 919, women in Bihar are disadvantaged socially with respect to literacy,
education and work participation as has been observed in the previous sections.
The Women’s Development Corporation is implementing the Mukhya Mantri Nari Shakti Yojana
in the state. This programme aims to sensitize, empower and assist women to lead a life based on
187

self-respect and confidence by strengthening their economic status through a collective endeavour.
The programme comprises schemes for social, economic and cultural empowerment of women.
Besides, it would provide support for Information and Documentation Centres as well as
innovations. A brief description of the schemes is given below:
Social Empowerment of Women
1. Helpline : This is a crisis intervention centre for women in distress and will be set up in
all the 38 districts of Bihar.
2. Short stay home : Under the provisions of Immoral Traffic Prevention Act-1986 and
Protection of Women against Domestic Violence Act-2005, short stay homes will be
established for social and economic rehabilitation of women who are victims of
trafficking or domestic violence.
3. Protection home : This would be a centre for providing shelter and rehabilitation
support to the victims of trafficking.
4. Working women hostel : It is proposed to extend boarding and lodging facilities to
working women staying away from their homes as a support measure to encourage
women in the service sector.
5. Crèche : The crèche would provide care and support to children upto the age of 5 years
of working mothers and provide nutritional food, game facilities, etc for the overall
development of young children.
6. Social Awareness : This programme proposes to create awareness amongst masses on
various women related issues by promoting family schools and use of various
traditional media as Nukkad-natak, puppet shows etc.
7. Social Rehabilitation Fund : This is a fund which will provide medical, educational
and other economic support to women in distress.
188

Economic Empowerment of Women
1. Organising, nurturing & capacity Building of Women SHGs : This programme will
be implemented in all the districts to enable women to access services and schemes
available, raise their awareness levels and help women to undertake various income
generating activities. The objective is to help develop collective strength and leadership
qualities among women so that they can manage and own their institutions i.e. SHGs &
Federations.
2. Training in the Service Sector : Through this programme, women and adolescent
girls will be trained so they can earn a livelihood in the service sector such as
housekeeping, computer operation, etc.
3. Initial capitalization fund : Grant support would be extended to women federations
amounting to Rs.20, 000 per SHG which will help them in on-lending to groups until
bank loan is accessed.
4. Infrastructure development and Livelihood promotion : Turn key projects will be
supported for the economic empowerment of women through training and setting up
production centers.
5. Preparation of project proposals, workshop and seminars/monitoring : various
action researches will be undertaken for the purpose of economic empowerment of
women and presented in workshop and seminars for replication and scaling up.
Monitoring activities will be also be undertaken under this sub-component.
Cultural Empowerment and Innovation
Organizing cultural Melas : To promote traditional folk art & theatre as well as promote
sales of handicrafts, melas would be organized from time to time. Awards would also be
given to promote these art forms among women.
Information and Documentation Centres : The centres will collate all data related to
women in the state and serve as a Data centre to track progress of the various programmes.
Innovative Schemes
Support fund would be given to promote new and innovative programmes related to
processes, strategies and concepts aimed at social and economic empowerment of women.
189

Welfare of Backward and Extremely Backward Classes
The backward classes constitute upto 60 percent of Bihar’s population. Thus, the overall
development of the backward and extremely backward sections are corner-stones for Bihar’s
human development. A separate department for BC and EBC Welfare was set up by the state
government in April 2007 to focus on scheme-based interventions for their educational and
economic development .
Welfare Measures for BC and EBC
The Bihar State Backward Classes Finance and Development Corporation has
facilitated loans for Swarojgaris from the National Backward Classes Finance and
Development Corporation by providing the Margin Money and Bank Guarantee.
More than 59 trades have been brought under various general schemes assisted by the
Corporation.
Swarnima Yojana is dedicated to the economic development of women from backward
classes through provision of low interest (4 percent per annum) loans .
Educational Loans, Swayam Saksham loans upto Rs 5 lakh for professionals and Micro
Finance schemes are other important measures.
81311 students were given stipends for higher secondary education in 2007-08 while
627921 students from primary to secondary levels availed of stipends.
In 2008-09, a stipend of Rs 10,000/- has been started for EBC students who score a first
division in secondary examinations.
Buildings for 6 out of 12 Residential schools for BCs and EBCs are being
constructed.and a society has been formed to develop these schools on the Navodaya
pattern.
Minorities
The religious minorities constitute 16.71 percent of the population of Bihar with 16.53 percent
Muslims, 0.03 percent Christians and 0.21 percent consisting of other religious minorities.
190

Table 5.34 : Districtwise Composition of Population based on Religion
Percentage share of District
Hindu Muslims Christians Others Araria 58.55 41.14 0.00 0.32 Aurangabad 90.14 9.74 0.00 0.12 Banka 87.60 11.81 0.00 0.58 Begusarai 86.54 13.35 0.00 0.11 Bhagalpur 82.16 17.47 0.08 0.29 Bhojpur 92.57 7.28 0.00 0.15 Buxar 93.35 6.16 0.00 0.49 Darbhanga 77.17 22.73 0.00 0.11 E.Champaran 77.98 21.25 0.00 0.77 Gaya 88.21 11.62 0.00 0.18 Gopalganj 82.89 17.06 0.00 0.05 Jamui 86.71 12.18 0.00 1.11 Jehanabad 91.73 8.20 0.00 0.07 Kaimur 90.13 9.55 0.00 0.33 Katihar 56.99 42.53 0.21 0.28 Khagaria 89.61 10.27 0.00 0.12 Kishanganj 31.86 67.58 0.22 0.34 Lakhisarai 95.51 4.41 0.00 0.08 Madhepura 88.56 11.37 0.00 0.07 Madhubani 81.97 17.94 0.00 0.09 Munger 91.86 7.89 0.10 0.14 Muzaffarpur 84.56 15.32 0.00 0.12 Nalanda 92.45 7.46 0.00 0.09 Nawada 88.65 11.30 0.00 0.06 Patna 91.84 7.76 0.19 0.21 Purnea 62.30 36.76 0.00 0.94 Rohtas 89.73 10.07 0.00 0.20 Saharsa 85.49 14.45 0.03 0.03 Samastipur 89.42 10.48 0.00 0.09 Saran 89.55 10.40 0.00 0.05 Sheikhpura 92.68 7.18 0.07 0.07 Sheohar 84.33 15.52 0.00 0.15 Sitamarhi 78.71 21.21 0.00 0.08 Siwan 81.74 18.21 0.00 0.06 Supaul 82.31 17.44 0.11 0.14 Vaishali 90.41 9.53 0.00 0.06 W.Champaran 80.75 19.16 0.00 0.09
Bihar 83.23 16.53 0.03 0.21
The largest population share of Muslims are in Araria (41.14 percent), Purnea (36.76 percent),
Katihar (42.53 percent) and Kishanganj (67.58 percent) while the lowest is in Lakhisarai (4.4
perecent). Kishanganj and Katihar also have the largest share of Christians in the population.
191

The state government is committed to the welfare of the minorities in Bihar. In view of the special
socio-economic problems faced by the minorities, the state government has launched several
welfare schemes for their upliftment as targeted programmes.
Welfare Measures for Minorities
Construction of hostels for minority students, separately for boys and girls.
Minority community building cum Haj house
Construction of monuments in memory of great personalities from the minority
community
Share capital provision of the state for the National Minority Development and Finance
Corporation and the Bihar State Minority Financial Corporation.
Computerization of Wakf property
Grants for development and protection of Wakf property
Merit cum means Scholarships for students in colleges.
Mukhyamantri Alpsankhyak Vidyarthi Protsahan Yojana for encouraging minority
students.
Mukhyamantri Shram Shakti Yojana for training of minority artisan and unemployed
youth.
Financial assistance to abandoned Muslim women.
Coaching of minority students preparing for various competitive examinations.
192

Appendix I
Districtwise Enrolement 2003-04
2003-04
ALL SC ST SI. No.
District Name
Primary (I-V)
Upper Primary
(VI-VIII)
Total (I-VIII)
Primary (1- V)
Upper Primary
(VI-VIII)
Total (I-VIII)
Primary ( I-V)
Upper Primary
(VI-VIII)
Total (I-VIII)
1 Araria 184908 19635 204543 21424 1577 23001 3068 275 33432 Aurangabad 274660 46038 320698 61394 7813 69207 513 271 7843 Banka 175924 16630 192554 20172 1445 21617 6613 446 70594 Begusarai 263717 31940 295657 43913 3583 47496 2487 313 28005 Bhagalpur 262798 31734 294532 31065 2810 33875 7732 960 86926 Bhojpur 295868 43287 339155 43567 5288 48855 919 164 10837 Buxar 179991 33324 213315 23251 3796 27047 647 209 8568 Darbhanga 358063 51469 409532 56133 5603 61736 720 36 7569 Gaya 467060 67152 534212 141368 11584 152952 203 101 304
10 Gopalganj 269874 34833 304707 39138 3687 42825 12 0 1211 Jamui 159867 19207 179074 24592 1861 26453 7415 381 779612 Jehanabad 179983 34025 214008 38690 5166 43856 319 23 34213 Kaimur 186814 33098 219912 45947 6783 52730 6455 164 661914 Katihar 242474 38494 280968 24063 3123 27186 12809 1997 1480615 Khagaria 160460 17077 177537 19302 1344 20646 13 0 1316 Kishanganj 132612 11654 144266 12288 1031 13319 4688 278 496617 Lakhisarai 84013 18212 102225 10953 1998 12951 1093 245 133818 Madhepura 228403 22828 251231 34971 2202 37173 1889 248 213719 Madhubani 476601 74376 550977 68928 5782 74710 471 62 53320 Munger 134595 30212 164807 18514 2962 21476 2175 145 232021 Muzaffarpur 516310 63695 580005 95070 7958 103028 0 0 022 Nalanda 286527 51792 338319 60966 7152 68118 607 31 63823 Nawada 167675 21476 189151 41190 3129 44319 756 215 97124 W. Champaran 349140 39622 388762 54902 3897 58799 15165 1384 1654925 Patna 471349 74082 545431 106928 10424 117352 2448 243 269126 E. Champaran 473206 52149 525355 66865 4572 71437 1573 283 185627 Purnea 261473 29865 291338 28476 2223 30699 10337 1070 1140728 Rohtas 281861 89738 371599 56717 11862 68579 3560 834 439429 Saharsa 180366 22895 203261 26678 2157 28835 763 77 84030 Samastipur 352598 57973 410571 64581 7087 71668 2076 480 255631 Saran 396081 78429 474510 48017 7991 56008 450 51 50132 Sheikhpura 59891 9626 69517 10531 1141 11672 241 6 24733 Sheohar 62471 6329 68800 9262 516 9778 36 0 3634 Sitamarhi 286694 41348 328042 37258 2797 40055 489 106 59535 Siwan 342838 71530 414368 48102 7347 55449 1292 590 188236 Supaul 194493 29493 223986 29009 2810 31819 1773 202 197537 Vaishali 330699 67193 397892 66418 8230 74648 27527 350 27877 Total 9732357 1482460 11214817 1630643 170731 1801374 129334 12240 141574
(Contd.)
193

Appendix I (Contd.)
Districtwise Enrolement 2004-05
2004-05
ALL SC ST SI. No.
District Name
Primary (I-V)
Upper Primary
(VI-VIII)
Total (I-VIII)
Primary (1- V)
Upper Primary
(VI-VIII)
Total (I-VIII)
Primary ( I-V)
Upper Primary
(VI-VIII)
Total (I-VIII)
1 Araria 252204 35591 287795 25578 2363 27941 3161 338 34992 Aurangabad 290795 62972 353767 63289 9681 72970 461 159 6203 Banka 213535 19285 232820 22452 1751 24203 9266 781 41194 Begusarai 321703 39040 360743 46258 4274 50532 1714 265 19795 Bhagalpur 307649 38522 346171 39983 3832 43815 13008 2706 157146 Bhojpur 314264 56326 370590 48507 7416 55923 820 170 176937 Buxar 192408 40373 232781 25441 4385 29826 675 483 11588 Darbhanga 382041 67188 449229 61715 6806 68521 569 114 6839 Gaya 503491 90602 594093 156797 17953 174750 2207 189 1841
10 Gopalganj 294681 54471 349152 42664 5732 48396 1 0 111 Jamui 160627 23375 184002 25486 2529 28015 7807 313 812012 Jehanabad 201741 44788 246529 41891 6290 48181 0 0 812113 Kaimur 222779 49147 271926 54540 10611 65151 8791 631 942214 Katihar 258432 44691 303123 24516 4309 28825 14305 2366 1667115 Khagaria 167800 23539 191339 23427 2312 25739 214 0 2609316 Kishanganj 144344 13052 157396 12793 1303 14096 5696 372 606817 Lakhisarai 105939 29873 135812 15233 2793 18026 958 236 119418 Madhepura 219268 24821 244089 34534 2323 36857 1932 175 726219 Madhubani 512501 91351 603852 73664 7446 81110 1011 255 126620 Munger 135079 40057 175136 17761 4207 21968 2720 456 317621 Muzaffarpur 580411 92465 672876 109220 11556 120776 0 0 444222 Nalanda 321857 75007 396864 67567 9519 77086 181 22 20323 Nawada 216783 64823 281606 50586 18591 69177 837 15 85224 W. Champaran 385218 48673 433891 57590 5290 62880 19870 1881 105525 Patna 498777 92624 591401 96609 8976 105585 2159 139 229826 E. Champaran 542057 74944 617001 74000 6751 80751 381 5 38627 Purnea 341291 35435 376726 40433 2621 43054 6498 1179 268428 Rohtas 314091 102031 416122 63871 15599 79470 3485 976 446129 Saharsa 182364 25567 207931 26679 2178 28857 579 78 65730 Samastipur 434508 72556 507064 75945 8490 84435 2231 403 511831 Saran 472381 97065 569446 60505 10646 71151 4232 833 506532 Sheikhpura 65195 9511 74706 10710 1115 11825 734 188 92233 Sheohar 68013 7764 75777 9807 576 10383 0 0 598734 Sitamarhi 295015 49139 344154 38858 3799 42657 291 37 32835 Siwan 386699 86842 473541 52121 8578 60699 1003 512 151536 Supaul 243498 36932 280430 35648 3218 38866 3274 516 184337 Vaishali 367696 75771 443467 76327 10687 87014 1350 244 1594 Total 10917135 1936213 12853348 1803005 236506 2039511 122421 17037 139458
(Contd.)
194

Appendix I (Contd.)
Districtwise Enrolement 2005-06
2005-06
ALL SC ST SI. No.
District Name
Primary (I-V)
Upper Primary
(VI-VIII)
Total (I-VIII)
Primary (1- V)
Upper Primary
(VI-VIII)
Total (I-VIII)
Primary ( I-V)
Upper Primary
(VI-VIII)
Total (I-VIII)
1 Araria 262710 47001 309711 30905 3805 34710 4278 1400 56782 Aurangabad 285849 66636 352485 73311 11871 85182 1062 145 12073 Banka 196532 26069 222601 25669 2537 28206 9685 856 68854 Begusarai 380444 49939 430383 4345 44 4389 101 0 1015 Bhagalpur 315697 49551 365248 37414 4888 42302 10545 1542 120876 Bhojpur 325939 72562 398501 47250 8534 55784 433 80 121887 Buxar 189899 56167 246066 28957 6409 35366 605 262 8678 Darbhanga 399964 77446 477410 59940 6239 66179 3158 402 35609 Gaya 518692 105990 624682 164187 20662 184849 259 38 4427
10 Gopalganj 311862 67392 379254 44309 6578 50887 2591 304 289511 Jamui 178747 28804 207551 29451 3412 32863 12154 1174 1332812 Jehanabad 218612 52309 270921 45040 7259 52299 0 0 1622313 Kaimur 224116 61412 285528 54300 12977 67277 7293 1015 830814 Katihar 294107 51896 346003 26044 4571 30615 16984 2402 1938615 Khagaria 150119 25120 175239 21274 2599 23873 79 24 2769416 Kishanganj 152852 17542 170394 13001 1499 14500 6634 521 715517 Lakhisarai 110789 28806 139595 16184 2555 18739 744 34 77818 Madhepura 226199 31565 257764 35946 3489 39435 2390 508 793319 Madhubani 567691 103530 671221 82373 8488 90861 824 122 94620 Munger 137224 41733 178957 16967 3923 20890 3192 1034 422621 Muzaffarpur 598527 105100 703627 107864 12898 120762 750 151 517222 Nalanda 314811 72386 387197 66896 9537 76433 1015 185 120023 Nawada 194908 34539 229447 47803 5190 52993 2384 573 295724 W. Champaran 408947 57739 466686 61585 6847 68432 22266 2485 415725 Patna 510653 115646 626299 108379 14510 122889 3736 708 444426 E. Champaran 501873 77490 579363 67211 7307 74518 3380 469 384927 Purnea 359375 41214 400589 38204 3692 41896 12813 1876 829328 Rohtas 327699 107549 435248 66409 15891 82300 4851 746 559729 Saharsa 186929 28886 215815 26419 2194 28613 1342 221 156330 Samastipur 463475 82771 546246 81267 9481 90748 4693 557 716031 Saran 459201 107733 566934 57791 9556 67347 3095 911 400632 Sheikhpura 68273 11960 80233 12242 1458 13700 1168 290 145833 Sheohar 68613 9254 77867 10083 848 10931 51 2 546434 Sitamarhi 316415 55356 371771 42212 4495 46707 884 147 103135 Siwan 367271 71019 438290 48882 7624 56506 1902 579 248136 Supaul 233466 34896 268362 35528 3055 38583 1733 267 351237 Vaishali 405110 88445 493555 83456 13455 96911 711 71 782 Total 11233590 2163453 13397043 1819098 250377 2069475 149785 22101 171886
(Contd.)
195

Appendix I (Contd.)
Districtwise Enrolement 2006-07
2006-07
ALL SC ST SI. No.
District Name
Primary (I-V)
Upper Primary
(VI-VIII)
Total (I-VIII)
Primary (1- V)
Upper Primary
(VI-VIII)
Total (I-VIII)
Primary ( I-V)
Upper Primary
(VI-VIII)
Total (I-VIII)
1 Araria 408060 36586 444646 65796 5892 71688 59130 5805 649352 Aurangabad 308789 81808 390597 78338 13959 92297 2200 709 29093 Banka 223117 37597 260714 21739 3180 24919 9155 874 100294 Begusarai 405328 65635 470963 52251 5703 57954 1278 198 14765 Bhagalpur 352016 45115 397131 31073 3801 34874 9280 1181 104616 Bhojpur 462756 110813 573569 112967 23272 136239 501 16 5177 Buxar 219882 66050 285932 41426 10814 52240 0 0 08 Darbhanga 424538 87489 512027 66113 8367 74480 3016 575 35919 Gaya 533684 100177 633861 182897 22362 205259 1824 144 1968
10 Gopalganj 320466 72303 392769 46850 8996 55846 772 827 159911 Jamui 194143 33773 227916 29723 4120 33843 8677 433 911012 Jehanabad 215808 55172 270980 44024 7651 51675 357 0 35713 Kaimur 235704 67504 303208 53644 13266 66910 6635 806 744114 Katihar 352796 57535 410331 56297 9312 65609 28880 3464 3234415 Khagaria 176828 33318 210146 24425 3075 27500 1953 546 249916 Kishanganj 157648 24231 181879 14172 1884 16056 6608 583 719117 Lakhisarai 109686 27283 136969 16340 2452 18792 710 15 72518 Madhepura 253369 45129 298498 64771 8524 73295 1441 260 170119 Madhubani 554057 123964 678021 77555 10889 88444 1526 81 160720 Munger 164189 39723 203912 21580 4609 26189 3608 508 411621 Muzaffarpur 640827 130348 771175 97825 14962 112787 429 57 48622 Nalanda 368569 98536 467105 78855 16330 95185 1612 436 204823 Nawada 241003 39419 280422 60983 5783 66766 1041 133 117424 W. Champaran 426473 75961 502434 59641 7802 67443 26411 3628 3003925 Patna 555109 137617 692726 115050 17374 132424 1209 309 151826 E. Champaran 563602 104218 667820 73541 9719 83260 1198 135 133327 Purnea 456595 57038 513633 59778 6029 65807 31851 3442 3529328 Rohtas 318133 103915 422048 70881 16020 86901 4162 707 486929 Saharsa 220160 42487 262647 27130 3215 30345 641 108 74930 Samastipur 648690 115609 764299 148023 20512 168535 7591 480 807131 Saran 457116 115964 573080 62372 11949 74321 1202 466 166832 Sheikhpura 66173 12533 78706 13040 1539 14579 448 30 47833 Sheohar 72744 10001 82745 11875 884 12759 293 3 29634 Sitamarhi 360064 61963 422027 48205 5164 53369 328 155 48335 Siwan 381068 109171 490239 48669 10742 59411 348 192 54036 Supaul 249616 43982 293598 39396 4165 43561 1377 302 167937 Vaishali 428311 92351 520662 94846 12653 107499 489 58 547 Total 12527117 2562318 15089435 2212091 336970 2549061 228181 27666 255847
(Concluded)
196

Appendix II
Districtwise Status of Regular & Contractual Doctors
Doctors Regualar (Govt.) Contractual Name of the
District Sanction Working Vacant Sanction Working Vacant
No of Doctors per Lakh
of Population
Khagaria 56 39 17 34 29 5 49 Gopalganj 101 52 49 69 42 27 38 Aurangabad 176 83 93 49 34 15 18 Jehanabad 98 65 33 40 34 6 11 Sheikhpura 64 34 30 33 14 19 8 Lakhisarai 46 42 4 30 30 0 8 Munger 63 61 2 44 26 18 7 Nalanda 153 98 55 95 58 37 7 Bhojpur 119 97 22 60 41 19 6 Bhahalpur 149 93 56 75 68 7 6 Samastipur 192 141 51 95 70 25 6 Sheohar 59 22 37 19 12 7 6 Begusarai 107 74 33 94 53 41 6 Vaishali 139 80 59 71 49 22 5 Buxar 74 47 27 54 23 31 5 Patna 294 211 83 92 69 23 5 Saharsa 92 47 45 45 23 22 5 Siwan 134 76 58 89 47 42 5 Nawada 111 71 40 45 24 21 5 Rohtas 158 82 76 89 44 45 5 Banka 95 55 40 47 35 12 5 Sitamarhi 121 84 37 52 35 17 4 Supaul 90 54 36 49 28 21 4 Darbhanga 132 88 44 72 65 7 4 Jamui 91 41 50 38 27 11 4 E. Champaran 179 104 75 128 74 54 4 Gaya 191 92 99 106 62 44 4 W. Champaran 208 81 127 83 46 37 4 Saran 145 105 40 94 36 58 4 Katihar 113 67 46 78 34 44 4 Muzaffarpur 165 86 79 70 59 11 3 Purnea 116 65 51 64 35 29 3 Madhepura 96 50 46 67 8 59 3 Kaimur 89 29 60 48 19 29 3 Araria 111 52 59 36 14 22 3 Madhubani 213 97 116 67 8 59 3 Kishangani 52 30 22 28 4 24 2 Arwal 51 17 34 20 13 7 1 Total 4643 2712 1931 2369 1392 977 5 Percentage of total sanctioned
58.4 41.6 58.8 41.2
197

Appendix III
Districtwise Details of Grade- 'A' Nurse
Staff Nurse Regular Contractual Name of
Districts Sanctioned
In Position
Vacant SanctionedIn
PositionVacant
A Grade Staff Nurse working per
lakh of population
Khagaria 11 56 47 9 41 Gopalganj 18 7 11 84 13 71 8 Jamui 13 10 3 60 45 15 6 Sheikhpura 10 4 6 36 27 9 5 Bhagalpur 18 18 0 122 82 40 4 Nalanda 36 33 3 110 52 58 4 Banka 18 11 7 72 56 16 3 Begusarai 23 23 0 102 50 52 3 Munger 20 20 0 48 21 27 3 Saharsa 30 21 9 82 24 58 3 Jahanabad 13 5 8 64 34 30 2 Gaya 26 17 9 152 71 81 2 Purnea 36 20 16 110 46 64 2 Darbhanga 8 4 4 154 64 90 2 Katihar 24 17 7 104 31 73 2 Muzaffarpur 21 17 4 160 55 105 2 Aurangabad 21 10 11 62 30 32 2 Madhepura 38 18 20 70 10 60 2 Kishanganj 6 6 0 44 19 25 2 Sitamarhi 17 13 4 120 28 92 2 Arwal 0 0 0 128 10 118 1 Nawada 82 24 58 1 Madhubani 42 16 26 190 32 158 1 Saran 33 28 5 142 14 128 1 Supaul 11 1 10 82 18 64 1 E. Champaran 24 17 7 164 25 139 1 Kaimur 28 10 18 82 4 78 1 Lakhisarai 10 9 1 38 0 38 1 Samastipur 22 20 2 164 10 154 1 Rohtas 20 10 10 88 11 77 1 Bhojpur 20 11 9 88 6 82 1 Araria 17 8 9 96 10 86 1 Siwan 8 6 2 114 12 102 1 Vaishali 118 9 109 118 8 110 1 Patna 43 28 15 212 0 212 1 Buxar 2 2 0 68 4 64 0 W. Champaran 12 3 9 120 11 109 0 Sheohar 6 1 5 22 1 21 0 Total 812 464 359 3810 1005 2805 2 Percentage of total sanctioned
57.1 44.2 26.4 73.6
198

Appendix IV
District Wise Details of ANM
A.N.M
Regular Contractual Name of Districts
Sanctioned In
Position Vacant Sanctioned
In Position
Vacant
ANMs working per
lakh of population
Khagaria 209 180 29 193 143 50 231 Gopalganj 266 250 16 186 40 146 116 Sheikhpura 122 110 12 85 64 21 29 Nalanda 405 405 0 370 272 98 29 Begusarai 370 370 0 360 195 165 25 Munger 167 167 0 165 144 21 24 Bhagalpur 394 384 10 362 269 93 24 Jahanabad 156 149 7 151 65 86 23 Vaishali 419 381 38 418 195 223 23 Lakhisarai 131 131 0 102 74 28 22 Buxar 212 212 0 162 92 70 22 Gaya 583 531 52 541 260 281 21 Muzaffarpur 583 583 0 583 278 305 21 Bhojpur 366 345 21 284 111 173 20 Banka 242 236 6 265 156 109 20 Samastipur 456 436 20 486 274 212 19 Kaimur 147 141 6 167 136 31 19 Jamui 230 213 17 212 82 130 18 Rohtas 286 280 6 308 195 113 18 Aurangabad 338 306 32 285 80 205 16 Saran 512 487 25 507 111 396 16 Arwal 87 69 18 78 38 40 16 Patna 545 545 0 418 329 89 16 Sitamarhi 300 289 11 213 95 118 14 Katihar 362 295 67 345 67 278 13 Purnea 356 310 46 370 85 285 13 Siwan 370 193 177 140 140 0 13 Saharsa 180 155 25 152 28 124 13 Darbhanga 351 265 86 419 180 239 12 W. Champaran 457 344 113 571 46 399 12 Madhubani 561 365 196 429 49 380 10 E. Champaran 419 291 128 503 104 399 9 Araria 274 170 104 290 34 256 9 Supaul 347 108 239 247 19 228 7 Nawada 223 102 121 5 Sheohar 48 23 25 34 5 29 5 Kishanganj 0 0 0 186 10 176 1 Madhepara 0 136 0 136 0 Total 11251 9719 1532 10946 4567 6253 16 Percentage of total sanctioned
86.4 13.6 41.7 57.1
199

Appendix V
Districtwise Details of ASHA Workers
Name of the District
No. of ASHA
Selection Target
ASHA Selection till now.
No. of ASH A Trained
No. of District Level
Trainer Trained
No. of Block level
Trainer Trained
Percentageof selection
Percentage of trained Candidate
No of Asha per Lakh of
Population
No of Trained
Ashas per lakh of
populationGopalganj 2022 2015 1868 4 33 100 92 806 747 Khagaria 1204 1001 967 4 24 83 80 715 691 Jamui 1296 1270 1270 5 53 98 98 137 137 Vaishali 2532 2532 2532 5 64 100 100 100 100 Siwan 2565 2538 2538 5 75 99 99 99 99 Arwal 669 644 644 3 5 96 96 97 97 Begusarai 2242 2107 2018 4 61 94 90 93 90 Samastipur 3271 3214 3214 5 92 98 98 87 87 Kaimur 1247 1247 1247 4 18 100 100 86 86 Nalanda 2017 2017 2017 4 57 100 100 85 85 Araria 2026 2026 2026 3 36 100 100 84 84 Sitamarhi 2529 2223 1665 4 65 88 66 83 62 Darbhanga 3028 2890 2890 4 56 95 95 80 80 Madhepura 1460 1403 1403 5 65 96 96 80 80 W. Champaran 2734 2594 2550 5 53 95 93 79 77 Supaul 1644 1492 1477 8 19 91 90 79 78 Sheohar 495 464 464 5 35 94 94 77 77 Banka 1552 1535 1455 4 40 99 94 77 73 Buxar 1273 1074 1074 4 50 84 84 77 77 Nawada 1671 1531 1284 4 42 92 77 77 64 Purnea 2322 2263 2002 4 34 97 86 75 67 Muzaffarpur 3398 3078 2544 4 70 91 75 74 61 Sheikhpura 444 439 426 4 30 99 96 74 72 Rohtas 2124 1972 1972 3 52 93 93 73 73 Bhojpur 1931 1621 1621 5 31 84 84 73 73 Madhubani 3451 3024 2751 5 70 88 80 72 66 Saran 2950 2658 2289 5 59 90 78 72 62 Bhagalpur 1971 1936 1877 4 46 98 95 72 70 Katihar 2174 1866 1486 4 48 86 68 69 55 Gaya 2997 2613 2440 5 90 87 81 69 64 E. Champaran 3689 2910 2686 5 135 79 73 68 62 Kishanganj 1167 1064 648 4 17 91 56 67 41 Aurangabad 1842 1552 1552 3 33 84 84 66 66 Munger 820 820 820 2 26 100 100 64 64 Lakhisarai 684 568 568 4 6 83 83 60 60 Saharsa 1383 777 777 4 46 56 56 54 54 Jehanabad 769 769 769 3 6 100 100 48 48 Patna 2757 2549 2549 4 70 92 92 46 46 Total 74350 68296 64380 161 1812 92 87 78 74
200

Appendix VI
Districtwise Institutional Deliveries April-07 to March-08 Sl. No.
Districts Apr-07
May-07
Jun-07
Jul-07Aug-
07 Sep-07 Oct-07 Nov-07
Dec-07
Jan-08
Feb-08
Mar-08
1 Araria 680 650 762 1283 2196 2849 3274 3039 2198 1874 1803 1891
2 Arwal 155 221 298 438 760 933 1030 1462 1483 846 718 6263 Aurangabad 926 1159 1265 1588 2244 3054 3662 3895 2384 1694 2315 25384 Banka 1023 1253 1375 1440 1952 2830 3807 2934 1379 1828 1763 1907
5 Begusarai 1069 1272 1762 2642 3535 3707 4004 3730 2732 3218 2786 3412
6 Bhagalpur 1161 1150 1483 2258 3489 4461 5625 4457 3225 3632 3084 3375
7 Bhojpur 350 473 993 1404 2608 2811 2967 2967 2535 2287 1992 2391
8 Buxar 188 254 478 889 1569 1721 1840 1567 109 899 1006 10519 E. Champaran 563 742 958 1325 1801 2927 3351 2476 1891 2213 2205 2308
10 W. Champaran 1012 905 1093 1746 916 4546 4474 4431 3891 3231 3062 350511 Darbhanga 258 372 558 1143 1657 2330 2928 3291 2759 3148 2442 260112 Gaya 253 546 711 1078 1546 2306 2510 2326 1519 1537 1224 126713 Gopalganj 932 782 892 1195 2062 2610 2749 2642 2065 2677 2520 258814 Jahanabad 89 179 385 715 1171 1551 1967 1932 1711 1399 1202 106515 Jamui 239 236 629 663 1286 2072 2177 2016 1705 1564 1482 114916 Kaimur 552 592 506 1000 1919 2317 2324 2157 1545 1365 1239 128017 Katihar 300 378 502 1764 2064 1626 1276 1579 118 516 631 74218 Khagaria 541 815 1086 1502 1734 2269 2361 1353 1268 1786 1573 174719 Kishanganj 347 179 410 291 3817 690 987 1025 1045 1245 1102 101920 Lakhisarai 282 505 534 859 1131 1373 1479 1379 821 926 772 81121 Madhepura 242 434 590 1005 1565 2922 2345 2235 1816 1313 1251 122122 Madhubani 494 742 750 490 1181 2092 1993 2023 511 1236 1884 203023 Munger 337 432 533 1273 1874 2284 2835 1852 1458 1448 1523 148024 Muzaffarpur 370 348 701 970 701 2699 2095 2284 1558 1309 952 115525 Nalanda 800 1119 994 1679 2972 3616 3494 2938 2472 2252 1994 243926 Nawada 436 783 789 975 1389 1628 1612 1775 1423 1474 1258 125727 Patna 880 1233 1673 2299 3843 8457 4212 5899 5284 4646 3941 291628 Purnea 1118 1409 1400 1854 3181 6968 4592 3762 2652 2693 2892 298029 Rohtas 255 371 582 1075 1756 2589 3758 3413 2807 2609 2745 236230 Saharsa 425 650 749 1302 1757 2105 2261 1966 760 1046 1368 89031 Samastipur 3193 3714 3987 6007 6468 8019 8067 7491 5002 7030 6293 609132 Saran 428 753 772 1110 2117 2810 2739 3147 2343 2768 3160 408533 Sheikhpura 412 562 637 995 1399 1844 1890 1537 313 838 718 72234 Sheohar 43 58 67 144 212 268 306 261 171 161 161 19335 Sitamarhi 279 304 566 1068 1735 2687 3113 2511 935 1294 1222 145236 Siwan 799 757 816 1571 2459 2815 2851 2319 1745 2243 2216 204837 Supaul 821 832 1013 1185 1740 2684 3026 2539 1703 1574 1455 147538 Vaishali 552 701 875 1980 2859 3511 3582 4276 3397 4328 4093 4342 Total 22804 27865 34174 52205 78665 108981 109563 102886 72733 78147 74047 76411 Grand Total 838481
201

Appendix VII
Fund Disbursement to Distric Health Society upto 24.12.2008
SI. No. District NRHM-A NRHM-B NRHM-C Others Total (upto
24.12.08) 1 Araria 10939250 7167020 2408430 272354 207870542 Arwal 28749880 15283300 9941264 7175124 611495683 Aurangabad 15464000 14283560 8409410 903027 390599974 Banka 25999350 20221880 7604491 718109 545438305 Begusarai 29504600 24102855 14523345 928632 690594326 Bhagalpur 846000 27633345 13990224 1157174 436267437 Bhojpur 39079200 17502730 11065609 910337 685578768 Buxar 12879300 13485940 5101133 619814 320861879 E.Champaran 56990000 15852132 17871021 1338634 92051787
10 W.Champaran 44475300 11311032 14369145 1324507 7147998411 Darbhanga 22812700 22885245 20445598 773321 6691686412 Gaya 28115900 25338323 20193640 1177714 7482557713 Gopalganj 41755300 10732480 9300694 1225376 6301385014 Jamui 13046000 13067080 5735312 692729 3254112115 Jehanabad 8520800 14782420 5463659 12069932 4083681116 Kaimur 17813100 16873828 6420447 499140 4160651517 Katihar 31739750 12094320 13597756 839322 5827114818 Khagaria 26444400 16275840 7942381 624351 5128697219 Kishanganj 15040900 7739660 6362247 560490 2970329720 Lakhisarai 10709600 10217720 3741618 522958 2519189621 Madhepura 23669600 14306120 9542770 3959544 5147803422 Madhubani 25366000 21717780 23082044 1186664 7135248823 Munger 13149550 19191720 7266677 659501 4026744824 Muzaffarpur 21368000 29960172 21326159 974684 7362901525 Nalanda 38876700 33865100 10140343 20306923 10318906626 Nawada 16119600 20119492 8731432 810149 4578067327 Patna 29638400 36832443 30458879 1937987 9886770928 Purnea 64334600 18802644 12231190 4400243 9976867729 Rohtas 38152700 21265160 10316881 1082698 7081743930 Saharsa 25846100 20165840 10275367 2988282 5927558931 Samastipur 79335000 27005980 20789442 2318386 12944880832 Saran 10346100 17113045 12008992 908771 4037690833 Sheikhpura 12952100 9338232 3225762 6201986 3171808034 Sheohar 3824000 6589100 2579660 357872 1335063235 Sitamarhi 13374000 17746140 12457976 762958 4434107436 Siwan 38551900 17064812 14807799 770228 7119473937 Supaul 30714400 18720140 10927711 6820804 6718305538 Vaishali 59340900 20088822 12202215 948565 9258050239 PMCH, Patna 6200000 7610085 0 0 1381008540 NMCH, Patna 1620000 3117775 0 0 473777541 JLNMCH,BGP 576000 4297000 0 0 487300042 ANMCH,Gaya 6056000 2639000 0 0 869500043 SKMCH,MUZ. 5500000 2639000 0 0 813900044 DMCH,Darbhanga 5900000 2639000 0 0 853900045 Rajvansi Nagar 0 2000000 0 0 2000000 CDPO Vehicle 0 5120000 0 0 5120000 Total 1051736980 716805312 436858723 91729290 2297130305
202

Appendix VIII
Percentage of Targets Achieved in Birth and Death Registration
Birth Death Name of District 2004 2005 2006 2004 2005 2006
Patna 20.79 23.39 35.23 45.05 54.46 63.37 Nalanda 16.67 16.55 12.49 24.44 24.09 17.80 Bhojpur 19.90 24.74 24.43 25.21 29.34 28.25 Buxar 8.35 7.80 11.91 15.32 15.25 16.21 Rohtas 8.94 18.70 17.46 16.46 29.39 24.90 Kaimur 14.24 12.84 13.52 21.24 27.46 26.10 Gaya 8.56 14.24 17.02 14.51 17.19 23.64 Jehanabad 21.35 28.93 23.99 23.58 31.66 26.34 Arwal 6.36 4.73 10.03 8.08 9.52 15.30 Nawada 15.23 10.87 19.46 17.89 12.09 19.72 Aurangabad 18.31 15.19 11.55 15.11 15.98 10.66 Saran 7.09 17.98 12.02 20.17 13.71 13.30 Siwan 14.06 15.98 14.94 24.21 24.15 24.54 Gopalganj 5.66 14.38 13.82 13.06 22.24 27.37 Muzaffarpur 17.54 25.12 33.03 19.19 20.88 24.92 E. Champaran 2.05 4.34 6.90 5.87 10.51 14.97 W. Champaran 14.10 16.96 20.63 20.21 19.70 20.19 Sitamarhi 2.38 3.83 7.58 5.17 6.53 9.98 Sheohar 1.69 3.69 9.04 3.50 9.30 9.72 Vaishali 9.04 16.76 30.35 19.97 22.73 27.39 Darbhanga 7.47 10.41 14.52 15.39 18.03 19.62 Madhubani 5.25 9.94 14.55 13.46 16.38 18.10 Samastipur 8.69 15.61 20.78 18.02 19.50 24.07 Munger 20.48 41.26 45.75 26.54 40.30 45.65 Lakhisarai 3.11 2.40 9.91 6.77 10.77 15.77 Sheikhpura 2.83 5.12 19.26 9.00 9.20 25.68 Jamui 26.63 28.37 18.46 29.15 51.93 26.63 Begusarai 8.86 15.06 15.94 14.98 21.71 19.33 Khagaria 15.35 30.82 33.56 18.39 29.94 29.74 Bhagalpur 8.68 19.38 22.38 18.85 25.93 32.96 Banka 10.97 20.04 14.91 17.59 21.16 17.35 Saharsha 7.51 8.51 14.96 8.18 8.54 16.56 Supaul 3.97 3.97 5.72 5.84 4.67 7.04 Madhepura 8.89 12.69 16.79 12.64 16.38 20.18 Purnea 13.43 25.87 24.55 14.75 25.67 22.54 Kishanganj 12.15 18.75 18.77 14.93 25.73 25.38 Araria 4.79 8.25 9.97 1.92 9.64 7.43 Katihar 11.73 29.39 33.23 19.67 23.80 19.16
Total 10.97 16.23 18.97 17.62 21.73 23.17
203

Appendix IX
Selected Health Indicators for Bihar
Urban Rural Total
Bihar India Bihar India Bihar India Indicator NFHS-
II NFHS-
III NFHS-
II NFHS-
III NFHS-
II NFHS-
III NFHS-
II NFHS-
III NFHS-
II NFHS-
III NFHS-
II NFHS-
III Trends in Vaccination Coverage (%)
22 46 61 58 11 31 37 39 12 33 42 44
Trends in Infant Mortality (per 1000 live births)
53 54 47 42 80 63 73 62 78 62 68 57
Trends in Any Antenatal Care (%)
67 53 86 91 32 32 60 72 34 34 66 77
Trends in Institutional Deliveries (%)
39 48 65 69 13 19 25 31 15 22 34 41
204

Appendix X
Districtwise Work Participation Ratio
Work Participation Ratio Share of Population SC ST All SC ST All Bihar 39.7 45.2 33.7 15.7 0.9
Gaya 43.7 41.2 36.8 29.6 0.1 Nawada 45.3 48 37.3 24.1 0.1 Aurangabad 39.1 41 33.3 23.5 0.1 Kaimur 39.3 42.6 34.4 22.2 2.8 Vaishali 35.7 45.9 28.8 20.7 0.1 Nalanda 44.7 54.3 38.1 20 0 Sheikhpura 46.1 48.3 37 19.7 0 Jehanabad 44.8 61 38.4 18.9 0.1 Samastipur 35.7 62.9 31.6 18.5 0.1 Rohtas 36.1 39.4 30.4 18.1 1 Jamui 47.7 47.4 42.7 17.4 4.8 Madhepura 46.3 51.6 44.8 17.1 0.6 Saharsha 46.3 47.2 39.1 16.1 0.3 Muzaffarpur 35.2 31.9 30.4 15.9 0.1 Lakhisarai 44.9 49.6 36.5 15.8 0.7 Darbhanga 36.1 44.2 31.2 15.5 0 Patna 37.6 46.1 30.2 15.5 0.2 Bhojpur 35.8 30.2 29.1 15.3 0.4 Supaul 46.6 45.8 42 14.8 0.3 Begusarai 35.5 27.6 31.8 14.5 0.1 Khagaria 42.2 53 36.5 14.5 0 Sheohar 35 23.4 31.2 14.4 0 W. Champaran 44.8 46.3 37.9 14.3 1.5 Buxar 35.1 31.3 29.1 14.1 0.6 Araria 48.2 51.1 39.5 13.6 1.4 Madhubani 39.6 30.6 34.3 13.5 0 Mungher 34 39.1 29.1 13.3 1.6 E. Champaran 38.3 37.5 32.7 13 0.1 Banka 42.5 48.6 39.6 12.4 4.7 Gopalganj 36.5 36 29.8 12.4 0.3 Purnea 46.9 47.1 37.8 12.3 4.4 Saran 32.3 30.2 26.5 12 0.2 Sitamarhi 35.9 31.6 31.9 11.8 0.1 Siwan 26.1 30.2 26.9 11.4 0.5 Bhagalpur 38.4 40.8 35.3 10.5 2.3 Katihar 42.3 45.8 37.5 8.7 5.9 Kishanganj 36.6 50 32.2 6.6 3.6 Arwal
205

206
Appendix XI
Districtwise Sectoral Distribution of Workers
SC - Sectoral Distribution of main Workers
ST - Sectoral Distribution of main Workers
Overall - Sectoral Distribution of main Workers
Cultiv-ators (%)
Agric-ultural Labou-
rers (%)
House-hold
Indust- ry
Workers (%)
Other Workers
(%)
Cultiva-tors (%)
Agricu-ltural
Labou-rers (%)
Household
Industry Workers
(%)
Other Workers
(%)
Cultiva-tors(%)
Agricultural
Labou-rers (%)
House-hold
Industry Workers
(%)
Other Workers
(%)
All Bihar 7.9 77.6 3.3 11.2 21.3 62.5 4 12 29 48 3.9 19Gaya 11.8 78.1 2.2 8 18.2 36.2 7.8 38 34 43.8 4.1 18Nawada 11.5 77.6 2.9 8 16.7 50.8 7.4 25 40 40.3 3.7 16Aurangabad 13.5 73.9 2.6 10 3.7 23.6 7 66 37 42.2 4.2 17Kaimur 11 78.3 2.2 8.5 33.5 40.3 3 23 34 48.6 3.5 14Vaishali 5.7 75.9 3.9 14.5 7.3 16.3 7.2 69 31 41.6 4.2 23Nalanda 8.7 78.2 3.3 9.7 4.7 25.6 8.2 62 36 42.1 4.6 18Sheikhpura 9.4 76.6 2.5 11.5 0 2 16.7 81 38 42.2 3.2 17Jehanabad 7.7 81.2 2.9 8.2 4 20 3.9 72 36 44.7 3.7 16Samastipur 4.6 78.9 3.2 13.3 4.2 44.7 0.7 50 27 47.4 4.4 21Rohtas 11.1 71.8 2.9 14.2 15.4 56.7 5.4 23 35 38.9 3.9 23Jamui 11.4 58.8 17.1 12.7 31.8 34.6 18.4 15 30 32.5 20.8 16Madhepura 6.4 88.1 1.4 4.1 35.2 53.4 5.7 5.6 33 56.3 1.8 8.7Saharsha 7.8 83.1 2.1 6.9 18.9 72.2 0.6 8.4 32 52.5 2.1 14Muzaffarpur 6.3 74.8 3.2 15.7 11.5 35 3.3 50 26 45.5 3.5 25Lakhisarai 8.2 76.6 3 12.2 14.2 62.8 2.6 20 32 43.6 2.9 21Darbhanga 5.2 77.9 3.6 13.2 6.2 38.2 0.3 55 23 51.1 4 22Patna 5.2 70.4 2.7 21.7 0.7 4 3.6 92 22 32.9 3.9 41Bhojpur 7.1 77.5 2.7 12.7 9.6 54 6.2 30 35 39.5 3.9 22Supaul 9.9 83.7 2.3 4.2 27.8 68.4 0.9 3 34 54.8 1.9 9Begusarai 4 72.1 5.8 18.2 1.9 12 0.5 86 19 47.9 6.9 26Khagaria 6.4 81.4 2.3 9.9 13.1 17 0.6 69 26 54.4 2.5 17Sheohar 2.9 90.4 2.5 4.3 6.7 33.3 0 60 26 61.3 2.3 11W. Champaran 4.7 85.7 2.5 7.1 13.2 79.4 1.2 6.2 21 62.3 2.6 14Buxar 10 74.9 2.5 12.6 5.3 51.3 5.6 38 36 40.1 3.9 20Araria 6.3 87.2 2.2 4.4 24 71.5 1.7 2.9 25 62.3 2 10Madhubani 5.5 84.7 2.9 6.9 34.3 38.2 5.7 22 31 52.8 3.4 13Mungher 5.3 61 4.5 29.2 10.5 54.8 4.7 30 16 41.6 4.5 38E. Champaran 6.1 83 2.4 8.4 17.2 60.4 2.6 20 27 54.8 2.8 15Banka 13.8 74.3 4.7 7.2 31.3 58.8 5.7 4.3 34 51.7 4.6 9.9Gopalganj 13 74 2.7 10.3 20.5 34.7 1.8 43 41 40.1 2.6 16Purnea 4.7 87.3 2.1 6 21.2 72.1 1.5 5.2 23 63.3 1.7 12Saran 8.8 72.2 3.3 15.6 19.2 37 2.4 41 36 37.5 4 23Sitamarhi 4.2 82.1 3.5 10.1 5 70.1 3.5 21 24 55.3 3.4 17Siwan 14.2 67.5 3.8 14.4 22.9 43.5 4.8 29 41 33.7 3.6 22Bhagalpur 6.6 68.2 5.3 20 19.6 68.9 1 11 20 48.2 7.4 25Katihar 5 79.9 3.4 11.8 19.4 72.7 1.7 6.1 22 61 2.5 14Kishanganj 5.8 70 5.6 18.7 12.5 83.6 0.5 3.4 26 57.6 2 14Arwal

CHAPTER VI
BANKING AND ALLIED SECTORS
The Reserve bank of India (RBI), in its Report on the Trends and Progress of Banking, 2007-08,
had noted that the global economy, after a sustained period of expansion, had entered into a phase
of downturn on account of the global financial crisis. The impact of this has been felt across the
entire landscape of the financial sector in India and across the states by varying degrees. The RBI
has noted that “Corporate earnings and credit quality eroded as input cost increased and demand
subsided in an environment of higher inflation and lower growth.” The most severely affected
sectors have been real estate, banking and automobiles in India. The national scenario, as analysed
by the RBI, shows a decline in the net interest income of Scheduled Commercial Banks (SCB) in
relation to their total assets due to a hardening of interest and deposit rates during 2007-08;
however, due to a simultaneous decline in the operating expenses of banks, they were able to
maintain their existing operating profits in relation to their total assets. Return on assets (RoA) of
SCBs improved moderately, while the return on equity (RoE) declined and ‘the capital to risk-
weighted asset ratio of SCBs, a measure of the capacity of the banking system to absorb losses’,
improved. While the operations of the urban cooperative banks (UCBs) witnessed impressive
growth during 2007-08, the rural cooperative banking sector, except State Cooperative
Agricultural and Rural Development Banks (SCARDBs), also performed well. But the Primary
Agricultural Credit Societies (PACS) and Primary Cooperative Agricultural and Rural
Development Banks (PCARDB) showed sub-optimal performance and incurred overall losses in
the country as a whole. The assistance sanctioned by Financial Institutions (FI) increased
substantially during 2007-08, as against a decline during the previous year, though the
disbursements had slowed down during the year. The capital adequacy ratio of FIs was higher than
the prescribed norm of 9 percent.
As economic development and bank operations are closely intertwined, each serving as an input to
the growth of the other, Bihar could not completely insulate itself against the overall impact of the
global meltdown and national trends as described above. As discussed later, they acted as serious
impediments to further expansion in the credit flow by the banks in Bihar. The following analysis
of the financial sector in Bihar takes into account three kinds of institutions functioning in the
207

state: (i) Scheduled Commercial Banks (SCB), (ii) Regional Rural Banks (RRB) and (iii)
Cooperative Banks. While the Scheduled Commercial Banks provide finance to both industry and
agriculture, the Regional Rural Banks and Cooperative Banks largely look after the requirements
of agriculture sector. Although the SCBs include both nationalised and private commercial banks,
plus the foreign banks, the present analysis is based on nationalised banks alone, the database on
which is satisfactory and, in any case, the presence of other commercial banks is very marginal in
Bihar. In addition, the analysis also includes the working of National Bank for Agriculture and
Rural Development (NABARD) which plays a substantive role in providing credit for agriculture
and rural development.
6.1 Banking Infrastructure
Scheduled Commercial Banks (SCB) : Table 6.1 shows the distribution of SCB branch offices in
Bihar during 2003-04 to 2007-08 and their growth. At the end of 2007-08, 61.9 percent of a total
of 3769 branches of commercial banks were located in rural areas, 20.8 percent in semi-urban and
the remaining 17.3 percent in urban and metropolitan areas. As regards growth in total number of
branches, after attaining the peak growth rate of nearly 1 percent in 2006-07, there was a sharp
decline in 2007-08 and, whatever little expansion was there, took place in urban areas only. The
urban branches have of course consistently increasing their share in the total number of branches,
from 12.4 percent in 2003-04 to 17.3 percent in 2007-08. From Table 6.2, it can be noted that
Bihar accounts for only 4.58 percent of all the SCB branches in the country, far less than its
population share of about 8 percent. Thus, average size of population served by a branch is more
than 31 thousand in Bihar, compared to the national average of about 15 thousand. From Table
6.3, it can further be seen that, with 30,698 bank employees as on March, 2007, more than one-
third of whom belong to the category of officers, Bihar accounts for only 3.41 percent of all the
SCB employees in India. Thus, apart from relatively less coverage, the branches of SCBs in Bihar
are also comparatively under-staffed.
Regional Rural Banks (RRB) : The total number of branches of RRBs in Bihar in 2006-07 was
only 1465. Over the years, there has been a small decrease in the number of branches of RRBs in
both Bihar and India (Table 6.4).
208

Cooperative Banks : The data for the number of branches of Cooperative Banks is shown in
Table 6.5. It may noted from the table that there has been no growth in this sector during
2006-07.
Table 6.1 : Distribution of Branches of SCBs in Bihar
Percentage Share in total Years (end
Marh) Total
Growth Rate
(Percent) Rural Semi-urban
Urban
2004 3618 0.25 68.7 18.9 12.4
2005 3646 0.77 68.0 18.9 13.1
2006 3678 0.80 63.6 20.6 15.8
2007 3712 0.92 63.0 20.7 16.3
2008 3769 0.32 61.9 20.8 17.3
Source : Statistical Tables Relating to Banks in India, 2007-08, RBI
Table 6.2 : Distribution of Branches of SCBs among States (2007-08)
States Rural Semi- Urban
Urban Total Percentage
Share Population per branch
Andhra Pradesh 37.00 23.27 39.73 6210 7.98 13752
Bihar 61.90 20.83 17.27 3769 4.85 31301
Gujarat 34.01 21.76 44.23 4269 5.49 13353
Haryana 32.71 20.12 47.17 2048 2.63 11387
Karnataka 37.38 19.84 42.78 5690 7.32 10691
Kerala 8.21 65.29 26.50 4030 5.18 9077
Madhya Pradesh 44.88 23.16 31.96 3855 4.96 24924
Maharashtra 28.43 17.58 53.99 7355 9.46 14403
Orissa 62.05 17.35 20.59 2593 3.33 15413
Punjab 34.09 28.01 37.90 3174 4.08 8505
Rajasthan 45.13 24.00 30.86 3833 4.93 16768
Tamil Nadu 28.88 29.04 42.08 5727 7.36 12146
Uttar Pradesh 50.40 17.33 32.27 9353 12.03 22565
West Bengal 45.57 11.52 42.91 5017 6.45 18087
All India 39.83 22.70 37.47 77773 100.00 15184
Source : Statistical Tables Relating to Banks in India, 2007-08, RBI
209

Table 6.3 : Distribution of Employees of SCBs as on March 31, 2007
Officers Clerks Sub-ordinates Total Region/State/
Union Territory Number Share (per cent)
Number Share (per cent)
Number Share (per cent)
Number Share (per cent)
Delhi 22485 6.47 17830 4.86 7887 4.26 48202 5.36
Haryana 8693 2.50 8396 2.29 4668 2.52 21757 2.42
Punjab 14678 4.22 14131 3.85 7468 4.04 36277 4.03
Rajasthan 13619 3.92 11904 3.25 7790 4.21 33313 3.70
Bihar 11412 3.28 11775 3.21 7511 4.06 30698 3.41
Orissa 8462 2.43 8576 2.34 5145 2.78 22183 2.47
West Bengal 22283 6.41 32852 8.96 16200 8.75 71335 7.93
Jharkhand 5720 1.65 6099 1.66 3484 1.88 15303 1.70
Chhattisgarh 4015 1.15 3417 0.93 2066 1.12 9498 1.06
Madhya Pradesh 14264 4.10 14028 3.83 8156 4.41 36448 4.05
Uttar Pradesh 32708 9.41 33602 9.16 19834 10.72 86144 9.58
Uttaranchal 3436 0.99 3406 0.93 2357 1.27 9199 1.02
Gujarat 18259 5.25 22012 6.00 11565 6.25 51836 5.76
Maharashtra 55376 15.93 58498 15.95 23171 12.52 137045 15.24
Andhra Pradesh 25812 7.42 22894 6.24 12368 6.68 61074 6.79
Karnataka 23297 6.70 26108 7.12 11794 6.37 61199 6.80
Kerala 15211 4.38 19671 5.36 8572 4.63 43454 4.83
Tamil Nadu 28212 8.11 31504 8.59 13335 7.21 73051 8.12
All India 347662 100.00 366700 100.00 185045 100.00 899407 100.00
Source : Statistical Tables Relating to Banks in India, 2007-08, RBI
Table 6.4 : Number of Branches of RRBs
2003-04 2004-05 2005-06 2006-07
All India 14663 14645 14607 14652
Bihar 1489 1487 1476 1465
Madhya Pradesh 1069 1064 1050 1050
Maharashtra 593 588 580 580
Rajasthan 1032 1027 1026 1033
Uttar Pradesh 2878 2869 2871 2884
West Bengal 894 897 898 899
Source : Money and Banking, Sept 2008, CMIE
210

Table 6.5 : Number of Branches of State and District Central Cooperative Banks (As on March 31)
State Cooperative Banks
District Central Cooperative
Banks
Total
Region / State
2006 2007 2006 2007 2006 2007
Haryana 13 13 359 359 372 372
Punjab 19 19 745 742 764 761
Rajasthan 13 13 390 392 403 405
Bihar 14 14 279 279 293 293
Orissa 14 14 311 311 325 325
West Bengal 45 46 261 260 306 306
Chattisgarh 1 5 198 198 199 203
Madhya Pradesh 22 22 834 834 856 856
Uttar Pradesh 29 30 1277 1300 1306 1330
Uttarakhand 2 2 198 200 200 202
Gujarat 1 1 1150 1144 1151 1145
Maharashtra 53 53 2704 3675 2757 3728
Andhra Pradesh 26 26 570 569 596 595
Karnataka 31 31 583 589 614 620
Kerala 20 20 612 628 632 648
Tamil Nadu 44 45 724 725 768 770
All-India 910 923 11613 12802 12523 13725
Source : Statistical Tables Relating to Banks in India, 2007-08, RBI
6.2 Deposits, Credits and Credit-Deposit Ratio
Table 6.6 shows the deposits and credits of scheduled commercial banks in Bihar vis-à-vis other
states and their shares in the total deposits and credits in the country. From this table, it is seen that
while there has been significant growth in total deposits in Bihar in 2007-08 over the previous
year by Rs 11,681 crore, the credit expanded by only Rs 3,712 crore. But Bihar’s share in the total
credit of scheduled commercial banks has remained practically the same at 0.9 percent over the
years. The per capita deposits and credits of scheduled commercial banks in these states are shown
in Table 6.7. We note that in terms of both per capita deposit and credit, Bihar ranks the lowest
211

among the major Indian states. While the per capita deposit of Bihar has increased significantly in
2007-08, the increase in per capita credit has not been appreciable. The banks need to take more
pro-active measures in increasing the credit flow by opening more branches in the unbanked areas.
It has been noted earlier that the expansion of bank branches in Bihar in 2007-08 has been
marginal.
Table 6.6 : Statewise Deposits and Credit of SCBs
Deposits Credits
Amount (Rs. crore)
Percentage share
Amount (Rs. crore)
Percentage share
Amount (Rs. crore)
Percentage share
Amount (Rs. crore)
Percentage share
State
2007 2008 2007 2008
Haryana 60669 2.3 74367 2.3 34951 1.8 45048 1.9
Punjab 84621 3.3 101046 3.1 52812 2.7 66998 2.8
Rajasthan 58973 2.3 73020 2.3 48656 2.5 59904 2.5
Bihar 56916 2.2 68597 2.1 17156 0.9 20373 0.9
Jharkhand 37196 1.4 43565 1.3 12629 0.6 15313 0.6
Orissa 41638 1.6 53732 1.7 26649 1.4 30396 1.3
West Bengal 150412 5.8 187610 5.8 94142 4.8 115255 4.8
Chhattisgarh 24427 0.9 30967 1.0 12948 0.7 16190 0.7
Madhya Pradesh 65498 2.5 81502 2.5 40737 2.1 49177 2.1
Uttar Pradesh 181006 7.0 213594 6.6 81699 4.2 95942 4.0
Uttarakhand 29318 1.1 36337 1.1 7911 0.4 9680 0.4
Gujarat 119224 4.6 152691 4.7 76916 3.9 99515 4.2
Maharashtra 655402 25.2 832063 25.8 642170 32.9 787840 32.9
Andhra Pradesh 141966 5.5 177567 5.5 124314 6.4 162595 6.8
Karnataka 171898 6.6 210349 6.5 133177 6.8 164110 6.9
Kerala 95282 3.7 109103 3.4 60615 3.1 71226 3.0
Tamil Nadu 163166 6.3 199949 6.2 183161 9.4 226830 9.5
All India 2598822 100.0 3228819 100.0 1949568 100.0 2394566 100.0
Source : Statistical Tables Relating to Banks in India, 2007-08, RBI
212
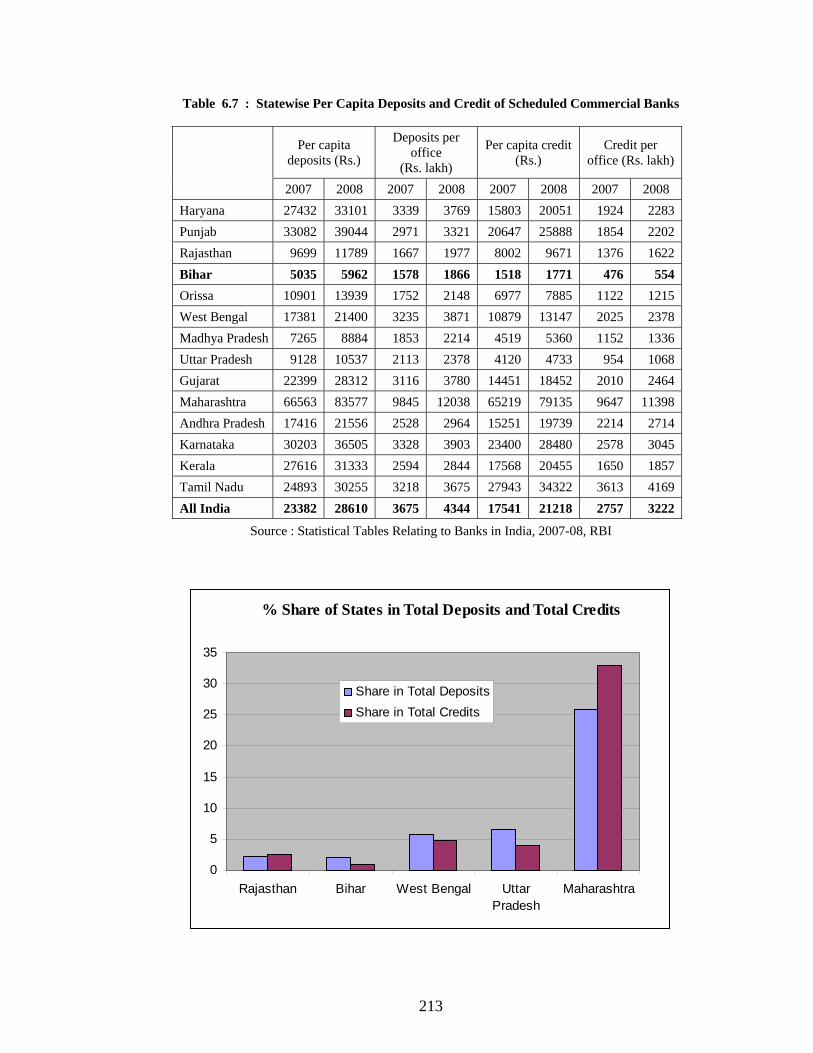
Table 6.7 : Statewise Per Capita Deposits and Credit of Scheduled Commercial Banks
Per capita deposits (Rs.)
Deposits per office
(Rs. lakh)
Per capita credit (Rs.)
Credit per office (Rs. lakh)
2007 2008 2007 2008 2007 2008 2007 2008
Haryana 27432 33101 3339 3769 15803 20051 1924 2283
Punjab 33082 39044 2971 3321 20647 25888 1854 2202
Rajasthan 9699 11789 1667 1977 8002 9671 1376 1622
Bihar 5035 5962 1578 1866 1518 1771 476 554
Orissa 10901 13939 1752 2148 6977 7885 1122 1215
West Bengal 17381 21400 3235 3871 10879 13147 2025 2378
Madhya Pradesh 7265 8884 1853 2214 4519 5360 1152 1336
Uttar Pradesh 9128 10537 2113 2378 4120 4733 954 1068
Gujarat 22399 28312 3116 3780 14451 18452 2010 2464
Maharashtra 66563 83577 9845 12038 65219 79135 9647 11398
Andhra Pradesh 17416 21556 2528 2964 15251 19739 2214 2714
Karnataka 30203 36505 3328 3903 23400 28480 2578 3045
Kerala 27616 31333 2594 2844 17568 20455 1650 1857
Tamil Nadu 24893 30255 3218 3675 27943 34322 3613 4169
All India 23382 28610 3675 4344 17541 21218 2757 3222
Source : Statistical Tables Relating to Banks in India, 2007-08, RBI
% Share of States in Total Deposits and Total Credits
0
5
10
15
20
25
30
35
Rajasthan Bihar West Bengal UttarPradesh
Maharashtra
Share in Total Deposits
Share in Total Credits
213

The Credit-Deposit Ratios (CDR) of all banks in Bihar during the last 5 years, according to data
released by the State Level Banker’s Committee (SLBC) were as under :
Mar 2004 Mar 2005 Mar 2006 Mar 2007 Mar 2008
26.81 29.86 32.10 34.38 32.35
The CD ratio of the banks depends mostly on the level of economic activity and the credit
absorption capacity of a particular state and is an indicator of the involvement of the banks in the
economic development of the state. Till the 1990s, CD ratio in Bihar was one of the lowest in the
country and there was no increase in the CD ratio in the state. After 2000-01, however, there has
been some improvement in the CD ratio, but even in 2007-08, it is still one of the lowest in the
country. The CD ratio of Bihar currently stands at 32.35 percent, far below the national average of
72.4 percent, and way behind the CD ratios of states like Maharastra (102.2 percent), Rajasthan
(82 percent), West Bengal (62.6 percent) and Madhya Pradesh (61.4 percent).
CDR of Bihar vis-a-vis Other States
0
20
40
60
80
100
120
Mar-04 Mar-05 Mar-06 Mar-07 Mar-08
Bihar MP RajasthanUP Maharastra West Bengal
In absolute terms, it means that if the current CD ratio of about 32 percent in the state were to
increase to the national level of around 72 percent, investments in the state would go up by
Rs. 27,000 crore, which is more than the current annual plan outlay of the state and would provide
214

the much-needed impetus to economic activities. Even a modest 50 percent CD ratio would boost
investments by Rs. 12,000 crore. The low disbursement of credit also indicates that the credit
requirements of the state are being met at higher rates of interest from private lending agencies,
eating into the profitability of enterprises in the state. This naturally is a serious hindrance to
industrial growth in the state. Further, this also indicates flight of capital away from the state.
The poor CD ratio of the state can be attributed to a number of factors such as poor credit
absorption capacity, poor basic infrastructure, apart from higher incidence of NPA (Non
Performing Assets) accounts. If the CD ratio is to be increased to a reasonable 40 percent in near
future, it would need huge investments which is possible only through Public-Private partnership,
as the state government would not be able to mobilize the required resources on its own. Efforts to
bring in large investments for infrastructure development such as urban development, transport,
civil aviation and industries need to be accelerated. The banks, on their part, should also commit
themselves to the task.
The CD ratios in Bihar, separately for SCBs, RRBs and Cooperative Banks, are shown in Tables
6.8 and 6.9. The CD ratio in Bihar is the highest (82 percent) for the Cooperative banks, followed
by Regional Rural Banks (42 percent), with the SCBs (29 percent) trailing far behind. It seems
that an encouraging investment climate in the state still remains a far cry.
Table 6.8 : Deposits and Credits of Different Bank Groups by Branch Locations in Bihar (2007-08) (Rs. crore)
Branch Locations Total
Rural Semi-Urban Urban/Metro Deposit Credit Bank Groups
Deposit Credit Deposit Credit Deposit Credit Deposit Credit
SCB 13103 4755 15798 4511 29673 7936 58574 17202
RRB 6329 2845 1730 574 761 258 8819 3678
Cooperative Bank — — — — 851 698 851 698
Total 19432 7600 17528 5085 31284 8892 68244 21577
215

Table 6.9 : Credit Deposit Ratio in Bihar for All Banks (2007-08)
Bank Deposit
(Rs. crore) Credit
(Rs. crore) CD Ratio
SCB 58574 17202 29.37
RRBs 8,819 3,678 41.70
Cooperative Banks 851 698 82.02
Total 68,244 21,577 31.62
RIDF — 500.00 —
Grand Total 68,244 22,077 32.35
As on March 2008, the aggregate deposits of all banks in Bihar were Rs. 68,244 crore, against a
credit of Rs 22,077 crore, giving a CD ratio of 32.35 percent, up from a pitiable 26.8 percent in
2003-04. Even before the process of liberalisation began in the early 1990s, the CD ratio of Bihar
used to be around 40 percent.
The CD ratio is conventionally calculated on the basis of credit sanctions. This connotes the extent
to which the banks employ the deposits mobilized in a state to meet the credit demands of the
state. However, while a low CD ratio based on credit sanctions would indicate the migration of
deposits from one state to another, a comparatively lower CD ratio based on credit utilization
would indicate the migration of credit. A comparison between these two types of ratios, therefore
assumes importance, particularly in the context of inter-state comparison of CD ratios where the
CD ratio based on utilisation would be the more appropriate. For the country as a whole, these two
ratios would evidently be identical, but within the states, there would be variation. The inequality
with respect to these two types of ratios has narrowed down substantially in the recent years,
because of the massive expansion of branches, especially in rural areas and also due to the change
in borrowers' attitude to seek credit from the banks located at the places of actual utilization. For
the SCBs, we note that Bihar’s utilisation ratio has substantially improved over the past two years,
indicating lesser migration of credit from the state compared to the earlier years (Table 6.10).
216

Table 6.10 : Credit Deposit Ratio of SCBs
2004-05 2005-06 2006-07 2007-08
As per
Sanction
As per
Utilisation
As per
Sanction
As per
Utilisation
As per
Sanction
As per
Utilisation
As per
Sanction
Haryana 51.4 63.2 57.4 69.6 56.9 68.4 60.6
Punjab 50.1 49.7 56.8 56.3 65.6 65.3 66.3
Rajasthan 68.7 76.5 77.3 86.0 82.9 90.9 82.0
Bihar 27.7 31.4 30.3 40.0 32.4 49.0 29.7
Jharkhand 29.6 30.6 31.2 31.6 32.8 33.3 35.1
Orissa 61.8 74.7 66.0 78.7 64.6 72.6 56.6
West Bengal 52.3 56.8 56.3 61.4 64.7 68.4 61.4
Chhattisgarh 43.6 49.9 45.5 52.5 50.0 58.3 52.3
Madhya Pradesh 54.7 61.2 60.5 67.2 61.8 64.6 60.3
Uttar Pradesh 37.9 42.2 41.0 46.3 45.1 50.4 44.9
Uttarakhand 24.3 29.1 25.8 30.9 26.7 32.1 26.6
Gujarat 46.5 60.9 55.6 75.3 63.7 88.4 65.2
Maharashtra 94.9 75.9 102.2 81.3 96.8 76.5 94.7
Andhra Pradesh 74.8 83.3 81.3 86.2 87.3 91.2 91.6
Karnataka 73.8 80.5 75.9 93.4 76.3 99.8 78.0
Kerala 54.6 57.5 61.4 64.3 60.9 63.8 65.3
Tamil Nadu 101.2 105.4 110.5 109.3 114.5 118.6 113.4
All India 66.0 66.0 72.4 72.4 75.0 75.0 74.2
Source : Statistical Tables Relating to Banks in India, 2007-08, RBI
6.3 CD Ratio of Different SCBs
Table 6.11 shows the CD ratios of different scheduled commercial banks in Bihar. Among the
Lead Banks, UCO Bank has the highest CD ratio of nearly 38.78 percent, down from 41.21
percent in the previous year. Among others, Syndicate Bank has the highest CD ratio of nearly
53.80 percent. For some banks, the CD ratios were very low, like the Corporation Bank (6.95
percent) or the Indian Overseas Bank (12.05 percent).
217

Table 6.11 : CD Ratio of Different Commercial Banks in Bihar
Banks 2004-05 2005-06 2006-07 2007-08
Lead Banks
State Bank of India 27.58 29.19 27.1 30.07
Central Bank of India 27.66 30.87 32.58 31.62
Punjab National Bank 28.36 28.74 26.63 25.02
Canara bank 31.21 32.86 34.88 29.93
UCO Bank 31.37 40.42 41.21 38.78
Bank of Baroda 21.93 52.94 52.04 30.37
Union Bank of India 45.39 47.78 42.17 37.41
Other Banks Bank of India 22.27 30.88 33.19 33.53
Allahabad Bank 38.66 40.61 38.76 32.52
Andhra Bank 10.50 11.28 20.47 18.07
Bank of Maharastra 72.12 49.92 40.29 20.45
Corporation Bank 10.27 16.21 08.99 06.95
Dena Bank 21.36 25.17 24.73 19.61
Indian Bank 17.93 22.25 23.74 23.52
Indian Overseas bank 23.76 16.50 13.11 12.05
Oriental Bank of Commerce 55.53 33.20 50.07 33.18
Punjab and Sind Bank 0 39.24 46.82 33.24
Syndicate Bank 39.47 49.06 57.37 53.80
United Bank of India 26.56 32.97 32.39 28.89
Vijaya Bank 19.41 20.89 23.19 24.61
State Bank of B&J 30.67 43.09 52.41 28.31
State Bank of Patiala 25.67 33.87 46.29 33.33
State Average 29.86 33.50 33.75 32.02
Note : For 2007-08, the figures are as on December 31, 2007
Source : State Level Bankers' Committee
6.4 CD Ratio of Different Districts
Tables 6.12 depicts the CD ratios of all scheduled commercial banks as well as the Regional Rural
Banks in different districts of Bihar during 2005-06 to 2007-08. From the Table, it can be seen
that, in 2007-08, the CD ratios across the districts show wide variations, from 20.66 percent in
Siwan to 48.99 percent in neighbouring West Champaran to 55.59 percent in Katihar; it is less
than 25 percent in Bhojpur, Lakhisarai, Munger, Saran and Siwan. It is above 50 percent in Araria,
Katihar, Kishanganj, Purnea and West Champaran. However, the high CD ratios in many districts
are related to high accumulated interests on previous loans; they do not necessarily reflect the
banks’ willingness to increase the ground level credit flow.
218

Table 6.12 : Districtwise CD Ratios in Bihar
District 2005-06 2006-07 2007-08 District 2005-06 2006-07 2007-08 Patna 29.64 32.18 27.64 East Champaran 40.63 43.68 42.34 Nalanda 26.99 27.44 25.77 Darbhanga 28.82 29.31 26.45 Bhojpur 23.61 24.95 24.51 Samastipur 37.65 38.50 36.05 Buxar 28.39 31.08 30.99 Madhubani 33.25 32.68 30.32 Rohtas 35.24 39.79 40.05 Saharsa 37.10 33.90 36.31 Kaimur 44.65 46.06 43.04 Supaul 34.84 32.38 35.66 Gaya 25.89 28.37 28.46 Madhepura 44.59 42.63 42.29 Jehanabad 21.71 23.62 25.28 Purnea 41.62 51.33 51.53 Nawada 24.38 27.16 26.06 Araria 54.26 51.69 50.72 Aurangabad 28.31 26.65 27.77 Kishanganj 51.66 53.17 55.77 Arwal 23.51 26.66 25.65 Katihar 59.85 58.19 55.59 Saran 23.73 26.18 23.12 Bhagalpur 32.98 37.77 35.79 Siwan 20.10 22.07 20.66 Banka 39.97 44.62 40.55 Gopalganj 27.45 29.12 30.19 Munger 21.34 23.35 23.17 Muzaffarpur 33.84 36.21 34.29 Lakhisarai 25.88 24.40 24.23 Vaishali 29.70 31.90 32.17 Sheikhpura 27.04 27.61 26.72 Sitamarhi 40.39 40.24 35.16 Jamui 28.63 29.18 28.30 Sheohar 28.05 30.06 29.44 Khagaria 38.57 38.34 32.70 West Champaran 56.85 51.69 48.99 Begusarai 43.72 44.95 40.32
Note : For 2007-08, the figures are as on June 31, 2007
Source : State Level Bankers' Committee, GOB
6.5 Investment Plus Credit to Deposit (ICD) Ratio
The banks assist the economy not simply by giving credit, but also by investing a large part of
their investible funds in State Government securities, in shares, bonds etc. of corporations and
undertakings of the state government, quasi-government bodies and joint-stock companies.
Therefore, the total involvement of the banks in the economic activities of a state is truly reflected
not by the Credit-Deposit ratios alone, but by the Investment plus Credit to Deposit (ICD) ratios.
Table 6.13 depicts the investments of SCBs in securities and shares/ debentures/ bonds of
associated bodies of the state government as on March 31, 2006 and 2007. With a share of about 4
percent in the total investments, Bihar is seen to be a disadvantaged state, since it accounts for
about 8 percent of the population.
From Table 6.14, we see that, if the ICD ratio is taken into account, there is a narrowing down of
the inter-state disparities in credit availability. The ICD ratios in respect of the relatively less
developed states were substantially higher than their respective CD ratios, whereas for the
developed states, the differences were much smaller.
219

Table 6.13 : Statewise Distribution of Investments of SCBs
Total Investments (Rs. crore)
Percentage Share State
2006 2007 2006 2007
Andhra Pradesh 10726 11465 8.65 9.24
Bihar 5513 4996 4.49 4.02
Gujarat 7724 7150 6.23 5.76
Haryana 3147 2922 2.54 2.35
Karnataka 6573 6143 5.30 4.95
Kerala 6230 6553 5.03 5.28
Madhya Pradesh 6304 6383 5.09 5.14
Maharashtra 10323 10892 8.33 8.77
Orissa 4653 4074 3.75 3.28
Punjab 4857 5221 3.92 4.21
Rajasthan 8242 8020 6.65 6.46
Tamil Nadu 8059 8318 6.50 6.70
Uttar Pradesh 15755 16479 12.71 13.27
West Bengal 11823 11468 9.54 9.24
Total 123930 124141 100.00 100.00
Source : Reserve Bank of India Bulletin, October 2008.
Table 6.14 : ICD Ratios of Scheduled Commercial Banks
2005-06 2006-07 As per
Sanction As per
Utilisation As per
Sanction As per
Utilisation
Haryana 63.8 75.9 61.7 73.2 Punjab 63.4 63.0 71.8 71.5 Rajasthan 94.1 102.9 96.4 104.5 Bihar 42.4 52.1 41.3 57.9 Jharkhand 35.7 36.1 36.8 37.3 Orissa 80.3 92.9 74.4 82.4 West Bengal 65.7 70.8 72.3 76.0 Chhattisgarh 50.7 57.7 54.2 62.6 Madhya Pradesh 71.9 78.6 71.5 74.4 Uttar Pradesh 51.3 56.7 54.2 59.4 Uttarakhand 34.3 39.4 33.8 39.2 Gujarat 63.0 82.7 69.6 94.3 Maharashtra 104.4 83.5 98.5 78.2 Andhra Pradesh 90.5 95.3 95.5 99.3 Karnataka 80.8 98.3 79.9 103.4 Kerala 69.1 72.1 67.7 70.7 Tamil Nadu 116.6 115.4 119.6 123.7 All India 78.3 78.3 79.8 79.8
Source : Report on Trend and Progress of Banking in India 2007-08, RBI
220

As of March 2007, Bihar had an ICD ratio of 57.9 percent, compared to its CD ratio of 32.35
percent. Nevertheless, even the ICD ratio of Bihar is much lower as compared to that of states like
Rajasthan (104.5 percent), Madhya Pradesh (74.4 percent) and Orissa (82.4 percent) as well as the
national average of 79.8 percent.
6.6 Regional Rural Banks (RRB)
There are 5 Regional Rural Banks (RRB) in Bihar, each serving a particular zone: Madhya Bihar
Kshetriya Gramin Bank (sponsored by the Punjab National Bank), Samastipur Kshetriya Gramin
Bank (sponsored by the State bank of India), Uttar Bihar Gramin Bank and Kosi Kshetriya
Gramin Bank (both sponsored by the Central Bank of India) and Bihar Kshetriya Gramin Bank
(sponsored by the United Commercial Bank). In 2006-07, these banks employed a total of 6141
staff members in their 1487 branches, nearly 86 percent of which are located in rural areas. Their
total accumulated losses ran into about Rs. 583 crore as on March, 2007. Table 6.15 shows the CD
ratio and the ID (Investment: Deposit) ratios of these 5 banks and Table 6.16 depicts the amount
of loan given during 2005-06 to 2007-08. Among them, the Kosi KGB has the highest CD ratio of
52 percent, while the ID ratio is the highest for the Madhya Bihar KGB which also has the highest
share of loans among all the 5 RRBs, agricultural as well as non-agricultural.
Table 6.15 : CD and ID Ratios of RRBs
CD Ratio ID Ratio RRBs
2005-06 2006-07 30/09/07 2005-06 2006-07 30/09/07
Madhya Bihar KGB 32.51 39.42 39.83 62 63 62
Samastipur KGB 42.80 44.68 47.04 51 57 54
Kosi KGB 48.36 52.20 52.70 53 54 49
Uttar Bihar KGB 34.84 37.51 36.56 59 57 59
Bihar KGB 34.94 38.24 39.57 57 58 53
Total 35.99 40.26 40.26 56 58 55
Source : State Level Bankers' Committee, GOB
221

Table 6.16 : Loans Disbursed by RRBs
Total loans (Rs. crore) Agricultural loans (Rs. crore)
RRBs 2005-06 2006-07 2007-08
Percent-age
share 2005-06 2006-07 2007-08
Percen-tage share
Madhya Bihar KGB 247 560 574 66.82 172 359 394 41.34
Samastipur KGB 49 62 62 9.20 25 38 54 5.67
Kosi KGB 102 173 173 10.24 67 99 141 14.80
Uttar Bihar KGB 264 484 484 9.43 155 256 327 34.31
Bihar KGB 77 91 91 4.31 31 38 37 3.88
Total 739 1370 1370 100.00 450 790 953 100.00
Source : State Level Bankers' Committee
6.7 Industry Share in Total Bank Credit
Table 6.17 shows the percentage share of different sectors of economy in the total credit of
scheduled commercial banks in Bihar for the period between 2003-04 to 2006-07. As on March
2007, agriculture (22.7 percent), industry and manufacturing (22.2 percent). Personal loans (31.8
percent) and trade (14.8 percent) together account for 92.3 percent of the total credit, the rest being
due to the loans to professionals and other services, finance and miscellaneous activities. The
inter-se distribution of credit among the different sectors showed only minor variations over the
years indicating no structural changes in the pattern of credit flow within the state. It is to be noted
that the highest share of credit was on account of personal loans that does not have much direct
bearing on the level of economic activity within the state.
Table 6.17 : Sectoral Share in the Credit of Scheduled Commercial Banks in Bihar
Percentage share of credit Sectors
2002-03 2003-04 2004-05 2005-06 2006-07
Agriculture 20.9 19.9 23.1 22.7 24.2
Industry and Manufacturing 14.2 12.8 16.5 22.2 22.0
Transport Operators 2.4 1.7 1.5 1.1 0.93
Personal Loans 27.5 33.0 33.5 31.8 31.7
Professional & Other services 2.8 2.7 2.7 2.9 3.5
Trade 21.4 18.1 16.6 14.8 14.4
Finance 0.8 0.5 0.6 0.3 0.3
Miscellaneous 9.9 11.3 5.5 4.2 3.6
Total Bank Credit 100.0 100.0 100.0 100.0 100.0
Source : Money and Banking, Sept 2008, CMIE
222

As per directions of the central government, the credit flow to agriculture is to double over the
three year period from 2004-05 to 2007-08. The progress achieved by the banks in Bihar in this
regard is shown in the Tables 6.18. This target has been achieved, as can be seen from the table.
Table 6.18 : Outstanding Agricultural Advances
Advances (Rs. crore)
Year Commercial banks
RRBs Cooperative Total
Growth (Percentage)
2004-05 2580 854 422 3856 38.20
2005-06 3506 1195 379 5080 31.74
2006-07 4257 1694 272 6223 22.50
2007-08 5085 2249 384 7718 24.02
2008-09
(till Sept.) 5153 2495 349 7997 —
Source : State Level Bankers’ Committee
Sectorial Share of Credit
0%
10%
20%
30%
40%
50%
60%
70%
80%
90%
100%
2002-03 2003-04 2004-05 2005-06 2006-07
Miscellaneous
Trade
Personal Loans
Industry andManufacturing
Agriculture
223

6.8 Advances under Annual Credit Plan (ACP)
Under the ACP Plan of banks in Bihar, the total credit flow in Bihar has gone up from Rs. 8738
crore in 2006-07 to Rs 10763 crore in 2007-08, registering a growth of 23 percent growth. The
total credit flow in Bihar during the past four years is shown in the Tables 6.19 and 6.20. While
the achievement has declined marginally in 2007-08, it is seen that there is wide variation in
achievement percentage among the various bank groups, ranging from 51.52 percent in the case of
cooperative banks to 86.2 percent for commercial banks.
Table 6.19 : ACP Achievement - All Banks
Year Target
(Rs. crore) Achievement
(Rs. crore) Achievement (percentage)
2003-04 4842 4287 88.53
2004-05 6022 5041 83.71
2005-06 7334 6055 82.57
2006-07 10001 8738 87.37
2007-08 13100 10763 82.16
Source : State Level Bankers’ Committee
Table 6.20 : Agencywise Analysis of ACP Achievement (March 2008)
Agencies Target
(Rs. crore) Achievement
(Rs. crore) Achievement (percentage)
Sch. Comm. Banks 10240 8827 86.20
RRBs 2173 1580 72.71
Cooperative Banks 687 356 51.82
Total 13100 10763 82.16
Source : State Level Bankers’ Committee
Table 6.21 presents the sectoral profile of credit deployment in 2006-07. The priority sector
advances constituted 62 percent of the total advances, of which agriculture accounted for nearly
half the total priority sector advances and more than one third of the total advances within the
state. It can be seen that the advances made to the small scale industries were very low. For
augmenting credit flow to this sector, development of infrastructure in power and roadways would
be necessary along with the revival of the Industrial Estates. Overall achievement under the ACP
was more than 82 percent, but it showed wide variations.
224

Table 6.21 : Sectoral Share of Advances (2006-07)
Sector Target
(Rs. crore)Achievement
(Rs. crore) Achievement (Percentage)
Share in Total
Advances (Percentage)
Agriculture 4881 3755 76.93 34.89
Small Scale Industries 913 573 62.76 5.32
Other Priority Sector Advances 2688 2384 88.69 22.15
Total Priority Sector Advances 8481 6712 79.14 62.36
Non Priority Sector Advances 4619 4056 87.81 37.68
Total 13100 10763 82.16 100.00
Source : State Level Bankers’ Committee
6.9 Primary Agricultural Credit Societies
Table 6.22 shows some selected indicators of functioning of Primary Agricultural Credit Societies
(PACS) in different states. Though the ratio of villages to PACS in Bihar compares favourably
with the national average, in terms of deposits and borrowings, Bihar is much behind the other
states for obvious reasons.
Table 6.22 : Selected Indicators on Primary Agricultural Credit Societies (March 31, 2007)
State No. of PACS
No. of villages covered
Ratio of villages to PACS
Total Staff
Deposits (Rs. lakh)
Credit (Rs. lakh)
Haryana 571 7,053 12 5,954 29,848 423,022
Punjab 3,981 12,329 3 10,418 76,310 317,601
Rajasthan 5,129 37,359 9 7,264 22,031 234,644
Bihar 5,969 45,098 8 2,538 6,115 50,115
Orissa 3,860 43,303 12 10,154 228793 171,601
West Bengal 12,077 103,059 9 29,379 100,811 149,108
Chhattisgarh 1,257 19,899 15 4,382 20,854 45,220
Madhya Pradesh 4,633 53,951 12 16,404 43,328 225,037
Uttarakhand 446 5,900 13 938 2,925 6,187
Uttar Pradesh 8,929 112,804 13 8,045 6,820 97,076
Gujarat 7,956 16,289 3 16,662 18,816 351,908
Maharashtra 21,045 37,462 2 29,173 13,643 783,436
Andhra Pradesh 4,064 29,207 7 13,919 32,011 638,450
Karnataka 4,205 27,242 7 12,073 112170 200,404
Kerala 1,624 1,464 1 15,739 1246529 197,180
Tamil Nadu 4,508 18,529 4 32,051 249629 398,127
India 97,224 637,102 7 464,168 2,624,340 9,558,750
225

6.10 State Cooperative Banks
Table 6.23 shows the working results of State Cooperative Banks in the major Indian states. The
recovery percentage in Bihar is very low and, there has been a phenomenal increase in the volume
of Non-Performing Assets (NPAs) in Bihar during the last financial year. The NPAs have
increased from Rs 164 crore to Rs 267 crore between 2006 and 2007 and the recovery percentage
has declined from 51.35 to 36.05 percent during the same period. All these have caused substantial
drop in the performance of the cooperative banks in Bihar.
Table 6.23 : Working Results of State Cooperative Banks
Profit/Loss (Rs. crore)
Total NPAs (Rs. crore)
NPAs as percentage to
Loans Outstanding
Recovery as at end-June (Percent) State
2006 2007 2006 2007 2006 2007 2006 2007
Haryana 37.00 25.63 5.22 5.26 0.22 0.18 99.84 99.86
Punjab 26.24 23.79 58.47 55.28 2.18 1.62 99.05 98.33
Rajasthan 21.15 21.36 21.85 56.82 1.31 2.77 98.03 98.12
Bihar 50.78 6.37 164.02 267.11 30.33 42.51 51.31 36.05
Orissa 19.69 9.16 116.71 129.27 6.94 6.67 87.71 77.86
West Bengal 14.05 14.23 98.08 99.13 4.99 5.01 85.47 78.29
Madhya Pradesh 57.56 31.41 177.21 185.38 10.55 8.85 92.31 93.49
Uttar Pradesh 2.88 2.68 12.13 30.45 14.07 16.39 94.86 94.69
Gujarat 5.29 5.51 123.43 133.18 6.08 6.09 83.11 97.33
Maharashtra 1.50 48.36 2847.93 2367.20 37.30 23.65 66.79 73.15
Andhra Pradesh 5.70 1.58 868.01 1134.74 15.39 18.71 78.06 71.76
Karnataka 27.28 13.35 315.60 242.09 17.67 10.82 92.05 92.05
Kerala -2.59 -28.96 430.77 504.48 26.08 22.94 96.23 87.23
Tamil Nadu 28.02 21.78 287.71 262.80 9.46 8.10 95.15 97.66
India 371.02 275.25 6734.93 6704.00 16.84 14.16 86.57 85.65
6.11 State Cooperative Agricultural and Rural Development Banks (SCARDB)
Table 6.24 shows the working results of State Cooperative Agriculture and Rural Development
Banks (SCARDB) in the major states in India. Here also, the recovery percentage in Bihar is a very
low at 16.0 percent, compared with the all India average of 43.9 percent; but even this marked a
significant improvement over 2006-07, when the recovery percentage was only 1.87 percent.
There was also a similar increase in the volume of Non-Performing Assets (NPAs).
226

Table 6.24 : Working Results of SCARDBs (end March)
Number of
branches
Profit/Loss (Rs. crore)
Total NPAs (Rs. crore)
NPAs as percentage to
Loans Outstanding
Recovery as at end-June (Percent) State
2007 2006 2007 2006 2007 2006 2007 2006 2007
Haryana 0 -48.15 -33.35 504 866.24 24.54 45.06 69.69 96.76
Punjab 0 33.01 25.32 0 0.72 0 0.03 94.12 90.97
Rajasthan 7 10.39 13.14 378.62 430.95 25.41 27.95 56.35 56.21
Bihar 151 0.00 0.00 69.71 83.45 68.6 89.69 1.87 16.00
Orissa 5 -0.58 -3.25 27.29 178.16 15.24 99.77 16.33 3.5
West Bengal 2 0.52 1.64 169.29 112.95 27.23 17.41 52.44 65.95
Madhya Pradesh 7 0.12 0.19 211.49 213.46 13.67 13.87 38.25 40.46
Uttar Pradesh 342 1.64 -119.73 1366.13 2067.57 40.03 50.49 41.6 31.79
Gujarat 181 18.67 22.96 327.29 328.29 53.99 53.08 36.26 42.88
Maharashtra - 15.14 195.45 1144.38 485.64 99.93 37.28 15.9 30.12
Karnataka 23 206.61 1.15 330.69 304.25 27.45 23.65 49.14 36.89
Tamil Nadu 18 15.53 -28.13 892.75 252.21 88.53 26.43 52.01 12.93
India 868 249.5 89.68 5778.8 5643.1 32.7 30.3 46.4 43.9
6.12 Kisan Credit Cards (KCC)
The KCC scheme, introduced in 1998-99, aims at providing crop loans to farmers in a flexible and
cost-effective manner. The scheme is being implemented in all the states by all commercial banks,
RRBs, state cooperative banks, central cooperative banks and primary agricultural cooperative
societies. Beneficiaries covered under the KCC are issued with a credit card and a passbook or a
credit card-cum-passbook, incorporating the name, address and particulars of land, borrowing
limit and the validity period. The production credit limits are fixed taking into account the entire
production credit needs for a full year, plus ancillary activities relating to crop production; sub-
limits are also fixed at the discretion of lending banks. Crop loan and short-term credit are in the
form of a revolving cash credit facility, involving any number of drawings and repayments within
the limit fixed on the basis of operational landholding, cropping pattern and scale of finance. The
KCC now covers short term loan for agriculture and allied activities as well as working capital
requirements for cropping.
227

The number of KCCs issued by banks in Bihar during the period from 1999-00 through 2008-09
are shown in Table 6.25. While for the commercial banks, the achievement figures were
consistently high during the entire period, the RRBs have been showing higher performance of
late. The cooperative banks, however, are yet to gear up fully for the job. Overall, the achievement
in the state has been only around 45.07 percent of the target for the entire period.
Table 6.25 : Number of Kisan Credit Card Issued by Banks
Commercial Bank RRBs Year
Target Achieve
ment Percentage Target
Achieve ment
Percentage
1999-00 99667 42756 42.90 46900 4591 9.79
2000-01 101501 65750 64.78 28617 13576 47.44
2001-02 110207 123465 112.03 52738 14256 27.03
2002-03 98180 77543 78.98 60918 24441 40.12
2003-04 105530 95587 90.58 64535 30864 47.83
2004-05 174850 140793 80.52 150500 76891 51.09
2005-06 143866 131618 91.49 129719 66332 51.14
2006-07 250000 203935 81.57 190000 140071 73.72
2007-08 300000 222478 74.16 228000 168529 73.92
2008-09 (Sept.08) 861429 119050 13.82 478571 107045 22.37
Total 2245230 1222975 54.47 1430498 646596 45.20
Cooperative Banks Total Year
Target Achieve
ment Percentage Target
Achievement
Percentage
1999-00 0 0 0.00 146567 47347 32.30
2000-01 180000 107094 59.50 310118 186420 60.11
2001-02 277204 42086 15.18 440149 186692 42.42
2002-03 600000 112580 18.76 759098 214564 28.27
2003-04 425839 229051 53.79 595904 355502 59.66
2004-05 470350 245907 52.28 795700 465744 58.53
2005-06 293166 120653 41.16 566751 318603 56.22
2006-07 160000 55374 34.61 600000 399380 66.56
2007-08 160000 75533 47.21 688000 466540 67.81
2008-09 (Sept.08) 160000 27422 17.14 1500000 253517 16.90
Total 2726559 1015700 37.25 6402287 2885271 45.07
Source: Directorate of Institutional Finance, GOB
228

6.13 National Bank for Agriculture and Rural Development (NABARD)
NABARD has a mandate for facilitating credit flow for development of agriculture, agro-
industries, village and cottage industries, handicrafts and other rural crafts by providing refinance
to lending institutions in rural areas. It also coordinates the operations of rural credit institutions
by offering training and research facilities. In addition, it manages the Rural Infrastructure
Development Fund (RIDF), created to compensate for the shortfall in commercial banks’ lending
to strengthen rural infrastructure and to provide loans to state governments for projects relating to
irrigation, soil conservation, watershed management, drinking water supply, cold storage chains
and other rural infrastructure projects.
The RIDF was set up by the government in 1995-96 for financing ongoing rural Infrastructure
projects. The fund is maintained by NABARD. Domestic commercial banks contribute to the fund
to the extent of their shortfall in stipulated priority sector lending to agriculture. The main
objective of the fund is to provide loans to state governments and state-owned corporations to
enable them to complete ongoing rural infrastructure projects. Till the end of 2007-08, thirteen
branches of RIDF have been released covering total cumulative sanctions for Rs. 74,043 crore, out
of which only Rs 45,595 crore (61.55 percent) have been disbursed, as shown in Table 6.26.
Table 6.26 : Cumulative Disbursements under RIDF till March 2008
Sanction Disbursement Amount
(Rs. crore) Percentage
Amount (Rs. crore)
Percentage
Southern Region 21223.87 28.65 13463.89 29.53
Western Region 11007.88 14.86 7423.20 16.28
Northen Region 20271.66 27.37 12908.29 28.31
Central Region 6885.36 9.30 4349.39 9.54
Eastern Region 11480.71 15.50 5733.57 12.58
North Eastern Region 3203.63 4.32 1716.52 3.76
All India 74073.11 100.0 45594.86 100.0
Source : Report on Trends and Progress of Banking in India, 2007-08, RBI
Till December 2007, NABARD had sanctioned 9,372 projects in the state under the RIDF, of
which as many as 7,951 are related to minor irrigation. The total credit disbursed by NABARD by
229

way of refinancing the banks amounted to Rs 184 crore during 2007-08, details of which are given
in Table 6.27.
Table 6.27 : Sectorwise Refinancing by NABARD in Bihar
(Rs. crore)
Purpose 2004-05 2005-06 2006-07 2007-08
Minor Irrigation 96.84 55.55 11.52 11.23
Farm Mechanisation 1.19 0.06 30.48 23.99
Swarnjayanti Gramin Swarojgar Yojna 69.37 51.49 24.62 33.91
Dairy 0 0.08 2.21 10.48
SC/ST Action Plan 0 1.27 4.8 0
Self Help Groups 2.99 5.9 8.64 19.86
Pradhan Mantri Rojgar Yojana 0 0.9 3.22 3.62
Rural Non–Farm Sector 5.09 1.88 15.22 10.21
Others 0.97 0.08 55.76 70.75
Total 176.45 117.21 156.47 184.05
Source : Data from NABARD
The scope of RIDF has been widened to include activities in agriculture and allied sectors
including irrigation projects, rural connectivity (roads and bridges), social sector investments
(rural health, education and drinking water), soil and water conservation, rain water harvesting etc.
Other activities include rural market yards, rural health centres and primary schools, mini hydel
plants, shishu shiksha kendras, anganwadis and system improvement in the power sector, flood
protection, watershed development/ reclamation of waterlogged areas, drainage, forest
development, market yard/godown, apna mandi, rural haats and other marketing infrastructure,
cold storage, seed/agriculture/ horticulture farms, plantation and horticulture, grading and
certifying mechanisms such as testing and certifying laboratories, etc., community irrigation wells
for irrigation purposes for the village as a whole, fishing harbour/jetties, riverine fisheries, animal
husbandry and modern abattoir.
The total disbursements made by NABARD under the various tranches of the RIDF in Bihar is
shown in Table 6.28. Only Rs. 747 crore out of total sanctioned amount of Rs 2309 crore, or 31.19
percent of the sanctioned amount have been disbursed till March 2008, leaving a huge shortfall
between sanction and disbursement. Such shortfall in disbursements of RIDF funds as compared
to sanctions continues to remain a matter of concern in the implementation of RIDF.
230

Table 6.28 : Sanctions and Disbursements in Bihar under RIDF till March, 2008
Sanction Disbursement RIDF
Tranche Amount (Rs. crore)
Amount (Rs. crore)
RIDF I 22.17 12.63
RIDF III 57.93 26.93
RIDF VII 58.02 37.69
RIDF VIII 198.69 154.50
RIDF IX 97.24 51.28
RIDF X 290.91 41.54
RIDF XI 459.41 181.22
RIDF XII 589.90 123.06
RIDF XIII 621.68 118.46
Total 2396.06 747.30
Source : Report on Trends and Progress of Banking in India, 2007-08, RBI
6.14 Micro Finance
Many third world countries are increasingly realizing that the conventional government run anti-
poverty programmes cannot make a serious dent on poverty, especially the kind of poverty caused
by weak rural infrastructure. This is particularly true in Bihar where these programmes help only a
fraction of the poverty-stricken population. In this scenario, microfinance is a potent alternative
for poverty alleviation. To succeed, microfinance should combine an innovative credit delivery
mechanism that ensures viable financial services for the needy with a realistic assessment of the
micro-enterprise opportunities in the state. However, creating adequate awareness among the
potential beneficiaries for this is the first prerequisite for the success of any such programmes. The
Self Help Groups (SHGs) and the SHG-Bank Linkage Programme, implemented by commercial
banks, RRBs and cooperative banks, have emerged as the major microfinance programme in the
country. Bihar is gradually catching up with other states in SHG-Bank Linkages. As on March 31,
2008, an impressive cumulative number of 141,377 SHGs were credit-linked to banks and the
total credit flow to these SHGs was Rs. 296.12 crore. The yearwise progress made in credit linking
of SHGs is shown in Table 6.29.
231

Table 6.29 : Microfinancing in Bihar
Year No. of SHGs linked with
bank
Amount of credit
(Rs. crore)
Up to 2004 16246 51.82
2004-05 11769 37.42
2005-06 18206 31.20
2006-07 26417 82.54
2007-08 68739 93.14
Total 1,41,377 296.12 Source : State Level Bankers’ Committee
Major handicaps in the spread of SHG-Bank Linkage Programme include the absence of reputed
NGOs and low awareness about SHG lending among the stakeholders. It is expected that, for the
sensitization programme, initiatives taken by NABARD and other implementing banks shall result
in creating a favourable environment towards the SHGs movement in the state. Performance of
RRBs in this area during 2007-08 shown in Table 6.30
Table 6.30 : Microfinancing by RRBs (2007-08)
RRBs
Number of SHGs
with bank-linkage
Amount of credit
(Rs. crore)
Madhya Bihar KGB 15725 950
Samastipur KGB 1502 49
Kosi KGB 8465 488
Uttar Bihar KGB 1610 0
Bihar KGB 4084 1677
Total 31,386 3,164
Source : State Level Bankers’ Committee
6.15 Evaluation of Selected Government Schemes
Pradhan Mantri Rojgar Yojana (PMRY) : The scheme was first launched on October 2, 1993 to
provide sustainable self-employment opportunities to 1 million educated unemployed youth in the
country during the Eighth Plan Period. Under the scheme, loans upto Rs. 1.00 lakh for business
sector and Rs. 2.00 lakh for other activities are to be provided by banks for all economically viable
activities, including agriculture and allied activities, but excluding direct agricultural operations
232

like raising crops, purchase of manure etc. The achievements under the scheme in Bihar during the
last 6 years are given in the Table 6.31, from which we can infer that the achievement of the state
has at best been moderate.
Table 6.31 : Target and Achievement under PMRY
Year Target (No.) Achievement
(No.) Achievement (percentage)
2001-02 18,000 8,204 45.57
2002-03 18,100 9,366 51.74
2003-04 14,400 9,812 68.13
2004-05 16,000 10,119 63.24
2005-06 25,000 14,191 56.76
2006-07 11,400 8,671 76.06
2007-08 15,000 7,618 58.63
Total 117,900 67,981 57.66
Source : State Level Bankers’ Committee
Swarnjayanti Grameen Swarozgar Yojna (SGSY) : For the effective alleviation of poverty
through providing self-employment to the poor of the country, the government has decided to
restructure the self-employment programmes being implemented in the country. Consequently, in
1999, a new programme named Swarnjayanti Gram Swarojgar Yojna (SGSY) was launched. This
is a comprehensive programme that includes all aspects of self-employment such as organizing the
poor to form Self-Help Groups (SHG), training, loans, technology, basic infrastructure and
marketing etc. The prime objective of the scheme is to ensure uplifting of beneficiaries above the
poverty line through persistent growth in their income for a long period of time. In Bihar, in
coordination with the Department of Rural Development, banks have been participating in the
scheme in a substantial way.
The Union Ministry of Finance has introduced a mechanism to evaluate the development outcome
of all the major programmes by way of converting financial outlays into measurable and
monitorable outcomes. In case of SGSY scheme, one item that is measurable and of immense
significance is the total number of Swarojgaris assisted (both the SHGs and the individuals).
Under SGSY, apart from the financial targets, physical targets for both individuals and SHGs are
allocated to banks. The performance of banks under the SGSY is shown in Tables 6.32 and 6.33.
233

While physical targets were over-achieved in case of SHGs, there were huge shortfalls in respect
of individuals.
Table 6.32 : Performance of Banks Under SGSY: Individuals
2006-07 2007-08
Number
Amount (Rs.
crore) Number
Amount (Rs.
crore)
Target 1,37,805 354.41 1,88,000 469.99
Proposals Received 1,19,927 — 85,460 —
Proposal Sanctioned 1,04,893 281.95 79,951 212.10
Proposal Disbursed 1,01,965 231.98 76,720 187.87
Achievement in Percentage (Sanction/Target)
79.55 79.55 42.53 45.13
Achievement in Percentage (Disbursement/Target)
74.00 65.46 40.81 39.97
Proposal Returned/ Rejected
13,897 — 5509 —
Proposal Pending for Disbursement
1,137 — 3231 —
Source : State Level Bankers’ Committee
Table 6.33 : Performance of Banks Under SGSY (SHGs)
Performance 2006-07 2007-08
Target (nos.) 9.726 15,040
Achievement (nos.) 12230 18,499
Achievement (Percentage) 126.0 123.0
Source : State Level Bankers’ Committee
In a recent meeting, the Government of India has reiterated the importance of banks' roles on
account of their responsibilities for sanction, credit mobilization and disbursal under the SGSY,
for achievement of the target of complete elimination of poverty by 2015. The banks are to initiate
steps to increase their outreach by expansion of their branches, especially in unbanked blocks. The
training and marketing support for rural products are two important elements, not adequately
addressed in the states, without which the achievement of physical/ financial targets does not
necessarily translate into real uplifting of the poor households. To address the training needs,
Karnataka has successfully carried out an innovative experiment by establishing Rural
Development and Self-Training Institutes (RUDSETIs) in each district for training the poor in
income generating activities.
234

One of the problems plaguing the priority sector advances is the low rate of recovery of these
advances. This also affects the financial viability of the banks. A recovery rate of around 47
percent in 2006-07 in priority sector advances by the banks in Bihar implies large non-performing
assets that seriously affect the viability of banks. The recovery position in government sponsored
schemes is even lower in comparison with priority sector advances, which is a major source of
worry for the banks. For SGSY and PMRY schemes, the recovery rates are only around 31 percent
and 25 percent respectively in 2006-07.
6.16 Summing Up
During 2007-08, the banking infrastructure in Bihar registered only marginal expansion. With a
share of less than 5 percent of the total number of bank branches in India, 3 percent of total
employees of scheduled commercial banks, and with only 2 percent share of total deposits and less
than 1 percent share of the total bank credits in the country, Bihar remains one of the
disadvantaged states in the country in banking. The per capita deposits and credits also remain one
of the lowest in the country. The priority sector advances made by the banks in the state
constituted 62 percent of the total advances during 2007-08, with agriculture sector alone claiming
a share of 35 percent; but the recovery of the priority sector advances was very low with more than
half of the advances remaining unrecovered. The CD ratio also remains one of the lowest at 32
percent and is way behind the national average of 72 percent. Even other disadvantaged states like
Uttar Pradesh, Rajasthan and Madhya Pradesh had achieved far higher CD ratios. The ICD ratios,
though higher than the CD ratios, still fall far short of the national average of 80 percent. The CD
ratios across districts showed wide variations from as low as 21 percent to as high as 56 percent :
there are five districts with CD ratios less than 25 percent. The achievement of the Regional Rural
Banks (RRBs) in this area was better than the scheduled commercial banks. The persistently low
CD ratio is a cause for serious concern and needs urgent correction.
Achievement of the banks under the Annual Credit Plan was remarkable; however the achieved
targets do not reflect the changed economic scenario in the state, whether in respect of improving
the investment climate or lifting a substantial number of the poor above the poverty line. Possibly
due to a slowdown of the economy as a whole, the non-performing assets of banks have increased
substantially Among the national level financial institutions, NABARD’s disbursement of loans
under the RIDF was not even one-third of the total sanctioned amount. Microfinancing in the state
235

has made good progress and there is immense scope for micro-finances to make significant
inroads into the rural economy. Achievements made under anti-poverty schemes like PMRY and
SGSY were annulled by the extremely low rate of recovery. In respect of the ACPs as well as the
poverty alleviation schemes, there is urgent need for instituting a proper monitoring mechanism to
ensure that the financial targets achieved actually translate into measurable and quantifiable
improvement in the economic well-being of the beneficiaries. At present, no such mechanism
exists. Overall, it appears that banking in Bihar is yet to start creating a real impact on improving
the living standards of people and in ushering an investment climate in the state that alone can
attract investments from the private sector and also from the other states. Banks can help
immensely in creating the rural infrastructure for marketing and distribution and only then any
meaningful public-private participation can emerge.
236

Appendix
Districtwise performance under annual credit plan (March, 2008)
Agriculture Small Scale Industries Other Priority Sector T O T A L District Name
Target Achie %ach Target Achie % ach Target Achie % ach Target Achie % ach
2 3 4 5 6 7 8 9 10 11 12 13 14
Patna 21,820 25,780 118 13,388 16,628 124 71,246 49,335 69 106,454 91,743 86
Arwal 3,659 2,796 76 375 528 141 841 1,272 151 4,875 4,596 94
Aurangabad 10,196 8,632 85 533 792 149 5,431 4,584 84 16,160 14,008 87
Bhojpur 20,960 12,534 60 1,735 990 57 7,688 6,669 87 30,383 20,193 66
Buxar 27,055 10,821 40 2,282 1,498 66 4,502 4,674 104 33,839 16,993 50
Gaya 17,494 10,654 61 4,802 3,301 69 8,724 12,080 138 31,020 26,035 84
Jehenabad 6,893 7,253 105 740 768 104 1,990 3,098 156 9,623 11,119 116
Kaimur 17,747 14,688 83 1,242 1,749 141 2,784 2,946 106 21,773 19,383 89
Lakhisarai 4,738 4,042 85 346 791 229 1,975 2,401 122 7,059 7,234 102
Nalanda 16,570 14,505 88 2,206 1,580 72 4,184 5,037 120 22,960 21,122 92
Nawada 7,549 7,538 100 229 672 293 4,657 3,554 76 12,435 11,764 95
Rohtas 23,529 17,260 73 3,574 2,840 79 8,053 6,197 77 35,156 26,297 75
Araria 8,002 7,673 96 683 358 52 1,993 2,895 145 10,678 10,926 102
Jamui 7,971 4,028 51 537 325 61 2,213 2,350 106 10,721 6,703 63
Kishanganj 7,005 5,289 76 353 1,066 302 3,027 3,664 121 10,385 10,019 96
Madhepura 5,697 4,099 72 488 636 130 1,260 4,720 375 7,445 9,455 127
Purnea 18,089 11,878 66 2,909 1,212 42 6,952 7,472 107 27,950 20,562 74
Saharsa 6,941 4,147 60 751 620 83 4,260 2,422 57 11,952 7,189 60
Supaul 8,146 4,979 61 120 354 295 3,076 3,658 119 11,342 8,991 79
Darbhanga 8,038 7,493 93 1,146 1,003 88 8,466 8,705 103 17,650 17,201 97
E. Champaran 18,688 16,592 89 3,987 667 17 12,085 10,427 86 34,760 27,686 80
Gopalganj 20,432 11,236 55 1,161 2,194 189 6,192 4,332 70 27,785 17,762 64
Madhubani 14,738 10,635 72 1,794 1,120 62 6,250 4,455 71 22,782 16,210 71
Muzaffarpur 16,208 15,557 96 13,380 2,892 22 15,276 12,825 84 44,864 31,274 70
Saran 18,931 10,738 57 5,830 1,082 19 7,699 11,336 147 32,460 23,156 71
Siwan 18,348 13,643 74 1,919 831 43 6,608 6,425 97 26,875 20,899 78
Vaishali 13,573 12,718 94 2,116 1,144 54 5,527 5,760 104 21,216 19,622 92
W. Champaran 17,771 15,595 88 1,408 587 42 6,298 5,738 91 25,477 21,920 86
Katihar 12,412 11,977 97 1,431 1,205 84 4,157 6,667 160 18,000 19,849 110
Shiekhpura 3,796 1,697 45 181 197 109 798 1,149 144 4,775 3,043 64
Banka 9,303 5,518 59 1,916 816 43 4,067 2,686 66 15,286 9,020 59
Begusarai 19,032 11,890 62 7,568 973 13 11,714 5,273 45 38,314 18,136 47
Bhagalpur 13,437 7,595 57 3,757 1,199 32 8,057 5,966 74 25,251 14,760 58
Munger 7,670 4,284 56 2,924 1,139 39 4,909 3,277 66 15,503 8,650 56
Sheohar 1,372 1,985 145 132 118 89 546 438 80 2,050 2,541 124
Sitamarhi 10,151 9,977 98 1,422 840 59 2,941 2,908 99 14,514 13,725 95
Khagaria 8,857 6,012 68 688 443 64 3,417 1,000 29 12,962 7,455 58
Samastipur 15,149 16,333 108 1,253 1,187 95 8,901 6,275 71 25,303 23,795 94
Total for Bihar 487,967 370,071 2,966 91,306 56,345 3,649 268,764 234,670 4,009 848,037 661,036 3,112
(Contd.)
237

238
Appendix : (Contd.)
Non Priority Sector
District Name Target Achie % ach Target
Grand total Achie
% ach
2 15 16 17 18 19 20
Patna 188,236 96,029 51 294,690 187,277 64
Arwal 1,087 1,228 113 5,962 5,824 98
Aurangabad 8,386 8,560 102 24,546 22,568 92
Bhojpur 8,549 7,047 82 38,932 27,240 70
Buxar 4,148 6,345 153 37,987 23,338 61
Gaya 12,154 15,409 127 43,174 41,444 96
Jehenabad 3,190 3,995 125 12,813 15,114 118
Kaimur 2,916 4,410 151 24,689 23,793 96
Lakhisarai 3,775 2,045 54 10,834 9,279 86
Nalanda 10,752 7,926 74 33,712 29,048 86
Nawada 2,635 4,037 153 15,070 15,801 105
Rohtas 5,832 9,030 155 40,988 35,327 86
Araria 6,427 6,846 107 17,105 17,772 104
Jamui 3,786 4,145 109 14,507 10,848 75
Kishanganj 4,041 5,282 131 14,426 15,301 106
Madhepura 3,605 5,421 150 11,050 14,876 135
Purnea 10,558 10,167 96 38,508 30,732 80
Saharsa 4,730 5,512 117 16,682 12,701 76
Supaul 2,423 5,581 230 13,765 14,572 106
Darbhanga 11,676 11,887 102 29,326 29,088 99
E. Champaran 9,525 10,877 114 44,285 38,563 87
Gopalganj 6,222 7,589 122 34,007 25,351 75
Madhubani 10,879 11,022 101 33,661 27,232 81
Muzaffarpur 22,683 20,368 90 67,547 51,642 76
Saran 12,112 12,513 103 44,572 35,669 80
Siwan 8,515 9,647 113 35,390 30,546 86
Vaishali 11,101 10,648 96 32,317 30,271 94
W. Champaran 7,518 10,743 143 32,995 32,663 99
Katihar 17,315 15,586 90 35,315 35,435 100
Shiekhpura 1,866 989 53 6,641 4,032 61
Banka 1,139 3,329 292 16,425 12,349 75
Begusarai 3,170 7,042 222 41,484 25,178 61
Bhagalpur 15,454 14,289 92 40,705 29,049 71
Munger 15,131 8,319 55 30,634 16,969 55
Sheohar 570 744 131 2,620 3,285 125
Sitamarhi 5,094 10,155 199 19,608 23,880 122
Khagaria 5,183 4,717 91 18,145 12,172 67
Samastipur 9,580 11,067 116 34,883 34,862 100
Total for Bihar 461,963 390,546 4,607 1,310,000 1,051,091 3,354

239
CHAPTER VII
PUBLIC FINANCE
7.1 Introduction
Public finance is not only about prudent fiscal management, it is also a theoretically consistent
measurement of relevant parameters that is essential for proper examination, analysis, diagnosis
and policy intervention in areas pertaining to state finances. Finance is an all encompassing realm,
it is one of the ways of generating future optimism that includes a host of areas from strengthening
government capacity for policy development and restructuring of administration to delivering the
promised socio-economic deliverables. At the same time, it also includes increasing accountability
of the administrative machinery, improving public sector performance, and developing physical
and social infrastructure through which the state governmental can beget public goods in an
efficient manner. The identification of the essential activities as well as the unproductive ones,
allocation of resources strictly according to economic and social priorities, reducing cost of
services and monitoring the outcome of all public expenditure are all essential functions of any
government. All these require careful and valid measurement of the relevant parameters and
aggregates.
It should be noted at the outset that the need for fiscal adjustment and continued fiscal
consolidation by lowering borrowing requirements to meet the FRBMA targets had not only been
recognized by the state government, it had also led to a number of pro-active steps beginning with
the enactment of the FRBMA and achievement of fiscal targets indicated in the Act. As a result,
during 2007-08, the state government achieved significant fiscal correction due by the momentum
given to the ongoing of reform process. Due to the economic slowdown, the process has slowed
down a little towards the second half of the last fiscal, but it did not affect the state finances and
government’s policies in a significant manner. The fiscal deficit no longer remains the key
concern of the state government; instead, the urgency is for an improvement of in the delivery of
public services, especially in the social sectors of health and education, and to improve the
infrastructure of roads and electricity supply.
Last year had witnessed the devastation caused by the worst floods in the living memory, a
devastation from which the state is still recovering slowly. As the catastrophe proved, the poor

240
state of infrastructure needs to be improved urgently and no amount of increased budgetary
allocation to the vital sectors like roads, electricity, irrigation and flood control, drinking water
supply and sanitation etc. would suffice to build an effective insurance against any repetition of
such calamity in future. The state government’s resources alone are inadequate to create the
infrastructure that should already have been in place in the state for accelerating the pace of
growth. Only through a viable public-private partnerships in the field of infrastructure can the
process of development and modernisation be carried forward expeditiously.
The constitution of the Thirteenth Finance Commission (TFC) and its deliberations have brought
the focus on the vertical and horizontal imbalances afflicting the states, and Bihar is particularly
affected by such imbalances due to historical factors of backwardness. The low buoyancy of the
state’s taxes makes it imperative to link the transfers to existing disparities, not only among the
states but also within different regions of the state to achieve a significant degree of equalization.
Development can only be ensured through proper implementation and efficient usage of the
allocated funds, the bottom line being that economic growth must be translated into human
wellbeing.
Being committed to fiscal responsibility and having substantially increased the capital outlays to
create income generating capital assets in the economy, Bihar today is facing the challenge of
translating its outlays into measurable and quantifiable outcomes. It has enforced significant fiscal
discipline in expenditure and enhanced its revenues to meet the requirements of enhancing social
sector expenditure. The resources available to the state government consists of tax and non-tax
revenues, capital receipts, share of central taxes assigned to the state, loans and grants from the
central government, borrowings from the open market, and collections from the Provident Fund
and other deposits kept within the government account. These resources are utilized for either plan
expenditure for development purposes or for non-plan expenditure on administration, payment of
interests and servicing of its outstanding debt and also for providing grants and loans to local
bodies, government companies and corporations.
As per the provisions of the Article 266 of the Constitution, all revenues received by the state
government, all loans raised by it by issue of treasury bills, loans or ways-and-means advances
and all money received by it as repayment of loans are credited to the Consolidated Fund of the
state government. No money can be spent out of the Consolidated Fund except with the approval

241
of the Legislature. Other than this, there are two separate funds managed by the state government
— first, a Contingency Fund of the nature of an imprest with a fixed corpus that can be created by
the Legislature under Article 267 of the Constitution to meet unforeseen expenditure, pending
their subsequent authorization by the Legislature. All other money received by or on behalf of the
state government are credited to the Public Account of the state under Article 266(2) of the
Constitution. No legislative authorization is required to withdraw any money from the Public
Account, the balance of which is not held separately, but stands merged with the cash balance of
the state government. The gross fiscal deficit of the state government after borrowings on the
Consolidated Fund is met by drawing down the balances in the Public Account.
In this chapter, the financial and fiscal performance of the state government have been analysed
first by summarizing the receipt and expenditure of the state government, as shown in Table 7.1.
Thereafter, the analysis considers a set of ten major performance indicators relating to public
finance and compares these indicators from Bihar with those of selected Indian states. This is
shown in Table 7.2.
The state government finances will then be analysed with reference to (i) Sustainability, Flexibility
and Vulnerability of State Finances; (ii) Deficit Management; (iii) Revenue Receipts and
Expenditure; (iv) Resource Moblisation; (v) Expenditure Management; (vi) Expenditure on Salary
and Pension; (vii) Quality of Expenditure; (viii) Sectoral Expenditure; (ix) Per Capita Expenditure
on Social and Economic Services and (x) Debt Management. At the end, efforts have been made
for a micro level analysis of expenditure in respect of a few sectors.
7.2 Overall Financial Position
Table 7.1 and the accompanying chart unravel the story of Bihar’s gradual financial turnaround.
Till 2003-04, the state government had a deficit in its revenue account, but in 2004-05, for the first
time Bihar had a revenue surplus that was more than Rs 1000 crore. This surplus has been
increasing continuously, from Rs 82 crore in 2005-06 to Rs 4647 crore in 2007-08. In the budget
estimates of 2008-09 also, the state government projected to keep it at almost the same level. This
has been made possible not by squeezing the expenditure necessary for maintaining the pace of
development, but by increasing the revenue (especially since 2005-06), efficient debt
management, and containing the interest payments. During the last 6 years, interest payment has
always been well below Rs 4000 crore on an outstanding total liabilities of around Rs 47,649 crore
as on March 2009. This has allowed the state government to increase its capital outlay threefold,

242
from Rs 2084 crore in 2005-06 to Rs 6104 in 2007-08; the outlay for 2008-09 is projected to
reach Rs 7635 crore as per budget estimates. In fact, 2005-06 marks a watershed in the finances of
the state government signifying an earnest beginning of reforms in public finances; it was in 2005-
06 that the state government enhanced its spending very substantially on social and economic
services as also more than doubled the capital outlay, while expenditure on general services was
contained nearly at the existing level. There were only some increases on district administration,
police and public works, besides on pension and interest payments.
The gap between plan and non-plan expenditure has also been closing since 2005-06; as of March
2008, the non-plan expenditure was less than twice the plan expenditure, compared to three times
4 years ago. The year 2005-06 also marks the beginning of a declining Gross Fiscal Deficit
(GFD), from Rs 3700 crore in 2005-06 to Rs 1703 crore in 2007-08. As a percentage of Gross
State Domestic Product (GSDP), it came down from 4.64 to 1.62 percent, well within the FRBMA
target of 3 percent. The state has achieved the FRBMA target of eliminating the revenue deficit far
ahead of the target date of 2008-09; even in the budget estimates of 2008-09, the GFD will be
contained at 2.96 percent of the GSDP, again within the FRBMA target. The increase in GFD in
2008-09 is primarily due to the increase in capital outlay by more than Rs 1500 crore, which is in
keeping with the state’s reform agenda.
The state government has particularly focused on its debt management in recent years. While the
total debt stock in the economy has not been allowed to increase, the interest payments have also
been contained at nearly the same level by reducing borrowings, from Rs 5653 crore in 2003-04 to
Rs 1612 crore in 2007-08. At the same time, discharge of high cost debt has caused the average
interest rate on debt to come down from more than 9.59 percent in 2004-05 to 7.15 percent in
2007-08, as discussed later.

243
Table 7.1 : Receipts and Expenditure of the Bihar Government
Sl. No. Rs. crore
2003-04 2004-05 2005-06 2006-07 2007-08 2008-09
1 Total Receipts Revenue Account 12456 15714 17838 23083 28210 33551 a Tax Revenue 10518 12465 13983 17325 21852 24353 b Non Tax Revenue 320 418 522 511 526 422 c Grants in aid and contr. 1618 2832 3333 5247 5832 8776 2 Total Expenditure Revenue Account 12711 14638 17756 20585 23563 28938 a General Services, of which 7175 7803 8523 8643 9252 10901 Interest payments 3343 3474 3649 3416 3707 3796
b Social Services 4033 4795 6862 7917 9868 12689 c Economic Services 1498 2036 2367 4021 4438 5343 3 Revenue Deficit 255 -1076 -82 -2498 -4647 -4613 4 Capital Receipts 7930 7641 3821 2365 1638 4522 a Public Debt etc. 7920 7626 3770 2358 1612 4500 b Recovery of Loan and Advances 10 15 51 7 26 22 5 Capital Expenditure, of which 9771 5420 4812 6551 8008 9636
Capital Outlay 1549 1205 2084 5211 6104 7635 6 Total Expenditure 22482 20058 22568 27136 31571 38574 a Plan Expenditure 5202 3476 4899 9397 10908 15746 b Non Plan Expenditure 17280 16581 17670 17740 20664 22828 7 Gross Fiscal Deficit 4363 1242 3700 3021 1703 3325 8 Primary Deficit 1020 -2232 51 -395 -2004 -471 9 Total Borrowings 7920 7626 3770 2358 1612 4500 a Internal Debt Receipt 7100 5972 3769 2355 1144 4493 b Loans from Central Government 820 1654 2 3 468 8
10 Repayment of Public Debt 5653 3087 981 1025 1632 1676 11 Debt Outstanding 34401 39344 42498 44226 44475 47649 12 GSDP 66254 73221 80157 98957 105148 112424 13 GDSP Growth (%) 1.93 10.52 9.47 23.45 6.26 6.92
As percentage of GSDP 1 Total Receipts Revenue account 18.80 21.46 22.25 23.33 26.83 29.84 a Tax Revenue 15.87 17.02 17.44 17.51 20.78 21.66 b Non Tax Revenue 0.48 0.57 0.65 0.52 0.50 0.38 c Grants in aid and contr. 2.44 3.87 4.16 5.30 5.55 7.81 2 Total Expenditure Revenue Account 19.18 19.99 22.15 20.80 22.41 25.74 a General Services, of which 10.83 10.66 10.63 8.73 8.80 9.70 Interest payments 5.05 4.74 4.55 3.45 3.53 3.38
b Social Services 6.09 6.55 8.56 8.00 9.38 11.29 c Economic Services 2.26 2.78 2.95 4.06 4.22 4.75 3 Revenue Deficit 0.39 -1.47 -0.10 -2.52 -4.42 -4.10 4 Capital Receipts 11.97 10.44 4.77 2.39 1.56 4.02 a Public Debt etc. 11.95 10.42 4.70 2.38 1.53 4.00 b Recovery of Loan and Advances 0.02 0.02 0.06 0.01 0.02 0.02 5 Capital Expenditure, of which 14.75 7.40 6.00 6.62 7.62 8.57
Capital Outlay 2.34 1.65 2.60 5.27 5.80 6.79 6 Total Expenditure 33.93 27.39 28.16 27.42 30.03 34.31 a Plan Expenditure 7.85 4.75 6.11 9.50 10.37 14.01 b Non Plan Expenditure 26.08 22.65 22.04 17.93 19.65 20.31 7 Gross Fiscal Deficit 6.59 1.70 4.62 3.05 1.62 2.96 8 Primary Deficit 1.54 -3.05 0.06 -0.40 -1.91 -0.42 9 Total Borrowing 11.95 10.42 4.70 2.38 1.53 4.00 a Internal Debt Receipt 10.72 8.16 4.70 2.38 1.09 4.00 b Loans from Central Government 1.24 2.26 0.00 0.00 0.45 0.01
10 Repayment of Public Debt 8.53 4.22 1.22 1.04 1.55 1.49 11 Debt Outstanding 51.92 53.73 53.02 44.69 42.30 42.38

244
7.3 Fiscal Performance
Revenue deficit and capital deficit represent the excess of expenditure over receipts under the
revenue and capital accounts respectively. The conventional budget deficit is the algebraic sum of
the revenue and capital deficits, but this does not actually show the total resource gap in the
economy, as it includes the borrowings under the capital receipts. The overall resource gap is
reflected by the Gross Fiscal Deficit (GFD) which is to be bridged by borrowings of one sort or
another. For analyzing the fiscal performance of the state government, the present analysis has
used the following eight indicators :
(i) Ratio of Revenue Deficit to GFD.
(ii) Ratio of Capital Outlay to GFD.
(iii) Ratio of Non-Development Expenditure to Aggregate Expenditure.
(iv) Ratio of Interest Payment to Revenue Expenditure.
(v) Ratio of State’s Tax Revenue to Revenue Expenditure.
(vi) Ratio of State’s Non-Tax Revenue to Revenue Expenditure.
(vii) Ratio of Gross Transfer from Central Government to Aggregate Expenditure.
(viii) Ratio of Debt Servicing Expenditure to Gross Transfer from the Central Government.
R e v e n u e a n d E x p e n d itu re o f B ih a r G o v e rn m e n t (R s C ro re )
0
5 0 0 0
1 0 0 0 0
1 5 0 0 0
2 0 0 0 0
2 5 0 0 0
3 0 0 0 0
3 5 0 0 0
4 0 0 0 0
2 0 0 3 -0 4 2 0 0 4 -0 5 2 0 0 5 -0 6 2 0 0 6 -0 7 2 0 0 7 -0 8 2 0 0 8 -0 9
T o ta l R e ce ip ts R ev en u e acco u n tT ax R ev en u eN o n T ax R ev en u eG ran ts in a id an d co n tr .T o ta l E x p en d itu re R e v en u e A cco u n t

245
A brief analysis of these ratios is presented in the succeeding paragraphs.
(i) Ratio of Revenue Deficit to GFD : This ratio indicates the extent to which the Revenue Deficit
contributes to GFD. Ideally, the revenue account should leave a surplus for creation of capital
assets. As noted already, there were surpluses in the revenue account since 2004-05 that enabled
the capital expenditure to be increased continuously, especially on state highways, rural roads,
water supply and sanitation, urban development as well as on irrigation and flood control. Very
few states have managed a substantial surplus for all these years; Rajasthan has a small working
surplus whereas West Bengal and Kerala had deficits in their revenue accounts in all these years.
Maharashtra had a large revenue deficit in 2007-08.
(ii) Ratio of Capital Outlay to GFD : As an obvious consequence of the improvements in its
revenue accounts, Bihar has increased Capital Outlay to GFD ratio to more than 100 percent
during the last three years. Only a few other states like Rajasthan, Kerala, Tamil Nadu and Gujrat
could repeat this feat. The situation in respect of Maharastra is a cause of concern owing to its
high negative ratio in 2007-08.
(iii) Ratio of Non-Development Expenditure to Aggregate Expenditure : The non-development
expenditure is incurred mainly for administrative services, whereas development expenditure is
incurred for social and economic services. The former should preferably be a small proportion of
the total disbursements. In Bihar, non-developmental expenditure, mainly in the form of non-plan
expenditure, constituted about 30 percent of the total expenditure during the period from 2006-07
to 2008-09. All the other states have also returned comparable figures.
(iv) Ratio of Interest Payment to Revenue Expenditure : Historicaly, interest payments constituted
a perennial burden on the finances of the state government, because of its heavy indebtedness. For
Bihar, however, interest payments have been an ever decreasing proportion of the revenue
expenditure since 2003-04. The budget estimates of 2008-09 reports it to be only 13 percent. A
perceptible decrease in the ratio has taken place after 2005-06. Other states also show similar
ratios excepting West Bengal, for which the ratio is substantially higher at around 30 percent.
(v) and (vi) Ratio of State’s Own Tax and Non-Tax Revenue to Revenue Expenditure : These
ratios obviously indicate the self-sufficiency of the state government vis-à-vis its revenue
expenditure needs. For the period from 2003-04 to 2008-09, state government's own tax and non-
tax revenue receipts together barely covered one-fourth of its total revenue expenditure and in fact,
this proportion has been on the decline. The position of almost every other state government is

246
better on this count; they raise more than 50 percent of their total revenue expenditure
requirements from their own tax and non-tax receipts. The most notable case is Maharashtra, with
close to 75 percent of its revenue expenditure being met from its own tax and non-tax sources.
(vii) Ratio of Gross Transfers from Central Government to Aggregate Expenditure : This ratio
brings out the state government's dependence on external resources viz., the central government.
For Bihar, this dependency on central government for meeting its expenditure needs is very high.
From around 40 percent in 2003-04, this ratio has increased steadily to as much as of 72 percent in
last two years, indicating an overwhelming dependence of the state on the central government.
None of the other states considered has such a high ratio.
(viii) Ratio of Debt Servicing to Gross Transfers from Central Government : Till 2003-04, debt
servicing used to consume a very substantial portion of the gross transfer from the central
government. However, due to better debt management, this ratio has been brought down from
more than 100 percent in 2003-04 to 22 percent in 2008-09. The performance of Bihar in this
respect is significantly better compared to the other states. Gujarat, Kerala and West Bengal have
ratios which are either close to or more than 100 percent, indicating that not only are fresh
borrowings being used only for discharging the existing debt, but also that resources transferred
from the central government as the states’ shares of central taxes are also being utilized for the
purpose of servicing of the existing debt. This obviously makes the states starve of much needed
funds for financing development projects. Andhra Pradesh, Rajasthan and Tamil Nadu also have
very high ratios in respect of this fiscal indicator.
Table 7.2 : Major Fiscal Indicators
(All figures in percent)
A. Revenue Deficit : GFD B. Capital Outlay: GFD State
2006-07 2007-08 2008-09 2006-07 2007-08 2008-09
Bihar -82.70 -272.78 -138.74 172.50 358.31 229.63
West Bengal 72.89 74.22 61.96 17.67 17.84 30.51
Orissa 274.94 -150.99 -22.24 -176.64 246.05 119.05
MP -405.35 -203.78 662.00 392.82 238.43 -216.78
Rajasthan -33.97 -6.67 -41.45 155.48 147.30 141.03
Andhra Pradesh -165.64 -7.53 76.38 250.77 96.96 -1.51
Kerala 68.97 67.29 59.85 23.63 21.74 27.75
Tamil Nadu 116.29 -63.13 -1.46 43.50 165.72 94.66
Maharashtra -7.01 2478.36 -7.33 87.35 -2156.91 102.54
Gujarat -31.29 -37.62 1.55 138.79 133.35 97.54

247
C. Non-Dev Exp: Aggregate Disbursements
D. Interest Payment: Revenue Expenditure State
2006-07 2007-08 2008-09 2006-07 2007-08 2008-09
Bihar 31.85 29.31 28.26 16.32 15.73 13.12
West Bengal 39.48 39.10 39.32 31.84 28.98 28.52
Orissa 38.78 34.36 36.13 20.21 20.55 18.99
MP 31.24 28.80 30.07 18.01 15.85 14.23
Rajasthan 34.77 29.83 32.20 26.95 19.82 20.25
Andhra Pradesh 33.00 30.61 25.98 18.08 16.18 13.39
Kerala 38.98 37.34 36.44 20.12 18.20 18.17
Tamil Nadu 33.91 32.74 31.65 11.90 12.00 10.74
Maharashtra 16.46 14.00 22.76 19.84 19.00 16.45
Gujarat 30.90 31.36 31.71 23.71 22.72 21.34
E. State’s Tax Rev : Rev Exp F. State’s Non-Tax Rev: Rev Exp State
2006-07 2007-08 2008-09 2006-07 2007-08 2008-09
Bihar 20.74 21.58 18.16 1.65 2.23 1.46
West Bengal 36.62 34.14 36.58 3.66 3.98 4.08
Orissa 37.99 34.08 31.64 16.41 9.72 9.40
MP 46.10 44.18 44.32 11.89 9.66 9.56
Rajasthan 46.52 42.97 45.78 13.75 12.88 11.29
Andhra Pradesh 57.74 56.40 53.93 15.65 12.34 12.63
Kerala 57.34 53.54 55.75 4.50 4.14 4.57
Tamil Nadu 72.58 64.14 64.48 8.94 6.59 6.37
Maharashtra 65.32 70.38 65.73 12.25 25.00 8.50
Gujarat 62.73 65.36 61.49 16.93 12.86 11.21
G. Gross Transfers: Aggregate Disbursements
H. Debt servicing: Gross Transfers State
2006-07 2007-08 2008-09 2006-07 2007-08 2008-09 Bihar 66.38 71.58 72.26 33.42 27.23 22.41 West Bengal 29.15 33.22 34.48 122.55 104.44 99.49 Orissa 48.86 51.00 50.13 53.31 48.79 44.29 MP 46.23 46.81 46.19 39.41 38.21 45.30 Rajasthan 35.46 36.27 38.96 64.88 54.82 57.83 Andhra Pradesh 29.80 28.62 31.07 84.93 78.41 69.87 Kerala 17.92 16.70 19.11 137.16 151.14 125.59 Tamil Nadu 21.98 26.71 24.80 95.13 63.24 51.17 Maharashtra 18.57 19.81 21.39 32.29 27.55 28.85 Gujarat 19.67 21.69 20.86 112.78 101.50 109.73

248
-300
-250
-200
-150
-100
-50
0
50
2003
-04
2004
-05
2005
-06
2006
-07
2007
-08
2008
-09
RevenueDeficit:GFD of Bihar
0
50
100
150
200
250
300
350
400
2003
-04
2004
-05
2005
-06
2006
-07
2007
-08
2008
-09
CapitalOutlay:GFD ofBihar
0
5
10
15
20
25
30
35
40
45
20
03
-04
20
04
-05
20
05
-06
20
06
-07
20
07
-08
20
08
-09
Non-DevExp:AggDisbursements
0
5
10
15
20
25
30
2003
-04
2004
-05
2005
-06
2006
-07
2007
-08
2008
-09
InterestPayment:RevenueExpenditure
0
5
10
15
20
25
2003
-04
2004
-05
2005
-06
2006
-07
2007
-08
2008
-09
State'sTaxRev:Rev Exp

249
0
0.5
1
1.5
2
2.5
3
2003
-04
2004
-05
2005
-06
2006
-07
2007
-08
2008
-09
State's Non-Tax Rev:Rev Exp
0
10
20
30
40
50
60
70
80
2003
-04
2004
-05
2005
-06
2006
-07
2007
-08
2008
-09
GrossTransfers:Agg Dis.
0
20
40
60
80
100
120
2003
-04
2004
-05
2005
-06
2006
-07
2007
-08
2008
-09
Debtservicing:GrossTransfers

250
7.4 Sustainability, Flexibility and Vulnerability of State Finances
The analysis in the preceding section can be extended further to identify the factors that make a
state government financially healthy and ensure its continued development. For development, it is
necessary that a government should try to expand the level of its activity. It would then be
necessary to know whether the means of financing these activities are sustainable, i.e., they meet
the increased expenditure needs without substantially adding to the debt burden of the state. If the
government wishes to expand the level of its activity, it would be pertinent to examine the
flexibility of the means of financing (increasing the revenue or by borrowing) and whether the
expanded levels of activity expose the government to more risks and make it vulnerable to be
influenced by the sources of funding. The state governments increase their levels of activity
primarily through the Five Year Plans which translate into annual development plans and are
provided for in the state budgets. Thus, it can be broadly stated that non-plan expenditure
represents the maintenance of the existing levels of activity, while plan expenditure entails
expansion in the level of activity. Some of the factors which measure the sustainability, flexibility
and vulnerability of the finances of the Bihar Government have been shown in Table 7.3 and are
discussed in the succeeding paragraphs.
(i) Balance of Current Revenue (BCR) : This is calculated as state government's Own Revenue
Receipts, plus share of Central Taxes, plus Non-Plan Grants, minus Non-Plan Revenue
Expenditure. A positive BCR shows that the state government has surplus funds from its revenues
for meeting plan expenditure. Bihar had a substantially positive BCR of Rs 5124 crore at the end
of 2007-08, which is further projected to increase to Rs 5738 crore at the end of 2008-09.
(ii) Interest Ratio : This is calculated as (Interest payment-Interest receipt) / (Total Revenue-
Interest receipt). A higher ratio indicates a lower ability of the state government to service any
fresh debt and meet its revenue expenditure from its revenue receipts. For Bihar, the ratio has
fallen by more than half from more than 30 percent in 2003-04 to about 15 percent in 2008-09.
(iii) Capital Outlay/Capital Receipts : This ratio indicates to what extent the capital receipts are
applied for capital formation. A ratio of less than 100 percent would not be sustainable in the long
run, as that would indicate that capital receipts are utilized for revenue expenditure. For the first
time in 2006-07, the ratio has touched a healthy figure of 220 percent. The positive trend was
sustained and further enhanced in 2007-08 when it rose to 373 percent. It is, however, projected to
come down to 169 percent in 2008-09 due to a substantially higher level of borrowings to pay for

251
higher capital outlay. It must be mentioned that, prior to 2005-06, the ratio used to remain below
20 percent, mostly due to the high debt service payments that used to consume most of the capital
receipts.
(iv) State Tax Receipts/GSDP : This is an important indicator of the gap between the state’s tax
efforts and its tax potential. A low ratio also indicates low tax compliance and reliance on
borrowings rather than taxation to meet the deficit. Further, the gap between this ratio and the ratio
of Total Receipts/ GSDP indicate the extent to which the state government is dependent on the
share of central taxes. For Bihar, the ratio of Total Tax Receipts to GSDP increased from 19
percent in 2003-04 to 30 percent in 2008-09. However, the ratio of state government's Own Tax
Receipt to GSDP remained the same at about 5 percent during the period from 2003-04 to 2008-
09. The tax potential of Bihar clearly remains largely untapped, as this ratio is very low. It cannot
also be ignored that about one third of its revenue are always in arrears, amounting to nearly Rs
1500 crore.
(v) Public Debt/GSDP : This ratio indicates whether the state government has fallen into a debt
trap from which it may not be able to come out on its own. A high ratio leaves little room for the
state government for financial maneuvering and indicates lack of flexibility in its finances. It can
be noted here that the total debt which constituted about 40 percent of the GSDP in 2003-04 has
now been successfully brought down to 34 percent in 2007-08. This level is projected to be
maintained in 2008-09 also. A high debt-GSDP ratio takes away whatever little flexibility the state
government has in respect of its finances and if it goes beyond a sustainable level, the state
government falls into a debt trap. As already pointed out, Bihar is safe on this account.
(vi) Primary Deficit : This is the GFD minus interest payments. It measures the impact of the
current financial policies of the state government vis-a-vis the liabilities created in the past, for
which interest has to be paid now. From 2006-07 onwards, Bihar has a primary surplus, which is
again a positive indicator.
(vii) Financial Asset/Liability Ratio : This indicates the solvency of the state government and
indicates its risk exposure and vulnerability. There has been substantial improvement in the ratio
from 72 percent in 2003-04 to 96 percent in 2007-08.

252
(viii) Buoyancy of State’s Tax and Non-Tax Revenues : Tax receipts of the state government were
highly buoyant in 2007-08 with respect to GSDP, but the non-tax receipts showed no relation to
GSDP. In fact, given the sudden and abrupt increase in buoyancy of the state’s own tax revenues
in 2007-08, it is more likely to be caused by factors like tax effort, rather than increase in the
income levels in the state. However, it must be noted here that the growth of its revenue receipts
(including the share of central taxes and grants) has been substantially outstripping the growth in
outstanding liabilities since 2003-04. It has given the finances of the state government an element
of security against any future debt trap. But to improve financial security further, the state
government needs longer term measures to augment its own revenues including both tax and non-
tax revenues.
(ix) Capital Repayment / Capital Borrowings : This ratio indicates the extent to which the debt
receipts meant for capital purposes could not be utilized for asset creation. A higher ratio would
indicate that a higher percentage of capital receipts has been utilised for capital repayment and, to
that extent, the state government has been deprived of the scope of capital asset creation. For
Bihar, this ratio declined from more than 70 percent in 2003-04 to 37 percent in 2008-09. This
indicates that more than 60 percent of the capital receipts are actually going towards creation of
income generating capital assets in the state.
To summarise, the fiscal position of the state government had started showing significant
improvements since 2005-06, as reflected by the parameters discussed above. These indicators
continued to improve further in the succeeding years, turning around the fiscal position in 2007-
08. The contributing factors were substantial increases in the central grants and share of taxes,
higher resource mobilisation, better expenditure management and, finally prudent debt
management. At the end of 2007-08, the finances of the state government were on a much stronger
footing than ever before in the past. All key fiscal indicators pointed to a marked improvement in
the fiscal position of the state government. The sustainability parameters had improved
significantly, though the tax potential remains substantially untapped and the tax efforts leave
scope for improvement. Tax revenues were buoyant, though non-tax revenues showed no
responsiveness to the increasing state income. The state government's finances had shown
increased flexibility over the years it was in a much better position to direct its resources towards

253
improving the standards of social and economic services and infrastructure. In terms of
vulnerability, however, the state government still remains overwhelmingly dependent on the
external resources, i.e., central funds, for meeting its own expenditure needs.
Table 7.3 : Fiscal and Financial Performance Indicators
A. Sustainability 2003-04 2004-05 2005-06 2006-07 2007-08 2008-09
Balance from Current Revenue (Rs Crore) -638 924 685 2999 5124 5738
Interest Ratio 30.70 26.54 24.02 18.35 15.92 15.13
Capital Outlay / Capital Receipts 19.53 15.76 54.51 220.32 372.62 168.84
State's Own Tax Receipts / GSDP 4.41 4.56 4.44 4.07 4.84 4.68
State's Own Non-Tax Receipts / GSDP 0.48 0.57 0.65 0.52 0.50 0.38
Buoyancy of State’s Own Tax Receipts w.r.t. GSDP 2.77 1.38 0.69 0.56 4.17 0.49
Buoyancy of State’s Own Non-Tax Receipts w.r.t. GSDP 13.08 2.89 2.64 -0.09 0.45 -2.85
Return on Investment (Rs Crore) 0.04 0.04 0.04 0.04 3.19 -----
Growth in outstanding liabilities 7.45 14.37 8.02 4.07 0.56 7.14
Growth in total revenue receipts 13.56 26.16 13.51 29.41 22.21 18.93
B. Flexibility 2003-04 2004-05 2005-06 2006-07 2007-08 2008-09
Capital Repayment / Capital Borrowings 71.38 40.48 26.01 43.47 101.24 37.25
Total Tax Receipts / GSDP 15.87 17.02 17.44 17.51 20.78 21.66
Average Interest Rate on Government Borrowing 9.00 9.59 8.20 7.15 7.15 ------
Debt Outstanding / GSDP 51.92 53.73 53.02 44.69 42.30 42.38
C. Vulnerability 2003-04 2004-05 2005-06 2006-07 2007-08 2008-09
Revenue Deficit (Rs Crore) 255 -1076 -82 -2498 -4647 -4613
Fiscal Deficit (Rs Crore) 4363 1242 3700 3021 1703 3325
Primary Deficit (Rs Crore) 1020 -2232 51 -395 -2004 -471
Primary Deficit / Fiscal Deficit 23.38 -179.75 1.39 -13.08 -117.61 -14.17
Revenue Deficit / Fiscal Deficit 5.85 -86.63 -2.21 -82.70 -272.78 -138.74
Financial Assets / Liabilities 72.00 78.00 80.00 86.00 96.00 ------
Arrears of Revenue (Rs Crore) 1357 1101 1345 1477 ------ ------
Arrears of Revenue/ Total Own Revenue (%) 41.89 29.28 32.94 32.51 ------ ------

254
7.5 Deficit Management
Table 7.4 shows the position in the revenue account as well as the combined position of the
revenue and capital accounts of some major states for the years 2006-07 to 2008-09. As noted
earlier, the revenue deficit of Bihar was controlled effectively with the result that, from 2006-07
onwards, there was a growing surplus in the revenue account. In the combined revenue and capital
accounts of Bihar, the budget deficit could also be reduced from Rs 1724 crore in 2007-08 to only
Rs 501 crore in the 2008-09, due to this large surplus in the revenue account. Several other states
like Rajasthan, Andhra Pradesh and Madhya Pradesh have also consistently managed a surplus in
the revenue account as well a surplus in their budgets.
Table 7.4 : Deficit/Surplus position of States
(Rs. crore)
Revenue Deficit(+)/Surplus(-) Conventional Deficit(+)/Surplus(-) State
2006-07 2007-08 2008-09 2006-07 2007-08 2008-09
Bihar -2498 -4647 -4613 1688 1724 501
West Bengal 8333 8138 7370 4105 174.37 126
Orissa -2260 -1682 -564 -1019 297 329
MP -3332 -3346 -2840 -2803 -3435 -5550
Rajasthan -638 -247 -1183 -565 -75 -1516
Andhra Pradesh -2806 -451 -708 -9899 -17476 -22719
Kerala 2638 4644 3367 7387 10833 10296
Tamil Nadu -2649 -976 -85 -4735 -3098 -2022
Maharashtra -810 -13631 -964 12 -2986 -1638
Gujarat -1769 -2034 123 472 -1413 646
-4000
-3000
-2000
-1000
0
1000
2000
3000
2003
-04
2004
-05
2005
-06
2006
-07
2007
-08
2008
-09
Conventional Deficit
-5000-4500-4000-3500-3000-2500-2000-1500-1000-500
0500
2003
-04
2004
-05
2005
-06
2006
-07
2007
-08
2008
-09
RevenueDeficit

255
As observed earlier, GFD of a state government is a fairly sensitive indicator of its financial
performance, as it reflects the total resource gap in its economy. Table 7.5 presents the GFD of a
few major states. Bihar’s GFD at around Rs 3000 crore in 2006-07 was sharply reduced to only
Rs 1700 crore in the next year, but is again projected to go up to Rs 3300 crore in 2008-09.
However, as a percentage of GSDP, it came down from a peak of 6.59 percent in 2003-04 to only
1.62 percent in 2007-08; even in 2008-09, it is projected to be within the FRBMA target of 3
percent.
Table 7.5 : Gross Fiscal Deficit
(Rs. crore) State 2006-07 2007-08 2008-09
Bihar 3021 1703 3325West Bengal 11432 10965 11894Orissa -822 1114 2536MP 822 1642 -429Rajasthan 1878 3704 2854Andhra Pradesh 1694 5987 -927Kerala 3825 6901 5626Tamil Nadu -2278 1546 5838Maharashtra 11553 -550 13159Gujarat 5653 5407 7935
Table 7.6 shows the decomposition of the GFD of Bihar, from which one can find that capital
outlay contributed most to GFD during the years 2003-04 through 2008-09, especially during the
recent years.
0
500
1000
1500
2000
2500
3000
3500
4000
4500
20
03
-04
20
04
-05
20
05
-06
20
06
-07
20
07
-08
20
08
-09
GDP of Bihar (Rs Crore)GSDP of Bihar (Rs Crore)
0
20000
40000
60000
80000
100000
120000
2003
-04
2004
-05
2005
-06
2006
-07
2007
-08
2008
-09

256
Table 7.6 : Decomposition of Gross Fiscal Deficit of Bihar
(Rs crore)
2003-04 2004-05 2005-06 2006-07 2007-08 2008-09
Revenue Deficit 255 -1076 -82 -2498 -4647 -4613
Capital Outlay 1549 1205 2083 5211 6104 7635
Net Lending 2558 1113 1697 308 247 303
GFD 4363 1242 3698 3021 1703 3325
GSDP 66254 73221 80157 98957 105148 112424
GFD: GSDP ratio(%) 6.59 1.70 4.62 3.05 1.62 2.96
De com position o f G FD o f Biha r (Rs Crore )
-6 0 0 0
-4 0 0 0
-2 0 0 0
0
2 0 0 0
4 0 0 0
6 0 0 0
8 0 0 0
1 0 0 0 0
2 0 0 3 -0 4 2 0 0 4 -0 5 2 0 0 5 -0 6 2 0 0 6 -0 7 2 0 0 7 -0 8 2 0 0 8 -0 9
Rev enue Def ic it Capita l Outlay Net Lending
GFD: GSDP ratio(%)
0
1
2
3
4
5
6
7
2003-04 2004-05 2005-06 2006-07 2007-08 2008-09

257
Table 7.7 shows how the GFD was financed during all these years. The net borrowing mainly
consisted of internal market borrowings made by the state government as well as the central loans,
less the recoveries of loans and advances made by the state government. The internal market
borrowings of the state government mainly financed its GFD, apart from the Public Account
receipts from small savings, provident funds etc. From 2005-06 onwards, loans from the central
government had no role in the financing of the GFD. Recovery of the loans and advances made by
the state government again has always remained negligible.
Table 7.7 : Financing of Gross Fiscal Deficit of Bihar
(Rs crore)
2003-04 2004-05 2005-06 2006-07 2007-08 2008-09
Net Public Account Receipts 2278 -3974 1209 1785 352 445
Increase in Cash Balance -182 676 -299 -97 1372 56
Net Borrowing 2267 4539 2790 1333 -20 2824
GFD 4363 1242 3700 3021 1703 3325
Financing of GFD of Bihar (Rs Crore)
-6000
-4000
-2000
0
2000
4000
6000
2003-04 2004-05 2005-06 2006-07 2007-08 2008-09
Net Public Account Opg CB-Clg CB Net Borrowing

258
7.6 Receipt and Expenditure of Bihar Government: Revenue Account
The summary of revenue receipts and expenditure of Bihar is shown in Table 7.8. From 2003-04
to 2008-09, revenue receipts and expenditure grew at nearly the same rate. With receipt
outgrowing the expenditure during the last 4 years, it has resulted in a revenue surplus. The state
government's own revenue, tax and non-tax combined, barely meets 20 percent of its revenue
expenditure needs, and the rest has to come from its share of taxes and grants from the central
government. While the total revenue of the state government has grown nearly threefold during
the period 2003-2009, from Rs 12456 crore to Rs 33551 crore, the state government's own total
revenue, tax and non-tax combined, have grown at a much slower rate, from Rs. 3239 crore to Rs.
5678 crore during the same period, i.e., by 75 percent.
In Table 7.8, some more parameters of the state government finance are considered through a
comparison of the state governments' own tax and non-tax revenues respectively with its total tax
and non-tax revenues. The state government's total tax revenue consists of the its own revenues as
well as its share from the divisible pool of central taxes, mainly Income Tax and Union Excice
Duties. The share of state government's own revenue in total revenue declined from 26 percent to
17 percent during the period, while its own non-tax revenue remained nearly same during the
period with some minor variations. Thus the state government remains overwhelmingly dependent
on the central government and therefore vulnerable to the changes in its policy and attitudes.
Table 7.8 : Revenue Account of Bihar
(Rs crore)
2003-04 2004-05 2005-06 2006-07 2007-08 2008-09
Revenue Receipt 12456 15714 17838 23083 28210 33551
Revenue Expenditure 12711 14638 17756 20585 23563 28938
Revenue Deficit 255 -1076 -82 -2498 -4647 -4613
State’s own tax + non-tax revenue 3239 3760 4083 4543 5611 5678
State’s own revenue as % of total revenue 26 24 23 20 20 17
State’s own revenue as % of revenue expenditure 25 26 23 22 24 20

259
Table 7.9 : Expenditure of Bihar Government
(Rs crore)
2003-04 2004-05 2005-06 2006-07 2007-08 2008-09
Developmental Expenditure 15303 12250 14041 18489 22314 27669
Non-Developmental Expenditure 7175 7803 8523 8643 9252 10901
Total Expenditure 22482 20058 22568 27136 31571 38574
Dev Expenditure as % of Total Expenditure 68 61 62 68 71 72
Plan Expenditure 5202 3476 4899 9397 10908 15746
Non-Plan Expenditure 17280 16581 17670 17740 20664 22828
Interest Payments 3343 3474 3649 3416 3707 3796
Table 7.9 shows the total expenditure of the state government for developmental and non-
developmental as well as its plan and non-plan expenditure. Plan expenditure is mostly
developmental, while non-plan expenditure is mostly non-developmental. In the absence of any
clear guideline for classification of expenditure between plan and non-plan on a rational basis, the
distinction continues to remain ambiguous and sometimes irrational too. All expenditures under
non-developmental heads is non-plan expenditure, but non-plan expenditure may have a
developmental component. This analysis of the expenditure, however, is restricted to the
conventional definition of the terms.
0
5000
10000
15000
20000
25000
20
03
-04
20
04
-05
20
05
-06
20
06
-07
20
07
-08
20
08
-09
Tax Revenues (Rs Crore)
Total Tax Revenue Own Tax Revenue
Revenue Receipt of Bihar (Rs Cr)
-10000
-5000
0
5000
10000
15000
20000
25000
30000
35000
40000
2003-04 2004-05 2005-06 2006-07 2007-08 2008-09
Revenue ReceiptRevenue Expenditure Revenue Deficit

260
Referring to Table 7.9 and the related charts, one may note that the developmental expenditure in
Bihar has constituted about 60 -70 percent of the total expenditure during all the years under
consideration. In absolute terms, it has nearly doubled over the years and, except for a marginal
decline in 2004-05, the pace of growth has been very high. The non-developmental expenditure,
on the other hand, has increased at a slower rate. As already noted, plan expenditure is made for
taking up new development projects in the state. In Bihar, about 20 percent of the total expenditure
of the state government has been plan expenditure till 2005-06, after which the share of plan
expenditure has increased steadily to about 40 percent in 2008-09. Nearly half of the non-plan
Dev. Vs Non-Dev. Expenditure (Rs Cr)
0
5000
10000
15000
20000
25000
30000
2003-04
2004-05
2005-06
2006-07
2007-08
2008-09
Developmental Expenditure
Non-Developmental Expenditure
Plan Vs Non-Plan Expenditure (Rs Cr)
0
5000
10000
15000
20000
25000
2003
-04
2004
-05
2005
-06
2006
-07
2007
-08
2008
-09
Plan ExpenditureNon-Plan ExpenditureInterest Payments
Dev and Non-Dev Exp (%)
0%
20%
40%
60%
80%
100%
2003-04
2004-05
2005-06
2006-07
2007-08
2008-09
Non-Developmental Expenditure
Developmental Expenditure
Plan and Non_Plan Exp (%)
0%
10%
20%
30%
40%
50%
60%
70%
80%
90%
100%
2003-04 2004-05 2005-06 2006-07 2007-08 2008-09
Plan Expenditure Non-Plan Expenditure

261
expenditure is non-developmental in nature, and nearly a quarter is solely due to interest payment
on outstanding loans and payments on account of pension and gratuity. As already noted, interest
payments have now been contained at around Rs 3700 crore in 2008-09, compared to about Rs
3300 crore in 2003-04. The total plan expenditure increased by almost Rs 10,500 crore during the
period, while the total non-plan expenditure increased by about Rs 5500 crore during the same
period.
As regards the crucial component of interest payment, it is seen from Table 7.10 that the
difference between the gross and net interest payments is only nominal due to the extremely poor
recovery of interest on the loans and advances given by the state government to its public sector
enterprises which are mostly loss-making and autonomous bodies. For many of these public
enterprises, their accumulated losses have completely wiped out their equity bases including
reserves several times over. The interest receipts, however, showed more than a nominal increase,
mainly from the investments of its cash balances (Table 7.11). Nevertheless, this increase is too
small to offset the ever-widening gap between interest payments and interest receipts. Thus,
interest payments consume about 20 percent of the total revenue expenditure of the state
government; but it must be noted that while the revenue expenditure increased nearly thereefold
during the period, interest payments increased by only 13.6 percent. From Table 7.12, we note that
the capital outlay has substantially increased from very low (7 percent) in 2003-04 to nearly a
quarter of the total expenditure in 2008-09, drawing from the substantial surplus in the revenue
account.
Table 7.10 : Interest Payment and Receipt
(Rs crore)
2003-04 2004-05 2005-06 2006-07 2007-08 2008-09
Gross Interest Payment 3343.04 3473.9 3648.89 3416.08 3706.99 3796.03
Net Interest Payment 3319.96 3398.85 3432.82 3240.09 3536.28 3738.59
Table 7.11 : Cash Balance of Bihar (Rs crore)
2003-04 2004-05 2005-06 2006-07 2007-08 2008-09
Balance in Cash Investment Account -930.28 -747.99 -1424.47 -1125.59 -1028.58 -2400.21
Increase in Closing Cash Balance 457.35 182.29 -676.48 298.88 97.01 -1371.63

262
Table 7.12 : Other Parameters of Expenditure
(Rs crore)
2003-04 2004-05 2005-06 2006-07 2007-08 2008-09 Total Tax Revenue 10518 12465 13983 17325 21852 24353
Own Tax Revenue 2919 3342 3561 4032 5085 5256
Total non-tax Revenue 320 418 522 511 526 422
Actual Capital Outlay 1549 1205 2083 5211 6104 7635
Capital Outlay as % of Total Expenditure 6.89 6.01 9.23 19.2 19.33 24.68
The exact nature of the state government's dependence on central resources can be seen from
Table 7.13 which shows the gross transfer of resources to Bihar during the period from 2003-04 to
2008-09. The gross transfer of resources includes the state’s share in central taxes, grants-in-aid
from the centre, as well as loans. The gross transfer of resources to the state government increased
steadily from 41 to 72 percent of the aggregate disbursements over the period, excluding the
central loans. The contribution of such loans in recent years, except in 2007-08, was almost nil.
About 70 percent of the gross transfers to the state government came from its share of central
taxes and the rest from grants and loans. There is no real difference between the gross and net
figures of resource transfer, since the state government has not resorted to central loans for the last
four years except in 2007-08.
2900
3000
3100
3200
3300
3400
3500
3600
3700
3800
20
03
-04
20
04
-05
20
05
-06
20
06
-07
20
07
-08
20
08
-09
Interest Burden (Rs Cr)
Gross Intt. PaymentNet Interest Payment
Transfer of Resources from Centre
0
5000
10000
15000
20000
25000
30000
20
03
-04
20
04
-05
20
05
-06
20
06
-07
20
07
-08
20
08
-0
Gross Loans from Centre
Grants fromCentre
Share inCentral Tax

263
Table 7.13 : Transfer of Resources from Centre to Bihar (Rs crore)
2003-04 2004-05 2005-06 2006-07 2007-08 2008-09
Share in Central Tax 7599 9122 10421 13293 16767 19097
Grants-in-Aid from Centre 1618 2832 3333 5247 5832 8776
Gross Loans from Centre 820 1654 2 3 468 8
Gross transfer of Resources 9216 11954 13754 18543 23067 27880
Net Loans from Centre -1560 -1069 -486 -314 40 -421
Net Transfer of Resources 7656 10885 13268 18229 23107 27460
7.7 Debt Management
Table 7.14 shows the outstanding fesical liabilities of the state government. The total outstanding
liability of the state government, as a percentage of GSDP, had decreased from 51 percent to 42
percent during the period from 2003-04 to 2008-09 and it reflects the state government's ability to
contain the debt burden. To understand the full import of the data presented in Table 7.14, one also
needs to look at Tables 7.15 and 7.16, which respectively depict the net amount of debt raised and
discharged by the state government. The total public debt, as can be seen from Table 7.14, was Rs.
35,045 at the end of 2007-08, which is 33 percent of the State’s GSDP. This large figure is the
accumulated effect of past borrowings, growing at an average annual rate of about 5.5 percent
since 2003-04. The major part of this huge debt (about 60 percent) is due to the internal loans
raised by the state government from the market, and about 16 percent is from the central
government. One significant feature of the composition of outstanding debt is that the loans from
centre has been continually discharged throughout the period without resorting to substantial fresh
borrowing. This has resulted in gradual reduction of the debt to the central government from Rs
10,106 crore in 2003-04 to Rs 7856 crore in 2008-09.
Table 7.14 : Outstanding Liabilities (Rs crore)
2003-04 2004-05 2005-06 2006-07 2007-08 2008-09
Internal Debt 16298 21906 25182 26829 26769 30014
Central Loans 10106 9037 8551 8237 8277 7856
Total Public Debt 26404 30943 33733 35065 35045 37870
Public Account 7997 8401 8766 9161 9429 9779
Total Liability 34401 39344 42498 44226 44475 47649
Outstanding Liability as % of GSDP 51.38 53.32 53.33 51.6 42.30 42.38

264
Table 7.15 : Net Debt Received (Rs crore)
2003-04 2004-05 2005-06 2006-07 2007-08 2008-09
Gross Central Loans Recd 820 1654 2 3 468 8
Internal Debt Recd 7100 5972 3769 2355 1144 4493
PF Small Savings 987 1198 1088 1012 1084 2696
Total Debt Recd 8907 8824 4858 3370 2696 7197
Recoveries of Loans and Advances 10 15 51 7 26 22
Interest payments 3343 3474 3649 3416 3707 3796
Interest Received 23 75 216 176 171 57
Repayment of Debt 6522 3882 1703 1642 2447 2450
Net Debt Recd -925 1558 -227 -1505 -3262 1030
Net Debt Received as %of Total Borrowing -10.38 17.66 -4.68 -44.65 -120.99 14.31
Table 7.16 : Repayment Liabilities (Rs crore)
2003-04 2004-05 2005-06 2006-07 2007-08 2008-09
Discharge of internal debt 3273 365 493 708 1203 1248
Repayment of loans to Centre 2380 2723 488 317 429 429
Discharge of other liabilities 869 795 723 617 815 774
Total Repayment 6522 3882 1703 1642 2447 2450
Total Interest Payment 3343 3474 3649 3416 3707 3796
Borrowings of Bihar Govt (Rs Cr)
0
1000
2000
3000
4000
5000
6000
7000
8000
9000
10000
2003-04 2004-05 2005-06 2006-07 2007-08 2008-09
PF Small Savings
Internal Debt Recd
Gross CentralLoans Recd
Net Debt Received (Rs Crore)
-6000
-4000
-2000
0
2000
4000
6000
8000
10000
12000
2003-04
2004-05
2005-06
2006-07
2007-08
2008-09
Total Borrow ing
Total Debt Servicing
Net Debt Received

265
7.8 : FRBM Act and Fiscal Correction Path
The state government had enacted the Fiscal Responsibility and Budget Management (FRBM) Act
in 2006 making it responsible for prudent financial management and fiscal stability. The Act
directs the state government to eliminate revenue deficit and contain fiscal deficit with efficient
debt management and greater transparency in fiscal operations. The targets envisaged in the Act
are :
(i) To reduce Revenue Deficit / GFD ratio by 0.1 percent every year beginning with 2006-07;
(ii) To eliminate Revenue Deficit by 2008-09;
(iii) To reduce GFD:GSDP ratio by 0.3 per cent every year beginning with 2006-07 if it is more
than 3 percent; otherwise, to contain the ratio within 3 percent by 2008-09.
As pointed out already, The state government has fully achieved these targets. The state
government has also developed its own Fiscal Correction Path (FCP), indicating milestones of
outcome indicators during the period 2004-10. Earlier, the Twelfth Finance Commission (TFC)
had recommended norms and ceilings for some fiscal aggregates and also made normative
projection for others. Table 7.17 gives a comparative statement of actual achievements against
targets set under TFC and FCP. It can be seen from the table that the state government has
achieved nearly all the FCP targets.
0
5
10
15
20
25
30
20
03
-04
20
04
-05
20
05
-06
20
06
-07
20
07
-08
20
08
-09
InttPayment:Rev Exp ofBihar
Debt Buiden vis-a-vis Debt Servicing (Rs Cr)
0
10000
20000
30000
40000
50000
60000
2003-04
2004-05
2005-06
2006-07
2007-08
2008-09
Debt BurdenDebt Service Payments

266
Table 7.17 : Targets and Achievement under Fiscal Correction path, 2007-08
(Rs crore)
Fiscal forecasts Projection in
TFC Projection as per
FCP Actual
Own Tax Revenue 6430.39 5020 5086
Own Non-Tax Revenue 1162.47 353 526
Revenue Expenditure - 23128 23563
Non Plan Revenue Expenditure
17005.61 18665 18759
Capital Expenditure - 5158 6376
Revenue Surplus (+) To be wiped out by
2008-09 (+)1310 4647
Fiscal Deficit (-)/ Surplus (+)
To reduce to not more than 3 per cent of GSDP by 2008-09
(-)1703
Consolidated Debt (including Guarantees)
31 per cent of GSDP by 2008-09
52122 51080 (51.13 Per
cent of GSDP)
7.9 Resource Mobilisation
The revenue receipt of the state government come from both tax and non-tax revenues. The tax
revenue of a state government consists of its own tax revenues and its share in the divisible pool of
taxes and duties of the central government. Similarly, the non-tax revenues consist of the state
government’s own non-tax revenue as well as central grants for plan and non-plan purposes. The
own tax revenues of the state government are classified into :
(i) Taxes on income which include agricultural income tax, taxes on trades;
(ii) Taxes on property and capital transactions which include land revenues, stamp and
registration fees, taxes on urban immovable property; and
(iii) Taxes on commodities and services which by far are the most important sources of the state
government’s own tax revenue and include a variety of taxes like sales tax, turnover tax,
state excise duty, taxes on vehicles, goods and passengers, electricity duty, taxes on
entertainment etc.

267
The share of central taxes consists mainly of the shares of Income tax, Union Excise duty and
additional excise in lieu of sales tax on certain commodities.
The own non-tax revenues of the state government are classified into interest receipts from loans
and advances to various government companies, public sector undertakings and other bodies,
dividends and profit from them, receipts from various services (general, social and fiscal) and
from economic services. Economic services contribute much more significantly to the state
exchequer than other services. The grants from central government are for both plan and non-plan
purposes. Within the plan grants, there are separate grants for the state's own plan schemes, central
plan schemes and also for the centrally sponsored schemes. The non-plan grants include the
statutory grants as well as relief on natural calamities and other public purpose grants.
Table 7.18 shows the revenue receipts of the state government during 2003-04 to 2008-09. From
this table, one can see that, during all these years, about 80 percent of the total receipts of the state
government came from the central government by way of grants-in-aid and state’s share of
divisible pool of taxes. While the own tax revenue of the state government has grown by 80
percent from Rs 2919 crore in 2003-04 to Rs 5256 crore in 2008-09, the non-tax revenue has
grown by 32 percent, from Rs. 320 crore to Rs. 422 crore during the same period. The non-tax
revenue had increased to Rs 526 crore in 2007-08 before declining in the next year. The state
government’s own total revenue (tax plus non-tax) has registered an increase of 75 percent during
this period. The total revenue of the state government, including all transfers from the central
government, increased from Rs. 12,456 crore in 2003-04 to Rs. 33,351 crore in 2008-09, an
increase of 168 percent in 6 years, implying an annual growthrate of nearly 18 percent. However,
the state government’s own share in the total revenue receipts has been steadily decreasing. In
2008-09, it was only 17 percent, as compared to 26 percent in 2003-04.

268
Table 7.18 : Revenue Receipts of the State (Rs crore)
Sources of Revenue 2003-04 2004-05 2005-06 2006-07 2007-08 2008-09 I. State’s Own Revenue 3239 3760 4083 4543 5611 5678 a) Tax Revenue 2919 3342 3561 4032 5085 5256 b) Non-Tax Revenue 320 418 522 511 526 422 II. Receipts from Centre 9216 11954 13754 18540 22599 27873 a) Share of Divisible Taxes 7599 9122 10421 13293 16767 19097 b) Grants-in-aid 1618 2832 3333 5247 5832 8776 III. Total Revenue Receipts 12456 15714 17838 23083 28210 33551 State’s Own Revenue as % of Total Receipts 26 24 23 20 20 17
Among the direct taxes of the state government are included Stamp and Registration Fees, Taxes
on Vehicles, Taxes and Duties on Electricity, Land Revenue and Taxes on Agricultural Income,
the last one being rather insignificant. Among the indirect taxes which are far more important than
the direct taxes, there are taxes on sales / trade, state excise, taxes on goods and passengers and
other taxes and duties on commodities and services. The details of receipts from these taxes from
2003-04 to 2008-09 BE are shown in Table 7.19.
Table 7.19 : Tax Revenue of Bihar Government (Rs crore)
Sources of Revenue 2003-04 2004-05 2005-06 2006-07 2007-08 2008-09 Taxes on Sales, Trade etc. 1637 1891 1734 2081 2535 2938 Stamp and Registration Fees 418 429 505 455 654 581 Taxes on Goods and Passengers 306 473 613 783 938 825 State Excise 240 272 319 382 525 538 Taxes on Vehicles 210 213 302 181 273 257 Land Revenue 34 33 55 75 82 75 Taxes & Duties on Electricity 18 10 18 63 64 30 Other Taxes and Duties on Commodities and Services 57 22 15 12 14 13 Taxes on Agricultural Income 0 0 0 0 0 0 Total 2919 3342 3561 4032 5085 5256
An analysis of the tax receipts of the state government reveals that its major sources of taxes are
sales tax, stamp and registration fees, excise duty of the state, taxes and duties on electricity and
taxes on vehicles. These five taxes together made up as much as 98 percent of the total tax receipts
of the state government in 2008-09. Of these, sales tax alone comprises 56 percent of the total tax
receipts, followed by Stamp and Registration Fees (16 percent). These taxes are highly buoyant
and their yields increase automatically with the general increase in the income level as reflected by

269
the GSDP. The composition of the state government's tax revenue is shown in Table 7.20 and their
growth rates in Table 7.21. In case of taxes on vehicles, there was a major drop between 2005-06
and 2006-07. However, it has again picked up in the next year and remains at that level even in
2008-09. ‘Taxes & Duties on Electricity’ experienced a substantial drop by more than 50 percent
during 2008-09, after registering an impressive growth of about 250 percent during 2006-07.
Barring 2005-06, Taxes on Sales have been growing consistently though the rate of growth has
slowed down in 2008-09. From Table 7.22, one can see that direct taxes contribute about 18
percent of the own total tax revenue of the state government, indirect taxes contributing the rest 82
percent in 2008-09, making the distribution even more skewed than in the previous year. It also
indicates that the process of fiscal reforms that the state government has initiated are yet to be
reflected in the structure of taxation.
Table 7.20 : Composition of Tax Revenue of Bihar Government
(Figures in percentage) Sources of Revenue 2003-04 2004-05 2005-06 2006-07 2007-08 2008-09
Taxes on Sales, Trade etc. 56 57 49 52 50 56
Stamp and Registration Fees 14 13 14 11 18 16
State Excise 8 8 9 9 13 11
Taxes on Vehicles 7 6 8 5 10 10
Taxes & Duties on Electricity 1 0 1 2 5 5
Land Revenue 1 1 2 2 2 1
Taxes on Goods and Passengers 10 14 17 19 1 1
Other Taxes and Duties on Commodities and Services 2 1 0 0 0 0
Taxes on Agricultural Income 0 0 0 0 0 0
Total 100 100 100 100 100 100
Table 7.21 : Growth of Tax Revenue of Bihar Government (Figures in percentage)
Sources of Revenue 2003-04 2004-05 2005-06 2006-07 2007-08 2008-09Overall Growth 2003-09
Taxes on Sales, Trade etc. -1 15 -8 20 22 16 79
Stamp and Registration Fees -1 14 17 -10 44 -11 39
Taxes on Goods and Passengers 20 3 18 28 20 -12 170
State Excise 18 2 42 20 38 2 124
Taxes on Vehicles 23 -46 89 -40 51 -6 22
Land Revenue -7 -1 65 36 10 -9 121
Taxes & Duties on Electricity 16 55 30 248 2 -53 72
Other Taxes and Duties on Commodities and Services 4 -62 -32 -19 17 -4 -77
Taxes on Agricultural Income 0 0 0 0 0 0 0
Total 5 15 7 13 26 3 80

270
Table 7.22 : Structure of Taxation in Bihar (Figures in percentage)
2003-04 2004-05 2005-06 2006-07 2007-08 2008-09
Share of Direct Taxes in State’s Own Tax Revenue 23 20 25 19 21 18
Share of Indirect Taxes in State’s Own Tax Revenue 77 80 75 81 79 82
Composition of Major Revenues of Bihar (%)
0%
10%
20%
30%
40%
50%
60%
70%
80%
90%
100%
2003-04 2004-05 2005-06 2006-07 2007-08 2008-09
Other Taxes
Taxes onVehicles
Stamp andRegistration Fees
State Excise
Taxes on Sales,Trade etc.
Sales Tax vs. Total Own Tax Revenue (Rs Cr)
0
1000
2000
3000
4000
5000
6000
2003-04 2004-05 2005-06 2006-07 2007-08 2008-09
Taxes on Sales, Trade etc. Total

271
Table 7.23 shows the major non-tax revenues of the state government and Table 7.24 shows their
composition and growth. The most important element of the state government’s non-tax revenue is
the royalty from mines and minerals, the other important source being the interest receipts. The
receipt from these two together was about 46 percent of the total non-tax receipts in 2008-09,
down from more than 66 percent the year before, due to a substantial drop in the interest receipts.
The steep increase in the interest receipts in 2005-06 was due to the investment of huge balance of
idle cash in the Cash Balance Investment Account. Thereafter, there has been a steady drop in
collections under this head. The royalty from mines and minerals has grown steadily in the past,
but the yield from this had declined marginally in 2008-09. Overall, the growth of non-tax
revenues has been quite uncertain. The above analysis brings out the importance of sales tax in the
tax revenue and royalty on mines and minerals in the non-tax revenue of the state government as
shown in the accompanying charts.
Table 7.23 : Major Non-Tax Revenues of Bihar
(Rs crore)
Sources of Revenue 2003-04 2004-05 2005-06 2006-07 2007-08 2008-09
Non-Ferrous Mining and Metallurgical Industries 73.34 80.09 100.9 127.65 178.65 140.00
Interest Receipts 23.08 75.05 216.07 175.99 170.74 58.25
Other Rural Development Programmes 21.26 24.67 10.16 13.8 7.31 13.81
Major Irrigation 26.22 0 1.62 1.95 2.41 8.28
Other Administrative Services 80.72 107.98 34.21 20.28 12 16.85
Medical and Public Health 11.97 12.66 15.1 17.51 21.07 17.78
Police 16.85 13.72 6 10.53 23.47 35.91
Roads and Bridges 10.62 8.42 12.05 16.75 17.95 28.17
Social Security and Welfare 10.59 8.3 14.75 18.79 2.75 13.22
Education, Sports, Arts and Culture 4.11 7.34 32.99 27.57 20.88 26.47
Others 41.57 79.49 78.41 80.36 68.33 63.05
Total 320.33 417.72 522.26 511.18 525.56 421.79

272
Table 7.24 : Composition of Non-Tax Revenues of Bihar
(Figures in percentage) Sources of Revenue 2003-04 2004-05 2005-06 2006-07 2007-08 2008-09 Non-Ferrous Mining and Metallurgical Industries 22.9 19.17 19.32 24.97 33.99 33.19 Interest Receipts 7.21 17.97 41.37 34.43 32.49 13.81 Other Rural Development Programmes 6.64 5.91 1.95 2.7 1.39 3.27 Major Irrigation 8.19 0 0.31 0.38 0.46 1.96 Other Administrative Services 25.2 25.85 6.55 3.97 2.28 3.99 Medical and Public Health 3.74 3.03 2.89 3.43 4.01 4.22 Police 5.26 3.28 1.15 2.06 4.47 8.51 Roads and Bridges 3.32 2.02 2.31 3.28 3.42 6.68 Social Security and Welfare 3.31 1.99 2.82 3.68 0.52 3.13 Education, Sports, Arts and Culture 1.28 1.76 6.32 5.39 3.97 6.28 Others 12.98 19.03 15.01 15.72 13.00 14.95 Total 100 100 100 100 100.00 100.00 Growth Rates (%)
Growth rate of Total Non-Tax Revenues 22.84 30.4 25.03 -2.12 2.81 -19.74 Growth rate of Non-Ferrous Mining and Metallurgical Industries -2.45 -16.26 0.77 26.51 39.95 -21.63 Growth rate of Interest Receipts -64.56 149.36 130.27 -18.55 -2.98 -65.88 Growth rate of receipts from Major Irrigation - - - 20.37 46.00 587.00
Composition of Non-Tax Revenue (% )
0%
10%
20%
30%
40%
50%
60%
70%
80%
90%
100%
2003-04 2004-05 2005-06 2006-07 2007-08 2008-09
Non-Ferrous Mining and Metallurgical Industries Interest ReceiptsPolice Roads and BridgesEducation, Sports, Arts and Culture Others

273
The state government has already shifted to a VAT regime from April 2005, replacing sales taxes.
The VAT is more efficient than the sales tax, but there are many related issues that remains to be
sorted relating to the building of an efficient database of the dealers/ distributors/ suppliers/
retailers etc. In 2005-06, the state government undertook a number of reform measures of the tax
system. The VAT rates were substantially reduced in respect of many items, including all
foodgrains due to which there was a drop in its yield in that year. But these rationalization
measures ultimately paid off and the revenue has been increasing at faster rate in later years.
Next to sales tax, the other important taxes are the taxes on property and capital transactions —
stamp and registration fees, taxes on goods and passengers, taxes on vehicles and state excise
duty. The high registration rates in Bihar were brought down substantially from 15.4 percent to 8
percent in urban and from 8.4 percent to 6 percent in rural areas in 2006-07 to improve
compliance.
Turning to the assessments of revenue, one notes some variations between the budget estimates
and the actual realisation of revenues in respect of the individual taxes in 2007-08, though the
overall realization from tax revenues were 9 percent more than the targets (Table 7.25). The
deviation in respect of individual taxes ranged between a maximum of 225 percent to a minimum
of (-) 27 percent. In case of Non-Tax Receipts, the collection exceeded the budget estimates by
nearly 33 percent. Table 7.25 : Variation between the Estimated and Actual Realisation of Tax and Non-Tax Revenue (2007-08)
(Rs crore)
Tax Revenue Budget
EstimatesActual
Receipts
% Variation Excess (+), shortfall (-)
Taxes on Sales, Trade etc. 2880 2535 -11.98
State Excise 500 525 5.08
Stamp and Registration Fees 720 654 -9.15
Taxes on Vehicles 375 273 -27.15
Taxes & Duties on Electricity 20 64 225.29
Land Revenue 75 82 9.99
Other Taxes and duties on Commodities and Services
18 14 -24.25
Taxes on Goods and Passengers 381 938 145.94
Total Tax 20001 21852 9.26
Non Tax Revenue
Non-Ferrous Mining and Metallurgical Industries
103 179 73.56
Forestry and Wildforestry 5 7 42.80
Social Security and Welfare 10 3 -72.55
Total Non Tax 396 526 32.63

274
The cost of collection of different taxes is shown in Table 7.26. The cost of collection was
insignificant compared to the total collection for all major taxes, except for Stamp and
Registration Fees where it was more than 5 percent of total collection. It is also to be noted that,
compared to the all-India averages, the cost in Bihar was much higher in respect of nearly all tax
heads.
Table 7.26 : Cost of Collection of Taxes
Head of revenue receipts
Year Collection (Rs Crore)
Expenditure on collection of
revenue (Rs crore)
Cost as percentage
of Collection
All India average cost of collection
percentage for 2005-06
2004-05 1890.54 21.46 1.14
2005-06 1733.60 25.47 1.47 2006-07 2081.49 27.30 1.31
Taxes on Sales, Trade etc. 2007-08 2534.79 42.73 1.69
0.91
2004-05 272.47 16.19 5.94 2005-06 318.59 14.78 4.64 2006-07 381.93 18.31 4.79
State Excise
2007-08 525.41 22.14 4.21
3.4
2004-05 429.14 22.02 5.13
2005-06 505.29 22.48 4.45 2006-07 455.02 36.86 8.10
Stamp Duty and Registration Fee
2007-08 654.14 34.02 5.20
2.87
2004-05 212.78 3.85 1.81
2005-06 302.44 5.09 1.68 2006-07 181.38 6.03 3.32
Taxes on Vehicles
2007-08 273.20 5.95 2.18
2.67
Table 7.27 shows the state government's own tax and non-tax revenues as percentage of GSDP
which is a measure of a state’s capacity to raise further resources. The tax and non-tax revenue of
Bihar together constitute only about 5 percent of its GSDP which is too low, even at the existing
level of poverty, while the total revenue including Central transfers and grants constitute about
30% of its GSDP as of 2008-09 BE. Table 7.28 shows a comparison between the Tax: GSDP
ratios of different states pertaining to the year 2007-08. It must be noted that while the own tax to
GSDP ratio of Bihar was one of the lowest and much less than the average of the states
considered, the ratio between its total revenues and GSDP was much higher than that of any other
state.

275
Table 7.27 : Tax and Non-tax Revenue as Percentage of GSDP
2003-04 2004-05 2005-06 2006-07 2007-08 2008-09 (BE) Own Tax Revenue as % of GSDP 4.41 4.56 4.44 4.07 4.84 4.68
Own Non-Tax Revenue as % of GSDP
0.48 0.57 0.65 0.52 0.50 0.38
Total Revenue as % of GSDP 18.80 21.46 22.25 23.33 26.83 29.84
Buoyancy of Total Revenue w.r.t. GSDP (Ratio)
2.49 1.43 1.25 3.55 2.74 2.49
Buoyancy of State’s Own Taxes w.r.t. GSDP(Ratio)
1.38 0.69 0.56 4.17 0.49 1.38
GSDP Growth (%) 1.75 10.52 9.47 23.45 6.26 6.92
Table 7.28 : Tax : GSDP Ratio of States (2007-08)
State Revenue Receipts
State's Own Tax
GSDP
State’s Own Tax:
Revenue Receipts
State's Own Tax:
GSDP
Total Revenue:
GSDP
Bihar 28210 5085 105148 0.18 4.84 26.83
Maharashtra 79860 46611 578839 0.58 8.05 13.80
Kerala 21497 13997 148367 0.65 9.43 14.49
Orissa 21381 6713 103376 0.31 6.49 20.68
Rajasthan 30128 12840 166520 0.43 7.71 18.09
Madhya Pradesh 29840 11704 142481 0.39 8.21 20.94
Andhra Pradesh 56127 31402 312221 0.56 10.06 17.98
Gujarat 34673 21334 292640 0.62 7.29 11.85
West Bengal 31360 13485 309528 0.43 4.36 10.13
Tamil Nadu 46577 29248 297864 0.63 9.82 15.64
Average 0.48 7.63 17.04
Table 7.29 gives the buoyancy ratios in respect of the state government's major tax and non tax
revenues as well as of revenue expenditure. From Table 7.29, it can be noted that, in 2007-08,
sales tax, stamp and registration fees, taxes on goods and passengers, taxes on vehicles and state
excise were far buoyant than the total tax revenues of the state government. Thus, the prospects of
increasing yield from these taxes, given a growth rate of nearly 6 percent in the GSDP is high. The
major sources of non-tax revenues did not exhibit such buoyancy.

276
Table 7.29 : Buoyancy of Important Tax and Non-Tax Revenue Sources
Major Sources of Tax and Non-Tax Revenues
2004-05 2005-06 2006-07 2007-08 2008-09
Taxes on Sales, Trade etc. 1.47 -0.88 0.86 3.48 2.30
Stamp and Registration Fees 0.26 1.87 -0.42 6.99 -1.62
Taxes on Goods and Passengers 5.19 3.14 1.18 3.16 -1.74
State Excise 1.29 1.79 0.85 6.00 0.34
Taxes on Vehicles 0.15 4.45 -1.71 8.09 -0.88
Taxes and Duties on Electricity -4.36 9.43 10.57 0.31 -7.62
Non-Ferrous Mining and Metallurgical Industries
0.88 2.74 1.13 6.39 -3.13
Interest Receipts 21.41 19.84 -0.79 -0.48 -9.59
Revenue Expenditure 1.44 2.25 0.68 2.31 3.30
Total Tax Revenue 1.43 1.25 3.55 2.74 2.49
Table 7.30 shows grants and contributions from the central government. It is seen from the table
that the total grants now stand at nearly Rs. 9000 crore in the budget estimates of 2008-09. Out of
this, about 50 percent are grants for state plan schemes, followed by centrally sponsored schemes
and non-plan grants. The total grants have increased five times between 2003-04 and 2008-09.
Grants for the centrally sponsored schemes increased by more than Rs 800 crore during 2008-09,
while the grants for state plan schemes increased by more than double during the same year.
Table 7.30 : Grants and Contributions from the Central Government
(Rs. crore)
2003-04 2004-05 2005-06 2006-07 2007-08 2008-09
Total Grants 1618 2832 3333 5247 5832 8776
Grants for State Plan Schemes 1169 1643 1556 2445 2914 4565
Grants for Central Plan Schemes 46 10 90 144 53 198
Grants for Centrally Sponsored Schemes 251 495 486 974 1360 2223
Non-plan Grants 152 684 1201 1683 1505 1790

277
Table 7.30 A : Comparative Commoditywise Collection of Sales Tax
No. of dealers Collection (Rs. crore) % growth Sl. No.
Commodity 2005-06 2006-07 2007-08 2005-06 2006-07 2007-08 2006-07 2007-08
1 2 and 3 Wheelers (Automobiles)
397 354 344 102.59 166.55 199.9 62.35 20.02
2 All Kinds of Furniture 380 360 379 0.95 1.05 6.23 10.04 494.19
3 Auto Parts 1140 1050 992 12.2 17.58 19.77 44.11 12.43
4 Battery 224 221 228 22.96 24.42 29.91 6.35 22.47
5 Beverages 138 102 86 13.09 15.38 19.53 17.51 26.97
6 Biscuits 337 337 308 18.32 29.79 36.08 62.63 21.12
7 Bricks and Minerals 1474 1639 1718 3.76 6.4 6.13 70.36 -4.22
8 Cement 1455 1537 1541 122.48 174.25 209.64 42.27 20.31
9 Coal 65 81 80 1.66 2.06 4.99 23.75 142.71
10 Computer and Peripherals 311 295 288 5.02 7.24 11.24 44.41 55.2
11 Consumer Durables 381 377 408 57.17 87.13 160.38 52.41 84.07
12 Crockery Cutlery and Glassware
163 153 147 2.06 2.22 2.6 7.62 17.03
13 Crude Oil 13 14 11 109.84 131.56 154.31 19.77 17.29
14 Cycles 350 329 306 2.7 4.46 5.64 64.78 26.56
15 Diesel Engine 408 416 407 3.14 4.01 4.77 27.83 19.02
16 Electrical Goods 1320 1247 1270 77.03 164.69 175 113.81 6.26
17 Entertainment 120 122 102 3.87 4.07 4.13 5.15 1.49
18 Essentials 90 76 58 0.49 0.66 0.64 33.44 -2.69
19 FMCG 958 953 996 96.23 127.69 146.42 32.7 14.67
20 Fastfoods 317 265 227 13.67 14.85 19.75 8.58 33.03
21 Fertilizers 1670 1429 629 40.23 50.98 58.56 26.72 14.87
22 Firework 76 69 68 0.41 0.37 0.47 -8.92 27.24
23 Food grains 2045 2134 2462 55.99 30.46 36.07 -45.6 18.43
24 Footwear 597 549 535 4.72 4.47 5.72 -5.36 28.04
25 Foreign Liquor(IMFL) 531 314 194 87.19 126.75 147.77 45.38 16.58
26 Hardware 1291 1242 1227 3.92 3.54 4.36 -9.57 23
27 Hide and Skins 32 28 33 0.69 0.79 0.66 14.07 -16.12
28 Hotel 324 362 306 5.29 8.98 12.85 69.64 43.09
29 Insecticide and Seeds 309 256 175 18.7 9.51 10.92 -49.15 14.83
30 Iron and Steel 542 508 511 30.25 42.6 54.17 40.81 27.15
31 Jewelry 1181 1241 1240 0.89 1.29 1.58 45.22 22.14
32 Jute 139 78 45 3.12 2.14 2.27 -31.55 6.3
33 Kerosene Oil 259 270 269 2.74 3.15 3.37 14.77 7.02
34 Kirana and Agarbati 2027 2146 2225 6.06 7.14 9.22 17.8 29.07
35 LPG 298 281 282 7.3 3.22 2.87 -55.85 -10.98

278
36 Marble Mosaic and Stone 399 428 572 1.73 1.9 2.8 9.57 47.4
37 Medicine 10587 8311 5019 71.46 113.61 130.21 58.99 14.61
38 Miscellaneous 13946 12415 10920 191 174.9 259.09 -8.43 48.14
39 Moulded Luggage 80 70 64 2.22 2.72 3.29 22.63 20.83
40 Mustard Oil 218 216 228 4.51 6.55 8 45.25 22.05
41 PVC 157 169 171 1.74 2.03 2.72 16.46 33.85
42 Paints 231 213 201 13.18 13.77 16.95 4.48 23.06
43 Pan Masala 131 126 176 1.18 14.04 41.01 1089.81 192.01
44 Paper 425 406 430 5.62 5.72 9.19 1.83 60.59
45 Petro Products 928 610 516 986.37 1091.6 1247.14 10.67 14.25
46 Plastic Goods 282 266 280 3.47 4.45 3.75 28.21 -15.25
47 Plywood and Board 288 279 313 2.29 2.74 3.49 19.5 27.3
48 Readymade and Hosiery 2038 1948 1981 8.43 10.85 13.91 28.79 28.16
49 Sanitary goods and fittings 228 230 260 3.13 4.51 5.7 44.2 26.27
50 Tea and Coffee 183 177 170 2.24 1.84 2.23 -17.72 21.07
51 Timber 798 766 748 2.55 2.66 2.76 4.05 3.82
52 Tires and tubes 255 186 196 23.34 29.26 37.88 25.36 29.45
53 Tractor 308 312 328 7.37 17.46 19.81 136.74 13.48
54 Utensils 311 311 288 0.87 0.48 0.52 -44.15 7.26
55 Vanaspati 87 110 108 3.82 7.3 13.92 91.02 90.78
56 Works Contract 31 56 73.58 137.,13 244.15 86.37 78.04
Total 53242 48416 43127 2346.87 2927.01 3636.44 24.72 24.24
Collection from other resources
43.12 23.13 -3.17 -46.36 -113.71
Grand Total 2389.98 2950.14 3633.27 23.44 23.16
7.10 Performance Analysis of State Tax Departments
Commercial Taxes Department
The Commercial Taxes Department collects revenue under seven Acts, viz.
(i) Bihar Value Added Tax Act, 2005 (VAT)
(ii) Central Sales Tax Act, 1956 (CST)
(iii) Entry Tax Act, 1993 (ENT)
(iv) Bihar Electricity Duty Act, 1948 (ED)
(v) Bihar Advertisement Tax Act, 1981 (ADV)
(vi) Hotel Luxury Tax Act, 1988 (HLT) and
(vii) Bihar Entertainment Tax Act, 1948 (ET)

279
Tables 7.31 and 7.32 show the taxes collected under these Act from 2003-04 to 2008-09 (till
November 2008). As one can see from these tables, commercial taxes now account for more than
70 percent of the total tax revenues of the state government and their growth rates have been
impressive. With the yield from taxes from each of the above acts increasing significantly, the cost
of collection, already negligible, is further coming down.
Table 7.31 : Actwise Comparative Collection (2003-04 to 2008-09)
(Rs crore)
Year BST/VAT CST ENT. ED ADV HLT ET TOTAL
Non-plan
Expe-nditure
Cost of collection (%)
2003-04 1560.29 74.41 14.19 15.88 0.00 1.59 310.79 1977.15 20.06 1.01
2004-05 1814.79 71.56 14.09 9.45 0.00 1.79 481.56 2393.24 20.20 0.84
2005-06 1649.95 84.11 10.97 17.84 0.00 1.91 625.20 2389.98 24.52 1.03
2006-07 2003.72 80.15 9.32 62.48 0.00 2.50 791.97 2950.14 27.27 0.92
2007-08 2522.94 54.03 9.88 63.80 0.01 3.36 979.28 3633.30 28.53 0.79
2008-09 (up to
Nov.08)
1626.79 25.22 6.37 2.05 0.07 1.17 683.93 2346.20 NA NA
Table 7.32 : Yearwise Percentage Share of Commercial Taxes in Total Revenue (Rs crore)
2003-04 2004-05 2005-06 2006-07 2007-08 2008-09
(Upto Nov.)
Total Revenue of State 2919.02 3342.48 3561.09 4032.24 5086.17
Revenue from Commercial Taxes 1977.15 2393.24 2390.4 2950.14 3633.30 2346.20
Percentage Share of Comm. Taxes in total revenue
67.73 71.60 67.13 73.16 71.43
At present scheme for reimbursement of a certain portion of the VAT payable by industrial units is
being implemented through budgetary support as per Industrial Incentive Policy, 2006. The
Commercial-Taxes Department has given reimbursement till date to the tune of Rs.2 crore to
existing Industrial units and new Industrial units. During the current fiscal, the Department has
also undertaken several initiatives to check tax evasion. One of these has been the introduction of
compulsory registration provision for transporters. Filling of quarterly return by them has now

280
been made mandatory. For this, necessary amendment has been made in the Bihar VAT Act and
Bihar VAT Rules.
In view of the unprecedented Kosi floods in some districts of Bihar, the Department made
provisions for extension of Return Filing and Tax Payment date for the dealers of the flood
affected districts. Exemption from Entry Tax, VAT and surcharge have been given to flood relief
items such as rice and wheat given by the government of India.
Under Bihar Value Added Tax Act, 2005, provision of VAT Audit has been made whereby upto
ten percent of the total registered dealers can be selected for detailed audit for a financial year on
the basis of a selection model. For the financial year 2005-06, 2519 dealers have been selected
and so far audit of 763 dealers has been done. For the financial year 2006-07, 2546 dealers have
been selected for detailed audit.
Once functional, the application will have on-line connectivity with the Tax Information Exchange
System (TINXSYS) to facilitate quick and faster information exchange between different states.
Excise and Prohibition Department
The Department of Excise and Prohibition is one of the oldest departments of the state government
and is one of the main sources of its revenue generation. This department has the responsibility to
control the sale and distribution of spirit, alcoholic beverage and molasses within the state, as well
as to collect revenues from these sources. A new excise policy was introduced from July 1, 2007,
under which the settlement of all types of retail excise shops through lottery was started for the
first time in the state. After amendment in Section 42 and 68 of Bihar Excise Act, 1915, the
amount of penalty was enhanced for violation of different provisions and conditions of the
licenses.
Earlier, there were 10 districts in the state where there were no Excise Offices. In, 2007-08, the
Excise Offices were established in these 10 districts and they are now fully functional. Further,
construction is going on in Patna to establish a modern Multipurpose Excise Complex.
Simultaneously, fresh recruitment of Excise Inspectors, promotion of officers and employees,
purchase of new vehicles and other measures were taken to strengthen the Excise Intelligence
Bureau. To enhance revenue resources, the Excise and Prohibition Department has taken several

281
new initiatives. Table 7.33 shows the revenue from different sources of excise for two years 2006-
07 and 2007-08. Country liquor and IMFL (Indian Made Foreign Liquor) are the two most
important sources of revenue under this head.
Table 7.33 : Revenue from Excise
(Rs crore)
Sources of Revenue 2006-07 2007-08
Country Liquor (Including Spice Country Liquor)
206.50 170.02
Indian Made Foreign Liquor (IMFL) 159.26 198.65
Commercial Denatured spirit 0.15 2.97
Medicinal and Toilet Preparation 0.56 0.05
Molasses 4.29 4.36
Compounding 1.93 6.47
Composite Shop 105.8
Bihar State Beverages Corporation 10.00 36.69
Others 1.18 10.55
Total 383.87 535.56
The Department of Commercial Taxes has also undertaken an ambitious programme of
computerization and has already started online work in 36 of its 49 Circles. By end of this
financial year, all the circles would have online working arrangements, making a significant
improvement in the quality of following e-services for tax payers — (i) Online filling of Returns,
(ii) Online Payment of Commercial-Taxes and (iii) On line application for registration.
Department of Registration
The Department of Registration is again one of the oldest departments of the state government. In
terms of revenue collection, it is only second to the Commercial Taxes Department. After transfer
of administration of stamps and registration duty to the Department from the Board of Revenue,
there has been continuous efforts by the department for increasing its resources. Inclusion of the
concept of Market Value in the Stamp Act by an amendment in 1990, followed by framing and
implementing of Bihar Stamp (Prevention of Undervaluation of Instruments) Rules in 1995, has
proved an effective method for enhancement of revenue from stamp duty. In 2006, these were
further amended and provision of yearly revision for urban property was made in the rules. In the

282
same year, efforts were made to reduce the rate of stamp duty for instruments of conveyances
from 8.4 percent to 6 percent. This has resulted in increased revenue collection.
After the Bihar Apartment Ownership Act, 2006 came into force, the Registration Department had
taken several initiatives to motivate the people for registration of their flats. As a result, 11349
flats were registered in Patna which added Rs 95.04 crore to the state exchequer. A liberal rate of
stamp duty of 0.5 percent on lease of houses/buildings payable during the whole lease period has
been fixed recently to promote registration of rent agreement of houses/flats. Apart from various
other measures to enhance the revenue resources, a record number of promotions were also given
to the officers and employees of the Registration Department during last year to boost their
morale. Table 7.34 shows the revenue from stamp and registration during the three years from
2006-07 to 2008-09 (till November, 2008).
Table 7.34 : Revenue from Stamp Duty and Registration Fees
(Rs crore)
Source of Revenue 2006-07
2007-08
2008-09Till
Nov,08
Stamp Duty
(i) From Printed Non-judicial stamps 184.79 176.66 111.34
(ii) From Non-judicial stamp duty deposited through Bank challan
195.83 308.72 223.22
(iii) Non-judicial adhesive stamps 11.23 10.67
(iv) Non-judicial special adhesive stamp – through Franking machines
0.19 0.58
(v) Revenue Stamps 0 2.05
14.04
(vi) Judicial Stamps 18.79 22.24 13.00
Sub-Total 410.83 520.92 334.56
Registration Fee and Other Fees
(i) Fees on registration of instruments 112.04 150.01 101.86
(ii) Landlord’s Registration fee 9.5 12.94 8.77
(iii) Landlord’s Process fee 5.38 7.23 4.95
(iv) Fee from searches of records & Non-Encumbrances 1.23 1.64 1.24
(v) Fee from certified copies 1.58 2.07 1.47
Sub-Total 129.73 173.89 118.29
Total 540.56 694.81 479.89

283
Table 7.35 shows the districtwise revenue from Stamp and Registration Fees in 2006-07. It is seen
that Patna district alone contributes 15 percent of the total revenue from this source, more than
three times that of any other district in Bihar.
Table 7.35 : Districtwise Revenue from Stamp Duty and Registration Fees
(Rs crore)
Name of Distrioct Registration
Fees Stamp Duty
Total Received
Patna 17.85 62.02 79.86
Muzaffarpur 6.57 17.87 24.44
Vaishali 5.53 15.12 20.64
Samastipur 5.37 14.78 20.16
Begusarai 5.15 14.98 20.13
Siwan 5.18 13.66 18.84
East champaran 5.14 13.54 18.68
Darbhanga 4.67 13.56 18.23
Madhubani 4.57 12.24 16.81
Sitamarhi 4.14 12.29 16.43
Rohtas 4.12 12.06 16.17
Gopalganj 3.96 11.61 15.57
Bhagalpur 3.84 11.68 15.52
Gaya 3.83 11.2 15.03
Saran 4.18 10.85 15.03
Bhojpur 5.24 9.15 14.39
Purnea 3.80 10.29 14.09
West champaran 3.51 9.72 13.23
Katihar 3.35 9.83 13.18
Nalanda 3.17 9.18 12.35
Aurangabad 2.77 8.34 11.11
Buxar 3.14 7.42 10.56
Madhupura 2.13 6.02 8.15
Supaul 1.99 5.88 7.87
Saharsa 1.82 5.79 7.61
Araria 2.04 5.05 7.09
Khagaria 1.84 5.09 6.93
Banka 1.94 4.9 6.84
Kaimur 1.79 4.68 6.46
Kishanganj 1.72 4.59 6.31
Jamui 1.54 4.72 6.26
Nawada 1.52 4.03 5.55
Jahanabad 1.16 3.81 4.96
Lakhisarai 1.21 3.57 4.78
Munger 1.28 3.48 4.76
Sheikhpura 0.69 2.08 2.76
Sheohar 0.72 1.98 2.70
Arwal 0.63 1.58 2.22
Total 133.11 378.59 511.70

284
7.11 Expenditure Management
As mentioned earlier, the revenue and capital expenditures are the two components of the state
government’s total expenditure. The expenditures of the state governments are classified under
three major categories — General Services, Social Services and Economic Services. Apart from
these, other areas of spending are capital outlay and repayment of loans and advances on the
capital account and grants to local bodies, autonomous institutions, commercial undertakings of
the state government and government companies. It is to be noted that while the repayment of
principal amounts of loans are made from the capital account, interest payment is made from the
revenue expenditure, under the General Services. Table 7.36 presents the expenditure from
Consolidated Fund of the state government and Table 7.37 shows the structure of expenditure in
percentage terms. In addition, Table 7.38 depicts the growth of expenditure under different heads.
These three tables together give us an insight into the state government's expenditure patterns.
Table 7.36 : Expenditure from Consolidated Fund (Rs crore)
2003-04 2004-05 2005-06 2006-07 2007-08 2008-09
General Services 7175 7803 8523 8643 9252 10901
Social Services 4033 4795 6862 7917 9868 12689
Economic Services 1498 2036 2367 4021 4438 5343
Grants in Aid 4 4 4 4 5 4
Capital, Public Debt, Loans 9771 5420 4812 6551 8008 9636
Capital Outlay 1549 1205 2083 5211 6104 7635
Total Consolidated Fund 22482 20058 22568 27136 31571 38574
Expenditure from Consolidated Fund 2008-09
28%
33%
14%
0%
25%General Services
Social Services
Economic Services
Grants in Aid
Capital, Public Debt, Loans

285
The structure of expenditure of the state government, as shown in Table 7.37 indicates that there
has been a change in the structure of expenditure of the state government since 2007-08. Prior to
2007-08, the expenditure on General Services, mostly incurred on running the day-to-day
administration of the state government, used to account for the bulk of expenditure from the
Consolidated Fund, followed by Social Services and Economic Services. Since 2007-08, General
Services no longer holds that predominant position. Now Social Services account for the bulk of
the expenditure which reflects the state government’s changed priority, in view of the importance
accorded to education, health and social development. Capital expenditure that has the potential of
generating income and employment has also been accorded high priority and accounts for a
quarter of the total expenditure of the state government.
Table 7.37 : Structure of Expenditure from the Consolidated Fund
Percentage of expenditure
2003-04 2004-05 2005-06 2006-07 2007-08 2008-09
General Services 31.92 38.9 37.76 31.85 29.31 28.26
Social Services 17.94 23.91 30.4 29.18 31.26 32.90
Economic Services 6.66 10.15 10.49 14.82 14.06 13.85
Grants in Aid 0.02 0.02 0.02 0.01 0.02 0.01
Capital, Public Debt, Loans 43.46 27.02 21.32 24.14 25.37 24.98
Total Consolidated Fund 100.00 100.00 100.00 100.00 100.00 100.00
0
2000
4000
6000
8000
10000
12000
14000
2003-04 2004-05 2005-06 2006-07 2007-08 2008-09
Expenditure from Consolidated Fund (Rs Cr)
General Services Social Services Economic Services

286
Table 7.38 : Growth of Expenditure from Consolidated Fund
Growth rates of expenditure (Percentage)
2003-04 2004-05 2005-06 2006-07 2007-08 2008-09 Overall 2003-09
General Services 9.15 8.75 9.22 1.41 7.05 17.83 51.94
Social Services 3.01 18.88 43.11 15.37 24.64 28.59 214.64
Economic Services -15.04 35.88 16.28 69.88 10.37 20.40 256.68
Grants in Aid 106.59 13.56 -1.64 0.00 25.00 -20.00 0.00
Capital, Public Debt, Loans 200.61 -44.53 -11.2 36.14 22.25 20.33 -1.38
Total Consolidated Fund 44.99 -10.78 12.52 20.24 16.34 22.18 392.92
Among the General Services, there are certain items on which there is very little room for
manoeuvre. These are mostly items of charged expenditure, like pension, interest payment etc, and
the expenditure on those heads has been rising steadily. The expenditure on administrative
services has also been growing steadily since 2003-04, mainly due to increased expenditure on
police and district administration, judiciary, legislature, tax departments and public works.
However, as can be seen from Table 7.38, the growth in expenditure on social and economic
services during the last 6 years has been far more impressive than the growth in expenditure on
general services and the nearly fourfold growth of total expenditure from the Consolidated Fund of
the state government has been mainly on this account. Among the social services, the revenue
expenditure on education, health and family welfare, water supply and sanitation, and social
welfare and nutrition have shown steady increases over the years. Capital outlay which was
Expenduture from Consolidated Fund (Rs Cr)
0
5000
10000
15000
20000
25000
30000
35000
40000
45000
2003-04 2004-05 2005-06 2006-07 2007-08 2008-09
Capital Outlay
Total Consolidated Fund

287
stagnating prior to 2005-06, has now been accorded the priority that it deserves; from the level of
Rs 1500 crore in 2003-04, it has been raised to Rs 7600 crore in 2008-09. Further, the much
needed infrastructure sector, so vital for any economic development of the state and so badly
neglected in the past, is now being given its due importance. Within a few years, one would expect
the positive outcomes of the capital expenditures.
Among the Economic Services, agriculture and allied sectors, rural development, power, roads and
bridges, and industry have registered significant increases over the years. The revenue expenditure
on power was increased substantially in 2006-07, from a pitiable amount of less than Rs 1 crore to
more than Rs 1000 crore and now remains above Rs 700 crore. However, the expenditure on flood
control has been stagnating at almost the same level, increasing marginally from Rs 48 crore in
2003-04 to only Rs 81 crore in the 2008-09. This needs to be accorded much higher priority,
especially in view of the devastating floods of 2008. Another area where the state government
was deficient is the repair and maintenance of building, roads and bridges, and irrigation facilities.
To maintain these assets, suitable amounts are required for their repair and maintenance. But the
expenditure in this area has been almost negligible, as shown in Table 7.39.
Table 7.39 : Expenditure on Repair and Maintenance of Buildings, Roads and Bridges and Irrigation Facilities
(Rs. crore)
Year Building Roads & Bridges
Irrigation
2003-04 50.35 0.00 0.00
2004-05 2.02 23.64 13.21
2005-06 10.12 0.00 0.00
2006-07 100.85 13.00 14.14
2007-08 7.64 0.00 8.23
7.12 Revenue Expenditure
Table 7.40 depicts the details of revenue expenditure of the state government during the period
from 2003-04 to 2008-09. It will be readily seen that, with a 75 percent share, revenue expenditure
constitutes the bulk of total expenditure. Revenue expenditure is incurred to maintain the present
level of activities and payments and cannot thus make any addition to the existing infrastructure or
services. Among the components of revenue expenditure, non-plan component again consumes the
bulk of expenditure (54 percent); however, the growth of plan revenue expenditure has been

288
higher than the growth of non-plan revenue expenditure. The total expenditure and the revenue
expenditure respectively are at 34 percent and 19 percent of the GSDP of Bihar. From the
buoyancy ratios, it is seen that revenue expenditure is increasing much faster than GSDP, but not
faster than revenue receipts.
Table 7.40 : Revenue Expenditure
2003-04 2004-05 2005-06 2006-07 2007-08 2008-09
Revenue Expenditure (RE) (Rs. cr.) 12711 14638 17756 20585 23563 28938
Capital Expenditure (CE) (Rs. cr.) 9771 5420 4812 6551 8008 9636
Total Expenditure (TE) (Rs. cr.) 22482 20058 22568 27136 31571 38574
Non Plan Expenditure (Rs. cr.) 17280 16581 17670 17740 18872 20827
Revenue A/c (NPRE) (Rs. cr.) 11627 12642 15020 16520 18759 20718
Capital A/c (Rs. cr.) 5653 3939 2650 1220 113 109
Plan Expenditure (Rs. cr.) 5202 3476 4899 9397 10794 15745
Revenue A/c (PRE) (Rs. cr.) 1084 1996 2736 4065 4804 8219
Capital A/c (Rs. cr.) 4118 1480 2163 5332 5990 7526
Rate of growth of NPRE (%) 6.66 8.73 18.81 9.99 6.38 10.36
Rate of growth of PRE (%) -19.94 84.13 37.07 48.57 14.87 45.87
RE/TE(%) 56.54 72.98 78.68 75.86 74.63 75.02
NPRE/TE (%) 51.72 63.03 66.55 60.88 59.78 53.99
TE/GSDP(%) 33.57 27.18 28.32 31.66 30.03 34.31
NPRE/GSDP(%) 17.36 17.13 18.85 19.28 17.95 18.53
Revenue Receipt (RR) / TE (%) 55.4 78.34 79.04 85.06 89.35 108.44
NPRE/RR (%) 93.35 80.45 84.20 71.57 66.50 61.75
Buoyancy of RE w.r.t. GSDP (%) 0.33 1.44 2.25 0.68 2.31 3.30
Buoyancy of RE w.r.t. RR (%) 1.03 0.58 1.58 0.54 0.65 1.20
7.13 Expenditure on Salary and Pension
Salary and pension constitute the two most important items of expenditure for all governments.
The trends in expenditure on salaries, both under plan and non-plan heads, as well as expenditure
on pension are presented in Table 7.41. The salary of the state government employees alone
accounted for more than one quarter of the state government's revenue expenditure at 28 percent;
during the last 6 years, however, this proportion has come down from 39 percent of revenue
expenditure that existed in 2003-04. This is not because of any decrease in salary account, but due
to significant increases in revenue expenditure. The salary expenses, as per cent of GSDP was
almost constant at 7 per cent during the entire 6 year period from 2003-04 to 2008-09. The salary

289
expenditure under non-plan head has increased from Rs. 4,468 crore to Rs. 7379 crore during the
same period whereas, under the plan head, it has increased from Rs. 552 crore to Rs. 588 crore.
The increase in salary expenditure during the period was mainly due to enhancements in
allowances of the state government employees.
Table 7.41 : Expenditure on Salaries and Pensions
Heads 2003-04 2004-05 2005-06 2006-07 2007-08 2008-09
Expenditure on salaries of which (Rs. cr.) 5020 5005 5783 6016 6469 7967
Non-Plan Head (Rs. cr.) 4468 4564 5153 5539 5915 7379
Plan Head (Rs. cr.) 552 441 631 478 555 588
Salary as a percentage of GSDP 7 7 7 7 6 7
Salary as a percentage of RR 40 32 32 26 23 24
Salary as a percentage of RE 39 34 33 29 27 28
Expenditure on Pensions (Rs. cr.) 2269 2325 2456 2497 2789 3438
Rate of Growth (%) 11 2 6 2 12 23
Pension as per cent of GSDP 3 3 3 3 3 3
Pension as per cent of RR 18 15 14 11 10 10
Pension as per cent of RE 18 16 14 12 12 12
Total expenditure on Salary & Pension (Rs. cr.) 7289 7330 8239 8513 9258 11405
Total as per cent of GSDP 10 10 10 10 9 10
Total as per cent of RR 59 47 46 37 33 34
Total as per cent of RE 57 50 46 41 39 40
Salary and Pension Expenditure of State Government (Rs Cr)
0
2000
4000
6000
8000
10000
12000
2003-04 2004-05 2005-06 2006-07 2007-08 2008-09
Expenditure onsalaries
Expenditure onPensions
Totalexpenditure onSalary andPension

290
As regards pension payments, it increased from Rs. 2,269 crore in 2003-04 to Rs. 3,438 crore in
2008-09. Both salary and pension expenditure grew at a higher rate after Marh 2007, as compared
to the earlier period, due to the two years’ moratorium on retirement coming to an end in March
2007. The state government has now implemented the new contributory pension scheme on the
pattern of the central government scheme to reduce the long term liabilities on pension account
which is applicable to the employees joining on or after September 1, 2005. The pension and
salary payments together constitute 10 percent of GSDP of the state and 40 percent of the state
government's revenue expenditure.
7.14 Quality of Expenditure
The quality of expenditure can be judged by the proportion of expenditure devoted to creation of
income generating capital assets, quantum of developmental expenditure on social and economic
services as opposed to non-developmental expenditure on general services, and plan expenditure
as opposed to non-plan expenditure. Thus, as parameters of quality in expenditure, the following
ratios have been considered : (1) ratio of capital outlay to total expenditure; (2) the ratio of capital
outlay to GSDP; (3) the proportion of revenue expenditure on social and economic services and
(4) ratio of plan and non-plan expenditure. The higher the ratio of these components to total
expenditure and GSDP, the better would be the quality of expenditure. Table 7.42 shows these
ratios during the 5 year period 2003-08. Going by all the parameters, it is clear that the quality of
expenditure in Bihar has undergone significant improvement over these 5 years. For example,
capital outlay has increased from a meager 7 percent to nearly a fifth of total expenditure, while
revenue expenditure has practically remained the same at 75 percent of total expenditure. The
remaining components of expenditure is accounted for by discharge of public debt and loans and
advances made by the state government. The salary component of developmental revenue
expenditure has declined from 54 percent to only 23 percent during this period, whereas the non-
Salary and Pension as % of Rev Exp
0
10
20
30
40
50
60
70
2003-04 2004-05 2005-06 2006-07 2007-08 2008-09
Salary as apercentage ofRE
Pension aspercentage ofRE
Total aspercentage ofRE
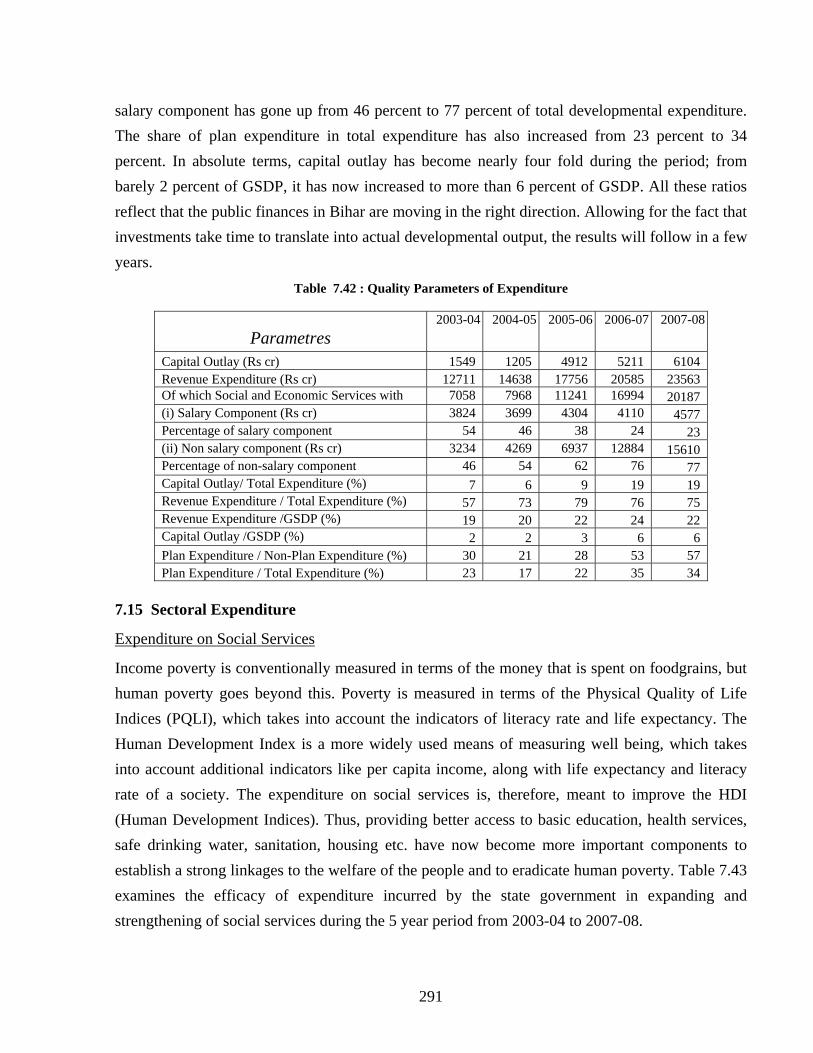
291
salary component has gone up from 46 percent to 77 percent of total developmental expenditure.
The share of plan expenditure in total expenditure has also increased from 23 percent to 34
percent. In absolute terms, capital outlay has become nearly four fold during the period; from
barely 2 percent of GSDP, it has now increased to more than 6 percent of GSDP. All these ratios
reflect that the public finances in Bihar are moving in the right direction. Allowing for the fact that
investments take time to translate into actual developmental output, the results will follow in a few
years.
Table 7.42 : Quality Parameters of Expenditure
Parametres 2003-04 2004-05 2005-06 2006-07 2007-08
Capital Outlay (Rs cr) 1549 1205 4912 5211 6104 Revenue Expenditure (Rs cr) 12711 14638 17756 20585 23563 Of which Social and Economic Services with 7058 7968 11241 16994 20187 (i) Salary Component (Rs cr) 3824 3699 4304 4110 4577 Percentage of salary component 54 46 38 24 23 (ii) Non salary component (Rs cr) 3234 4269 6937 12884 15610 Percentage of non-salary component 46 54 62 76 77 Capital Outlay/ Total Expenditure (%) 7 6 9 19 19 Revenue Expenditure / Total Expenditure (%) 57 73 79 76 75 Revenue Expenditure /GSDP (%) 19 20 22 24 22 Capital Outlay /GSDP (%) 2 2 3 6 6 Plan Expenditure / Non-Plan Expenditure (%) 30 21 28 53 57 Plan Expenditure / Total Expenditure (%) 23 17 22 35 34
7.15 Sectoral Expenditure
Expenditure on Social Services
Income poverty is conventionally measured in terms of the money that is spent on foodgrains, but
human poverty goes beyond this. Poverty is measured in terms of the Physical Quality of Life
Indices (PQLI), which takes into account the indicators of literacy rate and life expectancy. The
Human Development Index is a more widely used means of measuring well being, which takes
into account additional indicators like per capita income, along with life expectancy and literacy
rate of a society. The expenditure on social services is, therefore, meant to improve the HDI
(Human Development Indices). Thus, providing better access to basic education, health services,
safe drinking water, sanitation, housing etc. have now become more important components to
establish a strong linkages to the welfare of the people and to eradicate human poverty. Table 7.43
examines the efficacy of expenditure incurred by the state government in expanding and
strengthening of social services during the 5 year period from 2003-04 to 2007-08.

292
Table 7.43 : Expenditure on Social Services
2003-04 2004-05 2005-06 2006-07 2007-08
Education, Sports, Arts & Culture
Total Expenditure (Rs crore) 2876 3160 4423 5359 5553
Revenue Expenditure (Rs crore) 2822 3142 4394 5253 5496
(a) Salary component (%) 75 68 53 45 45
(b) Non-salary component (%) 25 32 47 55 55
Capital Expenditure (Rs crore) 54 18 29 106 57
Capital Expenditure (%) 2 1 1 2 1
Health and Family Welfare
Total Expenditure (Rs crore) 539 629 1015 1153 1387
Revenue Expenditure (Rs Crore) 534 607 877 985 1141
(a) Salary component (%) 89 76 71 60 53
(b) Non-salary component (%) 11 24 29 40 47
Capital Expenditure 5 22 138 168 245
Capital Expenditure (%) 1 3 14 15 18
Water Supply, Sanitation, Housing and Urban Development
Total Expenditure (Rs crore) 276 321 532 766 1052
Revenue Expenditure (Rs crore) 200 251 407 514 713
(a) Salary component (%) 36 29 20 18 16
(b) Non-salary component (%) 64 71 80 82 84
Capital Expenditure (Rs. cr) 76 70 124 253 339
Capital Expenditure (%) 28 22 23 33 32
Other Social Services
Total Expenditure (Rs crore) 506 822 1221 1235 2674
Revenue Expenditure (Rs crore) 477 794 1184 1166 2517
(a) Salary component (%) 40 27 28 14 8
(b) Non-salary component (%) 60 73 72 86 92
Capital Expenditure (Rs. cr) 29 28 37 69 157
Capital Expenditure (%) 6 3 3 6 6
Total Expenditure on Social Services
Total Expenditure (Rs crore) 4197 4932 7190 8513 10666
Revenue Expenditure (Rs crore) 4033 4795 6862 7917 9867
(a) Salary component (%) 71 60 49 40 35
(b) Non-salary component (%) 29 40 51 60 65
Capital Expenditure (Rs. cr) 163 137 328 596 799
Capital Expenditure (%) 4 3 5 7 7
The increase in the overall allocation to social sector from Rs. 4,197 crore in 2003-04 to Rs.
10,866 crore in 2007-08 reflects the state government’s commitment to improve the standards of
social services in the state. In 2007-08, the total expenditure on social services was more than one
third of the total expenditure and 48 percent of the total development expenditure. Overall, the
non-salary component of revenue expenditure worked out to 65 percent in the social services,

293
though in Health and Family Welfare, it stood at 47 percent and in respect of Education, Sports,
Art and Culture, it was 55 percent. Though overall capital expenditure increased from 4 percent to
7 percent of total expenditure during the five year period 2003-08, it was only 1 percent in
Education, Sports, Arts and Culture. In Water supply, Sanitation, Housing and Urban
Development, capital expenditure amounted to as much as 32 percent of the total expenditure, and
the non-salary component was also high at 84 percent of revenue expenditure. The task before the
state government is now to increase capital expenditure in Education.
For improving the quality of education and health services, the Twelfth Finance Commission had
recommended that the non-plan salary expenditure under education and health and family welfare
should increase only by 5-6 per cent while the non-salary expenditure under non-plan heads
should increase by at least 30 per cent per annum. The achievement against these targets is shown
in Table 7.44 and it is seen that nearly all targets have been achieved by the state government.
Table 7.44 : Achievements against TFC Projections in respect of Non-Plan Revenue Expenditure
(Rs. crore)
2005-06 2006-07 2007-08 Education TFC 3820.62 4183.58 4581.02 Actual 3777.07 4189.48 4741.76 Health TFC 790.12 880.98 982.29 Actual 758.34 849.87 1011.52 Building TFC 120.97 216.91 223.26 Actual 111.12 180.36 202.76 Road & Bridges TFC 258.90 349.18 362.78 Actual 281.86 410.85 403.14
Expenditure on Economic Services
Table 7.45 shows the analysis of expenditure on Economic Services. The expenditure on
economic services is meant to create productive capacity in the economy. The expenditure on
Economic Services in 2007-08 accounted for 14 per cent of the total expenditure and more than
one third of the total developmental expenditure incurred by the state government. Agriculture and
Allied Activities, Irrigation and Flood Control, Energy and Transport accounted for more than 60
per cent of the expenditure on Economic Services. More than half of the total expenditure on
economic services was on capital account, especially in transport (85 percent) and Irrigation and
Flood control (61 percent). Also as much as 78 percent of the total revenue expenditure was
incurred on non-salary components.

294
Table 7.45 : Expenditure on Economic Services
2003-04 2004-05 2005-06 2006-07 2007-08
Agriculture and Allied Activities
Total Expenditure (Rs crore) 254 407 504 596 759
Revenue Expenditure (Rs crore) 249 397 410 585 737
(a) Salary component (%) 70 44 47 39 31
(b) Non-salary component (%) 30 56 53 61 69
Capital Expenditure (%) 6 10 93 11 22
Irrigation and Flood Control
Total Expenditure (Rs crore) 840 916 1074 1067 1450
Revenue Expenditure (Rs crore) 319 473 483 435 562
(a) Salary component (%) 78 51 55 68 63
(b) Non-salary component (%) 22 49 45 32 37
Capital Expenditure (Rs. cr) 521 443 591 632 888
Capital Expenditure (%) 62.02 48.36 55.03 59.23 61.24
Energy and Power
Total Expenditure (Rs crore) 302 28 303 1514 841
Revenue Expenditure (Rs crore) 1 2 1 1081 726
(a) Salary component (%) 0 0 0 0 0
(b) Non-salary component (%) 100 100 100 100 100
Capital Expenditure (Rs. cr) 300 27 302 434 115
Capital Expenditure (%) 99.34 96.43 99.67 28.67 13.67
Transport
Total Expenditure (Rs crore) 266 369 560 2076 2707
Revenue Expenditure (Rs crore) 205 225 285 414 407
(a) Salary component (%) 42 37 38 25 29
(b) Non-salary component (%) 58 63 62 75 71
Capital Expenditure (Rs. cr) 62 144 275 1662 2300
Capital Expenditure (%) 23.31 39.02 49.11 80.06 84.96
Other Economic Services
Total Expenditure (Rs crore) 1199 1316 1609 3227 3763
Revenue Expenditure (Rs crore) 1199 1316 1609 3227 2005
(a) Salary component (%) 39 21 21 19 14
(b) Non-salary component (%) 61 79 79 81 86
Capital Expenditure (Rs. cr) 475 376 422 1722 1758
Capital Expenditure (%)
Total (Economic Services)
Total Expenditure (Rs crore) 2862 3035 4051 8481 9520
Revenue Expenditure (Rs crore) 1498 2036 2367 4021 4438
(a) Salary component (%) 53 34 34 23 22
(b) Non-salary component (%) 47 66 66 77 78
Capital Expenditure (Rs. cr) 48 33 42 53 5082
Capital Expenditure (%) 1.68 1.09 1.04 0.62 53.38

295
7.16 Per Capita Expenditure on Social and Economic Services
Table 7.46 shows the per capita expenditure on social and economic services, computed on the
basis of estimated population of Bihar for the years 2003-04 to 2008-09. The per capita capital
outlay has continuously been rising since 2005-06 and now stands at Rs 770 compared to the per
capita expenditure on social services at Rs 1374 and that on economic services at Rs 1193.
However, the low level of per capita expenditure on medical and public health as well as drinking
water supply and sanitation are matters of concern. The per capita expenditure on general
education (i.e., primary, secondary and higher education) increased from 2004-05 and stood at Rs
726 at the end of 2008-09, compared to only Rs 143 for medical and public health and only Rs 97
for water supply and sanitation. These areas are the state government’s priorities now. One should,
however, note that the figures for per capita expenditure on each of these sectors conceal the larger
inter-district disparity in government expenditure on different services which will be analysed
later.
Table 7.46 : Per Capita Expenditure on Social and Economic Services
2003-04 2004-05 2005-06 2006-07 2007-08 2008-09
Population (crore) 8.68 8.88 9.29 9.5 9.72 9.92
Total Expenditure (Rs crore)
General education 2778 3092 4337 5204 5493 7206
Medical and Public Health 388 504 760 848 1242 1415
Water Supply and Sanitation 125 142 292 230 622 966
Social Services 4197 4932 7541 8513 10667 13626
Economic Services 2862 3035 6369 8481 9520 11834
Capital Outlay 1549 1205 2084 5211 6104 7635
General Services 7198 7871 8753 8798 9474 11109
Per Capita Expenditure (Rs)
General education 320 348 467 548 565 726
Medical and Public Health 45 57 82 89 128 143
Water Supply and Sanitation 14 16 31 24 64 97
Social Services 484 555 812 896 1097 1374
Economic Services 330 342 686 893 979 1193
Capital Outlay 178 136 224 549 628 770
General Services 829 886 942 926 975 1120

296
Per Capita Expenditure on Social and Economic Services and per capita capital outlay (Rs)
0
200
400
600
800
1000
1200
1400
1600
2003-04 2004-05 2005-06 2006-07 2007-08 2008-09
Social Services
Economic Services
Capital Outlay
Per capita expenditure on Education, Health and Water supply and sanitation (Rs)
0
100
200
300
400
500
600
700
800
2003-04 2004-05 2005-06 2006-07 2007-08 2008-09
General education
Medical and PublicHealthWater Supply andSanitation

297
7.17 State Budget for 2008-09
The budget for 2008-09 has attempted to add further momentum to the development and reform
process that was embarked upon by the state government since 2005-06. In this section, budget for
2008-09 has been analysed.
From the summary of the budget for 2008-09, presented in Table 7.47, one can see that there is a
deficit of only Rs. 501 crore in the Consolidated Fund, in place of an actual deficit of Rs. 1723
crore in the previous year. However, there was an actual surplus of Rs. 445 crore in the Public
Account in 2007-08, the net effect being an increase in the cash balance of the state government
by Rs 1372 crore. In the budget estimates of 2008-09, however, the deficit of Rs. 501 crore in the
Consolidated Fund is partially offset by an a surplus of Rs 445 crore in the Public Account,
resulting ultimately in decreasing the cash balance of the state government by Rs 56 crore. The
revenue surplus in 2008-09 budget is projected to decrease marginally, from Rs. 4647 crore in
2007-08 to Rs. 4613 crore in 2008-09. In the capital account, the deficit is projected to decrease
from Rs. 6370 crore in 2007-08 to Rs. 5114 crore in 2008-09 budget.
The structures of receipts and expenditure are presented in Table 7.48. From this table, it can be
seen that the tax revenue as a percentage of receipts in the Consolidated Fund is projected to
decrease by 9 percent during 2008-09. The shortfall on this account, however, is proposed to be
met by a corresponding increase in the Public Debt receipts by 7 percent along with an increase in
the grants and contributions from the central government by 3 percent. Except for these, there has
not been any structural shift in the receipts.
As regards expenditure, the earlier trend of rising revenue expenditure continues. The revenue
expenditure is projected to increase by Rs 5375 crore during 2008-09. The trend of higher
expenditure in social services compared to that in economic services, a characteristic of the state
finance in the earlier years, is maintained and the expenditure in social service this year is
projected to increase by more than Rs 2800 crore compared to about Rs 900 crore for economic
services. While the share of social services in expenditure has increased marginally at the cost of
general services, that of economic service remains the same. This has been made possible by a
marginal decrease in the discharge of public debt obligations by 1 percent. The trend of increasing
capital outlay has also been continued this year and the share of capital outlay in the total

298
expenditure has increased from 19 percent to 20 percent. In absolute terms, capital outlay has
increased by more than Rs. 1500 crore over the level of the previous year.
Table 7.47 : Summary of Budget, 2008-09 (Surplus -, Deficit +)
(Rs. crore) Revenue Account 2007-08 2008-09 Capital Account 2007-08 2008-09
Receipts Receipts Tax revenues 21,852 24353 Public Debt 1612 4500 Non-Tax Revenues 525.57 422 Recovery of
Loans and Advances
26 22
Grants and Contributions 5,832 8776 Total Revenue Receipts 28,210 33551 Total Capital
Receipts 1,638 4522
Expenditure Expenditure General Services 9,252 10901 Capital Outlay 6104 7635 Social Services 9,868 12689 Public Debt 1632 1676 Economic Services 4,438 5343 Loans and
advances 273 325
Grants and Contributions 5 4 Total Revenue Expenditure
23,563 28938 Total Capital Expenditure
8,008 9636
Deficit Revenue A/c -4,647 -4,613 Deficit Capital Account
6,370 5,114
Consolidated Fund Receipts
29,848 38,073 Consolidated Fund Expenditure
31,571 38,574
Net Consolidated Fund 1,723 501 Contingency Fund Income 0 0 Expenditure 0 0 Contingency Fund Total 0 0 Contingency
Fund Total 0 0
Public Account Public Account Receipts Disbursements Small Savings, PF etc. 1,084 1124 Small Savings,
PF etc. 815 774
Reserve Funds 391.7 167 Reserve Funds 436 167 Deposits and Advances 4,485 2793 Deposits and
Advances 2785 2698
Suspense and Misc. 73,256 Suspense and Misc.
75446
Remittances 6,687 Remittances 6069 Total Receipts 85,903 4084 Total
Disbursements 85552 3640
Net Results Public Account
-352 -445
Net Result (All Accounts) 1,372 56

299
Table 7.48 : Structure of Receipts and Expenditure of Consolidated Fund
(Figures in percentages)
Receipts 2007-08 2008-09 Expenditure 2007-08 2008-09
Revenue Account Tax Revenue 73 64 General
Services 29 28
Non-Tax Revenue 2 1 Social Services 31 33
Grants-in-Aid and Contributions
20 23 Economic Services
14 14
Capital Account
Discharge of Public Debt
5 4
Public Debt 5 12 Loans and Advances
1 1
Recovery of Loans and Advances
0 0 Capital Outlay 19 20
Total 100 100 Total 100 100
Receipts in 2008-08 Budget(percent)
Non-Tax Revenue
1%
Grants-in-Aid and
Contributions23%
Tax Revenue64%
Public Debt12%

300
Expenditure of Bihar Govt (percent)
Loans 1%
General Services29%
Capital Outlay19%
Economic Services
14%Social Services
32%
Discharge of Public Debt
5%
7.18 Central Funds Bypassing the State Budget
In recent years, the number of centrally sponsored schemes for social sector development has
increased substantially and an increasing amount of funds from the central government is being
transferred directly to the autonomous state societies and District Rural Development Authorities
(DRDAs) which are executing agencies for these programmes. In Table 7.49, we have estimated
the funds that have been transferred to autonomous bodies from the central government in 2007-
08. The relevant data has been procured from the following three major societies to which central
government funds are directly transferred :
(a) Bihar Education Project (BEP) for Sarva Shikshya Abhiyan (SSA)
(b) State Health Society for all components of National Rural Health Mission (NRHM)
(c) District Rural Development Authority (DRDA) for National Rural Employment Guarantee
Programme (NREGP), Swarnjayanti Grameen Swarozgar Yojana (SGSY), Sampoorna
Grameen Rozgar Yojana (SGRY), Indira Awas Yojana (IAY), Drought Prone Area
Programme (DPAP), Member of Parliament Local Area Development Scheme (MPLADS),
Provision of Urban Amenities to Rural Areas (PURA), Integrated Wasteland Development
Project (IWDP) and funds for DRDA Administration.

301
Table 7.49 : Details of Central Funds Bypassing the State Budget (2006-07 and 2007-08) (Rs. crore)
GOI Share bypassing state budget
Name of Centrally Sponsored Programme 2006-07 (Actual
Releases)
2007-08 (Estimated Releases)
SSA 1026.29 1326.1 NPEGEL 55.44 0 KGBV 16.84 51.38
Total (SSA+NPEGL+KGBV) 1098.57 1377.48 Total NRHM-A 207.55 105.17 Total NRHM-B 27.94 71.17 Total NRHM-C 56.27 43.69 NRHM-D 14.23 9.17
Total (NRHM) 305.98 229.2 NREGP 485.81 544.79 SGSY 124.46 105.21 SGRY 127.8 ------- IAY (New) 585.69 IAY (Upgradation) 146.42
1054.12
IAY (Credit Cum Subsidy) 0 0 IAY (Flood Affected) 0 0 IAY (5%) 0.56 0 IAY (Kala Azar Affected) 12.04 1.63 Haryali (DPAP) 9.5141 0 IWDP 9.5141 1.18 MPLADS 36.6268 PURA 3.03451 3.89 DRDA (Admin) 11.39974 10.41
Total (DRDA) 1552.87 1721.23 Total of GOI funds bypassing State Budget 2957.42 3327.91 Receipts of GOB 25448 29848 Expenditure of GOB 27136 31571 Total Plan Grants (State Plan+ Centrally Sponsored Plan +Central Plan) 3563.70 4326.67 Total Central Grants (Plan+Non-Plan) 5247.11 5831.67 Percentage of Central Funds bypassing the State Budget (Receipt) 11.62 11.15 Percentage of Central Funds bypassing the State Budget (Expenditure) 10.90 10.54 Central Funds bypassing GOB budget as a percentage of Total Central Plan Grants (State Plan+ Central Plan +Centrally Sponsored Plan) 82.99 76.92 Central Funds bypassing GOB budget as a percentage of Total Central Grants 56.36 57.07
From Table 7.49, it is to be noted that a total of Rs. 3327.91 crore was routed directly to
autonomous societies in 2007-08. This accounts for 11.15 percent of the receipts of the state
government and 10.54 percent of its expenditure. Moreover, the plan grants of the state
government for State Plan Schemes, Central Plan and Centrally Sponsored Schemes (CSS) for

302
2007-08 was Rs. 4326.67 crore. This accounts for 57 percent of the total central government
grants of Rs. 5831.67 crore and 77 percent of the total Central Plan funds that is not routed
through the state budget. Thus, the transfers from the central government bypassing the state
budget is by no means a negligible amount. This has an adverse effect on centre-state financial
relations in particular and fiscal accountability in general due to the following reasons :
(i) The state government has no direct control over the process of fund utilisation as the bulk of
these funds do not pass through its accounts. Thus its status as a monitoring authority has no
financial backing, in spite of an increasing share of state expenditure on these schemes.
(ii) Apart from the fact that the funds are being transferred outside the state budget, the nature of
the schemes dictate the tying of funds to specific components. This centralized framework
limits the possibilities of adapting the expenditure to state-specific goals. Further, it fails to
create a synergy between the components of the state plan and the targets laid down by the
central government.
In an overall framework of decentralization, fiscal devolution should work from the central
government to the state government and from the state government to district and panchayat
levels. Bypassing the state government goes against the spirit of devolution and actually leads to
centralization of financial management at the all India level leading to inefficient use of resources.
Indeed, low utilisation of funds in CSS has been a major issue for Bihar though it had been argued
that funds transferred to autonomous societies bypassing the state budget would lead to higher and
more efficient utilisation.
7.19 Plan and Non-Plan Expenditure in Districts
Table 7.50 shows the expenditure incurred under Non-Plan (NP), State Plan (SP), Central Plan
Schemes (CPS) and Centrally Sponsored Scheme (CSS) in the districts during 2007-08. The
figures are at variance with those reported in the Finance Accounts for the entire state as the
process of reconciliation is yet to be completed. The plan and non-plan expenditure during 2007-
08 as reported in the Finance Accounts are Rs 10,908 crore and Rs 20,664 crore respectively,
adding to a total expenditure of Rs 31571 crore compared to Rs 29720 crore as shown in Table
7.50. As pointed out earlier, since a significant part of the plan expenditure bypasses the state
budget, especially those relating to the Centrally Sponsored Schemes, these are not captured in the
Finance Accounts as is the case with every other expenditure made from the Consolidated Fund.
This is why the difference is arising in the first place. The expenditure shown under works/ forest

303
mostly are plan expenditure and are reflected in the Finance Accounts. Table 7.51 shows the per-
capita plan and non-plan expenditure made in the various districts during 2007-08. It is seen that
Patna district accounts for about 43 percent of the total expenditure. The per capita annual
expenditure amounted to Rs 3055 in 2007-08 while the per capita non-plan expenditure was Rs
1959. The per capita Central Plan assiatance was only Rs 1 compared to per capita Centrally
Sponsored Plan funds of Rs 95.
Table 7.50 : Districtwise Expenditure (2007-08)
(Rs. crore)
NP CPS CSS SP Sub-Total
Works/ Forest
Total
Araria 164.75 0.00 10.21 72.48 247.44 53.92 301.36 Arwal 49.93 0.00 1.36 25.13 76.43 0.06 76.49 Aurangabad 259.02 0.04 12.22 62.67 333.95 93.64 427.59 Banka 137.43 0.02 7.61 67.04 212.10 47.02 259.12
Begusarai 514.90 1.24 14.26 70.20 600.59 52.50 653.09 Bhabhua 131.00 0.03 8.71 45.04 184.77 62.92 247.69 Bhagalpur 554.28 0.02 19.75 119.57 693.63 77.17 770.79 Bhojpur 382.90 0.01 14.37 39.26 436.54 93.42 529.96 Buxar 213.37 0.04 9.76 47.68 270.85 27.06 297.91 Darbhanga 575.57 0.03 19.14 227.99 822.73 142.88 965.61 East Champaran 485.18 0.04 21.48 111.82 618.52 72.63 691.15 Gaya 467.25 0.03 26.72 90.98 584.98 122.19 707.16 Gopalganj 245.50 0.02 12.98 85.06 343.56 47.93 391.50 Jamui 117.55 0.63 10.12 49.26 177.56 37.29 214.85 Jehanabad 162.40 0.03 6.12 38.69 207.24 73.79 281.03 Katihar 282.51 0.02 17.84 73.01 373.38 71.61 444.99 Khagaria 195.35 0.03 5.93 85.24 286.55 55.48 342.04 Kishanganj 104.65 0.01 9.13 48.30 162.10 39.41 201.52 Lakhisarai 73.36 0.02 4.06 30.45 107.89 9.53 117.42 Madhepura 164.18 0.04 9.15 62.18 235.55 58.81 294.37 Madhubani 408.55 0.02 20.60 107.07 536.24 251.48 787.72 Munger 286.25 0.03 7.26 57.83 351.37 23.26 374.63 Muzaffarpur 736.24 0.06 33.49 182.77 952.55 112.34 1064.89 Nalanda 432.20 0.27 16.30 71.50 520.27 105.52 625.79 Nawadah 211.49 0.03 10.81 44.41 266.74 23.78 290.51 Patna 8172.69 6.75 451.16 2759.29 11389.88 1453.03 12842.91 Purnea 284.76 0.09 10.82 96.39 392.06 85.65 477.71 Rohtas 432.70 0.03 14.62 49.87 497.22 72.84 570.07 Saharsa 222.01 0.01 11.22 67.34 300.58 27.15 327.73 Samastipur 467.75 0.03 18.67 198.54 684.99 67.71 752.70 Saran 389.05 0.03 18.05 95.75 502.88 69.74 572.62 Sheikhpura 60.42 0.01 2.99 32.00 95.42 23.63 119.05 Sheohar 70.22 0.02 3.26 53.25 126.76 9.34 136.10 Sitamarhi 367.49 0.05 13.51 159.11 540.15 119.20 659.35 Siwan 317.67 0.00 16.13 49.39 383.19 49.33 432.52 Supaul 186.99 0.04 6.88 81.32 275.23 87.56 362.79 Vaishali 364.02 0.02 13.19 71.20 448.43 43.34 491.77 West Champaran 366.56 0.04 15.30 144.56 526.45 89.56 616.01 Total 19058.15 9.80 925.19 5773.65 25766.79 3953.69 29720.48

304
Table 7.51: Districtwise Per Capita Expenditure (2007-08)
(Rupees)
Population NP CPS CSS SP Total Works/ Forest
G. Total
Araria 0.25 651.25 0.00 40.36 286.49 978.10 213.14 1191.23
Arwal 0.07 713.35 0.00 19.46 359.02 1091.83 0.87 1092.71
Aurangabad 0.24 1097.88 0.16 51.80 265.64 1415.49 396.90 1812.38
Banka 0.19 728.92 0.09 40.37 355.56 1124.94 249.39 1374.33
Begusarai 0.28 1870.05 4.49 51.78 254.97 2181.29 190.66 2371.94
Kaimur 0.15 867.09 0.17 57.65 298.11 1223.03 416.45 1639.48
Bhagalpur 0.28 1951.77 0.07 69.56 421.05 2442.44 271.72 2714.17
Bhojpur 0.26 1456.51 0.05 54.64 149.35 1660.56 355.34 2015.90
Buxar 0.16 1298.19 0.25 59.40 290.10 1647.95 164.63 1812.58
Darbhanga 0.39 1490.13 0.06 49.56 590.26 2130.00 369.90 2499.90
East Champaran 0.36 1360.26 0.10 60.22 313.50 1734.08 203.61 1937.69
Gaya 0.41 1147.83 0.06 65.63 223.50 1437.02 300.15 1737.18
Gopalganj 0.25 973.12 0.07 51.46 337.17 1361.82 189.99 1551.81
Jamui 0.16 717.03 3.87 61.76 300.47 1083.14 227.45 1310.59
Jehanabad 0.11 1511.02 0.28 56.95 360.03 1928.28 686.56 2614.84
Katihar 0.28 1007.49 0.08 63.61 260.36 1331.55 255.37 1586.92
Khagaria 0.15 1301.86 0.22 39.55 568.06 1909.68 369.74 2279.42
Kishanganj 0.15 688.83 0.09 60.10 317.94 1066.97 259.43 1326.40
Lakhisarai 0.09 780.28 0.23 43.21 323.84 1147.56 101.32 1248.89
Madhepura 0.18 917.61 0.23 51.16 347.54 1316.54 328.71 1645.25
Madhubani 0.42 975.02 0.06 49.15 255.53 1279.76 600.17 1879.93
Munger 0.13 2146.69 0.20 54.46 433.66 2635.01 174.43 2809.43
Muzaffarpur 0.44 1676.68 0.13 76.26 416.23 2169.30 255.84 2425.13
Nalanda 0.28 1555.69 0.99 58.66 257.37 1872.70 379.81 2252.51
Nawadah 0.21 997.16 0.12 50.96 209.41 1257.65 112.10 1369.75
Patna 0.55 14778.65 12.20 815.83 4989.61 20596.30 2627.51 23223.80
Purnea 0.30 955.12 0.31 36.29 323.30 1315.02 287.27 1602.29
Rohtas 0.29 1506.52 0.10 50.91 173.63 1731.15 253.61 1984.77
Saharsa 0.18 1256.03 0.06 63.49 380.98 1700.56 153.59 1854.15
Samastipur 0.40 1175.67 0.06 46.93 499.02 1721.67 170.18 1891.86
Saran 0.38 1021.82 0.08 47.41 251.50 1320.79 183.17 1503.96
Sheikhpura 0.06 981.07 0.16 48.47 519.63 1549.33 383.72 1933.05
Sheohar 0.06 1161.29 0.41 53.95 880.63 2096.28 154.48 2250.76
Sitamarhi 0.31 1168.83 0.15 42.96 506.06 1718.00 379.13 2097.12
Siwan 0.32 998.59 0.00 50.71 155.26 1204.56 155.08 1359.64
Supaul 0.20 920.91 0.18 33.89 400.48 1355.46 431.24 1786.70
Vaishali 0.32 1142.61 0.05 41.39 223.48 1407.53 136.05 1543.57
West Champaran 0.46 793.88 0.08 33.13 313.08 1140.17 193.97 1334.14
Total 9.73 1959.26 1.01 95.11 593.56 2648.94 406.46 3055.40

305
7.20 Centrally Sponsored Schemes
Sarva Shiksha Abhiyan (SSA)
Table 7.52 shows the financial performance under SSA scheme in Bhar from 2001-02 through
2007-08. Fund utilisation in Bihar was quite high during 2007-08 under SSA, as in the previous
year. One reason for high fund utilisation under SSA is that the implementing authority (Bihar
Education Project) has existed as a functioning institution for several years, providing a ready
institutional infrastructure for the programme. A componentwise break up shows that utilisation
was 88 percent for the general component of the SSA. However, for the gender specific
components, the utilisation was 264 percent, i.e., more than twice the released funds for National
Programme for Education of Girls at Elementary Level and 71 percent, for Kasturba Gandhi
Balika Vidyalaya. However, the gender specific component is a small percent of the total planned
allocation. It should be noted here that although a substantial part of the funds (88 percent)
released were utilised, the position with respect to releasing of funds itself was not satisfactory. In
2007-08, only 58 percent of the approved funds were released.
Table 7.52 : Financial Performance under SSA
(Rs. crore) Fund Releasses
Utilisation (Percentage with respect to)
Year Approved AWP &
B GOI GOB TOTAL
Total Expenditure Fund
released Fund
Approved SSA
2001-2002 67.05 28.50 5.00 33.50 8.97 26.77 13.37 2002-2003 351.35 79.15 28.50 107.65 12.92 12.00 3.68 2003-2004 764.77 194.49 64.83 259.32 246.89 95.21 32.28 20C4-2005 835.83 302.00 80.00 382.00 376.50 98.56 45.05 2005-2006 842.74 302.00 121.33 423.33 444.30 104.96 52.72 2006-2007* 2340.15 1026.29 538.50 1564.79 1549.59 99.03 66.22 2007-2008* 3161.49 1326.10 816.00 2142.10 1886.17 88.05 59.66
NPEGEL 2004-2005 49.00 18.38 0.00 18.38 12.76 69.42 26.03 2005-2006 57.33 17.71 11.80 29.51 25.78 87.37 44.97 2006-2007* 73.93 55.44 9.23 64.68 33.93 52.47 45.90 2007-2008* 48.06 0.00 9.23 9.23 24.44 264.70 50.85
KGBV 2005-2006 17.70 11.15 4.46 15.62 2.13 13.66 12.05 2006-2007* 138.38 16.84 5.61 22.45 15.49 69.02 11.20 2007-2008* 129.74 51.38 6.62 58.00 41.01 70.71 31.61
District Rural Development Authority (DRDA)
The DRDAs in the state are responsible for implementation of most of the flagship programmes
for poverty alleviation. From Table 7.53, one finds that 69.1 percent of funds released were

306
utilized by DRDAs in 2007-08. The Fund utilisation was high in some components of IAY and
NREGP, but low in respect of SGSY and remaining components of IAY. Thus, the capacity of
fund utilisation varied among the programmes, even though they were all administered by the
same authority. The relevant reasons concerned both planning and implementation of the
programmes. Further, most of these programmes are based on targeted identification of
beneficiaries. This process has proved to be cumbersome and prone to disputes. This has further
slowed down the efficacy of the programmes.
Table 7.53: Financial Performance of : Schemes under DRDA (2007-08)
(Rs. crore)
Schemes under DRDA
Financial
Target
Spillover from 2007-
08
Share of GOI (Releas
ed)
Share of
GOB (Releas
ed)
Total (GOI and
GOB)
Other Funds
Total Funds Availa
ble
Total Exp.
Utilisation
(Percentage)
NREGP - 795.35 544.79 74.18 618.97 58.57 1472.89 1053.35 71.52
SGSY 284.84 171.22 105.21 44.75 149.96 2.11 323.29 151.74 46.94
IAY (New) 1417.93 540.92 1054.12 369.43 1423.55 0 1964.47 1417.9 72.18
IAY (Upgradation) - 73.04 0 0 0 0 73.04 35.98 49.26
IAY (Credit Cum Subsidy)
- 7.72 0 0 0 - 7.72 3.26 42.23
IAY (Flood Affected)
- 82.17 0 0 0 0 82.17 52.53 63.93
IAY (5%) - 2.63 0 0 0 0 2.63 2.63 100.00
IAY (Kala Azar Affected)
- 16.05 1.63 0.54 2.17 0 18.22 18.22 100.00
Haryali (DPAP) - 19.29 1.18 0.57 1.75 0.06 21.1 7.8 36.97
Total 1702.77 1708.39 1706.93 489.47 2196.4 60.74 3965.53 2743.41 69.18
7.21 State Public Sector Undertakings and Corporations
Government Investments in Public Sector
The public sector in Bihar comprises 51 government companies and 4 statutory corporations as on
March 2008. Of the 51 government companies, 17 are working and 34 are non-working
companies. The total investment in public sector as on March 2006 was Rs 8631.32 crore,
comprising equity of Rs 622.70 crore (7.21 percent) and long term loans for Rs 8008.62 crore
(92.79 percent). The total investment including long term loans of the state government in the 17
working companies stood at Rs. 7638.65 crore till March 2006. The sector wise break-up of the
public sector is presented in Table 7.54.

307
Table 7.54 : Sectorwise State Government Companies and Corporations
Sector
Number of
Corporations
Number of Companies
Agriculture 8 Industry 14 Power 1 Electronics 4 Transport 1 Construction 3 Drugs and Chemicals 3 Mining 1 Forest 1 Financing 1 1 Sugar 1 Engineering 1 Textile 1 Public Distribution 1 Handloom and Handicraft 1 Others 1 11 Total 4 51
The summarised financial results for the years 2005-06 and 2006-07 are shown in Table 7.55.
2007-08 results are not available. It can be seen that the rate of return is negligible and that the
accumulated losses of the all the companies have eroded their total equity base several times over.
Their combined turnover has increased marginally between these two years. Neither did they pay
any dividend to the state government, nor did they receive any grants or subsidy from the state
government.
Table 7. 55 : Consolidated Financial Results of Public Sector in Bihar (2005-06 and 2006-07)
(Rs. crore) 2005-06 2006-07
Investment by Government in Share Capital 514.82 514.70
Turnover of all PSUs 1253.42 1388.23
Profit (Loss) ( 233.51) ( 145.14)
Capital employed 1848.84 2641.48
Return on capital employed 74.03 28.38
Return on capital employed (%) 4.00 1.07
PSUs Total Debt , of which 7721.86 8008.61
Government. Loan 6968.31 7228.51
Accumulated profit (Loss) (1582.18) (1682.99)
Dividend paid during year N.A. N.A.
Grant received during the year N.A. N.A.
Subsidy received during the year Nil Nil

308
Non-Working Companies
The state government has invested a total amount of Rs 720 crore till March 2007, comprising
paid up capital of Rs. 159 crore and outstanding loans of Rs. 561 crore, in the 34 non-working
state government companies. The financial indicators of these companies cannot be analysed
meaningfully as these are in various stages of liquidation, besides some of these companies have
not prepared any accounts for as long as 20 years or even more. In fact, five of these have not
prepared any accounts ever since their inception.
Statutory Corporations
The four statutory corporations of the state government are: Bihar State Electricity Board (BSEB),
Bihar State Road Transport Corporation (BSRTC), Bihar State Financial Corporation (BSFC) and
Bihar State Warehousing Corporation (BSWC). All the four corporations are functional. The most
important among them in terms of operations is the BSEB. Table 7.56 presents the financial
results of BSEB during the three years from 2004-05 to 2006-07. It is seen that accumulated loss
of BSEB has been increasing steeply and stands at more than Rs 1500 crore at the end of 2006-07.
The return on investment has been negative and the state government has paid a subsidy of more
than Rs 2300 crore during the three years from 2004-05 to 2006-07. The total of state government
loan due from the corporation stood at more than Rs 6200 crore as on March 2007. The Board had
suffered a loss of Rs. 54.30 crore in 2004-05 which increased to Rs. 854.61 crore in 2006-07.
Table 7.56 : Financial Results of BSEB
(Rs. crore)
2004-05 2005-06 2006-07
Turnover 1000.48 1132.43 1275.93
Profit ( Loss) (54.30) ( 429.42) ( 854.61)
Capital employed 1666.53 2225.53 3087.81
Return on capital employed Negative Negative Negative
Total Debt, of which 5500.14 6433.06 6204.39
Government Loan 3943.49 4731.18 4976.79
Accumulated profit (Loss) (240.67) (670.10) (1524.71)
Dividend paid during year (No. of Cos.)
Nil Nil Nil
Grant / subsidy received during the year
803.60 844.00 720.00
The problems which continue to seriously hamper power generation by the Board are :

309
Lower plant availability due to frequent breakdowns/ interruptions in various equipment and
auxiliaries;
High T&D Losses of more than 40 percent;
Abnormally long shut downs of generating units for capital maintenance;
Low productivity of generating units due to design deficiency, poor quality of coal, etc.
Overdue renovation/ modernisation of the systems and substations/lines;
Poor maintenance of units.
For increasing efficiecy, the state government is considering all options for restructuring of the
Board.
Summarised Results of Public Sector
Table 7.57 gives the summarised results of the public sector corporations and state government
companies for the year in which they have prepared their last accounts. It can be seen that none of
them have prepared up-to date accounts and most of them have been defaulting for years together.
In fact, the state public sector presents a picture of lack of accountability, mismanagement and
mounting losses. Since the accounts are not up-to-date, return on the investment cannot be
calculated. The Board meetings of most of the companies were not held regularly. None of these
51 companies could finalise their accounts for the current year. As mentioned before, 5 of these
companies have not drawn up their accounts ever since their inception, 33 others have not
finalised their accounts for more than last 15 years. As per provisions of the Companies Act, all
companies are statutorily required to finalise their accounts within 6 months of the closure of the
financial year. The audited accounts are required to be laid before the legislature within 9 months
of the closure of the financial year. Failure to observe these statutory provisions relating to timely
finalisation of accounts would normally attract penal provisions under the Companies Act.
The yearly accounts are the primary instrument of accountability and control of any organization.
The accountability of the government companies is ensured by the submission of accounts to the
legislature. In the absence of this, these Companies continue to accumulate losses year after year
at the cost of the public exchequer.

310
Most of these companies do not hold their Board meetings regularly. In the absence of finalised
accounts, the return on investment and various other performance parameters of these companies
remain unknown.
In view of poor turnover and continuous losses, the state government may either improve the
performance of these companies or consider their disinvestment. The state government has already
decided to wind up 5 working and 12 non-working companies. The restoration of sugar mills
under Public-Private cooperation is also under active consideration of the state government.
Table 7.57 : Summarised Results of Public Sector in Bihar as per Their Latest Accounts
Public Sector Units
Statutory Corporations
Investment (till March
2007)
Accumulated Profit (+) /
Loss (-)
Year of Account
Bihar State Electricity Board. 5969.48 (-) 1524.71 2004-05
Bihar State Road Transport Corporation. 182.30 (-)624.43 2001-02
Bihar State Financial Corporation. 377.03 (-)437.53 2005-06
Bihar State Ware-housing Corporation. 7.85 3.83 2003-04
Government Companies
Bihar Rajya Beej Nigam Ltd. 30.94 (-)38.73 1995-96
Bihar Rajya Matsya Vikas Nigam Ltd. 4.40 (-)1.92 1992-93
Bihar State Electronics Development Corporation Ltd. 10.01 (-) 10.38 1998-99
Bihar State Forest Development Corporation Ltd. 2.29 0.32 2000-01
Bihar State Mineral Development Corporation Ltd. 9.97 7.04 2000-01
Bihar Police Building Construction Corporation Ltd. 0.53 (-)1.53 1989-90
Bihar Rajya Pul Nirman Nigam Ltd. 3.50 (-)10.18 1995-96
Bihar State Minorities Finance Corporation Ltd. 34.93 (-)1.90 2001-02
Bihar State Backward Classes Finance and Development Corporation.
32.15 0.53 1997-98
Bihar State Food and Civil Supplies Corporation Ltd. 125.85 (-)25.45 1987-88
Bihar State Tourism Development Corporation Ltd. 5.00 1.85 1995-96
Bihar State Hydro Electric Power Corporation Ltd. 287.41 (-)5.48 1995-96
Tenughat Vidyut Nigam Ltd. 750.34 -- 1993-94 Bihar State Credit and Investment Corporation Ltd. 73.59 (-)126.49 2001-02 Bihar State Text Book Publishing Corporation Ltd. 6.33 1.62 1996-97 Bihar State Film Development and Finance Corporation Ltd. 1.15 (-)0.12 1991-92 Bihar State Beverages Corporation Ltd. 5 --- --- Bihar State Water Development Corporation Ltd. 59.68 (-)11.20 1978-79 Bihar State Dairy Corporation Ltd. 8.48 (-)9.00 1991-92

311
Table 7.57 : (Contd.)
Bihar Hill Area Lift Irrigation Corporation Ltd. 18.55 (-)0.86 1982-83 Bihar State Agro Industries Development Corpn. Ltd. 20.17 (-)14.16 1986-87 Bihar Fruit and Vegetables Development Corpn. Ltd. 3.22 (-)5.13 1991-92 Bihar Insecticides Ltd. 2.11 (-)1.03 1986-87 Bihar State Small Industries Corporation Ltd. 19.41 (-)16.56 1990-91 Bihar State Industiral Development Corporation Ltd. 83.24 (-)22.91 1986-87 Bihar Scooters Ltd. 7.72 … … Bihar Paper Mills Ltd. 18.49 (-)0.31 1985-86 Bihar State Finished Leather Corporation Ltd. 10.65 (-)2.13 1983-84 Bihar State Glazed Tiles and Ceramics Industries Ltd. 4.81 (-)0.51 1985-86 Vishwamitra Paper Industries Ltd. 1.96 (-)0.01 1984-85 Jhanjharpur Paper Industries Ltd. 1.54 (-)0.02 1985-86 Bihar State Tannin Extracts Ltd. 3.71 (-)0.67 1988-89 Bihar Solvent and Chemical Ltd. 1.97 (-)0.32 1986-87 Synthetic Resins (Eastern) Ltd. 1.36 (-) 0.73 1983-84 Magadh Minerals Ltd. 0.47 … … Bhawani Active Carbon Ltd. 0.09 (-)0.01 1985-86 Bihar State Leather Industries Development Corporation Ltd.
24.13 (-)2.92 1982-83
Bihar State Construction Corporation Ltd. 80.05 (-)2.79 1986-87 Kumardhubi Metal Casting and Engineering Ltd. 8.8 (-)8.16 1994-95 Beltron Video System Ltd. 9.56 (-)0.22 1987-88 Beltron Mining System Ltd. 2.48 (-)0.49 1989-90 Beltron Informatics Ltd. 0.28 …. ….. Bihar State Textile Corporation Ltd. 7.62 (-)0.32 1987-88 Bihar State Handloom and Handicrafts Corporation Ltd.
11.16 (-)0.44 1983-84
Bihar State Sugar Corporation Ltd. 342.95 (-)72.31 1984-85 Bihar State Cement Corporation Ltd. 0.03 …. Bihar State Pharmaceuticals and Chemicals Development Corporation Ltd.
19.28 (-)0.74 1985-86
Bihar Maize Products Ltd. 0.02 (-)0.06 1983-84 Bihar Drugs and Chemicals Ltd. 5.28 (-)0.16 1985-86 Bihar Panchayati Raj Financial Corporation Ltd. 1.07 (-)0.03 1984-85 Bihar State Export Corporation Ltd. 3.22 (-) 0.95 1991-92 Total 8703.61 -2968.81
7.22 Disparity in Government Expenditure on Social Sectors across the Districts
The last Economic Survey had pointed out the disparities that existed between the districts in the
state in respect of the state government expenditure on health and educational sectors. This year
the analysis has been extended into more sectors. The treasurywise data were analysed to ascertain
accurately the expenditure incurred by the state government in the districts under social sector
heads.

312
From Table 7.58, we can see that, in 2007-08, 67 percent of the total state government revenue
expenditure on education were made on primary education, followed by 17 percent in secondary
education and 14 percent on university and higher education. This signifies the priorities the state
government places upon primary education. In medical and public health, 50 percent of the total
expenditure were made on rural areas, as compared to 46 percent last year, followed by 30 percent
on urban areas and 10 percent on medical training and research and the rest 6 percent on public
health. This again reflects the state government’s priorities in the sphere of healthcare in favour of
rural areas where adequate facilities do not exist.
Table 7.58 : Government Revenue Expenditure on Education and Health
2005-06 2006-07 2007-08 General Education 100 100 100
Primary 64 63 67 Secondary 16 20 17 Higher Education and Others 18 16 14 Others (Adult Education etc) 1 1 2
Medical and Public Health 100 100 100
Urban 37 38 40 Rural 49 46 50 Public Health 4 6 2 Medical Research and Training 10 10 8
Table 7.59 and the accompanying charts show the districtwise per capita expenditure in 2007-08
on the sub-major heads of primary, secondary and higher education across all the districts of Bihar
as well as for health and supply of drinking water. All these are key components of the
expenditure on social sector. The extent of disparity between the per capita expenditure in Patna
and in the other districts of Bihar is found to be very large in all these areas, and it has not been
reduced compared to the last year. The data have been arranged in Table 7.59 in descending order
and the maximum and minimum expenditure can be readily compared with the average
expenditure that has been worked out for each sub-major head of accounts.
Table 7.60 shows the districtwise expenditure in respect of a few other heads and Table 7.61
shows the per capita amounts for the same, worked out on the estimated mid-year population for
2007-08. These tables and the accompanying chart also show that the extent of disparity remains
equally conspicuous in respect of these heads.

313
Table 7.59 : Per capita Expenditure on Social Sectors (Rs), 2007-08
Primary Education
Secondary Education
Higher Education
Medical Drinking Water
Supply Primary
EducationSecondary Education
Higher Education
Medical Drinking
Water Supply
District Per capita Expend-
iture District
Per capita Expendi-
ture District
Per capita Expendi-
ture District
Per capita Expendi-
ture District
Per capita Expendi-
ture Patna 3867.18 Patna 625.94 Patna 1532.61 Patna 927.23 Patna 170.86 Munger 288.88 Munger 111.34 Munger 6.31 Darbhanga 145.08 Bhagalpur 124.28 Nalanda 265.81 Buxar 106.47 Bhagalpur 3.54 Bhagalpur 127.15 Munger 93.28 Jehanabad 229.82 Jehanabad 98.69 Muzaffarpur 3.08 Jehanabad 99.44 Darbhanga 55.91 Madhepura 221.89 Bhojpur 95.94 Saharsa 2.91 Gaya 92.48 Muzaffarpur 54.28 Vaishali 221.10 Bhagalpur 87.93 Aurangabad 2.76 Munger 86.09 Sheikhpura 37.90 Aurangabad 217.63 Nalanda 87.73 Saran 2.41 Muzaffarpur 85.39 Rohtas 34.16 Khagaria 213.14 Arwal 85.01 Samastipur 2.13 Sheikhpura 62.80 Purnia 33.52 Bhojpur 212.17 Saran 80.16 Bhojpur 2.01 Nalanda 61.47 Gaya 33.30 Bhagalpur 211.88 Rohtas 79.79 Nalanda 1.85 Gopalganj 60.73 Saran 31.76 Rohtas 211.00 Lakhisarai 77.62 Rohtas 1.60 Aurangabad 59.78 Bhojpur 25.74 Saharsa 210.43 Sheikhpura 76.04 Jehanabad 1.53 Bhojpur 56.77 Jehanabad 25.64 Muzaffarpur 209.31 Siwan 73.70 Kishanganj 1.28 Begusarai 56.10 Nalanda 23.48 Begusarai 204.79 Gopalganj 69.10 Madhepura 1.20 Lakhisarai 55.46 Saharsa 17.87 Saran 200.63 Muzaffarpur 68.25 Purnia 1.19 Nawada 55.31 Aurangabad 13.51 Lakhisarai 199.79 Aurangabad 67.80 Vaishali 0.93 Samastipur 51.95 Banka 13.51 West Champaran
194.54 Begusarai 61.47 Supaul 0.93 Saharsa 51.39 Buxar 13.49
Buxar 194.52 Samastipur 60.58 Katihar 0.88 Khagaria 51.06 Kaimur (Bhabua)
12.92
Banka 194.22 Vaishali 58.55 Gopalganj 0.85 Banka 50.59 Nawada 12.31 Samastipur 191.34 Gaya 57.67 Khagaria 0.65 Rohtas 48.82 Jamui 10.89 Madhubani 188.37 Nawada 57.04 Nawada 0.65 Purnia 48.67 Sitamarhi 10.83 Darbhanga 182.57 Madhubani 56.39 Buxar 0.52 Vaishali 48.45 Vaishali 9.41 Purnea 181.37 Darbhanga 51.78 Jamui 0.52 Pashchim
Champaran 47.78 Purba
Champaran 8.86
Katihar 180.24 Saharsa 51.14 Pashchim Champaran
0.49 Madhubani 45.08 Khagaria 8.58
Nawada 179.36 Banka 46.93 Madhubani 0.47 Jamui 44.57 Samastipur 8.50 Siwan 178.72 Khagaria 46.45 Purba
Champaran 0.45 Katihar 44.33 Gopalganj 8.23
Sheohar 173.09 Madhepura 46.36 Siwan 0.41 Purba Champaran
43.03 Begusarai 7.95
Sheikhpura 170.98 Sitamarhi 40.37 Sitamarhi 0.34 Sitamarhi 43.02 Katihar 7.85 Gopalganj 170.35 Katihar 40.04 Banka 0.26 Saran 42.93 Pashchim
Champaran 7.45
East Champaran
169.33 Pashchim Champaran
39.24 Darbhanga 0.23 Buxar 42.61 Madhepura 7.27
Supaul 165.00 Supaul 38.44 Begusarai 0.18 Siwan 42.57 Madhubani 7.16 Sitamarhi 164.66 Jamui 38.15 Arwal 0.00 Arwal 42.32 Araria 6.18 Arwal 164.15 Kaimur
(Bhabua) 36.77 Sheohar 0.00 Kishanganj 34.95 Siwan 5.76
Araria 160.65 Sheohar 36.75 Araria 0.00 Madhepura 34.20 Lakhisarai 4.98 Gaya 153.36 Purba
Champaran 36.28 Lakhisarai 0.00 Sheohar 30.57 Kishanganj 2.82
Kishanganj 151.49 Purnia 33.59 Sheikhpura 0.00 Araria 29.26 Sheohar 1.66
Jamui 145.76 Kishanganj 31.84 Kaimur (Bhabua)
0.00 Kaimur (Bhabua)
20.18 Supaul 1.35
Kaimur 66.68 Araria 30.34 Gaya 0.00 Supaul 14.16 Arwal 0.00
State Average
399.72 State Average
91.79 State Average
88.25 State Average
107.54 State Average
31.06

314
Per capita Expenditure on Primary Education (Rs)
0
500
1000
1500
2000
2500
3000
3500
4000
4500
Patna
Nalanda
Vaishali
Khaga
ria
Bhaga
lpur
Sahar
sa
Begus
arai
Saran
Pashch
im C
hampar
an
Banka
Mad
huban
i
Purnia
Nawada
Sheoh
ar
Gopalg
anj
Supau
l
Araria
Kishang
anj
Kaimur
(Bha
bua)
Per capita Expenditure in Districts on Secondary Education (Rs)
0
100
200
300
400
500
600
700
Patna
Buxar
Jeha
naba
d (inc
l. Arw
al)
Nalan
da
Rohta
s
Sheikh
pura
Gop
algan
j
Auran
gabad
Samas
tipur
Gay
a
Mad
huban
i
Sahar
sa
Khaga
ria
Sitam
arhi
Pashc
him C
ham
para
n
Jam
ui
Sheoh
ar
Purni
a
Araria

315
Per Capita District Expenditure on Higher Education (Rs)
0
200
400
600
800
1000
1200
1400
1600
1800
Patna
Bhaga
lpur
Sahar
sa
Saran
Bhojpu
r
Rohta
s
Mad
hepur
a
Vaish
ali
Katiha
r
Khaga
ria
Jeha
naba
d (inc
l. Arw
al)
Jam
ui
Mad
huban
i
Siwan
Banka
Begus
arai
Araria
Sheikh
pura
Gay
a
Per capita Expenditure on Medical in Districts (Rs)
0
100
200
300
400
500
600
700
800
900
1000
Patna
Bhaga
lpur
Mun
ger
Jeha
naba
d (inc
l. Arw
al)
Nalan
da
Auran
gabad
Begus
arai
Nawad
a
Sahar
sa
Banka
Purni
a
Pashc
him C
ham
para
n
Jam
ui
Purba
Cham
para
n
Saran
Siwan
Mad
hepur
a
Araria
Supau
l

316
Per Capita District Expenditure on Drinking Water Supply (Rs)
0
20
40
60
80
100
120
140
160
180
Patna
Mun
ger
Muz
affa
rpur
Rohta
sGay
a
Bhojpu
r
Sahar
sa
Auran
gaba
d
Buxar
Nawad
a
Sitam
arhi
Purba
Cha
mpa
ran
Samas
tipur
Begus
arai
Pashc
him C
ham
para
n
Mad
huba
ni
Siwan
Kishan
ganj
Supau
l

317
Table 7.60 : District wise expenditure on Some Other Social Sectors during 2007-2008 (Rs.Crore)
Population
(Crore)
Welfare of SC, ST,
OBC
Social Security
& Welfare
Nutrition Roads & Bridges
Public Works
Patna 0.55 54.06 144.11 14.96 82.03 117.72 Darbhanga 0.39 7.78 10.22 14.16 13.22 2.52 Samastipur 0.40 5.90 9.68 12.78 8.71 3.36
Muzaffarpur 0.44 9.95 10.31 14.28 20.89 9.13
Sitamarhi 0.31 4.05 6.85 10.32 8.89 2.58
E. Champaran 0.36 6.21 10.97 18.78 14.08 3.15
Khagaria 0.15 2.41 4.99 7.12 5.28 2.00
Madhubani 0.42 7.22 12.85 14.29 12.69 2.34
W. Champaran 0.46 7.49 8.78 13.39 8.21 4.36
Begusarai 0.28 3.18 6.22 9.00 4.81 1.75 Vaishali 0.32 5.50 7.74 11.64 8.02 2.83
Nalanda 0.28 6.34 7.80 9.83 16.01 1.66
Gaya 0.41 18.49 10.20 18.30 10.61 3.16
Bhagalpur 0.28 9.15 10.53 10.10 8.55 7.97
Katihar 0.28 5.48 12.70 6.24 16.43 1.27
Siwan 0.32 4.97 7.83 12.90 21.63 1.43
Supoul 0.20 2.70 4.48 7.69 6.88 0.85 Sheohar 0.06 0.82 1.90 2.12 2.25 0.62
Saran 0.38 9.11 9.46 10.36 9.50 3.44
Gopalgunj 0.25 4.21 5.70 10.12 13.20 1.79
Purnea 0.30 6.67 7.09 12.47 10.93 1.64 Rohtas 0.29 8.66 5.97 9.73 10.86 1.64
Bhojpur 0.26 4.45 8.09 8.85 10.07 2.81 Madhepura 0.18 3.54 3.45 7.91 6.15 0.67
Saharsa 0.18 3.36 4.40 7.17 6.81 1.40
Araria 0.25 2.78 7.03 8.80 9.13 0.42
Aurangabad 0.24 4.69 5.24 11.14 3.86 2.27
Bhabua 0.15 10.59 3.87 6.55 5.09 0.49
Nawadah 0.21 4.57 5.07 7.69 6.91 0.97
Buxar 0.16 5.57 4.02 6.55 6.30 2.21
Banka 0.19 2.89 5.21 6.91 5.12 1.74
Jahanabad 0.11 2.48 3.38 4.01 11.47 0.55
Jamui 0.16 4.61 3.97 7.40 5.44 0.19
Kishanganj 0.15 1.89 3.58 6.93 6.11 0.60
Munger 0.13 3.31 4.11 3.90 3.64 3.05
Lakhisarai 0.09 1.54 2.32 4.01 1.30 0.32
Sheikhpura 0.06 0.74 1.58 2.46 2.58 0.60
Arwal 0.07 0.66 2.27 1.20 0.00 0.00
Total 9.73 248.02 383.98 352.07 403.66 195.51

318
Table 7.61 : Districtwise Per Capita Expenditure during 2007-08 (Rupees)
District Name
Welfare of
SC, ST, OBC
Social Security
&Welfare Nutrition
Roads & Bridges
Public Works
Patna 97.75 260.59 27.04 148.34 212.88 Sheohar 13.53 31.44 34.98 37.20 10.27 Darbhanga 20.15 26.45 36.66 34.24 6.53 Khagaria 16.06 33.25 47.42 35.21 13.31 Sitamarhi 12.90 21.79 32.84 28.26 8.19 Samastipur 14.83 24.33 32.11 21.88 8.44 Muzaffarpur 22.66 23.47 32.52 47.58 20.80 E. Champaran 17.41 30.76 52.66 39.48 8.83 Begusarai 11.56 22.59 32.68 17.47 6.37 Madhubani 17.23 30.67 34.11 30.29 5.60 Supaul 13.30 22.09 37.86 33.89 4.17 Nalanda 22.82 28.08 35.39 57.63 5.99 Vaishali 17.27 24.29 36.55 25.16 8.89 Jahanabad 23.11 31.45 37.34 106.77 5.09 Bhagalpur 32.21 37.07 35.57 30.09 28.06 Katihar 19.54 45.30 22.26 58.61 4.52 Madhepura 19.80 19.31 44.20 34.39 3.72 Kaimur 70.10 25.59 43.37 33.70 3.27 Saharsa 18.98 24.90 40.59 38.55 7.94 Siwan 15.64 24.62 40.54 67.98 4.49 Gopalgunj 16.71 22.58 40.11 52.31 7.09 W. Champaran 16.21 19.02 28.99 17.79 9.44 Buxar 33.87 24.49 39.82 38.33 13.43 Gaya 45.42 25.07 44.96 26.07 7.76 Munger 24.81 30.81 29.22 27.27 22.91 Purnea 22.36 23.77 41.84 36.67 5.51 Sheikhpura 12.07 25.63 40.02 41.83 9.79 Jamui 28.13 24.22 45.16 33.19 1.18 Bhojpur 16.92 30.76 33.65 38.29 10.67 Kishanganj 12.44 23.55 45.64 40.20 3.93 Rohtas 30.14 20.80 33.88 37.81 5.72 Nawada 21.55 23.91 36.26 32.60 4.56 Banka 15.34 27.65 36.64 27.15 9.23 Aurangabad 19.87 22.20 47.24 16.35 9.63 Araria 10.99 27.80 34.80 36.08 1.65 Saran 23.92 24.85 27.22 24.94 9.03 Lakhisarai 16.39 24.69 42.66 13.83 3.44 Arwal 9.38 32.42 17.11 0.00 0.00 State 25.50 39.47 36.19 41.50 20.10
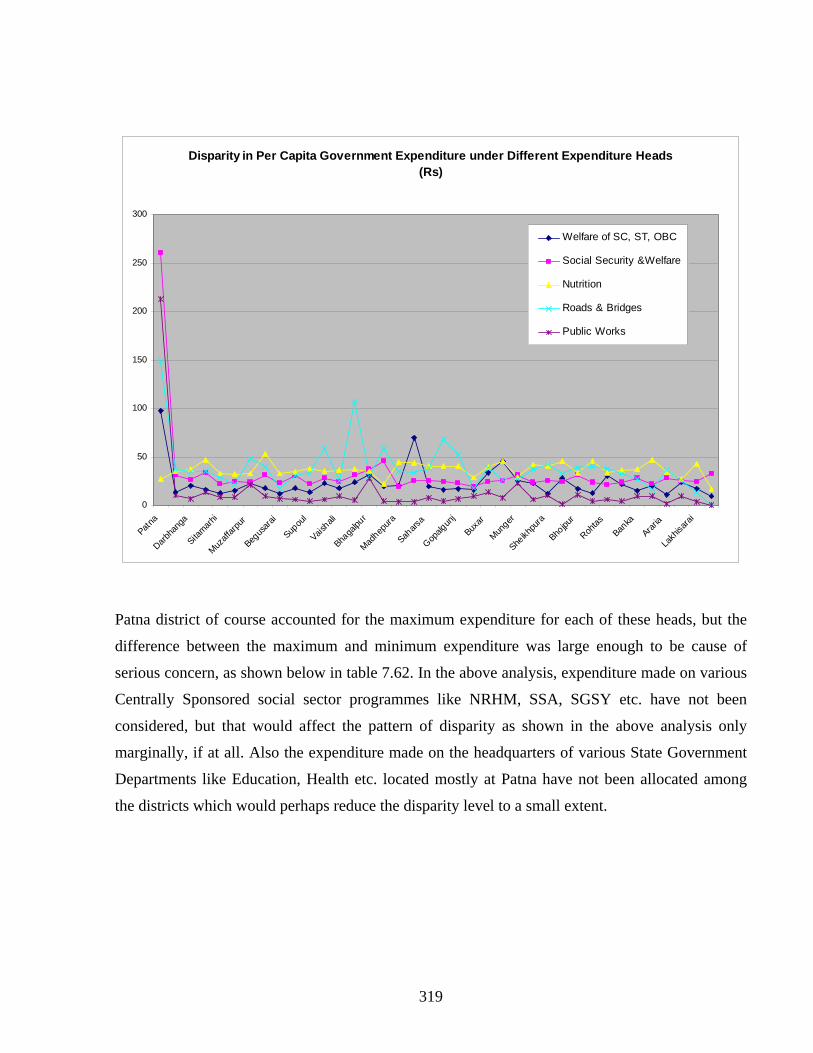
319
Disparity in Per Capita Government Expenditure under Different Expenditure Heads (Rs)
0
50
100
150
200
250
300
Patna
Darbh
anga
Sitam
arhi
Muz
affa
rpur
Begus
arai
Supou
l
Vaish
ali
Bhaga
lpur
Mad
hepur
a
Sahar
sa
Gop
algun
j
Buxar
Mun
ger
Sheikh
pura
Bhojpu
r
Rohta
s
Banka
Araria
Lakh
isara
i
Welfare of SC, ST, OBC
Social Security &Welfare
Nutrition
Roads & Bridges
Public Works
Patna district of course accounted for the maximum expenditure for each of these heads, but the
difference between the maximum and minimum expenditure was large enough to be cause of
serious concern, as shown below in table 7.62. In the above analysis, expenditure made on various
Centrally Sponsored social sector programmes like NRHM, SSA, SGSY etc. have not been
considered, but that would affect the pattern of disparity as shown in the above analysis only
marginally, if at all. Also the expenditure made on the headquarters of various State Government
Departments like Education, Health etc. located mostly at Patna have not been allocated among
the districts which would perhaps reduce the disparity level to a small extent.

320
Table 7.62 : Per Capita Minimum and Maximum District Expenditure during 2007-08
Head of Account
Maximum Expenditure
(Patna district) (Rs.)
Minimum Expenditure
(Rs.)
District registering minimum per
capita Expenditure
Average expenditure for the State (Rs.)
Primary Education 3867.18 66.68 Kaimur 399.72
Secondary Education 625.94 30.34 Araria 91.79
Higher Education 1532.61 0.00 Arwal, Sheohar, Araraia, Kaimur, Lakhiserai, Sheikhpura, Gaya
88.25
Medical 927.23 14.16 Supaul 107.54
Drinking Water Supply 170.86 0.00 Arwal 31.06
Welfare of SC, ST, OBC 97.75 9.38 Arwal 25.50
Social Security & Welfare 260.59 19.02 West Champaran 39.47
Nutrition 27.04 17.11 Arwal 36.19
Roads & Bridges 148.34 0.00 Arwal 41.50
Public Works 212.88 0.00 Arwal 20.10
7.23 : Panchayati Raj Institutions
The Bihar Panchayati Raj Act was enacted in 1993 and was substituted by the Bihar Panchayat
Raj Act, 2006. A three-tier system of Panchayat Raj (Zila Parishad, Panchayat Samiti and Gram
Panchayat) started functioning from 2001-02.
There are 38 Zila Parishads (ZPs), 531 Panchayat Samitis (PSs) and 8471 Gram Panchayats (GPs)
in Bihar. The total population covered by these is about 7.43 crore. The Panchayat Raj
Department (PRD) of the state government coordinates the functioning of the PRIs. As required
under Article 243G of the Constitution, by 2005, the state government had devolved several
functions of 20 departments to PRIs, though the processs of transfer of functions, functionaries
and funds to PRIs by these departments is yet to be completed. The list of such departments can be
found at Appendix I.
PRIs are financed by grants from the central government, besides recurring and non-recurring
grants released by the state government and its own sources of revenue. The Panchayat Samities
and Gram Panchayats are yet to raise revenue from their own sources and the state government
had not yet taken the necessary action by way of notifying the rates of taxes, tolls, fees etc. to be
imposed by them, as per the recommendation of the second State Finance Commission (SFC). The
financial assistance to PRIs and Urban Local Bodies (ULB) during the last 6 years is shown in
Table 7.63.

321
Table 7.63 : Financial Assistance to PRIs and ULBs
(Rs crore)
2002-03 2003-04 2004-05 2005-06 2006-07 2007-08
ULBs: Municipal Corporation and Municipalities
67.22 42.90 38.95 139.45 122.87 278.37
PRIs: Zila Parishads and Other PR Institution
69.28 34.49 153.72 379.22 522.25 834.28
The Zila Parishads are authorised to raise a small amount of revenues from its own resources like
rent of shops, rent of Dak Bunglow/ Inspection Bungalow, settlement of ponds/ghats/ferries/road
side land and trees, bullock cart registration fee and other miscellaneous fees. The Zila Parishads
naturally were unable to meet their establishment and other recurring charges from their own
sources and had to be financed by the state government by way of grants and loans amounting to
Rs 834 crore in 2007-08. Compared to this, the total assistance given to the ULBs amounted to Rs
278 crore in 2007-08. The PRIs were yet to maintain any account of the funds received; they
clearly lack the accounting expertise necessary for this purpose. In the absence of this, the
financial reporting system with the PRIs remains generally weak. The funds released by the
central and state governments are utilized by the ZPs, PSs and GPs for activities specified under
Section 22, 47 and 73 of the Panchayat Raj Act, 2006 pertaining to civic amenities in rural areas.
Finances of the Panchayat Raj Institutions
Appendices II, III and IV give the position of receipts and expenditure of 12 Zila Parishads (1996-
97 to 2005-06), 65 Panchayat Samities (2001-02 to 2005-06) and 195 Gram Panchayats (2001-02
to 2005-06) which were audited by the Examiner of Local Accounts, Bihar for the period from
1996-97 to 2005-06. The summary of receipts and expenditure of these institutions is given in
Table 7.64. It can be seen that about 14 percent of the total funds received could not be utilised by
the PRIs. Table 7.64 : Receipts and Expenditure of PRIs till 2005-06
(Rs crore)
PRIs Total Own Receipts
Total Receipts
Total Expenditure
Total Establish-
ment Expenditure
Savings = Receipts -
Expenditure
12 ZP (out 0f 38) 33.96 419.17 361.72 27.39 57.45
65 PS (out 0f 531) Nil 110.14 90.01 NA 20.13
195 GPs (out 8471) Nil 46.76 42.60 NA 4.16

322
Table 7.65 shows the summary of the total works executed by these PRIs in Bihar till 2006-07. It
can be seen that about 33 percent of the total number of works remain incomplete as on March
2007, involving a total advance of Rs 74.05 crore.
Table 7.65 : Summary of Total Works executed by PRIs till 2005-06
Total no. of
works undertaken
Total no. of works
completed
No of Incomplete Schemes
Estimated Cost of
Incomplete Schemes (Rs Cr)
Advance Involved in Incomplete Schemes (Rs Cr)
12 ZP (out 0f 38) 7047 3837 3210 28.86 39.38
65 PS (out 0f 531) 8703 5154 3549 44.32 26.71
195 GPs (out 8471) 12113 9756 2357 11.93 7.96
As per Section 134 of the Bihar Panchayat Raj Act, 1993, the state government is to constitute a
District Planning Committee in every district to consolidate the plans prepared by the PRIs and
ULBs in the district and to prepare a draft development plan for the district as a whole. The rules
regarding constitution of the committee, its powers, functions and jurisdictions were notified by
the state government in January 2007. The District Planning Committees are being constituted in
all districts.
Central and State Finance Commission Grants
The central grants to PRIs are given under recommendations of the successive Central Finance
Commissions and the state government grants under recommendations of the successive State
Finance Commissions (SFC). The grants received by the above PRIs under recommendations of
the Tenth, Eleventh and Twelfth Central Finance Commissions are shown in Appendices II to IV.
As regards the SFC transfers, the first State Finance Commission (SFC) constituted in 1994 did
not make any recommendation. The second State Finance Commission, constituted in June 1999,
submitted five interim reports mainly on the distribution of Tenth FC and Eleventh FC grants to
Gram Panchayats, Panchayat Samitis and Zila Parishads in the ratio of 93:6:1 respectively. The
'Population ratio' was also recommended as criteria for distribution among Panchayat Samitis and
Zila Parishads. The state government had accepted the above recommendations. The third SFC
was constituted in June 2004 and it submitted its report the same year incorporating all interim
recommendations of the previous Commissions.

323
Its major recommendations were as follows :
(i) An amount not exceeding 3 percent of the State’s total tax revenue from its own taxes net of
the collection costs shall be set apart in the annual budget for providing matching share to
each urban local body and Zila Parishads among the rural local bodies.
(ii) The State Government will distribute this amount among the local bodies as a matching
contribution to the total resources raised by the said urban local bodies and the Zila
Parishads in the immediately preceding financial year from its own sources and will be
based on actual collection. For the purpose of this clause the resources raised by a Zila
Parishad shall include the resources raised by the Panchayat Samitis and Gram Panchayats
within its local jurisdiction.
(iii) The matching contribution mentioned above shall be limited to an amount equal to the
resources raised by the urban local bodies and Zila Parishads as referred to above. In case the
resources raised by the local bodies exceed the amount of 3 percent above referred then
every local body shall get a proportionate share only weighted by the resources raised by
itself within the 3 percent limit.
(iv) The Zila Parishad concerned shall make a further devolution from the matching contribution
so received to the rural local bodies within its jurisdiction in the same manner as the
resources raised are calculated for that particular financial year.
(v) The local bodies need to create some revenue generating assets in respect of their future
needs. The commission suggests that the PRIs and the ULBs may seek financial help from
the financial institutions without any Government guarantee to promote the revenue
generating projects such as market complex, shops, high level bridges, slaughter house,
tanneries, bus stops etc.
(vi) The actual salary requirements of regular employees working against sanctioned posts
should be borne by the state government. For this purpose the current annual salary liability
of the local body in the financial year immediately preceding the year in which the report of
the Commission is implemented should be taken as the base year and the base amount.
Current liability shall not include arrears of salary, if any. There shall be 20 percent tapering
each year.
(vii) The Commission also recommended a one time grant to these bodies for developing their
database.

324
Grants for Centrally Sponsored Schemes
The PRI institutions receive grants not only through the central and state Finance Commissions
recommendations, but also directly from the central government for various Centrally Sponsored
Schemes which are not routed through the state government budget. Since there is no
comprehensive database for the PRIs in Bihar developed so far, we have no source from where to
gather information about the total amount of grants flowing to them for the Centrally Sponsored
schemes. The Examiner of Local Accounts, Bihar is attempting top build a database gradually
based on their audit results of few Panchayats every year and the information in respect of 12
Zila Parishads, 65 Panchayat Samities and 195 Gram Panchayats are available from this database.
On the basis of information published by him in his latest report for 2006-07, the information
about the grants received by the PRIs under the various Finance Commission grants and under the
Centrally Sponsored Schemes are presented in Table 7.66, 867 and 7.68 for the period from 1996-
97 to 2005-06.
Table 7.66 : Grants for 12 Zila Parishads (1996-97 to 2005-06)
(Rs crore)
Sl. No.
Fund Particulars
Receipt including
Outstanding Balance
Expenditure Balance
1 10th FC 19.84 19.73 0.11 2 11th FC 115.35 113.52 1.83 3 12th FC 93.60 59.38 34.22 4 EAS/SGRY 107.68 100.39 7.29 5 NREGP/SREGP 5.65 3.60 2.05 6 MP/MLA/MLC 13.33 11.62 1.71 7 Other non-recurring grants 29.76 26.09 3.67 8 Govt. grant and loan and
own receipt for establishment expenses.
33.96 27.39 6.57
Total 419.17 361.72 57.45
The other non-recurring grants received were from the state government, besides additional central
assistance for construction of Gram Panchayat buildings. The state government grants included
those from the Panchayati Raj Department for repair/renovation of Inspection bunglows/Dak
bunglows, repair and maintenance of roads, from the state Education Department for construction
of Primary School buildings and providing water and toilet facilities in Primary/Middle Schools as
also from the Agriculture Department for Macromode schemes and from the Revenue Department
as road cess.

325
Table 7.67 : Grants for 65 Panchayat Samities (2001-02 to 2005-06)
(Rs crore)
Sl. No.
Nature of grant
Receipt including
Outstanding Balance
Utilisation
Balance
1 10th FC 0.89 0.78 0.11
2 11th FC 5.74 4.20 1.54
3 12th FC 1.23 0.34 0.89
4 EAS/SGRY 101.59 84.53 17.06
5 NREGP 0.58 0.06 0.52
6 OTHERS 0.11 0.10 0.01
Total 110.14 90.01 20.13
Table 7.68 : Grants for 195 Gram Panchayats : 2001-02 to 2005-06
(Rs crore)
Sl. No.
Particulars of grants Receipt
including OB
Expenditure Balance
1 10th FC 2.26 2.05 0.21
2 11th FC 11.95 11.05 0.90
3 12th FC 3.27 2.53 0.74
4 EAS/SGRY 26.69 24.77 1.93
5 NREGP 0.05 Nil 0.05
6 PHED/Shiksha Mitra/ Lok Shiksha/MLA etc.
2.53 2.19 0.34
Total 46.76 42.59 4.16
The major constraints faced in respect of PRIs is the absence of any reliable and comprehensive
database regarding the physical and financial assets of these institutions. This is largely due to the
lack of any training and accounting infrastructure and lack of awareness. Despite the best efforts
of the state government, these inherent constraints are making the task of building such a database
extremely difficult.

326
Appendix I : Details of function devolved by 20 Departments to PRI
Number of functions transferred to Sl. No
Activity GPs PSs ZPs
1 Agriculture 4 6 6
2 Revenue and Land Development 10 1 Nil
3 Water Resources (Minor Irrigation) 8 3 2
4 Animal Husbandry and Fishery 10 3 8
5 Forest and Environment 5 5 5
6 Industry 6 6 6
7 Public Health Engineering 3 3 4
8 Rural Development 3 2 1
9 Rural Engineering (Road, Bridge, Culvert etc.) 1 1 2
10 Energy 3 3 3
11 Primary Education 9 8 7
12 Adult Education 1 1 1
13 Literacy 1 1 1
14 Cultural Activities 3 2 3
15 Medical 1 1 Nil
16 Family Welfare 1 1 Nil
17 Social Welfare 5 5 5
18 Welfare of Handicapped 2 4 4
19 Public Distribution System 2 3 3
20 Relief and Rehabilitation 1 1 Nil
Total 79 60 61

327
Appendix II : Receipts and Expenditure of Zila Parishads
(Rs crore)
Receipts Sl. No.
Name of ZP Xth FC
XIth FC
XIIth FC
EAS/ JRY/
SGRY NREGP
MP/ MLA/ MLC
Other scheme
Own receipt
Total Receipt
s
1 Jahanabad 0.98 4.48 3.4 6.5 nil 0.47 1.35 1.69 18.87
2 Arwal 0.01 1.78 1.39 4.82 3.05 0.75 0.57 0.23 12.6
3 Nalanda 2.77 12.76 9.52 14.86 1 5.95 2.88 9.52 59.26
4 Saran 3.7 17.25 12.72 14.17 Nil Nil 1.97 5.21 55.02
5 Supaul 2.02 11.48 6.95 14.27 Nil 0.32 3.21 1.54 39.79
6 Siwan 3.25 18.44 11.27 8.65 Nil 1.83 2.44 3.57 49.45
7 Darbhanga 3.69 16.85 12.66 0.05 Nil Nil 3.64 3.5 40.39
8 Rohtas 2.75 12.85 9.45 9.05 1 1.4 6.15 3.09 45.74
9 Kaimur 0.02 1.31 5.78 9.57 Nil 0.67 2.95 3.59 23.89
10 Sheikhpura 0.6 4.26 2.06 9.09 0.6 0.26 0.59 0.18 17.64
11 Lakhisarai 0.01 2.33 3.07 9.09 Nil 1.68 1.81 0.25 18.24
12 Madhubani 0.04 11.56 15.33 7.56 Nil Nil 2.2 1.59 38.28
Total 19.84 115.35 93.6 107.68 5.65 13.33 29.76 33.96 419.17
Appendix II : (Contd.)
Expenditure
Sl. No.
Name of ZP Xth FC
XIth FC
XIIth FC
SGRY NREGP MP/
MLA
Other scheme
Establishment
Expenditure
Total Expen-diture
Savings =
Receipt-Expend-
iture
1 Jahanabad 0.98 4.48 3.33 5.52 Nil 0.39 1.09 1.47 17.26 1.61
2 Arwal Nil 1.79 1.39 4.77 3 0.73 0.14 0.24 12.06 0.54
3 Nalanda 2.76 12.67 9.34 12.76 Nil 5.25 2.26 8.6 5.64 5.62
4 Saran 3.69 17.18 12.48 13.59 Nil Nil 2.56 3.7 53.2 1.82
5 Supaul 2.02 11.44 3.39 13.33 Nil 0.32 2.67 0.69 33.86 5.93
6 Siwan 3.25 17.51 5.62 8.65 Nil 1.82 2.2 3.19 42.24 7.21
7 Darbhanga 3.65 16.77 6.2 0.05 Nil Nil 4.56 1.74 32.97 7.42
8 Rohtas 2.72 12.75 4.62 6.76 Nil 0.82 4.3 2.95 34.92 10.82
9 Kaimur 0.02 1.29 2.83 9.38 Nil 0.66 3.09 2.8 20.07 3.82
10 Sheikhpura 0.6 4 1.01 8.93 0.6 0.26 0.3 NA 15.7 1.94
11 Lakhisarai 0 2.31 1.53 9.21 Nil 1.37 1.32 0.27 16.01 2.23
12 Madhubani 0.04 11.33 7.64 7.44 Nil Nil 1.6 1.74 29.79 8.49
Total 19.73 113.52 59.38 100.39 3.6 11.62 26.09 27.39 361.72 57.45

328
Appendix III : Receipt and Expenditure of Panchayat Samities (2001-02 to 2005-06)
(Rs lakh)
Receipt
Sl. No.
Name of P.S. District Xth FC
XIth FC
XIIth FC
SGRY NREP Other Total
Savings=
Receipt- Expend-
iture
1 Siwan Siwan 1.24 7.02 2.45 115.71 5.66 Nil 132.08 18.71
2 Mairwa Siwan 0.57 3.25 1.13 118.52 Nil Nil 123.47 30.92
3 Maharajganj Siwan 1.05 6.19 2.07 99.88 4.74 Nil 113.93 19.24
4 Hussainganj Siwan 1.13 6.41 2.24 141.11 Nil Nil 150.89 7.44
5 Siswan Siwan 0.92 4.55 1.82 91.65 Nil Nil 98.94 9.26
6 Pachrukkhi Siwan 1.61 31.97 2.46 128.86 6.65 Nil 171.55 25.33
7 Daraunda Siwan 1.08 6.12 2.14 119.48 5.94 Nil 134.76 35.70
8 Darauli Siwan 1.09 25.80 2.16 105.99 Nil Nil 135.04 20.41
9 Basantpur Siwan 0.63 14.90 1.25 56.94 Nil Nil 73.72 9.24
10 Lakri Naviganj Siwan 0.81 4.60 1.60 72.37 Nil Nil 79.38 14.38
11 Barhariya Siwan 1.96 11.24 3.86 187.68 Nil Nil 204.74 36.43
12 Guthani Siwan 0.82 4.76 1.62 59.05 Nil Nil 66.25 15.73
13 Ander Siwan 0.72 4.08 1.43 110.70 Nil Nil 116.93 23.23
14 Goriyakothi Siwan 0.80 7.50 2.75 133.04 Nil Nil 144.09 18.21
15 Raghunath pur Siwan 1.03 26.75 2.04 107.60 Nil Nil 137.42 15.19
16 Bhagwanpur Hat
Siwan 1.33 8.50 2.61 129.10 Nil Nil 141.54 25.32
17 Mohania Kaimur 1.34 11.14 2.31 237.17 Nil Nil 251.96 13.01
18 Chand Kaimur 0.78 4.64 1.33 139.50 Nil Nil 146.25 11.44
19 Durgawati Kaimur 2.53 5.24 1.54 143.69 Nil Nil 153.00 6.40
20 Nuawn Kaimur 0.73 3.82 1.25 104.11 Nil Nil 109.91 2.85
21 Chainpur Kaimur 2.07 9.68 1.90 176.28 Nil Nil 189.93 9.96
22 Bhabhua Kaimur 3.22 15.54 2.58 234.45 Nil Nil 255.79 26.68
23 Ramgarh Kaimur 0.80 8.45 1.37 134.11 Nil Nil 144.73 13.85
24 Adhaura Kaimur 0.37 1.04 0.59 121.05 Nil Nil 123.05 3.65
25 Rampur Kaimur 0.94 6.42 NA 107.20 Nil Nil 114.56 8.19
26 Kudara Kaimur 0.98 11.86 1.69 156.61 Nil Nil 171.14 12.45
27 Bhagwanpur Kaimur 1.16 2.85 0.86 146.33 Nil Nil 151.20 80.26
28 Jehanabad Jehanabad 0.97 4.38 1.66 178.53 19.14 Nil 204.68 25.02
29 Hulasganj Jehanabad 0.93 3.01 Nil 96.43 Nil Nil 100.37 5.92
30 Ratni Faridpur Jehanabad 0.94 5.66 1.63 113.16 16.35 Nil 137.74 34.40
31 Madanganj Jehanabad 0.85 2.73 0.92 89.53 Nil Nil 94.03 1.70

329
32 Ghoshi Jehanabad 1.07 3.46 1.17 121.06 Nil Nil 126.76 4.13
33 Makdumpur Jehanabad 1.42 8.31 2.48 273.07 Nil Nil 285.28 50.26
34 Kako Jehanabad 1.73 5.25 1.88 132.96 Nil Nil 141.82 7.91
35 Pratapganj Supaul 0.62 4.34 1.05 120.79 Nil Nil 126.80 48.19
36 Nirmali Supaul 0.46 2.59 0.78 142.24 Nil Nil 146.07 80.07
37 Raghopur Supaul 2.51 10.48 2.11 250.93 Nil Nil 266.03 62.56
38 Saraigarh Supaul 2.10 4.44 1.35 230.71 Nil Nil 238.60 116.22
39 Kishanpur Supaul 1.04 14.43 Nil 233.94 Nil Nil 249.41 54.74
40 Pipara Supaul 3.85 5.99 2.07 286.28 Nil Nil 298.19 36.25
41 Triveniganj Supaul 1.90 10.74 3.26 431.53 Nil Nil 447.43 68.37
42 Supaul Supaul 4.05 18.31 3.12 454.36 Nil Nil 479.84 8.45
43 Marauna Supaul 0.87 4.91 1.48 270.53 Nil Nil 277.79 188.50
44 Chhatapur Supaul 2.14 12.73 2.83 547.50 Nil Nil 565.20 84.91
45 Basantpur Supaul NA 9.26 1.73 144.62 Nil Nil 155.61 124.69
46 Pandaul Madhubani 2.05 15.07 2.87 173.41 Nil Nil 193.40 39.69
47 Rahika Madhubani 1.48 6.25 2.53 156.16 Nil Nil 166.42 6.71
48 Khajauli Madhubani 0.85 7.07 2.72 169.78 Nil Nil 180.42 20.06
49 Jainagar Madhubani 1.04 9.57 NA 119.38 Nil Nil 129.99 2.05
50 Basopatti Madhubani 1.04 3.80 1.77 86.33 Nil Nil 92.94 43.32
51 Madhwapur Madhubani 2.64 14.40 1.49 90.04 Nil Nil 108.57 8.84
52 Harlakhi Madhubani NA 5.34 1.99 44.19 Nil Nil 51.52 37.82
53 Bisfi Madhubani 2.01 12.80 3.43 126.20 Nil 11.29 155.73 32.09
54 Phulparas Madhubani 1.16 8.41 1.70 119.48 Nil Nil 130.75 42.90
55 Laukhi Madhubani 1.61 12.74 2.13 91.29 Nil Nil 107.77 42.00
56 Jhanjharpur Madhubani 1.06 6.24 1.82 72.53 Nil Nil 81.65 3.11
57 Lakhnaur Madhubani 1.03 4.74 1.76 114.93 Nil Nil 122.46 21.86
58 Babubarhi Madhubani 1.33 7.98 2.28 150.53 Nil Nil 162.12 4.49
59 Rajnagar Madhubani 1.53 9.21 2.61 184.19 Nil Nil 197.54 18.50
60 Madhepur Madhubani 1.67 19.13 2.85 155.53 Nil Nil 179.18 35.85
61 Ladaniya Madhubani 1.13 6.37 1.80 112.19 Nil Nil 121.49 23.10
62 Andhrathari Madhubani 2.63 10.01 4.92 193.87 Nil Nil 211.43 28.77
63 Ghoghardiha Madhubani 1.85 6.66 1.87 113.21 Nil Nil 123.59 25.60
64 Khutauna Madhubani 1.28 9.95 NA 88.16 Nil Nil 99.39 34.39
65 Benipatti Madhubani 2.19 12.98 3.75 201.15 Nil Nil 220.07 27.18
Total 88.74 574.06 122.86 10158.90 58.48 11.29 11014.33 2013.30

330
Appendix III : (Contd.)
Expenditure Sl. No.
Name of P.S. Xth F.C
XIth F.C XIIth F.C.
SGRY NREP Other Total
1 Siwan 1.23 6.93 1.15 104.06 Nil Nil 113.37
2 Mairwa 0.49 2.30 Nil 89.76 Nil Nil 92.55
3 Maharajganj 1.04 5.50 Nil 86.52 1.63 Nil 94.69
4 Hussainganj 1.10 5.27 1.98 135.10 Nil Nil 143.45
5 Siswan 0.92 3.04 1.15 84.57 Nil Nil 89.68
6 Pachrukkhi 1.43 28.07 1.28 115.44 Nil Nil 146.22
7 Daraunda 0.93 4.79 0.33 91.86 1.15 Nil 99.06
8 Darauli 0.99 25.55 Nil 88.09 Nil Nil 114.63
9 Basantpur 0.63 14.86 Nil 48.99 Nil Nil 64.48
10 Lakri Naviganj 0.81 3.83 Nil 61.16 Nil Nil 65.00
11 Barhariya 1.94 10.74 0.15 155.48 Nil Nil 168.31
12 Guthani 0.82 4.26 Nil 45.44 Nil Nil 50.52
13 Ander 0.72 3.00 Nil 89.98 Nil Nil 93.70
14 Goriyakothi 0.80 6.06 Nil 119.02 Nil Nil 125.88
15 Raghunath pur 1.00 26.46 1.14 93.63 Nil Nil 122.23
16 Bhagwanpur Hat 1.33 7.02 2.61 105.26 Nil Nil 116.22
17 Mohania 1.34 10.92 1.95 224.74 Nil Nil 238.95
18 Chand 0.78 1.46 Nil 132.57 Nil Nil 134.81
19 Durgawati 2.53 5.14 1.27 137.66 Nil Nil 146.60
20 Nuawn 0.73 3.71 0.20 102.42 Nil Nil 107.06
21 Chainpur 2.05 9.48 1.81 166.63 Nil Nil 179.97
22 Bhabhua 3.19 14.49 0.52 210.91 Nil Nil 229.11
23 Ramgarh 0.80 8.42 Nil 121.66 Nil Nil 130.88
24 Adhaura 0.32 0.96 Nil 118.12 Nil Nil 119.40
25 Rampur 0.87 5.60 NA 99.90 Nil Nil 106.37
26 Kudara 0.96 10.71 Nil 147.02 Nil Nil 158.69
27 Bhagwanpur 1.13 2.18 Nil 67.63 Nil Nil 70.94
28 Jehanabad 0.97 2.09 Nil 176.60 Nil Nil 179.66
29 Hulasganj 0.81 1.44 Nil 92.20 Nil Nil 94.45
30 Ratni Faridpur 0.90 2.46 Nil 96.91 3.07 Nil 103.34
31 Modanganj 0.80 2.62 Nil 88.91 Nil Nil 92.33
32 Ghoshi 1.02 2.67 Nil 118.94 Nil Nil 122.63

331
33 Makdumpur 1.42 6.30 Nil 227.30 Nil Nil 235.02
34 Kako 1.70 2.94 Nil 129.27 Nil Nil 133.91
35 Pratapganj Nil 1.01 Nil 77.60 Nil Nil 78.61
36 Nirmali 0.46 0.61 Nil 64.93 Nil Nil 66.00
37 Raghopur 1.26 1.41 Nil 200.80 Nil Nil 203.47
38 Saraigarh 1.76 1.54 1.00 118.08 Nil Nil 122.38
39 Kishanpur 1.03 6.30 Nil 187.34 Nil Nil 194.67
40 Pipara 3.51 3.73 Nil 254.70 Nil Nil 261.94
41 Triveniganj Nil 3.77 Nil 375.29 Nil Nil 379.06
42 Supaul 3.90 11.44 3.35 452.70 Nil Nil 471.39
43 Marauna 0.85 0.97 Nil 87.47 Nil Nil 89.29
44 Chaatapur 1.66 5.23 Nil 473.40 Nil Nil 480.29
45 Basantpur NA 1.43 Nil 29.49 Nil Nil 30.92
46 Pandaul 1.99 14.32 Nil 137.40 Nil Nil 153.71
47 Rahika 1.20 5.13 0.93 152.45 Nil Nil 159.71
48 Khajauli 0.66 6.29 2.72 150.69 Nil Nil 160.36
49 Jainagar 0.92 7.81 NA 119.21 Nil Nil 127.94
50 Basopatti 0.81 NA Nil 48.81 Nil Nil 49.62
51 Madhwapur 2.55 13.79 Nil 83.39 Nil Nil 99.73
52 Harlakhi NA 0.85 Nil 12.85 Nil Nil 13.70
53 Bisfi 0.75 5.27 Nil 107.31 Nil 10.31 123.64
54 Phulparas 0.57 2.28 Nil 85.00 Nil Nil 87.85
55 Laukhi 0.61 6.73 Nil 58.43 Nil Nil 65.77
56 Jhanjharpur 0.91 5.03 0.92 71.68 Nil Nil 78.54
57 Lakhnaur 0.92 5.17 Nil 94.51 Nil Nil 100.60
58 Babubarhi 1.29 5.77 0.85 149.72 Nil Nil 157.63
59 Rajnagar 1.53 .91 1.18 168.42 Nil Nil 179.04
60 Madhepur 1.25 12.24 Nil 129.84 Nil Nil 143.33
61 Ladaniya 1.28 3.59 1.18 92.34 Nil Nil 98.39
62 Andhrathari 2.39 6.97 3.80 169.50 Nil Nil 182.66
63 Ghoghardiha 1.82 4.85 Nil 91.32 Nil Nil 97.99
64 Khutauna 1.23 5.69 NA 58.08 Nil Nil 65.00
65 Benipatti 1.93 11.46 2.55 176.95 Nil Nil 192.89
77.54 419.86 34.02 8453.45 5.85 10.31 9001.03

332
Appendix IV : Position of Finances of Gram Panchayats for the period 2001-02 to 2005-06 (Rs lakh)
Receipt Sl. No.
Name of G.Ps.
Name of P.Ss. Xth FC XIth FC
XIIth FC
SGRY NREGP Others Total
1 Madhopur Maharaj ganj 1.04 6.20 - 10.20 0.72 - 18.162 Patedha -do- 1.04 5.68 1.76 7.01 0.26 0.77 16.523 Jigrawan -do- 1.04 5.68 1.76 8.10 0.46 0.88 17.924 Dipha Mairwa 1.04 6.18 1.76 9.65 - - 18.635 Muriyari -do- 1.04 6.02 1.76 10.49 - 0.90 20.216 Chotka Manjha -do- 1.04 5.99 1.76 10.23 - 0.94 19.967 Rampali Siwan 1.04 5.96 1.76 8.40 0.38 0.87 18.418 Makariyar -do- 1.04 5.99 1.76 10.02 0.56 0.87 20.249 Nathuchhap -do- 1.04 6.04 1.76 9.88 0.53 1.02 20.27
10 Chainpur Mubarakpur Siswan 1.04 5.91 1.76 11.30 - 0.98 20.9911 Bhikpur -do- 1.04 5.67 1.76 10.18 - 0.95 19.6012 Naya Gaon -do- 1.04 5.59 1.76 9.30 - 0.83 18.5213 Chanp Hussain ganj 1.04 5.96 1.76 9.41 - - 18.1714 Harihas (West) -do- 1.04 5.91 1.76 8.96 - 0.62 18.2915 Machkana -do- 1.04 5.73 1.76 6.91 - - 15.4416 Makhanpur Pachrukhi 1.04 5.33 1.76 10.19 0.46 - 18.7817 Sambhopur -do- 1.04 5.96 1.76 10.05 0.56 - 19.3718 Phalpura -do- 1.04 6.04 1.76 9.53 0.39 - 18.7619 Rajanpura Daraunda 1.04 5.86 1.76 9.34 - - 18.0020 Karsant -do- 1.05 5.91 1.76 8.79 0.45 - 17.9621 Madsara -do- 1.04 5.87 1.76 6.36 - - 15.0322 Harnahar Darauli 1.04 5.99 1.76 10.78 - 1.14 20.7123 Sarna -do- 1.04 5.81 1.76 8.16 - - 16.7724 Amarpur -do- 1.06 6.04 1.76 9.47 - 0.81 19.1425 Bahadurpur Barharia 1.04 6.01 1.76 11.01 - 0.77 20.5926 Hariharpur Lalgarh -do- 1.05 5.77 1.76 8.17 - 0.71 17.4627 Pakari -do- 1.04 5.63 1.76 7.99 - - 16.4228 Sonhua Guthni 1.04 5.97 1.76 10.80 - 0.98 20.5529 East Guthni -do- 1.04 5.91 1.76 8.86 - 0.83 18.4030 Balua -do- 1.04 5.86 1.76 9.30 - 1.00 18.9631 Bhopatpur Lakri Naviganj 1.04 5.89 1.76 12.53 - 0.99 22.2132 Khawaspur -do- 1.04 6.89 1.76 10.18 - 0.86 20.7333 Dumra -do- 1.04 6.07 1.76 9.77 -- 0.95 19.5934 Asawan Ander 1.04 5.81 1.76 7.91 - 0.96 17.4835 Narendrapur -do- 1.04 5.86 1.76 9.35 - 2.23 20.2436 Khendain -do- 1.04 5.71 - 9.56 - 0.98 17.2937 Majhwalia Goriya Kothi 1.04 6.11 1.76 11.74 - 0.96 21.6138 Barhoga Parsotim -do- 1.04 5.83 1.76 9.14 - 1.05 18.8239 Hariharpur -do- 1.04 5.84 1.76 8.46 - 0.96 18.0640 Brahmsthan Bhagwanpur
Hat 1.04 5.94 1.77 4.83 - 0.79 14.37
41 Gopalpur -do- - 6.15 1.77 10.58 - 0.69 19.1942 Bhikampur -do- 1.04 5.90 1.77 10.01 - - 18.7243 Wasaun Basantpur 1.05 6.61 1.77 11.94 - 0.95 22.3244 Rajapur -do- 1.05 5.87 1.76 11.56 - 0.84 21.0845 Wajuwar hotra -do- 1.04 5.86 1.76 9.52 - 0.93 19.1146 Chainpura Adhora 5.23 5.95 1.76 16.63 - 1.23 30.8047 Barban Kala -do- 6.36 5.81 1.76 17.02 - 2.44 33.3948 Sadaki -do- 10.36 5.57 1.78 21.00 - - 38.71

333
49 Jalalpur Rampur 1.04 6.00 1.76 19.66 - 6.36 34.8250 Pasai -do- 1.04 5.93 1.76 19.71 - 4.01 32.4551 Kudari -do- 6.45 - 1.76 18.22 - - 26.4352 Sasna Kudra 1.04 6.00 1.76 17.94 - 4.00 30.7453 Salathua -do- 1.04 6.34 1.77 14.10 - 3.98 27.2354 Siswar -do- 1.04 5.96 1.76 16.58 - 4.85 30.1955 Todi Bhagwanpur 1.07 7.69 1.76 19.99 - 4.50 35.0156 Bhagwanpur -do- 1.04 6.08 1.76 17.59 - - 22.9557 Saraiya -do- 1.04 5.97 1.76 14.07 - - 33.3858 Bahmaur Khas Mohania 1.05 5.97 1.76 21.02 - 3.58 36.7159 Bharkhar -do- 1.04 6.16 1.76 23.87 - 3.88 27.7660 Dadawan -do- 1.25 6.24 1.76 3.85 - 4.66 24.8661 Dulhi Chand 1.04 5.99 1.76 12.12 - 3.95 35.3862 Shivrampur -do- 1.04 6.22 1.76 22.30 - 4.06 33.4263 Parhi -do- 1.04 6.04 1.76 20.57 - 4.01 26.1564 Karnpura Durgawati 1.09 6.04 1.76 13.43 - 3.83 34.3465 Khajura -do- 1.05 6.02 1.77 17.64 - 7.86 35.5366 Chanu -do- 1.04 5.93 1.76 19.98 - 6.82 29.9067 Akhini Nuon 1.04 6.00 1.76 18.05 - 3.05 21.8868 Dunduna -do- 1.04 4.16 1.76 12.60 - 2.32 25.7769 Nuon -do- 1.04 6.28 1.76 12.57 - 4.12 21.9870 Ramgarh Chainpur 1.05 6.27 1.76 12.90 - - 35.8871 Barhauna -do- 1.05 6.14 1.76 22.43 - 4.50 35.8872 Merh -do- 1.04 5.85 1.77 17.23 - 4.17 30.0673 Dumdum Bhabhua 1.05 6.06 1.76 9.24 - 4.52 22.6374 Sikthi -do- 1.05 5.98 1.76 17.31 - 4.24 30.3475 Sonhan Bhabhua 1.05 6.38 1.76 15.72 - 5.93 30.8476 Sahadullahpur
Darwan Ramgarh 1.04 6.16 1.76 11.13 - 3.70 23.79
77 Aahiwas -do- 1.04 6.07 1.76 18.30 - 3.23 30.4078 Mahuwar -do- 1.05 6.04 1.76 20.77 - 3.25 32.8779 Sevnan Jehanabad 1.04 5.97 1.77 13.87 - 1.94 24.5980 Manday bigha -do- 1.04 6.09 1.76 15.95 - 1.96 26.881 Amain -do- 1.04 6.07 1.78 23.35 - 7.92 40.1682 Kaur Hulasganj 1.04 8.85 1.76 17.86 - 2.66 32.1783 Bouri -do- 1.04 5.91 1.76 17.65 - 1.75 28.1184 Tira -do- 1.04 5.60 1.76 21.47 - 1.41 31.2885 Kansua Ratni
Faridpur 1.04 5.91 1.76 14.38 - 2.55 25.64
86 Pandaul -do- 1.04 5.94 1.76 16.60 - 2.11 27.4587 Uchita -do- 1.04 5.92 1.76 16.05 - 2.42 27.1988 Devra Modanganj 1.04 5.91 1.76 16.77 - 2.30 27.7889 Gandhar -do- 1.04 5.96 1.76 17.80 - 2.27 28.8390 Jayatipur Kurua -do- 1.04 5.91 1.76 15.09 - 2.15 2591 Shahpur Ghoshi 1.04 5.91 1.76 19.68 - - 28.3992 Uber -do- 1.04 4.92 1.76 19.40 - - 27.1293 Parwan -do- 1.64 5.51 1.76 19.54 - - 28.4594 Kohra Makhdum
pur 1.04 5.91 1.76 15.09 - - 23.80
95 Solhanda -do- 1.04 5.90 1.76 25.50 - - 34.2096 Bela-bira -do- 1.04 6.95 1.76 21.24 - - 30.9997 North Serthu Kako 1.64 5.78 1.76 13.97 - - 23.1598 Bhawanipur South Pratapganj 1.05 5.91 - 22.16 - - 29.1299 Majhari Nirmali 1.04 8.83 1.76 18.61 - - 30.24

334
100 Dighia -do- 1.04 5.91 1.76 22.70 - - 31.41101 Bela Singermoti Nirmali 1.04 5.91 1.76 18.89 - - 27.60102 Boraha Raghopur 1.04 6.07 1.76 19.43 - 0.12 28.42103 Karjain -do- 1.04 5.97 1.76 - - - 8.77104 Piprahi -do- 1.04 4.71 1.76 28.59 - - 36.10105 Pipra Khurd Saraigarh Nil 8.83 1.77 24.53 - - 35.13106 Zilla Dumari -do- 1.04 6.02 1.77 16.04 - - 24.87107 Hanuman nagar -do- 1.05 5.95 1.76 11.77 - - 20.53108 Kathhara Kadampura Kisanpur 1.04 8.20 1.76 13.17 - - 24.17109 Dubiyahi -do- 1.04 5.95 1.76 17.17 - - 25.92110 Bouraha -do- 1.04 5.94 1.76 25.91 - - 34.65111 Ramnagar Pipra 1.07 8.54 1.76 14.79 - - 26.16112 Thumba -do- 1.05 7.76 1.77 19.21 - 0.12 29.91113 Maheshpur -do- 1.05 5.95 1.77 26.01 - 0.10 34.88114 Manganj West Triveniganj 1.05 6.05 1.76 19.48 - - 28.34115 Hariharpatti -do- 1.04 6.30 1.80 41.05 - - 50.19116 Pulwaha -do- 1.04 5.88 1.76 41.52 - - 50.20117 Kariho Supaul 1.04 8.02 1.76 25.80 - - 36.62118 Lokha -do- 1.04 6.09 1.76 22.00 - - 30.89119 Bairiya -do- 1.04 5.91 1.76 25.00 - 0.09 33.80120 Kadmaha Marauna 1.04 5.92 1.76 9.70 - - 18.42121 Sarojabela -do- 1.04 5.69 1.76 14.98 - 0.14 23.61122 Ghogharia -do- 1.04 5.88 1.76 26.26 - - 34.94123 Bhagwanpur Basantpur 1.04 8.85 1.76 25.87 - 0.13 37.65124 Basantpur -do- 1.04 5.98 1.76 27.71 - 0.14 36.63125 Parmanand pur -do- 1.04 6.00 1.76 31.90 - 0.12 40.82126 Mohammad ganj Chhatapur 1.05 5.91 Nil 38.72 - 0.10 45.78127 Chhatapur Chhatapur 1.05 6.00 1.76 20.67 - - 29.48128 Gwalpara -do- Nil 5.93 1.76 35.75 - - 43.44129 Sagarpur Pandaul 1.04 5.91 1.76 11.02 - 1.78 21.51130 Bolahi -do- 1.04 7.74 1.76 10.86 - 0.88 22.28131 Meghoul -do- 1.04 9.47 1.76 10.83 - 1.22 24.32132 Sanor Rahika 1.07 8.61 1.76 13.61 - 0.82 25.87133 Kakraul -do- 1.04 5.94 1.76 8.62 - 0.97 18.33134 Sapta -do- 1.04 7.70 - 7.63 - 0.99 17.36135 Khajauli Khajauli 1.04 6.41 1.76 8.39 - 1.65 19.25136 Datuwar -do- 1.04 6.02 1.77 10.07 - 1.04 19.94137 Bhakua -do- 1.06 5.95 1.76 7.37 - 1.01 17.15138 Selra Jaynagar 1.04 5.93 1.79 12.09 - 0.43 21.28139 Dodwar -do- 1.04 5.91 1.76 8.37 - 0.60 17.68140 Belhi (South) -do- 1.04 5.90 1.76 7.88 - 0.69 17.27141 Kataiya Bassopatti 1.07 5.88 1.76 8.17 - - 16.88142 Rajfet -do- 1.04 5.92 1.76 8.20 - 0.87 17.79143 Bassopatti (West) -do- 1.04 6.00 1.77 8.17 - 1.00 17.98144 Salempur Madhwapur 1.04 5.99 1.76 11.06 - 1.61 21.46145 Uttra -do- 1.04 6.05 1.76 12.15 - 0.71 21.71146 Balia -do- 1.04 5.90 1.76 6.35 - 1.13 16.18147 Kauna Barhi Harlakhi 1.05 7.19 1.76 5.52 - 0.48 16.00148 Chahuta Bisfi 1.05 5.91 - 7.05 - 0.84 14.85149 Khairibanka -do- 1.04 8.07 - 7.12 - 0.52 16.75150 Balha -do- 1.06 6.09 - 7.01 - 0.67 14.83151 Mahthour Khurd Phulparas 1.05 6.08 1.76 8.37 - 2.44 19.70152 Bathnaha -do- - 6.55 - 7.99 - - 14.54

335
153 Dairawan -do- 1.04 6.04 1.76 11.94 - 4.32 25.10154 Narhia North Laukahi 1.06 6.04 1.76 8.64 - - 17.50155 Narhia South -do- 1.07 4.78 1.77 2.86 - 1.23 11.71156 Laukahi -do- 1.06 6.07 1.76 10.70 - 0.61 20.20157 Balni Mehanth Jhanjharpur 1.04 5.95 1.76 14.86 - 0.16 23.77158 Lohna (North) -do- 1.04 5.97 1.76 4.93 - 1.11 14.81159 Raiyam East -do- 1.04 6.02 1.76 7.24 - 1.24 17.30160 Dwip West Lakhnaur 1.04 6.69 1.76 9.59 - - 19.08161 Tamuria -do- 1.06 6.05 1.76 8.30 - 1.14 18.31162 Kaithinia -do- 1.04 6.24 1.76 11.15 - 0.65 20.84163 Basha Babubarhi 1.05 5.90 1.76 6.21 - 0.94 15.86164 Chhorhi -do- 1.07 7.95 - 5.97 - 1.18 16.17165 Murhaddi -do- 1.04 5.95 1.76 11.03 - 1.15 20.93166 Pariharpur Rajnagar 1.04 6.10 1.76 5.97 - 1.02 15.89167 Chichari Kanoongo -do- 1.05 5.88 1.76 12.88 - 0.81 22.38168 Patwara South -do- 1.05 6.28 1.76 11.12 - 0.71 20.92169 Raj Madhepur East Madhepur 1.07 7.94 1.79 9.94 - 0.96 21.7170 Matras -do- 1.05 5.98 1.76 10.37 - 0.91 20.07171 Sunder Virajeet -do- 1.74 5.99 1.77 6.49 - 0.12 16.11172 Padma Ladania 1.04 6.04 1.77 6.56 - 0.96 16.37173 Dalokhar -do- 1.08 6.48 1.27 8.34 - 1.44 19.11174 Gidhwas -do- 1.07 6.07 1.76 9.98 - 0.90 19.78175 Andhrathri South Andhra thari 106 6.02 1.78 5.09 - 0.87 14.82176 Nanaur -do- 1.05 5.97 3.52 19.80 - 1.16 31.50177 Shiwa -do- 1.04 5.95 3.54 9.80 - 1.10 21.43178 Chhajana -do- 2.82 5.93 1.76 5.78 - 1.38 17.67179 Parsa North -do- 1.06 6.11 1.76 5.41 - 0.81 15.15180 Sangi -do- 1.06 5.93 1.76 6.75 - - 15.50181 Lalmania Khutauna 1.04 5.99 1.76 12.59 - 1.22 22.60182 Siktiyahi -do- 1.07 5.95 1.76 8.63 - 0.75 18.16183 Karmagh -do- 1.04 6.13 1.76 9.74 - 1.27 19.94184 Tyonth Benipatti 1.05 6.02 1.76 9.36 - 0.97 19.16185 Parkauli -do- 1.04 5.95 1.76 8.81 - 1.16 18.72186 Arer -do- 1.05 6.00 1.76 7.48 - 0.92 17.21187 Dairwan Kudra 1.04 6.04 1.76 11.94 - 4.32 25.10188 Sakari -do- 1.04 11.07 1.76 14.89 - 7.15 35.91189 Maura -do- 1.04 6.06 1.77 12.86 - 7.07 28.80190 Barahara Marauna 1.04 6.09 1.76 19.92 - 0.14 28.95191 Marauna South -do- 1.04 6.00 1.76 14.70 - - 23.50192 Marauna North -do- 1.04 6.03 1.76 16.08 - - 24.91193 Madhopur Khutauna 1.04 5.98 1.76 12.16 - 1.22 22.16194 Majhaura -do- 1.04 6.04 1.76 13.31 - 1.06 23.21195 Persahi (East) -do- 1.08 6.05 1.76 9.12 - 1.62 19.63
Total 226.60 1194.73 327.23 2669.36 4.77 253.34 4676.03

336
Appendix IV : (Contd.)
Expenditure
Sl. No
Name of G.Ps.
Xth FC XIth FC XIIth FC
SGRY NREGP Others Total
Savings =
Receipts –
Expend-iture
1 Madhopur 1.04 2.11 - 8.62 - - 11.77 6.39 2 Patedha 1.04 5.61 1.74 6.27 - 0.65 15.31 1.21 3 Jigrawan 1.02 5.61 Nil 6.89 - 0.80 14.32 3.60 4 Dipha 1.04 6.18 1.76 9.30 - - 18.28 0.35 5 Muriyari 1.04 5.58 1.71 9.22 - 0.89 18.44 1.77 6 Chotka Manjha 1.04 5.65 1.52 9.35 - 0.90 18.46 1.50 7 Rampali 1.03 5.92 1.60 8.24 - 0.79 17.58 0.83 8 Makariyar 1.04 5.91 1.72 9.81 - 0.80 19.28 0.96 9 Nathuchhap 1.04 5.79 Nil 8.84 - 0.52 16.19 4.08
10 Chainpur Mubarakpur
0.97 5.63 1.75 10.80 - 0.80 19.95 1.04
11 Bhikpur 1.02 5.54 1.35 9.44 - 0.81 18.16 1.44 12 Naya Gaon 1.02 5.22 0.15 8.60 - 0.13 15.12 3.40 13 Chanp 1.04 5.90 1.64 9.04 - - 17.62 0.55 14 Harihas (West) 1.04 5.83 1.70 8.76 - 0.59 17.92 0.37 15 Machkana 1.04 5.65 1.51 6.26 - - 14.46 0.98 16 Makhanpur 1.04 4.65 1.05 9.40 - - 16.14 2.64 17 Sambhopur 1.04 5.43 1.16 9.23 - - 16.86 2.51 18 Phalpura 1.02 5.86 1.58 9.46 0.22 - 18.14 0.62 19 Rajanpura 1.04 5.84 1.73 9.34 - - 17.95 0.05 20 Karsant 1.00 5.89 1.76 8.01 - - 16.66 1.30 21 Madsara 1.00 5.86 1.72 6.36 - - 14.94 0.09 22 Harnahar 0.88 4.69 1.65 9.43 - 0.98 17.63 3.08 23 Sarna 0.98 5.55 1.65 7.05 - - 15.23 1.54 24 Amarpur 0.91 5.74 1.69 8.91 - 0.80 18.05 1.09 25 Bahadurpur 1.04 5.98 1.69 10.15 - 0.74 19.60 0.99 26 Hariharpur
Lalgarh 1.02 5.77 1.75 7.04 - 0.56 16.14 1.32
27 Pakari 1.03 5.62 1.70 7.98 - - 16.33 0.09 28 Sonhua 1.04 5.19 1.32 9.58 - 0.97 18.10 2.45 29 East Guthni 1.04 5.46 1.41 8.35 - 0.83 17.09 1.31 30 Balua 1.04 5.72 1.30 8.03 - 1.00 17.09 1.87 31 Bhopatpur 1.02 5.84 1.75 12.22 - 0.93 21.76 0.45 32 Khawaspur 1.01 6.27 1.75 10.17 - 0.85 20.05 0.68 33 Dumra 1.03 6.07 1.76 9.7 - 0.91 19.47 0.12 34 Asawan 1.03 5.42 Nil 6.87 - 0.46 13.78 3.70 35 Narendrapur 1.03 5.41 0.95 8.82 - 2.00 18.21 2.03 36 Khendain 1.04 5.65 - 8.81 - 0.77 16.27 1.02 37 Majhwalia 1.02 6.07 1.75 11.68 - 0.86 21.38 0.23 38 Barhoga Parsotim 1.04 5.71 1.65 8.52 - 0.78 17.70 1.12 39 Hariharpur 1.02 5.82 1.73 7.81 - 0.96 17.34 0.72 40 Brahmsthan 1.04 5.90 1.75 4.77 - 0.79 14.25 0.12 41 Gopalpur - 6.08 1.44 10.57 - 0.69 18.78 0.41 42 Bhikampur 0.97 4.93 1.31 7.89 - - 15.10 3.62 43 Wasaun 1.04 5.85 1.69 11.72 - 0.92 21.22 1.10

337
44 Rajapur 1.04 5.81 1.60 10.05 - 0.80 19.30 1.78 45 Wajuwar hotra 1.03 5.72 1.39 8.72 - 0.66 17.52 1.59 46 Chainpura 5.08 5.40 1.15 16.42 - 0.62 28.67 2.13 47 Barban Kala 6.34 5.24 1.52 16.94 - 2.40 32.44 0.95 48 Sadaki 8.89 4.95 1.25 20.71 - - 35.80 2.91 49 Jalalpur 0.99 5.92 1.27 19.59 - 6.12 33.89 0.93 50 Pasai 1.04 5.32 1.50 19.69 - 3.31 30.86 1.59 51 Kudari 5.21 - 1.39 18.08 - - 2.68 1.75 52 Sasna 1.03 5.86 1.64 17.92 - 3.47 29.92 0.82 53 Salathua 1.04 6.31 1.76 14.10 - 3.69 26.90 0.33 54 Siswar 1.03 5.96 1.76 16.57 - 4.40 29.72 0.47 55 Todi 1.04 7.67 1.76 19.98 - 4.19 34.64 0.37 56 Bhagwanpur 1.04 5.99 1.16 17.07 - - 24.94 1.46 57 Saraiya 1.02 5.86 1.40 13.21 - - 21.64 1.31 58 Bahmaur Khas 1.04 6.08 1.47 20.99 - 3.33 32.67 0.71 59 Bharkhar 1.21 6.13 1.15 23.23 - 3.13 34.63 2.08 60 Dadawan 1.02 5.88 0.82 13.40 - 3.96 25.52 2.24 61 Dulhi 1.04 6.17 1.56 11.83 - 3.84 24.13 0.73 62 Shivrampur 1.02 5.87 1.43 21.75 - 3.79 34.18 1.20 63 Parhi 0.97 4.14 1.56 18.20 - 3.87 30.52 2.90 64 Karnpura 1.04 5.58 Nil 13.11 - 3.13 21.35 4.80 65 Khajura 1.04 5.89 1.57 17.46 - 7.33 32.98 1.36 66 Chanu 1.04 5.98 1.60 19.90 - 6.58 35.01 0.52 67 Akhini 1.04 4.09 1.75 18.05 - 2.78 29.60 0.30 68 Dunduna 1.03 6.19 1.72 12.60 - 2.10 21.55 0.33 69 Nuon 1.02 6.03 1.65 12.17 - 3.89 24.93 0.84 70 Ramgarh 1.05 6.09 1.49 11.51 - - 20.05 1.93 71 Barhauna 1.05 6.09 1.60 22.12 - 4.04 34.90 0.98 72 Merh 0.98 5.35 1.46 15.60 - 4.15 27.54 2.52 73 Dumdum 1.04 5.63 1.70 8.09 - 4.46 20.92 1.71 74 Sikthi 1.02 5.97 1.35 17.18 - 3.31 28.83 1.51 75 Sonhan 1.05 6.37 1.56 15.12 - 4.74 28.84 2.00 76 Sahadullahpur
Darwan 1.03 5.95 0.60 10.10 - 3.56 21.24 2.55
77 Aahiwas 1.04 5.48 1.45 16.76 - 2.69 27.42 2.98 78 Mahuwar 1.05 6.03 1.70 20.74 - 2.93 32.45 0.42 79 Sevnan 1.04 5.96 1.69 13.79 - 1.82 24.26 0.33 80 Manday bigha 1.02 5.74 1.65 15.91 - 1.34 25.66 1.14 81 Amain 1.01 5.58 1.20 23.03 - 7.35 38.17 1.99 82 Kaur 1.01 5.03 1.60 17.76 - 2.59 28.49 3.68 83 Bouri 0.96 5.05 0.05 17.23 - 0.89 24.18 3.93 84 Tira 0.83 5.29 1.12 19.13 - 0.79 27.16 4.12 85 Kansua 1.04 5.90 1.76 14.25 - 2.55 25.50 0.14 86 Pandaul 1.04 5.93 1.64 16.34 - 1.96 26.91 0.54 87 Uchita 1.04 5.89 1.50 16.03 - 2.27 26.73 0.46 88 Devra 1.01 5.62 0.96 16.63 - 1.59 25.81 1.97 89 Gandhar 1.02 5.96 Nil 17.80 - 2.10 26.88 1.95 90 Jayatipur Kurua 1.02 5.88 1.21 14.29 - 1.40 23.80 2.15 91 Shahpur 0.95 5.91 1.75 19.65 - - 28.26 0.13 92 Uber 0.64 3.57 1.30 18.98 - - 24.49 2.63 93 Parwan 1.64 5.50 1.61 19.52 - - 28.27 0.18 94 Kohra 0.76 5.86 1.16 14.88 - - 22.66 1.14 95 Solhanda 1.01 5.90 1.71 25.49 - - 34.11 0.09 96 Bela-bira 0.98 6.64 1.72 21.13 - - 30.47 0.52

338
97 North Serthu 1.64 5.75 1.76 13.91 - - 23.06 0.09 98 Bhawanipur South 1.01 5.90 - 22.14 - - 29.05 0.07 99 Majhari Nil 8.57 1.60 14.85 - - 25.02 5.22 100 Dighia Nil 3.16 Nil 14.30 - - 17.46 13.95 101 Bela Singermoti Nil 5.56 1.50 15.67 - - 22.73 4.87 102 Boraha 0.92 4.36 1.76 18.22 - 0.12 25.38 3.04 103 Karjain 0.99 4.76 0.15 - - - 5.90 2.87 104 Piprahi Nil 3.38 Nil 26.18 - - 29.56 6.54 105 Pipra Khurd Nil 6.89 1.69 24.31 - - 32.89 2.24 106 Zilla Dumari 0.99 5.99 1.74 15.94 - - 24.66 0.21 107 Hanuman nagar 099 5.83 1.73 11.72 - - 20.27 0.26 108 Kathhara Kadampura 0.82 6.69 1.75 13.14 - - 22.40 1.77 109 Dubiyahi 0.92 5.84 1.75 16.55 - - 25.06 0.86 110 Bouraha 0.87 5.11 0.01 25.89 - - 31.88 2.77 111 Ramnagar 1.04 8.37 1.36 6.74 - - 17.51 8.65 112 Thumba 1.03 6.73 1.67 19.11 - 0.12 28.66 1.25 113 Maheshpur 1.04 5.85 1.53 18.73 - 0.10 27.25 7.63 114 Manganj West 1.04 5.91 1.76 4.60 - - 13.31 15.03 115 Hariharpatti Nil 5.42 0.63 39.24 - - 45.29 4.9 116 Pulwaha 0.99 Nil Nil 41.29 - - 42.28 7.92 117 Kariho 0.74 7.62 1.69 24.60 - - 34.65 1.97 118 Lokha 0.87 4.77 1.05 16.94 - - 23.63 7.26 119 Bairiya 0.93 5.13 1.70 24.25 - 0.09 32.10 1.70 120 Kadmaha 0.15 5.27 Nil 7.73 - - 13.15 5.27 121 Sarojabela 0.58 3.37 1.40 14.80 - 0.14 20.29 3.32 122 Ghogharia 1.01 5.77 1.75 25.93 - - 34.46 0.48 123 Bhagwanpur 0.07 5.31 0.08 24.32 - 0.12 29.90 7.75 124 Basantpur Nil 5.53 1.25 27.28 - 0.13 34.19 2.44 125 Parmanand pur Nil 5.77 1.59 31.89 - 0.11 39.36 1.46 126 Mohammad ganj 0.99 5.05 Nil 38.14 - - 44.18 1.60 127 Chhatapur 0.99 5.49 1.15 18.86 - - 26.49 2.99 128 Gwalpara Nil 4.31 1.53 35.56 - Nil 41.40 2.04 129 Sagarpur 1.03 5.59 1.48 7.73 - 1.58 17.41 4.10 130 Bolahi 1.03 7.63 1.47 9.00 - 0.86 19.99 2.29 131 Meghoul 1.04 9.43 1.76 10.77 - 1.14 24.14 0.18 132 Sanor 1.04 8.58 1.73 13.59 - 0.68 25.62 0.25 133 Kakraul 1.04 5.87 0.97 6.31 - 0.66 14.85 3.48 134 Sapta 1.01 6.37 - 6.84 - 0.73 14.95 2.41 135 Khajauli 1.04 6.40 1.76 8.34 - 1.64 19.18 0.07 136 Datuwar 1.04 5.34 0.92 8.61 - 0.17 16.08 3.86 137 Bhakua 1.06 5.68 1.65 7.26 - 0.85 16.50 0.65 138 Selra 1.03 5.90 1.68 11.61 - 0.30 20.52 0.76 139 Dodwar 1.02 5.63 1.21 7.32 - 0.38 15.56 2.12 140 Belhi (South) 1.03 5.65 1.75 7.88 - 0.53 16.84 0.43 141 Kataiya 1.06 5.33 1.76 7.74 - - 15.89 0.99 142 Rajfet 1.04 5.92 1.68 7.27 - 0.67 16.58 1.21 143 Bassopatti (West) 0.91 5.71 1.60 8.01 - 0.79 17.02 0.96 144 Salempur 1.04 5.93 1.76 10.65 - 1.45 20.83 0.63 145 Uttra 1.04 5.92 1.76 10.26 - 0.66 19.64 2.07 146 Balia 1.03 5.78 0.97 6.11 - 1.00 14.89 1.29 147 Kauna Barhi 0.99 6.86 1.47 5.44 - 0.33 15.09 0.91 148 Chahuta 1.00 4.71 - 5.70 - 0.62 12.03 2.82 149 Khairibanka 1.03 7.74 - 6.94 - 0.31 16.02 0.73

339
150 Balha 1.03 5.95 - 5.99 - 0.47 13.44 1.39 151 Mahthour Khurd 1.04 6.07 1.76 8.35 - 2.35 19.57 0.13 152 Bathnaha - 6.30 - 6.54 - - 12.84 1.70 153 Dairawan 1.03 6.03 1.69 11.82 - 3.74 24.31 0.79 154 Narhia North 1.00 6.04 1.75 7.19 - - 15.98 1.52 155 Narhia South 1.06 2.85 1.33 3.68 - 1.02 9.94 1.77 156 Laukahi 0.95 5.47 1.29 8.61 - 0.18 16.50 3.70 157 Balni Mehanth 1.01 5.76 0.84 13.48 - 0.12 21.21 2.56 158 Lohna (North) 1.04 5.95 1.20 4.29 - 1.00 13.48 1.33 159 Raiyam East 0.99 4.88 1.38 5.43 - 0.82 13.50 3.80 160 Dwip West 0.80 6.67 1.11 7.93 - - 16.51 2.57 161 Tamuria 0.89 5.44 1.70 5.03 - 0.26 13.32 4.99 162 Kaithinia 1.04 4.96 1.70 8.91 - 0.46 17.03 3.81 163 Basha 0.98 5.89 1.75 5.91 - 0.84 15.37 0.49 164 Chhorhi 1.06 5.15 - 5.74 - 0.73 12.68 3.49 165 Murhaddi 1.04 5.94 1.71 9.20 - 1.11 19.00 1.93 166 Pariharpur 1.03 6.10 1.70 4.79 - 0.89 14.51 1.38 167 Chichari Kanoongo 1.03 5.86 1.74 12.76 - 0.78 22.17 0.21 168 Patwara South 1.04 6.16 1.75 9.45 - 0.49 18.89 2.03 169 Raj Madhepur East 1.05 7.43 1.76 9.47 - 0.87 20.58 1.12 170 Matras 0.99 5.89 1.73 10.01 - 0.77 19.39 0.68 171 Sunder Virajeet 1.03 5.98 1.73 5.23 - 1.03 15.00 1.11 172 Padma 0.85 6.01 1.53 5.99 - 0.68 15.06 1.31 173 Dalokhar 1.07 6.44 1.15 8.34 - 1.39 18.39 0.72 174 Gidhwas 1.06 6.06 1.74 9.98 - 0.82 19.66 0.12 175 Andhrathri South 1.05 5.63 1.76 4.18 - 0.69 13.31 1.51 176 Nanaur 1.05 5.78 Nil 7.29 - 1.09 15.21 16.29 177 Shiwa 1.03 5.42 2.03 8.45 - 1.00 17.93 3.50 178 Chhajana 2.81 5.91 1.70 4.80 - 1.26 16.48 1.19 179 Parsa North 1.04 5.87 0.96 4.70 - 0.75 13.32 1.83 180 Sangi 1.05 5.74 1.20 5.62 - - 13.61 1.89 181 Lalmania 1.00 5.96 1.07 10.67 - 0.73 19.43 3.17 182 Siktiyahi 1.02 5.66 1.63 8.36 - 0.38 17.05 1.11 183 Karmagh 0.89 5.94 - 7.46 - 1.18 15.47 4.47 184 Tyonth 1.05 5.96 1.58 8.32 - 0.81 17.72 1.44 185 Parkauli 1.03 5.79 1.75 8.47 - 1.14 18.18 0.54 186 Arer 0.93 5.99 1.59 6.10 - 0.53 15.14 2.07 187 Dairwan 1.03 6.03 1.69 11.82 - 3.74 24.31 0.79 188 Sakari 1.02 10.75 1.53 13.05 - 6.08 32.43 3.48 189 Maura 1.02 6.01 1.75 12.85 - 5.87 27.50 1.30 190 Barahara Nil 4.39 1.45 18.96 - Nil 24.80 4.15 191 Marauna South 0.58 4.80 0.90 14.62 - - 20.90 2.60 192 Marauna North 1.03 5.09 1.50 15.44 - - 23.06 1.85 193 Madhopur 1.01 5.27 - 10.14 - 1.09 17.51 4.65 194 Majhaura 1.04 3.86 - 10.20 - 0.41 15.51 7.70 195 Persahi (East) 0.93 6.03 1.20 8.73 0.60 17.49 2.14
205.34 1105.25 252.81 2476.85 0.22 219.11 4259.58 416.45

340
Appendix V : Details of Central Taxes Collected in Bihar (Rs. crore)
Tax Heads 2005-06 2006-07 2007-08 2008-09
(upto Dec., 2008)
Central Excise 3271.58 3398.88 3769.84 2724.51
Service Tax 83.79 156.04 195.48 136.62
Direct Tax
1 Corporate Tax 88.60 121.10 95.40 92.17
2 Income Tax 368.00 438.61 629.90 608.65
3 Fringe Benefit Tax 4.46 7.04 4.72 4.56
4 Securities Transaction Tax 0.00 0.00 0.00 0.00
5 Banking Cash Transaction Tax 0.05 0.03 0.07 0.06
6 Hotel Receipt / State Duty Tax 0.00 0.00 0.01 0.01
7 Interest / Expenditure Tax 0.12 0.18 0.44 0.42
8 Wealth / Gift Tax 0.20 0.30 0.17 0.16
9 Total 461.43 567.26 730.71 706.03
Customs Duty
1 Total Basic Duty 0.56 0.73 0.63
2 Total Additional Duty of Customs (CVD) 152.40 162.00 98.25
3 Total Special CVD 37.58 2.71 2.14
4 Total Special Addl. Duty of Customs
5 Addl. Customs Duty (Cess) on HSD
6 Addl. Customs Duty (Cess) on MS
7 Surcharge on Petroleum Goods on MS
8 National Calamity Contingent Duty (N C Duty) 0.55 0.42 0.31
9 Education Cess 3.30 4.29 3.61
10 Cess on Secondary and Higher Education 3.31 2.01
11 Others 5.97 3.44
12 Total Export Duty 40.51
13 Total Cess on Export 1.03 0.02 0.00
14 Total Other Receipts 4.48 3.18 2.33
15 Total Gross Revenue (1 to 14) 199.90 182.63 153.23
16 Refunds 0.22 - -
17 Drawback (Customs) 46.80 65.57 44.53
18 Total Net Revenue (15-16-17) 152.88 117.06 108.70
Note : For 2007-08 and 2008-09, the figures are of net taxes collected after deducting refunds.
XXX