economic status of the groundfish fisheries off alaska, 1996
TRANSCRIPT

NOAA Technical Memorandum NMFS-AFSC-85
Economic Status of theGroundfish Fisheries off Alaska, 1996
byR. K. Kinoshita, A. Grieg, and J. M. Terry
U.S. DEPARTMENT OF COMMERCENational Oceanic and Atmospheric Administration
National Marine Fisheries ServiceAlaska Fisheries Science Center
February 1998

NOAA Technical Memorandum NMFS
The National Marine Fisheries Service’s Alaska Fisheries Science Centeruses the NOAA Technical Memorandum series to issue informal scientific andtechnical publications when complete formal review and editorial processingare not appropriate or feasible. Documents within this series reflect soundprofessional work and may be referenced in the formal scientific and technicalliterature.
The NMFS-AFSC Technical Memorandum series of the Alaska FisheriesScience Center continues the NMFS-F/NWC series established in 1970 by theNorthwest Fisheries Center. The new NMFS-NWFSC series will be used bythe Northwest Fisheries Science Center.
This document should be cited as follows:
Kinoshita, R. K., A. Grieg, and J. M. Terry. 1998. Economic status ofthe groundfish fisheries off Alaska, 1996. U.S. Dep. Commer., NOAATech. Memo. NMFS-AFSC-85,91 p.
Reference in this document to trade names does not imply endorsement bythe National Marine Fisheries Service, NOAA.

Technical Memorandum NMFS-AFSC-85
Economic Status of theGroundfish Fisheries off Alaska, 1996
byR. K. Kinoshita, A. Grieg, and J. M. Terry
Socioeconomic TaskResource Ecology and Fisheries Management Division
Alaska Fisheries Science Center7600 Sand Point Way N.E., BIN C-15700
Seattle, WA 98115-0070
U.S. DEPARTMENT OF COMMERCEWilliam M. Daley, Secretary
National Oceanic and Atmospheric AdministrationD. James Baker, Under Secretary and Administrator
National Marine Fisheries ServiceRolland A. Schmitten, Assistant Administrator for Fisheries
February 1998

This document is available to the public through:
National Technical Information ServiceU.S. Department of Commerce5285 Port Royal RoadSpringfield, VA 22161
www.ntis.gov

Notice to Users of this Document
This document is being made available in .PDF format for the convenience of users; however, the accuracy and correctness of the document can only be certified as was presented in the original hard copy format.


iii
ABSTRACT
This report presents data which summarize various aspects of the economic
performance of the domestic groundfish fishery off Alaska. Generally, data are presented for
1992 through 1996. Limited catch, ex-vessel value, and export value data are included from
the early or mid-1980s through 1996 to depict the rapid development of the domestic
groundfish fishery in the 1980s. With the exception of the exports, Pacific halibut
(Hippoglossus stenolepis) is not included in this report because for management purposes
halibut is not part of the groundfish complex.
Compared to the report that was prepared a year ago, there have been major changes in
the data that are presented. The changes include a new source of ex-vessel prices for 1992-96,
more extensive bycatch data, and more detailed data on the size and level of activity of the
groundfish fleet.

V
CONTENTS
Page
Abstract. . . . . . . . . . . . . . . . . . . . . . . . . . . . . . . . . . . . . . . . . . . . . . . . . . . . . . iii
List of Figures . . . . . . . . . . . . . . . . . . . . . . . . . . . . . . . . . . . . . . . . . . . . . . . . . vii
List of Tables . . . . . . . . . . . . . . . . . . . . . . . . . . . . . . . . . . . . . . . . . . . . . . . . . . viii
Introduction . . . . . . . . . . . . . . . . . . . . . . . . . . . . . . . . . . . . . . . . . . . . . . . . . . . . . 1
Overview . . . . . . . . . . . . . . . . . . . . . . . . . . . . . . . . . . . . . . . . . . . . . . . . . . . . . . 2
Domestic Fishery . . . . . . . . . . . . . . . . . . . . . . . . . . . . . . . . . . . . . . . . . . . . . . . . 5
Markets . . . . . . . . . . . . . . . . . . . . . . . . . . . . . . . . . . . . . . . . . . . . . . . . . . . . . . 8
Citations . . . . . . . . . . . . . . . . . . . . . . . . . . . . . . . . . . . . . . . . . . . . . . . . . . . . . . 11

vii
List of Figures
1.
2.
3.
4.
5.
1.
2.
3.
4.
5.
6. Gulf of Alaska groundfish catch by species, gear, and target fishery, 1995-96.
7. Bering Sea and Aleutian Islands groundfish catch by species, gear, and target fishery,1995-96.
8. Gulf of Alaska groundfish discards by species, gear, and target fishery, 1995-96.
9. Bering Sea and Aleutian Islands groundfish discards by species, gear, and targetfishery, 1995-96.
10. Gulf of Alaska groundfish discard rate by species, gear, and target fishery, 1995-96.
Groundfish catch in the commercial fisheries off Alaska by species, 1988-96.
Ex-vessel value of the domestic fish and shellfish catch off Alaska, 1988-96.
Pacific Northwest and Alaska exports of edible fishery products by major productgroups, 1988-96.
Ex-vessel value of the domestic groundfish catch off Alaska by species, 1988-96.
Number of vessels that landed more than 25 tons of groundfish in the domestic fisheryoff Alaska by gear type, 1992-96
List of Tables
Ex-vessel value of the catch in the commercial fisheries off Alaska by species group,1982-96.
Value of Pacific Northwest and Alaska exports of edible fishery products or productgroups, 1982-96.
Groundfish catch in the commercial fisheries off Alaska by area and species, 1987-96.
Retained, discarded, and total groundfish catch off Alaska by area, gear, and species,1992-96.
Discards and discard rate of the groundfish catch by area, gear, and processing mode,1992-96.
11. Bering Sea and Aleutian Islands groundfish discard rate by species, gear, and targetfishery, 1995-96.

viii
12.
13.
14.
15.
16.
17.
18.
19.
20.
21.
22.
23.
24.
25.
26.
27.
28.
Prohibited species bycatch in the Gulf of Alaska by species, gear, and groundfish targetfishery, 1995-96.
Prohibited species bycatch in the Bering Sea and Aleutian Islands by species, gear, andgroundfish target fishery, 1995-96.
Prohibited species bycatch rates in the Gulf of Alaska by species, gear, and groundfishtarget fishery, 1995-96.
Prohibited species bycatch rates in the Bering Sea and Aleutian Islands by species,gear, and groundfish target fishery, 1995-96.
Groundfish catch off Alaska by area, gear, and species, 1992-96.
Groundfish catch off Alaska by area, processor category, and species, 1992-96.
Groundfish catch off Alaska by area, residency, and species, 1992-96.
Ex-vessel value of the groundfish catch off Alaska by area, gear, and species, 1992-96.
Ex-vessel value of the groundfish catch off Alaska by area, processor category, andspecies, 1992-96.
Ex-vessel value of the groundfish catch off Alaska by area, residency, and species,1992-96.
Ex-vessel prices in the groundfish fisheries off Alaska by area, gear, and species, 1992-96.
Number and total registered net tons of vessels that caught groundfish off Alaska byarea and gear, 1992-96.
Number of vessels that caught groundfish off Alaska by area, tonnage caught, andgear, 1992-96.
Numbers, mean length, and mean registered tons of vessels that caught groundfish offAlaska by area, vessel length class, catcher type, and gear, 1992-96.
Number of vessels that caught groundfish off Alaska by area, processor category,target, and gear, 1992-96.
Number of vessels that caught groundfish off Alaska by area, residency, target, andgear, 1992-96.
Number of vessels that caught groundfish off Alaska by month, area, catcher type, andgear, 1992-96.

ix
29.
30.
31. Production of groundfish products in the fisheries off Alaska by species, 1992-96.
32. Production of groundfish products in the fisheries off Alaska by species, product, andarea, 1992-96.
33.
34.
35.
36.
37.
38.
39.
40.
41.
42.
43.
44.
45.
Catcher vessel weeks of fishing groundfish off Alaska by area, vessel length class,gear, and target, 1992-96.
Catcher-processor vessel weeks of fishing groundfish off Alaska by area, vessel lengthclass, gear, and target, 1992-96.
Production of groundfish products in the fisheries off Alaska by species, product, andprocessing mode, 1992-96.
Annual wholesale prices of frozen fish blocks and fillets, F.O.B. East Coast, 1976-96.
Monthly wholesale prices of selected frozen fish blocks and fillets, F.O.B. East Coast,1994-96.
Monthly Japanese landing market price of selected groundfish by species, 1987-96.
Monthly Tokyo wholesale prices of selected products, 1987-96.
Annual exports of groundfish from Alaska, Washington, and Oregon customs districts,quantity, value, and average price, 1991-96.
Exports of groundfish from Alaska, Washington, and Oregon customs districts to majorcountries, quantity, percent change from 1995 to 1996, and average price, 1995-96.
U.S. imports of groundfish fillets, steaks, and blocks, 1976-96, quantity and value.
U.S. per capita consumption of fish and shellfish, 1970-96.
U.S. consumption of all fillets and steaks, and fish sticks and portions, 1980-96.
Annual U.S. economic indicators: Selected producer and consumer price indexes,1976-96.
Monthly U. S . economic indicators: Selected producer and consumer price indexes,1994-96.
Annual foreign exchange rates for selected countries, 1976-95 in national currencyunits per U.S. dollar.

X
46. Monthly foreign exchange rates for selected countries, 1994-96 in national currencyunits per U.S. dollar.
47. Monthly U.S. cold storage holdings of selected groundfish blocks, 1994-96.
48. Monthly U.S. cold storage holdings of selected groundfish fillets, 1994-96.
49. Monthly West Coast cold storage holdings of selected groundfish products, 1994-96.

INTRODUCTION
The domestic groundfish fishery off Alaska has become an important segment of the U.S.
fishing industry. With a total catch of 2.05 million metric tons (t), a retained catch of 1.77
million t, and an ex-vessel value of $538 million in 1996, it accounted for 40.8% of the catch
and 15.6 % of the ex-vessel value of the catch off U.S. shores. The value of the 1996 catch after
primary processing was estimated at $1.23 billion.
The fishery management and development policies for the Bering Sea/Aleutian Islands
area and Gulf of Alaska groundfish fisheries have resulted in high levels of catch, ex-vessel
value, processed product value, exports, employment, and other measures of economic activity.
However, open access management and the use of the race for fish as the principal mechanism
for allocating the groundfish quotas and prohibited species catch limits among competing fishing
operations have increased harvesting and processing costs; decreased the quantity and value of
the resulting seafood products; and resulted in user conflicts that have dominated the North
Pacific Fishery Management Council’s meeting agendas, decreased the time and resources
available to address conservation issues, and increased the complexity, cost, and intrusiveness of
fishery management.
This report presents the economic status of groundfish fisheries off Alaska in terms of
economic activity and outputs using estimates of catch, bycatch, ex-vessel prices and value, the
size and level of activity of the groundfish fleet, the weight and value of processed products,
wholesale prices, exports, and cold storage holdings. The catch, ex-vessel, ex-processor, and
fleet size and activity data are for the fishing industry activities that are reflected in Weekly
Production Reports, Observer Reports, fish tickets from processors who file Weekly Production
Reports, and the annual survey of groundfish processors. All catch data for 1991-96 are now
based on the blend estimates of total catch which are used by the National Marine Fisheries
Service (NMFS) to monitor groundfish and prohibited species catch (PSC) quotas during each
fishing year.

2
External factors which, in part, determine the economic status of the fisheries are also
included. These include foreign exchange rates, the prices and price indexes of products that
compete with products from these fisheries, and fishery imports. This report updates last year’s
document (Kinoshita et al. 1997) and is intended to serve as a reference document for those
involved in making decisions with respect to conservation, management, and use of these fishery
resources.
A brief overview of the economic status of the fisheries is followed by a more complete
description of the status of the domestic fisheries in terms of the types of information listed
above. The qualifications made in both the verbal description of the fisheries and the footnotes
to the tables are critical in helping to avoid misunderstanding the information contained in this
report.
OVERVIEW
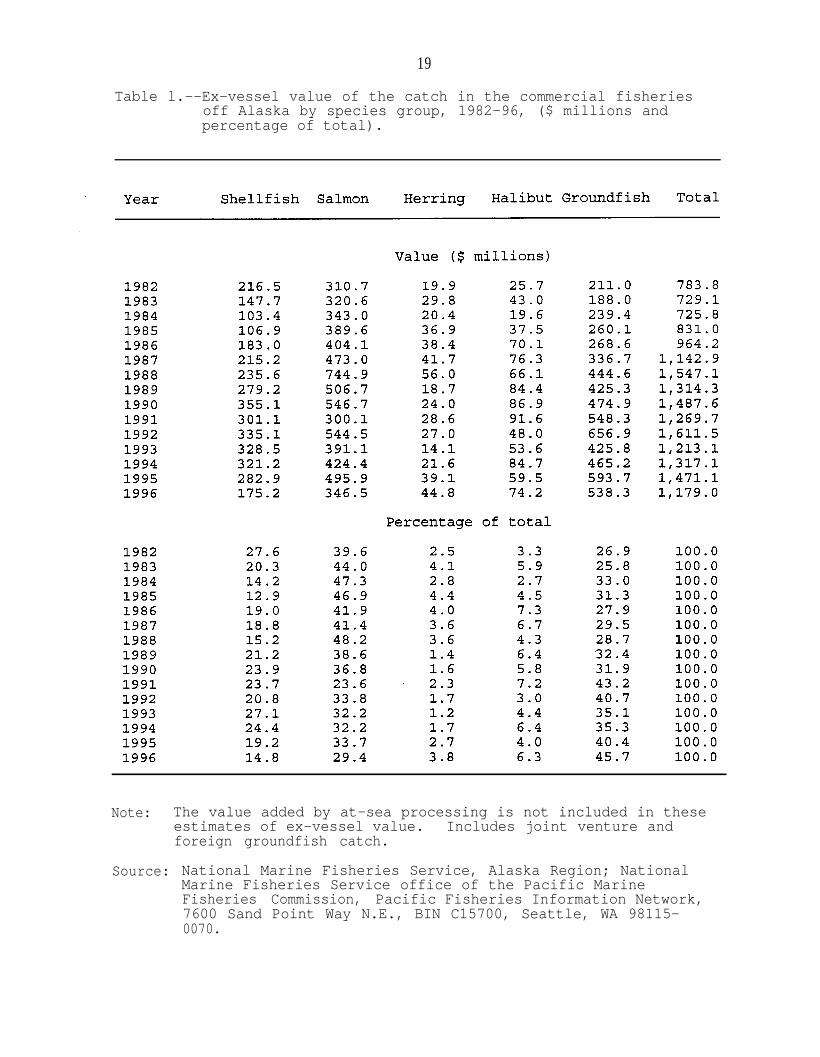
The commercial groundfish catch off Alaska totaled 2.05 million t in 1996, off 4.3 %
from 1995 (Fig. 1). The decrease in catch was accompanied by a 6 % decline in the average ex-
vessel price of groundfish and the estimated ex-vessel value of the catch, excluding the value
added by at-sea processing, declined by 9.3% from $594 million in 1995 to $538 million in 1996
(Table 1). The value of the 1996 catch after primary processing was estimated at $1.23 billion.
The groundfish fisheries accounted for the largest share of the ex-vessel value of all commercial
fisheries off Alaska in 1996 (45.7%), while the Pacific salmon (Oncorhynchus spp.) fishery was
second with $346 million or 29.4% of the total Alaska ex-vessel value (Fig. 2 and Table 1).
The value of the shellfish catch amounted to $175 million or 14.8% of the total for Alaska.
The exports of groundfish products from the Pacific Northwest and Alaska have been the
driving force behind the growth of the groundfish fisheries off Alaska. The value of edible
groundfish exports, including Pacific halibut (Hippoglossus stenolepis), increased from $126
million in 1986 to $1.11 billion in 1992, and totaled $916 million in 1996 (Fig. 3 and Table 2).

3
Exports of groundfish in 1996 accounted for 48.6% of all edible fishery products from the
Pacific Northwest and Alaska, followed by salmon exports with $645 million or 34.2%) and crab
exports, with $154 million or 8.2 % of the total.
During the last 10 years, the total catch in the commercial groundfish fisheries off Alaska
(including foreign and joint venture fisheries as well as the domestic fishery) varied between 1.85
and 2.38 million t (Table 3). The peak catch occurred in 1991, in part, because blend estimates
of catch and bycatch were not yet used to monitor most quotas. If they had been, several
fisheries would have been closed earlier in the year. There are three reasons why the catch
estimates for 1988 through 1990 have a significant downward bias compared to the estimates for
the other years. First, the domestic fishery accounted for a large part of total catch in 1988
through 1990. Second, discards were not included in the reported estimates of domestic catch
prior to 1991. Based on estimates of the discard rates for 1992 through 1995, discards would
have been about 16% of total catch. Finally, the blend estimates of catch, excluding at-sea
discards, tend to exceed the estimates based solely on industry reports and prior to 1991 only
industry reports were used to estimate retained catch in the domestic fishery. Variations in the
catch estimates also reflect changes in the total allowable catch (TAC), area closures, and bycatch
restrictions.
Walleye (Alaska) pollock (Theragra chalcogramma) has been the dominant species in the
commercial groundfish catch off Alaska. The pollock catch in 1996 totaled 1.27 million t and
accounted for 62 % of the total groundfish catch of 2.05 million t (Table 3). The pollock catch
was down 9.1% from 1995. The next major species, Pacific cod (Gadus macrocephalus),
accounted for 309,000 t or 15 % of the total 1996 groundfish catch. The Pacific cod catch was
down slightly from a year earlier. The 1996 catch of flatfish, which includes yellowfin sole
(Pleuronectes asper), rock sole (Pleuronectes bilineatus), and arrowtooth flounder (Atheresthes
stomias) was 276,800 t in 1996, up 4.4% from 1995. Pollock, Pacific cod, and flatfish
comprised 90.5% of the total 1996 catch. Other important species are sablefish (Anoplopoma

4
fimbria), rockfish (Sebastes and Sebastolobus spp.), and Atka mackerel (Pleurogrammus
monopterygius) .
Table 4 lists the blend estimates of the retained, discarded, and total catch by gear, area,
and species. Table 5 lists the discards and discard rates by gear, processing mode, and area.
The differences in discard rates by gear and processing mode are explained, in part, by
differences in target species. Tables 6 and 7 break down the catch by species, area, gear, and
target fishery. Tables 8 to 11 break down the discards and discard rates by area, species, gear,
and target fishery. The discard rates vary by gear and target species. For the Gulf of Alaska,
the overall groundfish discard rates were 8%) 1%, and 24%, respectively, for hook and line, pot,
and trawl gear in 1996. The corresponding groundfish discard rates for the three gear types in
the Bering Sea/Aleutian Islands area were 16 % , 4 % , and 13 % . Tables 12 to 15 present bycatch
and bycatch rates for crab, halibut, herring, and salmon by area, target species, and gear.
Exchange rates and world supplies of fishery products play a major role in international
trade. Exchange rates change rapidly and can significantly affect the economic status of the
groundfish fisheries. There is also considerable uncertainty concerning the future conditions of
stocks and the resulting quotas. The management actions taken to allocate the catch between
various user groups can significantly affect the economic health of either the domestic fishery as
a whole or segments of the fishery. Additional management actions that will decrease groundfish
catches or increase operating costs may result from continued concerns with: 1) the bycatch of
crab, halibut, salmon, and Pacific herring (Clupea pallasi); 2) the discard and utilization of
groundfish catch; and 3) the effects of the groundfish fisheries on marine mammals. Relatively
low guideline harvest levels for the three largest crab fisheries have resulted in more fishing
vessels from the crab fisheries participating in the groundfish fisheries.

5
DOMESTIC FISHERY
Trawl, hook and line, and pots are the principal types of gear used in the domestic
groundfish fishery. Annual catch for virtually every gear group, area, and species increased
dramatically from 1985 to 1991 as the domestic fishery replaced the foreign and joint venture
fisheries. In the last 5 years, the trawl catch averaged 91.8% of the total catch, while the catch
with hook and line gear accounted for 6.9% (Table 16). Most species are harvested
predominately by one type of gear, which typically accounts for 90% or more of the catch. The
one exception is Pacific cod, where in 1996, 51.4% (159,000 t) was taken by trawls, 34%
(105,000 t) by hook and line gear, and 14.6% (45,000 t) by pots.
Catch for at-sea processing increased from 106,200 t in 1986 to 1,659,000 t in 1992, and
decreased to 1445,000 t by 1996 (Table 17). The catch for on-shore processing increased from
61,500 t in 1986 to 621,000 t in 1992 and was 608,000 t in 1996. The relative catch of these
two types of operations vary by area and by species. In the Bering Sea/Aleutian Islands area,
catch for at-sea processing exceeded that taken for on-shore processing for each species. In the
Gulf of Alaska, catch for on-shore processing accounted for 70.7% of the total and, with the
exception of flatfish and rockfish, accounted for the majority of the catch of each species.
Catch data by residency of vessel owners are presented in Table 18. These data were
extracted from the NMFS groundfish fish ticket and blend catch databases and from the State of
Alaska vessel registration file which includes the stated residency of each vessel owner. For the
domestic groundfish fishery as a whole, 87.7% of the 1996 catch was made by vessels with
owners who indicated that they were not residents of Alaska. Vessels with owners who indicated
that they were residents of Alaska accounted for 8.2% of the catch and the remaining 4.1% of
the catch was taken by vessels for which the residence of the owner was not known. The catches
of the three vessel residence groups were much closer to being equal in the Gulf where Alaskan
vessels accounted for the majority of the Pacific cod catch.

6
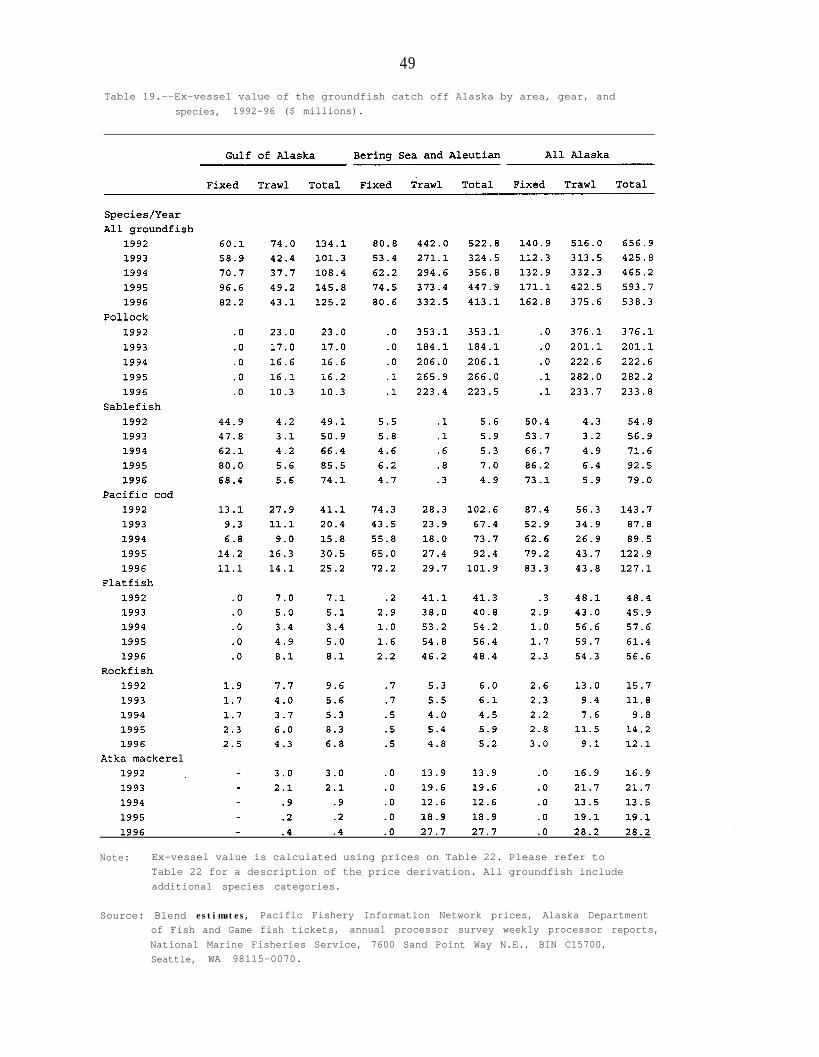
The ex-vessel value of the domestic landings, excluding the value added by at-sea
processing, declined from $657 million in 1992 to $594 million in 1995, and was $538 million in
1996 (Fig. 4 and Table 19). The ex-vessel value in 1996 dropped by 9.3 % from a year earlier,
while catch was down 3.5 %. Pollock was the dominant species with 43.4% of the total ex-vessel
value, while accounting for 67.3 % of the quantity. Sablefish accounted for 14.7 % of the value
compared with only 1.1% of the catch, and Pacific cod represented 23.6 % of the value and
15.4% of the catch.
The 1996 ex-vessel value of the landings for at-sea processing and on-shore processing
were $339 million and $199 million, respectively (Table 20). The dominance of at-sea
processing is less when it is measured in terms of ex-vessel value than when it is measured in
terms of catch. Although catch for at-sea processing accounted for 70% of the catch (Table 17),
it accounted for only 63 % of the ex-vessel value (Table 20). This is because the on-shore
processors have received a product mix with a larger proportion of higher priced species,
including sablefish.
The percentage of catch taken by Alaskan vessels is also greater when measured in terms
of ex-vessel value rather than in terms of weight, however the ex-vessel value of the landings is
dominated by vessels with owners who indicated that they were not residents of Alaska. The
estimated ex-vessel values of the 1996 catch of Alaskan vessels, other vessels, and vessels of
unknown residence were $85.6 million (15.9%), $424.2 million (78.8%), and $28.6 million
(5.3 % ) , respectively (Table 21).
The overall weighted average ex-vessel price, excluding the value added by at-sea
processing, declined in 1993 from the previous year, rebounded in 1994 and 1995, and declined
from $0.147 per pound in 1995 to $0.138 per pound, round weight in 1996. The average price
of pollock fell from $0.099 per pound in 1995 to $0.089 in 1996 (Table 22). The average price
of sablefish was slightly lower than a year earlier. Pacific cod prices were up 1.9%) and Atka

7
mackerel prices increased by 12.4%. Average prices of flatfish and rockfish in 1996 were down
by 14.4% and 24.3%, respectively from 1995.
The number of vessels harvesting groundfish off Alaska declined from a peak of 2,243
vessels in 1992 to 1,686 in 1996 (Table 23). Table 24 breaks out the number of vessels into
three classes by the amount of groundfish caught. From 1992 to 1996, the number of trawl
vessels that caught more than 25 tons of groundfish declined from 291 in 1992 to 267 in 1996
(Table 24, Fig. 5). The number of vessels using hook and line gear that caught more than 25
tons of groundfish declined from 412 in 1992 to 316 vessels in 1996. The number of vessels
using pot gear that caught more than 25 tons of groundfish decreased from 131 in 1992 to 78 in
1993 and then increased to 160 in 1996.
The numbers of vessels harvesting groundfish are presented by length class in Table 25,
by processor category in Table 26, and by residency of vessel owner in Table 27. The
seasonality of vessel deployment is depicted in Table 28 which gives the number of vessels that
harvested groundfish by month, area, and gear. Tables 29 and 30 give the number of vessel
weeks for catcher and catcher-processor vessels.
Data on production of groundfish products by species are presented in Tables 31 to 33.
The total value in 1996 declined by 11.5 % to an estimated $1.23 billion from $1.39 billion in
1995. The decline in prices of major groundfish exports in 1996, pollock surimi and pollock
roe, account for the drop in product value for 1996. Production of pollock surimi declined by
9.7 % in 1996 to 160,900 t, while the value declined by 32 % to $298 million. Pollock roe
production fell by 8.8% to 14,500 t, and the value dropped by 19% to $176 million. Production
of cod products was slightly higher, and the value was 3 % above the previous year’s levels.

8
MARKETS
Annual and monthly wholesale prices for selected groundfish products F.O.B. East Coast
are reported in Tables 34 and 35, respectively. After increasing in 1995, cod block prices
declined by 15.2% in 1996. Annual average prices of cod fillets in 1996 were down 1.0% from
1995. Domestic pollock block prices in 1996 fell by 5.5 % after increasing in 1995. The
Japanese landed and wholesale prices in Tables 36 and 37 were generally higher for groundfish
products in 1996, except for Alaska pollock and surimi. Japanese wholesale prices of surimi
were down 8 % from 1995.
Exports of edible groundfish products from Oregon, Washington, and Alaska customs
districts in 1996 amounted to 889 million lb and $916 million. These exports were 6.6% higher
by quantity but down 7% by value from the previous year. The increase in the value of
groundfish exports resulted primarily from lower surimi and cod prices. Groundfish exports in
1996 included $97 million of cod products, $88 million of sablefish, $110 million of flatfish
(including $16 million of halibut), $167 million of roe, and $324 million of “other” fishery
products which was dominated by $265 million of surimi (Tables 38 and 39).
Japan continued to dominate the U.S. export market of edible fishery products, and the
top four countries in 1996 purchased 92% of the total. Japan imported $706 million of
Northwest and Alaska edible groundfish products or 77% of the total value of $916 million. The
Republic of Korea was a distant second with purchases of $104 million or 11% of the total.
Canada was the third largest importer with $37.2 million, followed by the People’s Republic of
China with $20.4 million.
In addition to exports of edible fishery products, there were exports of other products.
Some products are non-edible, while others are listed by Customs as non-edible although, when
highly refined, they may be consumed by humans such as fish oils, fish liver oils, seaweed and
other algae, and thickeners derived from kelp. These products totaled $69.8 million; ranked by

9
value, they include fish meal ($28.2 million), fish products unfit for human consumption ($12.2
million), fish meal for human consumption ($10.9 million), and fish oils ($8.4 million).
The economic status of these fisheries is also dependent on U.S. imports of competing
fishery products. The import data in Table 40 provide information on both the potential level of
import substitution that might be possible and the prices with which domestic products compete.
Imports of groundfish blocks and fillets in 1996 totaled 457 million pounds and valued at $620
million. Imports of blocks and fillets in 1996 were up 3.4 % by quantity and down 4.6 % by
value from a year earlier and down by about one-half from their peak in 1987.
Changes in the size of the domestic market are reflected by the upward trend in U.S. per
capita consumption of fishery products from 12.5 pounds per capita in 1980 to 16.2 pounds in
1987. Since 1987, per capita consumption has declined, and stood at 14.8 pounds in 1996. Per
capita consumption of fresh and frozen fish and shellfish increased from 7.9 pounds in 1980 to
10.0 pounds in 1996. Per capita consumption of fresh and frozen fish and shellfish was
unchanged from a year earlier, while per capita consumption of canned fish increased by 0.2
pounds from 1995 (Table 41). Not all seafood products have exhibited an increase in per capita
consumption. While per capita consumption of fillets and steaks increased by 32% between 1980
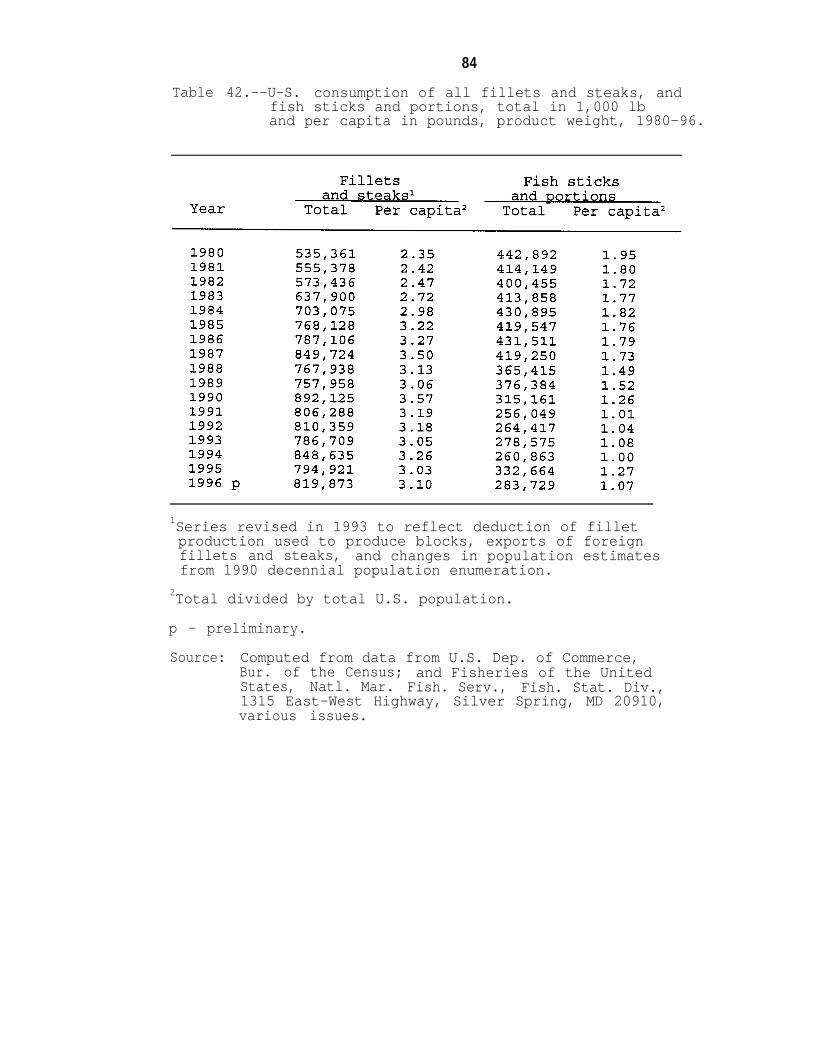
and 1996, consumption of fish sticks and portions declined by 45 % (Table 42). However, since
1987, per capita consumption of fillets and steaks has declined 11.4 % to 3.1 pounds, and stick
and portion consumption has declined 38 % to 1.07 pounds in 1996.
Fishery products from the groundfish fisheries off Alaska compete in domestic markets
with other fishery products, meat, poultry, and other food products. The producer and consumer
price indexes for these products are presented in Tables 43 and 44. In 1996, the producer price
index (PPI) increased by 2.3 % from 1995, while the consumer price index (CPI) rose 3 % from
the previous year. The increase in the CPI continues to be below the annual average increase of
4.7 % in the 1980s. Consumer price indexes for meat and poultry increased by 3.5 % and 6.3 % ,
respectively, in 1996, while fish and shellfish prices rose by only 0.8%.

10
Due to both the large amount of groundfish that is exported from the fisheries off Alaska
and the large quantities of imported products that compete in the domestic market, foreign
exchange rates have significant effects on the prices in these fisheries. In 1996, the value of the
U.S. dollar was stronger compared to the Japanese yen and the Republic of Korea’s won, and
was slightly weaker against the Canadian dollar from the previous year (Tables 45 and 46). The
annual value of the U.S. dollar relative to the Japanese yen increased 15.6 % to 108.8 yen to the
U.S. dollar from 94.1 yen in 1995. The stronger U.S. dollar makes U.S. exports more
expensive in Japan. The U.S. dollar in 1996 was down 0.6% relative to the Canadian dollar and
gained 4.3 % relative to the Korean won from 1995.
The levels of fishery product cold storage holdings provide another measure of the
condition of groundfish markets. U.S. holdings of selected groundfish blocks and fillets are
reported in Tables 47 and 48. U.S. cold storage holdings of groundfish blocks and fillets on 31
December 1996 were up 5.4% from a year earlier and down 10.5% compared with the 1991-95
average 31 December holdings.
While U.S. holdings offer an overall view of the U.S. groundfish market, West Coast
holdings provide a regional view of the supply of West Coast groundfish products (Table 49).
Holdings of pollock blocks and fillets, cod fillets, surimi, and analog products on the West Coast
have grown with increases in production over the last 5 years. Holdings of pollock blocks and
fillets on 31 December 1996 were down 10% from a year earlier, cod fillets were 76% lower,
holdings of surimi were down 26.7 % , while analog products were down 23.8 % from a year
earlier.

11
CITATIONS
Kinoshita, R. K., A. Greig, D. Colpo, and J. M. Terry. 1997. Economic status of thegroundfish fisheries off Alaska, 1995. U.S. Dep. Commer., NOAA Tech. Memo.NMFS-AFSC-72, 91 p.
National Marine Fisheries Service. 1997. Fisheries of the United States, 1996. U.S. Dep.Commer., Current Fish. Stat. No. 9600, July 1997, 169 p. Available Sup. Doc.,U.S. Gov. Print. Off., Washington, DC 20402.

Figure 1.--Groundfish catch in the commercial fisheries off Alaska by species, 1988-96.

Figure 2.--Ex-vessel value of the domestic fish and shellfish catch off Alaska, 1988-96.

Figure 3 .--Pacific Northwest and Alaska exports of edible fishery products by major productgroups, 1988-96.

Figure 4.--Ex-vessel value of the domestic groundfish catch off Alaska by species, 1988-96.

Figure 5.--Number of vessels that landed more than 25 tons of groundfish in the domesticfishery off Alaska by gear type, 1992-96.
19
Table l.--Ex-vessel value of the catch in the commercial fisheriesoff Alaska by species group, 1982-96, ($ millions andpercentage of total).
Note: The value added by at-sea processing is not included in theseestimates of ex-vessel value. Includes joint venture andforeign groundfish catch.
Source: National Marine Fisheries Service, Alaska Region; NationalMarine Fisheries Service office of the Pacific MarineFisheries Commission, Pacific Fisheries Information Network,7600 Sand Point Way N.E., BIN C15700, Seattle, WA 98115-0070.

20
Table 2.--Value of Pacific Northwest and Alaska exports of ediblefishery products or product groups ($ millions andpercentage of tota1), 1982-96.
Notes: * Other fresh, frozen, canned, cured, roe, and processedfinfish excluding salmon, herring, and other nongroundfishspecies.Discrepancies in totals are due to rounding.
Sources: U.S. Dep. Commer., Bur. of the Census; database fromNational Marine Fisheries Service, Fish. Stat.. Div.,Silver Spring, MD 20910; Alaska Fisheries Science Center,7600 Sand Point Way N.E., BIN C15700, Seattle, WA 98115-0070.

21
Table 3.--Groundfish catch in the commercial fisheries off Alaska by area and species,
1987-96 (1,000 metric tons, round weight).
Notes: Totals may include additional categories.
Source: Blend estimates for 1991-96. Processor reports and fish tickets for 1987-90.National Marine Fisheries Service, 7600 Sand Point Way N.E., BIN C15700,
Seattle, WA 98115-0070.

22
Table 4.--Retained, discarded, and total groundfish catch off Alaska by area, gear,
and species 1992-96, (1,000 metric tons, round weight).

23
Table 4.--Continued.

24
Table 4.--Continued.
Notes : All groundfish and all gear may include additional categories.
Source: Blend estimates, National Marine Fisheries Service, 7600 Sand Point Way N.E.,
BIN C15700, Seattle, WA 98115-0070.

25
Table 5.--Discards and discard rate of the groundfish catch off Alaska by area, gear,
and processing mode, 1992-96 (1,000 metric tons, round weight).
Notes: All gear may include additional categories.
Source: Blend estimates, National Marine Fisheries Service, 7600 Sand Point Way N.E.,
BIN C15700, Seattle, WA 98115-0070.

Table 6.--Gulf of Alaska groundfish catch by species, gear, and target fishery,round weight).
1995-96 (1,000 metric tons,

Table 6.--Continued.
Notes: Totals may include additional categories. The target,week, processing mode, NMFS area, and gear.
calculated by AFSC staff, is based on processor,
Source: Blend estimates, National Marine Fisheries Service, 7600 Sand Point Way N.E., BIN C15700, Seattle, WA98115-0070.

Table 7.--Bering Sea and Aleutian Islands groundfish catch by species, gear, and target fishery,(1,000 metric tons, round weight).
1995-96

Table 7.--Continued.
Notes: Totals may include additional categories. The target, calculated by AFSC staff, is based on processor,week, processing mode, NMFS area, and gear.
Source: Blend estimates, National Marine Fisheries Service, 7600 Sand Point Way N.E., BIN C15700, Seattle, WA98115-0070.

Table 8.--Gulf of Alaska groundfish discards by species, gear, and target fishery, 1995-96 (1,000 metrictons, round weight).

Table 8.--Continued.
Notes: Totals may include additional categories. The target, calculated by AFSC staff, is based on processor,week, processing mode, NMFS area, and gear.
Source: Blend estimates, National Marine Fisheries Service, 7600 Sand Point Way N.E., BIN C15700, Seattle, WA98115-0070.

Table 9.--Bering Sea and Aleutian Islands groundfish discards by species, gear, and target fishery, 1995-96(1,000 metric tons, round weight).

Table 9.--Continued.
Notes: Totals may include additional categories. The target, calculated by AFSC staff, is based on processor,week, processing mode, NMFS area, and gear.
Source: Blend estimates, National Marine Fisheries Service, 7600 Sand Point Way N.E., BIN C15700, Seattle, WA98115-0070.
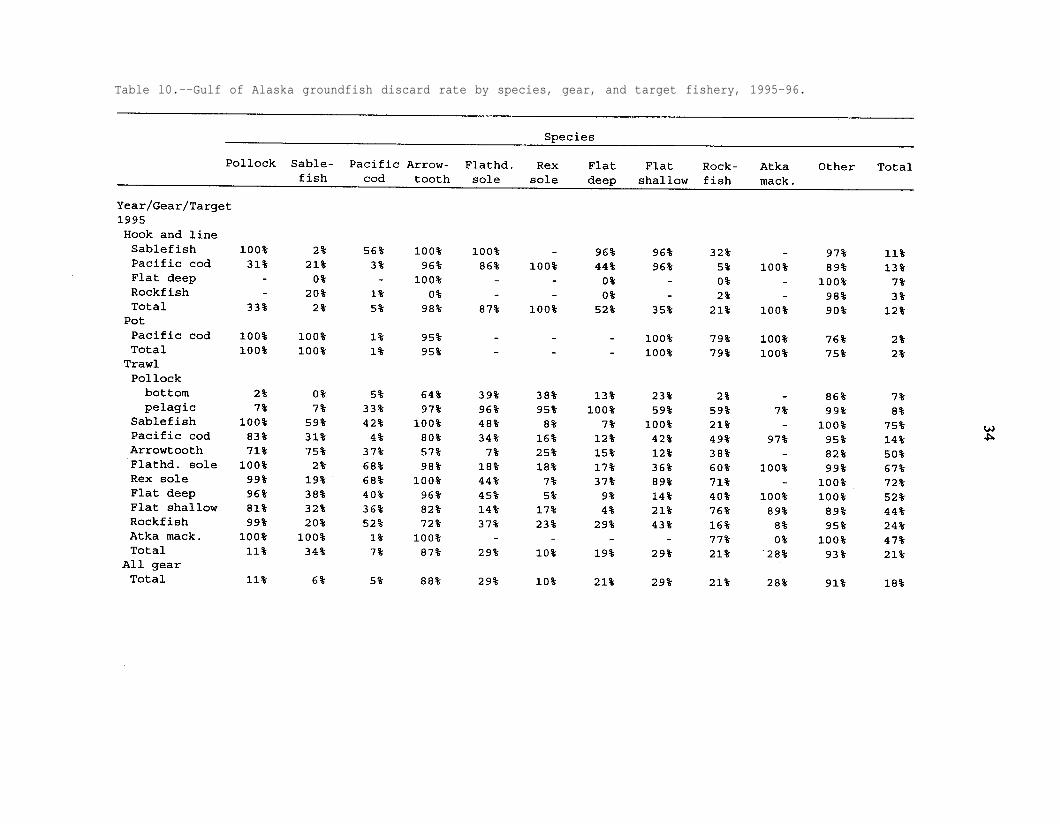
Table l0.--Gulf of Alaska groundfish discard rate by species, gear, and target fishery, 1995-96.

Table lO.--Continued.
Notes: Totals may include additional categories. The target, calculated by AFSC staff, is based on processor,week, processing mode, NMFS area, and gear.
Source: Blend estimates, National Marine Fisheries Service, 7600 Sand Point Way N.E., BIN C15700, Seattle, WA98115-0070.

Table 1l.--Bering Sea and Aleutian Islands groundfish discard rate by species, gear, and target fishery, 1995-96.

Table 1l.--Continued.
Notes: Totals may include additional categories. The target, calculated by AFSC staff, is based on processor,week, processing mode, NMFS area, and gear.
Source: Blend estimates, National Marine Fisheries Service, 7600 Sand Point Way N.E., BIN C15700, Seattle, WA98115-0070.

38
Table 12.--Prohibited species bycatch in the Gulf of Alaska by species, gear, and
groundfish target fishery 1995-96. (metric tons (t) or number in 1,000s).

39
Table 12.--Continued.
Notes: Totals may include additional categories. The target, calculated by AFSC staff,
based on processor, week, processing mode, NMFS area, and gear. International
Pacific Halibut Commission discard mortality rates are used to estimate halibut
mortality. The halibut Individual Fishing Quota program allows retention of
halibut in the hook and line groundfish fisheries making true halibut bycatch
numbers unavailable. No prohibited species bycatch numbers were available for
the sablefish fishery in 1996.
Source: Blend estimates, National Marine Fisheries Service, 7600 Sand Point Way N.E.,
BIN C15700, Seattle, WA 98115-0070.

40
Table 13.--Prohibited species bycatch in the Bering Sea and Aleutian Islands by
species, gear, and groundfish target fishery, 1995-96 (metric tons (t)
or number in 1,000s).

41
Table l3.--Continued.
Notes: Totals may include additional categories. The target, calculated by AFSC staff,
based on processor, week, processing mode, NMFS area, and gear. International
Pacific Halibut Commission discard mortality rates are used to estimate halibut
mortality. The halibut Individual Fishing Quota program allows retention of
halibut in the hook and line groundfish fisheries making true halibut bycatch
numbers unavailable. No prohibited species bycatch numbers were available for
the sablefish fishery in 1996.
Source: Blend estimates, National Marine Fisheries Service, 7600 Sand Point Way N.E.,
BIN C15700, Seattle, WA 98115-0070.

42
Table 14.--Prohibited species bycatch rates in the Gulf of Alaska by species, gear,and groundfish target fishery, 1995-96 (metric tons (t)).

Table l4.--Continued.
Notes: Totals may include additional categories. The target, calculated by AFSC staff,
based on processor, week, processing mode, NMFS area, and gear. International
Pacific Halibut Commission discard mortality rates are used to estimate halibut
mortality. The halibut Individual Fishing Quota program allows retention of
halibut in the hook and line groundfish fisheries making true halibut bycatch
numbers unavailable. No prohibited species bycatch numbers were available for
the sablefish fishery in 1996.
Source : Blend estimates, National Marine Fisheries Service, 7600 Sand Point Way N.E.,
BIN C15700, Seattle, WA 98115-0070.

44
Table 15.--Prohibited species bycatch rates in the Bering Sea and Aleutian Islands by
species, gear, and groundfish target fishery, 1995-96 (metric tons (t)).

45
Table 15.--Continued.
Notes: Totals may include additional categories. The target, calculated by AFSC staff,
based on processor, week, processing mode, NMFS area, and gear. International
Pacific Halibut Commission discard mortality rates are used to estimate halibut
mortality. The halibut Individual Fishing Quota program allows retention of
halibut in the hook and line groundfish fisheries making true halibut bycatch
numbers unavailable. No prohibited species bycatch numbers were available for
the sablefish fishery in 1996.
Source: Blend estimates, National Marine Fisheries Service, 7600 Sand Point Way N.E.,
BIN C15700, Seattle, WA 98115-0070.

46
Table 16.--Groundfish catch off Alaska by area, gear, and species, 1992-96(1,000 metric tons, round weight).
Notes: "H & L" is hook and line. All groundfish include additional species categories.
Source: Blend estimates, National Marine Fisheries Service, 7600 Sand Point Way N.E.,
BIN C15700, Seattle, WA 98115-0070.

47
Table 17.--Groundfish catch off Alaska by area, processor category, and species,
1992-96 (1,000 metric tons, round weight).
Note: Processor category, at-sea and on-shore, refers to where processing occurred.
This is NOT the same as inshore/offshore for cod and pollock allocation.
All groundfish include additional species categories.
Source: Blend estimates, National Marine Fisheries Service, 7600 Sand Point Way N.E.,
BIN C15700, Seattle, WA 98115-0070.

48
Table 18.--Groundfish catch off Alaska by area, residency, and species, 1992-96
(1,000 metric tons, round weight).
Notes : Catch delivered to motherships is classified by the residence of the owner of
the mothership. All other catch is classified by the residence of the owner
of the fishing vessel. All groundfish include additional species categories.
Source: Blend estimates, fish tickets, Alaska Commercial Fisheries Entry Commission
vessel data, National Marine Fisheries Service, 7600 Sand Point Way N.E.,
BIN C15700, Seattle, WA 98115-0070.
49
Table 19.--Ex-vessel value of the groundfish catch off Alaska by area, gear, and
species, 1992-96 ($ millions).
Note: Ex-vessel value is calculated using prices on Table 22. Please refer to
Table 22 for a description of the price derivation. All groundfish include
additional species categories.
Source: Blend estimates, Pacific Fishery Information Network prices, Alaska Department
of Fish and Game fish tickets, annual processor survey weekly processor reports,
National Marine Fisheries Service, 7600 Sand Point Way N.E., BIN C15700,
Seattle, WA 98115-0070.

50
Table 20.--Ex-vessel value of the groundfish catch off Alaska by area, Processorcategory, and species, 1992-96 ($ millions).
Note: Ex-vessel value is calculated using prices on Table 22. Please refer to
Table 22 for a description of the price derivation. Processor category, at-sea
and on-shore, refers to where processing occurred. This is NOT the same as
inshore/offshore for cod and pollock allocation. All groundfish include
additional species categories.
Source: Blend estimates, Pacific Fishery Information Network prices, Alaska Departmemt
of Fish and Game fish tickets, annual processor survey weekly processor reports,
National Marine Fisheries Service, 7600 Sand Point Way N.E., BIN C15700,
Seattle, WA 98115-0070.

51
Table 21.--Ex-vessel value of the groundfish catch off Alaska by area, residency, and
species, 1992-96 ($ millions).
Note : Ex-vessel value is calculated using prices on Table 22. Please refer toTable 22 for a description of the price derivation. Catch delivered to
motherships is classified by the residence of the owner of the mothership.
All other catch is classified by the residence of the owner of the fishing
vessel. All groundfish include additional species categories.
Source: Blend estimates, Pacific Fishery Information Network prices, Alaska Departmernt
of Fish and Game fish tickets, annual processor survey weekly processor reports,
National Marine Fisheries Service, 7600 Sand Point Way N.E., BIN C15700,
Seattle, WA 98115-0070.

52
Table 22.--Ex-vessel prices * in the groundfish fisheries off Alaska by area, gear,
and species, 1992-96 ($/lb, round weight).
* Prices do not include the value added by at-sea processing; therefore they reflect
prices prior to processing. Prices do reflect the value added by dressing fish
at sea, where the fish have not been frozen. Except where noted unfrozen landings
price is calculated as landed value divided by estimated or actual round weight.** Since this category is not well represented by on-shore landings, a price was
calculated from product survey prices. The price in this case is the value of the
product divided by the calculated round weight and multiplied by a constant .4 to
correct for value added by processing.
*** The trawl price was used for this category.
****This column is the weighted average of the other columns.
Source: Blend estimates, Pacific Fishery Information Network prices, Alaska Departmemt
of Fish and Game fish tickets, annual processor survey weekly processor reports,
National Marine Fisheries Service, 7600 Sand Point Way N.E., BIN C15700,
Seattle, WA 98115-0070.

53
Table 23.--Number and total registered net tons of vessels that caught groundfish
off Alaska by area and gear, 1992-96.
Note : Registered net tons totals exclude mainly smaller vessels for which data were
unavailable. The percent of vessels missing are: 1992 - 8%.
1993 - 7%, 1994 - 6%, 1995 - 5%, 1996 - 7%
Source: Blend estimates, fish tickets, Observer Program data, Federal permit file,
Alaska Commercial Fisheries Entry Commission vessel data, National Marine
Fisheries Service, 7600 Sand Point Way N.E., BIN C15700, Seattle, WA
98115-0070.

54
Table 24.--Number of vessels that caught groundfish off Alaska by area, tonnage
caught, and gear, 1992-96.
Source: Blend estimates, fish tickets, Observer Program data, Federal permit file,
Alaska Commercial Fisheries Entry Commission vessel data, National Marine
Fisheries Service, 7600 Sand Point Way N.E., BIN C15700, Seattle, WA
98115-0070.

55
Table 25.--Numbers, mean length, and mean registered tons of vessels that caught
groundfish off Alaska by area, vessel length class (feet), catcher type,
and gear, 1992-96.

56
Table 25.--Continued.

57
Table 25.--Continued.
Source: Blend estimates, fish tickets, Observer Program data, Federal permit file,
Alaska Commercial Fisheries Entry Commission vessel data, National Marine
Fisheries Service, 7600 Sand Point Way N.E., BIN C15700, Seattle, WA
98115-0070.

58
Table 26.--Number of vessels that caught groundfish off Alaska by area, processor
category, target, and gear, 1992-96.

59
Table 26.--Continued.
Note: Processor category, at-sea and on-shore, refer to where processing occurred.
This is NOT the same as inshore/offshore for cod and pollock allocation.
A target is calculated based on vessel, week, processing mode, NMFS area,
and gear.
Source: Blend estimates, fish tickets, Observer Program data, Federal permit file,
Alaska Commercial Fisheries Entry Commission vessel data, National Marine
Fisheries Service, 7600 Sand Point Way N.E., BIN C15700, Seattle, WA
98115-0070.

60
Table 27.--Number of vessels that caught groundfish off Alaska by area, residency,
target, and gear, 1992-96.

61
Table 27.--Continued.
Note : A target is calculated based on vessel, week, processing mode, NMFS area,
and gear. Vessels are classified by the residency of the owner of the fishing
vessel.
Source : Blend estimates, fish tickets, Observer Program data, Federal permit file
Alaska Commercial Fisheries Entry Commission vessel data, National Marine
Fisheries Service, 7600 Sand Point Way N.E., BIN C15700, Seattle, WA
98115-0070.

62
Table 28.--Number of vessels that caught groundfish off Alaska by month, area,catcher type, and gear, 1992-96.

63
Table 28.--Continued.

64
Table 28.--Continued.
Source: Blend estimates, fish tickets, Observer Program data, Federal permit file,
Alaska Commercial Fisheries Entry Commission vessel data, National Marine
Fisheries Service, 7600 Sand Point Way N.E., BIN C15700, Seattle, WA
98115-0070.

65
Table 29.--Catcher vessel (excluding catcher-processors) weeks of fishing groundfish
off Alaska by area, vessel length class (feet), gear, and target, 1992-96.

66
Table 29.--Continued.
Notes: A vessel which fished more than one category in a week is apportioned a partial
week based on catch weight. A target is calculated based on vessel, week,
processing mode, NMFS area, and gear. All groundfish include additional target
categories.
Source: Blend estimates, fish tickets, Observer Program data, Federal permit file,
Alaska Commercial Fisheries Entry Commission vessel data, National Marine
Fisheries Service, 7600 Sand Point Way N.E., BIN C15700, Seattle, WA
98115-0070.

67
Table 30.--Catcher-processor vessel weeks of fishing groundfish off Alaska by area,
vessel length class (feet), gear, and target, 1992-96.

68
Table 30.--Continued.

69
Table 30.--Continued.
Notes: A vessel which fished more than one category in a week is apportioned a partial
week based on catch weight. A target is calculated based on vessel, week,
processing mode, area, and gear. All groundfish include additional target
categories.
Source : Blend estimates, fish tickets, Observer Program data, Federal permit file,
Alaska Commercial Fisheries Entry Commission vessel data, National Marine
Fisheries Service, 7600 Sand Point Way N.E., BIN C15700, Seattle, WA
98115-0070.

Table 31.--Production of groundfish products in the fisheries off Alaska by species, 1992-96(1,000 metric tons product weight and million dollars).

Table 31.--Continued.
Source: Weekly processor report data and annual processor price survey, National Marine Fisheries Service,7600 Sand Point Way N.E., BIN C15700, Seattle, WA 98115-0070.
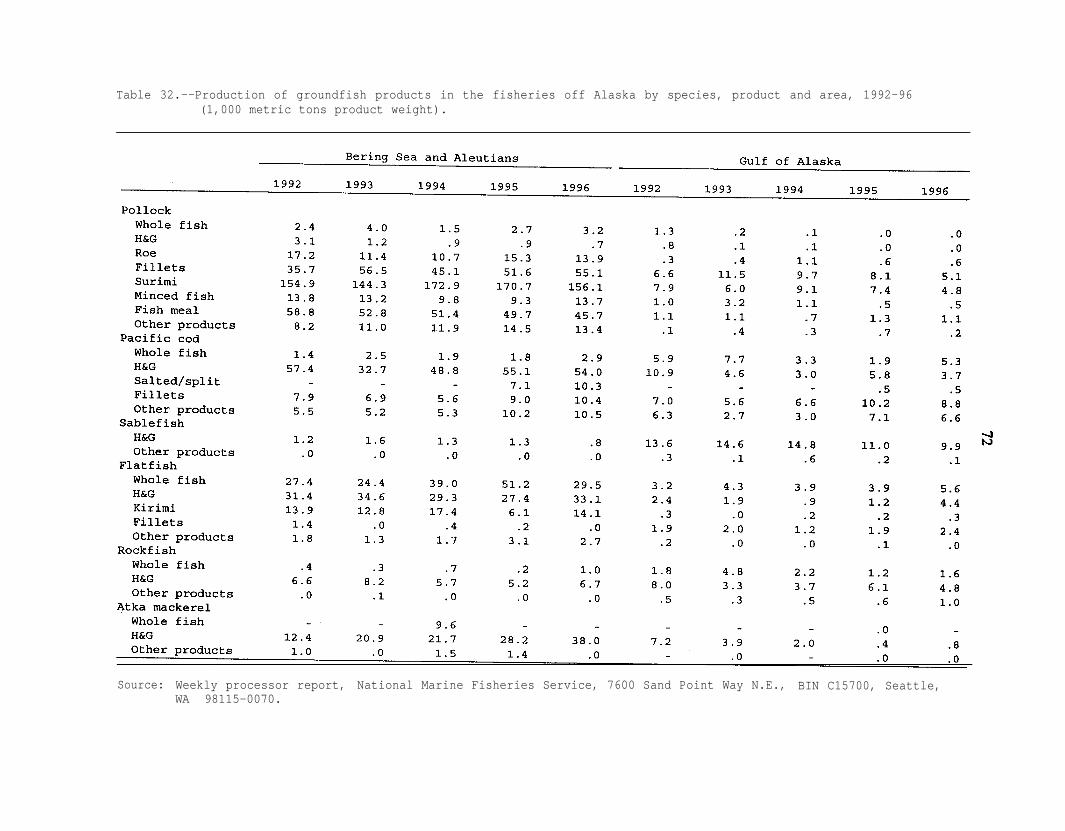
Table 32.--Production of groundfish products in the fisheries off Alaska by species, product and area, 1992-96(1,000 metric tons product weight).
Source: Weekly processor report,WA 98115-0070.
National Marine Fisheries Service, 7600 Sand Point Way N.E., BIN C15700, Seattle,

Table 33.--Production of groundfish products in the fisheries off Alaska by species, product and processingmode, 1992-96, (1,000 metric tons product weight).
Source: Weekly processor report, National Marine Fisheries Service, 7600 Sand Point Way N.E., BIN C15700, Seattle,WA 98115-0070.

74
Table 34.--Annual wholesale prices of frozen fish blocks and fillets,F.O.B. East Coast, 1976-96, in cents/lb.
NA - Not available.
Source: Fishery Market News Report, Natl. Mar. Fish. Serv.,408 Atlantic Ave., Boston, MA 02210-2203.

75
Table 35.--Monthly wholesale prices of selected frozen fish blocks and fillets,F.O.B. East Coast, 1994-96, in cents/lb.
Notes: NQ - No quote. TFQ - Too few quotes.
Source: Fishery Market News Reports, Natl. Mar. Fish. Serv., 408 Atlantic Ave.,Boston, MA 02210-2203.

76
Table 36 .--Monthly Japanese landing market price of selected groundfishby species, 1987-96, in yen/kilogram (weighted average).

77
Table 36.--Continued.
Source: Monthly Stat. of Agriculture, Forestry, and Fisheries, Stat. and Info.Dept., Ministry of Agriculture, Forestry, and Fishery, Government ofJapan. Available from Alaska Fish. Sci. Cen., 7600 Sand Point WayN.E., BIN C15700, Seattle, WA 98115-0070.

78
Table 37.--Monthly Tokyo wholesale prices of selected products, 1987-96,in yen/kilogram (weighted average).
Note: Beginning in 1988, prices are for six large cities wholesale market.
Source: Monthly Stat. of Agriculture, Forestry, and Fisheries, Stat. and Info.Dep., Ministry of Agriculture, Forestry, and Fisheries, Government ofJapan. Available from Alaska Fish. Sci. Cen., 7600 Sand Point WayN.E., BIN C15700, Seattle, WA 98115-0070.

79
Table 38 .--Annual exports of groundfish from Alaska, Washington,and Oregon customs districts, quantity (1,000 lb),value ($l,OOO), and average price ($/lb), 1991-96.

80
Table 38.--Continued.
Source: U.S. Dep. Commer., Bur. of the Census; and Natl. Mar. Fish.Serv. data base from Alaska Fish. Sci. Cent., 7600 Sand PointWay N.E., BIN C15700, Seattle, WA 98115-0070.

81
Table 39.--Exports of groundfish from Alaska, Washington, and Oregoncustoms districts to major countries, quantity (1,000 lb),percent change from 1995 to 1996, and average price ($/lb),1995-96.
Source: U.S. Dep. Commer., Bur. of the Census; and Natl. Mar. Fish.Serv. database from Alaska Fish. Sci. Cent., 7600 Sand PointWay N.E., BIN C15700, Seattle, WA 98115-0070.

82
Table 40.--U.S. imports of groundfish fillets, steaks, and blocks,1976-96, quantity in million lb, product weight and valuein million dollars.
Source: U.S. Dep. Commer., Bur. of the Census, Washington, D.C.20233; and Fisheries of the United States, Natl. Mar. Fish.Serv., Fish. Stat. Div., 1315 East-West Highway, Silver Spring,MD 20910, various issues.

83
Table 41 .--U.S. per capita consumption of fish and shellfish, 1970-96,population in millions and consumption in pounds, edible weight.
Note: Per capita consumption represents pounds of edible meat consumedfrom domestically caught and imported fish and shellfish adjustedfor beginning and ending inventories, and exports, divided by thecivilian population of the United States as of 1 July of each year.Population estimates for 1980-91 were revised to reflect changesfrom the 1990 decennial population enumeration. Changes did notsignificantly alter pounds per capita.
Source: Fisheries of the United States, 1996. Natl. Mar. Fish. Serv.,1315 East-West Highway, Silver Spring, MD 20910, CFS No. 9600,July 1997.
84
Table 42.--U-S. consumption of all fillets and steaks, andfish sticks and portions, total in 1,000 lband per capita in pounds, product weight, 1980-96.
1Series revised in 1993 to reflect deduction of filletproduction used to produce blocks, exports of foreignfillets and steaks, and changes in population estimatesfrom 1990 decennial population enumeration.
2Total divided by total U.S. population.
p - preliminary.
Source: Computed from data from U.S. Dep. of Commerce,Bur. of the Census; and Fisheries of the UnitedStates, Natl. Mar. Fish. Serv., Fish. Stat. Div.,1315 East-West Highway, Silver Spring, MD 20910,various issues.

85
Table 43.--Annual U.S. economic indicators: Selected producer andconsumer price indexes, 1976-96.
Source: Producer prices and price indexes, and consumer price indexes,U.S. Dep. of Labor, Bur. of Labor Statistics.

86
Table 44.--Monthly U.S. economic indicators: Selected producer andconsumer price indexes, 1994-96.
Source: Producer prices and price indexes, and consumer price indexes,U.S. Dep. of Labor, Bur. of Labor Statistics.

87
Table 45 .--Annual foreign exchange rates for selected countries, 1976-96,in national currency units per U.S. dollar.
ROK - Republic of Korea. U.K. - United Kingdom.
Source: Intl. Financial Statistics, Intl. Mon. Fund, Washington, D.C.

88
Table 46.--Monthly foreign exchange rates for selected countries, 1994-96,in national currency units per U.S. dollar.
ROK - Republic of Korea. U.K. - United Kingdom.
Source: Intl. Financial Statistics, Intl. Mon. Fund, Washington, DC.

89
Table 47.--Monthly U.S. cold storage holdings of selected groundfish blocks,1994-96, in 1,000 lb (end of month).
Notes: * Total includes other species not listed.
Source: Natl. Mar. Fish. Serv., Fish. Stat. Div., Silver Spring, MD 20910.

90
Table 48 .--Monthly U.S. cold storage holdings of selected groundfish fillets,1994-96, in 1,000 lb (end of month).
Notes: * Total includes other species not listed.
Source: Natl. Mar. Fish. Serv., Fish. Stat. Div., Silver Spring, MD 20910.

91
Table 49.--Monthly West Coast cold storage holdings of selected groundfishproducts, 1994-96, in 1,000 lb (end of month).
Notes: Includes domestic and foreign products.
Source: Natl. Mar. Fish. Serv., Fish. Stat. Div., Silver Spring, MD 20910.

RECENT TECHNICAL MEMORANDUMS
Copies of this and other NOAA Technical Memorandums are available from theNational Technical Information Service, 5285 Port Royal Road, Springfield, VA 22167(web site: www.ntis.gov). Paper and microfiche copies vary in price.
AFSC-
85 KINOSHITA, R. K., A. GREIG, and J. M. TERRY. 1998. Economic status of the groundfish fisheries offAlaska, 1996, 91 p. NTIS No. PB98-126170.
84 LAAKE, J., D. RUGH, and L. BARAFF. 1998. Observations of harbor porpoise in the vicinity of acousticalarms on a set gill net, 40 p. NTIS No. PB98-117641.
83 RUTECKI, T. L., M. F. SIGLER, and H. H. ZENGER JR. 1997. Data report: National Marine FisheriesService longline surveys, 1991-96, 64 p. NTIS No. PB98-108822.
82 MARTIN, M. H. 1997. Data report: 1996 Gulf of Alaska bottom trawl survey, 235 p. NTIS No. PB98-103930.
81 LAUTH, R. R. 1997. The 1996 Pacific West Coast upper continental slope trawl survey of groundfishresources off Washington and Oregon: Estimates of distribution, abundance, and length composition, 156 p. NTIS No. PB97-208912.
80 LAUTH, R. R. 1997. The 1995 Pacific West Coast upper continental slope trawl survey of groundfishresources off southern Oregon and northern California: Estimates of distribution, abundance, and lengthcomposition, 110 p. NTIS No. PB97-208920.
79 LAUTH, R. R., M. E. WILKINS, and P. A. RAYMORE JR. 1997. Results of trawl surveys of groundfishresources of the West Coast upper continental slope from 1989 to 1993, 342 p. NTIS No. PB97-208904.
78 HILL, P. S., D. P. DEMASTER, and R. J. SMALL. 1997. Alaska marine mammal stock assessments,1996, 150 p. NTIS No. PB97-203277.
77 CHUMBLEY, K., J. SEASE, M. STRICK, and R. TOWELL. 1997. Field studies of Steller sea lions(Eumetopias jubatus) at Marmot Island, Alaska, 1979 through 1994, 99 p. NTIS No. PB97-203376.
76 OSMEK, S., J. CALAMBOKIDIS, J. LAAKE, P. GEARIN, R. DELONG, J. SCORDINO, S. JEFFRIES, andR. BROWN. 1997. Assessment of the status of harbor porpoise ( Phocoena phocoena) in Oregon andWashington waters, 46 p. NTIS No. PB97-198436.
75 WING, B. L., C. W. DERRAH, and V. M. O’CONNELL. 1997. Ichthyoplankton in the eastern Gulf of
Alaska, May 1990, 42 p. NTIS No. PB97-174379.
74 WILSON, C. D., and M. A. GUTTORMSEN. 1997. Echo integration-trawl survey of Pacific whiting,Merluccius productus, off the west coasts of the United States and Canada during July-September 1995,70 p. NTIS No. PB97-174387.
73 CELEWYCZ, A. G., and A. C. WERTHEIMER. 1997. Suitability of Dry Bay, southeastern Alaska, as
rearing habitat for juvenile salmon, 19 p. NTIS No. PB97-161343.
72 KINOSHITA, R. K., A. GREIG, D. COLPO, and J.M. TERRY. 1997. Economic status of the groundfishfisheries off Alaska, 1995, 91 p. NTIS No. PB97-161269.
71 STRICK, J. M., L. W. FRITZ, and J. P. LEWIS. 1997. Aerial and ship-based surveys of Steller sea lions(Eumetopias jubatus) in Southeast Alaska, the Gulf of Alaska, and Aleutian Islands during June and July1994, 55 p. NTIS No. PB97-144026.