economic review meeting - wa
TRANSCRIPT

Budget Outlook & Economic Review
January 30, 2020
Washington State
Economic and Revenue Forecast Council

This page left intentionally blank.
WASHINGTON STATE
ECONOMIC AND REVENUE FORECAST COUNCIL
AGENDA
BUDGET OUTLOOK & ECONOMIC REVIEW MEETING
January 30, 2020
10:00 a.m.
Approval of meeting minutes from November 20, 2019
Budget Outlook methodology review
Budget Outlook adoption
Presentation of economic outlook and revenue collection experience

This page left intentionally blank.

STATE OF WASHINGTON
ECONOMIC AND REVENUE FORECAST COUNCIL
PO Box 40912 Olympia, Washington 98504-0912 (360) 534-1560
Meeting Minutes Revenue Review & Budget Outlook
November 20, 2019 John L. O’Brien, Hearing Room C
Economic and Revenue Forecast Council
Members Present Staff
Ed Orcutt, House of Representatives, ERFC Chair
Christine Rolfes, Senate
John Braun, Senate
Timm Ormsby, House of Representatives
Duane Davidson, Treasurer
David Schumacher, Office of Financial Management
Steve Lerch, Executive Director
Sarian Scott, Senate
Andy Toulon, House
Rachel Knutson, OFM
Call to Order
Representative Orcutt called the meeting to order at 10:03 a.m.
Motion
Representative Ormsby moved, seconded by Representative Orcutt, to adopt the November 4,
2019 meeting minutes. Motion passed at 10:04 a.m.
Forecast Presentation
Dr. Lerch presented information on the economic and revenue forecast. Dr. Lerch summarized
the forecast changes.
Motion
Director Schumacher moved, seconded by Representative Orcutt, to adopt the official state
economic and revenue forecasts, and the unofficial optimistic, pessimistic and alternative
forecasts. Council approved the motion unanimously at 10:22 a.m.
Budget Outlook Presentation
Sarian Scott, Andy Toulon, and Rachel Knutson presented information on the four-year budget
outlook. Discussion ensued regarding pension costs and extraordinary expenditures for fire
costs.
Motion
Representative Ormsby made a motion to adopt the budget outlook as presented, seconded by
Representative Orcutt. Council approved the motion unanimously at 10:39 a.m.
Adjournment
With no further business, the meeting adjourned at 10:40 a.m.
Economic and Revenue Forecast Council 1

This page left intentionally blank.
Economic & Revenue Forecast Council
State of Washington
Economic Review: January 30, 2020
Executive Summary
United States
This forecast is based on a modified version of IHS Markit's January 2020
Control forecast for the U.S. economy. As usual, we have adjusted real gross
domestic product (GDP) to match the Blue Chip “Consensus” GDP forecast.
The forecast for GDP growth in 2020 and 2021 is now 1.9% in both years
compared to 1.8% in both years in the November forecast. The Blue Chip
long-range forecast has not changed since November and calls for growth
rates of 1.9% and 2.0% in 2022 and 2023. February 2020 is our first forecast
for 2024 and 2025. We assume real GDP will grow 2.0% in each year as in
the latest Blue Chip long-range forecast.
Our oil price forecast reflects the futures markets, primarily the Brent (North
Sea) oil price but also the West Texas Intermediate (WTI) benchmark. This
forecast was based on the Friday, January 24, 2020 closing prices for Brent
and WTI futures. The latest futures prices indicate a slightly steeper decline in
oil prices than in the November forecast. As in November, the refiner
acquisition price of crude is $57 per barrel in the first quarter of 2020
however it now declines to $50 by the end of 2023 compared to $52 in the
November forecast.
China and the U.S. announced a tentative “phase one” trade agreement. The
forecast includes the suspension of 15% tariffs on $160 billion of Chinese
goods scheduled to go into effect on December 15th and the reduction, from
15% to 7.5%, of tariffs on $112 billion of goods that went into effect on
September 1st that were included in the phase one agreement. However, it
does not include the $200 billion increase in Chinese imports from the U.S.
that was part of the phase one agreement. We will increase the forecast of
net exports as we see evidence of stronger Chinese demand that is not offset
by shifts away from other U.S. export markets.
The U.S. economy added 145,000 net new jobs in December. Employment
data for October and November were revised down by 14,000 jobs. With
these revisions, average monthly employment gains in 2019 equaled 176,000
jobs. Sectors with notable employment gains in December included retail
trade (+41,000), health care (+28,000), accommodation and food service
(+25,000), construction (+20,000), amusement, gambling and recreation
(+14,000) and local government (+14,000). Sectors with net employment
declines in December included manufacturing (-12,000), couriers and
messengers (-9,000), support activities for mining (-8,000), state
government (-8,000) and services to buildings and dwellings (-6,000).
Two key measures of consumer confidence diverged yet again this month.
The University of Michigan (UM) consumer sentiment survey increased by 2.5
points to 99.3 in December. Most of the December gain in the index was
attributed to upper income households. The Conference Board index of
Economic and Revenue Forecast Council 3

Executive Summary January 30, 2020 Economic Review
consumer confidence declined slightly, falling 0.3 points in December to
126.5. A slightly stronger assessment of current economic conditions was
offset by a decline in the short-term outlook for jobs and financial prospects.
Initial claims for unemployment insurance increased by 6,000 to 211,000
(SA) in the week ending January 18th. The four-week moving average of
initial claims decreased by 3,250 to 213,250.
Industrial production in November increased by 1.1% (SA) compared to
October. This increase in part reflects the return to work of striking
automotive workers. Over the year, industrial production is down by 0.8%
(SA). New orders for core capital goods (i.e., durables excluding aircraft and
military), which is a proxy for business investment, increased by 0.2% (SA) in
November following a 1.0% increase in October according to U.S. Census
Bureau data.
Residential construction and new home sales data improved this month.
Housing units authorized by building permits in November were 1.4% (SA)
above their October level and 11.1% above their year-ago level. November
housing starts increased by 3.2% (SA) compared to October and were 13.6%
above their November 2018 level. New home sales in November increased by
1.3% (SA) compared to October and were 16.9% above their year-ago level.
Existing home sales in November decreased by 1.7% (SA) compared to
October but were up 2.7% compared to November 2018. The seasonally
adjusted Case-Shiller national home price index for October was 0.5% above
its September level and 3.3% above its year-ago level.
Major threats to the U.S. and Washington economies remain, including
concerns about international trade policy and geopolitical risks.
Washington
We have two months of new Washington employment data since the
November forecast was released. Total nonfarm payroll employment rose
13,700 (seasonally adjusted) in November and December, which was 500
more than expected in the November forecast. Private services-providing
sectors added 7,700 jobs in the two-month period. The manufacturing sector
added 1,700 jobs of which 900 were aerospace jobs. Construction
employment increased by 800 jobs and government employment rose by
3,600 jobs.
We have also incorporated another quarter of benchmark employment data
from the Quarterly Census of Employment and Wages (QCEW). The new
QCEW data and other revisions did not change the estimated level of total
employment in October 2019. December employment is 500 (0.0%) higher
than expected in the November forecast because of stronger growth from
October to December.
Washington’s unemployment rate declined to 4.3% in December from 4.4% in
November. The December unemployment rate was a new all-time low in the
series that dates back to 1974.
Boeing suspended production of the 737 MAX jet in January. We assume the
suspension continues through March. The effect of moving from slowdown to
suspension is to reduce first-quarter U.S GDP growth by 0.5 percentage point
while adding 0.25 percentage point to growth in both the second and third
Economic and Revenue Forecast Council 4
Executive Summary January 30, 2020 Economic Review
quarters. Boeing has indicated that affected employees will be reassigned and
that there will be no layoffs or furloughs due to the shutdown.
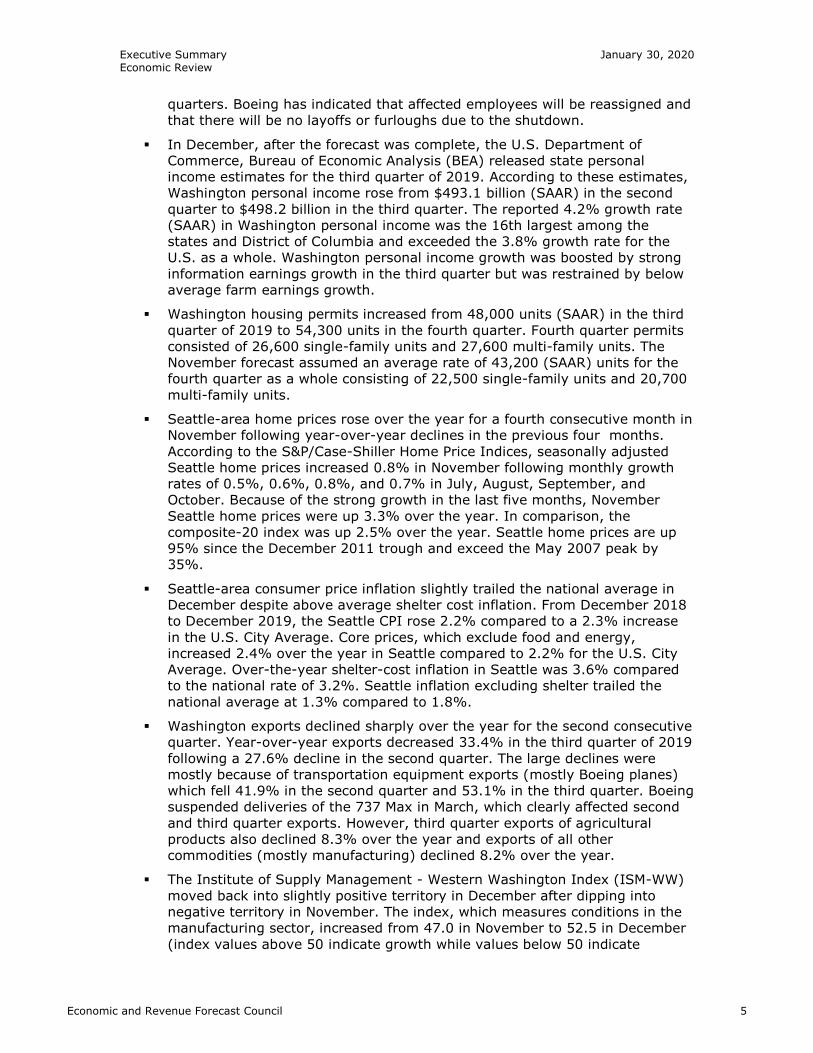
In December, after the forecast was complete, the U.S. Department of
Commerce, Bureau of Economic Analysis (BEA) released state personal
income estimates for the third quarter of 2019. According to these estimates,
Washington personal income rose from $493.1 billion (SAAR) in the second
quarter to $498.2 billion in the third quarter. The reported 4.2% growth rate
(SAAR) in Washington personal income was the 16th largest among the
states and District of Columbia and exceeded the 3.8% growth rate for the
U.S. as a whole. Washington personal income growth was boosted by strong
information earnings growth in the third quarter but was restrained by below
average farm earnings growth.
Washington housing permits increased from 48,000 units (SAAR) in the third
quarter of 2019 to 54,300 units in the fourth quarter. Fourth quarter permits
consisted of 26,600 single-family units and 27,600 multi-family units. The
November forecast assumed an average rate of 43,200 (SAAR) units for the
fourth quarter as a whole consisting of 22,500 single-family units and 20,700
multi-family units.
Seattle-area home prices rose over the year for a fourth consecutive month in
November following year-over-year declines in the previous four months.
According to the S&P/Case-Shiller Home Price Indices, seasonally adjusted
Seattle home prices increased 0.8% in November following monthly growth
rates of 0.5%, 0.6%, 0.8%, and 0.7% in July, August, September, and
October. Because of the strong growth in the last five months, November
Seattle home prices were up 3.3% over the year. In comparison, the
composite-20 index was up 2.5% over the year. Seattle home prices are up
95% since the December 2011 trough and exceed the May 2007 peak by
35%.
Seattle-area consumer price inflation slightly trailed the national average in
December despite above average shelter cost inflation. From December 2018
to December 2019, the Seattle CPI rose 2.2% compared to a 2.3% increase
in the U.S. City Average. Core prices, which exclude food and energy,
increased 2.4% over the year in Seattle compared to 2.2% for the U.S. City
Average. Over-the-year shelter-cost inflation in Seattle was 3.6% compared
to the national rate of 3.2%. Seattle inflation excluding shelter trailed the
national average at 1.3% compared to 1.8%.
Washington exports declined sharply over the year for the second consecutive
quarter. Year-over-year exports decreased 33.4% in the third quarter of 2019
following a 27.6% decline in the second quarter. The large declines were
mostly because of transportation equipment exports (mostly Boeing planes)
which fell 41.9% in the second quarter and 53.1% in the third quarter. Boeing
suspended deliveries of the 737 Max in March, which clearly affected second
and third quarter exports. However, third quarter exports of agricultural
products also declined 8.3% over the year and exports of all other
commodities (mostly manufacturing) declined 8.2% over the year.
The Institute of Supply Management - Western Washington Index (ISM-WW)
moved back into slightly positive territory in December after dipping into
negative territory in November. The index, which measures conditions in the
manufacturing sector, increased from 47.0 in November to 52.5 in December
(index values above 50 indicate growth while values below 50 indicate
Economic and Revenue Forecast Council 5

Executive Summary January 30, 2020 Economic Review
contraction). The production, orders, and deliveries components indicated
expansion in December while the employment and inventory components
indicated contraction.
Washington car and truck sales declined slightly in December. Seasonally
adjusted new vehicle registrations decreased 1.3% in December following a
0.8% decline in November. December sales were down 7.8% over the year
and 17.5% since the November 2017 post-recession peak. Monthly sales are
erratic but have been trending down since mid-2016.
We expect 1.8% Washington employment growth this year, up slightly from
the 1.6% rate in the November forecast. As in November, we expect growth
to continue to decelerate. We expect employment growth to average 1.0%
per year in 2021 through 2023, which is slightly faster than the 0.9% rate
expected in November. Our forecast for nominal personal income growth this
year is 4.4%, up from 3.9% in the November forecast. Our new forecast for
nominal personal income growth in 2021 through 2023 averages 4.5% per
year, which is down from the 4.7% rate expected in the November forecast.
While personal income growth is lower than in November, the level is higher
due to an upward revision to history.
Economic and Revenue Forecast Council 6

Washington State Economic Outlook & Revenue Collection Experience
Presented to the Economic and Revenue Forecast Council
Steve LerchExecutive Director
January 30, 2020Olympia, Washington

This page left intentionally blank.

Economic and Revenue Forecast Council
Summary
• The preliminary economic forecast for both the U.S.and WA are very similar to the November forecast.
• Inflation remains tame.
• Boeing suspended production of the 737 MAX jet inJanuary; it is expected that it will be cleared to fly thissummer with production to resume in March. Boeinghas indicated that affected employees will bereassigned and that there will be no layoffs orfurloughs due to the shutdown.
• Revenue collections since the November forecast are$169 million above expectations; December REETcollections were $74 million above the forecast due toa rush of sales ahead of a January 1 increase in taxrates on sales worth more than $1.56 million.
Slide 1
Economic and Revenue Forecast Council
Forecast risks
Upside• Consumer and business confidence have
dipped but remain at high levels
• U.S., WA labor markets slowed in 2019 butremain strong
Downside• International trade policy remains uncertain
• Geopolitical risks: Iran, North Korea, China,Russia, Brexit
• Uncertainty regarding 737 MAX
• Maturing economic expansion
Slide 2
Economic and Revenue Forecast Council 9

Economic and Revenue Forecast Council
Inflation remains moderate
-3.0
-2.0
-1.0
0.0
1.0
2.0
3.0
4.0
5.0
6.0
7.0
2000 2002 2004 2006 2008 2010 2012 2014 2016 2018
Inflation, % change over the year
CPI - Seattle CPI - U.S.
Source: U.S. Bureau of Labor Statistics, data through Dec. 2019
Slide 3
Economic and Revenue Forecast CouncilEconomic and Revenue Forecast Council
Job growth below 2018 averages, remains healthy
0
1
2
3
4
5
6
7
8
9
10
0
50
100
150
200
250
300
350
400
450
500
2011 2012 2013 2014 2015 2016 2017 2018 2019
Th
ou
san
ds
Th
ou
san
ds
Average monthly employment change
U.S. (left) WA (right)
Source: Bureau of Labor Statistics, Employment Security Dept.; data through Dec. 2019
Slide 4
Economic and Revenue Forecast Council 10

Economic and Revenue Forecast CouncilEconomic and Revenue Forecast Council
Wage growth by selected industries
0% 1% 2% 3% 4% 5% 6%
Total
Construction
Manufacturing
Retail trade
Transp & warehousing
Information
Financial activities
Prof & business services
Educ & health services
Leisure & hospitality
Annual growth in average annual wages, 2001 - 2018
U.S. WA
Adjusting for inflation, annual overall WA wage growth averaged 1.3% over this period
Source: Bureau of Labor Statistics, Employment Security Dept.; data through 2018
Slide 5
Economic and Revenue Forecast Council
2019 WA exports to most countries have declined
0
5
10
15
20
25
30
35
40
China Canada Japan South
Korea
United
Kingdom
All other
$ B
illio
ns
WA exports, 2018 vs. 2019
Jan - Nov 2018 Jan - Nov 2019
Source: WISERTrade, data through Nov. 2019
Slide 6
Economic and Revenue Forecast Council 11

Economic and Revenue Forecast Council
WA exports down substantially in 2019
-40%
-35%
-30%
-25%
-20%
-15%
-10%
-5%
0%
5%
10%
2016 2017 2018 2019 YTD
Annual growth, WA exports
Transp Equip All other Total
Source: WISERTrade, data through Nov. 2019
Aerospace exports for Jan – Nov 2019 are $15.2 billion lower than during the same period in 2018
Slide 7
Economic and Revenue Forecast Council
Boeing deliveries down this year, few new orders
-250
-150
-50
50
150
250
350
737 737 MAX 777 787 747/767
Freighter
# o
f air
craft
2018 deliveries 2019 deliveries 2019 net orders
Source: Boeing Company, data through Dec. 2019
Slide 8
Economic and Revenue Forecast Council 12

Economic and Revenue Forecast CouncilEconomic and Revenue Forecast Council
Recent economic expansions
90%
100%
110%
120%
130%
140%
1 7 9 11 13 15 17 19 21 23 25 27 29 31 33 35 37 39 41
Calendar Quarters
Cumulative U.S. GDP growth, recent economic
expansions
1982-1990 1991-2001 2001-2007 2009-present
The current expansion is the longest on record but growth has been slower than in previous expansions.
Source: U.S. Bureau of Economic Analysis, data through 2019 Q3
Slide 9
Economic and Revenue Forecast CouncilEconomic and Revenue Forecast Council
WSJ: probability of recession in next 12 months
0
5
10
15
20
25
30
35
40
Recessio
n p
ro
bab
ilit
y,
%
Source: Wall Street Journal Economic Forecasting Survey, data through Dec. 2019
Slide 10
Economic and Revenue Forecast Council 13

Economic and Revenue Forecast Council
U.S. manufacturing has slowed in last 5 months
30
35
40
45
50
55
60
65
70
75
80
2000 2001 2003 2005 2007 2009 2011 2012 2014 2016 2018
Institute for Supply Mgmt. Manufacturing Index: U.S., WA
U.S. WA
Source: ISM, WA data through Dec. 2019
Values above 50 indicate expansion, below 50 indicate contraction.
Slide 11
Economic and Revenue Forecast CouncilEconomic and Revenue Forecast Council
GDP growth forecast
0.0%
0.5%
1.0%
1.5%
2.0%
2.5%
3.0%
2014 2016 2018 2020 2022 2024
Annual real GDP growth
February preliminary November
GDP growth is slightly higher for 2020 and 2021 compared to the November forecast
Source: IHS Markit, ERFC February 2020 preliminary forecast; data through 2018
Slide 12
Economic and Revenue Forecast Council 14

Economic and Revenue Forecast CouncilEconomic and Revenue Forecast Council
Oil prices
20
30
40
50
60
70
80
90
100
110
120
2007 2009 2011 2013 2015 2017 2019 2021 2023 2025
Do
llars P
er B
arrel
February preliminary November
Oil prices are slightly lower than in the November forecast
Source: Energy Information Administration, IHS Markit, ERFC; data through Q4 2019Note: Vertical black line indicates last actual
Forecast
Slide 13
Economic and Revenue Forecast CouncilEconomic and Revenue Forecast Council
U.S. nonfarm payroll employment
125
130
135
140
145
150
155
160
2007 2009 2011 2013 2015 2017 2019 2021 2023 2025
Mil
lio
ns
U.S. Nonfarm Payroll Employment
February preliminary November
U.S. nonfarm payroll employment is close to the November forecast
Source: IHS Markit, ERFC; data through Q4 2019Note: Vertical black line indicates last actual
Forecast
Slide 14
Economic and Revenue Forecast Council 15

Economic and Revenue Forecast CouncilEconomic and Revenue Forecast Council
WA personal income forecast
300
350
400
450
500
550
600
650
700
2013 2015 2017 2019 2021 2023 2025
Billio
ns o
f U
SD
Washington personal income
February preliminary November
Washington personal income forecast is slightly higher than in November but with slightly lower growth rates
Source: ERFC February 2020 Preliminary forecast; historical data through 2018
Forecast
Slide 15
Economic and Revenue Forecast CouncilEconomic and Revenue Forecast Council
Washington employment forecast
2,600
2,700
2,800
2,900
3,000
3,100
3,200
3,300
3,400
3,500
3,600
3,700
3,800
2007 2009 2011 2013 2015 2017 2019 2021 2023 2025
Th
ou
san
ds
Washington Nonfarm Payroll Employment
February preliminary November
Washington employment forecast is very close to the November forecast
Source: ERFC February 2020 Preliminary forecast; historical data through Q4 2019
Forecast
Slide 16
Economic and Revenue Forecast Council 16

Economic and Revenue Forecast CouncilEconomic and Revenue Forecast Council
Housing permits forecast
20
25
30
35
40
45
50
2013 2015 2017 2019 2021 2023 2025
Th
ou
san
ds
Washington Housing Permits
February preliminary November
Washington housing permits forecast is slightly higher than in November
Source: ERFC February 2020 Preliminary forecast; historical data through 2019
Slide 17
Economic and Revenue Forecast Council
Collections still growing faster than personal income growing faster than personal income
-15%
-10%
-5%
0%
5%
10%
1984 1988 1991 1995 1998 2002 2005 2009 2012 2016 2019
Year-Over-Year Rev Act* Growth Less State Personal
Income Growth
YOY Rev Act Less Income Growth Long-Term Average
Source: ERFC; Quarterly revenue data through Q3 2019, February 2019 preliminary income estimates
Adjusted Rev Act growth YOY:
18Q4: 7.5%19Q1: 5.6%19Q2: 8.1%19Q3: 6.6%
February preliminary personal income YOY growth estimates:
18Q4: 6.5%19Q1: 5.4%19Q2: 6.2%19Q3: 5.7%
*Adjusted for large one-time payments and refunds and payments under the amnesty program
Slide 18
Economic and Revenue Forecast Council 17

Economic and Revenue Forecast Council
Actual market value came in higher than anticipated
-10
-5
0
5
10
15
20
25
2000 2003 2006 2009 2012 2015 2018
Percen
t
Washington Total Market Value Growth
November Forecast Actual
Source: ERFC November 2019 forecast; historical data through 2019
$80 m per year
November forecast for growth in market value: 7.9%
Actual growth:9.8%
Every 1.0 percentage point increase in market value growth adds around $40 million in revenue per year
Slide 19
Economic and Revenue Forecast Council
Taxable real estate sales jumped in December
0
2
4
6
8
10
12
14
1999 2001 2003 2005 2007 2009 2011 2013 2015 2017 2019
$ b
illio
ns,
SA
Source: ERFC, data through Dec. 2019 sales
On Jan. 1st, the real estate excise tax rate changed from 1.28% to a graduated rate ranging from 1.1% to 3.0%
Slide 20
Economic and Revenue Forecast Council 18

Economic and Revenue Forecast Council
Collections through January 10th$169 million above the November forecast
Cumulative collections as of January 10 compared to the November forecast
Estimate Actual Diff. Pct.
Department of Revenue-Total $4,604,212 $4,772,574 $168,362 3.7%
Revenue Act 2,846,010 2,926,699 80,690 2.8%
Non-Revenue Act 1,758,203 1,845,874 87,672 5.0%
Liquor Sales/Liter 47,804 48,914 1,110 2.3%
Cigarette 55,456 55,155 (301) -0.5%
Property (State School Levy) 1,439,556 1,422,494 (17,062) -1.2%
Real Estate Excise 179,506 268,187 88,682 49.4%
Unclaimed Property 15,927 25,629 9,703 60.9%
Other 19,955 25,495 5,540 27.8%
Administrative Office of the Courts 11,189 11,482 294 2.6%
Total General Fund-State $4,615,401 $4,784,056 $168,656 3.7%
Total Excluding Special Factors $4,615,401 $4,752,060 $136,660 3.0%
Thousands of dollars
Special factors: $32.0 million in net large one-time payments for past due taxes.
REET collections jumped higher than expected ahead of the January 1 rate increase.
Adjusted for both the special factors and the REET surplus, collections are $48.0 million (1.0%) higher than forecasted.
Slide 21
Economic and Revenue Forecast CouncilEconomic and Revenue Forecast Council
Conclusion
• The U.S. and Washington economic forecasts are very similar to November, with slightly stronger WA housing permits
• As has been the case for some time, Washington’s economy is continuing to outperform the nation
• Threats to economic expansion include concerns about international trade policy, geopolitical risks and a maturing expansion
• The next monthly revenue collection report will be available on February 18th and the revenue forecast will be presented on February 19th
Slide 22
Economic and Revenue Forecast Council 19

Economic and Revenue Forecast CouncilEconomic and Revenue Forecast Council
Questions?
Economic & Revenue Forecast CouncilPO BOX 40912Olympia WA 98504-0912
www.erfc.wa.gov360-534-1560
Economic and Revenue Forecast Council 20

Table 1
U.S. Economic Forecast Comparison
January 2020
2019Q4 2020Q1 2020Q2 2020Q3 2020 2021 2022 2023 2024 2025
Real GDP, Percent Change, Annual Rate
ERFC (February Preliminary) 1.8 1.7 2.0 1.9 1.9 1.9 1.9 2.0 2.0 2.0
IHS 1.8 1.7 2.4 2.5 2.1 2.1 1.7 1.5 1.8 2.2
Economy.com 2.2 1.5 2.2 1.5 1.8 2.0
Blue Chip Average* 2.0 1.6 1.9 1.8 1.9 1.9 1.9 2.0 2.0 2.0
Blue Chip Top 10* 2.6 2.3 2.6 2.3 2.3 2.3 2.3 2.4 2.3 2.2
Blue Chip Bottom 10* 1.4 1.0 1.1 1.3 1.8 1.5 1.6 1.6 1.6 1.7
Real Consumption, Percent Change, Annual Rate
ERFC (February Preliminary) 2.3 2.0 2.1 2.0 2.4 2.1 2.0 2.2 2.1 2.1
IHS 2.3 2.9 2.7 2.8 2.8 2.7 2.3 2.2 2.2 2.4
Economy.com 2.1 1.4 1.5 1.1 1.9 1.4
Blue Chip Average* 2.2 2.1 2.1 2.0 2.4 2.1 2.0 2.2 2.1 2.1
Blue Chip Top 10* 2.8 2.7 2.6 2.5 2.7 2.5 2.4 2.7 2.5 2.3
Blue Chip Bottom 10* 1.7 1.3 1.5 1.4 1.9 1.7 1.7 1.7 1.8 1.9
Federal Funds Rate
ERFC (February Preliminary) 1.7 1.6 1.6 1.6 1.6 1.8 2.1 2.4 2.6 2.6
IHS 1.7 1.6 1.6 1.6 1.6 1.8 2.1 2.4 2.6 2.6
Economy.com 1.7 1.6 1.6 1.6 1.6 1.7
Three Month T-Bill Rate
ERFC (February Preliminary) 1.6 1.5 1.5 1.5 1.5 1.6 2.0 2.1 2.3 2.3
IHS 1.6 1.5 1.5 1.5 1.5 1.6 1.9 2.1 2.4 2.4
Blue Chip Average* 1.6 1.6 1.5 1.5 1.5 1.4 2.0 2.1 2.2 2.3
Blue Chip Top 10* 1.6 1.6 1.6 1.7 1.7 1.8 2.6 2.8 2.9 2.9
Blue Chip Bottom 10* 1.6 1.5 1.3 1.1 1.2 0.9 1.4 1.5 1.6 1.7
10-Yr. T-Note Yield
ERFC (February Preliminary) 1.8 2.0 2.2 2.3 2.2 2.7 3.0 2.9 2.9 2.9
IHS 1.8 2.0 2.1 2.3 2.2 2.7 2.9 3.0 3.0 3.1
Economy.com 1.8 2.1 2.2 2.2 2.2 2.7
Blue Chip Average* 1.8 1.8 1.9 1.9 1.9 2.1 2.6 2.8 2.9 3.0
Blue Chip Top 10* 1.8 2.0 2.2 2.3 2.2 2.6 3.3 3.4 3.6 3.7
Blue Chip Bottom 10* 1.8 1.7 1.6 1.6 1.6 1.6 1.8 2.1 2.2 2.3
Consumer Price Index, Percent Change, Annual Rate
ERFC (February Preliminary) 3.0 1.6 1.5 1.5 1.9 1.8 2.2 2.2 2.2 2.2
IHS 2.7 1.8 1.6 1.1 1.8 1.7 2.5 2.6 2.5 2.4
Economy.com 2.5 2.3 1.9 2.4 2.3 2.4
Blue Chip Average* 2.4 2.2 2.1 2.0 2.2 2.0 2.2 2.2 2.2 2.2
Blue Chip Top 10* 2.8 3.0 2.6 2.5 2.5 2.5 2.5 2.5 2.5 2.4
Blue Chip Bottom 10* 1.8 1.6 1.6 1.3 1.8 1.6 1.9 1.9 1.9 1.9
Payroll Employment, Millions
ERFC (February Preliminary) 152.2 152.7 153.3 153.3 153.2 154.2 155.2 155.6 155.8 156.3
Percent Change, Annual Rate 1.5 1.4 1.5 0.1 1.2 0.6 0.7 0.2 0.2 0.3
IHS 152.2 152.7 153.3 153.4 153.3 154.4 155.1 155.2 155.4 156.0
Percent Change, Annual Rate 1.6 1.3 1.6 0.4 1.2 0.8 0.5 0.1 0.1 0.4
Economy.com 152.2 152.6 153.2 153.2 153.1 153.8
Percent Change, Annual Rate 1.5 1.2 1.5 0.0 1.1 0.4
Unemployment Rate, Percent
ERFC (February Preliminary) 3.5 3.5 3.5 3.5 3.5 3.7 3.8 4.0 4.2 4.3
IHS 3.5 3.5 3.4 3.5 3.5 3.5 3.8 4.2 4.5 4.5
Economy.com 3.5 3.5 3.5 3.5 3.5 4.0
Blue Chip Average* 3.6 3.6 3.6 3.6 3.6 3.7 4.1 4.1 4.1 4.1
Blue Chip Top 10* 3.6 3.7 3.9 4.0 4.0 4.4 4.7 4.7 4.6 4.6
Blue Chip Bottom 10* 3.5 3.4 3.4 3.3 3.4 3.2 3.5 3.5 3.6 3.6
Real Disposable Personal Income, Percent Change, Annual Rate
ERFC (February Preliminary) 1.6 2.1 1.5 1.8 1.9 2.0 2.1 1.8 1.9 2.3
IHS 1.8 2.3 1.9 2.5 2.2 2.6 2.2 2.0 2.2 2.5
Blue Chip Average* 2.1 2.2 2.0 1.9 2.1 2.0 2.0 2.0 2.0 2.0
Blue Chip Top 10* 2.9 2.7 2.8 2.5 2.6 2.5 2.4 2.5 2.5 2.4
Blue Chip Bottom 10* 1.3 1.5 1.3 1.3 1.6 1.5 1.5 1.5 1.5 1.6
West Texas Intermediate
ERFC (February Preliminary) 57.0 55.4 54.1 53.2 53.7 50.6 49.5 49.4 49.8 50.4
IHS 56.7 56.9 55.9 52.0 52.7 47.5 52.4 58.1 62.1 66.4
Economy.com 56.9 60.1 60.1 60.3 60.2 61.3
CME Group (10/12/2016) #REF! #REF! #REF! #REF! #REF! #REF! #REF! 50.6
* Forecasts beyond 2021 are from the October 2019 Blue Chip Economic Indicators
Economic and Revenue Forecast Council 21

U.S. Forecast Comparison
2019Q4 2020Q1 2020Q2 2020Q3 2019 2020 2021 2022 2023 2024 2025
Real GDP (Billions of 2012 Dollars)
February Forecast, Preliminary 19,208 19,290 19,385 19,474 19,069 19,429 19,801 20,177 20,581 20,993 21,412
Percent Change 1.8% 1.7% 2.0% 1.9% 2.3% 1.9% 1.9% 1.9% 2.0% 2.0% 2.0%
November Forecast 19,188 19,271 19,358 19,440 19,063 19,397 19,746 20,121 20,523
Percent Change 1.6% 1.7% 1.8% 1.7% 2.3% 1.8% 1.8% 1.9% 2.0%
Real Consumption (Billions of 2012 Dollars)
February Forecast, Preliminary 13,430 13,496 13,564 13,632 13,284 13,600 13,886 14,164 14,475 14,779 15,090
Percent Change 2.3% 2.0% 2.1% 2.0% 2.6% 2.4% 2.1% 2.0% 2.2% 2.1% 2.1%
November Forecast 13,410 13,479 13,547 13,607 13,277 13,574 13,832 14,108 14,419
Percent Change 2.0% 2.1% 2.0% 1.8% 2.6% 2.2% 1.9% 2.0% 2.2%
PCE Price Index (2012=100)
February Forecast, Preliminary 110.4 110.9 111.3 111.8 109.7 111.6 113.6 115.8 118.1 120.4 122.7
Percent Change 1.9% 1.5% 1.6% 1.7% 1.4% 1.7% 1.8% 2.0% 2.0% 2.0% 1.9%
November Forecast 110.6 111.1 111.6 112.2 109.7 111.9 114.0 116.3 118.6
Percent Change 2.2% 2.0% 1.9% 1.9% 1.5% 2.0% 1.9% 2.0% 2.0%
Real Personal Income (Billions of 2012 Dollars)
February Forecast, Preliminary 17,104 17,194 17,262 17,340 16,983 17,304 17,661 18,061 18,438 18,859 19,326
Percent Change 1.8% 2.1% 1.6% 1.8% 3.1% 1.9% 2.1% 2.3% 2.1% 2.3% 2.5%
November Forecast 17,139 17,219 17,275 17,331 17,014 17,306 17,644 18,063 18,511
Percent Change 1.5% 1.9% 1.3% 1.3% 3.3% 1.7% 2.0% 2.4% 2.5%
Nonfarm Payroll Employment (Millions)
February Forecast, Preliminary 152.2 152.7 153.3 153.3 151.4 153.2 154.2 155.2 155.6 155.8 156.3
Percent Change 1.5% 1.4% 1.5% 0.1% 1.6% 1.2% 0.6% 0.7% 0.2% 0.2% 0.3%
November Forecast 152.2 152.6 153.1 153.2 151.4 153.1 154.0 154.8 155.4
Percent Change 1.4% 1.1% 1.5% 0.3% 1.6% 1.1% 0.6% 0.5% 0.4%
Unemployment Rate (Percent of Labor Force)
February Forecast, Preliminary 3.5 3.5 3.5 3.5 3.7 3.5 3.7 3.8 4.0 4.2 4.3
November Forecast 3.5 3.5 3.5 3.5 3.7 3.5 3.7 3.9 4.1
Oil Price, Refiner's Acquisition
February Forecast, Preliminary 58.1 56.6 54.5 53.2 59.4 54.1 50.9 50.0 50.0 50.5 51.1
November Forecast 56.7 57.1 55.8 54.8 59.0 55.4 53.0 52.3 52.3
30 Year Fixed Mortgage Rate (Percent, average)
February Forecast, Preliminary 3.7 3.9 4.0 4.0 3.9 4.0 4.3 4.5 4.5 4.6 4.6
November Forecast 3.7 3.8 3.9 4.0 3.9 3.9 4.4 4.5 4.6
3 Month T-Bill Rate (Percent, average)
February Forecast, Preliminary 1.6 1.5 1.5 1.5 2.1 1.5 1.6 2.0 2.1 2.3 2.3
November Forecast 1.6 1.6 1.5 1.5 2.1 1.5 1.8 2.2 2.4
Economic and Revenue Forecast Council 22

Washington Forecast Comparison
2019Q4 2020Q1 2020Q2 2020Q3 2019 2020 2021 2022 2023 2024 2025
Real Personal Income (Billions of 2012 Dollars)
February Forecast, Preliminary 456.1 459.0 462.0 464.4 450.9 463.1 474.4 486.7 499.5 514.2 529.5
Percent Change 2.2% 2.6% 2.7% 2.0% 4.3% 2.7% 2.4% 2.6% 2.6% 2.9% 3.0%
November Forecast 451.1 452.8 455.4 457.1 447.7 456.1 466.9 479.4 493.8
Percent Change 1.7% 1.5% 2.3% 1.5% 3.6% 1.9% 2.3% 2.7% 3.0%
Personal Income (Billions of Dollars)
February Forecast, Preliminary 503.7 508.9 514.3 519.1 494.6 516.6 538.9 563.7 589.9 619.2 650.0
Percent Change 4.2% 4.2% 4.3% 3.7% 5.8% 4.4% 4.3% 4.6% 4.6% 5.0% 5.0%
November Forecast 498.6 503.1 508.3 512.7 491.3 510.4 532.5 557.6 585.7
Percent Change 4.1% 3.6% 4.2% 3.5% 5.1% 3.9% 4.3% 4.7% 5.0%
Disposable Personal Income (Billions of Dollars)
February Forecast, Preliminary 447.8 452.5 457.3 461.6 440.1 459.4 479.5 501.4 523.3 547.5 573.8
Percent Change 3.9% 4.3% 4.3% 3.8% 5.3% 4.4% 4.4% 4.6% 4.4% 4.6% 4.8%
November Forecast 444.5 448.7 453.4 457.5 437.7 455.4 475.7 498.2 522.2
Percent Change 4.3% 3.9% 4.2% 3.6% 4.8% 4.0% 4.5% 4.7% 4.8%
Nonfarm Payroll Employment (Thousands)
February Forecast, Preliminary 3495 3513 3533 3538 3470 3533 3572 3612 3636 3658 3678
Percent Change 1.5% 2.1% 2.3% 0.6% 1.9% 1.8% 1.1% 1.1% 0.7% 0.6% 0.6%
November Forecast 3494 3504 3524 3530 3470 3524 3561 3595 3623
Percent Change 1.5% 1.2% 2.3% 0.7% 1.9% 1.6% 1.1% 1.0% 0.8%
Unemployment Rate (Percent of Labor Force)
February Forecast, Preliminary 4.4 4.3 4.2 4.3 4.6 4.3 4.5 4.7 4.9 5.1 5.2
November Forecast 4.5 4.5 4.5 4.5 4.6 4.5 4.7 4.9 5.1
Manufacturing Employment (Thousands)
February Forecast, Preliminary 293.2 294.3 293.2 291.5 293.5 292.4 289.9 291.5 293.2 293.9 293.3
Percent Change -1.4% 1.6% -1.6% -2.3% 2.1% -0.4% -0.8% 0.6% 0.6% 0.2% -0.2%
November Forecast 295.0 295.2 294.1 292.8 294.5 293.5 291.3 293.0 295.5
Percent Change -1.3% 0.2% -1.4% -1.9% 2.4% -0.3% -0.8% 0.6% 0.9%
Construction Employment (Thousands)
February Forecast, Preliminary 221.9 222.5 222.2 220.8 219.1 221.3 216.8 214.5 212.4 212.2 212.3
Percent Change 4.1% 1.1% -0.6% -2.4% 2.7% 1.0% -2.1% -1.1% -1.0% -0.1% 0.1%
November Forecast 221.4 219.7 218.8 217.6 218.9 218.2 214.0 212.5 211.8
Percent Change 3.5% -3.0% -1.7% -2.0% 2.6% -0.3% -1.9% -0.7% -0.3%
Housing Permits (Thousands)
February Forecast, Preliminary 54.3 44.9 44.8 44.6 48.6 44.6 43.3 43.1 42.7 42.0 41.3
Percent Change 63.5% -53.2% -0.7% -1.4% 1.9% -8.3% -2.9% -0.5% -0.8% -1.7% -1.5%
November Forecast 43.2 43.9 43.8 43.5 45.9 43.6 42.5 42.2 41.6
Percent Change -34.4% 6.5% -0.8% -2.2% -3.9% -5.0% -2.5% -0.6% -1.4%
Economic and Revenue Forecast Council 23

U.S. Forecast Comparison Fiscal Years
2020 2021 2022 2023 2024 2025
Real GDP
Billions of 2012 dollars
February Preliminary Forecast 19,251 19,614 19,989 20,376 20,786 21,201
Growth 2.0% 1.9% 1.9% 1.9% 2.0% 2.0%
November Forecast 19,233 19,568 19,928 20,320
Growth 1.9% 1.7% 1.8% 2.0%
Difference in level 18 45 61 56
Difference in growth forecast 0.1% 0.1% 0.1% 0.0%
Real Consumption
Billions of 2012 dollars
February Preliminary Forecast 13,461 13,743 14,022 14,317 14,628 14,933
Growth 2.7% 2.1% 2.0% 2.1% 2.2% 2.1%
November Forecast 13,445 13,699 13,967 14,260
Growth 2.6% 1.9% 2.0% 2.1%
Difference in level 16 44 55 57
Difference in growth forecast 0.1% 0.2% 0.1% 0.0%
PCE Price Index
2012 = 100
February Preliminary Forecast 110.6 112.5 114.7 116.9 119.3 121.6
Growth 1.6% 1.7% 1.9% 1.9% 2.0% 1.9%
November Forecast 110.8 113.0 115.2 117.4
Growth 1.8% 1.9% 2.0% 2.0%
Difference in level -0.2 -0.4 -0.4 -0.5
Difference in growth forecast -0.2% -0.2% 0.0% 0.0%
Unemployment Rate
Percent of Labor Force
February Preliminary Forecast 3.5% 3.6% 3.7% 3.9% 4.1% 4.3%
November Forecast 3.5% 3.6% 3.8% 4.0%
Difference in forecast 0.0% 0.0% -0.1% -0.2%
30 Year Fixed Mortgage Rate
Annual Average
February Preliminary Forecast 3.8% 4.2% 4.5% 4.5% 4.6% 4.6%
November Forecast 3.8% 4.2% 4.5% 4.6%
Difference in forecast 0.0% 0.0% 0.0% -0.1%
3 Month T-Bill Rate
Annual Average
February Preliminary Forecast 1.7% 1.5% 1.8% 2.0% 2.2% 2.3%
November Forecast 1.7% 1.6% 2.1% 2.3%
Difference in forecast 0.0% -0.1% -0.2% -0.2%
Economic and Revenue Forecast Council 24
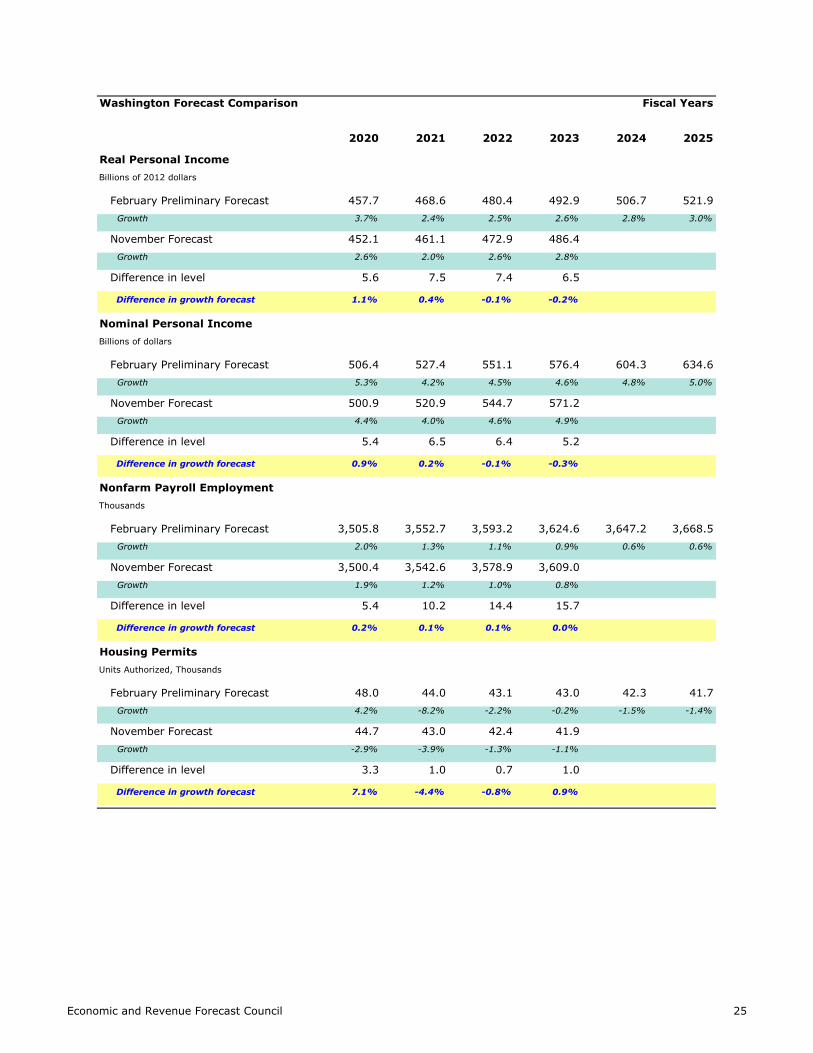
Washington Forecast Comparison Fiscal Years
2020 2021 2022 2023 2024 2025
Real Personal Income
Billions of 2012 dollars
February Preliminary Forecast 457.7 468.6 480.4 492.9 506.7 521.9
Growth 3.7% 2.4% 2.5% 2.6% 2.8% 3.0%
November Forecast 452.1 461.1 472.9 486.4
Growth 2.6% 2.0% 2.6% 2.8%
Difference in level 5.6 7.5 7.4 6.5
Difference in growth forecast 1.1% 0.4% -0.1% -0.2%
Nominal Personal Income
Billions of dollars
February Preliminary Forecast 506.4 527.4 551.1 576.4 604.3 634.6
Growth 5.3% 4.2% 4.5% 4.6% 4.8% 5.0%
November Forecast 500.9 520.9 544.7 571.2
Growth 4.4% 4.0% 4.6% 4.9%
Difference in level 5.4 6.5 6.4 5.2
Difference in growth forecast 0.9% 0.2% -0.1% -0.3%
Nonfarm Payroll Employment
Thousands
February Preliminary Forecast 3,505.8 3,552.7 3,593.2 3,624.6 3,647.2 3,668.5
Growth 2.0% 1.3% 1.1% 0.9% 0.6% 0.6%
November Forecast 3,500.4 3,542.6 3,578.9 3,609.0
Growth 1.9% 1.2% 1.0% 0.8%
Difference in level 5.4 10.2 14.4 15.7
Difference in growth forecast 0.2% 0.1% 0.1% 0.0%
Housing Permits
Units Authorized, Thousands
February Preliminary Forecast 48.0 44.0 43.1 43.0 42.3 41.7
Growth 4.2% -8.2% -2.2% -0.2% -1.5% -1.4%
November Forecast 44.7 43.0 42.4 41.9
Growth -2.9% -3.9% -1.3% -1.1%
Difference in level 3.3 1.0 0.7 1.0
Difference in growth forecast 7.1% -4.4% -0.8% 0.9%
Economic and Revenue Forecast Council 25

U.S.
(000) % Chg. % Chg.
Total 65.2 1.9% 1.5%
Electronic Shopping and Mail-Order Houses 11.8 21.0% -3.4%
Software Publishers 4.7 7.0% 7.1%
Information Excluding Software 4.6 6.6% -0.9%
Other Services 5.5 4.5% 1.5%
Transportation, Warehousing and Utilities 3.2 2.8% 1.0%
Professional and Business Services 11.6 2.7% 2.0%
Education and Health Services 11.2 2.3% 2.8%
Financial Activities 3.4 2.1% 1.4%
Aerospace Product and Parts Manufacturing 1.8 2.1% 3.6%
State and Local Gov Non-Education 3.7 1.7% 1.1%
Construction 3.6 1.7% 2.0%
Leisure and Hospitality 5.0 1.4% 2.5%
Wholesale Trade 1.3 0.9% 1.1%
State and Local Gov Education 0.0 0.0% 0.6%
Manufacturing Excluding Aerospace -0.4 -0.2% 0.5%
Mining and Logging -0.6 -9.5% -1.1%
Information 9.4 6.8% 0.2%
Retail Trade 4.7 1.2% -0.2%
Manufacturing 1.4 0.5% 0.6%
Source: WA State ERFC Kalman filtered data, U.S. Bureau of Labor Statistics
Year-Over-Year Employment Growth by Industry
(November 2018 to November 2019)
Washington vs. U.S.Washington
Economic and Revenue Forecast Council 26