economic reforms and infrastructure spending · affected the composition of provincial public...
TRANSCRIPT
Copyright © UNU-WIDER 2009 1 National Institute of Public Finance and Policy, New Delhi, India, e-mail: [email protected]; 2 Fudan University, China, e-mail: [email protected] This study has been prepared within the UNU-WIDER project on Southern Engines of Global Growth, co-directed by Amelia U. Santos-Paulino and Guanghua Wan. UNU-WIDER gratefully acknowledges the financial contributions to the research programme by the governments of Denmark (Royal Ministry of Foreign Affairs), Finland (Ministry for Foreign Affairs), Norway (Royal Ministry of Foreign Affairs), Sweden (Swedish International Development Cooperation Agency—Sida) and the United Kingdom (Department for International Development). ISSN 1810-2611 ISBN 978-92-9230-216-0
Research Paper No. 2009/43 Economic Reforms and Infrastructure Spending Evidence from China and India Pinaki Chakraborty1 and Yan Zhang2 August 2009
Abstract
This paper examines the country specific effect of policy reform on infrastructure spending in China and India. In China we have examined how marketization and decentralization has affected the composition of provincial public expenditure and in the case of India we have examined the impact of fiscal reforms on sub-national infrastructure spending. It is observed that in China with a lower marketization level in 1986–1992, fiscal decentralization had positive effect on development expenditure and negative effect on other expenditure. However, when the marketization level increased, such effects were reversed. In the case of India, the econometric estimates revealed that, in the post-economic liberalization era, financial sector reforms and fiscal reforms have adversely affected the sub-national finances and thereby the infrastructure spending. The fiscal intervention dummy found to be negative for all the sectoral expenditure, though it was expansionary for total expenditure, implying it to be committed/non-developmental expenditure driven. Thus, to conclude, as the fiscal space has been shrinking due to reform, there is an urgent need and more so in India for corrective measures to increase the fiscal space for higher infrastructure spending.
Keywords: fiscal reforms, infrastructure spending, decentralization
JEL classification: H54
The World Institute for Development Economics Research (WIDER) was established by the United Nations University (UNU) as its first research and training centre and started work in Helsinki, Finland in 1985. The Institute undertakes applied research and policy analysis on structural changes affecting the developing and transitional economies, provides a forum for the advocacy of policies leading to robust, equitable and environmentally sustainable growth, and promotes capacity strengthening and training in the field of economic and social policy making. Work is carried out by staff researchers and visiting scholars in Helsinki and through networks of collaborating scholars and institutions around the world.
www.wider.unu.edu [email protected]
UNU World Institute for Development Economics Research (UNU-WIDER) Katajanokanlaituri 6 B, 00160 Helsinki, Finland Typescript prepared by Janis Vehmaan-Kreula at UNU-WIDER The views expressed in this publication are those of the author(s). Publication does not imply endorsement by the Institute or the United Nations University, nor by the programme/project sponsors, of any of the views expressed.
Tables and figures appear at the end of the paper

1
1 Introduction
The 1990s has seen significant economic reforms in China and India aimed at opening up of the economy, greater marketization and globalization in both countries. The economic reforms programme in India was initiated due to the unprecedented macroeconomic crisis of 1991 reflected in burgeoning public sector deficits and debt, widening current account deficits in external account and dwindling foreign exchange reserves. In China also, the progress of marketization started since Deng Xiaoping’s talk in 1992. Also the year 1994 witnessed the tax sharing reform in China, which adjusted the tax authority of central and provincial governments in China. One of the major components of macro policy reforms in India is fiscal policy reform. Fiscal consolidation measures that initially began at the central government level to control burgeoning public sector deficit, gradually spread over to the sub-national level through reforms in tax and expenditure policies. This paper explores how fiscal decentralization and marketization affected the composition of provincial public expenditure in China and also examines the impact of fiscal reforms in social and economic infrastructure spending in India. The paper takes a broader definition of infrastructure encompassing social and economic infrastructure spending in both countries.
The paper has been divided into the following sections. In Section 2, we undertake a comparative analysis of the growth performance and spending on social and economic infrastructure in China and India vis-à-vis other developed and developing countries. In Section 3, a comparative analysis of structure of government expenditure spending in social and economic infrastructure of both countries is undertaken. In Section 4, we examine how the fiscal reform in India and fiscal decentralization and marketization in China has affected the composition of public expenditure spending in China and India in infrastructure. Section 5, summarizes and draws conclusions.
2 Social and economic infrastructure spending and growth: a comparison
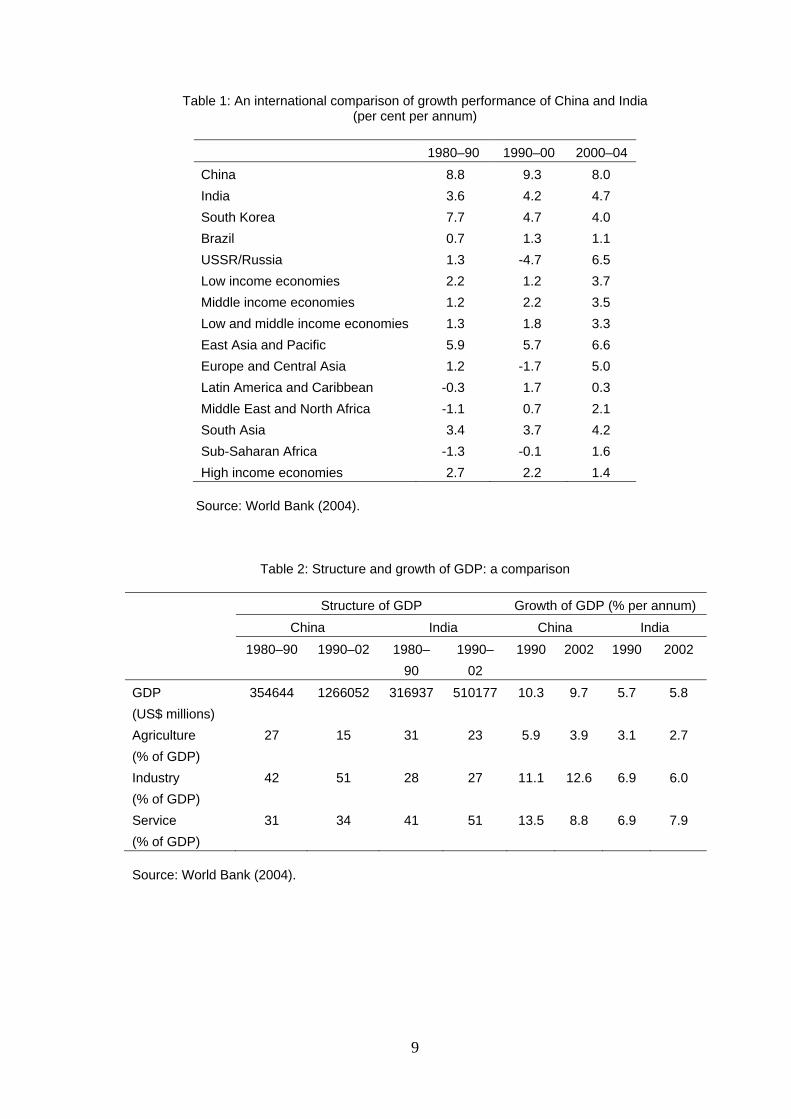
Prima-facie, there should be no mistake that the immediate dynamics behind China’s sustained rapid economic growth over the past quarter century is a process of very rapid industrialization (Lo and Li 2006). In India, the economic growth in recent years has been attributed to the economic reforms towards greater marketization and globalization. In India, sustained increase in growth is observed from the 1980s and it accelerated further during the decade of 1990s and 2000. In an international perspective, if we look at, among all the countries and regions (Table 1), China has been the fastest growing followed by South Korea, though India has surpassed South Korea’s growth performance during the decade of 2000. Compared to other developing countries, China and India show spectacularly high growth during recent years.
Four main factors have distinguished China’s industrialization—a 43 per cent domestic savings rate, impressive progress in building infrastructure, surging foreign direct investment (FDI) and a vast reservoir of hard-working, low-cost labour (Roach 2004). By contrast, India’s national savings rate is only 24 per cent; its infrastructure is in terrible shape; and its ability to attract FDI—which ran at only US$4bn in 2003 pales in comparison with the US$53bn that poured into China in each of the last two years (Roach 2004). It is argued that the service sector led growth in India has sidestepped the savings, infrastructure and FDI constraints that have long hobbled its manufacturing strategy. It is evident from Table 2, the share of service sector in GDP is much higher in
2
India vis-à-vis China and has been increasing at a faster rate. In China, service sector growth has declined from 13.5 to 8.8 per cent between 1990 and 2002, while in India, it increased from 6.9 to 7.9 per cent during the same period.
The infrastructure spending, being the focus, we examine in detail the social and economic infrastructure spending in both the countries (Table 3). The social sector spending and achievement in both the countries show that though India spends more than 4 per cent of GDP on education compared to 2 per cent of GDP in China, China’s achievement in education is far superior than in India. It is interesting to note that pupil-teacher ratio in China is just half of that in India. The literacy is also at 91 per cent compared to 61 per cent in India. Unlike education, China’s spending on health is double than that of India. Also, the indicators of health outcome shows improved performance in China vis-à-vis India. Disparities in spending on social infrastructure though show a contrasting picture with regard to health and education, while outcomewise China outweighs Indian performance in both the sectors.
If we look at the investment in physical infrastructure (Table 4), China spends 9 per cent of its GDP on physical infrastructure while India spends only 3.6 per cent of GDP on physical infrastructure. The composition of physical infrastructure spending in China reveals that transport constitutes around 50 per cent of the total infrastructure spending followed by electricity at 40 per cent and the rest is spent on communication and urban infrastructure. While in India, less than 50 per cent of the total infrastructure spending is on transport followed by electricity and communication. The allocation for urban infrastructure is dismally low at 0.1 per cent of GDP.
3 Size and structure of government expenditure
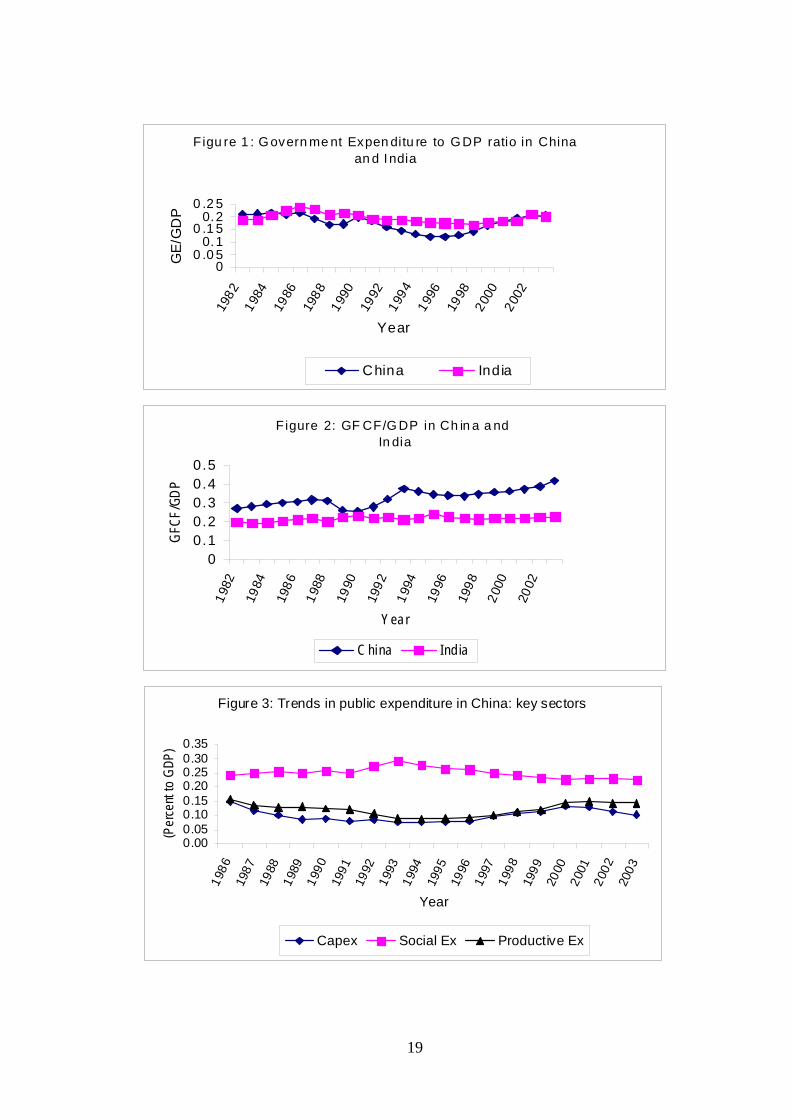
A comparison of the size of the government measured in terms of government expenditure to GDP ratio in both countries shows that government expenditure remained much higher in India vis-à-vis China during the decades of 1990s.1 However, between 1999–2000 onwards, both the ratios converged at around 20 per cent of GDP. (Figure 1). Although the size of the government expenditure in India remains consistently higher, the gross fixed capital formation in China is much higher in China vis-à-vis India (Figure 2). It is evident that the gap in capital formation between China and India is also widening in recent years.
Figures 3 and 4 shows the trend in public expenditure spending in key infrastructure sectors in both the countries. As evident from Figure 3, capital expenditure spending in China shows a cyclical movement between 1986 and 2003, with a surge in expenditure from the early 1990s and a fall from 2000 onwards. The social and other productive expenditures also show a gradual decline during the 1990s. The differences in public expenditure composition in China across regions and over time are shown in Table 5. It is evident from the table that there is no difference in social sector spending across East, Central and Western provinces. However, Central Provinces spend much less on capital formation vis-à-vis other regions. The ratio of productive expenditure to GDP ratio is highest in Western provinces among all the regions. In India social services expenditure
1 This period coincides with the period of economic reform, when there was a large scale fiscal retrenchment in India at State and Central level.
3
to GDP ratio declined sharply from the mid 1990s, while the economic services expenditure showed an increase during the same period. The capital expenditure to GDP ratio showed a decline from the early 1990s, and remained stagnant during the later half of the 1990s. But it started increasing from 2002–03 onwards.
Like China (Table 5), and in the case of India also, we have also examined the profile of expenditure, both current and capital, and also examined whether there has been a qualitative shift in the structure of total government expenditure towards developmental expenditure and infrastructure spending in the post-economic reform period. The study noted that the share of capital or investment spending on social and economic infrastructure declined steadily across States in the post reform period irrespective of the levels of fiscal imbalance of individual States in India (Table 6). The idea is if a State has a higher level of fiscal imbalance, it will have a lower level of fiscal space to spend on infrastructure and for other developmental purposes.
It is to be noted that the States are categorized according to their levels of fiscal imbalance. There are eight categories namely: High and Increasing Fiscal Deficit States (HIFD), High and Declining Fiscal Deficit States (HDFD), Medium and Increasing Fiscal Deficit States (MIFD), Medium and Stagnant Fiscal Deficit States (MSFD), Medium and Declining Fiscal Deficit States (MDFD), Low and Increasing Fiscal Deficit States (LIFD), Low and Stagnant Fiscal Deficit States (LSFD), Low and Declining Fiscal Deficit States (LDFD). The strain of committed expenditures, namely: debt servicing cost also increased significantly across States in the post reform period due to financial liberalization contributing to the lowering of fiscal space. It is particularly more for those States with higher fiscal imbalance.
Apart from the quantitative dimension of the movement of expenditure, we have looked at the qualitative aspect and implications of such a movement through a disaggregated analysis of sectoral expenditure. While looking at the qualitative dimension of fiscal reforms, it should be borne in mind that we are basically looking for a structural shift in government expenditure away from non-developmental to developmental expenditure, particularly in the provision of various publicly provided services. A successful reform programme should look at the optimal provision of expenditure at meeting the deficient delivery of public services. Given the declining capital spending and committed expenditure driven increase in current expenditure, it has been observed that the quality of expenditure across the board has declined. In this context there is an urgent need for expenditure restructuring to free up fiscal resources to improve the quality of spending across sub-national governments in India.
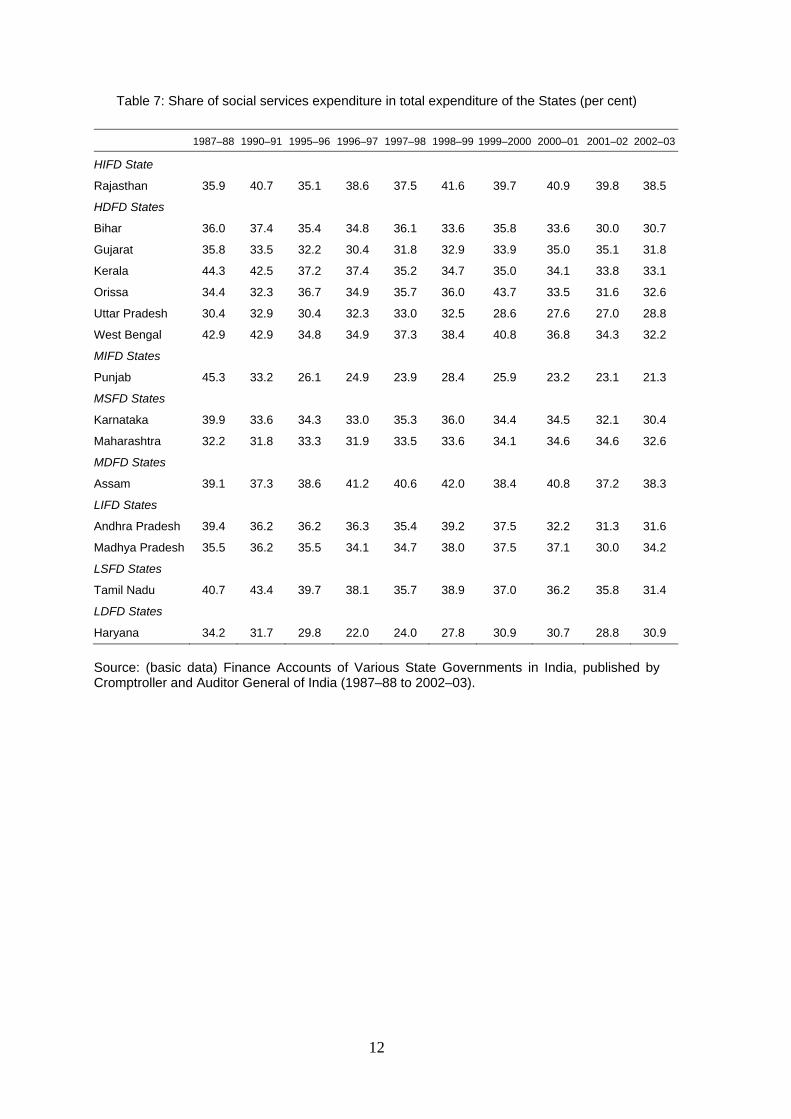
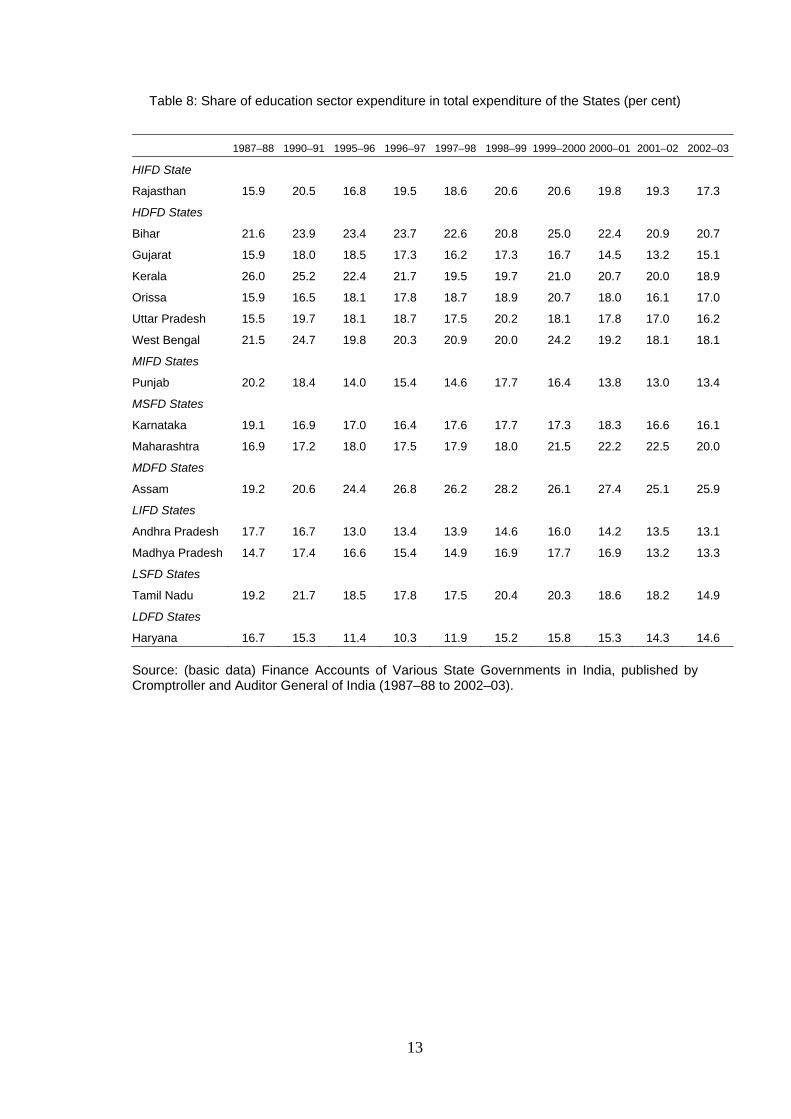
The share of social sector expenditure experienced a sharp fall in Punjab, Kerala, West Bengal, Karnataka, Andhra Pradesh and Tamil Nadu (Table 7). Other States, which experienced a moderate decline in the same share, were Bihar, Gujarat, Orissa, Uttar Pradesh and Haryana. It is important to examine the intra-sectoral allocation within social sector to understand the expenditure priorities of the government within the social sector. Within social services, we have particularly examined what has happened to sectoral expenditure on education and health. It is noteworthy that in many States, the share of education expenditure in total expenditure did not decline as sharply as the aggregate social service expenditure (Table 8). One of the reasons that could be attributed to the maintaining of the share of education expenditure is the increase in the share of elementary education due to the introduction of the nutrition programme and district primary education programme from the mid 1990s. The share of health sector
4
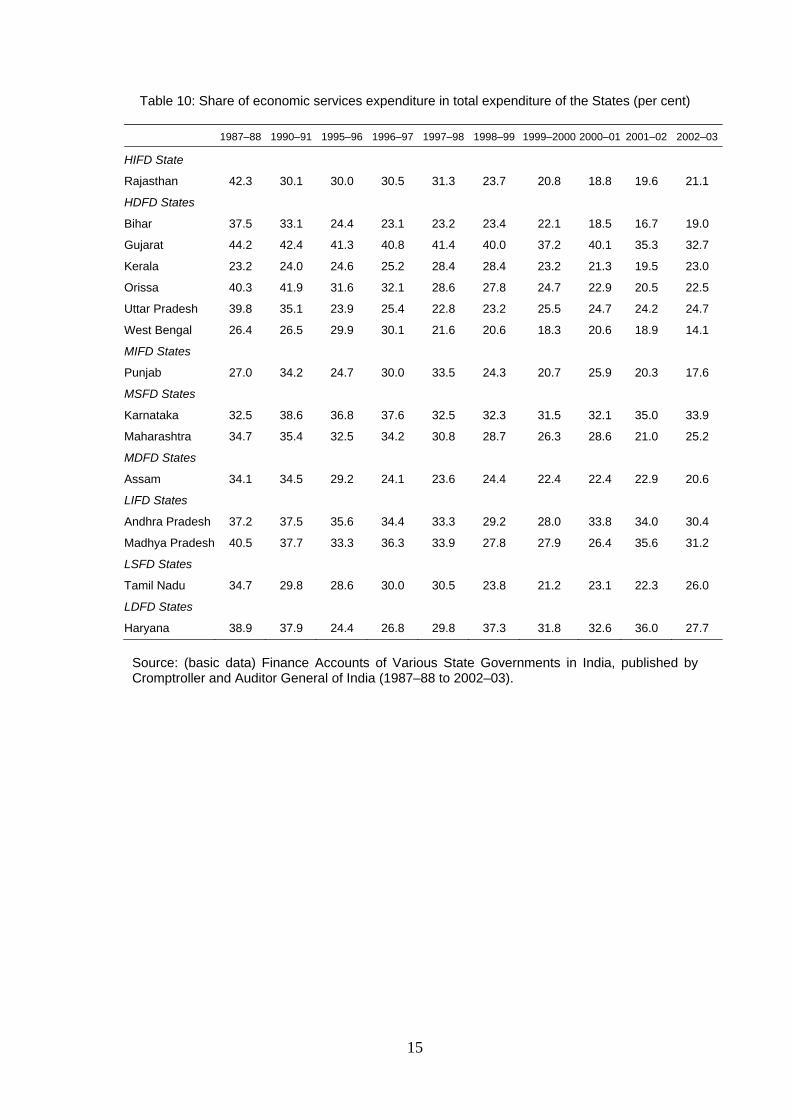
expenditure2 did show a decline in all the States (Table 9). In the context of the economic services expenditures, which by nature are largely economic infrastructure spending, it is to be noted that Kerala and Karnataka, maintained the share of economic services expenditure during this period (Table 10). In all other States, there was a sharp fall in the share of economic services expenditures spent primarily on physical infrastructure.
4 Impact of decentralization, marketization and reforms on infrastructure spending
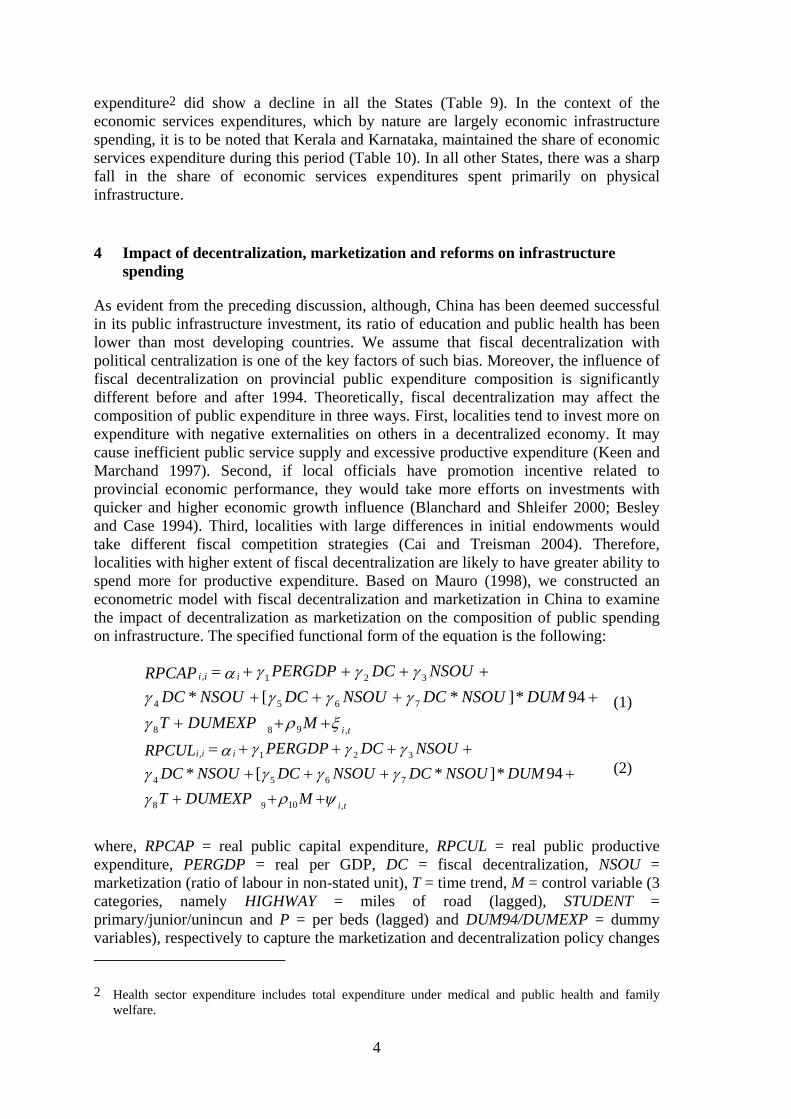
As evident from the preceding discussion, although, China has been deemed successful in its public infrastructure investment, its ratio of education and public health has been lower than most developing countries. We assume that fiscal decentralization with political centralization is one of the key factors of such bias. Moreover, the influence of fiscal decentralization on provincial public expenditure composition is significantly different before and after 1994. Theoretically, fiscal decentralization may affect the composition of public expenditure in three ways. First, localities tend to invest more on expenditure with negative externalities on others in a decentralized economy. It may cause inefficient public service supply and excessive productive expenditure (Keen and Marchand 1997). Second, if local officials have promotion incentive related to provincial economic performance, they would take more efforts on investments with quicker and higher economic growth influence (Blanchard and Shleifer 2000; Besley and Case 1994). Third, localities with large differences in initial endowments would take different fiscal competition strategies (Cai and Treisman 2004). Therefore, localities with higher extent of fiscal decentralization are likely to have greater ability to spend more for productive expenditure. Based on Mauro (1998), we constructed an econometric model with fiscal decentralization and marketization in China to examine the impact of decentralization as marketization on the composition of public spending on infrastructure. The specified functional form of the equation is the following:
ξργγγγγγγγα
+++
++++
++++=
MDUMEXPTDUMNSOUDCNSOUDCNSOUDC
NSOUDCPERGDPRPCAP
ti
iii
9 ,88
7654
321,
94*]*[*
ψργγγγγγγγα
+++
++++
++++=
MDUMEXPTDUMNSOUDCNSOUDCNSOUDC
NSOUDCPERGDPRPCUL
ti
iii
10 ,98
7654
321,
94*]*[*
where, RPCAP = real public capital expenditure, RPCUL = real public productive expenditure, PERGDP = real per GDP, DC = fiscal decentralization, NSOU = marketization (ratio of labour in non-stated unit), T = time trend, M = control variable (3 categories, namely HIGHWAY = miles of road (lagged), STUDENT = primary/junior/unincun and P = per beds (lagged) and DUM94/DUMEXP = dummy variables), respectively to capture the marketization and decentralization policy changes
2 Health sector expenditure includes total expenditure under medical and public health and family welfare.
(1)
(2)

5
and they are time dummys. αi and γi are the coefficients while ξi and ψi are the error terms.
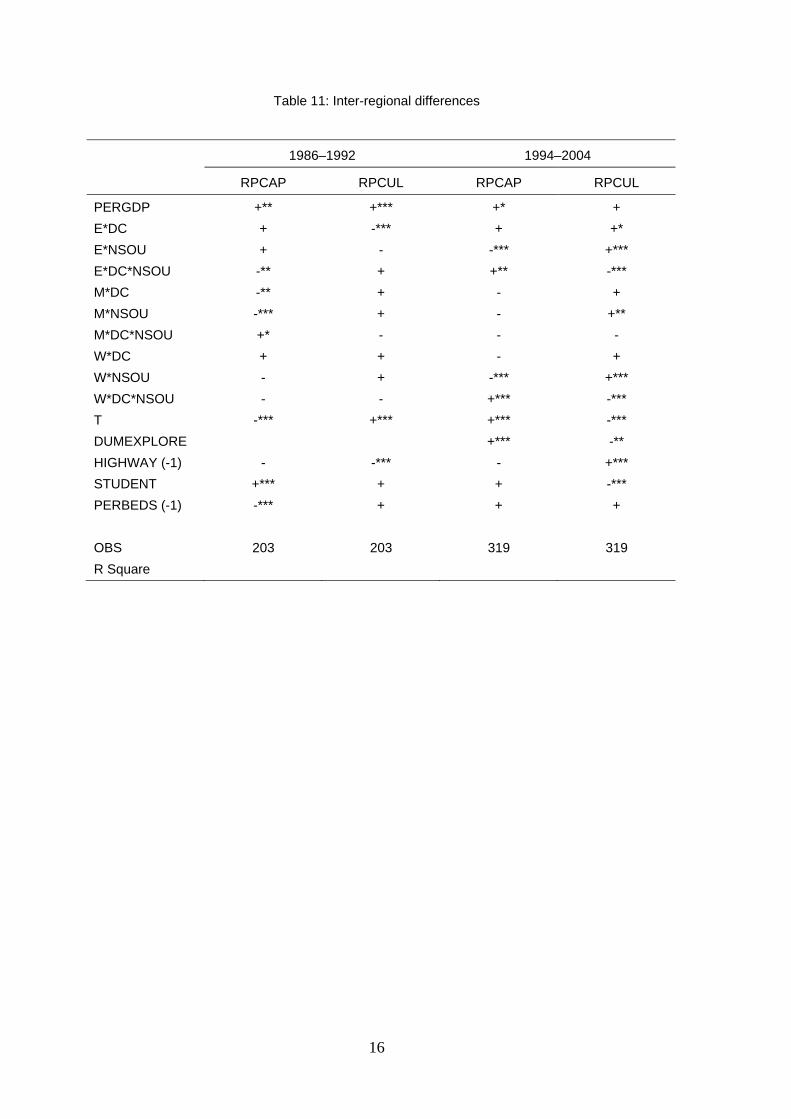
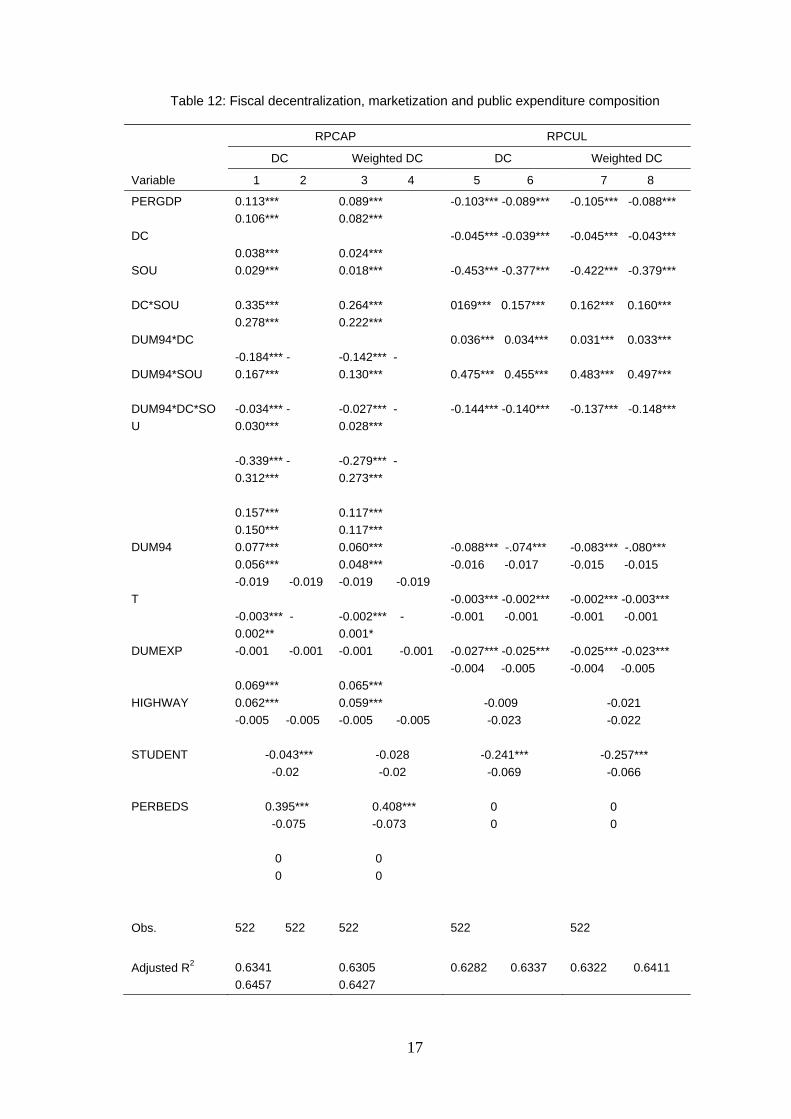
Using panel data, we estimate fixed effect model from 1986 to 2004. The pooled OLS estimates show the intertemporal changes and interregional differences in the relationship between fiscal decentralization, marketization and public expenditure composition (see Tables 11 and 12). Although the effect of fiscal decentralization on the ratio of expenditure on education, science, culture and public health is still negative after 1994, the tax sharing reform significantly decreased the bias of public spending structure. And marketization since 1994 also contributed to the improvement in such ratios. There are also differences among regions in the east, central and west China. It is also observed that the effect of fiscal decentralization on public spending structure depends on the extent of marketization. With a lower marketization level in 1986–1992, fiscal decentralization had positive effect on development expenditure and negative effect on other expenditure. However, when the marketization level is high enough, such effects are reversed.
In the context of India, we examine the impact of fiscal and financial sector reforms on sub-national governments’ social and economic infrastructure spending. We use the panel data set for a period of 16 years from 1987–88 to 2002–03 and estimate fixed effects models. We carry out the analysis for 15 major States, for which the fiscal arrangements are homogenous under the Constitution. The period captures the decade before the economic reforms of 1991–92 and the experience thereafter, to give us an opportunity to capture the impact of reforms on spending and the determinants of spending thereof.
On the basis of the previous discussion, we define infrastructure spending in four ways—capital expenditure, social sector expenditure, education expenditure and health expenditure. We also have examined the impact of reforms on total expenditure at the sub-national level. The research question here is to identify the sign of the sensitivity of reforms and the impact of financial liberalization captured through average cost of borrowing on the sub-national infrastructure spending. Fiscal reform is captured through reform dummy introduced from 1995–96 onwards.
In terms of the determinants of infrastructure spending, apart from the lagged dependent variable, we test our model with four other variables, which have no significant correlation between themselves, as well as with the dependent variable. First, we take the GSDP as the income of the States, to instrument for internal fiscal capacity to spend. Second, lagged dependent variable will have an impact on the dependent variable. Third, we account for the changes in the average cost of debt that accrues to the States. One of the main objectives of this econometric exercise is to determine the impact of financial liberalization captured through the average cost of debt on infrastructure spending, in the context of a policy of gradual deregulatory policy environment. We use the fiscal reform dummy to see the impact of reform on spending on infrastructure. We also introduce a dummy due to the sudden spurt in committed expenditure due to the pay revision of government employees for the period from 1997–98 to 1999–00. This has not been undertaken until now in the literature on India. We specify log-linear estimation equations for the model as follows:

6
μθφδγβα tttttttx SDUFDULRLTELYLTE ++++++= −1, (3)
λθφδγβα tttttttx SDUFDULRLCELYLCE ++++++= −1, (4)
ηθφδγβα tttttttx SDUFDULRLSSLYLSS ++++++= −1, (5)
ξθφδγβα tttttttx SDUFDULRLEducLYLEduc ++++++= −1, (6)
ψθφδγβα tttttttx SDUFDULRLHealthLYLHealth ++++++= −1, (7)
Where LYt = Gross State Domestic Product, TE = Total Expenditure, CE = Capita Expenditure, SS = Expenditure on Social Service, Educ = Expenditure on Education, Health = Expenditure on Health, Yt = and LR= Rate of Interest. t corresponds to current period while t-1 corresponds to previous period.
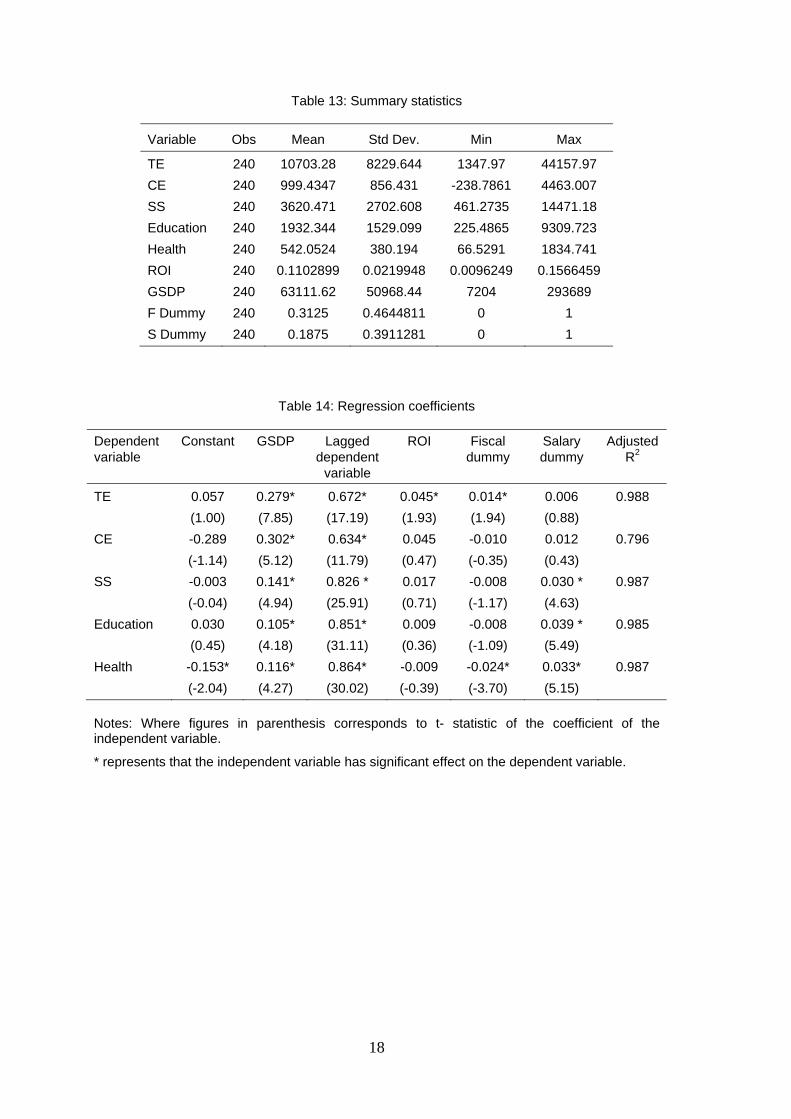
The variable nomenclature is self-explanatory. State-specific factors are denoted by (γ, δ, φ, θ); L are the constant terms; and μt, λt, ηt, ξt and ψt are the error terms. We estimate the two sets of equations separately with alternative specifications of the error terms, testing for heteroscedasticity and autocorrelation between the error terms and the explanatory variables. A summary of the data is given in Table 13. The number of observations is quite large, and we have taken care to choose the period with no missing values in the data. The data set (and the adjustments made thereof) is homogenous across all States in the study. Table 13 reveals that there is enough variability in the data to make the estimation worthwhile. Most of the variables have moved in a broad range over the time period. This gives us hope of getting consistent standard errors to test the sensitivity of the model.
The estimation results are given in Table 14. As noted above, we carry out the same methodology for all five models, attempting therefore to identify the differential impact of the explanatory variables on various components of social and economic infrastructure spending. The estimation results throw up some interesting observations. Comparing the estimates, we find that two of our explanatory variables, namely, GSDP and lagged dependent variables, are strongly significant across the specification. The fit of the models are also satisfactory. However, the financial liberalization captured through the average cost of debt (ROI) is positive and significant with the total expenditure. In other words, increasing average cost of debt had an expansionary effect on government spending. Fiscal intervention dummy also remained positive and significant for total expenditure. The fiscal reform dummy remained negative for all other specification and in case of health it is also significant. The salary dummy is found to be positive and significant for social sector expenditures, including education and health.

7
5 Conclusions
The economic reform programme that was initiated in India due to the unprecedented macroeconomic crisis of 1991 and the progress of decentralization and marketization started in China during the 1990s has influenced the economic performance of both countries in many ways. Our focus being policy reform and infrastructure spending, we have examined the country specific effect of these policies on infrastructure spending. In China we have examined how marketization and decentralization has affected the composition of provincial public expenditure and in the case of India we have examined the impact of fiscal reforms in sub-national infrastructure spending. The paper took a broader definition of infrastructure encompassing social and economic infrastructure spending in both countries.
The study noted that although the effect of fiscal decentralization on the ratio of expenditure on education, science, culture and public health is still negative after 1994, the tax sharing reform significantly decreased the bias of public spending structure. And marketization since 1994 also contributed to the improvement in such ratios. There are also differences among regions in the east, central and west China. It is also observed that the effect of fiscal decentralization on public spending structure depends on the extent of marketization. With a lower marketization level in 1986–1992, fiscal decentralization had positive effect on development expenditure and negative effect on other expenditure. However, when the marketization level is high enough, such effects are reversed.
In the case of India, we have examined the profile of expenditure, both current and capital, and also examined whether there has been a qualitative shift in the structure of total government expenditure towards developmental expenditure and infrastructure spending in the post-economic reform period. The study noted that the share of capital or investment spending on social and economic infrastructure declined steadily across States during this period. While looking at the qualitative dimension of fiscal reforms, it has been observed that the quality of expenditure across the board has declined. The econometric estimates reveal that unlike in China, in the post-economic liberalization era in India, financial sector reforms and fiscal reforms have adversely affected the sub-national finances and thereby the infrastructure spending. The fiscal intervention dummy found to be negative for all the sectoral expenditure, though it was expansionary for total expenditure, implying the total expenditure is committed/non-developmental expenditure driven. Thus, to conclude, as the fiscal space has been shrinking due to reform and thereby the infrastructure spending particular in India, there is an urgent need for corrective measures to increase the fiscal space for developmental fiscal needs to provide greater growth stimulus by higher spending on infrastructure. Also there is an urgent need for expenditure restructuring to free up fiscal resources to improve the quality of spending.

8
References
Besley, T., and A. Case (1994). ‘Unnatural Experiments? Estimating the Incidence of Endogenous Policies’. NBER Working Papers 4956. Cambridge MA: National Bureau of Economic Research.
Blanchard, O., and A. Shleifer (2000). ‘Federalism with and without Political Centralization: China versus Russia’. NBER Working Papers 7616. Cambridge MA: National Bureau of Economic Research.
Cai, H., and D. Treisman (2004). ‘State Corroding Federalism’. Journal of Public Economics, 88 (3–4): 843–93.
Finance Accounts (1987–88 to 2002–03) of Various State Governments in India, published by Cromptroller and Auditor General of India.
Keen, M., and M. Marchand (1997). ‘Fiscal Competition and the Pattern of Public Spending’. Journal of Public Economics, 66 (1): 33–53.
Lo, D., and G. Li (2006). ‘China’s Economic Growth, 1978–2005: Structural Change and Institutional Attributes’. Working Paper 150. University of London: School of Oriental and African Studies.
Mauro, P. (1998). ‘Corruption and the Composition of Government Expenditure’. Journal of Public Economics, 69: 263–79.
Roach, S. (2004). ‘The Challenge of China and India’. Available at: http://yaleglobal.yale.edu/display.article?id=4462.
World Bank (2004). World Development Indicators 2004. World Bank: Washington, DC.
9
Table 1: An international comparison of growth performance of China and India (per cent per annum)
1980–90 1990–00 2000–04 China 8.8 9.3 8.0 India 3.6 4.2 4.7 South Korea 7.7 4.7 4.0 Brazil 0.7 1.3 1.1 USSR/Russia 1.3 -4.7 6.5 Low income economies 2.2 1.2 3.7 Middle income economies 1.2 2.2 3.5 Low and middle income economies 1.3 1.8 3.3 East Asia and Pacific 5.9 5.7 6.6 Europe and Central Asia 1.2 -1.7 5.0 Latin America and Caribbean -0.3 1.7 0.3 Middle East and North Africa -1.1 0.7 2.1 South Asia 3.4 3.7 4.2 Sub-Saharan Africa -1.3 -0.1 1.6 High income economies 2.7 2.2 1.4
Source: World Bank (2004).
Table 2: Structure and growth of GDP: a comparison
Structure of GDP Growth of GDP (% per annum) China India China India
1980–90 1990–02 1980–90
1990–02
1990 2002 1990 2002
GDP (US$ millions)
354644 1266052 316937 510177 10.3 9.7 5.7 5.8
Agriculture (% of GDP)
27 15 31 23 5.9 3.9 3.1 2.7
Industry (% of GDP)
42 51 28 27 11.1 12.6 6.9 6.0
Service (% of GDP)
31 34 41 51 13.5 8.8 6.9 7.9
Source: World Bank (2004).

10
Table 3: Key social infrastructure spending and achievements: China and India
China India Education indicators Public expenditure on education (% of GDP in 2001/02) 2.2 4.1 Primary pupil teacher ratio (in 2001/02) 20 40 Literacy rate (in %) 2000–04 91 61 Health indicators Public expenditure on health (% of GDP in 2001) 2.0 0.9 Life expectancy (2004) 70M, 73F 63M, 64F Access to improved water sources (% of population) 75 84 Access to improved sanitation (% of population) 40 28
Source: World Bank (2004).
Table 4: Physical infrastructure investment in India and China
China India US$bn % of GDP US$bn % of GDP
Transport 95.7 4.3 10.9 1.4 Railways 15.2 0.7 3.5 0.4 Roads 67.1 3.0 5.8 0.7 Ports 9.7 0.4 1.2 0.2 Airports 3.7 0.2 0.4 0.1 Communication 19.0 0.9 8.1 1.0 Electricity 80.1 3.6 8.4 1.1 Urban infrastructure 6.4 0.3 1.0 0.1 Total 201.2 9.0 28.4 3.6
Source: Asia infrastructure: a catalyst for sustainable growth in Asia (October 2006).
Table 5: Difference in public expenditure composition in China
Provincial expenditure
Local expenditure for capital construction
(%)
Local expenses on culture, education, science and public
health (%)
Ratio of productive expenditure to GDP
(%)
1986–1992 0.100739 0.252641 0.128691 1994–2004 0.100693 0.248042 0.115834 East 0.111769 0.254839 0.096529 Central 0.074538 0.248582 0.102921 West 0.109484 0.245320 0.161899

11
Table 6: Share of capital expenditure in total expenditure: 1987–88 to 2002–03 (per cent)
1987–88 1990–91 1995–96 1999–2000 2000–01 2001–02 2002–03
Difference between 1990–91
and 2002–03
HIFD State
Rajasthan 18.22 17.74 18.81 11.68 10.05 10.91 11.36 -6.39
HDFD States
Bihar 20.65 15.43 5.57 13.77 11.44 10.17 12.19 -3.24
Gujarat 20.64 19.89 15.76 16.42 7.60 -1.05 11.28 -8.61
Kerala 12.46 11.76 13.38 7.31 5.80 5.39 5.58 -6.18
Orissa 23.44 21.41 11.14 12.17 13.62 10.30 11.07 -10.34
Uttar Pradesh 19.94 16.17 10.41 11.80 11.14 10.47 11.74 -4.43
West Bengal 12.70 10.77 14.42 10.91 13.20 11.28 7.77 -2.99
MIFD States
Punjab 31.59 22.00 15.13 4.63 13.45 9.86 5.11 -16.88
MSFD States
Karnataka 13.90 11.25 15.86 11.73 12.78 12.22 12.48 1.23
Maharashtra 17.76 16.28 18.31 20.99 3.09 6.91 11.15 -5.13
MDFD States
Assam 20.82 18.12 11.23 9.35 10.62 7.71 7.96 -10.16
LIFD States
Andhra Pradesh 15.31 13.43 14.35 18.03 14.27 13.84 15.60 2.17
Madhya Pradesh 19.05 14.71 11.24 5.72 8.50 3.24 16.58 1.86
LSFD States
Tamil Nadu 10.25 9.37 8.11 4.54 7.09 8.60 6.93 -2.44
LDFD States
Haryana 16.36 17.32 14.34 12.59 19.72 17.17 8.26 -9.06
Source: (basic data) - Finance Accounts of Various State Governments in India, published by Cromptroller and Auditor General of India (1987–88 to 2002–03).
12
Table 7: Share of social services expenditure in total expenditure of the States (per cent)
1987–88 1990–91 1995–96 1996–97 1997–98 1998–99 1999–2000 2000–01 2001–02 2002–03
HIFD State
Rajasthan 35.9 40.7 35.1 38.6 37.5 41.6 39.7 40.9 39.8 38.5
HDFD States
Bihar 36.0 37.4 35.4 34.8 36.1 33.6 35.8 33.6 30.0 30.7
Gujarat 35.8 33.5 32.2 30.4 31.8 32.9 33.9 35.0 35.1 31.8
Kerala 44.3 42.5 37.2 37.4 35.2 34.7 35.0 34.1 33.8 33.1
Orissa 34.4 32.3 36.7 34.9 35.7 36.0 43.7 33.5 31.6 32.6
Uttar Pradesh 30.4 32.9 30.4 32.3 33.0 32.5 28.6 27.6 27.0 28.8
West Bengal 42.9 42.9 34.8 34.9 37.3 38.4 40.8 36.8 34.3 32.2
MIFD States
Punjab 45.3 33.2 26.1 24.9 23.9 28.4 25.9 23.2 23.1 21.3
MSFD States
Karnataka 39.9 33.6 34.3 33.0 35.3 36.0 34.4 34.5 32.1 30.4
Maharashtra 32.2 31.8 33.3 31.9 33.5 33.6 34.1 34.6 34.6 32.6
MDFD States
Assam 39.1 37.3 38.6 41.2 40.6 42.0 38.4 40.8 37.2 38.3
LIFD States
Andhra Pradesh 39.4 36.2 36.2 36.3 35.4 39.2 37.5 32.2 31.3 31.6
Madhya Pradesh 35.5 36.2 35.5 34.1 34.7 38.0 37.5 37.1 30.0 34.2
LSFD States
Tamil Nadu 40.7 43.4 39.7 38.1 35.7 38.9 37.0 36.2 35.8 31.4
LDFD States
Haryana 34.2 31.7 29.8 22.0 24.0 27.8 30.9 30.7 28.8 30.9 Source: (basic data) Finance Accounts of Various State Governments in India, published by Cromptroller and Auditor General of India (1987–88 to 2002–03).
13
Table 8: Share of education sector expenditure in total expenditure of the States (per cent)
1987–88 1990–91 1995–96 1996–97 1997–98 1998–99 1999–2000 2000–01 2001–02 2002–03
HIFD State
Rajasthan 15.9 20.5 16.8 19.5 18.6 20.6 20.6 19.8 19.3 17.3
HDFD States
Bihar 21.6 23.9 23.4 23.7 22.6 20.8 25.0 22.4 20.9 20.7
Gujarat 15.9 18.0 18.5 17.3 16.2 17.3 16.7 14.5 13.2 15.1
Kerala 26.0 25.2 22.4 21.7 19.5 19.7 21.0 20.7 20.0 18.9
Orissa 15.9 16.5 18.1 17.8 18.7 18.9 20.7 18.0 16.1 17.0
Uttar Pradesh 15.5 19.7 18.1 18.7 17.5 20.2 18.1 17.8 17.0 16.2
West Bengal 21.5 24.7 19.8 20.3 20.9 20.0 24.2 19.2 18.1 18.1
MIFD States
Punjab 20.2 18.4 14.0 15.4 14.6 17.7 16.4 13.8 13.0 13.4
MSFD States
Karnataka 19.1 16.9 17.0 16.4 17.6 17.7 17.3 18.3 16.6 16.1
Maharashtra 16.9 17.2 18.0 17.5 17.9 18.0 21.5 22.2 22.5 20.0
MDFD States
Assam 19.2 20.6 24.4 26.8 26.2 28.2 26.1 27.4 25.1 25.9
LIFD States
Andhra Pradesh 17.7 16.7 13.0 13.4 13.9 14.6 16.0 14.2 13.5 13.1
Madhya Pradesh 14.7 17.4 16.6 15.4 14.9 16.9 17.7 16.9 13.2 13.3
LSFD States
Tamil Nadu 19.2 21.7 18.5 17.8 17.5 20.4 20.3 18.6 18.2 14.9
LDFD States
Haryana 16.7 15.3 11.4 10.3 11.9 15.2 15.8 15.3 14.3 14.6 Source: (basic data) Finance Accounts of Various State Governments in India, published by Cromptroller and Auditor General of India (1987–88 to 2002–03).

14
Table 9: Share of health sector expenditure in total expenditure of the States (per cent)
1987–88 1990–91 1995–96 1996–97 1997–98 1998–99 1999–2000 2000–01 2001–02 2002–03
HIFD State
Rajasthan 4.7 5.3 4.6 5.3 5.2 5.3 4.8 4.6 4.5 4.0
HDFD States
Bihar 5.2 5.1 5.8 5.0 5.2 5.5 5.0 4.7 4.4 4.3
Gujarat 5.0 5.0 4.7 4.5 4.6 4.9 4.7 3.7 3.0 3.6
Kerala 7.8 7.2 6.5 6.1 5.7 5.8 5.8 5.5 6.2 5.2
Orissa 5.6 5.1 5.2 4.7 4.8 5.3 4.7 4.7 4.2 4.5
Uttar Pradesh 6.8 6.3 5.7 5.9 6.3 4.6 4.3 4.3 3.9 0.2
West Bengal 8.3 8.4 6.4 6.1 6.5 7.7 6.4 6.4 5.7 5.7
MIFD States
Punjab 7.0 6.2 4.1 4.7 4.4 5.4 5.2 4.9 4.5 4.0
MSFD States
Karnataka 6.8 5.4 5.3 4.7 5.9 5.8 5.7 5.4 5.2 4.6
Maharashtra 5.9 5.1 4.6 4.4 4.3 4.1 4.2 3.9 4.5 4.0
MDFD States
Assam 6.8 5.9 5.8 6.1 5.9 4.9 4.9 5.1 4.9 4.3
LIFD States
Andhra Pradesh 6.2 5.5 4.6 5.3 5.4 5.7 5.8 5.2 4.9 4.6
Madhya Pradesh 5.8 5.2 4.8 4.6 4.6 5.6 5.2 5.4 4.3 4.6
LSFD States
Tamil Nadu 6.8 6.6 6.2 5.7 5.7 6.2 5.7 5.1 5.2 4.5
LDFD States
Haryana 4.9 4.1 3.0 2.7 3.3 3.8 3.7 3.5 3.2 3.6 Source: (basic data) Finance Accounts of Various State Governments in India, published by Cromptroller and Auditor General of India (1987–88 to 2002–03).
15
Table 10: Share of economic services expenditure in total expenditure of the States (per cent)
1987–88 1990–91 1995–96 1996–97 1997–98 1998–99 1999–2000 2000–01 2001–02 2002–03
HIFD State
Rajasthan 42.3 30.1 30.0 30.5 31.3 23.7 20.8 18.8 19.6 21.1
HDFD States
Bihar 37.5 33.1 24.4 23.1 23.2 23.4 22.1 18.5 16.7 19.0
Gujarat 44.2 42.4 41.3 40.8 41.4 40.0 37.2 40.1 35.3 32.7
Kerala 23.2 24.0 24.6 25.2 28.4 28.4 23.2 21.3 19.5 23.0
Orissa 40.3 41.9 31.6 32.1 28.6 27.8 24.7 22.9 20.5 22.5
Uttar Pradesh 39.8 35.1 23.9 25.4 22.8 23.2 25.5 24.7 24.2 24.7
West Bengal 26.4 26.5 29.9 30.1 21.6 20.6 18.3 20.6 18.9 14.1
MIFD States
Punjab 27.0 34.2 24.7 30.0 33.5 24.3 20.7 25.9 20.3 17.6
MSFD States
Karnataka 32.5 38.6 36.8 37.6 32.5 32.3 31.5 32.1 35.0 33.9
Maharashtra 34.7 35.4 32.5 34.2 30.8 28.7 26.3 28.6 21.0 25.2
MDFD States
Assam 34.1 34.5 29.2 24.1 23.6 24.4 22.4 22.4 22.9 20.6
LIFD States
Andhra Pradesh 37.2 37.5 35.6 34.4 33.3 29.2 28.0 33.8 34.0 30.4
Madhya Pradesh 40.5 37.7 33.3 36.3 33.9 27.8 27.9 26.4 35.6 31.2
LSFD States
Tamil Nadu 34.7 29.8 28.6 30.0 30.5 23.8 21.2 23.1 22.3 26.0
LDFD States
Haryana 38.9 37.9 24.4 26.8 29.8 37.3 31.8 32.6 36.0 27.7 Source: (basic data) Finance Accounts of Various State Governments in India, published by Cromptroller and Auditor General of India (1987–88 to 2002–03).
16
Table 11: Inter-regional differences
1986–1992 1994–2004
RPCAP RPCUL RPCAP RPCUL
PERGDP +** +*** +* + E*DC + -*** + +* E*NSOU + - -*** +*** E*DC*NSOU -** + +** -*** M*DC -** + - + M*NSOU -*** + - +** M*DC*NSOU +* - - - W*DC + + - + W*NSOU - + -*** +*** W*DC*NSOU - - +*** -*** T -*** +*** +*** -*** DUMEXPLORE +*** -** HIGHWAY (-1) - -*** - +*** STUDENT +*** + + -*** PERBEDS (-1) -*** + + + OBS 203 203 319 319 R Square
17
Table 12: Fiscal decentralization, marketization and public expenditure composition
RPCAP RPCUL
DC Weighted DC DC Weighted DC
Variable 1 2 3 4 5 6 7 8
PERGDP DC SOU DC*SOU DUM94*DC DUM94*SOU DUM94*DC*SOU
0.113*** 0.106*** 0.038*** 0.029*** 0.335*** 0.278*** -0.184*** -0.167*** -0.034*** -0.030*** -0.339*** -0.312*** 0.157*** 0.150***
0.089*** 0.082*** 0.024*** 0.018*** 0.264*** 0.222*** -0.142*** -0.130*** -0.027*** -0.028*** -0.279*** -0.273*** 0.117*** 0.117***
-0.103*** -0.089*** -0.045*** -0.039*** -0.453*** -0.377*** 0169*** 0.157*** 0.036*** 0.034*** 0.475*** 0.455*** -0.144*** -0.140***
-0.105*** -0.088*** -0.045*** -0.043*** -0.422*** -0.379*** 0.162*** 0.160*** 0.031*** 0.033*** 0.483*** 0.497*** -0.137*** -0.148***
DUM94 T DUMEXP HIGHWAY STUDENT PERBEDS
0.077*** 0.056*** -0.019 -0.019 -0.003*** -0.002** -0.001 -0.001 0.069*** 0.062*** -0.005 -0.005 -0.043*** -0.02 0.395*** -0.075 0 0
0.060*** 0.048*** -0.019 -0.019 -0.002*** -0.001* -0.001 -0.001 0.065*** 0.059*** -0.005 -0.005 -0.028 -0.02 0.408*** -0.073 0 0
-0.088*** -.074*** -0.016 -0.017 -0.003*** -0.002*** -0.001 -0.001 -0.027*** -0.025*** -0.004 -0.005 -0.009 -0.023 -0.241*** -0.069 0 0
-0.083*** -.080*** -0.015 -0.015 -0.002*** -0.003*** -0.001 -0.001 -0.025*** -0.023*** -0.004 -0.005 -0.021 -0.022 -0.257*** -0.066 0 0
Obs.
Adjusted R2
522 522
0.6341 0.6457
522
0.6305 0.6427
522
0.6282 0.6337
522
0.6322 0.6411
18
Table 13: Summary statistics
Variable Obs Mean Std Dev. Min Max
TE 240 10703.28 8229.644 1347.97 44157.97 CE 240 999.4347 856.431 -238.7861 4463.007 SS 240 3620.471 2702.608 461.2735 14471.18 Education 240 1932.344 1529.099 225.4865 9309.723 Health 240 542.0524 380.194 66.5291 1834.741 ROI 240 0.1102899 0.0219948 0.0096249 0.1566459 GSDP 240 63111.62 50968.44 7204 293689 F Dummy 240 0.3125 0.4644811 0 1 S Dummy 240 0.1875 0.3911281 0 1
Table 14: Regression coefficients
Dependent variable
Constant GSDP Lagged dependent
variable
ROI Fiscal dummy
Salary dummy
Adjusted R2
TE 0.057 (1.00)
0.279* (7.85)
0.672* (17.19)
0.045* (1.93)
0.014* (1.94)
0.006 (0.88)
0.988
CE -0.289 (-1.14)
0.302* (5.12)
0.634* (11.79)
0.045 (0.47)
-0.010 (-0.35)
0.012 (0.43)
0.796
SS -0.003 (-0.04)
0.141* (4.94)
0.826 * (25.91)
0.017 (0.71)
-0.008 (-1.17)
0.030 * (4.63)
0.987
Education 0.030 (0.45)
0.105* (4.18)
0.851* (31.11)
0.009 (0.36)
-0.008 (-1.09)
0.039 * (5.49)
0.985
Health -0.153* (-2.04)
0.116* (4.27)
0.864* (30.02)
-0.009 (-0.39)
-0.024* (-3.70)
0.033* (5.15)
0.987
Notes: Where figures in parenthesis corresponds to t- statistic of the coefficient of the independent variable.
* represents that the independent variable has significant effect on the dependent variable.
19
Figu re 1 : Govern me nt Expen ditu re to GDP ratio in China an d India
00 .0 5
0.10 .1 5
0.20 .2 5
1982
1984
1986
1988
1990
1992
1994
1996
1998
2000
2002
Year
GE
/GD
P
China India
Figure 2: GF CF/G DP in Ch in a a nd In dia
00.10.20.30.40.5
1982
1984
1986
1988
1990
1992
1994
1996
1998
2000
2002
Y ear
GFCF
/GDP
C hina Ind ia
Figure 3: Trends in public expenditure in China: key sectors
0.000.050.100.150.200.250.300.35
1986
1987
1988
1989
1990
1991
1992
1993
1994
1995
1996
1997
1998
1999
2000
2001
2002
2003
Year
(Per
cent
to G
DP)
Capex Social Ex Productive Ex

20
Figure 4: Trends in public expenditure in India: key sectors
0.000000
0.0100000.020000
0.030000
0.040000
0.0500000.060000
0.070000
0.080000
1990
-91
1995
-96
1996
-97
1997
-98
1998
-99
1999
-00
2000
-01
2001
-02
2002
-03
2003
-04
2004
-05
Year
Exp.
/GD
P
Social Exp./GDP Economic Exp./GDP Cap. Dev. Exp./GDP