economic recovery in the border region: leveraging trade
TRANSCRIPT

Global Economy
Consumers
Labor
Govern-ments
Infrastruc-ture
Oversight Hearing of the Assembly Committee on
Jobs, Economic Development, and the Economy
Economic Recovery in the Border Region: Leveraging Trade to Chart a
New Path Forward
Preliminary Report
Oversight Hearing on Thursday, November 10, 2011 Calexico City Hall
Calexico, California
CA Economy
Consumers
Capital
Business
Infrastruc-ture
Govern-ment
Labor

ii

iii
V. Manuel Pérez, Chair Assembly Committee on Jobs,
Economic Development, and the Economy
Committee on Jobs, Economic Development, and the Economy
V. Manuel Pérez, Chair Shannon Grove, Vice Chair
Jim Beall Marty Block Ben Hueso
Mike Morrell
Committee Staff:
Toni Symonds, Chief Consultant Mercedes Flores, Consultant
Amy Wilson, Communications Director
Assembly Republican Caucus, Office of Policy:
Julia King, Senior Consultant

iv

v
Table of Contents Page
Introduction
Issues for Consideration ............................................................................... ...1 Organization of this Paper ............................................................................. 3
Section I. Moving toward Rural Prosperity The Needs of Rural Areas Not Reflected in State Policies ........................... 5 Rural Communities as Innovators ................................................................... 7 The Rural-Urban Connection ......................................................................... 9 Rural Entrepreneurship ................................................................................. 10 Rural Development Models from other States ............................................. 11 Hearing Discussion Points .............................................................................. 12
Section II. International Trade and the California Economy The Importance of Trade within the Global Economy ............................ 15 The California Economy ................................................................................ 17 Challenges to California's Competitiveness ................................................ 25 Hearing Discussion Points ............................................................................ 27
Section III. U.S. Trade Policy and the Federal-State Relationship U.S. Trade Agreements ................................................................................... 29 Foundations of International Trade ............................................................. 30

vi
The World Trade Organization ................................................................... 31 The North American Free Trade Agreement ............................................. 32 Recently Approved Trade Agreements ........................................................ 33 Emerging Trends ........................................................................................... 34 Hearing Discussion Points ............................................................................ 36
Section IV. California's Trade Program
California's Trade Program ........................................................................... 37 State Trade and Foreign Investment Infrastructure ................................... 38 Business Development and Cooperative Agreements with Mexico ............ 40 A Cautionary Tale of Foreign Trade Offices ................................................ 41 Highlights of California's Export Promotion Activit ies .............................. 43 Supporting Trade within the Broader State Planning Process................... 46 Hearing Discussion Points ............................................................................. 49
Section V. – Recommendations on Further Actions Recommendations for Further Actions ........................................................ 51
Appendices Appendix A – Agenda for the November 10, 2011 hearing ....................... 57 Appendix B – Fast Facts on the California Economy .................................. 59 Appendix C – Fast Facts on California's Trade Economy .......................... 63 Appendix D – Fast Facts about California-Mexico Trade Relations ......... 68

vii
Appendix E – Fact Facts on the Imperial County Economy ...................... 71 Appendix F – Selection of Economic Strategies Related To the Imperial and Coachella Valleys ........................................................ 74 Appendix G – Summary of Legislation ....................................................... 81 Appendix H – State and Federal Resource Programs ................................ 85 Appendix I – Foreign Trade Zones located in California ......................... 94 Bibliography .................................................................................................... 97 End Notes ...................................................................................................... 103

viii

1
Economic Recovery in the Border Region: Leveraging Trade to Chart a New Path Forward
California workers and businesses are currently facing some of the harshest economic conditions since the Great Depression. Unemployment in California remains above 11% and is projected to continue in double digits well into 2014. It is estimated that over 2.25 million Californians have lost jobs during this recession and bankruptcies among small businesses have been nearly double the national average. Communities in proximity to the border with Mexico, including those in the Imperial and Coachella Valleys, have been especially hard hit, experiencing unemployment levels above 30%. On November 10, 2011, the Assembly Committee on Jobs, Economic Development and the Economy (JEDE) will be in Calexico, California, to hear from community and civic leaders, as well as economic development professionals and the public, about their ideas and priorities for using bi-national solutions and trade and foreign investment (TFI) to kick start these rural regional economies. An agenda of the hearing is provided in Appendix A. This is the eleventh in a series of hearings Chairman V. Manuel Pérez (D-Coachella) has held on the issue of economic recovery. Topics addressed have included fortifying small business development; reforming the state's regulatory process; revitalizing the state's manufacturing sector; building infrastructure to support job creation; and addressing the economic and workforce development issues of the long term unemployed including returning veterans. In this hearing, the Committee will continue to examine these types of economic recovery issues with a special emphasis on solutions and models that may be beneficial to communities and businesses in the rural portions of the California-Mexico border region. Economic disparities within these areas have been particularly extreme due to a number of factors including the lack of ongoing private sector investment; its remote geographic location; limited infrastructure; and inconsistent access to a skilled workforce. This report provides general information on rural development and the role international trade and foreign investment play within the California economy. It is designed to serve as a public policy workbook that will be updated and revised to reflect information learned during the hearing and to set the framework for the Committee's ongoing work on economic recovery, as well as rural prosperity. Issues for Consideration As one of the 10th largest economies in the world, a majority of California communities are already highly integrated within global markets. Whether it’s a cell phone that is produced using minerals from Africa, batteries manufactured with rare earth mined in China, or a morning ritual of strong black coffee, a majority of Californians participate in the global marketplace every day. Some products are produced out-of-the country, others use raw or manufactured components from a variety of geographic locations, and still others are from companies that are owned by or have major shareholders that are from a foreign country.

2
CA Economy
Consumers
Infrastruc-ture
Govern-ment
Labor
Global Economy
Consumers
Labor
Govern-ment
Infrastruc-ture
Business
Capital
As the diagram above illustrates, California's economy has multiple internal and external drivers. Strengths in one area may, for a time, compensate for weaknesses in another. Over the long term, however, the economic health of the community is dependent on the quality of all six drivers. Rapid globalization in the past two decades has permanently changed the economic development paradigm for rural communities in close proximity to the border with Mexico, such as those in the Coachella and Imperial Valleys. Their unique location provides both opportunities for accessing international capital and commerce, as well as challenges, such as the impacts of northward migration and financing infrastructure suitable to participation within the global movement of goods. In developing a framework for rural regional prosperity, a range of speakers have been invited to brief the Committee. Among other issues, the speakers have been asked to address the following:
• How can the state support local and regional efforts to catalyze private investments in underserved and emerging areas?
• What actions can the state take to minimize economic and workforce challenges of rural communities in and around the California-Baja Mega-Region?
• Where are these opportunities to enhance the global competitiveness and economic integration of the Coachella and Imperial Valleys?
• What actions can the state take to facilitate cross-border commerce and reduce de facto barriers to cross-border investment?
Information and research from this hearing will be used in January 2012 when the legislative session resumes and JEDE begins deliberations on legislation affecting business attraction/expansion, economic development strategies and the possibility of expanding the role of international trade within the state's economic recovery and post-recession economy activities. Descriptions of these measures are included in Appendix G and a list of preliminary recommendations is provided in Section V of this paper.

3
Organization of the Report This report is organized into five sections. In the first section, the report provides an overview of the challenges facing rural California and makes recommendation for a new rural development model. The second section has information on the California economy within a global economic context. The third section describes the state and federal trade framework including information on the World Trade Organization and the North American Free Trade Agreement. The fourth section provides background on California's trade program including those state and bi-national programs that are currently being utilized in the Imperial and Coachella Valleys. The fifth, and final, section includes a list of recommendations developed by staff through research and discussions with stakeholder groups. Each section concludes with identification of key issues that are anticipated to be discussed during the hearing and the related recommendations. In addition to these sections, the report includes a number of appendices that may serve as useful references to key elements discussed elsewhere in the paper. • Appendix A provides the agenda for the November 10, 2011 hearing.
• Appendix B is a fact sheet on the California economy including a map of the state displaying
county unemployment for September 2011 (most current data).
• Appendix C provides detailed information on California's trade and investment activities.
• Appendix D is a fact sheet on California-Mexico trade relations.
• Appendix E is a fact sheet on the Imperial County economy.
• Appendix F presents summaries of selected economic development strategies related to the Imperial and Coachella Valleys.
• Appendix G includes a summary of selected trade and infrastructure related legislation from the current and most recent legislative sessions.
• Appendix H provides a list of federal, state and international business development, international trade and infrastructure programs.
• Appendix I is a list of Foreign Trade Zones in California.

4

5
Section I – Moving Toward Rural Prosperity California's rural communities face a variety of economic development challenges. High unemployment; intense pockets of poverty; inadequate infrastructure; and limited access to the educational, vocational, health, and government services available in urban and suburban communities are only a few of the issues rural communities face in developing and implementing economic development strategies. One of the most compelling changes facing rural communities is the shift away from a mono-economy dominated by agriculture. While agriculture remains a key economic driver in some areas, rural communities are also looking to a range of economic engines for growth. Supporting the development and growth of these new industry sectors may well require new and/or updated skill sets, alternative financing options, and other community development elements to make them sustainable. Increasing globalization coupled with enhanced communications has also brought global, as well as local, competitiveness challenges. It is becoming increasingly common that rural communities in California compete for manufacturing plants and financing from global investors and international companies. Promoting a more modern rural development model will require setting new goals that encompass the economic success of the whole state, leveraging all available infrastructure opportunities, re-examining education and workforce development systems, and improving access to capital for California's rural communities. Most importantly, a modern rural development model will likely require coordination across industry sectors, levels of government, and between public and private actors. The November 10, 2011 hearing is designed to provide information and public comment on how trade and foreign investment can be used to catalyze rural economic recovery and, ultimately, rural prosperity. Later sections of this report will discuss a broad range of international trade and foreign investment issues from a global, national and state perspective. As a starting place, this section explores some of the unique challenges and opportunities rural areas face when undertaking economic development activities and lays a framework for a new rural development model – based on innovation, fueled by clean energy, and globally networked. An expanded group of appendices have been prepared to help provide background on this issue. Appendix E and Appendix F include a Fact Sheet on the Imperial Valley and a summary of key economic development strategies for the Coachella and Imperial Valleys, respectively. The Needs of Rural Areas not Reflected in State Policies Aside from a few small loan and grant programs, California has no state-level policy specifically targeted toward rural economic development activities.

6
While California is not unique in its lack of attention to rural economic policy, this was not always true. California's most recent venture into rural policy came in the late 1990s with the enactment of two bills, one to establish an internal cabinet-level task force on rural issues and another to establish an external stakeholder driven rural development council. Stakeholder groups represented on the rural development council included economic developers, local governments, tribal governments, agriculture, forestry, and other business interests. The internal task force was managed through the Governor's Office, and the rural development council was administered through the California Technology, Trade and Commerce Agency (TTCA) until the agency was eliminated in 2003. Combined, these two entities addressed a variety of rural issues including economic development, health care, energy, workforce development, water, and land use. The rural development council was also a member of the National Rural Development Partnership, which was initially chartered by an act of the U.S. Congress in 1990. Today, 31 state rural development councils belong to the National Rural Development Partnership, including California's neighboring states of Arizona, Nevada, New Mexico, Oregon and Texas. The now defunct internal rural task force and the external rural development council provided an opportunity for other rural policy groups to bring their issues forward and reduce the prevalent silo thinking. The California Rural Health Policy Council is one example of a group whose voice became greater by having a single internal and external place to raise issues and share ideas. The rural development council was also a place where external stakeholders could raise and seek resolution of issues among the broader statewide rural community. Besides advancing policy issues, the rural policy task force also worked with federal, state, and local governments to: • Eliminate impediments to economic growth by
streamlining burdensome regulations; • Identify gaps in service delivery and develop
solutions for addressing these areas; and
Priority Rural Actions In February 2010, JEDE Chairman, Assemblyman V. Manuel Pérez, joined a convening of rural stakeholders by the USDA Rural Development California State Director Glenda Humiston for the purpose of identifying a set of key actions for rural California. • Expand and Upgrade Infrastructure
• Improve Access to Capital and Financing
• Streamline Regulations and Permit Processes
• Develop a Better Definition of Rural That Fits California’s Needs and Realities
• Find Ways to Expand and Improve Service to Applicants
• Provide More Technical Assistance and Planning to Local Communities
• Assist and Enhance Traditional Job Training Institutions
• Enhance Programs and Opportunities in Specific Sectors: -Enable Regional Food Systems and Improve Access to Healthy Food -Support Value-added Business Growth and Tourism -Expand Programs to Stimulate Green Jobs and Projects -Increase Opportunities to Produce and Utilize Alternative Energy Sources -Stabilize and Expand the Supply of Affordable Housing -Improve Access and Affordability of Health Care

7
• Develop and support a more congruent and fluid service-delivery system for rural California. California's rural policy in the 1990s was reflecting a new federal policy that focused not just on rural education and health care, but also on proposed investments intended to “enable rural Americans to help themselves, create jobs, and rebuild their communities.” This strategy advanced recommendations from earlier federal reports that argued that the only effective policy to improve conditions in impoverished rural communities was to use federal funds and technical assistance to leverage local planning and fund efforts. This refocused federal policy was also to become part of a broader national strategy to bring the nation out of the recession that had begun in 1991. Two changes in national tax policy were particularly important to rural communities. The first was the increase in the earned income tax credit, which substantially increased the after-tax income of the working poor, a disproportionate number of whom reside in rural areas. The second was the enactment of legislation creating empowerment zones and enterprise communities (EZ/EC), which included certain tax incentives to encourage growth in distressed areas. The EZ/EC program included both an urban component administered through the federal Department of Housing and Urban Development and a rural component administered by the U.S. Department of Agriculture (USDA). While California's enterprise zone program was initially established in the early 1980s, changes were made to the program in the mid-1990s to better reflect the changes in federal policy, SB 2023 (Costa) Chapter 955, Statutes of 1996 and AB 296 (Knight) Chapter 953, Statutes of 1996. In 2005 and 2006, JEDE held four months of intensive hearings to examine the state enterprise zone program which resulted in an even stronger alignment of the state program with the original intention of the federal program, which was to assist poor communities in helping themselves, create jobs, and rebuild their neighborhoods. In 2009, JEDE again held three oversight hearings, which resulted in a series of recommendations to better target the program to achieve empowerment and wealth creation with California's poorest communities. These recommendations have been incorporated into AB 231 (V. Manuel Pérez), which is pending in JEDE and will be heard in January 2012. Rural Communities as Innovators Enhancing innovation opportunities within rural communities can be a very powerful, competitive advantage to these historically lower-income economies. A report by Collaborative Economics, the Innovation Driven Economic Development Model, notes that many communities are experiencing new forms of economic pressures from innovation-driven globalization and technological changes. Collaborative Economics states that the global innovation economy is primarily driven by ideas and is different than the industrial-based economies of the past. Rather than competing solely on the basis of costs, the new model also requires communities to compete on the basis of increasing productivity. Collaborative Economics states that today's business development is based on an open business model where firms seek innovation assets, including ideas, talent,

8
capital, and other resources from many different internal and external sources. This open business model means that rural businesses are not necessarily removed from the competition simply because of location. In the new model it is important that regions, whether urban or rural, be capable of supporting ongoing learning and adapting to new innovations. While it may seem that urban areas offer more favorable innovation conditions, rural areas can offer many highly desired qualities when properly packaged. Key characteristics of a successful innovation model are business communities which are well networked, have the ability to operate collaboratively, and are clustered geographically. By its very nature innovation can take many forms – a community can be innovative in how it produces products, as well as in the types of products it produces. Rural
innovation may be about performing traditional activities in a new way, or about starting new businesses and/or new industry sectors. Successful innovation is strongly related to the level of access to human capital, knowledge, and networks. As one example, a rural area may try to develop complex R&D facilities in order to compete for high-tech industries. This type of development may, however, generate costly upfront investments with very little job creation. It may be more effective to invest in the capacity of a rural area to assimilate innovation, rather than to try to produce that innovation itself. Investments in infrastructure such as broadband technologies or multimodal transport facilities that link to global networks may prove to be more effective. An excellent opportunity for rural innovation lies in the area of renewable energy. While much of the state-level discussions on renewable energy are dominated by urban- and suburban-based stakeholders, renewable energy is, for the most part, truly a discussion about rural energy production. Biofuels primarily rely on agricultural feed stocks. Due to siting requirements, wind power will most likely be used in rural areas as compared to urban communities. While solar power is clearly more flexible, large solar arrays generally need to be erected in rural areas. Certain areas, such as Imperial County, offer unique and high quality geothermal opportunities. The scale of this economic opportunity for rural communities is enormous. According to the USDA, annual oil imports to the U.S. will exceed "the entire value of every ear of corn, every gallon of milk, every pound of beef, everything that we produce agriculturally" in the country. Rural renewable energy could mean more stable revenues for communities. Development of renewable energy facilities in rural areas means new jobs in construction, operations, and maintenance. It could also mean a viable future for young people, and thus reduce the brain drain from California's rural communities. In recognition of this potential, USDA Rural Development is currently supporting a cleantech pilot project in the Coachella and Imperial Valleys.
Rural innovation does not necessarily look like innovation or high-tech as it occurs in more urban places.
9
Mega-Region Initiative Innovative Model
Urban and Rural Connection The Mega-Region Initiative is a partnership between San Diego, Imperial Valley and Baja California regions. It focuses on five target clusters: cleantech, logistics, specialized manufacturing, construction materials and applied biotechnology. The objective is for the regions to become more competitive in the global market place.
Another important rural innovation opportunity is the advance in access to broadband. In a knowledge-based economy, easy access to information through secure, decentralized data systems allows large and small organizations to relocate, network, expand more cost-effectively, and provide workers and contractors with more flexibility relative to work space. Factories, warehouses, offices, and transportation networks can also be optimized for economic efficiency. Broadband effectively levels the playing field by allowing rural communities to have unprecedented access to information which enhances their ability to provide services that were previously only available in urban settings. In effect, jobs become more mobile, and that ultimately benefits rural communities. Access to broadband provides the technical backbone to support telecommuters, home-based businesses, web-based businesses, new businesses, satellite offices, and relocations. Unfortunately, many rural areas lack broadband or have inadequate broadband capacity. The Rural – Urban Connection Rural development should not occur in a vacuum. Coordinating rural development actions with major regional and state-level investment activities can more effectively ensure that local infrastructure investments provide significant value, including those of a smaller scale. Similarly, the needs and role of rural areas should not be considered an after-thought. Periodically, the Legislature and the Governor put forth "comprehensive" investment plans in telecommunications, transportation, energy, and water infrastructure; however, even when a rural component is added, its addition often occurs at the end of the process rather than it being a central component to the plan. As an example, early discussion on the allocation of the goods movement moneys from the 2006 infrastructure bonds focused on how much money would go to Los Angeles and the Bay Area - even though 45% of trucking related to goods movement travels through the San Joaquin Valley. Through concerted and coordinated regional lobbying, the San Joaquin Valley was able to receive 25% of the $1 billion of funding available. Working across regions is also important when considering public investments in education and vocational training. Access to an adequate variety of these types of opportunities in a rural area can be difficult. A rural community may have limited public transportation between itself and other rural and urban areas, or the operation of the education facilities themselves may be constrained due to outdated education funding formulas or too prescriptive of a program delivery system to properly fit current rural development patterns. Some of these gaps can be filled through better coordination and cooperation between public and private resources in rural and more urban

10
communities. Other solutions will need to be specifically designed so that jobs and appropriately skilled workers can flow freely between rural and urban areas. As discussed above, even in a fully diversified rural economy, it is likely that successful innovation-based businesses will need access to an ongoing variety of key resource providers making the urban and rural connection even more important. Rural Entrepreneurship For many rural policy makers, entrepreneurship is considered the best, if not the only, hope for building stronger economies in the rural areas. This renewed interest in entrepreneurship and small business development is an important national trend. Rural communities are increasingly shifting away from trying to attract subsidies; instead, they are opting for strategies to attract more private investments. This subsection draws from national and California specific research on how microenterprise activities can help move rural economies forward. The Rural Policy Research Institute, USDA and the California Association for Microenterprise Opportunity advocate for small and home-based business development, in part, because of rural communities' smaller markets and limited access to large pools of skilled labor. However, both emphasize the ability of rural communities to effectively promote new small enterprise, which can supplement local employment opportunities and increase their tax base. The Corporation for Enterprise Development, working with funding from the Kellogg Foundation, undertook an extended study to identify and review institutions, programs, and activities that support rural entrepreneurship. The study, Mapping Rural Entrepreneurship, validated the many challenges facing rural communities today. It concluded that a new program delivery framework was needed that would "animate" people and institutions around entrepreneurship. The new recommended framework would: • Provide tools and resources for local communities to identify and grow their own assets;
make local decisions about the balance between economic, social, and environmental imperatives; learn from the experiences of others; and, be open to experimentation and innovation;
• Include regionally oriented solutions developed through cooperation across multiple
jurisdictions;
Coachella Valley Blueprint
The Coachella Valley Blueprint focuses on four primary issues and goals to enhance the Valley's competitiveness as a place to do business, live, work and visit.
Goal 1 - Establish regional identity to help compete in the global marketplace. Goal 2 – Diversify economy through development of high wage employment sectors. Goal 3 - Develop competitive labor force that supports existing future businesses. Goal 4 – Continue to make the Coachella Valley a compelling place to live, work, visit and prosper.
Appendix F includes a full summary of the Blueprint including key actions.
11
The California Financial Opportunities Roundtable (CalFOR) is a partnership of USDA Rural Development and the Federal Reserve Bank of San Francisco. The goal of CalFOR is to mobilize capital markets and capture local investment potential for the purpose of fueling regional economic growth and job creation. JEDE is a member of the Technical Advisory Committee.
• Include entrepreneur-focused systems that align a variety of training, technical assistance,
and financing programs to support entrepreneurs at the various stages of the business development; and
• Provide opportunities for continuous learning by both the entrepreneurs and the program and
service administrators. Mapping Rural Entrepreneurship also highlighted other essential elements for promoting rural entrepreneurship, such as providing supportive public policy; fostering a diverse group of entrepreneurs; and obtaining participation by anchor institutions, such as foundations and community development financial institutions. The Regional Economies Project also undertook a special analysis of California's rural regions in its
report, Patterns of Entrepreneurship in Rural California (Rural Entrepreneurship Report). The Rural Entrepreneurship Report found entrepreneurship to be the single biggest driver of economic growth, job creation, and industrial and technological innovation in California's rural regions. Most firms, the Rural Entrepreneurship Report found, never leave the rural community in which they start and that over 80% of the net growth in establishments is attributable to sectors related to health, regional experience, and innovation services. Further, the report cites that national research and experience suggest that the growth of entrepreneurship is highly dependent on the local supporting infrastructure, including education, technical assistance, and access to credit. Rural Development Models from Other States California was once a leader in rural development policy and could, with appropriate new direction, help to facilitate greater prosperity in California's rural communities. Below are a few examples of the types of proactive policies, programs, and services used by other states in assisting their rural communities. • Minnesota Entrepreneurial Gateway Program: The Minnesota Rural Partners (MRP) has
built an online tool for entrepreneurial resource matching (www.bizpathways.org). This tool is a component of the Minnesota Entrepreneurial Gateway program (MEG), developed to serve as an economic development strategy for the rural areas of Minnesota. Currently, four pilots of the MEG program are in place and have benefited an estimated 30,000 people. More than 3,000 service providers participate in the online tool. MRP has leveraged about $200,000 to implement the four pilot sites from a combination of user fees and foundation grants, including the Initiative Foundation, Blandin Foundation, the Minneapolis Foundation, and the W.K. Kellogg Foundation. Partners included the higher education systems, the state economic development department, the Independent Bankers Association, and local community organizations and businesses.

12
• New Mexico Rural Readiness Program: The New Mexico Rural Development Response
Council recently completed a three-and-a-half year contract with the Economic Development Administration designed to implement economic development projects in 16 rural New Mexico communities. The purpose of the program is to use a specific community development project as a means to increase the community's capacity to carry on future projects. To date, Rural Readiness has created 700 to 750 jobs and has the potential to create 1,700 new jobs during the next two to ten years.
• Wyoming Community Assessments: The community assessment program provides
communities the training and technical assistance necessary to undertake an assessment of the community's assets. Too often planning goes forward without adequately understanding the real strengths and weaknesses of the community. With a well prepared assessment a community has a better ability to make decisions and plan their own future. The cornerstone of the program is to help communities develop locally-conceived and locally-driven development strategies and to provide a long-term support system to help achieve development goals. Community assessments have been undertaken in nearly every Wyoming community. Further, the program has nearly 500 trained volunteers for the resource teams with extensive experience in the areas of community and economic development, land use planning, affordable housing, conservation, healthcare, tourism, transportation, infrastructure, and many more.
• South Dakota's Investment Visa Program: South Dakota's international trade and investment
program includes targeting foreign investors who are interested in obtaining a green card and potential U.S. citizenship on a fast-track. The South Dakota program uses the current federal EB-5 immigration program that provides permanent residency to foreign investors who meet certain requirements. The primary requirement is the investment of $1 million anywhere in the U.S. or $500,000 in a target area. To help implement its foreign investment attraction program, the state established a U.S. Customs approved Regional Center, an entity officially able to facilitate the EB-5 applications and market the program worldwide.
• National Rural Policy Research Institute: The Rural Policy Research Institute (RUPRI)
provides unbiased analysis and information on the challenges, needs, and opportunities facing rural America. RUPRI’s aim is to help policymakers understand the rural impacts of public policies and programs. RUPRI was founded in 1990 to address a concern of members of the U.S. Senate Agricultural Committee, including Senator Kit Bond (Missouri); Senator Dale Bumpers (Arkansas); Senator Tom Harkin (Iowa); and Senator Bob Kerrey (Nebraska), that no objective, non-governmental source of external data, information, and analysis regarding the rural and community impacts of public policy decisions was available.
Hearing Discussion Points The November 10, 2011 hearing will provide an opportunity for the committee to hear testimony on a number of trade related challenges facing rural communities along the border with Mexico and within the economic corridor to the North. Key issues to be discussed at the hearing relating to this section include regional collaboration, access to capital, workforce development, and

13
infrastructure to support economic development at the local, regional, state, national, bi-national and global levels. Witnesses have been asked to provide their own assessments, highlight successful models and recommend practical solutions for guiding the state's actions in the post-recession economy. Related recommendations, as summarized in Section V, may include: 1. Introduce legislation to authorize the creation of a bi-national economic development
authority for the bi-national mega-region and related areas. Membership may include representation by Imperial County, the Coachella Valley, San Diego County and Baja California.
2. Develop an economic development focused MOU between the elected representatives in the
Coachella Valley, Imperial Valley, San Diego City and/or County, and the State of Baja. Initially, the agreement would focus on collaborative marketing approaches and could later support larger regional solutions related to infrastructure.
3. Engage the San Diego and Imperial Valley Economic Development Corporations on how
other communities in the economic corridors could meaningfully participate in the CaliBaja Bi-National Mega Region initiative.
4. Call on California Governor's Office of Business and Economic Development to allow, if
requested, the iHUBs in the San Diego and Imperial County form an official partnership with the iHUB in Coachella Valley, similar to the relationship between the Sacramento and Northern California iHUBs.
5. Engage tribal governments in identifying issues and prioritizing possible collaborative
actions that would enhance the economic competitiveness of the mega-region and surrounding communities.
6. Engage education, business and civic leaders to discuss opportunities for complementary
educational curricula and internships related to emerging sectors in the bi-national economic corridors.
7. Authorize a new and dedicated funding source for local economic development entities
within the U.S. side of the mega-region and its economic corridors. 8. Call on the California Governor's Office of Business and Economic Development to begin
the process for adopting an updated International Trade and Investment Strategy that includes the discussion of the unique needs of the Mega-Region including issues relating to infrastructure, access to capital, workforce development, bi-national entrepreneurship and regulatory reforms that support business start-ups, growth and manufacturing.
9. Direct JEDE staff to undertake a survey of how other states and regional economic
development entities establish their official presence in foreign markets. Include within the

14
final report recommendations on the potential role of a foreign trade office and/or special state relationship.
10. Facilitate economic development and community empowerment discussions among rural
stakeholders in anticipation of the 2012 Farm Bill. JEDE, working in partnership with the California Legislative Rural Caucus, can encourage rural stakeholders to identify how they can be supported in developing clean energy generation and more economically diversified economies.
11. Become a partner to and collaborator with the California Financial Opportunities Roundtable
(CalFOR). CalFOR is a joint initiative of the U.S. Department of Agriculture – Rural Development and the Federal Reserve Bank of San Francisco for the purpose of mobilizing capital markets and capturing local private investment potential in rural areas.

15
Section II – International Trade and the California Economy
Since the earliest days of European immigration to North America, international trade has played an important part of the North American economy. Colonists and other émigrés were highly dependent on international trade companies such as the Hudson Bay Company, Boston Tea Company and the Dutch West Indian Company to provide goods that were available on the continent and to provide access to wealthy European markets for excess goods such as furs, tobacco, and raw materials. As a nation, the U.S. economy has long maintained trade relationships with a wide range of countries throughout the world as both a means to support U.S. based companies, leverage U.S. financial resources and provide a higher quality of life to residents who benefit from increased choice and potentially lower cost products. Since World War II, the U.S. economic model of free trade and conversion of “closed” markets to the implementation of trade liberalization policies have dominated international financial entities including the International Monitory Fund and the World Bank. Opening borders to trade with the developed economies has become a consistent pre-condition to accessing international aid. These trade relationships and U.S. foreign policies, in general, are increasingly being scrutinized as to their impact on domestic workers and small and mid-sized companies in the U.S. Spurred on by relative inexpensive access to global markets, globalization has both benefited the U.S. and caused economic dislocation. This section of the report provides more detailed information on how international trade and foreign investment contribute to the state's economic engine. Appendix C provides a JEDE prepared fact sheet on California's trade economy and Appendix D has information on California's trade relationship with Mexico.
Importance of Trade within the Global Economy
In 2010, global GDP was $63 trillion, with the U.S. ($14.5 trillion) having the highest GDP of any individual nation, followed by China ($5.8 trillion), Japan ($5.4 trillion), Germany ($3.3 trillion), France ($2.5 trillion), the United Kingdom ($2.2 trillion), Brazil ($2.08 trillion), Italy ($2.05 trillion), India ($1.7 trillion), Canada ($1.5 trillion), Russia (1.4 trillion). Based on these figures from the World Bank, if California were an independent nation its $1.9 trillion economy would rank it as the ninth largest economy in the world.
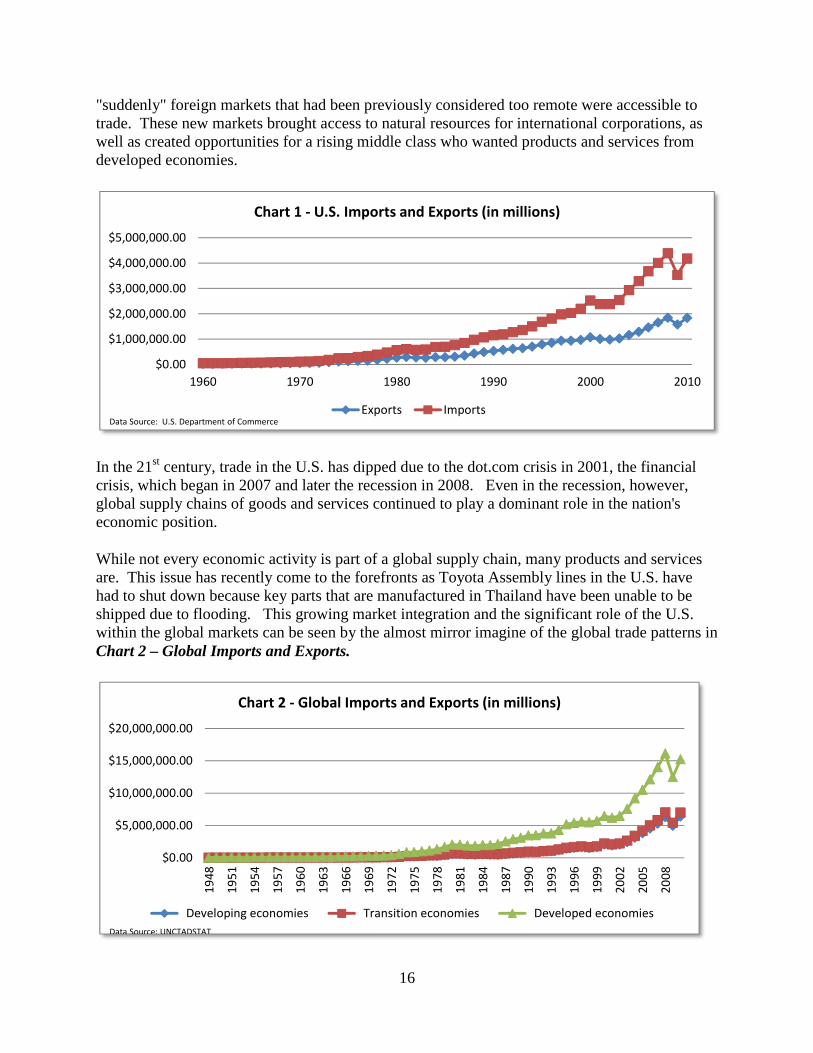
A significant driver of GDP is international trade and foreign investment. As the world's largest economies, it is not surprising that the U.S., Germany, China and Japan are also world's largest importers. As illustrated by the Chart 1 – U.S. Imports and Exports (1960 – 2010), international trade has played an increasingly valuable role within the U.S. economy. Innovations in technology during the 1990s rapidly increased global market integration, and
Globalization is "the growing integration of economies and societies around the world..." The World Bank
16
"suddenly" foreign markets that had been previously considered too remote were accessible to trade. These new markets brought access to natural resources for international corporations, as well as created opportunities for a rising middle class who wanted products and services from developed economies.
In the 21st century, trade in the U.S. has dipped due to the dot.com crisis in 2001, the financial crisis, which began in 2007 and later the recession in 2008. Even in the recession, however, global supply chains of goods and services continued to play a dominant role in the nation's economic position.
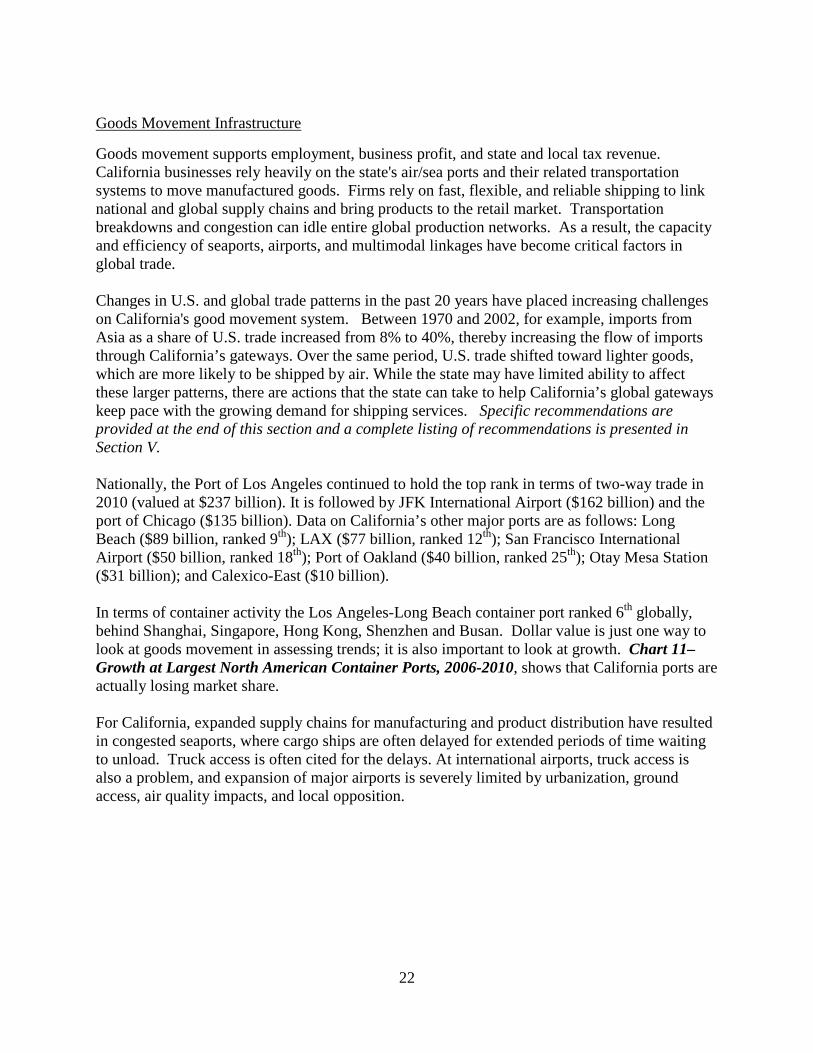
While not every economic activity is part of a global supply chain, many products and services are. This issue has recently come to the forefronts as Toyota Assembly lines in the U.S. have had to shut down because key parts that are manufactured in Thailand have been unable to be shipped due to flooding. This growing market integration and the significant role of the U.S. within the global markets can be seen by the almost mirror imagine of the global trade patterns in Chart 2 – Global Imports and Exports.
$0.00
$1,000,000.00
$2,000,000.00
$3,000,000.00
$4,000,000.00
$5,000,000.00
1960 1970 1980 1990 2000 2010
Chart 1 - U.S. Imports and Exports (in millions)
Exports ImportsData Source: U.S. Department of Commerce
$0.00
$5,000,000.00
$10,000,000.00
$15,000,000.00
$20,000,000.00
19
48
19
51
19
54
19
57
19
60
19
63
19
66
19
69
19
72
19
75
19
78
19
81
19
84
19
87
19
90
19
93
19
96
19
99
20
02
20
05
20
08
Chart 2 - Global Imports and Exports (in millions)
Developing economies Transition economies Developed economies
Data Source: UNCTADSTAT

17
Another indicator of world interconnectedness can be seen in changes in the amount of foreign direct investment (FDI). FDI is when a company from another country invests, either by purchasing an existing company in another country or building a new site of operations in the foreign country in what is called "green field investment." Chart 3 – Global Inward FDI shows foreign investment, over the same time period as the previous two charts. Overall the chart displays a similar pattern to international trade, except that the dot.com crisis had a greater impact on investment capital.
The U.S. is the largest receiver of FDI in the world and California businesses receive the largest percentage of FDI in the U.S. As globalization and market integration continue to evolve, it is expected that FDI, as we have already seen in venture capital, will be more dispersed across the world.
The California Economy
Historically, the state's significance in the global marketplace resulted from a variety of factors, including: its strategic west coast location that provides direct access to the growing markets in Asia; its economically diverse regional economies; its large, ethnically diverse population, representing both a ready workforce and significant consumer base; its access to a wide variety of venture and other private capital; its broad base of small- and medium-sized businesses; and its culture of innovation and entrepreneurship, particularly in the area of high technology. A key driver of the state's $1.9 trillion economy is international trade and its related goods movement activities. Chart 4 – California Employment by Sector (2009) shows total reported California employment by industry. Almost all of these employment/industry sectors are linked to California trade and foreign investment activities. Manufacturing is the most closely dependent, where more than one-fifth (22.9%) of the workers directly depend on exports for their jobs. Overall, manufacturing contributed to 9.3% of the state's GDP in 2009 and provided an average annual salary of $68,201.
$0.00
$500,000.00
$1,000,000.00
$1,500,000.00
$2,000,000.00
$2,500,000.00
Chart 3 - Global Inward FDI (in millions)
Developing economies Transition economies Developed economiesData Source: UNCTADSTAT

18
Manufacturing employment is sometimes referred to as the gold standard because it pays high wages (usually with benefits), supports the state's access to the broader global market and provides a key link in the extended network of small and medium sized businesses that participate in the production, distribution and retail supply chain. Due to their ability to provide specialized goods and services, small- and medium-sized businesses are crucial to the state's international competitiveness and are an important means for dispersing the positive economic impacts of trade within the California economy. Of the over 59,998 companies that exported goods from California in 2009, 96% (57,461) were small- and medium-sized enterprises (SME) with fewer than 500 employees. These SMEs generated nearly two-fifths (44%) of California's exports in 2008 demonstrating their key role in the state's trade competitiveness. Nationally, SMEs represented only 32.8% of total exports.
Manufacturing in California, however, even prior to the current economic recession, faced many challenges maintaining global and domestic competitiveness, including providing a skilled workforce to support the changing needs of manufacturing and goods movement, and maintaining cost-effective productivity in the face of lower safety and wage standards in emerging foreign markets. The California Manufacturers and Technology Association (CMTA) estimates that California lost 633,000 manufacturing jobs from its peak in January 2001 to November 2010. While part of this reduction reflects the loss of high-tech jobs in 2001 and 2002 and the current recession, the industry, as a whole, is suffering. Compared to other states, however, California's loss of manufacturing jobs more severe, as shown in Chart 5 – Loss of Manufacturing Jobs – Comparison of Western States.
Chart 5 – Loss of Manufacturing Jobs – Comparison of Western States (2001-2010 seasonally adjusted)
Arizona California Nevada Oregon Texas -30% -34% -12% -29% -21%
Source: CMTA, based on data from US Bureau of Labor Statistics and California Employment Development Department
Leisure and
Hospitality
1,493782 (7%)
Other Services
740,659 (3%)
Trade, Transportation
and Utilities
2,618690 (12%)
Education and Health
Services
1,714560 (11%)Manufacturing
1,275,752 (8%)
Construction
618,068 (3%)
Professional and
Business Services
2,049,246 (9%)
Financial Activities
7,94,616 (5%)
Agriculture, Mining,
and Natural
Resoruces
1,209,711 (8%)
Government
2,419,600 (16%)
Chart 4 - California Employment By Sector (2009)

19
Manufacturing costs in California are estimated by the CMTA, based on data from the US Bureau of Labor Statistics, to be 24% higher than the national average. The quality and development process related to building and maintaining infrastructure is one component of those costs. In the subsections that follow, there is a more expanded discussion on the role of infrastructure in remaining globally competitive. Appendix C provides a fact sheet on California's trade economy and Appendix D has information on California's trade relationship with Mexico. Exports If California were a country, it would be the 11th largest exporter in the world. Exports from California accounted for over 11% of total U.S. exports in goods, shipping to over 226 foreign destinations in 2010. California's land, sea, and air ports of entry serve as key international commercial gateways for products entering the country. As shown in Chart 6 – 2010 Export from California to the World, California exported $143 billion in goods in 2010 (up from $120 billion in 2009), ranking second only to Texas with $163 billion in export goods. Computers and electronic products were California's top exports in 2010, accounting for 30.1% of all state exports, or $43 billion.
Chart 6 - 2010 Exports From California to the World Product Value ($) Percent
334 Computers & Electronic Prod. 43,075,351,414 30.1 % 333 Machinery (except electrical) 14,486,638,626 10.1 % 336 Transportation Equipment 12,957,683,521 9 % 325 Chemical Manufactures 11,590,683,001 8.1 % 339 Misc. Manufactures 11,502,854,621 8 % 111 Agricultural Products 9,353,709,931 6.5 % All Others 40,301,943,159 28.1 % Total 143,268,864,273 100 %
Based on origin of movement, Mexico is California's top trading partner, receiving $21 billion (14.6%) in goods in 2010. The state's second and third largest trading partners are Canada and China with $16.1 billion (11%) and $12.4 billion (8.6%), respectively. Other top-ranking export destinations include Japan, South Korea, Taiwan, the United Kingdom, Hong Kong, Germany, and Singapore. Chart 7 – California Export Markets, below, provides more detailed information on California's export markets.
Chart 7 – California Export Markets (in millions of dollars) Rank Country 2007
Value 2008 Value
2009 Value
2010 Value
2007 %
Share
2008 %
Share
2009 %
Share
2010 %
Share
% Change 09-10
1 Mexico 18,347 20,472 17,474 20,949 13.7 14.1 14.6 14.6 19.9 2 Canada 16,274 17,850 14,315 16,198 12.1 12.3 11.9 11.3 13.2 3 China 10,566 10,982 9,744 12,469 7.9 7.6 8.1 8.7 28.0 4 Japan 13,457 13,062 10,902 12,180 10.0 9.0 9.1 8.5 11.7 5 Korea,
South 7,409 7,747 5,913 8,027 5.5 5.3 4.9 5.6 35.8
6 Hong Kong 4,919 5,688 5,800 6,757 3.7 3.9 4.8 4.7 16.5

20
7 Taiwan 5,786 5,149 4,120 6,518 4.3 3.6 3.4 4.6 58.2 8 Germany 5,560 5,759 4,441 5,122 4.1 4.0 3.7 3.6 15.3 9 United
Kingdom 5,217 5,538 3,916 4,181 3.9 3.8 3.3 2.9 6.8
10 Netherlands 4,077 4,348 3,566 4,126 3.0 3.0 3.0 2.9 15.7 Source: TradePort.org by U.S. Census Bureau
California exported $21 billion worth of goods to Mexico in 2010, accounting for 15% of California’s overall goods exports. California is the second largest exporter to Mexico amongst the 50 U.S. states (behind Texas). As shown in Chart 8, computers and electronic products are
California's highest single export to Mexico. However, as Mexico's economy diversifies, exports of machinery and transportation equipment have grown exponentially.
Imports If California were a country it is estimated that it would be the 12th largest importer in the world. Having $327 billion in products being imported to California in 2010. California's top five imports in 2010 were: Computer & Electronic Products ($107 billion); Transportation Equipment ($49 billion); Oil & Gas ($21 billion); Miscellaneous Manufactured Commodities ($19 billion); and Apparel & Accessories ($17 billion). China is the largest source of imports into California; the 2010 value of Chinese imports was $133 billion. China is followed by Japan ($41 billion); Mexico ($33 billion); Canada ($23 billion); and South Korea ($12 billion). Chart 9 – California Imports provides more detailed information on California imports from 2008 to 2010.
Chart 9 – California Imports (in millions) Rank Country 2008
Value 2009 Value
2010 Value
2008 % Share
2009 % Share
2010 % Share
% Change, 2009 - 2010
1 China 98,676 89,252 113,391 28.3 33.0 34.7 27.0 2 Japan 55,435 33,605 40,698 15.9 12.4 12.4 21.1
Chart 8 - 2010 Exports from California to Mexico by Industry Sector 01.19.2009
Product Value ($) Percent
Computers & Electronic
Prod. $6,463,923,401 30.9 %
Transportation
Equipment 1,793,428,398 8.6 %
Machinery, Except
Equipment $1,612,029,694 7.7 %
chemicals $1,229,644,680 6.1 %
All Others $9,849,948,319 47.0 %
Grand Total $20,948,974,492 100 %
30.9 %
8.6%
7.7%6.1%
47%
Source: U.S. Department of Commerce: International Trade Administration

21
3 Mexico 33,829 29,520 32,753 9.7 10.9 10.0 11.0 4 Canada 21,478 17,206 21,625 6.2 6.4 6.6 25.7 5 South Korea 15,525 12,204 12,109 4.5 4.5 3.7 -0.8 6 Malaysia 9,291 8,785 10,616 2.7 3.2 3.2 20.8 7 Taiwan 11,107 8,060 9,849 3.2 3.0 3.0 22.2 8 Thailand 8,356 7,109 7,771 2.4 2.6 2.4 9.3 9 Germany 7,531 5,670 7,577 2.2 2.1 2.3 33.6 10 Saudi
Arabia 8,868 3,760 5,314 2.5 1.4 1.6 41.3
11 Ecuador 6,113 3,102 5,205 1.8 1.1 1.6 67.8 12 Iraq 7,915 2,987 4,601 2.3 1.1 1.4 54.1
Source: TradePort.org by U.S. Census Bureau Foreign Investment and Foreign Direct Investment As depicted in Chart 10 – Employment by Foreign Owned NonBank U.S. Affiliates in the top Five States, California has had the highest level of employment in foreign-owned firms since at least 1997. Along with employment, foreign-owned firms own more property, plants, and equipment in California than in any other state. FDI in 2008, 2009 and 2010 was respectively, $3.8 billion, $5 billion and $6.8 billion. Foreign controlled companies employed 594,100 Californians in 2008 (most recent numbers known at the time of printing. Historically, leading sources of FDI in California were investors from the United Kingdom, Japan, Switzerland, Germany, and France. Europe, in total, has been the largest source of FDI in California. Collectively, Asian Pacific countries have the second highest FDI in California, with a higher proportion of manufacturing employment and commercial property holdings than are held by European investors. While California remains the largest recipient of FDI in the United States, faster FDI growth is occurring elsewhere, according to the Kyser Center for Economic Research. From 1999 to 2005 the level of gross property, plant, and equipment of all non-bank affiliates in California grew by 10.7%, compared to 20.6% nationally, 95.9% in Kentucky, 50.0% in Colorado, 46.2% in Massachusetts, and 26.7% in New York.
200.0
300.0
400.0
500.0
600.0
700.0
2002 2003 2004 2005 2006Pe
op
le E
mp
loy
ed
(th
ou
san
ds)
Chart 10 - Employment by Foreign Owned Nonbank U.S. Affiliates
in the top five States (2002-2006)
California
New York
Texas
Pennsylvania
Illinois
22
Goods Movement Infrastructure
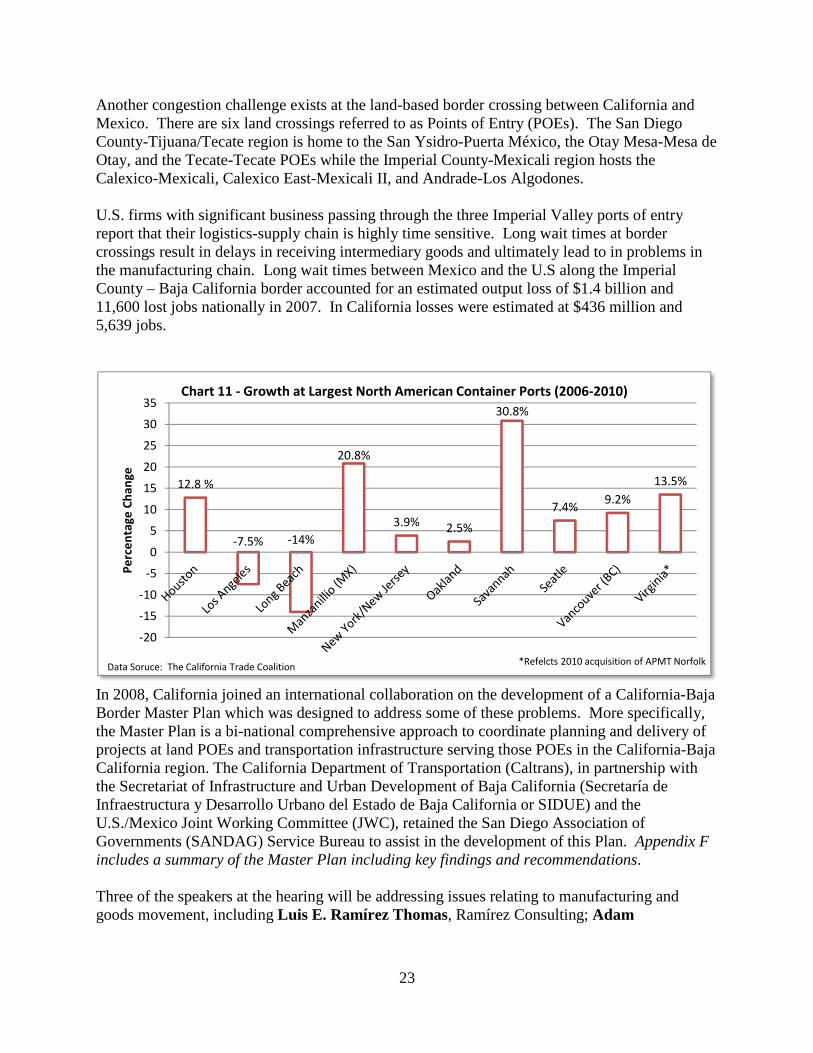
Goods movement supports employment, business profit, and state and local tax revenue. California businesses rely heavily on the state's air/sea ports and their related transportation systems to move manufactured goods. Firms rely on fast, flexible, and reliable shipping to link national and global supply chains and bring products to the retail market. Transportation breakdowns and congestion can idle entire global production networks. As a result, the capacity and efficiency of seaports, airports, and multimodal linkages have become critical factors in global trade. Changes in U.S. and global trade patterns in the past 20 years have placed increasing challenges on California's good movement system. Between 1970 and 2002, for example, imports from Asia as a share of U.S. trade increased from 8% to 40%, thereby increasing the flow of imports through California’s gateways. Over the same period, U.S. trade shifted toward lighter goods, which are more likely to be shipped by air. While the state may have limited ability to affect these larger patterns, there are actions that the state can take to help California’s global gateways keep pace with the growing demand for shipping services. Specific recommendations are provided at the end of this section and a complete listing of recommendations is presented in Section V. Nationally, the Port of Los Angeles continued to hold the top rank in terms of two-way trade in 2010 (valued at $237 billion). It is followed by JFK International Airport ($162 billion) and the port of Chicago ($135 billion). Data on California’s other major ports are as follows: Long Beach ($89 billion, ranked 9th); LAX ($77 billion, ranked 12th); San Francisco International Airport ($50 billion, ranked 18th); Port of Oakland ($40 billion, ranked 25th); Otay Mesa Station ($31 billion); and Calexico-East ($10 billion). In terms of container activity the Los Angeles-Long Beach container port ranked 6th globally, behind Shanghai, Singapore, Hong Kong, Shenzhen and Busan. Dollar value is just one way to look at goods movement in assessing trends; it is also important to look at growth. Chart 11– Growth at Largest North American Container Ports, 2006-2010, shows that California ports are actually losing market share. For California, expanded supply chains for manufacturing and product distribution have resulted in congested seaports, where cargo ships are often delayed for extended periods of time waiting to unload. Truck access is often cited for the delays. At international airports, truck access is also a problem, and expansion of major airports is severely limited by urbanization, ground access, air quality impacts, and local opposition.
23
Another congestion challenge exists at the land-based border crossing between California and Mexico. There are six land crossings referred to as Points of Entry (POEs). The San Diego County-Tijuana/Tecate region is home to the San Ysidro-Puerta México, the Otay Mesa-Mesa de Otay, and the Tecate-Tecate POEs while the Imperial County-Mexicali region hosts the Calexico-Mexicali, Calexico East-Mexicali II, and Andrade-Los Algodones. U.S. firms with significant business passing through the three Imperial Valley ports of entry report that their logistics-supply chain is highly time sensitive. Long wait times at border crossings result in delays in receiving intermediary goods and ultimately lead to in problems in the manufacturing chain. Long wait times between Mexico and the U.S along the Imperial County – Baja California border accounted for an estimated output loss of $1.4 billion and 11,600 lost jobs nationally in 2007. In California losses were estimated at $436 million and 5,639 jobs.
In 2008, California joined an international collaboration on the development of a California-Baja Border Master Plan which was designed to address some of these problems. More specifically, the Master Plan is a bi-national comprehensive approach to coordinate planning and delivery of projects at land POEs and transportation infrastructure serving those POEs in the California-Baja California region. The California Department of Transportation (Caltrans), in partnership with the Secretariat of Infrastructure and Urban Development of Baja California (Secretaría de Infraestructura y Desarrollo Urbano del Estado de Baja California or SIDUE) and the U.S./Mexico Joint Working Committee (JWC), retained the San Diego Association of Governments (SANDAG) Service Bureau to assist in the development of this Plan. Appendix F includes a summary of the Master Plan including key findings and recommendations. Three of the speakers at the hearing will be addressing issues relating to manufacturing and goods movement, including Luis E. Ramírez Thomas, Ramírez Consulting; Adam
12.8 %
-7.5% -14%
20.8%
3.9% 2.5%
30.8%
7.4%9.2%
13.5%
-20
-15
-10
-5
0
5
10
15
20
25
30
35
Pe
rce
nta
ge
Ch
an
ge
Chart 11 - Growth at Largest North American Container Ports (2006-2010)
Data Soruce: The California Trade Coalition*Refelcts 2010 acquisition of APMT Norfolk

24
Wasserman, Global Logistics Development Partners; and José Eugenio Lagarde Amaya, Industrial Development Commission of Mexicali. State's diverse population as a trade advantage California's diverse population provides the state with a key trade and foreign investment advantage over other states and nations. Due to strong past in-migration from other nations, more than one-in-four of California's current residents (9.5 million people) were born outside the U.S., compared to just over one-in-ten nationally. About half of foreign-born Californians are from Latin America, and another third from Asia. Net foreign in-migration currently totals approximately 200,000 persons annually, representing nearly 40% of California's annual population growth. For many immigrant groups, California represents the single largest gathering of their brethren outside their native lands. The current California international trade and investment study found that the state's economic and social diversity uniquely positioned the state as a preferred partner for certain regions around the world. Regionally, 36% of the population in Los Angeles is foreign born, as is 27% of the Bay Area. It is estimated that 40% of the entrepreneurs in the Silicon Valley are foreign born. New globally-based models for innovation and technology have brought great changes in the function of world economies, and California's dominance as a center of innovation is being challenged. The newly emerging economies of China, India, and Singapore, among others, have been and are committed to continuing massive investments in research and development to become leaders in innovation and not merely "copycat" economies. While these dynamics pose challenges to current leading technology centers, they also offer California new opportunities for collaboration and cooperation. The state's diversity could be a crucial advantage to successful global collaboration and foreign investment attraction. The state is already engaged in academic and research partnerships with China, Canada, and Iceland on renewable energy and other technologies. The University of California at San Diego has a multi-year manufacturing initiative with Mexico supporting economic growth on both sides of the border. These types of partnership efforts, however, have not yet been brought forward into a broader economic development framework and are too often treated as one-off initiatives. Enormous potential exists in research, development, and product manufacturing by capitalizing on cross border initiatives if California is to successfully transition to the new and more highly connected economic world of the 21st Century. Bi-National Economic Development and Migration Outward migration from Mexico to the U.S. has historically been a complex and controversial issue. For a select group of workers in Mexico, coming to California appears as a good economic choice for them and their families given the sometimes limited alternatives where they live. While migration from Mexico has benefitted many economic sectors in California, the issue of immigration has consistently been on the state's public policy agenda.

25
One often overlooked and under-funded element to this discussion is bi-national economic development policies which can help to re-balance the drivers of immigration. The "maquiladores," a by-product of NAFTA, are manufacturing and assembly facilities located in Northern Mexico including Mexicali. With cross border supply chains, these facilities have become important players within extended and sometimes global supply chains. The North American Development Bank, another entity created through enactment of NAFTA, provides project financing and construction oversight for projects initiated through the U.S. Environmental Protection Agency's U.S.-Mexico Border Water Infrastructure Program. The program serves communities within 62 miles, north and south, of the border. By providing cleaner water and improved infrastructure, the quality of life is improved and jobs are created on both sides of the border. Texas has taken the bi-national economic development model a step further. Local economic developers actively engage businesses to develop dual manufacturing facilities on both sides of the border. Funded through a local sales tax, these local economic developers are contributing to the economies in their states and Mexico. Challenges to California's Competitiveness Innovation has long been the cornerstone of California's competitive edge. Innovation, by its very nature, requires constant reassessment and, very often, reinvestment of public resources to maintain and enhance a creative environment where businesses and financial partnerships can constantly evolve. In March 2008, JEDE undertook a survey of California's business climate. Overall, JEDE found that the state's businesses experience higher costs than in many other areas of the nation, consistently ranking California in the top 10 highest cost states. However, the survey also found that even with those costs certain regions of the state remain highly competitive within the national and global marketplace. A copy of the California business climate survey is available through the JEDE Committee website www.assembly.ca.gov .
Infrastructure: A Major Challenge to California's
Competitiveness World class infrastructure plays a key role in business attraction, as multinational companies consistently rank the quality of infrastructure among their top four criteria in making investment decisions. Research shows that as U.S. infrastructure has been in a decline, infrastructure in other countries is rapidly increasing. The 2010-11 Global Competitiveness Report by the World Economic Forum places U.S. infrastructure 23rd in the world, a drop from its rank of 7th in 2000. California trade-related infrastructure is in a similar state. Concerns have been raised over the lack of development of new and/or significantly upgrading of existing infrastructure. The impact of this lack of investment is compounded by the substantial new investments made in other states and nations, including the expansion of the Panama Canal. With the logistics sector alone employing over 73,000 workers, failing to remain competitive will impact California jobs.

26
Since the release of the 2008 survey, JEDE policy staff continue to track California competitiveness issues and report them as part of the monthly update of the Fast Facts. As an example, the 2007 index developed by the Milken Institute and Greenstreet Partners ranked four California metro areas in the top 25 areas that are best to create and sustain innovation-based jobs: Riverside-San Bernardino (3rd), Bakersfield (17th), Vallejo-Fairfield (22nd), and Sacramento–Arden-Arcade–Roseville (25th). In the 2010 index, however, only one California location was ranked in the top 25 communities, that being Hanford-Corcoran (24th). California has also consistently been a leader in attracting venture capital, although research shows that other states and regions in the world are beginning to close the gap. A 2010 report, Venture Impact: The Economic Importance of Venture Capital Backed Companies in the U.S. Economy showed that although California remains a leader in both venture-backed employment and revenues, its position is being seriously challenged. Among other key challenges is the continued impact of the 2008 recession. According to the report, California was the only state, within the top 5 states, to see a decline in venture capital investment; the state went from receiving $997 billion in 2008 to $845 billion in 2010. The State of Washington saw the largest increase in venture capital investment, having received $79 billion in 2008 to $256 billion in 2010. In addition, the report offered the following findings related to venture-backed companies and employment: • Nationally, venture-backed companies contributed to 11.9 million jobs and $3.1 trillion in
revenues in 2010. California was the leader in revenues tied to venture-backed companies with $846 billion, followed by Washington ($256 billion), Texas ($243 billion), Pennsylvania ($238 billion) and Massachusetts ($90 billion).
• The states with the highest employment attributable to venture-backed companies were California (3.9 million jobs), Texas (1.1 million jobs), Pennsylvania (783,527 jobs), Washington (778,579) and Massachusetts (775,151 jobs), in 2010.
Another historic California strength has been its academic-based research capacity. In a 2006 survey, the University of California ranked second with Caltech third and Stanford fourth among all universities for biotechnology transfer. MIT was ranked first and the University of Florida ranked fifth. California also ranks first among 50 states for patents issued in 2010, when 30,089 total patents were granted. Other top performing states include New York (8,095 patents), Texas (8,027 patents), Washington (5,810 patents), and Massachusetts (5,261 patents). California's research and development expenditures as a percentage of GDP were just above 3.5% in 2009, making it highest above many global competitors including Japan, Korea, Germany, France, Singapore, Canada, U.K., China and India. While the state's world class research universities remain an advantage, recurring cuts to the University of California system and the proliferation of new global centers of innovation will likely require new collaborations and investments.

27
Other indices reviewed identified additional areas that threaten California's long-term economic strength. In particular, JEDE surveys found that the state will need to make long-term investments in infrastructure, K-12 education, and workforce development. As an example, California ranks only 5th among U.S. states in science and technology according to the Milken Institutes 2010 Science and Technology Index. If the state does not regain competitiveness in these areas, California's advantages in entrepreneurship, finance, and technology will further erode. The most recent study by the state on global competitiveness (2008) made similar findings to the reviewed indices, especially as they relate to the need to make improvements to infrastructure and workforce development. More specifically, the Business, Transportation and Housing Agency (BTH) study found that any area where the state "cannot supply high-quality workers – at the right quantity – will tend to encourage industry to outsource, offshore, or move out of state." The BTH study also recommended that the state would benefit from improved infrastructure investments, including investments in broadband coverage, water infrastructure, energy generation and delivery, as well as road, rail, and port infrastructure. Hearing Discussion Points The November 10, 2011 hearing will provide an opportunity for the committee to hear testimony on a number of trade related challenges facing California, in general, and the rural communities along the border and within the economic corridor to the North, more specifically. Among the key challenges to be discussed are the condition of the state's trade related infrastructure, impediments to capital flow, workforce preparedness, as well as other impacts of globalization. Witnesses have been asked to provide their own assessments, highlight successful models and recommend practical solutions for guiding the state's actions in the post-recession economy. Related recommendations, as summarized in Section V, may include: 1. Introduce legislation to authorize the creation of a bi-national economic development
authority for the bi-national mega-region and related areas. Membership may include representation by Imperial County, the Coachella Valley, San Diego County and Baja California.
2. Develop an economic development focused MOU between the elected representatives in the
Coachella Valley, Imperial Valley, San Diego City and/or County, and the State of Baja. Initially, the agreement would focus on collaborative marketing approaches and could later support larger regional solutions related to infrastructure.
3. Engage, in cooperation with the California Governor's Office of Business and Economic Development, the Conference of Border Governors and the Border Legislative Conference on how to work more effectively in achieving key competitiveness objectives. As a first step find out more about the following initiatives: • Development of Secure Manufacturing Zones.

28
• Development of a coordinated network of “inland ports” along the main logistics corridors.
4. Call on President Barack Obama to designate a point person to facilitate the permitting process among federal agencies for ports of entry and other issues related to goods movement.
5. Engage education, business and civic leaders to discuss opportunities for complementary educational curricula and internships related to emerging sectors in the bi-national economic corridors.
6. Call on the California Department of Transportation to begin facilitation of the update to the California-Baja Border Master Plan. Encourage and actively support outreach to the economic development community within the Mega-Region and along established economic corridors.
7. Advocate with President Obama and the U.S. Congress for additional capitalization of the North American Development Bank, as well as providing more flexibility under the definition of eligible geographic area by incorporating areas within clearly defined economic corridors.
8. Authorize a new and dedicated funding source for local economic development entities within the U.S. side of the mega-region and its economic corridors.
9. Pass legislation, AB 1409 (JEDE), which requires the state Goods Movement Plan to be reflected in the international trade and foreign investment strategy, as well as being integrated in the state's short and long-term infrastructure and economic development plans.

29
California's International Trade Strategy calls for the state to engage the federal government on U.S. trade policy and advocate for California's business interests before IGPAC.
Section III – U.S. Trade Policy and the Federal - State Relationship This section provides general background on the structure and activities of trade agreements, including a discussion on international trade agreements, how the U.S. engages in its negotiations, and the limited options California has in influencing the final outcomes of international trade agreements. U.S. Trade Agreements The U.S. Constitution grants the federal government the power to negotiate treaties and trade agreements. Ratification, however, is vested in the U.S. Congress upon a two-thirds vote of approval. Congress is prohibited from making amendments to a trade agreement, though it is not uncommon for related bills to accompany the passage of a trade agreement that include mitigation provisions for economically impacted communities, workers and businesses. In recognition of this inability to modify specific elements of trade agreements once negotiated and their far reaching impact on state and local economies, Congress directs the U.S. Trade representative (USTR) to seek advice from states throughout the negotiation process. Among the 29 trade-related advisory committees, the USTR provides administrative support to the Intergovernmental Policy Advisory Committee (IGPAC). The IGPAC is comprised of state and local officials, including members of state legislatures, state trade directors, and related national associations. California state government does not have a position on IGPAC, however, there is one California member, Carlos J. Valderrama, who represents the Los Angeles Area Chamber of Commerce. The USTR also maintains a state point of contact (SPOC) system in which the governor of each state designates a single point of contact within the state that is responsible for transmitting information to the USTR and disseminating information from the USTR to state officials. Pursuant to the statutory provisions in SB 1513 (Chapter 663, Statutes of 2006), the SPOC serves as the official liaison between the USTR, the Administration, and the Legislature. The SPOC is required to "promptly disseminate correspondence or information" from the USTR to the relevant state agencies, departments, and legislative policy committees in the Senate and the Assembly. The SPOC is also required to work with the Administration and the relevant state committees to review the effects of proposed and enacted trade agreements. Currently, California has no designated SPOC. The U.S. has trade agreements in force with 20 countries including Australia, Bahrain, Canada, Chile, Colombia, Costa Rica, Dominican Republic, El Salvador, Guatemala, Honduras, Israel, Jordan, Korea, Mexico, Morocco, Nicaragua, Oman, Panama, Peru, and Singapore.

30
Besides trade agreements, the U.S. has a number of trade preference programs that allow special access to U.S. markets for countries that are considered developing markets and/or where the U.S. wants to develop a stronger relationship. Foundations of International Trade Soon after the outbreak of World War II, high level discussions began in the U.S. and the United Kingdom regarding the need for a new post-war financial system. These discussions also included the need to plan for post-war reconstruction and global economic development as a means to ensure that the economic conditions that contributed to the rise of the Fascists did not reoccur. Central in these discussions were and Harry Dexter White for the U.S. and John Maynard Keynes for the United Kingdom. By April of 1944 a joint statement was finalized, and in June a select group of delegates met and began to form the foundation of what would be presented at the United Nations Monetary and Financial Conference in July at Bretton Woods, New Hampshire. All 45 Allied nations were represented and committed to the purpose of designing a financial system that would end economic nationalism and open the world’s markets. To achieve this goal, the world's leaders
signed the Bretton Woods Agreements, creating the International Monetary Fund (IMF), the World Bank, and the General Agreement on Trade and Tariffs (GATT). The IMF and the World Bank provided loans for development, and the GATT regulated trade, which, at that time, was mostly in manufactured goods. From time to time, the countries participating in the GATT would come together for “rounds of negotiations” (Round). Each Round is generally named after the locale where the Round began. For the next 50 years, the GATT was expanded
significantly. The 1990’s saw a major shift in U.S. engagement in the global trading system. NAFTA was negotiated among Mexico, Canada, and the U.S. and took effect in 1994. NAFTA sought to eliminate all trade restrictions between the three countries and create a single trade region. In 1995, during the Uruguay Round of GATT negotiations, the World Trade Organization (WTO) was established. The WTO was created to administer the 18 different trade agreements that were folded into the WTO. The WTO and NAFTA signified a major shift in the relationship of international law to national and sub-national law. While GATT was voluntary, NAFTA and the WTO agreements contain measures that render them binding and enforceable, providing for enforcement, administration, and continuing negotiations by participating countries on the agreements. Below are two other important trade rules. • Most-Favored Nation (MFN) refers to the principle of nondiscriminatory treatment in the
granting of trading privileges. Simply put, a member of the WTO or NAFTA cannot grant a trade privilege, such as a lower tariff, to any other member without offering the same deal to all members. Conversely, a member cannot discriminate against another member by

31
imposing a trade restriction against it without imposing it on all other members. All members, then, treat all other members as "most-favored nations."
• National Treatment is the principle that in both domestic and foreign arenas "like" goods and
services must be treated equally. Products are considered "like" by taking into account only their end characteristics; methods of production cannot be considered. Thus, products produced under deplorable labor and environmental conditions cannot be distinguished from those that are produced by more globally accepted practices.
The World Trade Organization (WTO) As discussed above, the WTO was approved by Congress in 1993 and went into effect on January 1, 1994. WTO agreements contain measures that were negotiated and approved by the majority of the world’s trading nations, guaranteeing countries important trade privileges. The WTO enforces 18 different agreements, including: • The General Agreement on Trade in Services (GATS) is designed to liberalize trade in
services by limiting governmental regulations that affect the services trade. GATS works on a positive list basis, meaning that each government chooses what service sectors to commit. The U.S. has already committed several sectors, including financial services, health care services, and retail and wholesale distribution services, and, is currently looking to add more service sectors to this list.
• The Agreement on Agriculture (AOA) sets rules on the international food trade and restricts
certain domestic agriculture policies. AOA issues include, but are not limited to, the level of support for farmers, food safety rules, the ability to maintain emergency food-stocks, and other issues designed to ensure a secure food supply.
• Trade Related Intellectual Property Rights (TRIPS) is designed to create enforceable global rules on patents, copyrights, and trademarks to protect inventions or artistic products; however, critics point out that the agreement extends far beyond this scope by including the practice of patenting plant and animal forms as well as seeds.
• The Government Procurement Agreement (GPA) was signed in 1994. This agreement sets
limits on the criteria permitted for decisions regarding government purchase of goods. Government procurement has traditionally been a tool for the promotion of social goals, e.g. investing in local businesses or placing requirements on the way goods are produced (as in recycled content laws, local content laws, or anti-sweatshop laws). Unlike other WTO agreements, not all WTO countries are bound by the GPA, rather, only those who have signed the GPA are bound by it.
Currently, 39 countries (including the U.S.) have signed the agreement. Additionally, a majority of U.S. states have signed the agreement, as well as seven cities. Decisions to sign the agreement at the state and local level have generally been made by the respective governor or mayor and have not been debated by state legislatures or city councils, though the impact of the GPA on the authority of these bodies is

32
substantial. The USTR seeks approval only from state Governors as procurement rules are incorporated into additional trade agreements. In the next round of negotiations, the U.S. will likely try to increase the number of countries signing the agreement.
Under the WTO’s dispute settlement mechanism, member countries, often acting on the behalf of their business sector, can challenge the laws, policies, and programs of any other member country as being in violation of WTO rules. Panels of trade experts have the power to adjudicate claims of alleged violations of these rules and hand out punishments. Generally, the losing country has three choices or any combination thereof, as follows: (1) change its law to conform to the WTO ruling; (2) face harsh economic sanctions; or (3) pay compensation to the winning country. As their task is to only determine whether or not the policy in question is a “barrier to trade,” the panels do not have to consider other factors, such as public health, economic justice, or economic sovereignty. The design and operation of the WTO’s dispute resolution system is established in the Uruguay Rounds Dispute Resolution Understanding (DRU). The DRU provides only one specific operating rule: all panel activities and documents are confidential. The North American Free Trade Agreement (NAFTA) NAFTA was approved by Congress in 1993 and went into effect on January 1, 1994. NAFTA is based on a model and philosophy very similar to that underlying the WTO; the agreement
eliminates most trade and investment barriers between Canada, U.S., and Mexico. Under this agreement, more than half the duties on American exports to Canada and Mexico were eliminated. Other barriers were gradually phased out over either five, 10, or 15 year periods. NAFTA goes a step further than the WTO by empowering corporations to sue governments directly, and authorizing corporations to seek monetary damages for loss to their property or profits caused by governmental actions. This authority is known as Chapter 11. NAFTA Chapter 11 grants new rights to private foreign investors, allowing
investors to directly sue national governments for financial losses due to federal, state, or local government actions. In contrast, the 1989 Free Trade Agreement between Canada and the U.S., which required investor complaints to be screened for merit by government representatives before moving forward, and under the WTO, only governments can launch challenges against other governments. The NAFTA agreements provide private foreign companies an alternative court system with which to challenge and seek compensation for any government action that is “tantamount to expropriation” or results in an “indirect expropriation”. The agreements leave these terms largely open to interpretation by NAFTA tribunals during dispute settlement proceedings. Investment tribunal decisions are afforded no precedential value; therefore, even a positive ruling provides no assurances for the future. There are several Chapter 11 cases of interest to California, two of which directly challenge California actions:
33
• In the Metalclad case, a U.S. company brought action against a Mexican local government
land use policy. A NAFTA tribunal interpreted an “indirect expropriation” to be any government action that interfered with any part of the economic benefit of a property and required Mexico to pay Metalclad $16 million.
• In the Methanex challenge to California’s Methyl tert-butyl ether ban, a NAFTA tribunal
defined the expropriation terms much more narrowly, finding that a non-discriminatory regulation for a public purpose, which is enacted with due process, cannot constitute an expropriation.
• In the pending claim against a California law requiring backfilling of open-pit gold mines,
Glamis Gold Ltd. is seeking no less than $50 million in compensation because of California’s actions aimed at protecting Native American sacred sites.
Several trade agreements modeled on NAFTA have been negotiated by the USTR and approved by Congress; these include the Central American Free Trade Agreement (CAFTA) and bilateral agreements including those with Australia, Chile, Singapore, and Jordan. Under the WTO, NAFTA, and additional bilateral and regional trade agreements, if a state law is in question, the state is not allowed to represent itself, and instead must be represented by an arbitrator chosen by the USTR. If a state law is found to be inconsistent with U.S. trade obligations, it would not be automatically preempted by the international ruling; rather, the state would be urged by the U.S. government to voluntarily change its law or enforcement practices to comply with the ruling. The U.S. government is authorized to use persuasion, including withholding federal funding or initiating a lawsuit in order to ensure state compliance with trade rules. Recently Approved Trade Agreements The U.S. House of Representatives (House) and the U.S. Senate passed comprehensive free trade agreements with Colombia (HR 3078), Panama (HR 3079), and South Korea (HR 3080) in October 2011. The House also passed legislation, previously approved by the Senate, reauthorizing Trade Adjustment Assistance to provide workers displaced by foreign trade expansion with training in new skills and other assistance. The trade agreements were approved with wide bipartisan support. In the House, the Colombia vote was 262-167, Panama 300-129, and South Korea 278-151. In the Senate, the votes were: Colombia 66-33; Korea 83-15; and Panama 77-22. The content of the three trade agreements were negotiated under the Bush Administration. Congressional ratification was held up due to strong opposition to both specific elements of the agreements and, in the case of Colombia, the concept that the U.S. should enter into full trade status with a country that had such a poor record of civil justice. The major disagreements focused on concerns over jobs lost in the U.S. because of further globalization, and the labor and environmental protections contained in the agreements, especially Colombia's history of violence

34
against union organizers and workers. A separate labor action plan was negotiated with Colombia to ensure that it strengthens law enforcement and prosecution efforts in worker violence cases. Opponents of the agreement remain concerned, however, that the action plan is not made an integral part of the trade agreement. The California Legislature twice sent resolutions to Congress expressing its opposition to the Colombian agreement (ACR 29, Statues of 2009) and concerns that the agreement did not adequately mitigate its potential impact on the California cut flower industry and its workers (ACR 29, Chapter 93, Statutes of 2011). In lobbying Congress, proponents of the agreements stressed the potential economic benefits to the U.S. For California, South Korea was California's fifth largest export market in 2010, with exports totaling more than $8.1 billion, up from $5.9 billion in 2009. In 2010, Colombia was California's 34th largest export market with exports totaling $408.7 million (a 24% increase over the previous year). Panama was California s 42nd largest export market in 2010, with exports totaling $252 million. According to the California Chambers of Commerce, California manufacturers would benefit from the Colombian agreement as they would gain access to the $5.25 billion Panama Canal expansion project as the agreement eliminates the 5% duty on construction equipment and infrastructure machinery. According to Capital Institute, Senator Dianne Feinstein's remarks on the Senate floor in support of the Panama agreement noted that the project would ultimately reduce transportation costs for California exports. The Obama Administration, which had pushed hard to pass these agreements, stated that ratification of the three trade agreements could result in about $13 billion dollars more in U.S. exports annually and create as many as 250,000 jobs. Among other things, the agreements ensure market access, national treatment, and regulatory transparency in the signatory countries for U.S. goods and services. They also eliminate or substantially reduce tariffs and non-tariff trade barriers on U.S. exports in all sectors. The American Farm Bureau Federation estimated that U.S. farm exports could increase by more than $690 million per year to Colombia, more than $195 million per year to Panama, and more than $1.8 billion per year to South Korea. Emerging Trends In September 2011, the WTO held its annual public forum, this year entitled, Seeking Answers to Global Trade Challenges. The forum was based around four core challenges: global food security, trade in natural resources, accuracy of country of origin designations, and the need for a next generation trading system. The issue of the country of origin rules is very relevant to local and regional economic development discussions. In putting the issue forward the WTO is recognizing the changing nature of the international supply chains and multi-facility production. Many products are no longer singularly made in one country. An increasing amount of product components are made in more than one country. This is certainly true for California-made products where cross border supply chains have been identified as a key trend for more than a decade. Further, this economic

35
trend has broad public policy implications. When the accuracy and appropriateness of the county of origin designation is ambiguous, it brings into question the current data on which important global decisions are based. The fourth issue raised at the WTO public forum was the need for a new rules-based, multi-lateral trading system that could more accurately reflect the evolving global market. Among other examples, the WTO noted the proliferation of preferential trade agreements, power shifts in international politics, new technological developments, the growing role of non-state actors, and the emergence of social and environmental considerations as part of trade. These are similar issues that have been raised in California's own trade policy discussions. In the past few years, legislators have begun to increasingly question the U.S. trade framework and its impact on the rights of states and the ability of its residents to pursue their collective values including those related to environmental and economic development considerations, such as "buy and hire local" policies. In the state's most recent international trade study, it not only found that California faces significant challenges from offshoring, the global redistribution of manufacturing and services, and growing talent pools in other countries – it also raised concerns regarding the impact of global trade arrangements on California businesses. More specifically, the International Trade and Investment Study identified five key shifts in U.S. and global international trade policy and practice that would likely affect California, including the following: 1. Limit on use of Multilateral Agreements: Progress in multilateral negotiations is likely to be
limited in the near future given the current deadlock between the U.S., the European Union (EU), and developing countries. Each of these players has the ability to block progress. These challenges are only expected to become greater as the economies of the BRIC – Brazil, Russia, India, and China grow and become more dominant players in the global markets.
2. Expansion of Regional Agreements: Given the challenges of multilateral agreements, it is
expected that more bilateral and regional trade agreements will be pursued. This trend is also being driven as a promotional tool by the U.S. and EU as a means to expand their markets as the middle class expands in developing countries.
3. Increase in the use of Dispute Resolution Mechanisms: As discussed above, both the WTO
and all U.S. bilateral trade agreements contain mandatory dispute settlement mechanisms. As with most policies that open access to the courts, there is a good and bad side. While California business may have a greater ability to win access to new markets, it is also now easier to challenge California policies.
4. Increased Applicability of Sustainability Issues: There is a growing interest among nations
and investors in the environmental, social, and economic policies and practices of trade partners. As a trend setter, California can be particularly at risk for having policies challenged, thus making advocacy even more important.

36
5. Impact of Open Borders: Globalization brings greater economic integration. These additional open markets also yield unintended consequences, such as concerns over homeland security, money laundering, drug trafficking, and illegal immigration. These impacts can be costly and can potentially overwhelm government agencies' ability to act.
It is anticipated that a number of the speakers at the hearing will discuss the changing global market. Linsey Dale, who leads the Imperial County Farm Bureau, will specifically be discussing the impact of the current trade rules on agriculture in the Imperial Valley. Hearing Discussion Points Among the key challenges relating to this section to be discussed at the November 10, 2011 hearing include the adequacy of the state and federal trade relationship, whether the state is sufficiently taking advantage of trade-related economic opportunities, and whether the current federal trade agreement framework adequately protects the rights of states and ensures the basic economic and civil rights of its citizens. Witnesses have been asked to provide their own assessments, highlight successful models, and recommend practical solutions for guiding the state's actions in the post-recession economy. Related recommendations, as summarized in Section V, may include: 1. Call on the California Governor's Office of Business and Economic Development to begin
the process for adopting an updated ITI Strategy that includes the discussion of the unique needs of the Mega-Region including issues relating to infrastructure, access to capital, workforce development, bi-national entrepreneurship and regulatory reforms that support business start-ups, growth and manufacturing.
2. Call on Governor Jerry Brown to appoint the statutorily mandated position of "State Point of
Contact" for the U.S. Trade Representative.
3. Call for the re-examination and assessment of the impacts of free trade agreements, preferences and U.S. aid related programs in Central and South American counties to ensure that the desired economic, environmental and social benefits are actually being produced within the targeted country and do not have unmitigated negative impacts on communities in California.

37
Section IV – California's Trade Program Between 1986 and 2004, the Technology, Trade and Commerce Agency (TTCA) was the responsible government entity for promoting economic development, international trade, and foreign investment in California. When the agency was eliminated, due to its poor administrative performance, the authority for all state trade activity was also struck from statute. Beginning in the 2005-06 session, several legislative measures were introduced to reinstate the state's trade authority. No measures were successful until a compromise was negotiated by the JEDE, SB 1513 [(Romero), Chapter 663, Statutes of 2006]. During the deliberations on the re-establishment of the state's trade authority, concerns were repeatedly raised that the state lacked a
comprehensive, or even generally understandable, statutory scheme related to trade and foreign relations. SB 1513 addressed these concerns by first requiring the Business, Transportation and Housing Agency (BTH) to undertake a trade study to determine what role, if any, the state should play in international trade and foreign investment activities. Second, the bill required BTH to establish a business advisory committee to provide California businesses with direct access to the policy making process. Third, the bill required the development of a trade strategy that is consistent with the trade study and acts as the vehicle for implementing the state's trade policy. The first five-year strategy was published in February 2008. The next update is
required in February 1, 2013. California's Trade Program The foundation of the state's overall trade program is the economic assessment that is provided by the international trade study. This approach allows the state to take not only a regional approach, but also an industry sector approach based on the state's core and emerging industries. By emphasizing the development of deeper economic relationships within core and emerging industry sectors and their trade associations, the strategy better aligns with economic development activities at the local and regional levels. This tighter alignment should result in increasing the impact of the state activities and investments. Dominant and emerging industries from the 2008 study include the following:
Dominant industry clusters include: a) Professional business and
information services b) Diversified manufacturing c) Wholesale trade and transportation d) High-tech manufacturing
Emerging industry clusters include: a) Life science and services b) Value-added supply chain
manufacturing and logistics c) Cleantech and renewable energy d) Nanotechnology

38
Based on these industry clusters, the International Trade and Investment Strategy identified the following five program objectives:
1. Leverage existing services to provide export assistance to companies by the state's primary
and emerging clusters; 2. Develop a foreign direct investment program prioritized by the state's primary and emerging
clusters; 3. Promote and leverage the California brand; 4. Monitor and engage the federal government in regard to U.S. trade policy; and 5. Integrate international trade and investment into the state's overall economic development
strategy. Under each of these program objectives, are a set of specific actions, including timelines, priority levels, and measurable outcomes. One example of a recommended action includes facilitating export trade promotion through participation in key industry trade shows and business match-making activities during trade delegations visits. The ITI Strategy also strongly relies on coordinated efforts with existing federal and local public and private stakeholders. State Trade and Foreign Investment Infrastructure In support of local and private sector trade and investment activities, the state has several ongoing programs, including the Governor's Office of Business and Economic Development (GO-BIZ), the Business Partnership, Team California, Foreign Trade Zones (FTZ), the EB5 Program, innovation hub program (iHUB) and the Centers for International Trade Development. The Governor's Office Business and Economic Development was originally established in April 2010 through Executive Order (S-05-10) and later codified and renamed GO-BIZ through AB 29 (John A. Perez), Chapter 475,, Statutes of 2010. Since its inception, it has served over 3,000 businesses, 95% of which are small. GO-BIZ, in collaboration with the state's network of economic development departments and corporations, serves as the one-stop connection point for foreign and domestic businesses seeking to relocate to California. Under an MOU with the Business, Transportation and Housing Agency, GO-BIZ has been administering the state's international trade programs. The most frequent types of assistance include help with permit streamlining, starting a businesses, relocation and expansion of businesses, and regulatory challenges. Another networking tool used by the state is the statewide Business Partnership for International Trade and Investment, which includes representatives from small and large businesses and industries, as well as trade related nonprofit organizations and government representatives. The Partnership is required to meet at least once a quarter for the purpose of advising the Administration on key trade and foreign investment issues.

39
Council on Jobs and Competitiveness
Earlier this year, the White House convened the nonpartisan Council on Jobs and Competitiveness comprised of business, finance and labor leaders. It advised the President on the following ways government can best foster growth, competitiveness, innovation and job creation: 1. Accelerate private investment
in job-rich projects in infrastructure and energy development.
2. Ignite entrepreneurship by
creating a one-stop shop for accessing capital and accelerating payments for government contracts.
3. A national investment initiative
which includes increasing foreign investment and streamlining the EB5 investment visa program.
4. Simplify the regulatory
review process and streamline development project approvals.
5. Develop talent for filling current jobs and fueling growth by focusing on education and training in high and mid-skill jobs.
FTZs are areas within the state where goods may be imported without adhering to all U.S. Customs rules or tariffs. The program is designed to promote foreign trade and global supply chains while retaining domestic employment that might otherwise go to foreign countries. Merchandise admitted into a zone may, among other things, be stored, exhibited, repacked, assembled, graded, cleaned, processed, tested, labeled, and mixed with foreign merchandise. There are two types of FTZs – General Purpose and Subzone Purpose Zones. Subzones, sponsored by a General Purpose Zone, are generally located within an industrial park or port complex whose facilities are also used by the general public. These zones are established by the federal government with companion state statute authorization. California has 17 out of the 234 general purpose FTZs in the U.S., including zones located in Eureka, Imperial, Long Beach, Los Angeles, March JPA, Merced, Oakland, Palmdale, Palm Springs, Sacramento, San Diego, San Francisco, Port Hueneme, San Jose, Santa Maria, Southern California Logistics Airport, and Stockton. Appendix I provides a complete listing of the FTZs located in California.
Another key geographically targeted program is the EB5 investment program administered under the federal Immigration Act of 1990, which authorizes the issuance of 10,000 new green cards a year based on new foreign investment made in the U.S. Persons applying to this program must demonstrate that they have invested a minimum of $1 million and that later they have created at least 10 direct jobs, or have invested $500,000 in certain targeted high unemployment areas and that later they have created 10 direct or indirect jobs.
Based on 2010 state figures and a high unemployment rate defined as 14.4% or greater, 56 cities, 13 counties, 21 rural areas, and 11 metropolitan statistical areas in California have been identified as eligible target areas. Some states, such as South Dakota, have specific programs that target foreign investment by people who want to apply for visas under the investment provisions. The GO-BIZ also administers the iHUB program in

40
partnership with the statewide network of Small Business Development Centers. Designations are for a five-year period. There are currently 12 regional iHUBs including iHUBs located in the following regions: Sacramento, San Jose, the Coachella Valley, and San Diego and Imperial Counties. The iHUB program is designed to improve the state's national and global competitiveness by stimulating partnerships, economic development, and job creation around specific research clusters. Key assets and partners of the initiative include technology incubators, research parks, universities, federal laboratories, economic development organizations, business groups, and venture capitalists. The California Community College System administers the state's Centers for International Trade Development. These 8 Centers for International Trade Development, located in a majority of the urban areas of the state, offer technical assistance and consultation to firms doing business, or seeking to do business, globally. The northern most areas of the state are serviced through offices in Community Colleges located in Sacramento and San Bruno, and the most southern center is located in Chula Vista. Services provided through the Centers for International Trade Development include, but are not limited to: free or low cost import and export education programs; one-on-one counseling; access to international trade shows; opportunities to join trade missions; a "Help Desk" for advising on international business transaction challenges; and access to a trade information database (www.citd.org/trade_info/index.cfm) on its Web site. The Centers for International Trade Development serve over 2,500 businesses and entrepreneurs in California each year. The CITDs were the state's official applicant for federal funding under the STEP, which is based on the goals, objectives and activities detailed in the state ITI strategy. The Imperial Valley is served by the CITD located in San Diego. Business Development and Cooperative Agreements with Mexico Because it is the state's top trading partner, California also has several programs and boards designed to strengthen its relationship with Mexico. The Office of California-Mexico Affairs was established 1996 for the purpose of furthering and developing favorable economic, educational, and cultural relations with bordering Mexican states and United States border states. Placed within the Office are the operations of the California Office of the Southwest Border Regional Conference, the members of which include the four American border states: California, Arizona, New Mexico, and Texas. The Governor is a participant on the Conference of Border Governors which includes the Governors' of the adjoining border states in on both sides of the border. Another state board is the California-Mexico Border Relations Council, consisting of the California state agency Secretaries of the Resources Agency, Environmental Protection, Health and Human Services, Business Transportation and Housing, Food and Agriculture and the Director of Emergency Services. This Council has been very active in the past year, implementing the requirements of AB 1079 (V. Manuel Pérez), Chapter 382, Statutes of 2009, which directs the Council to develop a strategic plan to guide the implementation of the New River Improvement Project (NRIP).

41
The NRIP is a comprehensive program to clean up America’s most polluted river. To implement the project the Council works with appropriate bi-national, federal, state, local, and nongovernmental organizations on both sides of the California-Mexico border to establish cooperative water quality monitoring, public health studies, inspection, technical assistance programs and funding as needed to support and implement the project and meet the project objectives. The Budget Act of 2009 (AB 1 (Evans), Chapter 1, Statutes of 2009-10 Fourth Extraordinary Session) appropriated $800,000 for the City of Calexico in support of the improvement project for the New River and met federal matching fund requirements for an additional $4 million. A Cautionary Tale of Foreign Trade Offices California’s formal international trade programs commenced in 1977 with the creation of the Office of International Trade, within the newly formed Department of Economic and Business Development (DEBD). The DEBD was the predecessor of California’s Department of Commerce (DOC), which would later become the Trade and Commerce Agency (TCA), which was subsequently renamed the Technology, Trade and Commerce Agency (TTCA) prior to its dissolution in 2003.
In 1982, Governor Jerry Brown signed AB 3757 (Brown) creating the California World Trade Commission (CWTC). The CWTC would, over time, become responsible for the California Export Finance Office, which provided export guarantees to banks as security for small businesses and the Office of Export Development, which organized trade shows and assisted in matching California firms with foreign trade partners. In 1984, AB 3313 (Moore) required a study of the feasibility of opening foreign trade offices. Mentor International received the contract for the feasibility study, which included an outline of site selection procedures for potential foreign trade offices. In 1986, the CWTC established a Trade Representative’s Office in Washington, D.C.
While 1986 should have been considered the dawning of a new economic development era for California, it was only one year later that concerns began being raised by government policy watchdog groups, such as the Little Hoover Commission (LHC). In its 1987 report, the LHC called into question the administration, configuration, accountability, and purpose of the state's international trade programs. These criticisms were echoed in academic studies, state audit reports, and the Legislative Analyst's Office (LAO) Budget Analyses, until the ultimate dissolution of California's international trade and investment offices in 2003, along with the TTCA. A selection of these concerns is summarized below: • A State Auditor report in 1996, Trade and Commerce Agency: More Can Be Done to
Measure the Return on the State's Investment and to Oversee Its Activities found that TCA did not sufficiently assess the success of its programs. Because there was no mechanism to determine the return on investment provided by international trade programs, TCA's programs, including international trade and investment offices, were open to widespread criticism.

42
• In November 1999, the California Research Bureau (CRB) prepared a report, California Trade Policy, at the request of Lon Hatamiya, Agency Secretary, TCA. The report stated the typical promotional approach to international trade undertaken by state governments “does not work well in today’s changing, high speed, and complex global marketplace.” The CRB report summarized the main areas of concern having arisen regarding California's international trade offices. The issues included, but were not limited to: a) Lack of an overall state foreign trade
policy; b) Lack of a formal method to
determine where to locate trade offices;
c) Competency of state foreign trade
office staff;
d) Accuracy of cost-benefit estimates of office activities;
e) Appropriate level of trade office
staff, salaries, and benefits;
f) Value and purpose of state-sponsored foreign trade missions; and
g) Appropriateness of private funding
for state trade missions.
• A second State Auditor report, in 2001, of the TTCA found that the agency's "International
Trade and Investment Division has done an uneven job of coordinating with other entities working in the international arena. Without effective coordination, the agency cannot ensure that it has fully leveraged the State's resources and addressed possible gaps and redundancies in the delivery of services." The report also stated that six of the trade offices did not include targets to allow a successful evaluation of their performance or value.
• The LAO's Analysis of the Budget Bill (2003-2004) recommended the Legislature abolish all 12 international trade and investment offices on account of their questionable effectiveness.
• A 2004 Public Policy Institute of California (PPIC) paper noted that a thorough review of
California's international trade and investment programs and services currently offered may help clarify California's policy options, especially in light of the differences between today's globalized economy and the focus in the 1980s of increasing California's exports to close a trade imbalance.
The PPIC paper concluded that a discussion on the creation of a new foreign office network may be premature if it takes place prior to the state addressing the question of whether state government should offer international business services.
The state's current trade program does allow for the establishment of new Foreign Offices but only under certain specific circumstances, including the following: • A specific Foreign Office Strategy must be developed that outlines how the offices will
operate including how they will be financed, managed and monitored;

43
• The Legislature is required to provide statutory authority;
• An individual business plan must be submitted to the Legislature for each proposed Foreign
Office; and
• A qualified manager of the Foreign Offices must be hired and in place before any offices can open.
There are also heightened oversight requirements for the Foreign Offices including and an annual report, a three-year performance review by BTH and an independent review of the performance of the offices every five-years. There is also a requirement that BTH make an annual determination that sufficient funds have been appropriated in the Budget Act to meet the required oversight and management responsibilities related to the proper operation of the offices. While California does not currently operate any Foreign Offices, it does participate in bi-national and foreign relations activities, as discussed elsewhere in the report. Testimony during the November 10, 2011 hearing will include examples of how other states are financing and implementing state foreign offices and otherwise providing a presence in foreign countries. Highlights of California's Export Promotion Activit ies In carrying out its trade related duties, GO-BIZ and state government have a key private nonprofit partner in TeamCalifornia. In addition to maintaining a website http://www.teamca.org/index.php with key links to state and regional resources, TeamCalifornia's members provide direct assistance to businesses that are looking to relocate, expand and/or need other information about California. A special focus of TeamCalifornia is organizing California's presence at the premiere trade shows in North America and overseas. In 2012, TeamCalifornia will be facilitating California booths at trade shows that focus on cleantech, biotech, food products and corporate expansions. Through TeamCalifornia, small and large economic development organizations across California have an opportunity to combine resources and access key industry and real estate trade shows, advertise in top tier industry- and region-specific publications, and work within a single cooperative "Made in California" brand. California Promotion Agreements Over the years, California has also entered into an array of agreements with foreign governments. Some of the agreements support early stage research and development, while other represent traditional cooperative trade promotion activities. Below is a sampling of international agreements identified by Committee staff. • Sweden-California: Agreement on Use of Renewable Fuels: Signed in June 2006, in
connection with the California Energy Commission, this agreement is designed to advance

44
the use of renewable fuels, including using bio-gas to run motor vehicles. The agreement envisions an extensive exchange of technologies and ideas to promote alternative fuels.
• California-Brazil: International Trade Promotion: In October 2004, during a delegation
arranged by the California State University at Hayward, the Bay Area Northern California World Trade Center and the Brazil-based Chamber of International Business signed an agreement to increase international commerce between Brazil and California.
• California-Mongolia: International Trade Promotion: In May 2006, Lt. Governor Cruz
Bustamante signed an agreement to establish a public-private partnership to promote trade between California and Mongolia. The partnership is known as the California-Mongolia Business Forum-Ulaanbaatar.
• California-Tijuana: International Trade Promotion: In March 2005, Lt. Governor Cruz
Bustamante signed an agreement to establish a public-private partnership to promote trade between California and Tijuana. Tijuana's Business Forum is designed to fill the gap left by the closure of the California trade office.
• California-Taiwan: International Trade Promotion: Lt. Governor Cruz Bustamante signed
an agreement to establish a public-private partnership to promote trade between California and Taiwan. The agreement establishes the California-Taiwan Business Forum, an industry-funded, public-private partnership in Taipei.
• California-Hong Kong/Taipei/Beijing: International Trade Promotion: In October
2004, Lt. Governor Cruz Bustamante finalized agreements with three business associations based in Taipei, Hong Kong, and Beijing to establish a new public-private partnership model to promote trade with California.
• California-United Nations: Climate Change: Signed in April 2008 during an official
visit to China by the Secretary of the California Environmental Protection Agency, this is an agreement with the United Nations Environmental Program to have California share information such as academic research, effective policy initiatives, lessons learned, and technological innovation with the provincial governments of China.
In addition to the state, some local and regional entities have become engaged in international trade and foreign investment activities. Both Riverside County and Imperial County have aggressive programs. The Economic Development Department of Riverside County has an Office of Foreign Affairs, which has recently spear-headed the expansion of the FTZ that includes the Coachella Valley, lured new foreign businesses to the area, and facilitated the selection of the local golf course for the Canadian Open in January 2012. Tom Freeman, Commissioner, Riverside County Office of Foreign Affairs will be testifying at the hearing about his office's current trade activities. The Coachella Valley Economic Partnership (CVEP) is also an active local partner through the implementation of the Coachella Valley Blue Print, which calls for, among other things, a

45
targeted workforce development from K-12 forward and a comprehensive internal and external marketing plan for the Coachella Valley based on dominant and emerging industries. A summary of the ley elements of the Blue Print can be found in Appendix F. At the November 10, 2010 hearing, the President of CVEP, Tom Flavin, will be talking about the Blue Print, collaborative efforts between the Coachella and Imperial Valleys, and other economic recovery efforts. In the Imperial Valley, the local economic development corporation regularly leads a trade delegation to and hosts delegations from China and other foreign countries. The Imperial Valley Economic Development Corporation is also a key partner in a number bi-national initiatives including the California and Baja Mega-Region initiative. Tim Kelley , the Executive Director of the Imperial Valley Economic Development Corporation will be testifying on these activities, as well as on his role at the Vice President of TeamCalifornia. The following section includes additional discussion on important regional initiative and Appendix E has a fact sheet on the Imperial County economy. National Export Goal can also Drive Business Expansion In January 2010, President Obama announced a national goal of doubling U.S. exports within five years, setting a 2015 target for U.S. exports of $3.14 trillion. In accomplishing this goal, the federal government is expected to propose new programs, target existing trade related activities, and increase funding and technical assistance within current programs. The National Export Initiative (NEI), the mechanism by which the federal Administration is managing activities and funds related to increasing U.S. exports, has identified eight priority areas, including the following:
o Increasing exports among small- and medium-sized enterprises;
o Creating more opportunities for U.S. sellers to meet with foreign buyers, especially in the
area of green technologies; o Increasing the number of U.S. trade missions abroad and those coming to the U.S. o Making more credit available through existing credit programs, developing of new financial
products, and streamlining applications and processes; and o Removing of trade barriers through the successful conclusion of Word Trade Organization
(WTO) Doha Rounds, the Trans-Pacific Partnership Agreement, and robust monitoring and enforcement of WTO trade rules.
Since the announcement of the new national goal in early 2010, exports from California were up $20 billion over 2009. For California, the second largest exporter of products in the U.S. and the largest receiver of foreign direct investment in the nation, this federal goal could result in significant new economic opportunities.

46
CA Economy
Infrastructure
Labor
Business
Consumers
Govern-ment
Capital
In October 2011, the federal Small Business Administration released the first $30 million in state moneys to help small businesses participate in the achieving the national goal. California was awarded approximately $2.5 million to implement a portion of the state ITI Strategy. At the hearing, Victor Castillo with the Center for International Trade and Development in San Diego will be presenting on how the new export moneys will be used for trade promotion activities in Imperial County. Supporting Trade within the Broader State Planning Process As the diagram below illustrates, there are six key drivers of the California economy. Each of these drivers has both is own unique characteristics and also qualities that are shared in common. In addition, the diagram illustrates how each of the drivers is inextricably linked with in the overall economy. Weaknesses within any one of the drivers affects the other. As an example, California's aging infrastructure limits the state's ability to attract new capital – especially in rural and historically underserved areas, such as those in the Coachella and Imperial Valleys. The condition of infrastructure in turn limits new job opportunities, resulting in less consumer spending and ultimately less tax revenues. The State Planning Process California's community and economic development policy is driven by a number of statutory mandates, the first of which is the Environmental Goals and Policy Report (EGPR.) The EGPR is the state's 20-year growth and economic development strategy. Prepared every four years, it serves as a guide for individual department plans and overall state expenditures. The EGPR analyzes the current context of the state's environmental, economic and social setting; the driving forces behind growth and development; and the outside influences that affect many of the state's actions, policies, and programs. Based on this analysis of existing conditions and influences, the EGPR proposes cross-cutting and integrated goals and policies for the state which will allow it to achieve the overarching mission of sustainable development. Statutorily, the EGPR is also one of the state's main tools for implementing the state planning priorities: • To promote infill development and equity by rehabilitating, maintaining, and improving
existing infrastructure, particularly in underserved areas, and to preserve cultural and historic resources.
• To protect, preserve, and enhance environmental and agricultural resources, including working
landscapes, natural lands, recreation lands, and other open spaces.

47
• To encourage efficient development patterns by ensuring that new infrastructure supports development that uses land efficiently, is built adjacent to existing developed areas, is in an area planned for growth, is served by adequate transportation and other essential utilities and services, and minimizes ongoing costs to taxpayers.
In proposing an implementation strategy for the state planning principles, the 2003 update to the EGPR proposed fundamental changes in the way that state government conducts itself. The 2003 EGPR Update made a distinction between things that should continue to grow or develop—such as jobs, productivity, wages, capital, savings, profits, information, healthcare, education, knowledge, environmental quality and social equity—and things that should not—such as pollution, waste, poverty, and dependence on non-renewable resources. Unfortunately, the policy recommendations in the 2003 EGPR Update were not specifically pursued. Further, the state failed to meet the deadline for providing an update in November of 2007. Another important state planning document is the Five-Year Infrastructure Plan (Infrastructure Plan), which is required to be updated each year and submitted to the Legislature at the same time the Governor submits his/her proposed budget. The Infrastructure Plan documents the state's overall need for new, as well as the rehabilitation and expansion of existing, infrastructure. The Infrastructure Plan must be sufficiently detailed to provide a clear understanding of the type and amount of infrastructure proposed to be funded and the state programmatic objectives that will be achieved by this funding. Among other requirements, the Infrastructure Plan must also be consistent with the state planning priorities and put forth a specific funding proposal to meet the state's current and future infrastructure needs. Submittal of the annual update to the Infrastructure Plan has been spotty with only two issued, one in 2004 and 2008. Submittal of the annual budget to the Legislature is also supposed to be accompanied by the Governor's annual Economic Report, which reviews the state's current economic development conditions, forecasts trends, and identifies policies and actions that promote growth in employment, productivity, income, and purchasing power of Californians. In conjunction with the Economic Report, the Governor is required to outline issues and make recommendations to increase employment and investment in the state. No formal Economic Report has been submitted to the Legislature since 2000, although a statistical abstract was prepared in 2006. While Governor Brown's proposed state budget included an assessment of the current economy and recommendations for the realignment of some of the state's economic development activities, it did not include a comprehensive list of policies or recommended actions that would lead to an increase in jobs and investment in California. Following the enactment of the budget, the Governor did propose a number of economic development initiatives and in his signing and veto messages he expressed his intent to provide a more comprehensive economic development package in January to coincide with the release of his proposed 2012-13 budget. Given the importance of TFI to the California economy, existing law also requires the development of a state International Trade and Investment Strategy (ITI Strategy). Required as a pre-condition for carrying out and state funded trade activities, the ITI Strategy is prepared every

48
five years based on current global, national, state and regional economic research. The ITI Strategy is also required to have a public vetting with the Legislature to ensure the inclusion of jointly agreed upon goals and measurable objectives. The current ITI Strategy was finalized in August 2008 and the next strategy is due in August 2013. Existing law also require the development of a Goods Movement Action Plan (GMAP). The purpose of the GMAP is to improve and expand California's goods movement industry and infrastructure in a manner which will generate jobs, increase mobility, reduce traffic congestion, improve air quality, protect public health, enhance port safety, and improve people's quality of life. The GMAP work done to date takes a very macro look at the goods movement industry currently serving California business, and makes recommendations for projects on California's highway, rail, and air transport goods movement networks. It does not, however, link to the other planning documents. It also does not make recommendations at a sufficiently refined level to address the needs of businesses with fewer than 99 employees (representing 97% of all businesses in the state) nor specific industry sectors. In addition to the assessment documents discussed above, the state had, until August 2011, a requirement to have a two-year state Economic Development Strategic Plan, which sets state economic goals and recommendations necessary to improve the business climate and economy of the state. The Plan was to also evaluate the adequacy of state and local infrastructure, the effectiveness of the state's economic development programs and identify strategies to foster job growth and economic development covering all state agencies, offices, boards, and commissions that have economic development responsibilities. The timely and regular update of the state Economic Development Strategic Plan was also designed to allow the Administration and Legislature to monitor the effectiveness of state programs and services on an ongoing basis. The state Economic Development Strategic Plan was last prepared in 2002 and its statutory mandate was eliminated as part of the 2011-12 budget actions. Taken together, these six assessment and strategy requirements are designed to form the foundation for the blueprint of the state's short-, middle-, and long-term economic success. The EGPR sets the overall long-term framework in which individual departments and agencies can develop more detailed plans, including the state transportation and state housing plans. The Infrastructure Plan allows the state to keep track of its infrastructure needs and set a rational infrastructure development agenda that supports the long-term economic and population growth assessments outlined in the EGPR and the state planning priorities. The development of the state Economic Development Strategic Plan is built on the information and policies provided in the EGPR, the Infrastructure Plan, the ITI Strategy and Economic Report. Lack of a Game Plan While some of this information is contained in a variety of state reports, it is unfortunate that California does not have a current and complete set of these economic assessments to help guide state actions in support of regional and local economic development strategies. As discussed earlier in the paper, all of the border regions have adopted and continue to implement economic development strategies, as well as participate in key international trade and foreign initiatives including foreign trade zones, enterprise zones, Team California and iHUBs. It is unlikely that

49
the state is best leveraging its resources and contributing to the state's overall economic good when it lacks a basic measuring stick for its actions. Hearing Discussion Points Among the key challenges to be discussed at the hearing relating to this section are structural inadequacies of the state's international trade program, as well as its current planning and financing activities. Witnesses have been asked to provide their own assessments, highlight successful models and recommend practical solutions for guiding the state's actions in the post-recession economy. Related recommendations, as summarized in Section V, may include: 1. Call on California Governor's Office of Business and Economic Development to allow, if
requested, the iHUBs in the San Diego and Imperial County form an official partnership with the iHUB in Coachella Valley, similar to the relationship between the Sacramento and Northern California iHUBs.
2. Call on the California Governor's Office of Business and Economic Development to begin
the process for adopting an updated ITI Strategy that includes the discussion of the unique needs of the Mega-Region including issues relating to infrastructure, access to capital, workforce development, bi-national entrepreneurship and regulatory reforms that support business start-ups, growth and manufacturing.
3. Request a modification to the make-up of Team California to include an associate position
for the Assembly and Senate policy committee chairs. 4. Facilitate the development of a MOU between the U.S. Small Business Administration, the
State of California, financial intermediaries and private lenders, including micro-lenders that focus on export finance and meeting the new national goal of doubling exports within the next five years.
5. Direct JEDE staff to undertake a survey of how other states and regional economic
development entities establish their official presence in foreign markets. Include within the final report recommendations on the potential role of a foreign trade office and/or special state relationship.
6. Call on the Governor to meet statutory mandates to update and guide state funding based on
comprehensive economic growth and infrastructure development plans. 7. Pass AB 1137 (V. Manuel Pérez), which would require ongoing local and regional
consultation on trade and foreign investment activities, codifies the EB5 program and updates the foreign trade zone program.
8. Facilitate economic development and community empowerment discussions among rural stakeholders in anticipation of the 2012 Farm Bill. JEDE, working in partnership with the

50
California Legislative Rural Caucus, can encourage rural stakeholders to identify how they can be supported in developing clean energy generation and more economically diversified economies.
9. Pass legislation, AB 1409 (JEDE), which would require the state Goods Movement Plan to
be reflected in the international trade and foreign investment strategy, as well as being integrated in the state's short and long-term infrastructure and economic development plans.
51
Section V – Recommendations for Further Actions It is not envisioned that a single report, initiative or hearing will resolve long standing community and economic development challenges. This document and the November 10, 2011 hearing will, instead, serve as a "real world" example of how policies and actions taken in Sacramento and Washington D.C. may impact rural communities, historically underserved communities and communities, within and surrounding the California and Baja Mega-Region. The hearing will additionally offer an opportunity to identify potential actions that can strengthen existing networks and contribute to the resolution of key economic challenges within the Imperial and Coachella Valleys, as well as the state as a whole. The following recommendations are provided for the consideration of the Members, witnesses and the public: Recommendations Designed to Support the Economic Development Efforts of the Border Region and Related Economic Corridors 1. Introduce legislation to authorize the creation of a bi-national economic development
authority for the bi-national mega-region and related areas. Membership may include representation by Imperial County, the Coachella Valley, San Diego County and Baja California.
2. Develop an economic development focused MOU between the elected representatives in the
Coachella Valley, Imperial Valley, San Diego City and/or County, and the State of Baja. Initially, the agreement would focus on collaborative marketing approaches and could later support larger regional solutions related to infrastructure.
3. Engage the San Diego and Imperial Valley Economic Development Corporations on how
other communities in the economic corridors could meaningfully participate in the CaliBaja Bi-National Mega Region initiative.
4. Call on California Governor's Office of Business and Economic Development to allow, if
requested, the iHUBs in the San Diego and Imperial County to form an official partnership with the iHUB in Coachella Valley, similar to the relationship between the Sacramento and Northern California iHUBs.
5. Engage tribal governments in identifying issues and prioritizing possible collaborative
actions that would enhance the economic competitiveness of the mega-region and surrounding communities.
6. Engage the California Governor's Office of Business and Economic Development, the
Conference of Border Governors and the Border Legislative Conference on how to work more effectively in achieving key competitiveness objectives. As a first step find out more about the following initiatives:

52
• Development of Secure Manufacturing Zones.
• Development of a coordinated network of “inland ports” along the main logistics corridors.
7. Call on President Barack Obama to designate a point person to facilitate the permitting
process among federal agencies for ports of entry and other issues related to goods movement.
8. Engage education, business and civic leaders to discuss opportunities for complementary
educational curricula and internships related to emerging sectors in the bi-national economic corridors.
9. Call on the California Department of Transportation to begin facilitation of the update to the
California-Baja Border Master Plan. Encourage and actively support outreach to the economic development community within the mega-region and along established economic corridors.
10. Advocate with President Obama and the U.S. Congress for additional capitalization of the
North American Development Bank, as well as providing more flexibility under the definition of eligible geographic area by incorporating areas within clearly defined economic corridors.
11. Authorize a new and dedicated funding source for local economic development entities
within the U.S. side of the mega-region and its economic corridors.
Recommendations Designed to Enhance the State's Overall Trade Program 12. Call on the California Governor's Office of Business and Economic Development to begin
the process for adopting an updated ITI Strategy that includes the discussion of the unique needs of the Mega-Region including issues relating to infrastructure, access to capital, workforce development, bi-national entrepreneurship and regulatory reforms that support business start-ups, growth and manufacturing.
13. Request a modification to the make-up of Team California to include an associate position
for the Assembly and Senate policy committee chairs. 14. Call on Governor Jerry Brown to appoint the statutorily mandated position of "State Point of
Contact" for the U.S. Trade Representative. 15. Facilitate the development of a MOU between the U.S. Small Business Administration, the
State of California, financial intermediaries and private lenders, including micro-lenders, that focuses on export finance and meeting the new national goal of doubling exports within the next five years.

53
16. Direct JEDE staff to undertake a survey of how other states and regional economic development entities establish their official presence in foreign markets. Include within the final report recommendations on the potential role of a foreign trade office and/or special state relationship.
17. Call on the Governor to meet statutory mandates to update and guide state funding based on
comprehensive economic growth and infrastructure development plans. 18. Facilitate economic development and community empowerment discussions among rural
stakeholders in anticipation of the 2012 Farm Bill. JEDE, working in partnership with the California Legislative Rural Caucus, can encourage rural stakeholders to identify how they can be supported in developing clean energy generation and more economically diversified economies.
19. Become a partner to and collaborator with the California Financial Opportunities Roundtable
(CalFOR). CalFOR is a joint initiative of the U.S. Department of Agriculture – Rural Development and the Federal Reserve Bank of San Francisco for the purpose of mobilizing capital markets and capturing local private investment potential in rural areas.
20. Pass AB 1137 (V. Manuel Pérez), which would requires ongoing local and regional
consultation on trade and foreign investment activities, codifies the EB5 program and updates the foreign trade zone program.
21. Call for the re-examination and assessment of the impacts of free trade agreements,
preferences and U.S. aid related programs in Central and South American counties to ensure that the desired economic, environmental and social benefits are actually being produced within the targeted country and do not have unmitigated negative impacts on communities in California.
22. Pass legislation, AB 1409 (JEDE), which would requires the state Goods Movement Action
Plan to be reflected in the international trade and foreign investment strategy, as well as be integrated in the state's short and long-term infrastructure and economic development plans.
At the close of the hearing, Members may wish to comment on, make changes to, and prioritize the recommendations on this list. Follow-up actions could be addressed in legislation as early as January 2012, with oversight hearings in February 2012.

54

55
California's Economic Recovery: Charting a New Path Forward by Leveraging
International Trade
Appendices
Appendix A – Agenda for the November 10, 2011 hearing Appendix B – Fast Facts on the California Economy Appendix C – Fast Facts on California's Trade Economy Appendix D – Fast Facts about California-Mexico Trade Relations Appendix E – Fast Facts on the Imperial County Economy
Appendix F – Selection of Economic Strategies related to the Imperial and Coachella Valleys Appendix G – Summary of Legislation Appendix H – State and Federal Resource Programs
Appendix I – Foreign Trade Zones located in California Bibliography End Notes

56

57
Appendix A
Economic Recovery in the Border Region: Leveraging Trade to Chart a New Path Forward
Thursday, November 10, 2011, from 9:00 a.m. to Noon
Calexico City Hall, Council Chamber
PRELIMINARY AGENDA
The Border Region faces many challenges in moving toward economic recovery and obtaining greater prosperity in the coming decade. Among other strategies, the region is looking to leverage international trade and foreign investment to advance its economic growth. The presentations during this hearing will include an overview of the current regional economy and identification of key actions for moving forward. I. Welcome, Introductions and Opening Statements
Chairman Pérez and Members of the Assembly Committee on Jobs, Economic Development, and the Economy will give opening statements and frame the key issues to be examined during the hearing. The Luis J. Castro, Mayor of Calexico and the Francisco Pérez Tejada Padilla, Mayor of Mexicali will also provide opening remarks.
II. Achieving Regional Economic Recovery and Expansion through Trade and Foreign Investment
• Tim Kelley, Imperial Valley Economic Development Corporation • Tom Flavin, Coachella Valley Economic Partnership • Tom Freeman, Riverside County Office of Foreign Affairs • Linsey Dale, Imperial County Farm Bureau The Imperial and Coachella Valleys have regularly experienced unemployment rates double that of the statewide average. The effects of the recession have been especially harsh for this region. In responding to these challenges, several economic strategies have been implemented to encouraging local business development, attracting private investment, providing for region's workforce needs, leveraging the region’s cleantech advantages and expanding trade and investment opportunities. During this panel, Members will hear specific examples of how state I-Hubs, a federal renewable energy pilot project, and other innovative initiatives are being used or could be used to support the economic recovery and success of the region.
III. Leveraging Economic and Infrastructure Advantages in the Mega-Region
• Luis E. Ramírez Thomas, Ramírez Consulting • Adam Wasserman, Global Logistics Development Partners

58
• José Eugenio Lagarde Amaya, Industrial Development Commission of Mexicali • Victor Castillo, Center for International Trade and Development
California border communities compete with other localities both within the U.S. and in Mexico for attracting and growing businesses. Presentations in this panel will focus on strategies used by competing communities and how improvements in infrastructure and economic development activities may help to reposition and strengthen the mega-region's global competitiveness.
IV. Public Comment
Anyone interested in addressing the Committee may sign up to speak during the public comment period. A sign-up sheet is located at the back of the hearing room.
V. Summation of Key Concepts and Closing Remarks
Assembly Members will highlight key issues and provide recommendations on further actions by the Assembly Committee on Jobs, Economic Development, and the Economy.

59
Appendix B
Fast Facts on the California Economy (reflecting September 2011 data) California’s economy is one of the ten largest in the world with a 2010 gross state product (GDP) of $1.9 trillion.i In September the California unemployment rate decreased to 11.9% (seasonally adjusted) representing an estimated 2.5 million unemployed workers in California. U.S. unemployment remained the same 9.1% down 0.0 percentage points from August. ii California's Global Economy • In 2010, California's total GDP was $1.9 trillion to the U.S.’s $14.5 trillion.iii • In 2010, California's GDP ranked 9th in the world. The 2010 worldwide GDP rank as follows:
United States ($14.5 trillion), China ($5.87 trillion), Japan ($5.49 trillion), Germany ($3.30 trillion), France ($2.56 trillion), United Kingdom ($2.25 trillion), Brazil ($2.09 trillion), Italy ($2.05 trillion), India ($1.73 trillion), Canada ($1.34 trillion) the Russian Federation ($1.48 trillion), and Spain ($1.41 trillion).iv
• U.S. foreclosures show a total of 3,825,637 foreclosures were filed nationally and a total of 546,669 on California properties, a decrease of nearly 14% from 2009 were reported in the RealtyTrac 2010 Year End Report. As of September 2011, California has 271,874 foreclosure properties.v
Job Market • In September 2011 there were 14,098,500 jobs in California’s nonfarm industries, as compared
to14,057,200 in August 2011. California nonfarm payrolls increased 11,800 following a revised 21,100 gain in August and a 4.600 job loss in July.vi UCLA’s Andersen forecast calls for economic growth to gradually rebound in mid-2012 with the economy advancing at modes 2.5 -3% rate.vii
• Sectors with increased employment in September were professional and business services (13,300); construction (6,900); leisure and hospitality (4,700); trade, transportation and utilities (4,600); and other services (600).viii
• Sectors that lost jobs in August were government (7,000); manufacturing (4,700); educational and health services (3,500); information (2,200); financial activities (800); and mining and logging (100).ix
• In September 2011, California nonfarm businesses were up 11,800 jobs (0.1%) jobs from the prior month, as compared to an increased 250,600 (1.8%) since September 2010.x
• From September 2010 to September 2011, nonfarm jobs rose in nine sectors of the 11 major industry sectors: information (5.0%); construction (4.2%); professional and business services (3.8%); leisure and hospitality (2.7%); educational and health services (2.5%); mining and logging (1.8%); manufacturing (1.3%); trade, transportation and utilities (1.2%); and government (0.1%).xi
Unemployment (September 2011) These numbers are not seasonally adjusted as compared to the seasonally adjusted unemployment number above. The monthly unemployment numbers by their nature are not seasonally adjusted)
• Statewide: 11.9% (Down from 12.1% in 2010)

60
• Alameda County: 10.2% (Down from 11.3% in 2010) • Colusa County: 15.0% (Down from 15.4% in 2010) • Contra Costa: 10.1% (Down from 11.0% in 2010) • Fresno County:14.9% (Down from 15.0% in 2010) • Imperial County: 29.6% (Down from 31.8% in 2010) • Los Angeles County: 12.2% (Down from 12.7 in 2010) • Riverside County: 14.0 % (Down from 15.0% in 2010) • Sacramento County: 11.9 % (Down from 12.8% in 2010) • Santa Clara County: 9.6% (Down from 10.9% in 2010xii California Trade and Foreign Investment Activity • California's export shipments of merchandise totaled $143 billion in 2010, up from a total of
$120 billion in 2009.xiii If the value of services were added to the export of products, it is likely that California would rank first in total exports among the 50 states.xiv
• Exports supported roughly 616,500 California jobs in 2010.xv • In 2010, the state's leading export category was computers and electronic products, accounting
for $43.1 billion of California's total merchandise exports. Other top merchandise exports include machinery manufacturers ($14.5 billion), transportation equipment ($13 billion), chemical manufacturers ($11.6 billion), and miscellaneous manufacturers ($11.5 billion). xvi
• Exports from California accounted for 11.2% of total U.S. exports in 2010.xvii • Small and medium-sized firms generated more than two-fifths (44%) of California's total
exports of merchandise in 2008, well above the 31% export share nationally.xviii • California's top four export markets in 2010 were Mexico ($21.0 billion), Canada ($16.2
billion), China ($12.5 billion), and Japan ($12.2 billion) respectively.xix • For the second quarter of 2011, state exports to China ($3.7 billion) exceeded those to Japan
($3.4 billion) for the first time, though exports to Japan grew from the same quarter last year ($3 billion in 2010 to $3.7 billion in 2011.) xx
Foreign Investment & U.S. Based Subsidiaries • California has the highest rate of employment by U.S. subsidiaries of foreign companies.xxi • In 2009, insourcing companies employed 594,100 Californians and accounted for 4% of the
state's total private sector employment.xxii More than 32% of all subsidiaries in California are in the manufacturing industry and account for 193,300 jobs.xxiii
Energy Market • California produced 13% of the natural gas in 2008xxiv, 38% of the crude oil in 2010 xxv, and
68% of the electricity it consumes in 2009 (best available data)xxvi. The remaining electricity and natural gas were purchased from Canada, the Pacific Northwest, the Rocky Mountain States and the Southwest. Remaining crude oil was imported from Alaska and abroad.xxvii
• In 2010, 53.4% of California’s electricity came from burning natural gas, 15.4 % from nuclear fission, 14.6% was generated in large hydroelectric dams, 14.6% from renewable sources, and 1.7% came from coal.xxviii
• In 2007 California’s renewable energy came from geothermal (4.5% of total electricity)xxix, wind (2.3%)xxx, waste-to-energy and biomass (2.1%)xxxi, and solar (0.22%)xxxii sources.

61
• The West Coast price for Alaskan North Slope crude oil dropped to $102.24 per barrel on October 3, but has since increased to $110.20 per barrel as of October 12, 2011. This is $22.84 higher per barrel than in October of 2010.xxxiii
• Reformulated gasoline production in California for the week ending October 7 decreased 8% from the previous week to 6.2 million barrels, remaining within the 5-year range and 1.5% higher than a year ago. Inventories for California reformulated gasoline increased 2.2% but remains in the middle of the five-year range.xxxiv
California's Innovation Economy • California ranks 4th among the 50 states in science and technology. Other top states include
Massachusetts (1st), Maryland (2nd), Colorado (3rd), Utah (5th), Washington (6th), and New Hampshire (7th). The Milken Science and Technology index ranks states based on research and development dollars, number of patents issued, venture capital investment, and business starts.xxxv
• California ranked 1st among all 50 states in patents issued in 2010 with 30,080 patents granted. Other top performing states include New York (8,095 patents), Texas (8,027 patents), Washington (5,810 patents), and Massachusetts (5,261 patents).xxxvi
• California ranks 3rd in start-ups and 1st in new branches in high-tech manufacturing. Other top ranking states include Florida, Texas, and Washington for start-ups and Texas, Florida, and Washington for new branches.xxxvii
• The Milken Institute ranks the University of California System first in technology transfer and commercialization among all U.S. universities. The California Institute of Technology and Stanford University are ranked among the top ten. xxxviii

62

63
Appendix C
Fast Facts on California's Trade Economy
California is one of the ten largest economies in the world with a 2010 gross state product (GDP) of $1.9 trillion.xxxix Exports out of California were valued at $143 billion in 2010 and represented 11.2% of total US exports.xl Imports into California were valued at $327 billion in 2010 and represented 17.1% of total US imports.xli As a state, California ranks second, behind Texas, in value of two way trade.xlii
California and World Markets
• California's largest export market is Mexico, where the value of exports totaled $20.9 billion in 2010. After Mexico, California's top export markets in 2010 were: Canada ($16.2 billion), China ($12.5 billion), Japan ($12.2 billion), and South Korea ($8.0 billion).xliii
• California exports are up from 2009 ($120 billion) but down from 2008 ($144 billion).xliv
• California's top five exports in 2010 were: Computer & Electronic Products ($43 billion); Machinery, Except Electrical ($14 billion); Transportation Equipment ($12 billion); Chemicals ($11 billion); and Miscellaneous Manufactured Commodities ($11 billion).xlv
• China is the largest source of imports into California; the 2010 value of Chinese imports was $133 billion. China is followed by Japan ($41 billion); Mexico ($33 billion); Canada ($23 billion); and South Korea ($12 billion).xlvi
• California's top five imports in 2010 were: Computer & Electronic Products ($107 billion); Transportation Equipment ($49 billion); Oil & Gas ($21 billion); Miscellaneous Manufactured Commodities ($19 billion); and Apparel & Accessories ($17 billion).xlvii
• As global demand recovered from the financial crisis, increased trade volumes in 2010 compensated for nearly all losses in 2009 according to the Kyser Center for Economic Research.xlviii
Trade and Jobs
• A total of 59,998 companies exported goods from California in 2008. 96% of those companies (57,461) were small and medium-sized enterprises with fewer than 500 employees.xlix
• Exports supported 22.9% of all California manufacturing jobs in 2009.l
• Small and medium-sized companies generated 44% of California's total
Small, 2%
Medium,
6%
Large, 92%
Percent of Exporters by Firm Size, 2009

64
Small,
24%
Medium,
9%
Large,
67%
Percent of the Value of Exports by
Firm Size, 2009
exports of merchandise in 2008, the seventh highest percentage among the states.li
• Small and medium-sized companies represent 32.8% of the export value of U.S. goods exports.lii
• Less than one percent of American companies export. According to the International Trade Administration (ITA), this percentage is significantly lower than all other developed countries. Of the companies that do export, 58% export to only one country.liii
Trade Partners and Free Trade Agreements
• Countries that have signed a Free Trade Agreement (FTA) with the U.S. make up 9% of the World GDP and represent 41% of U.S. exports. Exports to FTA countries grew at a faster rate (23% annually) than exports to the rest of the world (20%) from 2009 to 2010.liv
• The U.S. has active FTAs with 20 countries; Australia, Bahrain, Chile, Canada, Colombia, Costa Rica, Dominican Republic, El Salvador, Guatemala, Honduras, Israel, Jordan, Korea, Mexico, Morocco, Nicaragua, Oman, Panama, Peru and Singapore. lv
• South Korea is California's fifth largest trading partner, and a major purchaser of Computers and Electronic Products; Machinery; and Transportation equipment, California's top three exports. The South Korea FTA (KORUS) eliminates tariffs in these industries potentially providing a competitive boost to California exports.lvi At the same time, however, the removal of protective barriers under KORUS will expose domestic producers and manufacturers to South Korean products. The Economic Policy Institute reported that rising Korean imports could displace up to 159,000 U.S. jobs by 2015.lvii
• While exports to Japan have grown over the past two years (California's 4 largest trading partner), they are expected to drop in 2011 in the wake of the tsunami and nuclear crisis. Starting in late 2011 and continuing through 2012, however, exports are expected to pick up as reconstruction gets underway.lviii
California's Trade Infrastructure
• The President's National Export Initiative identifies improvements to U.S. transportation and supply chain infrastructure as critical to enabling exporters to get their good to ports quickly and inexpensively.lix
• The Port of Los Angeles continued to hold the top rank in terms of two-way trade in 2010 (valued at $237 billion). It is followed by JFK International Airport ($162 billion) and the port of Chicago ($135 billion). Data on California’s other major ports are as follows: Long Beach ($89 billion, ranked 9th); LAX ($77 billion, ranked 12th); San Francisco International Airport ($50 billion, ranked 18th)lx; Port of Oakland ($40 billion, ranked 25th); Otay Mesa

65
Station ($31 billion);lxi and Calexico-East ($10 billion). In terms of container activity the Los Angeles-Long Beach container port ranked 6th globally, behind Shanghai, Singapore, Hong Kong, Shenzhen and Busan.lxii
• Southern California’s share of West Coast tonnage rose from 58.8% to 59.3% in 2010. Northern California’s share decreased over the same period from 11.1% to 10.2%.lxiii
• Border crossing delays between Mexico and the U.S along the Imperial County – Baja California border accounted for an estimated output loss of $1.4 billion and 11,600 lost jobs nationally due to reduced output in 2007. In California losses were estimated at $436 million and 5,639 jobs.lxiv
• If border delays continue to grow, economic losses on both sides of the border will more than double by 2016. The output loss in Imperial Valley – Mexicali region will reach $1.52 billion and result in a loss of nearly 17,000 jobs according to HDR|HLB Decision Economics.lxv
• U.S. firms with significant business passing through the three Imperial Valley ports of entry report that their logistics-supply chain is highly time sensitive. Long wait times at border crossings result in delays in receiving intermediary goods and ultimately lead to problems in the manufacturing chain.lxvi
Growing International and Domestic Competition
• California ports face growing competition from Canadian and Mexican port expansion projects, as well as from East Coast and Gulf ports once the planned expansion of the Panama Canal is completed in 2014.
• Vancouver, Canada’s largest container port, has increased container throughput at an annual rate of 12% since 1980, faster than the growth rate of any U.S. West Coast port. Container traffic in Vancouver is expected to triple by 2020, and Vancouver hopes to increase its share of West Coast trade from 8.5% in 2008 to 12% in 2020.lxvii
• Mexico has several port expansion projects underway, including the flagship project at Punta Colonet. However, the Mexican port infrastructure sector has suffered from tight credit and the 2009 contraction in global trade. lxviii
• As of June 2009, at least four port expansions, including Punta Colonet, had to be cancelled or deferred by the Mexican government due to lack of private sector interest. Demand for Mexican port facilities has also shrunk since the start of the economic down turn.lxix
• Port authorities on the east coast of the United States have planned more than $10 billion in port development projects in preparation for opening of the Panama Canal expansion, according to the Port of New Orleans. The five largest projects are planned by Houston ($4.6 billion); Tampa ($1.6 billion); Charleston ($857 million); the Virginia Port Authority ($701 million); and Port Everglades ($572 million).lxx

66
Foreign Investment in California
• U.S. majority-owned affiliates of foreign corporations owned $11.7 trillion in U.S. assets and had $3.5 trillion in annual sales in 2008. U.S. affiliates of foreign multinationals contributed 11.3% of total U.S. private investment and 14.3% of total private R&D.lxxi
• U.S. affiliates of multinational companies are typically high-productivity firms that are major private sector contributors to national efforts to innovate and build, according to the President’s Council on Economic Advisors.lxxii
• Foreign controlled companies employed 594,100 Californians in 2008, more than any other state. Foreign investment was responsible for 4.6% of the state’s total private-industry employment that year.lxxiii
Ye
ar
19
70
19
72
19
74
19
76
19
78
19
80
19
82
19
84
19
86
19
88
19
90
19
92
19
94
19
96
19
98
20
00
20
02
20
04
20
06
20
08
20
10
-200000
-180000
-160000
-140000
-120000
-100000
-80000
-60000
-40000
-20000
0
Mil
lio
ns
of
Do
lla
rs
California Balance of Trade, 1970-2010
200.0
250.0
300.0
350.0
400.0
450.0
500.0
550.0
600.0
650.0
2002 2003 2004 2005 2006
Pe
op
le E
mp
loy
ed
(th
ou
san
ds)
Employment by Foreign Owned Nonbank U.S.
Affiliates in the top five States, 2002-2006California
New York
Texas
Pennsylvania
Illinois

67
• In terms of employment, Japan was the greatest source of FDI in 2008, employing 118,900 Californians. Japan was followed by the UK (84,100), France (61,000), Germany (60,700), and Switzerland (57,500).lxxiv
• While California remains the largest recipient of FDI in the United States, faster FDI growth is occurring elsewhere, according to the Kyser Center for Economic Research. From 1999 to 2005 the level of gross property, plant, and equipment of all non-bank affiliates in California grew by 10.7%, compared to 20.6% nationally, 95.9% in Kentucky, 50.0% in Colorado, 46.2% in Massachusetts, and 26.7% in New York.lxxv

68
Appendix D
Fast Facts about California-Mexico Trade Relations
Mexico is the largest market for exports of California-made goods and has been California’s main trading partner since 1999. lxxvi California ranks third (behind Texas and Michigan, respectively) among U.S. importer states of Mexican goods, accounting for almost 12% of all Mexican imports.lxxvii California and Mexico Demographics
• According to the 2010 U.S. Census, California's population is 37.3 million as compared to Mexico's population of 113 million with an estimated annual population growth of 1.1%. lxxviii
• If Los Angeles were in Mexico, its five million Mexican residents would make it the fourth biggest city in the country (after Mexico City, Guadalajara and Monterey).lxxix
• 40% of the population in Southern California, between Los Angeles and the Mexican border, speak Spanish. lxxx
• California is one fourth the size of Mexico with 11 million California residents being of Mexican descent.lxxxi
California – Mexico Economies
• In 2010, California's total gross state product was $1.9 trillion. lxxxii Mexico's gross domestic product in 2010 was $1.04 trillion. lxxxiii
• Mexican exports to the U.S. account for one fourth of Mexico's gross domestic product. As a result, Mexico's economy is strongly linked to the U.S. business cycle. lxxxiv
• The trade relationship between Mexico and California generates over $20.9 billion per year for California. lxxxv
Mexican Trade Policy and Free Trade Agreements
• The 17 countries that have a free trade agreement (FTA) in force with the U.S. make up 9% of the World GDP and represents 41% of U.S. exports. Exports to FTA countries grew at a faster rate (23% annually) than exports to the rest of the world (25%) from 2009 to 2010. lxxxvi
• Mexico is the country with the largest network of FTAs in the world, including 44 countries, on three different continents, which provide preferential access to a potential market of more than 113 million consumers. lxxxvii Currently, more than 90% of Mexico's trade occurs under free trade agreements.
• Mexican trade with the U.S. and Canada has tripled since the implementation of NAFTA in 1994. lxxxviii
Job Creation
• Export-supported jobs account for an estimated 5.2% of California's total private-sector employment. lxxxix

69
• Nearly one quarter (23%) of all California manufacturing workers are dependent on exports for their employment. xc
• Approximately 177,000 California jobs (17% of all export-supported jobs in California) are related to the commercial relationship with Mexico. More than half of these jobs are a result of export growth under NAFTA. xci
• Commerce, tourism, and foreign direct investment from Mexico support more than 200,000 jobs in California (1.5% of the total number of payroll jobs in California). xcii
California Exports to Mexico
• California exported $21 billion worth of goods to Mexico in 2010, accounting for 15% of California’s overall goods exports. xciii
• California is the second largest exporter to Mexico of the 50 U.S. states (behind Texas). xciv
• Computers and electronic products have been California's highest single export to Mexico since 2000. However, as Mexico's economy diversifies, exports of machinery and transportation equipment have grown exponentially. xcv
Goods Movement between California and Mexico
• California has four major international border crossings supporting the movement of both persons and goods: San Ysidro, Otay Mesa, Tecate, and Calexico. Of these, San Ysidro handles the lightest volume, while Otay Mesa and Calexico accommodate the largest volume. Otay Mesa is the largest border crossing in California, ranking sixth in the nation.
• In 2010, California gateways with Mexico moved $46.9 billion in merchandise.
• Most of the California-Mexico trade is two-way within the same commodity class, suggesting extensive production sharing. Components made in California are assembled or further processed in Mexico, and shipped back to California. Top commodities for this type of trade include: machinery, vehicles, instruments, and electronics and electronic equipment. xcvi
2010 Exports from California to Mexico by Industry Sector 01.19.2009
Product Value ($) Percent
Computers & Electronic Prod. $6,463,923,401 30.9 %
Transportation Equipment 1,793,428,398 8.6 %
Machinery, Except Equipment $1,612,029,694 7.7 %
chemicals $1,229,644,680 6.1 %
All Others $9,849,948,319 47.0 %
Grand Total $20,948,974,492 100 %
30.9
8.6
7.76.1
47
Source: U.S. Department of Commerce: International Trade Administration

70
• Border crossing delays between Mexico and the U.S. along the Imperial County – Baja California border accounted for an estimated output loss of $1.4 billion and 11,600 lost jobs nationally due to reduced output in 2007. In California losses were estimated at $436 million and 5,639 jobs. xcvii
• Both U.S. and Mexican firms with significant business passing through the three Imperial Valley ports of entry report that their logistics-supply chain is highly time sensitive. Long wait times at border crossings result in delays in receiving intermediary goods and ultimately lead in to problems in the manufacturing value chain. xcviii

71
Appendix E
Fact Facts on the Imperial County Economy
Imperial County is located in the southeast corner of California, east of San Diego County and south of Riverside County. The Colorado River forms the eastern boundary of Imperial and the Arizona-California Border, and the southern border is shared with Mexico.xcix The region spans 4,174.73 square miles.c El Centro (population 37,835), Calexico (population 27,109), and Brawley (population 22,052) are the county's most populated cities.ci Demographics
• The total population of Imperial County in 2010 was 174,528.cii
• There has been a 22.6% population change in Imperial County from 2000-2010. In comparison, California's population changed 10% during the same time period.ciii
• Foreign-born residents make up 29.6% of the population; 38.8% of those residents are naturalized U.S. citizens and 61.2% do not have U.S. citizen status. civ
• Residents of Hispanic or Latino origin comprise 80.4% of the population, 13.7% are Caucasian, 2.9% are African American, 0.9% are American Indian and Alaska Native, and 1.3% are Asian. cv
• Of residents over 25 years old, 21.1% of the population have a high school degree, 10.2% have a Bachelor's degree, and 4.6% have a graduate or professional degree.cvi
• Residents living in a family household make up 79.7% of the population. The average household size is 3.34 occupants, and the average family size is 3.76 people. cvii
• The median household income is $37,946 per yearcviii and 36.9% of the population lives on a household income of less than $25,000 per year. cix
• There are 35,368 residents (22.8% of population) living in poverty, including 29.4% of the population under the age of 18. cx
Employment
• As of May 2011, the labor force of Imperial County is 75,000; 54,200 are employed and 20,700 are unemployed. The county unemployment rate is 27.7%,cxi the highest in California.cxii
• At the peak of the recession (2008-2009), employment took a sharp decline and 1,300 jobs were lost.cxiii

72
• Occupations with the fastest job growth are Mobile Equipment Mechanics (projected 85.7% job growth between 2008-2018); Home Health Aides Mechanics (projected 46.7% job growth); and Purchasing Agents (projected 33.3% job growth). cxiv
• The principal labor markets of 2010 were farming (11,500 employed); trade, transportation and utilities (10,200 employed); and retail trade (6,700 employed). cxv
• 44,600 of those employed in Imperial County are employed by a nonfarm industry.cxvi
• 16.5% of businesses are Hispanic-owned (2007). cxvii
Industry • There are six principal business sectors in Imperial County. They are Manufacturing (3,934
employees); Food Manufacturing (1,512 employees); Agriculture, Forestry, Fishing, & Hunting (1,475 employees); Support Activities for Agriculture and Forestry (1,475 employees); and Support Activities for Crop Production (1,475 employees). cxviii
• Projected economic growth from 2010 to 2015 is 16.7% retail sales growth, 15.1% personal income growth, and 8.6% job growth. cxix
Nonfarm Industry In Imperial County
Imperial County (2008) California (2008) Private nonfarm establishments
2,477 879,025
Private nonfarm employment 33,906 13,742,925 Private nonfarm employment (% change 2000-2008)
33.7% 6.7%
Non-employer Establishments 10,129 2,688,453 cxx Source: http://quickfacts.census.gov/qfd/states/06/06025.html
Real Estate
• There are 49,126 occupied housing units in Imperial County, 55.9% of which are owner-occupied and 44.1% are renter-occupied. cxxi
• 25.1% of owner-occupied housing units without a mortgage spend $250 or less in monthly housing costs.cxxii
• The homeownership rate from 2005-2009 was 56.6% (California's average is 57.9%).cxxiii
• The median price of existing homes sold in January 2011 was $513,460. cxxiv
• Of the population living on less than $20,000 per year, 12% spend 30% or more of their income on housing costs. cxxv

73
Infrastructure
• The major transportation routes in Imperial County are Interstate 8 (traverses Imperial County connecting San Diego to Arizona and beyond serving as an important route for goods, services, and people), State Route 7 (the only north/ south roadway connector to the Calexico East POE, that processed virtually all of the commercial goods movement through the international border), and State Route 78 (traverses Imperial County connecting San Diego to the Arizona border; the only east/ west highway alternative to I-8).cxxvi
• The Colorado River is the only source of water for irrigation and domestic uses.cxxvii
• About one third of Colorado River water that comes to the Imperial Valley ends up in the Salton Sea as drainage water. This drainage water is necessary to ensure that there is a uniform application of water in fields as well as to maintain soil salinity.cxxviii
• The Bureau of Land Management has received 163 applications to build solar and wind projects on 1.6 million acres of federal land in California, almost all of which are planned for the Imperial Valley and the desert region north of the Valley. Untapped geothermal power in Imperial County is capable of powering 2 million homes. cxxix

74
Appendix F
Selection of Economic Strategies Related to the Imperial & Coachella Valleys
This appendix includes a summary of the goals, objectives and recommendations from several economic development strategies for the Imperial and Coachella Valleys. The list of strategies will be added to and modified based on testimony from the November 10, 2011 hearing.
Imperial County Comprehensive Economic Development Strategy 1**
Goals / Objectives
• Promote a balanced yet diversified regional economic base. • Support the development and expansion of infrastructure activities to promote regional
economic development. • Improve the education and skills of the region’s workforce. • Promote and expand tourism in the Imperial Valley. • Promote international and bi-national trade development. • Promote agriculture and other related industries. • Pursue a policy of sustainable development that balances economic development with
preservation of resources.
Summary of Findings
• Work to enhance the region’s quality of life. • Imperial Valley leaders have identified the need for an educated workforce as the single most
important issue in the economic development of the county. • A major challenge in the county is providing for the development and maintenance of an
adequate supply of affordable housing for all segments of the population. Development of affordable housing units is not occurring at a rate to adequately meet the housing needs of the growing population.
• The Calexico East Port of Entry, that opened in December 1996, has intensified economic development activity and been the catalyst to increase the county’s participation in international and regional trade. The area has a strong potential for commercial and industrial development evidenced by the increase in the truck traffic into the county since port of entry’s opening (a 33% increase from 1997 to 2007).
• All 50 states now export to Mexico through the California gateway, and the Southern California border region is becoming a key worldwide manufacturing center and a prime export market for many U.S. and foreign companies.
• Traditionally a strong agriculturally-based economy, industry growth in Imperial County for the near future is expected to come from government, retail services, professional and business services, and education and health services. Government is expected to create half the jobs in the County by 2014.
1) County of Imperial Planning and Development Services Department (2008); www.imperialcounty.net

75
• Industries identified as a good match to the Imperial County assets are: energy generation, food processing, medical and medical support, warehouse/distribution/transportation.
• Customer service academy for all industry sectors was identified as a need. • Health care facilities are available in the larger cities although limited in the areas of neonatal
intensive care and trauma services; services to the more rural areas are provided by small clinics. Two critical public health concerns are tuberculosis (county ranked number one in tuberculosis cases per 100,000 population) and teen pregnancy (in 2005, 56% of county teenagers gave birth).
• Imperial County has the tenth lowest high school dropout rate in the state. The county’s 2006-07 rate was 14% compared to the State rate of 21.5%.
• California High School Exit Exam passing scores in Imperial County are below the State’s passing rate but are continuing to increase and the gap is closing.
Cali Baja Bi-National Mega-Region Global Competitiveness Strategy 2**
Goals / Objectives
• Attract new high-tech industry investments including foreign direct investment. • Retain and expand existing businesses. • Create a brand that differentiates the region from LA and the rest of Southern California. • Targeted industries: Cleantech (alternative and renewable energy), Applied Biotech
(biotechnology, bio-agriculture, medical devices), Specialized Mfg, and Logistics (transportation and warehousing).
• Encourage entrepreneurialism by connecting business interests in San Diego with business opportunities in Imperial.
Summary of Findings – Workforce and Education
• K-12 curriculums in each of the counties are being designed around science, technology, engineering, and math (STEM) including (1) Project Lead the Way, a project-learning approach to teaching fundamentals of math and science underway in 41 schools in eight districts (San Diego and Imperial Counties); and (2) High Tech High: seven public charter schools in San Diego County.
• San Diego County Science Festival and Sally Ride Science Festival offer math and science programs tailored to students and teachers.
• Career pathways for renewable energy technologies exist at Imperial College, Imperial Valley ROP, and three high school districts.
• Eleven universities and research institutions supply critical resources for high-tech industries including: biosciences, engineering, medicine, oceanography, and a variety of research topics.
Summary of Findings – Cross-border Movement and Trade
• The principal infrastructure challenge for the bi-national region is cross border movement.
2) San Diego Regional EDC, Imperial Valley EDC, with the Mega-Region Advisory Board (2009).

76
• Border crossings for legal guest workers, shoppers, tourists and commercial freight often take over two hours. This equates to a $5.3 billion cost to the San Diego and Imperial Counties economies.3
• Smart Border 2010 and Border Master Plan – initiatives to improve secure cross-border movement.
• Freight Gateway Study and the I-15 / I-8 Corridor studies focus on regional freight traffic and improving north-south mobility.
• Initiatives designed to improve border security include:
– Merida Initiative, a counter-trafficking program
– Stimulus money to improve technology and infrastructure, provide more Customs and Border Protection officers (CBP), agents, pilots, and ATF agents
– Project Gun Runner to detect and halt illegal flow of weapons and ammunition.
– Use of U.S. military troops and equipment.
• Local resources encourage and support business (universities, research centers, highly-skilled workforce, venture capital, mfg. base, and incentives i.e. free trade zones, enterprise zones, and maquiladora system).
• Negative perceptions of California’s business-friendly attitude (taxes, permitting, regulations, and anti-development attitudes) negates benefits of incentives. Regions from across the U.S. are targeting Southern California for their business attraction programs.
Summary of Findings – Water and Power
• Growth in agriculture, maquiladoras, and population have increased the pressure on the two main sources of water supply in the region – Sacramento River/San Joaquin River Delta and the Colorado River.
• Imperial County has legally secured and large water rights from the Colorado River. • San Diego County receives 90 percent of its water supply from outside sources. • Imperial Irrigation District (IID) and San Diego County Water Authority (SDCWA) have
established efficiency and conservation programs; and reclamation projects are being studied. • San Diego Gas & Electric estimates a new power plant every five years is needed to keep up
with demand growth. • Alternative power and economic development opportunities include geothermal (Imperial
County), wind (eastern San Diego County), and solar (Imperial County).
Next Steps / Strategy Implementation
• The Cali Baja Bi-National Mega-Region Global Competitiveness Strategy contains specific action steps and identified key partners for each of the following implementation strategies.
• Place brand the mega-region to attract and retain targeted high-tech trade, investment and knowledge workers (media placement, global messaging, cultivate international corporate partnerships, collaborate with local exporting companies).
3) San Diego Association of Governments (2006).

77
• Develop an aggressive and targeted marketing program to attract foreign direct investment to the mega-region (market to four industry sectors, develop mega-region marketing rules of engagement, create materials for collaborative use, create a web portal).
• Create materials and events to educate stakeholders about global issues affecting the region. • Coordinate ongoing efforts to ensure the mega-region has an educated and highly-skilled
workforce (develop K-16 educational standards for tech industries, support efforts to create a biotech and cleantech center, look for outside grants, support work visa reforms, develop model industry training programs).
• Collaborate for a seamless infrastructure throughout the mega-region (actively support the Smart Border 2010 initiative, educate public, seek funding, secure legal rights and funding to build transmission lines)
• Champion the implementation of policies and business incentives to attract and retain high-value businesses (seek funding for business attraction, create one-stop permitting centers, streamline EIR process).
California-Baja Border Master Plan 4**
Cross-border travel at the six land ports of entry (POE) in the California/Baja region has grown over the years and growth is expected to continue because of increasing population and economic activity. Improving the current infrastructure is critical to relieving congestion and facilitating cross-border movement of people and trade. Executives from twenty-four U.S. and Mexico agencies participated in the creation of this Master Plan which prioritizes POE and related transportation projects.
Goals / Objectives
• Increase understanding of POE and transportation planning on each side of the border. • Create a mechanism to prioritize and advance POE and related transportation projects. • Develop criteria for prioritizing mid- and long-term projects. • Establish a process for ongoing communication among local, state, and federal partners.
Summary of Prioritized Projects
• Otay Mesa East-Mesa de Otay II — a proposed new POE to serve both passenger and commercial vehicles; will be located about two miles east of the existing Otay Mesa-Mesa de Otay POE.
• San Ysidro-Puerta Mexico/Virginia Avenue-El Chaparral POE — serves pedestrian and passenger vehicles (not commercial); a rail line crosses at this POE. Redesign of the POE is being coordinated with Mexico to convert the existing southbound vehicle lanes into northbound lands to facilitate traffic into the U.S.
• Calexico-Mexicali POE — serves pedestrian and passenger vehicles; freight rail service operates regularly. To ease congestion, a new facility is proposed to process north and
4) San Diego Association of Governments (SANDAG) (September 2008). Commissioned by the U.S./Mexico Joint Working Committee to the California Department of Transportation (CalTrans) and the Secretariat of Infrastructure and Urban Development of Baja California.

78
southbound passenger vehicles while the existing facility would process pedestrians and buses. Project would expand to 16 passenger vehicle lanes and six pedestrian lanes.
• Otay Mesa-Mesa de Otay POE — serves pedestrian, passenger and commercial vehicles. Proposed project would expand the number of lanes to improve passenger and cargo service and operation efficiencies. Specifics of the project are pending completion of a feasibility study.
• Tecate-Tecate POE — serves pedestrian, passenger, commercial, and rail. Proposed project is to construct a commercial facility at the Tecate, Baja California border station to improve the flow of commercial traffic.
• Calexico East-Mexicali II POE — serves pedestrian, passenger, and commercial vehicles. Proposed project, to improve passenger throughput, would expand the number of passenger lanes at the existing Imperial County facility from eight to 12 vehicle lanes.
• Andrade-Los Algodones POE — serves primarily pedestrian and passenger vehicles; some commercial vehicles. Proposed project would move vehicle lanes to the Arizona border keeping pedestrian lanes in Imperial County. The pedestrian lanes are important to tourism and winter visitors typically cross on foot.
Summary of Recommendations
• Consider the California-Baja California Border Master Plan a framework to prioritize infrastructure projects and facilitate planning and funding of related transportation projects.
• Update the master plan every three to four years; update should be led by Caltrans and Secretaria de Desarrollo Urbano del Estado de Baja California (SIDUE).
Port of San Diego: Charting Our Future; Compass Strategic Plan Fiscal Years 2007-2011**
Goals / Objectives / Action Items
• Stimulate regional economic vitality by (1) promoting and supporting the maritime industries; (2) participating with other organizations to acquire funds for maritime infrastructure; (3) pursue new maritime/logistics business opportunities; (4) improving/expanding cruise ship terminal infrastructure; and (5) enhancing industrial uses.
• Enhance and sustain a dynamic and diverse waterfront by (1) supporting, improving and expanding infrastructure to support business development; and (2) improving and expanding tourism and recreational opportunities.
• Protect and improve the environmental conditions of San Diego Bay and the Tidelands by (1) participating in educational programs; (2) promoting environmentally sensitive practices; and (3) providing innovative leadership in management and control programs.
• Ensure a safe and secure environment for people, property, and cargo by (1) continuing development of the Harbor Police facility; (2) participating in safety educational programs; and (3) collaborate with regional partners on safety and security issues, programs, and technologies.
• Develop and maintain a high level of public understanding that builds confidence and trust in the Port by (1) developing customer service standards; (2) conducting regular informational briefings with stakeholders and community at large; (3) supporting and actively participating in local communities, charities, and events.

79
• Develop a high-performing organization by (1) aligning personnel philosophies and training programs with the Strategic Plan; (2) continually evaluating and upgrading system systems.
• Strengthen the Port’s financial performance by (1) expediting tenant redevelopment plans; (2) training for Emergency Response and Business Continuity Plan; (3) developing programs that will diversify the Port’s revenue base; and (4) implementing cost-saving measures.
Coachella Valley Economic Development Blueprint Strategy The Coachella Valley Blueprint strategy focuses on four primary issues and goals to enhance the Valley's competitiveness as a place to do business, live, work and visit. Issue 1 Though regions are now the definitive geography for economic competitiveness, the Coachella Valley has little significant history of thinking or acting regionally in terms of comprehensive economic development. • Goal
o The establishment of a true regional identify and framework that will enable Coachella Valley communities to compete and thrive in the global marketplace
• Objectives o Promote a greater understanding of regional challenges and opportunities. o Better link Coachella Valley communities through programs that foster regional identity
and relationship building o Build the capacity to advocate for issues of importance to Coachella Valley
constituencies. Issue 2 High concentrations in cyclical, largely low-paying employment sectors risk continued instability in the Coachella Valley economy. • Goal
o Greater diversification through development of high wage sectors that will boost regional wealth and increase economic sustainability.
• Objectives o Develop comprehensive internal and external economic development marketing
programs for the Coachella Valley. o Effectively Develop the Valley's identified target sectors. o Provide comprehensive data collection and analysis and services for regional stakeholder
groups. o Provide entrepreneurs and small business persons the resources necessary to succeed. o Ensure existing Valley businesses are retained and expanded.
Issue 3 Overall workforce skills and capacity must be enhanced for the Coachella Valley to compete for the high-value jobs being created in the New Economy. • Goal

80
o Development of a competitive labor force that will enable existing and future Coachella Valley companies to thrive and workers to greatly increase their incomes.
• Objectives o Optimize primary and secondary education in the Valley. o Fully leverage regional higher education and workforce development institutions.
Issue 4 Quality of life and quality of place – increasingly critical when competing for companies and talent – are Coachella Valley strengths, but must be maintained and enhanced to ensure long-term economic sustainability. • Goal
o Aggressive and ongoing efforts to continue the Coachella Valley's standings as one of the west's most compelling destinations to work, live and visit.
• Objectives o Leverage local and regional partnerships to provide effective public services for
Coachella Valley residents. o Continue to enhance the Coachella Valley's capacity in arts, culture and recreation
amenities. o Support the development of quality housing options for residents of all ages and incomes. o Ensure that sustainable development patterns are supported and enforced.
**Prepared by Chabin Concepts for the South County San Diego Comprehensive Economic Development Strategy

81
Appendix G
Summary of Legislation
The following is a summary of selected legislation relating to international trade, foreign investment and infrastructure. The list is divided between bills introduced in the 2011-12 Session and those introduced in prior sessions. The list will be modified to reflect testimony from the November 10, 2011 hearing of the Assembly Committee on Jobs, Economic Development and the Economy. Legislation from the 2011-12 Session • AB 29 (John A. Pérez, Mike Feuer and V. Manuel Pérez) - Office of Business and Economic
Development: This bill establishes the Governor's Office of Business and Economic Development (GO-BIZ), which would be administered by a director appointed by the Governor. The bill would also move the Office of Small Business Advocate to the Office of Economic Development. Status: Signed by the Governor, Chapter 475, Statutes of 2011.
• AB 231 (V. Manuel Pérez) Enterprise Zone Reform Package – reforms elements of the state’s Enterprise Zone program to make it more transparent, effective, and accountable to the public and to the communities it serves. Status: Pending in JEDE, two year bill.
• AB 696 (Hueso) – Strengthening the link between Economic Development and
Infrastructure: This bill requires projects selected for funding under the Infrastructure State Revolving Fund Program to only be funded if the project meets specified land use and economic development criteria. Status: Vetoed by the Governor, 2011.
• AB 1094 (John A. Pérez) – National I-Bank: This bill designates the Infrastructure and
Economic Development Bank as the state's lead agency in dealing with the proposed federal infrastructure bank. The bill also expands the membership of the board of directors of the I-Bank from five to seven members by including the representation of state legislators. Status: Pending on the Senate Floor.
• AB 893 (V. Manuel Pérez) – Technical Assistance for Infrastructure Funding Applications:
This bill modernizes the operations of the I-Bank, such as the inclusion of the economic development community on the Board, mandating outreach to communities, and adding new reporting requirements about the number of jobs created and retained, and the industries served. Status: Held in Senate Appropriations.
• AB 1137 (V. Manuel Pérez) – Trade Promotion and Export Finance: This bill makes a
number of changes to programs designed to assist local communities and businesses, enhance the local business climate, and create jobs by increasing foreign trade and investment including providing authorizing the establishment of the California Trade Promotion and Export Finance Program, codifying the state's role in the EB-5 Program, and making

82
technical corrections to the international free trade zone program. Status: Pending in the Senate Appropriations Committee.
• AB 1409 (JEDE) – Goods Movement Update to the State Economic Strategy: This bill
requires that the next update of the international trade and investment strategy include policy goals, objectives and recommendations from the state Goods Movement Plan (GMAP), as well as related measurable outcomes and timelines. Status: Pending in Senate Appropriations Committee.
• AB 1410 (JEDE Committee) – Trade Omnibus Bill: This bill makes technical, non-
substantive amendments to the codes relating to international trade and foreign investment. Specifically, this bill reorganizes the statutory placement of the Office of California-Mexico Affairs and the California-Mexico Border Relations Council from a general title within state government to a more specific title on foreign relations within the Government Code. Status: Pending on the Senate Floor.
• SB 460 (Price) – Trade Promotion Partnership: This bill requires the Secretary of the
Business, Transportation and Housing Agency (BTH) to convene a statewide business partnership for international trade marketing and promotion. Status: Held on the Suspense File in the Assembly Committee on Appropriations.
• SB 822 (Evans) – Five-Year Infrastructure Plan: Existing law requires the Governor, in
conjunction with the Governor's Budget, to submit annually to the Legislature a proposed 5-year infrastructure plan containing specified information concerning infrastructure needed by state agencies, public schools, and public postsecondary educational institutions and a proposal for funding the needed infrastructure. This bill makes technical, nonsubstantive changes to this provision. Status: Pending in the Assembly Committee on Budget.
• SB 907 (Evans) - Master Plan for Infrastructure Financing and Development Commission:
This bill creates the Master Plan for Infrastructure Financing and Development Commission. It describes the structure of the commission and that its members shall be appointed by the Governor. The bill also provides for staff to be loaned from relevant agencies with exception of the Executive Director that is appointed by the chair of the commission with the approval of the entire membership. The bill also describes the duties of the commission including creating task force committees. Status: Pending in the Assembly Committee on Jobs, Economic Development and the Economy.
Legislation from Prior Sessions • AB 761 (Coto) - Small Business Procurement: State Infrastructure Construction Goals: This
bill requires each state agency awarding contracts that are financed with proceeds from the infrastructure bonds approved by voters in November 2006 to establish a 25% small business participation goal for state infrastructure construction contracts and to provide specified assistance to small businesses bidding on state infrastructure bond-related contracts. Status: This bill was signed by the Governor, Chapter 611, Statutes of 2007.

83
• AB 1107 (Arambula) - Goods Movement: Small Business and Microenterprise: As passed by JEDE, this bill would have required the California Small Business Board within the Business, Transportation and Housing Agency in collaboration with the Labor and Workforce Development Agency and the California Department of Food and Agriculture to assess the goods movement needs of small business and microenterprise in California, and to make recommendations thereupon, for incorporation in the California Economic Development Strategic Plan and the State Transportation Plan. Status: JEDE-related content removed. The bill was vetoed by the Governor in 2008.
• AB 1672 (Nunez) - California Transportation Commission: This bill makes various findings
regarding transportation infrastructure in California, and states certain goals and policies for the expenditure of Proposition 1B bond funds, including the expenditure of money in the Trade Corridor Infrastructure Fund. Status: The bill was signed by the Governor, Chapter 717, Statutes of 2007.
• AB 2896 (Karnette) - Commercial Development Trade Council: This bill would have
created the Commercial Transportation Council in Business, Transportation and Housing Agency to review and collect data, and to provide advice concerning commercial transportation needs in California. Status: The bill was held in the Senate Committee on Governmental Organization in 2006.
• AB 3021 (Nuñez) - California-Mexico Border Relations Council: This bill established the six-member California-Mexico Border Relations Council (Border Council) comprised of all Agency Secretaries and the Director of the Office of Emergency Services for the purpose of coordinating activities of state agencies. The Border Council is required to report to the Legislature on its activities annually. Status: Signed by the Governor - Chapter 621, Statutes of 2006.
• AJR 14 (Jeffries) - Customs Duties: This resolution memorialized the President of the U.S.
and Congress to enact legislation to ensure that a substantial increment of new revenues derived from customs duties and importation fees be dedicated to mitigating the economic, mobility, security, and environmental impacts of trade in California and other trade-affected states across the U.S. Status: Approved by both Houses, Resolution Chapter 73, Statutes of 2007.
• AJR 27 (Torrico) - Support U.S.-Colombia Trade Promotion Agreement: This resolution
memorialized Congress that the California Legislature opposes the United States-Colombia Trade Promotion Agreement. Status: Approved by both Houses, Resolution Chapter 145, Statutes of 2010.
• AJR 55 (Villines) - Support U.S.-Colombia Trade Promotion Agreement: This resolution
would have memorialized Congress that the California Legislature supports the United States-Colombia Trade Promotion Agreement. Status: Refused adoption in the Assembly Committee on Jobs, Economic Development, and the Economy in 2008.

84
• SB 19 (Lowenthal) Trade Corridors: Emissions Reduction : This bill declared legislative intent with regard to the expenditure of Proposition 1B bond money for Trade Corridors. Status: The bill was held under submission in Assembly Committee on Appropriations in 2008.
• SB 262 (Runner) - Trade Corridor Improvements: This bill would have required the
California Transportation Commission, when allocating Proposition 1B Trade Corridor Infrastructure money, to consider the impact of a project on goods movement and port operations in the Southern California region, and impacts and benefits of an inland port on reducing congestion at or in the vicinity of the Ports of Los Angeles and Long Beach. Status: The bill was held in the Senate Committee on Transportation and Housing in 2008.
• SB 1513 (Romero and Figueroa) - New International Trade Program: Final Compromise - California International Trade and Investment Act. This bill provided new authority for the BTH to undertake international trade and investment activities, and as a condition of that new authority, directs the development of a comprehensive international trade and investment policy for California. This bill reflects extended bi-partisan discussions between the Senate and the Assembly. Status: Signed by the Governor - Chapter 663, Statutes of 2006.
• SB 1266 (Perata) - Highway Safety, Traffic Reduction, Air Quality, and Port Security Bond Act of 2006: This bill provided for $19 billion in transportation infrastructure bonds including $3.5 billion to be deposited in the Trade Corridors Infrastructure Fund. Status: The bill was signed by the Governor, Chapter 25, Statutes of 2006.

85
Appendix H
State and Federal Resource Programs
This appendix includes basic information on community development programs and services available to businesses, nonprofits and local governments. The list is provided as both background information for the November 10, 2011 hearing by the Assembly Committee on Jobs, Economic Development and the Economy and as a resource to communities seeking financing options.
Access to Capital for Small Businesses
2011 California Air Resources Board Direct Loan Program Administered by the California Air Resources Board, this program implements a low-interest direct loan program for small trucking fleets for the purpose of providing affordable financing to small fleet owners/operators to purchase cleaner trucks (2010 model year or newer heavy-duty trucks), retrofits, or SmartWay equipment prior to any applicable compliance deadlines. Air Quality Improvement Program Administered through the California Air Resources Board, this program was created to implement a heavy-duty vehicle air quality loan program to assist on-road fleets affected by the ARB’s "In-Use Truck and Bus Regulation and Heavy-Duty Vehicle Greenhouse Gas Emission Reduction Measure." Alternative and Renewable Fuels and Vehicle Technology Program Administered by the California Energy Commission, this program provides funding to develop and deploy alternative and renewable fuels and advanced transportation technologies to help attain the state’s climate change policies for medium and heavy duty trucks. Beverage Container Recycling Grants Administered through CalRecycle, this program provides funding program assists organizations with establishing convenient beverage container recycling and litter abatement projects, and to encourage market development and expansion activities for beverage container materials. California Capital Access Program Administered through the California Pollution Control Board operates a loan loss reserve program through private financial institutions. Convert Diesel Powered Irrigation Pumps to Electricity Administered by the California Air Resources Board, this incentive program is designed to encourage agricultural customers to convert diesel internal combustion irrigation pumps, which are significant sources of air pollution, to electric use. Community Development Block Grant (CDBG) Program Administered by the California Department of Housing and Community Development, this

86
program provides funding for economic development projects, public infrastructure improvements, as well as housing, community and social welfare related projects and activities. Energy Efficient Conservation Block Grants (EECBG) Program Administered by the California Energy Commission, this program focuses on energy efficiency projects that deliver lasting financial benefits to California consumers and the economy. Farm and Ranch Cleanup Grants Administered through CalRecycle, this program provides funding to cities, counties, Resource Conservation Districts, and Native American tribes for the cleanup of illegal solid waste sites on farm or ranch property.
Federal Small Business Financing Loan Programs Administered by the U.S. Small Business Administration, this site www.sba.gov has an index of loans available for small businesses.
Household Hazardous Waste (HHW) Grants Administered through CalRecycle, this program provides local government funding for programs to expand or initially implement HHW programs such as collection programs, educational programs, load checking programs, and programs emphasizing waste reduction, source reduction, reuse or recycling of HHW.
Jobs Through Recycling Grant Program Administered by the U.S. Environmental Protection Agency, this program provides grants for recycling/reuse businesses that increase the use of recyclable or reusable materials and contribute to economic development and job creation.
Landfill Closure Loans Administered through CalRecycle, this program provides zero interest loans to operators of unlined, older-technology landfills interested in early closure of their facilities. Local Enforcement Agency Grants Administered through CalRecycle, this program provides grant funds, based on population and solid waste facilities, to local enforcement agencies to assist in their solid waste facilities permit and inspection program. Non-toxic Dry Cleaning Incentive Program Administered by the California Air Resources Board, this grant program provides grants to any eligible dry cleaners in the state willing to transition from the use of Perc machines to alternative non-toxic and non-smog forming technologies such as water-based and CO2 cleaning systems. Public Interest Energy Research (PIER) Program Administered by the California Energy Commission, these programs support and fund energy research, development, and demonstration (R&D) projects that will bring environmentally safe, affordable, and reliable energy services and products to the marketplace. The PIER - R&D Programs listed below:

87
• Buildings End-Use Energy Efficiency • Emerging Technology Demonstration Grant (ETDG) Program • Energy Innovations Small Grant (EISG) Program • Energy-Related Environmental Research Area • Industrial/Agricultural/Water End-Use Energy Efficiency Research Area • Renewable Energy Research Area • Transportation Research Area
Recycling Market Development Zone (RMDZ) Loans Administered through CalRecycle, this program provides direct loans to businesses that use postconsumer or secondary waste materials to manufacture new products, or that undertake projects to reduce the waste resulting from the manufacture of a product. Small Business Certified Development Company (CDC)/504 Loan Program Administered through the U.S. Small Business Administration, this loan program is a long-term financing tool, designed to encourage economic development within a community by providing small businesses with long-term, fixed-rate financing to acquire major fixed assets for expansion or modernization. Small Business 7(a) Loan Program Administered through the U.S. Small Business Administration, this loan program includes financial help for businesses with special requirements. For example, funds are available for loans to businesses that handle exports to foreign countries, businesses that operate in rural areas, and for other very specific purposes. Small Business Disaster Loans Administered through the U.S. Small Business Administration, this program provides low interest disaster loans to homeowners, renters, businesses of all sizes and private, nonprofit organizations to repair or replace real estate, personal property, machinery & equipment, inventory and business assets that have been damaged or destroyed in a declared disaster. Small Business Microloan Program Administered through the U.S. Small Business Administration, this loan program provides small, short-term loans to small business concerns and certain types of not-for-profit child-care centers. The SBA makes funds available to specially designated intermediary lenders, which are nonprofit community-based organizations with experience in lending as well as management and technical assistance. These intermediaries make loans to eligible borrowers. The maximum loan amount is $50,000, but the average microloan is about $13,000. Small Business Surety Bond Program Operated by the U.S. Small Business Administration, this program can guarantee bid performance and payment bonds for contracts up to $1.25 million for small businesses that are unable to obtain bonds through regular commercial channels.

88
Solid Waste Disposal and Site Cleanup Grants Administered through CalRecycle, this program expends funds directly for cleanup or emergency actions, providing loans to responsible parties who demonstrate the ability to repay state funds or provide matching grants to local governments to assist in remediation of environmental problems at landfills. State Small Business Loan Guarantee Program Administered through California Business Transportation and Housing Agency, this program makes direct loans and provides loan guarantees and letters of credit through private financial institutions to small businesses. The Diesel Emissions Reduction Program Administered through U.S. EPA, this grant and loan program was created to promote diesel emission reductions. As stipulated, 70 percent of the funds are to be used for national competitive grants, with the remaining 30 percent allocated to the states through the State Clean Diesel Grant and Loan Program. The PLACE Program for Off-Road Vehicles (formerly On-Road Heavy-Duty Vehicle Air Quality Loan Program) Administered by the California Air Resources Board, The PLACE Program for Off-Road Vehicles is loan guarantee program available for off-road vehicle owners needing assistance for financing retrofits, repowers and replacements prior to any applicable compliance deadlines. Tire Equipment Loan Program Administered through CalRecycle, this program provides loans to California tire manufacturers and processors for the purchase of equipment that will be used to produce tire-derived material and products. Tire Recycling, Cleanup, and Enforcement Grants Administered through CalRecycle, this program provides several different grant programs available to local governments for the purpose of diverting tires from landfill disposal by promoting markets of recycled-content products, as well as for enforcement and cleanup. Used Oil Recycling Grants Administered through CalRecycle, this program provides several different grant programs available for assisting local governments, nonprofit entities, and other parties for activities that encourage appropriate disposal and recycling of used oil.
USDA Business and Industry Direct Loan Program Operated by the U.S. Department of Agriculture, this program provides loans to private parties to be used for improving, developing, or financing business and industry, creating jobs, and improving the economic and environmental climate in rural counties.

89
Resources for Local Governments and Economic Development Corporations
California Community Economic Revitalization Team (CERT) Administered by the California Resources Agency, this program provides links to Federal and State grant and loan programs. California Infrastructure and Economic Development Bank (I-Bank) The I-Bank was created in 1994 to promote economic revitalization, enable future development, and encourage a healthy climate for jobs in California. The I-Bank has broad authority to issue tax-exempt and taxable revenue bonds, provide financing to public agencies, provide credit enhancements, acquire or lease facilities, and leverage State and Federal funds.
Economic Development Administration (EDA) Administered by the U.S. Department of Commerce, the EDA provides various economic development and public works related grants through eight EDA programs. Goods Movement Emissions Reduction Program Administered by the California Air Resources Board, this program is a new partnership between the ARB and local agencies (like air districts, ports, and transportation agencies) to quickly reduce air pollution emissions and health risk from freight movement along California's trade corridors. Local agencies provide financial incentives to owners of equipment used in freight movement to upgrade to cleaner technologies. Public Works Development Facilities Program Administered by the U.S. Department of Commerce, this program provides grants to help distressed communities attract new industry, encourage business expansion, diversify local economies, and generate long-term, private sector jobs.
Infrastructure
Airports Financial Assistance Division Administered by the Federal Aviation Administration (FAA), this Division provides Airport Improvement Grants to public agencies, districts, and authorities. Airport Improvement Program Administered by the Federal Aviation Administration (FAA), this program provides grants for airport projects.
Border Environment Infrastructure Fund Administered by the North American Development Bank, this fund facilitates financing for the development, execution and operation of environmental infrastructure projects in the U.S.-Mexico border region by combining grant funds with loans or guaranties for projects that would otherwise be financially unfeasible.
California Certified Local Government (CLG) Grants

90
Administered by the Historic Preservation Fund, a minimum of 10% of the state's annual allocation is passed through to local governments to fund the Certified Local Government Grants (CLG). Community Development Block Grants may be used as a local match for federal grants such as CLGs California Department of Boating and Waterways This Department offers several loans for the development of marinas, expansion and/or improvement of boating and ancillary facilities available to the public, and for construction of new small craft harbors or expansion of existing berthing facilities. California Heritage Fund – Proposition 40 Administered by the California Cultural and Historical Endowment, funding supports projects that help to preserve and demonstrate culturally significant aspects of life throughout California history including architecture, economic activities, art, recreation and transportation. California Infrastructure and Economic Development Bank (I-Bank) The I-Bank, www.ibank.ca.gov , has broad authority to issue tax-exempt and taxable revenue bonds, provide financing to public agencies for infrastructure, provide credit enhancements, and acquire or lease facilities.
California Office of Traffic Safety This Office provides grants to improve traffic safety on area streets and highways and increase safety awareness. Community Development Block Grant (CDBG) Program Administered by the California Department of Housing and Community Development, this program provides funding for economic development projects, public infrastructure improvements, as well as housing, community and social welfare related projects and activities. Community Facilities Loan Program Administered by the U.S. Department of Agriculture, this program provides loans for public community facilities in rural areas and towns. Federal Transit Administration - Capital Grant Prog ram Administered by the Federal Transit Administration, this program provides grants to assist with the financing of capital projects that will benefit the country's transit systems. The three categories of projects are:
• Bus and bus-related facilities; • Modernization of fixed guideway systems; and • Construction of new fixed guideway systems and extensions.
Federal Transit Administration - Metropolitan Planning Program Administered by the Federal Transit Administration, this program provides financial assistance, through the states, to Metropolitan Planning Organizations to support the costs of preparing long-range transportation plans required as a condition of obtaining Federal Capital Program and Urbanized Area Formula Program grants for transit projects.

91
North American Development Bank - Loan and Guaranty Program Administered by the North American Development Bank, this program provides direct financing or loan guarantees for environmental infrastructure projects within 100 kilometers of the U.S.-Mexico border. Projects must involve potable water, wastewater treatment, municipal solid waste, or related areas. Borrowers may be from the public or private sector. North American Development Bank - Institutional Development Cooperation Program Administered by the North American Development Bank, this program assists public utilities within 100 kilometers of the U.S.-Mexico border in achieving effective and efficient operation of their water, wastewater treatment, municipal solid waste, and related services. Pollution Prevention Incentives for States Grants Program Administered by the U.S. Environmental Protection Agency, this program provides grants for state, tribal and regional programs that address the reduction or elimination of pollution across all environmental media: air, land, and water. Public Telecommunications Facilities Program Administered by the U.S. Department of Commerce, this program provides matching grants for equipment that disseminates noncommercial educational and cultural programs to the American public. Public Works Development Facilities Program Administered by the Department of Commerce, this program provides grants to help distressed communities attract new industry, encourage business expansion, diversify local economies and generate long-term, private sector jobs. Among the types of projects funded are water and sewer facilities primarily serving industry and commerce; access roads to industrial parks or sites: port improvements; and business incubator facilities. Technology Opportunities Program Administered by the U.S. Department of Commerce, this program provides matching demonstration grants to help develop information infrastructures and services in rural as well as urban areas. Transportation and Community and System Preservation Pilot Program Administered by the U.S. Department of Transportation, this program provides grants to investigate the relationship between transportation and community and system preservation and private sector-based initiatives. USDA - Telecommunications Program Administered by the U.S. Department of Agriculture, this program provides financing to promote the construction of telecommunications infrastructure in rural areas. USDA - Farm Bill Broadband Program Administered by the U.S. Department of Agriculture, this program is designed to provide loans for funding, on a technology neutral basis, for the costs of construction, improvement, and

92
acquisition of facilities and equipment to provide broadband service to eligible rural communities. USDA – Community Connect Administered by the U.S. Department of Agriculture, this program serves rural communities where broadband service is least likely to be available, but where it can make a tremendous difference in the quality of life for citizens. Eligible areas include a single community with a population less than 20,000 which does not have Broadband Transmission Service. USDA – Distance Learning and Telemedicine Program Administered by the U.S. Department of Agriculture, the Distance Learning and Telemedicine Program provides loans and grants for advanced telecommunications technologies that provide enhanced learning and health care opportunities for rural residents.
USDA - Water and Waste Programs Administered by the U.S. Department of Agriculture Rural Development, the program provides loans to develop water and waste disposal systems in rural areas and towns with a population not in excess of 10,000. Loans are available to local governments, tribes and nonprofits. USDA – Technical Assistance and Training Grants Administered by the U.S. Department of Agriculture Rural Development, the program provides grants to nonprofit organizations to provide technical assistance and training to associations on a wide range of issues relating to the delivery of water and waste water. USDA – Solid Waste Management Grants Administered by the U.S. Department of Agriculture Rural Development, the program provides grants to public and private nonprofit organizations for providing technical assistance and training to associations to reduce or eliminate pollution of water resources and improve planning and management of solid waste facilities. This assistance is available to towns with a population not in excess of 10,000. USDA – Community Water Assistance Grants Administered by the U.S. Department of Agriculture Rural Development, the program provides assistance to rural communities that have had a significant decline in the quantity or quality of drinking water. Grants are available to rural areas and towns with a population not in excess of 10,000. USDA – Water Circuit Rider Technical Assistance Administered by the U.S. Department of Agriculture Rural Development, the program provides technical assistance for the operation of rural water systems. The assistance is provided through a contract with the Rural Utility Service (RUS). Assistance can be requested by officials of rural water system or the RUS. U.S. Department of Commerce - Public Works Development Facilities Program Administered by the Department of Commerce, this program provides grants to help distressed communities attract new industry, encourage business expansion, diversify local economies and

93
generate long-term, private sector jobs. Among the types of projects funded are water and sewer facilities primarily serving industry and commerce; access roads to industrial parks or sites: port improvements; and business incubator facilities.

94
Appendix I
Foreign Trade Zones Located in California
Foreign Trade Zones (FTZs) are areas where goods may be imported without submitting to all U.S. Customs rules or tariffs. They are intended to promote U.S. participation in trade and retain domestic employment that might otherwise go to foreign countries. These zones are established by the federal government with companion state statute authorization. California has 17 general purpose FTZs out of 234 zones in the U.S.
Zone Name and Contact Information Subzones Dedicated to a Single Firm Location
FTZ No. 3 San Francisco Grantee: San Francisco Port Commission Pier 1, The Embarcadero San Francisco, CA 94111 Peter Dailey (415) 274-0400 Fax (415) 274-0528
3A Lilli Ann 3B Chevron 3C Tesoro Refining
San Francisco
FTZ No. 18 San Jose Grantee: City of San Jose Office of Economic Development San Jose City Hall, 200 E. Santa Clara Street San Jose, California 95113 Joseph Hedges (408) 535-8186 Fax (408) 292-6719 [email protected] www.sjeconomy.com
18E Space Systems/Loral, Inc. 18F Lam Research Corp.
San Jose
FTZ No. 50 Long Beach Grantee: Board of Harbor Commissioners of the Port of Long Beach P.O. Box 570, Long Beach, CA 90801-0570 Larry Ditchkus (562) 590-4162 Fax (562) 901-1739
50C National RV 50D Datatape, Inc. 50E Alps Manufacturing 50F Rauch Industries 50G Shell Oil Products 50H BP West Coast Products LLC 50I Valero Energy Corporation 50J Ricoh Electronics, Inc. 50K Eastman Kodak Company 50L Michelin North America, Inc. 50M Conair Corporation
Los Angeles/ Long Beach
FTZ No. 56 Oakland Grantee: City of Oakland Operator: Pacific American Warehousing & Trucking Co 9401 San Leandro St., Oakland, CA 94603 Linda Hothem (510) 568-8500 Fax (510) 568-4483 [email protected]
56A Mazda San Francisco
FTZ No. 143 West Sacramento 143A C. Ceronix San Francisco

95
Grantee: Port of Sacramento 1110 West Capitol Avenue West Sacramento, CA 95691 Mike Luken (916) 371-8000 Fax (916) 372-4802 [email protected] www.portofsacramento.com
143B Hewlett-Packard 143C Gymboree Corporation 143D Grafil, Inc.
FTZ No. 153 San Diego Grantee: City of San Diego 202 “C” St., MS 4A, San Diego, CA 92101 Adrienne Turner (619) 236-6364 Fax (619) 533-3320 [email protected]
153C DNP Electronics 153D Callaway Golf Company 153E National Steel & Shipbuilding Co.
San Diego
FTZ No. 191 Palmdale Grantee: City of Palmdale, Economic Development, 38250 North Sierra Highway, Palmdale, CA 93550 David Walter (661) 267-5125 Fax (661) 267-5155
Los Angeles/ Long Beach
FTZ No. 202 Los Angeles Grantee: Board of Harbor Commissioners of the City of Los Angeles 425 South Palos Verdes Street San Pedro, CA 90731 Masa Morimoto (310) 732-3843 Fax (310) 547-4643
202A 3M 202B Chevron USA, Inc. 202C ConocoPhillips 202E Sony Electronics, Inc.
Los Angeles/ Long Beach
FTZ No. 205 Port Hueneme Grantee: Board of Harbor Commissioners, Oxnard Harbor District Port of Hueneme, P.O. Box 608 333 Ponoma St., Port Hueneme, CA 93044 Will Berg (805) 488-3677 Fax (805) 488-2620
205A Imation Corporation Port Hueneme
FTZ No. 226 Merced, Madera & Fresno Counties Grantee: Board of Supervisors of the County of Merced 2507 Heritage Drive, Atwater, CA 95301 Patty Hymiller (209) 385-7686 Fax (209) 383-4959 [email protected] www.ftz226.co.merced.ca.us
Fresno
FTZ No. 231 Stockton Grantee: Port of Stockton P.O. Box 2089, Stockton, CA 95201 Steve Escobar (209) 946-0246 Fax (209) 463-2362 [email protected]
231A Medline Industries, Inc. San Francisco

96
FTZ No. 236 Palm Springs Grantee: City of Palm Springs 3200 East Tahquitz Canyon Way Palm Springs, CA 92262 Cathy Van Horn (760) 323-8175 Fax (760) 322-8325 [email protected]
Palm Springs
FTZ No. 237 Santa Maria Grantee: Santa Maria Public Airport District 3217 Terminal Drive, Santa Maria, CA 93455 Gary Rice (805) 922-1726 Fax (805) 922-0677
San Luis
FTZ No. 243 Victorville Grantee: City of Victorville 14343 Civic Dr., Victorville, CA 92392 Collette Hanna (760) 243-6324 [email protected] www.victorvillecity.com
243A Black & Decker Corp. Victorville
FTZ No. 244 Riverside County Grantee: March Joint Powers Authority P.O. Box 7480, Moreno Valley, CA 92552 Lori M. Stone (951) 656-7000 Fax (951) 653-5558
244A Skechers USA, LLC Los Angeles/ Long Beach
FTZ No. 248 Eureka Grantee: City of Eureka, California Office of the City Manager 531 K Street, Eureka, CA 95501-1165 Marie Liscom (707) 441-4215 Fax (707) 441-4209
Eureka
FTZ No. 257 Imperial County Grantee: County of Imperial Department of Planning and Development Services 801 Main St., El Centro, CA 92243 Jurg Heuberger (760) 482-4236 Fax (760) 353-8338
Calexico
FTZ No. 276 Kern County Grantee: County of Kern Department of Airports 3701 Wings Way, Suite 300 Bakersfield, CA 93308 Teresa Hitchcock (661) 391-1818 Fax (661) 391-1801
Meadows Field Airport

97
Bibliography
Below is a partial bibliography of the reports and websites used to prepare this report. A more comprehensive list will be provided in the next report update. 2005 California Regional Economies Project. California Regional Economies Project, 2005. Assembly Committee on Jobs, Economic Development, and the Economy. Microenterprise: The Engine of Regional Economics. 2006. Assembly Committee on Jobs, Economic Development, and the Economy and Assembly Committee on Revenue and Taxation. 20 Years of California Enterprise Zones: A Review and Prospectus. 2005 Assembly Committee on Jobs, Economic Development, and the Economy and Senate Committee on Business, Professions, and Economic Development. California Trade Prospectus: Finding Our Way Within a Global Economy. 2006. Bardhan, Ashok, and Cynthia Kroll. Foreign Trade and Growth in California's Economy. Fisher Center for Real Estate and Urban Economies, 1995. Bardhan, Ashok, and Dwight Jaffee. Innovation, R&D and Off Shoring. Fisher Center for Real Estate and Urban Economies, 2005. Berube, Alan, and Bruce Katz. Katrina's Window: Confronting Concentrated Poverty Across America. The Brookings Institution, October 2005. Best Performing Cities 2010. Milken Institute and Greenstreet Real Estate Partners. 2010. Balancing Democracy & Trade: Assessing the Impact of Trade & Investment Agreements on California Law (Harrison Institute for Public Law, Georgetown University Law Center, 2001) Border Governors Conference Council of Economic Advisors Holds Inaugural Meeting at 2008 Conference. 15 August 2008. Business, Transportation and Housing Agency. Accessed 21 September 2008. http://www.bth.ca.gov/news_pub/2008/081508.asp. Budget Backgrounder – Making Dollars Make Sense. August 2008. California Budget Project. http://www.cbp.org.
Business without Borders? The Globalization of the California Economy (Public Policy Institute, Howard Shatz, 2003)

98
California Agricultural Resource Directory 2007. California Department of Food and Agriculture. Accessed on 2 October 2008. Cleantech Industry in San Diego. Global Connect, U.C. San Diego Extension. June 2007. Collaborative Economics, Inc. The Innovation Driven Economic Development Model. September 2008. Collaborative Economics, Inc. Logistics and Manufacturing Value Chains: Meeting the Workforce and Infrastructure Demands of a "Real Time" Economy. California Regional Economies Project. July 2005. Collier, Robert. California on the Global High Road: State Trade and Investment Strategy for the 21st Century. Institute of Governmental Studies, University of California, Berkley, 1999. Comprehensive Economic Development Strategies, CEDS, Summary of Requirements. Economic Development Administration, U.S. Department of Commerce. October 2011. http://www.eda.gov. Crafting a Way Forward: The Rural/Urban Dynamic in Regional Competitiveness. 19 October 2006. Rural Policy Research Institute. Accessed on 2 October 2008. http://www.rupri.org. Creating Economic Opportunity and Jobs from Quality of Life Experiences in Rural California. California Regional Economies Project, September 2004. CTC Approves Landmark $3 Billion Goods Movement Program. News and Press Releases – 2008. 10 April 2008. California Business, Transportation and Housing Agency. Accessed 21 September 2008 http://www.bth.ca.gov/news_pub/2008/041008.asp. Economic Development America. Economic Development Information Coalition, Summer 2004. Effland, Anne B.W. Rural Amenities, Global Economy, and the Environment: The Clinton Administration Confronts New Paradigms. n.d. Energy Facts: California Industries. National Association of Manufacturers, 2010. www.manufacts.org. Executive Summary. American Human Development Report, Measure of America. http://www.measureofamerica.org. Facts About California Manufacturing. National Association of Manufacturers, 2011. www.manufacts.org. Federal Financial Institutions Examination Council. CRA National Aggregate Table. Community Reinvestment Act. n.d. http://www.ffiec.gov/craadweb/national.aspx.

99
Federal Immigration Act of 1990 – Investor Visa Program. May 2008. Feser, Edward. Linking Research and Rural Development Policy: An Introduction to the Special Issue. The Journal of Regional Analysis and Policy. 2007. University of Illinois at Urbana-Champaign. Global Gateways Development Program. Office of Goods Movement, California Department of Transportation, 2002). Goetz, Stephan J. "Self-Employment in Rural America: The New Economic Reality." Rural Realities. 2008. Rural Sociological Society. http://www.ruralsociology.org. Governor's Environmental Goals and Policy Report. Governor's Office of Planning and Research, State of California, 2003. Green Light for Rural Priorities Projects. 11 September 2008. The Scottish Government. Accessed 18 September 2008. http://www.scotland.gov.uk/News/Releases/2008/09/11101406. Hanak, Ellen, and David Neumark. Trade with Mexico and California Jobs, California Economic Policy. Public Policy Institute of California, 2006. Haveman, Jon; Howard Shatz; and Ernesto Vilichis. California and the World Economy: Exports, Foreign Direct Investment and U.S. Trade Policy. Public Policy Institute of California, 2002. Henderson, Lisa. "Preservation and Revitalizing Rural Downturns." Economic Development America. 2004. Economic Development Information Coalition. http://www.eda.gov/ImageCache/EDAPublic/documents/pdfdocs/edasummer2004_5ffinal_2epdf/v1/edasummer2004_5ffinal.pdf. Henton, Doug; John Melville; Tracey Grose; and Gabrielle Maor. Clean Technology and the Green Economy. Collaborative Economics. March 2008. Koehler, Gus. California Trade Policy. California Research Bureau, 1999 and 2001. Levere, Andrea; Bill Schweke; and Beadsie Woo, Development Finance and Regional Economic Development. July 2010. www.cfed.org. LP Information. National Association of Investment Companies. Accessed 19 September 2010. http://www.naicvc.com/Home/LPCaseStudies.aspx. Maglinte, Janet. California Economic Strategy Panel Regions. California Economic Strategy Panel, 2010. Maglinte, Janet. California Economic Strategy Panel, Bay Area Region. 2010. California Economic Strategy Panel. http://www.labor.ca.gov/panel.

100
Maglinte, Janet. California Economic Strategy Panel, Central Coast Region. 2010. California Economic Strategy Panel. http://www.labor.ca.gov/panel. Maglinte, Janet. California Economic Strategy Panel, Central Sierra Region. 2010. California Economic Strategy Panel. http://www.labor.ca.gov/panel. Maglinte, Janet. California Economic Strategy Panel, Greater Sacramento Region. 2010. California Economic Strategy Panel. http://www.labor.ca.gov/panel. Maglinte, Janet. Northern California Region Economic Profile. California Economic Strategy Panel, 2010. http://www.labor.ca.gov/panel. Maglinte, Janet. California Economic Strategy Panel, Northern Sacramento Valley Region. 2010. California Economic Strategy Panel. http://www.labor.ca.gov/panel. Maglinte, Janet. California Economic Strategy Panel, Southern California Region. 2010. California Economic Strategy Panel. http://www.labor.ca.gov/panel. Maglinte, Janet. California Economic Strategy Panel, Southern Border Region. 2010. California Economic Strategy Panel. http://www.labor.ca.gov/panel. McKernan, Signe-Mary, and Henry Chen, Small Business and Microenterprise as an Opportunity and Asset-Building Strategy. The Urban Institute. June 2005. Measure of America: American Human Development Project. American Human Development Project, 2008. http://measureofamerica.org/human-development. The Power of Place: A National Strategy for Building America's Communities of Innovation. Association of University Research Parks. Accessed 24 September 2008. http://www.aurp.net/meet/power_of_place.cfm. Regional Economic Accounts, Gross Domestic Product by State. 5 June 2008. Bureau of Economic Analysis, U.S. Department of Commerce. Accessed 10 September 2008. http://www.bea.gov/bea/regional/gsp/action.cfm. Reid, J. Norman, and Thomas D. Rowley. Future Directions in Rural Development Policy. Findings and Recommendations of the National Commission on Agriculture and Rural Development Policy. December 1990. http://eric.ed.gov/ERICWebPortal/custom/portlets/recordDetails/detailmini.jsp?_nfpb=true&_&ERICExtSearch_SearchValue_0=ED331684&ERICExtSearch_SearchType_0=no&accno=ED331684.

101
Rosset, Peter. Overseas Rural Development Policy. January 1997. Foreign Policy in Focus. Accessed 24 September 2008. http://www.fpif.org/briefs/vol2/v2n7ove_body.html. Roth, Dennis; Anne B.W. Effland; and Douglas E. Bowers. Federal Rural Development Policy in the Twentieth Century. July 2008. Economic Research Service, U.S. Department of Agriculture. Accessed 24 September 2008. http://www.nal.usda.gov/ric/ricpubs/rural_development_policy.html. Rural America at a Glance. Economic Research Service, U.S. Department of Agriculture. October 2007. http://www.ers.usda.gov/. Rural Development. 15 October 2007. The Scottish Government. Accessed 18 September 2008. http://www.scotland.gov.uk/Topics/Rural/rural-policy/16780/6661. Rural Development. Organization for Economic Co-operation and Development. Accessed 18 September 2008. http://www.oecd.org/documentprint/0,3455,en_2649_34413_36878637_1_1_1_1,00.html. Rural Population Indicators for California, 2000. Economic Research Service, U.S. Department of Agriculture. http://www.ers.usda.gov/. Seed Grants. Economic Development Work Group, California Partnership for the San Joaquin Valley. Accessed 21 September 2008. http://www.sjvpartnership.org/wg_overview.php?wg_id=3. Shatz, Howard. Business without Borders: The Globalization of the California Economy. Public Policy Institute, 2003. Strategic Research for SEERAD. 27 June 2005. The Scottish Government. Accessed 18 September 2008. http://www.scotland.gov.uk/Publications/2005/01/20526/49996. "Synopsis of Public Policy Reports for State Government Investments." A Call to Action. California Economic Strategy Panel, December 2002. Top 20 and Bottom 20 Congressional Districts. American Human Development Index. n.d. http://www.measureofamerica.org. Trade Facts: California Manufacturing. National Association of Manufacturers, February 2010. www.manufacts.org.
Trade with Mexico and California Jobs, California Economic Policy (Public Policy Institute of California, Ellen Hanak and David Neumark, 2006) U.S. Census Bureau News, A Profile of U.S. Exporting Companies, 2003-2004. U.S. Department of Commerce, 2006.

102
Western Rural Development Center. Accessed 28 September 2008 http://wrdc.usu.edu/. Winter-Nelson, Alex. "Roles for State Government in International Trade." The Journal of Regional Analysis and Policy. 2007. University of Illinois at Urbana-Champaign.

103
End Notes
i http://www.dof.ca.gov/HTML/FS_DATA/LatestEconData/documents/BBRANK.XLS; California Department of Finance, 7/2011, accessed 10/24/11 ii http://www.calmis.ca.gov/file/ lfmonth/Calmr.pdf; California Employment Development Department, “California Labor Market Review, ” September 2011 accessed 10/24/11 iii http://www.dof.ca.gov/HTML/FS_DATA/LatestEconData/documents/BBRANK.XLS; California Department of Finance, 7/2011, accessed 10/24/11 iv http://siteresources.worldbank.org/DATASTATISTICS/Resources/GDP.pdf; World Bank, accessed 10/24/11 v http://www.realtytrac.com/ContentManagement/Library.aspx?ChannelID=9&ItemID=17763 The California Foreclosure Watch, 1/12/11, accessed 10/24/11- http://www.realtytrac.com/states/california.html, accessed 10/24/11 vi http://www.calmis.ca.gov/file/lfmonth/Calmr.pdf; California Employment Development Department, “California Labor Market Review, ” September 2011; accessed 10/24/11 vii http://uclaforecast.com/contents/archive/2011/media_92011_1.asp; UCLA Andersen Forecast September , 2011 Press Release, September , 2011, accessed 10/24/11 viii http://www.calmis.ca.gov/file/lfmonth/Calmr.pdf; California Employment Development Department, “California Labor Market Review, ” September 2011; accessed 09/26/11 ix http://www.calmis.ca.gov/file/lfmonth/Calmr.pdf; California Employment Development Department, “California Labor Market Review, ” September 2011; accessed 09/26/11 x http://www.calmis.ca.gov/file/lfmonth/Calmr.pdf; California Employment Development Department, “California Labor Market Review, ” September 2011; accessed 09/26/11 xi http://www.calmis.ca.gov/file/lfmonth/Calmr.pdf; California Employment Development Department, “California Labor Market Review, ” September 2011; accessed 09/26/11 xii http://www.calmis.ca.gov/file/lfmonth/Calmr.pdf; California Employment Development Department, “California Labor Market Review, ” September 2011; accessed 09/26/11 xiii http://www.calchamber.com/International/Trade/Pages/TradeStatistics.aspx ; CalChamber, “Trade Statistics” accessed 10/24/11 xiv http://www.calchamber.com/International/Pages/Default.aspx; Trade Statistics; accessed 10/24/11 xv http://www.calinst.org/bul2/b1821.shtml#TOC1_5 ; The California Institute for Federal Policy Research, “Trade: Deficit Grows To Highest Level In Three Years”; accessed 10/24/11 xvi http://www.trade.gov/mas/ian/statereports/states/tg_ian_002717.asp; International Trade Administration, U.S. Department of Commerce, “California: Exports, Jobs, and Foreign Investment”; accessed 10/24/11 xvii http://www.census.gov/foreign-trade/statistics/state/data/ca.html; CalChamber, Trade Statistics; accessed 10/24/11 xviii http://www.trade.gov/mas/ian/statereports/states/tg_ian_002717.asp; International Trade Administration, U.S. Department of Commerce, “California: Exports, Jobs, and Foreign Investment”; accessed 10/24/11 xix http://www.trade.gov/mas/ian/statereports/states/tg_ian_002717.asp; International Trade Administration, U.S. Department of Commerce, “California: Exports, Jobs, and Foreign Investment”; accessed 10/24/11 xx http://beaconecon.com/InternationalTrade/states.php?state=California; Beacon Economic, International Trade; accessed 10-24-2011 The October 2011 Fast Facts was prepared by Mercedes Flores xxi http://www.ofii.org/jobs/ca; Organization for International Investment, accessed 10/24/11 xxii http://www.ofii.org/jobs/ca; Organization for International Investment, accessed 10/24/11 xxiii http://www.ofii.org/jobs/ca; Organization for International Investment, accessed 10/24/11 xxiv http://energyalmanac.ca.gov/overview/energy_sources.html; California Energy Commission, “California's Major Sources of Energy Sources,” accessed 10/24/11 xxv http://energyalmanac.ca.gov/petroleum/statistics/crude_oil_receipts.html ; California Energy Commission, “Oil Supply Sources To California Refineries,” accessed 10/24/11 xxvi http://energyalmanac.ca.gov/electricity/system_power/2008_total_system_power.html ; California Energy Commission, “Total Electricity System Power” accessed 10/24/11 xxvii http://energyalmanac.ca.gov/overview/energy_sources.html; California Energy Commission, “California's Major Sources of Energy Sources,” accessed 10/24/11 xxviii http://energyalmanac.ca.gov/electricity/total_system_power.htm; California Energy Commission, “California's Major Sources of Energy Sources,” accessed 10/24/11 xxix http://energyalmanac.ca.gov/renewables/geothermal/index.html ; California Energy Commission, “California Geothermal Energy Statistics & Data,” accessed 10/24/11 xxx http://www.energy.ca.gov/wind/index.html ; California Energy Commission, “Wind Energy in California", accessed 10/24/11, xxxi http://www.energy.ca.gov/biomass/index.html ; California Energy Commission, “Waste to Energy (WTE) & Biomass in California,” accessed 10/24/11 xxxii http://energyalmanac.ca.gov/renewables/solar/index.html ; California Energy Commission, “California Solar Energy Statistics & Data,” accessed 10/24/11 xxxiii http://www.energyalmanac.ca.gov/petroleum/petroleum_watch/2011-07-15_Petroleum_Watch.pdf , California Energy Commission, “Petroleum Watch,” July 15, 2011, accessed 10/24/11 xxxiv http://www.energyalmanac.ca.gov/petroleum/petroleum_watch/2011-07-15_Petroleum_Watch.pdf , California Energy Commission, “Petroleum Watch,” July 15, 2011, accessed 10/24/11 xxxv http://www.milkeninstitute.org/tech/tech2010.taf; Milken Institute Science and Technology Index; January 2011; accessed 10/24/11

104
xxxvi http://www.uspto.gov/web/offices/ac/ido/oeip/taf/cst_all.pdf; Patents by Country/State and year, all patents, all types, January 1, 1977 to December 31, 2010, Updated March 2011; accessed 10/24/11 xxxvii http://www.gcx-online.com/gcx/article.asp?magarticle_id=653; Global Corporate Expansion, Economic Development Rankings-2008; accessed 10/24/11 xxxviii http://www.milkeninstitute.org/pdf/m2m2006_uni_tech.pdf; accessed 10/24/11 xxxix http://www.dof.ca.gov/HTML/FS_DATA/LatestEconData/documents/BBRANK.XLS; California Department of Finance, 11/18/10, Accessed 07/018/11 xl http://www.census.gov/foreign-trade/statistics/state/data/ca.html; State Exports for CALIFORNIA, 06/9/11, accessed 07/25/11 xli http://www.census.gov/foreign-trade/statistics/state/data/imports/ca.html, 06/9/11, accessed 07/25/11 xlii http://www.census.gov/foreign-trade/statistics/state/data/imports/tx.html; State Exports for TEXAS , 06/9/11, accessed 07/25/11 xliii http://www.trade.gov/mas/ian/statereports/states/tg_ian_002717.asp; California: Exports, Jobs, and Foreign Investment; June 2011, accessed 07/26/11 xliv http://www.census.gov/foreign-trade/statistics/state/data/ca.html#com; State Exports for CALIFORNIA, 06/9/11, accessed 07/25/11 xlv State Exports by NAICS Commodities; USATradeOnline, accessed 07/28/11 xlvi http://www.census.gov/foreign-trade/statistics/state/data/imports/ca.html; State Imports for CALIFORNIA xlvii State Imports by NAICS Commodities; USATradeOnline, accessed 07/28/11 xlviii http://laedc.org/newsroom/pdf/TradeOutlookReport.pdf; International Trade Trends, The Southern California Region 2010 Review and 2011 Outlook; accessed 07/25/11 xlix http://www.trade.gov/mas/ian/statereports/states/tg_ian_002717.asp; California: Exports, Jobs, and Foreign Investment; June 2011, 07/26/11 lhttp://www.trade.gov/mas/ian/statereports/states/tg_ian_002717.asp; California: Exports, Jobs, and Foreign Investment; June 2011, 07/26/11 li http://www.trade.gov/mas/ian/statereports/states/tg_ian_002717.asp; California: Exports, Jobs, and Foreign Investment; June 2011, 07/26/11 lii http://www.trade.gov/mas/ian/smeoutlook/tg_ian_001925.asp; Small and Medium-Sized Exporting Companies: Statistical Overview, 2009; accessed 8/18/11 liii http://trade.gov/cs/factsheet.asp; Exporting is Good For Your Bottom Line, accessed 07/24/11 liv http://trade.gov/fta/; Free Trade Agreements; accessed 7/24/11 lv http://trade.gov/fta/; Free Trade Agreements; ; accessed 7/24/11 lvi http://trade.gov/fta/korea/california.pdf; Benefits form the U.S.-Korea Trade Agreement, February 2011, accessed 7/24/11 lvii http://www.epi.org/publications/entry/trade_policy_and_job_loss/; Trade policy and job loss, February 2010, accessed 08/2/11 lviii http://laedc.org/newsroom/pdf/TradeOutlookReport.pdf; International Trade Trends, The Southern California Region 2010 Review and 2011 Outlook; accessed 07/25/11 lix www.whitehouse.gov/sites/default/files/nei_report_091510_extended.pdf; Report to the President of the National Export Initiative, September 2010, accessed 07/26/11 lx http://laedc.org/newsroom/pdf/TradeOutlookReport.pdf; International Trade Trends, The Southern California Region 2010 Review and 2011 Outlook; accessed 07/25/11 lxi http://laedc.org/newsroom/pdf/TradeOutlookReport.pdf; International Trade Trends, The Southern California Region 2010 Review and 2011 Outlook; accessed 07/25/11 lxii http://laedc.org/newsroom/pdf/TradeOutlookReport.pdf; International Trade Trends, The Southern California Region 2010 Review and 2011 Outlook; accessed 07/25/11 lxiii Report: Assessable Tonnage, Area: Southern California, By Year; Pacific Maritime Association - Research Department, accessed 8/1/11 lxiv http://www.co.imperial.ca.us/IVAG/ProjectBriefs/IVAG%20Final%20Report.pdf; Imperial Valley – Mexicali Economic Delay Study; November 2007, accessed 8/1/2011 lxv http://www.co.imperial.ca.us/IVAG/ProjectBriefs/IVAG%20Final%20Report.pdf; Imperial Valley – Mexicali Economic Delay Study; November 2007, accessed 8/1/2011 lxvi http://www.co.imperial.ca.us/IVAG/ProjectBriefs/IVAG%20Final%20Report.pdf; Imperial Valley – Mexicali Economic Delay Study; November 2007, accessed 8/1/2011 lxvii http://www.internationaltransportforum.org/jtrc/discussionpapers/DP200808.pdf; The Impact of Hinterland Access Conditions on Rivalry between Ports; February 2008; accessed 8/3/11 lxviii Mexico Infrastructure Report Q2 2011; Business Monitor International Ltd.; accessed 8/3/2011 lxix Mexico Infrastructure Report Q2 2011; Business Monitor International Ltd.; accessed 8/3/2011 lxx http://www.portno.com/pdfs/PNO%20Master%20Plan.pdf; Charting the Future of the Port of New Orleans; June 2008, accessed 8/3/11 lxxi http://www.whitehouse.gov/sites/default/files/microsites/cea_fdi_report.pdf; U.S. Inbound Foreign Direct Investment; June 2011; accessed 8/8/2011

105
lxxii http://www.whitehouse.gov/sites/default/files/microsites/cea_fdi_report.pdf; U.S. Inbound Foreign Direct Investment; June 2011; accessed 8/8/2011 lxxiii http://www.trade.gov/mas/ian/statereports/states/tg_ian_002717.asp; California: Exports, Jobs, and Foreign Investment; June 2011, accessed 07/26/11 lxxiv http://www.bea.gov/international/xls/mousa_all_employ_state_ctry.xls; Employment of Majority-Owned U.S. Affiliates, State; accessed 8/8/2011 lxxv http://www.laedc.org/reports/FDI-2009.pdf; Foreign Direct Investment in Los Angeles County; May 2009; accessed 8/8/2011 lxxvi “The Economic Impact of the Mexico-California Relationship”; The Tomas Rivera Policy Institute, September 2005– http://www.ime.gob.mx/ime2/aportaciones/california.pdf; accessed 8-20-11 lxxvii “World Fact Book: Mexico, United States Central Intelligence Agency, https://www.cia.gov/library/publications/the-world-factbook/index.html – accessed 8-20-11 lxxviii California Department of Finance, Demographic Research Unit http://www.dof.ca.gov/HTML/DEMOGRAP/SF%201/RaceCA.pdf lxxix Baja Border a "Fronteriza" Culture and Marketplace http://www.mexicomatters.net/businessmexico/05_fronterizacultureandmarketplace.php – accessed 8-29-2011 lxxx Baja Border a "Fronteriza" Culture and Marketplace http://www.mexicomatters.net/businessmexico/05_fronterizacultureandmarketplace.php – accessed 8-29-2011 lxxxi “U.S. Census" http://www.census.gov/newsroom/releases/archives/facts_for_features_special_editions/cb09-ff08.html; – accessed 8-30-11 lxxxii Bureau of Economic Analysis, Gross State Product, www.bea.gov/bea/regional/gsp/ – accessed 8-29-2011 lxxxiii http://www.dof.ca.gov/HTML/FS_DATA/LatestEconData/documents/BBRANK.XLS; California Department of Finance, 11/18/10, accessed 8-29-2011 lxxxiv "Background Note: Mexico", Bureau of Western Hemisphere Affairs, United States Department of State, http://www.state.gov/r/pa/ei/bgn/35749.htm;– accessed 8-29-2011 lxxxv “"California: Exports, Jobs, and Foreign Investment", Office of Trade and Industry Information, International Trade Administration, U.S. Department of Commerce, August 2011. See http://www.ita.doc.gov/td/industry/otea/state_reports/california.html lxxxvi "ITA Free Trade Agreements http://www.trade.gov/fta/index.asp; accessed 7/24/11 lxxxvii "Agreements and Negotiations", Embassy of Mexico in Canada; http://www.embamexcan.com/ECONOMY/internationaltrade.shtml lxxxviii World Fact Book: Mexico, United States Central Intelligence Agency, https://www.cia.gov/library/publications/the-world-factbook/index.html – accessed 8-20-11 lxxxix "California: Exports, Jobs, and Foreign Investment", Office of Trade and Industry Information, International Trade Administration, U.S. Department of Commerce, August 2011. See http://www.ita.doc.gov/td/industry/otea/state_reports/california.html xc "California: Exports, Jobs, and Foreign Investment", Office of Trade and Industry Information, International Trade Administration, U.S. Department of Commerce, August 2011. See http://www.ita.doc.gov/td/industry/otea/state_reports/california.html xci “The Economic Impact of the Mexico-California Relationship”; The Tomas Rivera Policy Institute, September 2005 – http://www.ime.gob.mx/ime2/aportaciones/california.pdf; accessed 8-29-2011 xcii “The Economic Impact of the Mexico-California Relationship”; The Tomas Rivera Policy Institute, September 2005 –http://www.ime.gob.mx/ime2/aportaciones/california.pdf; accessed 8-29-2011 xciii "California: Exports, Jobs, and Foreign Investment", Office of Trade and Industry Information, International Trade Administration, U.S. Department of Commerce, April 2011. See http://www.ita.doc.gov/td/industry/otea/state_reports/california.html See also, California Chamber of Commerce: www.calchamber.com. xciv “The Economic Impact of the Mexico-California Relationship”; The Tomas Rivera Policy Institute, http://www.state.gov/r/pa/ei/bgn/35749.htm; – accessed 8-29-2011 xcv "State Export Data", Trade Stats Express; http://tse.export.gov/ ; accessed 8-29-2011 xcvi "The Emerging Integration of the California-Mexico Economies"; Public Policy Institute of California, August 2004–http://www.ppic.org/content/pubs/report/R_804HSR.pdf; accessed 8-29-2011 xcvii http://www.co.imperial.ca.us/IVAG/ProjectBriefs/IVAG%20Final%20Report.pdf; Imperial Valley – Mexicali Economic Delay Study; November 2007, accessed 8/1/2011 xcviii http://www.co.imperial.ca.us/IVAG/ProjectBriefs/IVAG%20Final%20Report.pdf; Imperial Valley – Mexicali Economic Delay Study; November 2007, accessed 8/1/2011 Prepared on August 29, 2011 xcixhttp://www.labormarketinfo.edd.ca.gov/cgi/databrowsing/localAreaProfileQSResults.asp?selectedarea=Imperial+County&selectedindex=13&menuChoice=localAreaPro&state=true&geogArea=0604000025&countyName=; accessed 6/23/11 c http://quickfacts.census.gov/qfd/states/06/06025.html; accessed 6/22/11 ci http://mapzones.org/Imperial_County_California.html; accessed 6/24/11 cii http://www.dof.ca.gov/research/demographic/state_census_data_center/census_2010/documents/DP2010-Imperial_County.pdf; accessed 6/22/11

106
ciii http://quickfacts.census.gov/qfd/states/06/06025.html; accessed 6/22/11 civ http://factfinder.census.gov/servlet/ADPTable?_bm=y&-context=adp&-ds_name=ACS_2009_1YR_G00_&-tree_id=309&-redoLog=true&-_caller=geoselect&-geo_id=05000US06025&-format=&-_lang=en; accessed 6/22/11 cv http://www.dof.ca.gov/research/demographic/state_census_data_center/census_2010/documents/DP2010-Imperial_County.pdf; accessed 6/22/11 cvi http://factfinder.census.gov/servlet/ADPTable?_bm=y&-context=adp&-ds_name=ACS_2009_1YR_G00_&-tree_id=309&-redoLog=true&-_caller=geoselect&-geo_id=05000US06025&-format=&-_lang=en; accessed 6/22/11 cvii http://www.dof.ca.gov/research/demographic/state_census_data_center/census_2010/documents/DP2010-Imperial_County.pdf; accessed 6/22/11 cviii http://www.census.gov/cgi-bin/saipe/saipe.cgi?year=2009&type=county&table=county&submit=States%20%26%20Counties&display_data=Display%20Data&state=06&areas=06025; accessed 6/24/11 cix http://factfinder.census.gov/servlet/STTable?_bm=y&-geo_id=05000US06025&-qr_name=ACS_2009_5YR_G00_S2507&-context=st&-ds_name=ACS_2009_5YR_G00_&-tree_id=5309&-redoLog=false&-format=; accessed 6/24/11 cx http://www.census.gov/cgi-bin/saipe/saipe.cgi?year=2009&type=county&table=county&submit=States%20%26%20Counties&display_data=Display%20Data&state=06&areas=06025; accessed 6/24/11 cxihttp://www.labormarketinfo.edd.ca.gov/cgi/databrowsing/localAreaProfileQSResults.asp?selectedarea=Imperial+County&selectedindex=13&menuChoice=localAreaPro&state=true&geogArea=0604000025&countyName= cxiihttp://www.labormarketinfo.edd.ca.gov/cgi/databrowsing/localAreaProfileQSResults.asp?selectedarea=Imperial+County&selectedindex=13&menuChoice=localAreaPro&state=true&geogArea=0604000025&countyName= cxiii http://www.dot.ca.gov/hq/tpp/offices/ote/socio_economic_files/2010/Imperial.pdf; accessed 6/24/11 cxivhttp://www.labormarketinfo.edd.ca.gov/cgi/databrowsing/localAreaProfileQSResults.asp?selectedarea=Imperial+County&selectedindex=13&menuChoice=localAreaPro&state=true&geogArea=0604000025&countyName=; accessed 6/23/2011 cxvhttp://www.labormarketinfo.edd.ca.gov/cgi/databrowsing/localAreaProfileQSMoreResult.asp?menuChoice=localAreaPro&criteria=Unemployment+Rate&categoryType=employment&geogArea=0601000000&more=More+Areas; accessed 6/28/11 cxvihttp://www.labormarketinfo.edd.ca.gov/cgi/databrowsing/localAreaProfileQSResults.asp?selectedarea=Imperial+County&selectedindex=13&menuChoice=localAreaPro&state=true&geogArea=0604000025&countyName=; accessed 6/23/2011 cxvii http://quickfacts.census.gov/qfd/states/06/06025.html; accessed 6/22/2011 cxviii http://factfinder.census.gov/servlet/IBQTable?_bm=y&-ds_name=CB0800A1&-geo_id=05000US06025; accessed 6/24/11 cxix http://www.dot.ca.gov/hq/tpp/offices/ote/socio_economic_files/2010/Imperial.pdf; accessed 6/24/11 cxx http://quickfacts.census.gov/qfd/states/06/06025.html; accessed 6/22/2011 cxxi http://www.dof.ca.gov/research/demographic/state_census_data_center/census_2010/documents/DP2010-Imperial_County.pdf; accessed 6/22/11 cxxiihttp://factfinder.census.gov/servlet/STTable?_bm=y&-geo_id=05000US06025&-qr_name=ACS_2009_5YR_G00_S2506&-context=st&-ds_name=ACS_2009_5YR_G00_&-tree_id=5309&-redoLog=false&-format= cxxiii http://quickfacts.census.gov/qfd/states/06/06025.html; accessed 6/22/11 cxxivhttp://www.labormarketinfo.edd.ca.gov/cgi/databrowsing/localAreaProfileQSResults.asp?selectedarea=Imperial+County&selectedindex=13&menuChoice=localAreaPro&state=true&geogArea=0604000025&countyName=; accessed 6/23/11 cxxv http://factfinder.census.gov/servlet/STTable?_bm=y&-geo_id=05000US06025&-qr_name=ACS_2009_5YR_G00_S2506&-context=st&-ds_name=ACS_2009_5YR_G00_&-tree_id=5309&-redoLog=false&-format= cxxvihttp://www.ceres.ca.gov/geo_area/counties/Imperial/conditions.html; accessed 6/27/11 cxxvii http://tmdl.ucdavis.edu/Water_Quality_FAQs.htm; accessed 6/27/11 cxxviii http://tmdl.ucdavis.edu/Water_Quality_FAQs.htm; accessed 6/27/11 cxxix http://www.npr.org/templates/story/story.php?storyId=102679730; accessed 6/22/11