economic policy institute invest in children paper
TRANSCRIPT
It’s time for an ambitiousnational investment inAmerica’s childrenInvestments in early childhood care and educationwould have enormous benefits for children, families,society, and the economy
Report • By Josh Bivens, Emma García, Elise Gould, Elaine Weiss, and Valerie Wilson • April 6, 2016
Summary: An ambitious national investment in early childhood care and education wouldprovide high societal returns. American productivity would improve with a better-educated and healthier future workforce, inequality would be immediately reduced asresources to provide quality child care are progressively made available to families withchildren, and the next generation would benefit from a more level playing field thatallows for real equality of opportunity.
• Washington, DC View this report at epi.org/101151

SECTIONS
1. Introduction and keyfindings • 1
2. Benefits stemmingfrom directinvestments inchildhooddevelopment • 5
3. Benefits stemmingfrom increased in-kindresources to familieswith children • 13
4. Benefits stemmingfrom parents’increased labor forceparticipation • 16
5. Benefits stemmingfromprofessionalization ofthe child careworkforce • 20
6. The status quo inAmerican child care,and policy efforts tohelp • 23
7. Conclusion • 31
About the authors • 32
Endnotes • 33
References • 34
Introduction and keyfindingsNearly 7 years into the recovery from the Great Recession,two glaring problems remain in the U.S. economy. One is asignificant slowdown in the growth of productivity (theamount of output and income generated in an averagehour of work). The other is the destructive rise in incomeinequality in recent decades due largely to bigcorporations and the wealthy rewriting the rules of theeconomy to stack the deck in their favor. This inequalityhas prevented the fruits of productivity growth from“trickling down” to reach most households—and hasundermined the ideal of providing genuinely equalopportunity for all.
Ameliorating these two problems should be policymakers’core focus. One way to address both issues—one thatwould spur myriad other benefits to American families—isinvesting ambitiously in our country’s children. Theseinvestments should include (but not necessarily be limitedto):
Expanding public funding for home visits by trainednurses to help expectant parents make healthychoices both before and after childbirth.
Providing resources necessary to ensure all familiescan access high-quality child care with well-trained,professional staff qualified to provide early childhoodeducation. High-quality programs will aim to nurturechildren’s cognitive and socioemotional developmentand allow all children to enter their formal schoolingyears at comparable levels of preparedness.
Providing resources to ensure the professionalizationof early childhood caregivers and teachers. Thismeans providing enough resources to attract andretain well-credentialed staff and to close earningsgaps between early childhood workers and otherworkers with similar skills and credentials (includingK–12 teachers).
There are many models of successful widespreadimplementation of these types of investments, andresearch clearly demonstrates such investments wouldprovide high societal returns. American productivity would
1
improve with a better-educated and healthier future workforce, inequality would beimmediately reduced as resources to provide quality child care are progressively madeavailable to families with children, and the next generation would benefit from a more levelplaying field that allows for real equality of opportunity. What is missing is the political willto provide these resources to all American families.
This report reviews the evidence on why a major investment in America’s children is sucha promising economic strategy that can provide substantial social benefits—and thatwould more than pay for itself over time. It highlights four particular tranches of benefits:
1. Benefits that stem from having more resources invested in the care and education ofchildren in their early years
The benefits accruing directly to the children receiving greater care and educationalresources are large and progressive, as higher-income families are much more likely toalready be able to afford high-quality child care and educational opportunities. Thebenefits stemming from greater investments in children are also universal, leading to anincreasingly productive workforce that will boost economic growth, provide budgetarysavings at the state and federal levels, and lead to reductions in future generations’involvement with the criminal justice system. These benefits will, of course, materializeonly in coming decades when today’s children have grown up. But the research is clearthat they will materialize—and when they do, they are permanent.
One section of this paper will review the research on the potential payoff from this trancheof benefits. Key findings from this section include:
Achievement gaps between American students in different income classes, andbetween students of different races and ethnicities, appear before kindergartenbegins, and sometimes peak at ages 5 and 6. This means early childhood care andeducation (ECCE) has a potentially large role in shaping these gaps.
According to McKinsey researchers, the potential benefits to closing educationalachievement gaps between students of different income classes total nearly $70billion annually. The same researchers have further estimated that the payoff toreducing average test score gaps between American students and students in better-performing national school systems stands at nearly $180 billion annually.
High-income families spend much more on child enrichment activities than do low-income families—and the gap has grown over time. For example, in 1970 the spendinggap between the highest and lowest household income fifths was roughly $2,700. By2006, it had grown to $7,500.
Gaps in the absolute level of investments in children’s enrichment activities by incomeclass have grown substantially over time, even as lower-income householdsincreased their spending on these activities at a more rapid clip when measured asa share of income. In essence, lower-income households are making a greaterinvestment effort, but the rise in income inequality has allowed higher-incomehouseholds to pull away even without increasing the share of income they devote tochildren’s enrichment.
2

The gaps in parental investment are firmly linked to achievement gaps in youngchildren. Parental involvement in enrichment activities is a significant positivedeterminant of test score achievement. This provides a clear lever for ECCEinvestments that free up resources (including parental time) to make a major dent inachievement gaps.
A solid research base has identified major benefits from specific ECCE interventions.For infants and very young children, programs that send nurses to pregnant mothersand mothers of infants to provide parenting advice and health monitoring have beenlinked to better scholastic achievement and later life outcomes for children. Incountries that have provided subsidies for high-quality very early child care, similarimprovements in children’s academic and later life achievement have beendocumented.
2. Benefits that stem from providing resources directly to families with young childrento help them afford early child care and pre-kindergarten
Because early child care and education are huge expenses for nearly all families withyoung children, the case for providing subsidies for quality child care and educationseems strong. This case is strengthened by the fact that such investments would paydividends down the road in addition to immediately improving families’ living standards.And the direct economic benefits of providing such in-kind aid and removing a portion ofchild development costs from family budgets can be considerable.
One section of this paper will look at a number of family archetypes (say, a family earningthe median income with a given number of children) to see how much subsidies that capout-of-pocket child care expenses at 10 percent of family income would boost thesefamilies’ post-subsidy income. Key findings from this section include:
For a family that had an infant and a pre-kindergarten-age child and that earned thestate median income for families with children, the median benefit from such a reformwould be about $11,000 (received by families in Florida).
For a family that had an infant and a pre-kindergarten-age child and that earned justhalf the state median for families with children, the median state benefit would beabout $16,000 (received by families in Kansas).
3. Benefits that stem from increasing labor force participation by parents (mostlymothers) of young children
A prime impediment to a career for families with young children is a lack of high-qualitychild care possibilities. And it’s an unfortunate fact of culture, history, and past policydecisions that this curtails women’s labor force opportunities to a much greater degreethan men’s. The benefits of boosting women’s labor force participation through theprovision of more and better child care access and affordability are potentially enormous.Women are, of course, half of the potential workforce, and each 1 percent boost in theoverall workforce increases total national income by 1 percent, or roughly $180 billion.
3
One section of this paper will look at trends in women’s labor force participation andprovide illustrative calculations of how much an ambitious investment in America’s childrencould pay off in terms of greater labor force participation and national income. Key findingsfrom this section include:
If women’s labor force participation in the United States matched that of America’sinternational peers, the potential gains to gross domestic product (GDP) could beenormous—up to $600 billion annually.
Providing affordable, high-quality child care should be a core component of anystrategy to boost women’s labor force participation. An investment that capped childcare expenditures at 10 percent of family income could increase overall women’slabor force participation enough to boost GDP by roughly $210 billion (or 1.2 percent).
The additional tax revenue and reduced public outlays associated with higher GDPstemming from higher women’s labor force participation could provide roughly $70billion in economic resources to governments to help finance the investment in ECCE.
4. Benefits that stem from the professionalization of the child care workforce
Currently, providing early child care in the United States is low-wage work. This is largelybecause the workforce lacks meaningful labor standards and protections. Further, evenwith its current low-wage workforce, the cost of early child care and development is largerelative to the budgets of typical American families, principally because this work is labor-intensive and there is little scope for traditional strategies to lower costs without sacrificingquality. To put it simply, while crowding more and more children into each room with acaregiver and teacher would normally register in economic statistics as a productivityimprovement, this is clearly not a serious strategy for improving early childhood care anddevelopment.
By providing incentives to boost pay and training for early child care providers, a majorinvestment in America’s children would also lift wages in this key economic sector. Many ofthese gains would accrue to the workers themselves, but the higher-quality workforce thatwould result from attracting and retaining more and better job seekers and incentivizingtraining would also result in higher-quality care. A key strategy for retention will be closingthe wage penalty that currently exists between early child care and development workersand workers in other sectors with similar skills and credentials (including teachers in theK–12 sector).
One section of this paper will examine the characteristics of the child care workforce, andwill calculate the wage gains that would accompany policies leading to a better-trainedand better-paid early child care workforce. Key findings from this section include:
The current U.S. child care workforce is strikingly low-paid and lacks bargainingpower to boost their pay and raise standards in the profession. In 2014, for example,the median wage of child care workers was $10.31, or 39.3 percent below the medianin other occupations.
4

The low pay of child care workers and the low level of investment in their training arebarriers to providing high-quality child care. Well-compensated employees andinvestment in staff are key contributors to the most successful ECCE strategies.
Outline of following sectionsThe following four sections examine the economic evidence and logic behind each of thefour tranches of benefits that investments in ECCE provide. This is followed by anoverview of the American status quo of helping families with children obtain access toquality child care. It finds that while a number of different policies and programs aim tohelp American families along these lines, these efforts fall short in terms of affordability,access, and quality. This highlights the need for a major investment in America’s childrenthat could realize the potential benefits we identify.
Benefits stemming from directinvestments in childhood developmentThe largest and most enduring benefits of a major investment in childhood care anddevelopment are those stemming from its direct impact on children. The evidence is clear:Children with better early childhood care and educational opportunities grow up to bemore likely to work and less likely to interact with the criminal justice system. They growup in better health and earn higher wages. They pay more taxes and draw on fewergovernment resources. While many of these benefits only become apparent once the firstwave of children enter adulthood, these benefits are large—and they persist and grow insuccessive generations so long as the investment effort is maintained.
Lynch and Vaghul (2015), for example, review evidence on the economic benefits from amajor investment that would provide universal high-quality pre-kindergarten education toall American 3- and 4-year-olds. Over a 34-year window (between 2016 and 2050), theyestimate annual benefits from this investment would total roughly $10 billion.
It is important to note that even these large benefits still leave many potential benefits onthe table. The full potential economic payoff from a major investment in America’s childrenwould occur if achievement gaps were eliminated between American students of differentincome classes, or different races and ethnicities, or even between average Americanstudents and students in higher-performing national educational systems in otheradvanced economies. McKinsey (2009) has estimated that closing achievement gapsbetween low-income students and others would boost GDP by roughly $70billion annually. They further estimate that closing achievement gaps that persist betweenstudents of different races and ethnicities would boost GDP by roughly $50 billionannually. Further, if a major investment in America’s children also boostedthe average performance of American students, payoffs would be even larger. Forexample, McKinsey (2009) estimates that closing the gap in average educational
5

achievement between American students and students in higher-performing nationaleducational systems could boost U.S. GDP by roughly $180 billion annually.
The Lynch and Vaghul (2015) and McKinsey (2009) estimates together indicate that justone major component (high-quality pre-kindergarten for 3- and 4-year-olds) of anambitious investment effort in America’s children could potentially provide a payoffequivalent to eliminating over a tenth of the achievement gap between students ofdifferent income classes. This indicates, among other things, that we should not restrictour investment effort in childhood development and education to any one strand ofinterventions, but should instead pursue an ambitious and varied portfolio of policies.
The benefits stemming from various features of such an investment strategy are notspeculative. The research base identifying the economic benefits of early childhood careand education programs (ECCE) is large and unequivocal: Public investments in theseprograms produce significant net societal returns, with benefits far exceeding costs(Barnett and Nores 2015; Rolnick and Grunewald 2003; Council of Economic Advisers2014). The precise magnitude of these net returns is obviously a function of the specificintervention type, as ECCE encompasses a range of programs and services. For example,ECCE can include child care in its many forms (from in-home care with a relative, toprofessional in-home care, to center-based care), nurse home visiting programs, parentingprograms, and nutrition and health-oriented interventions.1 ECCE can also include earlychild education programs (e.g., Early Head Start, EDUCARE) as well as preschool programs(e.g., center-based education programs for 3- and 4-year-olds, including state- and/orlocally funded programs, and the federal Head Start program).2
Benefits of high-quality early child careBenefits to children stemming solely from enhanced access to quality early child care havenot been translated into monetary terms as often as have benefits stemming fromexpanded early childhood education. As is discussed in the next section, evidence clearlyshows the latter would have large positive societal effects. A less-robust but stillconvincing body of research suggests expanding access to early child care may also havepotentially large positive impacts.
To understand why, it is crucial to note that the previously discussed income-basedachievement gaps are present even before children enter kindergarten. Figure A showsgaps in a number of average measures of achievement and school readiness amongkindergarteners of different socioeconomic statuses. The figure shows test results fromassessments of math and reading as well as teacher-reported summaries of “persistencein completing tasks.” Each assessment is measured relative to the bottom socioeconomicstatus fifth, and in all cases achievement and school readiness rise steadily associoeconomic status rises.
Perhaps even more strikingly, there is very little movement thereafter in achievement gapsacross income groups relative to the size of these initial gaps that appear inkindergarten. Figure B replicates a figure used in a recent report by the Council of
6

Figure A Achievement gaps rooted in socioeconomic statusexist when children enter kindergartenAchievement at the beginning of kindergarten, secondthrough fifth socioeconomic quintiles as compared withlowest quintile
Note: SES refers to socioeconomic status. Bars show the adjusted standard deviation score for eachsocioeconomic group, relative to low-SES children.
Source: EPI analysis of ECLS-K, Kindergarten Class of 2010–2011 (National Center for Education Statis-tics)
Variables(measuredin standarddeviations ) Reading Math
Persistencein
completingtasks (asreported
byteachers)
Low-middleSES
0.167 0.153 0.116
Middle SES 0.345 0.372 0.177
High-middleSES
0.555 0.539 0.346
High SES 0.784 0.761 0.422
Stan
dard
dev
iatio
ns
0.17
0.35
0.56
0.78
0.15
0.37
0.54
0.76
0.12
0.18
0.35
0.42
ReadingMathPersistence in completing tasks (as reported by teachers)
Low-middle SES Middle SES High-middleSES
High SES0
0.2
0.4
0.6
0.8
1
Economic Advisers (2014) showing measures of IQ scores through age 8 and measures ofmath test scores after age 8 for children from families in the highest and lowest incomequartiles. The IQ gaps essentially peak in kindergarten, and math test score gaps arenearly stable over most of the years between ages 8 and 14. The clear implication is thatthe income-based achievement gaps highlighted in Figure A tend to persist throughoutchildhood—highlighting again just how crucial early childhood education and developmentare.
These achievement gaps are mirrored in gaps in different income classes’ parentalinvestment of time and money on childhood development. For example, the Council ofEconomic Advisers (2014) documented that both mothers and fathers in high-incomefamilies spent substantially more time engaged in educational activities with their children.
7

Figure B Achievement gap is largely set by age 5IQ/test scores in standard deviations, by parent incomequartile
Note: IQ scores are available through age 8. After age 8, math test scores are shown. A 3-year movingaverage is used for math scores.
Source: Adapted from Council of Economic Advisers (2014)
Age
Parentincome
inlowestquartile
Quartile1
Parentincome
inhighestquartile
Parentincome
inhighestquartile
0 -0.1206 0.033147
1
2
3
4 -0.28939 0.486972
5 -0.42535 0.53804
6
7 -0.32933 0.485797
8 -0.39463 -0.41495 0.432994 0.361795
9 -0.40094 0.286091
10 -0.44016 0.321102
11 -0.32139 0.360868
12 -0.37427 0.424476
13 -0.32371 0.398653
14 -0.42176 0.41377
Sco
re (i
n st
anda
rd d
evia
tions
)
Age (years)
Parent income in lowest quartileParent income in highest quartile
-0.5
0
0.5
1
0 1 2 3 4 5 6 7 8 9 10 11 12 13 14
Garcia (2015) shows that such enrichment activities with parents are positively associatedwith greater cognitive and non-cognitive achievement in kindergarteners.
The extent to which higher-income parents are increasingly able to invest more money ineducational and enrichment activities is depicted in Figure C, which uses data fromDuncan and Murnane (2011). It shows that the spending gap between the highest andlowest household income fifths widened from about $2,700 in 1970 to roughly $7,500 by2006. One of the most distressing aspects of this large and growing gap is that it haswidened even as lower-income families have increased the share of income devoted tothese expenditures much more rapidly than higher-income families. Essentially, families inthe lowest income classes have increased their investment effort in childhooddevelopment more rapidly than families with higher incomes. But because increasingincome inequality has channeled so much more money to these higher-income families,the absolute level of resources devoted to children has become increasingly unequal.
In short, gaps that appear in kindergarten—and which are hence (at least in part) the resultof investments in very young children’s development—tend to persist throughoutchildren’s lives. Thus, if we want to reap the enormous potential benefits of closingincome-based achievement gaps, we need to equalize resources available to youngchildren even before they begin traditional elementary school.
8
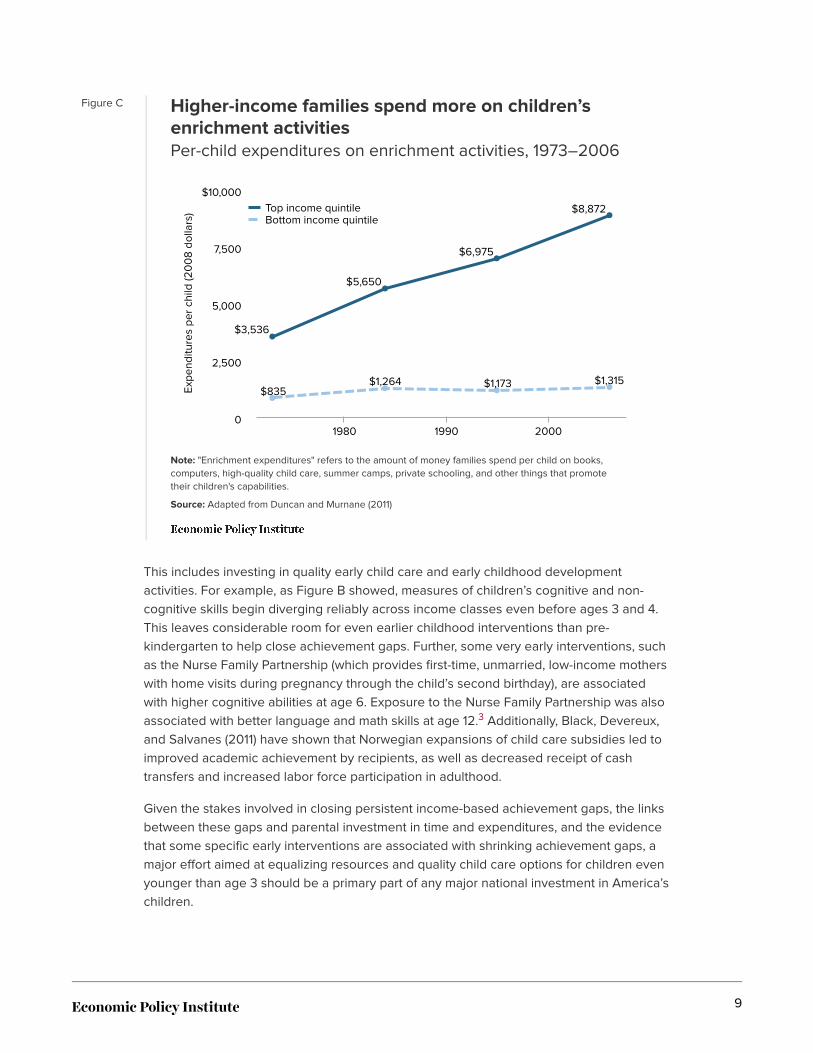
Figure C Higher-income families spend more on children’senrichment activitiesPer-child expenditures on enrichment activities, 1973–2006
Note: "Enrichment expenditures" refers to the amount of money families spend per child on books,computers, high-quality child care, summer camps, private schooling, and other things that promotetheir children's capabilities.
Source: Adapted from Duncan and Murnane (2011)
Topincomequintile
Bottomincomequintile
1973 $3,536 $835
1984 $5,650 $1,264
1995 $6,975 $1,173
2006 $8,872 $1,315
Expe
nditu
res
per
child
(20
08
dol
lars
)
$3,536
$5,650
$6,975
$8,872
$835$1,264 $1,173 $1,315
Top income quintileBottom income quintile
1980 1990 20000
2,500
5,000
7,500
$10,000
This includes investing in quality early child care and early childhood developmentactivities. For example, as Figure B showed, measures of children’s cognitive and non-cognitive skills begin diverging reliably across income classes even before ages 3 and 4.This leaves considerable room for even earlier childhood interventions than pre-kindergarten to help close achievement gaps. Further, some very early interventions, suchas the Nurse Family Partnership (which provides first-time, unmarried, low-income motherswith home visits during pregnancy through the child’s second birthday), are associatedwith higher cognitive abilities at age 6. Exposure to the Nurse Family Partnership was alsoassociated with better language and math skills at age 12.3 Additionally, Black, Devereux,and Salvanes (2011) have shown that Norwegian expansions of child care subsidies led toimproved academic achievement by recipients, as well as decreased receipt of cashtransfers and increased labor force participation in adulthood.
Given the stakes involved in closing persistent income-based achievement gaps, the linksbetween these gaps and parental investment in time and expenditures, and the evidencethat some specific early interventions are associated with shrinking achievement gaps, amajor effort aimed at equalizing resources and quality child care options for children evenyounger than age 3 should be a primary part of any major national investment in America’schildren.
9

Benefits of early childhood education (ECE)programsAs noted above, the estimated benefits of ECE investments are exceptionally large—andthe research supporting this conclusion is robust. The benefits primarily stem from howthese investments would equalize resources among children of different income classes.As such, they would unambiguously boost economic and educational mobility. A trulyambitious investment in America’s children could also conceivably raise the average levelof educational achievement, and not just close achievements gaps without lifting thisaverage. But most of the benefits would still accrue to children who are relativelyresource-deprived, thereby enhancing their economic mobility.
Benefits to student achievement
Because the most immediately recognizable benefit conferred by participation in high-quality early childhood education is a gain in standardized-test scores, these are widelymeasured in studies of several such programs.
How results are described in this section
The easiest way to compare results of ECE programs across studies is to scalethe benefits in terms of standard deviation increases associated withparticipation. This is because the outcome variable in most of these studies is notthe same; different studies examine student achievement on different tests. Wecan compare results among different tests by translating findings into standarddeviations. This measure shows the test score increase associated with variousinterventions as a share of the typical variance among scores. In the realm of testscores, one standard deviation is an enormous difference. For example, thestandard deviation of 2014 college-bound seniors’ SAT scores was 322 (CollegeBoard 2015). A gain of this magnitude would move a test-taker’s score from themedian (about 1490) to the 82nd percentile (about 1810).
Two major meta-analyses provide conclusive evidence that high-quality early childhoodeducation is associated with improved test scores. One study (Camilli et al. 2010)examined over 120 U.S. studies since 1960 and found consistent evidence that havingparticipated in preschool the year prior to entering kindergarten was associated with largepositive effects (0.23 standard deviations) on cognitive outcomes. Another study (Duncanand Magnuson 2013) suggests even larger effects, with early childhood educationassociated with score gains of 0.35 standard deviations.
Preschool also positively affects school progress (with an effect size of 0.156 standarddeviations, according to Camilli et al. 2010), reduces special education placement andgrade repetition, and increases high school graduation rates and post-secondaryeducational attainment (Barnett 2008). In addition to gains in traditional cognitive areas,preschool has also been found to improve social development (with an effect size of 0.137
10

standard deviations, according to Camilli et al. 2010), and to reduce externalizing behaviorproblems (Schindler et al. 2015).4
Detailed studies of lasting gains resulting from exposure to the Chicago Child-ParentCenter (CCPC) in the 1980s have shown that large-scale publicly run programs can deliverreal benefits comparable to those provided by smaller “model” programs, so long asteacher training and support are strong, there is a quality, age-appropriate curriculum, andparents are engaged. This helps allay concerns about “scalability” that have plaguedanalyses of smaller-scale ECCE interventions (for more on the components of successfulearly childhood educational interventions in large-scale programs, see Reynolds et al.2011).
More recently, studies of state-level pre-kindergarten programs have reported gains inscores for participating students (compared with their non-participating peers). Oklahoma’suniversal pre-kindergarten program illustrates that a universal program (versus a targetedprogram) can yield significant returns not only for low-income children, but for all children.Offered to all 4-year-olds since 1998, it currently serves all but a few school districts.5 Anevaluation of the program found statistically significant effects on literacy (Wong et al.2008). Using data from the Tulsa, Oklahoma, program, studies have shown significantimpacts on kindergarten outcomes of between 0.2 and 0.5 standard deviations in differentpre-reading and math outcomes for two different cohorts, one in preschool during2001–2002 and the second during 2006–2007 (Hill, Gormley, and Adelstein 2015;Gormley, Phillips, and Gayer 2008).6 While the benefits are greatest for the mostdisadvantaged children, all participants reaped significant benefits (Barnett 2008).
New Jersey’s Abbott Preschool Program constitutes an important benchmark both for highquality and for continuous improvement. It started in 1999–2000 and currently serves allchildren in 31 high-poverty communities and about 19 percent and 29 percent,respectively, of the state’s 3- and 4-year-olds (Barnett et al. 2015). Basic program standardsinclude a maximum class size of 15, teachers with certification in early childhoodeducation, assistant teachers in every classroom, support services for children andfamilies, and a developmentally appropriate curriculum that fully addresses the state’slearning standards (Barnett et al. 2013).7 Program effects persist over time, and are largerfor children who participated in the program for two years than for one year. Using datafrom a cohort that completed preschool in 2004–2005, Barnett et al. (2013) estimate thattest score gains in fifth grade from one year of preschool education are equivalent toabout 10–20 percent of the achievement gap between white and minority students. Twoyears of preschool participation results in gains equivalent to 20–40 percent of the gap(Barnett et al. 2013).
North Carolina’s Smart Start Initiative complements its More at Four preschool program for4-year-olds. Established in 1993, the initiative takes a comprehensive approach, offeringchild care and education, as well as health and family support, for children from ages 0 to5 (Ladd, Muschkin, and Dodge 2014). By the time participating students reached thirdgrade, the Smart Start Initiative had generated gains equivalent to two to four months ofinstruction in math and reading, respectively (Ladd, Muschkin, and Dodge 2014).
11

Will these test score gains fade over time?
One concern regarding ECE’s effects on student test scores is the potential for thesebenefits to diminish over time. Two comprehensive meta-analyses of quality studies reportthat such fadeout is common, but that its economic and social impacts are easy tooverstate.
Leak et al. (forthcoming) and Duncan and Magnuson (2013) estimate that test score gainsassociated with high-quality pre-kindergarten decline by about 0.03 standard deviations ayear. However, even statistically significant estimates of fadeout do not mean that suchprograms do not have large positive social returns. Heckman et al. (2010) and Heckmanand Kautz (2012) find that gains in social and emotional skills (versus the traditionalcognitive skills presumably captured in test scores) obtained in pre-kindergarten programscontinue to benefit participants through their adulthood. Shonkoff and Phillips (2000) andHeckman (2008) similarly find that earlier investments establish strong foundationsimportant to children’s later development, and that these benefits are not adequatelycaptured in test scores.
Evidence from studies evaluating the federal Head Start program reinforces this finding.For example, while the at-risk 3- and 4-year-olds who participate show substantial short-run gains (up to 0.25 standard deviations on cognitive outcomes after nine months in theprogram), test score improvements largely fade after a few years. Yet long-term studies ofHead Start participants indicate that the students are more likely to graduate from highschool and less likely to commit crimes.
Benefits to employment outcomes and earnings from ECE
Strong evidence also demonstrates that ECE has substantial effects on children’s eventualemployment outcomes and earnings. Children who participated in the Perry PreschoolProject (a program in the 1960s that provided at-risk children with high-quality preschool)and who were exposed to the Chicago Child-Parent Center were all followed throughearly adulthood, allowing a comparison of outcomes among adults who participated in theprograms in their early childhood and those who did not. Adults who had participatedregistered increased earnings compared with those who did not participate (Nores et al.2006; Belfield et al. 2006; Reynolds et al. 2002; and Reynolds et al. 2011). Economists findthat these gains are the result of a combination of higher rates of employment and higherearnings.
Other ECE benefits: Reduced crime, better health, morestable adult lives
There are a host of other benefits associated with exposure to early childhood education.The largest benefits are associated with reductions in criminal activity, but a range of otherbenefits are also identified.
Both “model” programs (the Perry Preschool Project and the Chicago Child-Parent Center)as well as the very large-scale Head Start program are associated with significant
12

reductions in the odds of pre-kindergarten program participants’ eventual criminal activity/involvement in the criminal justice system as adults, when compared with their non-participating peers. At age 40, Perry preschoolers had considerably lower rates of lifetimecriminal activity than nonparticipants, including felonies for violent assault, drug sales, orproperty theft (Nores et al. 2005).8 At age 26, CCPC participants’ rates of felony arrestsand substance abuse were 25 percent and 24 percent lower, respectively, than those ofnonparticipating children (Reynolds et al. 2011).9 At age 18, the juvenile arrest ratedifferences were even more significant for CCPC participants: The number of juvenilecourt petitions was 42 percent lower in the treatment group versus the comparison group.
Improved health outcomes are additional benefits that accrue both to individual graduatesof various pre-kindergarten programs and to society. At age 40, when compared with theirnonparticipating peers, the shares of Perry participants who reported health problems orhaving been treated for substance abuse were 9 percentage points and 12 percentagepoints lower, respectively (Nores et al. 2005). At age 26, when compared with theirnonparticipating peers, CCPC participants had a 26 percent lower rate of reporteddepression symptoms, a 24 percent lower substance use rate, and higher health insurancerates (Reynolds et al. 2011).
Other adulthood outcomes that contribute to life stability in different forms are higher ratesof asset possession, such as owning a home (Perry participants’ homeownership rate was10 percentage points higher than that of nonparticipants) or having a savings account (76percent versus 41 percent). Participants also had higher marriage rates at age 40 (37percent versus 24 percent) (Nores et al. 2005).10
For all of these reasons, an ambitious investment in high-quality early child care andeducation would benefit children—and ultimately society as a whole.
Benefits stemming from increasedin-kind resources to families withchildrenChild care reform that substantially reins in parents’ out-of-pocket child care costs throughproviding subsidies, while enforcing high standards in the quality and pay of child careworkers, can provide significant returns not only to the children who receive that care (asdescribed in previous sections), but also to parents, their families’ well-being, and theeconomy as a whole.
Many important benefits provided by our social insurance and safety net programs comein the form of in-kind benefits to households to help them afford specific goods andservices. Food stamps, Medicaid, housing vouchers, and even energy cost assistance areprograms that provide such in-kind resources to low-income families. Given that suchfamilies’ budgets are stretched thin, these in-kind benefits are essentially fungible withcash and provide huge assistance. The practice of providing subsidies for specific in-kind
13

services even for families well above the poverty line has been greatly expanded by theAffordable Care Act (ACA), which provides financial help to afford health insurance tofamilies earning a full 400 percent of the federal poverty line.
Child care subsidies are a simple resource transfer to low- and moderate-income familieswith children, who currently either find child care entirely out of reach, or who struggle tofind room for high-quality child care in their budget. A child care reform proposal that capsthe amount families would be required to pay as a share of their total family income, andfully subsidizes the remaining costs, would free up substantial resources to not only makechild care affordable, but also to allow families to pay for other necessities that may havepreviously been neglected. These necessities may include rent, food, health care, andsavings for a rainy day, for retirement, or for their children’s education.
Here we examine the monetary impact one particular proposal would have for a numberof family “archetypes.” Using the best data available on child care costs by state (CCAA2015), we limit expenditures for the state-level median family with children to 10 percent oftotal income and see how much income that frees up. (Ten percent used to be indicated asa threshold of child care affordability by the U.S. Department of Health and HumanServices. It has very recently reduced this threshold to 7 percent. A policy that capped out-of-pocket costs at this level would have even larger benefits than we calculate below.)
The maps in Figures D and E compare the savings of capping child care costs at 10percent of family income for both a family with an infant, and a family with an infant and a4-year-old in full-year care, respectively. The colors of the map represent how muchincome is freed up by capping child care expenditures. In all but two states, the medianfamily with children would experience savings from such child care reform.
For families with only an infant, the savings range from $350 a year in Mississippi to$8,304 in Massachusetts. (Savings in Washington, D.C., are substantially higher, at$16,272; however, we do not include it in our rankings because it is more properly thoughtof as a city, not a state, and because it has outlier levels of child care costs.) The mediansavings for this prototypical family ($3,272) is found in New Mexico. It’s important to notethat the savings would be even greater with ambitious, quality-oriented child care reform,which has the potential to increase prices as staff quality and investments rise.
As expected, capping expenditures at 10 percent of family income for families with twochildren (an infant and a 4-year-old) would yield even larger savings. They range from$4,289 in South Dakota to $21,085 in Massachusetts. (Washington, D.C., comes in at$34,114 because of its far-higher-than-average child care costs.) The median savings are inFlorida (at $11,128), where such child care reform would free up nearly one-third of medianfamily income.
While the illustration here considers the cost savings for median families with children(which, on a nationwide basis, have a median income of $63,767), the boost would beeven greater for families lower on the income scale. These include single-mother families(which have a median income of $26,374), families headed by an African American (whichhave a median income of $36,790), and families headed by a Latino or Latina (which havea median income of $41,363). This is because the progressive nature of a cap on child
14

Figures Dand E
Typical families would see significant savings frompolicies that limit their child care expensesSavings to median-income families with children ifout-of-pocket child care expenditures were capped at 10%of income, by state
Source: EPI analysis of CCAA (2015) and U.S. Census Bureau American Community Survey
State
Savings tomedian-income
families
Shareof
medianincomefreed
up
Savings tomedian-income
families
Shareof
medianincomefreed
up
Alaska $3,300 5.0% $10,952 18.9%
Alabama $516 1.1% $5,387 13.2%
Arkansas $1,301 3.2% $6,296 17.5%
Arizona $4,090 9.3% $11,587 31.7%
California $5,457 10.5% $13,687 31.4%
Colorado $6,164 10.9% $16,046 34.2%
Connecticut $5,182 7.1% $16,684 27.1%
WashingtonD.C.
$16,272 39.7% $34,114 147.6%
Delaware $3,999 6.8% $12,267 24.2%
Florida $3,460 7.9% $11,128 30.9%
Georgia $2,103 4.4% $8,603 20.8%
Hawaii $788 1.2% $10,100 17.6%
Iowa $2,941 5.3% $11,157 23.4%
Idaho $1,810 3.9% $8,734 22.0%
Illinois $6,195 11.3% $15,762 34.9%
Indiana $3,201 6.6% $9,961 24.0%
Kansas $4,926 9.6% $12,877 29.5%
Kentucky $974 2.1% $6,473 15.6%
Louisiana $412 0.9% $5,326 12.5%
Massachusetts $8,304 11.8% $21,085 36.5%
Maryland $5,249 7.2% $14,349 22.5%
Maine $3,835 8.1% $10,705 26.5%
Michigan $3,888 7.8% $10,652 24.6%
Minnesota $6,712 10.8% $17,831 34.9%
Missouri $2,834 5.7% $12,142 30.3%
Mississippi $350 0.9% $4,347 12.1%
Montana $3,213 6.5% $11,135 26.8%
North Carolina $3,900 8.8% $11,492 31.3%
North Dakota $1,110 1.8% $8,621 15.6%
Nebraska $1,613 2.9% $8,456 17.5%
NewHampshire
$3,627 5.2% $13,084 21.6%
New Jersey $2,671 3.5% $12,217 18.1%
New Mexico $3,272 8.4% $10,370 32.8%
Nevada $4,462 10.1% $12,580 35.0%
New York $7,461 14.2% $19,161 46.8%
Ohio $3,028 6.0% $10,369 24.0%
Oklahoma $1,561 3.4% $6,684 16.6%
Oregon $5,656 12.5% $14,443 39.5%
Pennsylvania $3,910 6.9% $11,982 24.7%
Rhode Island $6,155 11.3% $16,195 36.6%
South Carolina $1,336 3.0% $5,987 14.9%
South Dakota $4,289 8.4%
Tennessee $647 1.4% $5,162 12.4%
Texas $3,122 6.6% $9,852 24.1%
Utah $2,058 3.6% $8,670 17.1%
Virginia $2,797 4.2% $10,754 18.5%
Vermont $4,676 8.6% $14,646 32.8%
Washington $5,854 10.4% $15,442 33.2%
Wisconsin $5,008 9.3% $14,477 32.4%
West Virginia $2,678 6.0% $8,491 21.9%
Wyoming $5,453 9.6%
care expenditures as a share of income, by definition, provides greater subsidies to thosewith lower family income, freeing up a larger share of their income to spend on otherneeds. For instance, in Kansas, the median state in terms of median family income forfamilies with children ($62,752), families with an infant and a 4-year-old would save$12,877 from a 10 percent cap on child care expenditures. If a Kansas family’s income ishalf the median ($31,376), the income freed up by the 10 percent cap would be muchgreater, at $16,014.
Helping families afford high-quality child care through generous subsidies would materiallyimprove families’ living standards—particularly for those families that need the most help.
15

Benefits stemming from parents’increased labor force participationA major investment in America’s children would also deliver economic benefits tofamilies—and the economy as a whole—by making it more feasible for parents (particularlymothers) to work. From the widespread lack of paid parental leave to inadequate andunaffordable child care, the United States falls far behind its international peers on anumber of measures related to investments in families with children. Without adequatepolicies to support parents’ ability to remain in the labor force after having children, manyparents (mostly mothers) drop out. This has important ramifications for their future workprospects, including their career path and earnings potential, which likewise hasimplications for their family’s income and well-being. Moreover, lower labor forceparticipation translates directly to lower levels of gross domestic product (GDP). Thissection surveys the literature regarding links between child care costs and labor forceparticipation and provides illustrative simulations of how better child care policy could leadto better outcomes for parents, families, and the economy.
International context for better parental supportpoliciesResearch has shown that paid parental leave and subsidized child care increase parentallabor force participation. Many of our peer nations have such policies, and, notsurprisingly, their parental labor force participation rates are much higher than ours.
Figure F illustrates just how far U.S. women have fallen behind some of our internationalpeers. The graph shows the share of women age 25–54 with a job between 1995 and2014 in Germany, Canada, Japan, and the United States. While the share of prime-agewomen with a job rose in those peer nations, in the U.S. it actually fell. Policies that helpparents, particularly women, balance work and family could meaningfully improve theirability to participate in the labor force. This increase in labor force participation wouldmean more earnings for families and more economic activity for the country.
Blau and Kahn (2013) concur with those findings and also stress that at the same time thatU.S. women’s labor force participation went from the sixth highest (out of 22) in 1990 to the17th highest in 2010, our peer countries outpaced the United States in providinginvestments and public benefits dedicated to supporting families with children. Ruhm(2011) looks specifically at the relationship between investments in child care and laborforce participation, and finds that increasing public child care expenditures from theaverage of 19 wealthy OECD countries to the level of Denmark would increase labor forceparticipation rates of 25- to 54-year-old women by 4.4 percentage points.
An increase of this magnitude would have enormous implications for economic growth. Toget a sense of how increasing the share of women in the labor force could affect theeconomy, consider that if prime-age women had the same labor force participation rate in
16

Figure F The share of prime-age women with a job has faredworse in the U.S. than in peer countriesEmployment-to-population ratio of women workers age25–54, select countries, 1995–2014
Source: EPI analysis of OECD Labour Force Statistics
Canada Germany JapanUnitedStates
1995 69.434551% 66.360158% 63.233624% 72.189196%
1996 69.577146% 67.220440% 63.701741% 72.770073%
1997 70.971110% 67.399584% 64.566038% 73.541046%
1998 72.183646% 68.944387% 64.036077% 73.642970%
1999 73.245982% 70.253128% 63.551051% 74.147991%
2000 73.944309% 71.210539% 63.582090% 74.213847%
2001 74.297867% 71.607431% 64.124398% 73.421299%
2002 75.348504% 71.845950% 63.863976% 72.259684%
2003 76.000458% 71.981067% 64.407421% 72.006189%
2004 76.720415% 72.129055% 65.028791% 71.848458%
2005 76.488663% 70.969949% 65.733178% 71.963537%
2006 76.984912% 72.647765% 66.614235% 72.504467%
2007 78.190906% 74.045933% 67.370518% 72.501768%
2008 78.008148% 74.744854% 67.495987% 72.301570%
2009 77.114622% 75.420875% 67.595960% 70.208609%
2010 77.075022% 76.320711% 68.157788% 69.343654%
2011 77.207691% 77.892216% 68.459240% 68.967922%
2012 77.710148% 78.235789% 69.161920% 69.196894%
2013 78.090883% 78.625264% 70.773639% 69.253713%
2014 77.444969% 78.839200% 71.835052% 69.997790%
78.8%
77.4%
71.8%
70.0%
GermanyCanadaJapanUnited States
1995 2000 2005 201060
65
70
75
80%
the United States as in Canada or Germany, there would be roughly 5.5 million morewomen in the U.S. labor force. All else equal, this would increase GDP by 3.5 percent,representing an additional $600 billion of economic activity (Shierholz 2014).
This overall GDP gain would manifest itself as more parents (overwhelmingly women)being able to access paid work, which would lead to higher annual earnings and incomefor households with children. Some of today’s potential workers who are most constrainedfrom participating in paid labor because of the lack of access to quality child care aresingle mothers. Relieving this constraint (especially through a policy of progressivetransfer) would boost household income and family resources for these householdsparticularly, making it not just good for overall economic growth, but for the equitabledistribution of income as well. Allowing heads of low-income, single-parent households tochoose paid work knowing that quality child care is available is especially important giventhat the American system of income supports has shifted so decisively in recent decadestoward boosting the returns to work. The earned income tax credit (EITC), for example,now lifts more people out of poverty than any other single government program except forSocial Security, and it is only available to those with earnings from the labor market.
17

Estimating the relationship between child carecosts and women’s labor force participationA number of studies have examined specific policy changes to identify a causalrelationship between the cost of child care and parental labor force participation in theUnited States and abroad. While the price of child care could affect the extent of laborforce participation of both men and women, the literature focuses on changes in mothers’participation (and, to keep our simulations grounded in solid research, we do as well).
One prominent study examined the introduction of universal child care in Quebec (Baker,Gruber, and Milligan 2005). They found that each 1 percent increase in subsidies wasfound to raise maternal labor force participation by 0.24 percent. Lefebvre and Merrigan(2005) found similar results, with every 1 percent decrease in child care costs raising thelabor force participation of mothers by 0.25 percent.
Child care policy can help close gender gaps inemployment and wagesWhile U.S. women have increased their labor force participation rate (LFPR) greatly in thelast 50 years, substantial gaps between men’s and women’s participation remain. Only56.8 percent of women participate in the labor force, as compared with 69.1 percent ofmen. The gender gap in LFPRs is even greater for parents with children under age 18. In2015, mothers’ LFPR was 69.9 percent, compared with 92.7 percent for fathers.11 A menuof work–family policies ranging from paid family leave to affordable child care could makeit easier for women to enter or stay in the labor force. As a result, women’s (i.e., mothers’)labor force participation would increase substantially, helping to close the genderemployment gap. Minimizing employment gaps would also help close gender wage gaps.
Although the gender pay gap can be measured in numerous ways, one clear way is toexamine hourly pay differences. In 2015, the hourly pay of women at the median was 83percent of men’s. The differences are starker among mothers, who are more likely to workfewer hours and are also more likely to not work for stretches of time. In terms of annualearnings, the pay gap is wider—women earned 78.6 cents for every dollar a man earned in2014, in part because women work fewer hours on average compared with men(Hegewisch and Hartman 2015).
Additionally, there is a sizable penalty for time out of the labor force for women (i.e.,mothers with young children). In a study of MBA graduates, Bertrand, Goldin, and Katz(2009) find that career interruptions are costly in terms of future earnings, and women arefar more likely to have career interruptions than men.
While paid parental leave and making child care affordable can improve gender wagegaps in general, and sometimes to a large degree, other labor market changes should beconsidered to limit disparities in certain occupations that confer large rewards to thoseworkers willing to put in exceptionally long hours. Goldin (2014) argues that differences in
18

pay are particularly stark among professions that reward long hours of work. As such,mothers in particular may benefit from policies to promote temporal flexibility, which wouldgive them the ability to adjust hours and complete work when it is most convenient giventheir family obligations. While that temporal flexibility can come at a cost to wages, itwould help to remedy gender inequities in the labor market.
Estimating each state’s economic gains fromincreased labor force participation through childcare reformIn this section, we provide a rough illustration of the magnitude of possible economicgains stemming from increasing women’s labor force participation by enacting child carereform. We also allocate these gains across states.12
Consider the child care reform discussed previously whereby child care expenditureswould be capped at 10 percent of a family’s income. We evaluate the effect of this changeat the median of the income distribution for families with children to get an illustration ofthe possible magnitude of this reform’s effect on labor force participation. First, for themedian family with children, we calculate the percent reduction in child care costs (i.e., thesize of the subsidy) that such reform would result in. Then, using the relativelyconservative estimate by Blau (2001) that decreasing child care costs by 1 percentincreases mothers’ labor force participation by 0.2 percent, we calculate the mothers’labor force response to this subsidy. Translating this addition to the overall labor force, wethen estimate the gains to each state’s economy from such child care reform.
In Figure G, we illustrate these gains to each state’s gross state product (GSP) for familieswith an infant. While the color coding in the map corresponds to the percent increase inGSP, the level increase in each state’s GSP is also provided in the online version of thefigure. While the percent increases in GSP are as large as 1.6 percent in several states, themedian GSP increase was $1.9 billion in Washington, D.C., and as large as $33.5 billion inCalifornia. Across the country, this translates into a GDP increase of 1.2 percent, equal to$210.2 billion.
Using estimates from Bivens and Edwards (2010), we estimate that a GDP gain of thismagnitude would boost federal tax revenue by roughly $70 billion annually, providing avery large base of economic support to finance this ambitious investment in America’schildren.
19

Figure G Nearly all states’ economies would grow frompolicies that limit families’ child care expendituresIncrease in size of state economy from cappingout-of-pocket infant care expenditures at 10% of income
Note: These estimates use each state's median income for families with children and use Blau's (2001)finding that decreasing child care costs by 1 percent increases mothers' labor force participation by 0.2percent.
Source: EPI analysis of CCAA (2015), U.S. Census Bureau American Community Survey, Current Popula-tion Survey Outgoing Rotation Group microdata, Blau (2001), and BEA (2016)
State
Increasein state
economy
Increasein state
economy(in
millions)
Increasein state
economy
Increasein state
economy(in
millions)
Alaska 1.0% $562 1.9% $1,099
Alabama 0.3% $655 1.8% $3,665
Arkansas 0.8% $954 2.1% $2,518
Arizona 1.3% $3,853 2.1% $6,083
California 1.5% $33,498 2.1% $49,529
Colorado 1.5% $4,437 2.2% $6,595
Connecticut 1.2% $3,033 2.1% $5,340
WashingtonD.C.
1.6% $1,916 1.9% $2,246
Delaware 1.2% $774 2.1% $1,356
Florida 1.2% $10,404 2.1% $17,781
Georgia 1.0% $4,594 2.1% $10,156
Hawaii 0.3% $219 1.7% $1,321
Iowa 1.1% $1,793 2.1% $3,645
Idaho 0.9% $545 2.1% $1,340
Illinois 1.6% $11,490 2.3% $16,821
Indiana 1.2% $3,948 2.2% $6,989
Kansas 1.5% $2,177 2.3% $3,329
Kentucky 0.5% $939 1.8% $3,330
Louisiana 0.2% $625 1.7% $4,356
Massachusetts 1.6% $7,075 2.3% $10,271
Maryland 1.3% $4,378 2.1% $7,240
Maine 1.1% $623 1.9% $1,009
Michigan 1.3% $5,708 2.1% $9,284
Minnesota 1.5% $4,833 2.3% $7,237
Missouri 1.1% $3,180 2.3% $6,557
Mississippi 0.3% $290 1.9% $1,971
Montana 1.1% $472 2.0% $872
North Carolina 1.5% $7,135 2.4% $11,550
North Dakota 0.4% $232 1.7% $941
Nebraska 0.7% $771 2.0% $2,170
NewHampshire
0.9% $625 1.8% $1,252
New Jersey 0.7% $3,968 1.8% $9,931
New Mexico 1.4% $1,268 2.3% $2,122
Nevada 1.4% $1,925 2.2% $2,975
New York 1.6% $22,580 2.3% $31,736
Ohio 1.1% $6,583 2.2% $12,401
Oklahoma 0.8% $1,405 1.9% $3,429
Oregon 1.6% $3,333 2.3% $4,792
Pennsylvania 1.1% $7,560 2.0% $13,172
Rhode Island 1.5% $832 2.3% $1,230
South Carolina 0.7% $1,285 1.8% $3,351
South Dakota
Tennessee 0.4% $1,087 1.6% $4,897
Texas 1.2% $20,139 2.2% $35,942
Utah 0.8% $1,128 1.9% $2,692
Virginia 0.9% $4,176 2.0% $9,117
Vermont 1.3% $375 2.1% $623
Washington 1.4% $5,966 2.1% $8,978
Wisconsin 1.4% $4,093 2.2% $6,509
West Virginia 1.1% $787 1.9% $1,439
Wyoming
Benefits stemming fromprofessionalization of the child careworkforceThere is large variation in the outcomes of specific ECCE interventions. To maximize thebenefits of these interventions, the design of an ambitious national investment in childrenshould be guided by research findings identifying the characteristics of particularlysuccessful ECCE efforts. One of the clearest findings is the importance of thecharacteristics of child care providers and staff. Some of the most important characteristicsare credentials, schooling, and experience, but other characteristics related to quality areintangible ones, such as energy, enthusiasm, and motivation (Blau 2001).
However, the low pay of child care workers presents a severe barrier to attracting the typeof workforce at scale that would maximize the benefits of ECCE. Table 1, reproduced fromGould (2015), highlights that child care workers are overwhelmingly female (95.6 percent)
20

Table 1 Demographic characteristics of child care workers, 2014Demographic Child care workers All other workers
Gender
Men 4.4% 53.7%
Women 95.6% 46.3%
Citizenship status
U.S. born 81.2% 83.5%
Naturalized U.S. citizen 8.3% 7.8%
Non-naturalized immigrant 10.5% 8.7%
Race/ethnicity*
White 60.1% 66.1%
Black 14.1% 10.6%
Hispanic 19.8% 15.7%
Asian 3.9% 5.8%
Other 2.1% 1.9%
Education
Less than high school 8.6% 8.0%
High school 30.5% 27.2%
Some college 39.4% 29.7%
Bachelor’s degree 17.7% 22.8%
Advanced degree 3.8% 12.4%
Age
18–22 15.4% 7.3%
23–49 55.7% 59.1%
50+ 29.0% 33.7%
* Race/ethnicity categories are mutually exclusive (i.e., white non-Hispanic, black non-Hispanic, and His-panic any race).
Note: To ensure sufficient sample sizes, this table draws from pooled 2012–2014 microdata.
Source: EPI analysis of Current Population Survey Outgoing Rotation Group microdata
and disproportionately workers of color (39.9 percent, versus 33.9 percent for otheroccupations). In part because of the lingering labor market penalty suffered by women andworkers of color, child care workers receive very low hourly pay, many significantly belowthe state median wage. However, their low pay is not just a function of their demographiccharacteristics—these workers face a wage penalty even after controlling for relevantworker characteristics. Gould (2015) has documented that the wage penalty for child careworkers is 23.0 percent even when compared with demographically similar workers inother occupations.
The effect of child care workers’ demographic characteristics being consistently penalizedin the U.S. labor market, along with the occupation-specific wage penalty, combine tomake median hourly wages for child care workers nationally just $10.31, 39.3 percentbelow the $17.00 median hourly wage of workers in other occupations. In fact, one inseven child care workers (14.7 percent) live in families with income below the official
21

poverty line, compared with 6.7 percent of workers in other occupations. After accountingfor demographic differences between child care workers and other workers, child careworkers are 5.9 percentage points more likely to be in poverty than similar workers inother occupations (Gould 2015). Current proposals to set a wage floor for child careworkers at $15 an hour would directly raise wages for 60 percent of child care workers, fora total wage increase of $156 million per week.13
Higher wages for child care workers would also have benefits beyond improving theeconomic well-being of care providers and their families. Multiple studies of child carequality have shown that higher compensation is correlated with the ability to attract andretain a highly trained workforce—particularly workers who display more of the intangiblecharacteristics associated with high-quality care, and who provide more positivedevelopmental experiences for young children (Whitebook et al. 2001; Center on Children,Families and the Law 2005). Higher compensation has also been shown to contribute tosustainability of quality improvements over time (Whitebook et al. 2001).
Higher wages would also provide incentives for child care facilities to invest in thedevelopment of their staff, which in turn would improve quality. In a comprehensivelongitudinal evaluation of one of the most stunning ECCE successes—the Chicago Child-Parent Program—Reynolds et al. (2011) identified a number of elements crucial to itssuccess. “Highly qualified and well-compensated teachers with bachelor’s degrees andcertifications in early childhood education” and “ongoing staff development” wereidentified as major drivers of this success.
This finding that better-compensated teachers are associated with both higher quality andgreater levels of employer investment should not come as a shock. Recent studiesexamining the impact of increases in minimum wages (at either the state or federal level)have come to similar conclusions. Dube, Lester, and Reich (2014) find that minimum-wageincreases reduce turnover significantly. Given that provider experience is a key ingredientin ECCE quality, providing a better-paid, more-stable workforce should be a primary goalof any ambitious effort to invest in America’s children.
Given the crucial role that provider quality plays in maximizing the return to investments inECCE, policymakers should ensure that incentives to boost quality and spur investment inECCE staff and providers are included in any investment effort. One tool to spur quality isto set high reimbursement rates for providers. Higher reimbursement rates to qualityproviders make them more likely to serve subsidy-receiving households instead of justcatering to higher-income families. The federal government currently recommends thatstates set their reimbursement rates at the 75th percentile of the market rate distributionso that low-income families have access to 75 percent of the providers in their area and toprovide incentives for providers to invest in more professional staff. Unfortunately, fewstates—only one in 2014—actually do so in practice; many states fail to update the ratesbased on current market surveys. By comparison, 22 states set reimbursement rates at orabove 75 percent in 2001. Other tools to spur quality in ECCE staff could include measuresto ensure that subsidies can only be used in ECCE facilities that meet high thresholds forstaff training and job quality.
22

Through raising child care workers’ wages and pursuing other policies to increase childcare quality, we can ensure that investments in ECCE yield the greatest possible benefits.
The status quo in American child care,and policy efforts to helpIn this section, we describe the current state of child care in America, with a focus onaffordability and availability of high-quality care. We also provide a broad overview of thepatchwork of policies that help families gain access to child care. Above all, this analysis ofthe status quo underscores the need for ambitious child care reform.
The problem of affordability extends beyondlow-income familiesHigh-quality child care is out of reach for many American families—not just those with lowincomes. Child care costs are one of the most significant expenses in a family’s budget,largely because child care and early education is a labor-intensive industry, requiring a lowstudent-to-teacher ratio (CCAA 2014). The heavy burden of child care costs in the contextof typical family budgets is illustrated by EPI’s basic family budget thresholds (Gould,Cooke, and Kimball 2015), which measure the income families need in order to attain amodest yet adequate standard of living in 618 communities. Geographical cost-of-livingdifferences are built into the budget calculations by incorporating regional, state, or localvariations in prices (depending on item). The thresholds are also adjustable by family type,as expenses vary considerably depending on the number of children in a family (if any),and whether a family is headed by a single parent or two parents.
Across regions and family types, child care costs account for the greatest variability infamily budgets. Monthly child care costs for a household with one child (a 4-year-old)range from $344 in rural South Carolina to $1,472 in Washington, D.C (Gould and Cooke2015).14 Child care costs are even higher for families with multiple children; in the Districtof Columbia, monthly child care costs for a three-child household (with a 4-year-old, an8-year-old, and a 12-year-old) are $2,784—nearly 90 percent higher than for a householdwith one child (a 4-year-old). Costs are particularly high for families with infants, due toincreased staff sizes and additional training and licensing requirements (CCAA 2014);center-based infant care costs range from $468 a month in Mississippi to $1,868 a monthin the District of Columbia.
The Department of Health and Human Services has considered child care affordable if itconsumes 10 percent or less of a family’s income (HHS 2014). (As previously noted, HHSvery recently reduced this threshold to 7 percent.) By this 10 percent metric, in only twostates is infant care “affordable”—South Dakota and Wyoming. In Massachusetts, whichhas one of the highest center-based infant care costs, child care costs exceed thisaffordability test for over 80 percent of families. This is illustrated in Figure H, which
23

Figures Hand I
In most states, small shares of families can affordchild careShare of families able to afford center-based child care, bystate, 2014
Note: Child care is considered affordable if it consumes 10 percent or less of a family's income.
Source: EPI analysis of CCAA (2014) and U.S. Census Bureau American Community Survey
State
Shareof
familiesable toaffordinfantcare
Annualinfantcarecost
Incomenecessaryto afford
infantcare
Totalnumber
offamilies
Numberof
familiesunable to
affordinfantcare
Share offamiliesable toafford
4-year-oldcare
Annual4-year-oldcare cost
Incomenecessaryto afford
4-year-oldcare
Numberof
familiesunable to
afford4-year-old
care
Alabama48.4% $5,637 $56,370
1,232,515 636,08353.7% $4,871 $48,710
571,109
Alaska35.5% $10,957 $109,570
165,015 106,41753.5% $7,652 $76,520
76,663
Arizona27.9% $9,437 $94,370
1,579,481 1,139,09538.2% $7,497 $74,970
976,833
Arkansas42.8% $5,995 $59,950
752,212 430,40550.9% $4,995 $49,950
369,363
California28.5% $11,817 $118,170
8,762,059 6,261,09543.5% $8,230 $82,300
4,947,250
Colorado22.6% $13,154 $131,540
1,315,283 1,017,66634.9% $9,882 $98,820
855,942
Connecticut28.1% $13,880 $138,800
887,263 638,38537.6% $11,502 $115,020
553,704
Delaware28.9% $11,000 $110,000
233,000 165,67842.8% $8,268 $82,680
133,383
WashingtonD.C.
9.4 $22,631 $226,310117,864 106,728
23.8% $17,842 $178,42089,870
Florida30.2% $8,694 $86,940
4,693,411 3,276,89935.3% $7,668 $76,680
3,038,663
Georgia37.7% $7,644 $76,440
2,426,392 1,511,82745.4% $6,500 $65,000
1,323,794
Hawaii47.3% $8,280 $82,800
314,151 165,52141.0% $9,312 $93,120
185,437
Idaho37.5% $7,200 $72,000
407,499 254,72840.2% $6,924 $69,240
243,740
Illinois22.3% $12,964 $129,640
3,099,184 2,408,27735.0% $9,567 $95,670
2,013,603
Indiana29.2% $8,918 $89,180
1,657,223 1,172,67943.8% $6,760 $67,600
931,801
Iowa30.0% $9,485 $94,850
801,562 560,86138.9% $8,216 $82,160
490,045
Kansas23.5% $11,201 $112,010
728,602 557,20339.8% $7,951 $79,510
438,626
Kentucky43.3% $6,294 $62,940
1,124,586 637,33249.7% $5,499 $54,990
565,207
Louisiana49.8% $5,747 $57,470
1,112,659 558,84555.5% $4,914 $49,140
495,651
Maine26.7% $9,512 $95,120
344,585 252,50344.5% $6,870 $68,700
191,333
Maryland27.7% $13,932 $139,320
1,445,972 1,045,93648.9% $9,100 $91,000
739,057
Massachusetts18.7% $17,062 $170,620
1,610,581 1,310,16732.0% $12,781 $127,810
1,095,495
Michigan26.0% $9,882 $98,820
2,485,159 1,838,89045.4% $6,764 $67,640
1,357,822
Minnesota17.8% $14,366 $143,660
1,369,594 1,125,41731.0% $11,119 $111,190
944,628
Mississippi50.2% $4,822 $48,220
738,463 360,33959.2% $3,997 $39,970
301,661
Missouri32.0% $8,632 $86,320
1,508,816 1,025,31027.9% $9,308 $93,080
1,088,313
Montana28.0% $9,062 $90,620
251,176 180,74735.0% $7,922 $79,220
163,152
Nebraska39.9% $7,926 $79,260
480,317 288,69448.4% $6,843 $68,430
248,045
Nevada23.8% $9,852 $98,520
642,461 489,64734.4% $8,118 $81,180
421,504
NewHampshire
30.3% $11,810 $118,100345,901 241,134
40.8% $9,457 $94,570204,941
New Jersey38.0% $11,534 $115,340
2,203,675 1,367,07946.5% $9,546 $95,460
1,178,767
New Mexico32.9% $7,942 $79,420
489,532 328,39337.9% $7,098 $70,980
303,909
New York20.3% $14,144 $141,440
4,621,954 3,681,43528.4% $11,700 $117,000
3,307,405
North Carolina26.7% $9,255 $92,550
2,492,048 1,826,39535.9% $7,592 $75,920
1,596,596
North Dakota44.6% $8,217 $82,170
187,800 104,03749.5% $7,511 $75,110
94,867
Ohio31.2% $8,977 $89,770
2,923,523 2,011,13241.5% $7,341 $73,410
1,711,321
Oklahoma42.1% $6,788 $67,880
966,516 559,68456.6% $5,123 $51,230
419,601
Oregon22.1% $11,322 $113,220
966,250 752,68032.9% $8,787 $87,870
648,101
Pennsylvania27.5% $10,640 $106,400
3,185,054 2,310,57240.7% $8,072 $80,720
1,889,506
Rhode Island21.9% $12,867 $128,670
257,165 200,88832.2% $10,040 $100,400
174,337
South Carolina43.0% $6,475 $64,750
1,201,616 684,78257.7% $4,651 $46,510
507,920
South Dakota57.7% $5,661 $56,610
211,235 89,31065.8% $4,804 $48,040
72,348
Tennessee47.2% $5,857 $58,570
1,660,344 876,69759.1% $4,515 $45,150
679,033
Texas34.7% $8,759 $87,590
6,407,165 4,184,22447.2% $6,730 $67,300
3,384,004
Utah37.4% $8,641 $86,410
691,495 432,89352.8% $6,612 $66,120
326,081
Vermont22.7% $11,270 $112,700
162,017 125,22227.3% $9,970 $99,700
117,832
Virginia35.6% $10,458 $104,580
2,058,820 1,325,31648.7% $7,957 $79,570
1,056,282
Washington24.0% $12,733 $127,330
1,725,099 1,311,54336.3% $9,588 $95,880
1,099,260
West Virginia28.5% $7,926 $79,260
472,869 337,93945.0% $5,813 $58,130
260,002
Wisconsin21.4% $11,579 $115,790
1,485,877 1,168,48829.8% $9,469 $94,690
1,042,753
Wyoming55.3% $6,541 $65,410
149,032 66,55060.8% $5,833 $58,330
58,348
depicts the share of families able to afford infant care in each state. Similarly, FigureI displays the share of families in each state able to afford 4-year-old care.
Of EPI’s 618 family budget areas, in only a handful of areas (all in Louisiana) are child carecosts even close to 10 percent of EPI’s family budget threshold. Center-based child carefor single-parent families with two children (ages 4 and 8) ranges from 11.7 percent of amodest yet adequate income in New Orleans to 33.7 percent in Buffalo.
Affording child care is particularly difficult for low-wage families. For a full-time, full-yearminimum-wage worker, child care costs as a share of income far exceed the HHS
24

affordability standard. For example, the shares of annual minimum-wage earnings requiredto afford infant care ranges from 31.8 percent in South Dakota to 103.6 percent inWashington, D.C. This expense becomes even further out of reach for families with morethan one child requiring care.
However, affordable child care is not just a problem for low-income families. For families offour, with two parents and two children (ages 4 and 8), the income level necessary toachieve a modest yet adequate standard of living exceeds state median income in 430 of618 family budget areas. (Median incomes for families with children under 18 range from$44,717 in Mississippi to $88,627 in New Jersey.) This is due largely to the high cost ofchild care. Clearly, even middle-income families have great difficulty affording child care.
As mentioned previously, child care is even less affordable for families with infants. Toillustrate this, we constructed family budgets in 10 areas for two-parent, two-child familieswith an infant and a 4-year-old (instead of a 4-year-old and an 8-year-old). The areasinclude San Francisco; Stamford, Connecticut; Tampa, Florida; Atlanta; Chicago; Boston;Detroit; Kansas City, Missouri; Raleigh, North Carolina; and Las Vegas. Annual budgets forthese families range from $67,536 in Atlanta (which saw the smallest change in its overallbudget when we changed the age of children in the household to include an infant,increasing $3,648) to $108,245 in Stamford. (Boston saw the largest change in its overallbudget, increasing $16,921.) Annual child care costs for an infant and a 4-year-old rangefrom $13,245 in Atlanta to $29,478 in Boston. As a share of total family budgets, thesechild care costs range from 19.3 percent in San Francisco to 28.7 percent in Boston. Thiscompares with a range of 11.8 percent in San Francisco to 21.6 percent in Chicago forfamilies with a 4-year-old and an 8-year-old. In short, families with infants deserve specialattention from policymakers. By the time children are age 5, universal schooling helpsmany families with child care obligations. But before then, and particularly in the first yearsof children’s lives, too many families are left on their own.
Child care–related tax provisions to promoteaffordabilityAs the above estimates show, child care affordability is not just a problem for low-incomefamilies, but for many higher-income families as well. There are two major federal vehiclesused to offset employment-related child care costs that are available to all families,regardless of income: the child and dependent care tax credit (CDCTC) and the employer-provided child care tax exclusion.
The CDCTC allows parents to report up to $3,000 per child in child care costs (up to amaximum of $6,000) and receive a tax credit of 20 to 35 percent, or up to $2,100, basedon their adjusted gross income (AGI). Both parents in a two-parent household must beemployed in order to receive the credit. The 35 percent credit rate applies to families withAGI below $15,000 and decreases by 1 percentage point for each additional $2,000 ofAGI. The 20 percent credit rate applies to families with AGI greater than $43,000.
25

Despite its progressive structure, the federal CDCTC provides little benefit to low-incomefamilies because it is non-refundable, meaning families with little or no tax liabilities areunable to receive it. This excludes well over a third of the lowest-income households.Twenty-six states also have child care–related tax provisions, but only 12 includerefundable tax credits (NWLC 2014). Tax credits are also less practical for liquidity-constrained low-income families because the benefits are only available when or if afamily files an income tax return, rather than at the time the expenses are incurred.
According to Blau (2001), one-quarter of the total amount of tax credits claimed in 1997went to families with AGI of less than $30,000, but almost all of this amount was claimedby families with AGI between $15,000 and $30,000; only 1.8 percent was claimed byfamilies with AGI less than $15,000. This suggests that those most likely to qualify for themaximum benefit of $2,100, such as single-parent minimum-wage workers, rarely actuallyget it. The largest average benefits go to those with incomes between $100,000 and$200,000 because their expenses are higher than those of other income groups andbecause more people in this income range have child care expenses (Maag 2013).
The employer-provided child care tax exclusion is available to any worker employed at afirm that offers this benefit. It allows an employee to exclude from taxation up to $5,000 ofher salary, regardless of the number of children receiving care. Since these are pre-taxdollars, higher-income families typically benefit more from the exclusion than from the taxcredit because they save both on income and payroll taxes. Families can claim both theCDCTC as well as the child care exclusion, but total expenses claimed cannot exceed$6,000. Although most working families will only receive a fraction of this amount in actualtax benefits, $6,000 covers the average cost of infant care in only six states, and theaverage cost of child care for a 4-year-old in 11 states.15 At the other end of the spectrum,average infant care costs in the District of Columbia are nearly four times the totalallowable expenses under federal child care tax provisions.
In addition to limitations on the amount of allowable expenses and the number of familieswho benefit from these tax provisions, the value of these provisions erodes each yearbecause they are not indexed to inflation.
Child care subsidiesChild care subsidies are the primary vehicle for making more options for higher-qualitychild care available to low-income families who generally do not benefit from non-refundable tax credits. The Child Care Development Fund (CCDF), authorized under theChild Care and Development Block Grant Act (CCDBG), is the primary source of federalfunding for child care subsidies for low-income working families. Other funding sources forchild care assistance include the federal Temporary Assistance for Needy Families (TANF)funding and Social Services Block Grant (SSBG), along with other state funds.
States may transfer up to 30 percent of their TANF block grant funds to CCDBG, or useTANF funds directly for child care without first transferring the money. In fiscal 2013, totalfederal spending on child care assistance—including combined CCDBG and TANF
26

Table 2 State variation in key child care assistance policiesDescription of policy Number of states affected
Income limit failed to keep pace with the increase in the federal poverty levelbetween 2001 and 2015
27
Family of three with income above 100/150/200 percent of poverty could NOTquality for assistance in 2015
0/17/39
Waiting lists or frozen intake in 2015 21 (same in 2001)
Families at 100 percent of poverty (family of three) paid a higher percentage ofincome in copayment in 2015 than in 2001
28
Reimbursement rate set at federally recommended 75th percentile of marketrates in 2015
1 (down from 22 in 2001)
Reimbursement rate at highest quality level was set above 75th percentile ofmarket rate
8 (of 37 states with tieredcenter care of 4-year-olds)
Allowed families receiving child care assistance to continue receiving it for atleast some amount of time while a parent searched for a job in 2015
45
Allowed families to qualify for and begin receiving child care assistance while aparent searched for a job in 2015
13
Offered tiered income eligibility in 2014 17 (range of 8% to 70%allowable increase; 25% is
median)
Source: Forry et al. (2014); Schulman and Blank (2015); Minton et al. (2015)
funds—was $11.3 billion; 1.46 million children received care subsidized by CCDF (CLASPJune 2015). These numbers represent an 11-year low in child care assistance spending anda 15-year low in the number of children served. Only 17 percent of eligible families accessthese subsidies due to any number of obstacles presented by a complex maze of programrules. Although CCDF is a single federal program, it functions as separate state programsin practice because states have flexibility to set specific program rules for how the CCDBGfunds are distributed. For example, states can determine:
Whether to set income thresholds lower than the federally allowed maximums
How to define the family unit and family income for purposes of establishing eligibility
Whether to provide care for older children with special needs
How to define the parent/guardian activities for which child care may be provided,including setting minimum work hours
Whether to use the CCDF-funded program to provide child care for foster children orchildren being monitored through child protective services
Whether to modify requirements in any way for families also enrolled in otherprograms
Whether to impose any other eligibility requirements, such as an assets test16
Program rules can have significant and sometimes conflicting effects on the affordabilityand quality of child care available to low-income families. The National Women’s LawCenter publishes an annual report with detailed information on state child care assistancepolicies. Findings from their 2015 report are summarized in Table 2.
27

Key barriers to access for families eligible for subsidies:eligibility limits, waiting lists, copayments, and job-searcheligibility
Income eligibility limits are a clear shortcoming of current child care subsidies. Theseeligibility limits are used to determine how far up the income scale access to child caresubsidies extend. The higher the limit, the more families potentially have access to childcare assistance, assuming they also meet the other requirements. In 2015, incomeeligibility limits for a family of three ranged from $23,880 in Michigan to $61,524 in NorthDakota (Schulman and Blank 2015). In all states, a family of three with income below thefederal poverty threshold ($20,090 for a family of three) could qualify for assistance in2015. About two-thirds of states offer assistance to families with income up to 150 percentof the poverty threshold ($30,135 for a family of three), but less than one-fourth offerassistance to families with income up to 200 percent of the poverty threshold ($40,180 fora family of three). But as we demonstrated previously in our review of child careaffordability, this means many families with incomes substantially above the poverty linethat nevertheless face severe stress in affording quality child care do not benefit fromthese subsidies.
Waiting lists are used to manage excess demand for child care assistance by qualifiedfamilies. States may also opt to freeze intake, meaning qualified families are turned awaywithout even being placed on a waiting list. Average time spent on a waiting list can varyby state, but ranged from one to two months in one state to between 18 months and twoyears in another (Schulman and Blank 2015). Eligible families with an immediate need forchild care are often forced to seek other options or risk losing a job.
Copayments are the portion of the total cost of child care a family must pay out of pocket.These copayments have generally increased over time. Among states that required acopayment in 2015, more than half required copayments that were a higher percentage ofincome than what was required in 2001. Based on the 10 percent HHS affordabilitystandard, required copayments were unaffordable for a family of three with an income at150 percent of poverty in nine states (Schulman and Blank 2015).
While all but five states allow families receiving child care assistance to continue receivingit for at least some amount of time while a parent searched for a job in 2014, the amount oftime allowed varies by state. Only 14 states allowed families to qualify for and beginreceiving child care assistance while a parent searched for a job.
Eligibility redetermination periods establish the frequency with which a family’s eligibilityfor child care assistance is reassessed. In most cases these periods are between six and12 months. A family’s ongoing eligibility has a major impact on the continuity of care. Afamily can lose eligibility if parents are no longer engaged in an approved activity (i.e.,working, searching for work, or engaging in education or training) or if their income risesabove the established income eligibility limit. In 2014, 17 states had tiered eligibility limits,allowing a higher income limit at redetermination than initial eligibility. This permits a familyto continue receiving assistance while their income grows. In most states the allowableincrease is modest, with a median increase of 24 percent in 2014 (Forry et al. 2014).
28
Among states with tiered eligibility in 2014, the lowest allowable increase was 8 percent inWisconsin, and the highest was 70 percent in Massachusetts.
The other consequence of this patchwork system of state rules is that certain racial orethnic groups may be disproportionately impacted by various policies, depending onpopulation distribution and the racial distribution of children served in a state. Nationally,African American and white children made up nearly equal percentages of children servedthrough CCDF funding in fiscal 2014 (42 percent and 41 percent, respectively). Latinochildren (includes all races) were 21 percent of those served. However, the racialdistribution of children served varies across states. African American children were asmuch as 91 percent of those served in Mississippi, and Latino children were the highestshare of children served in New Mexico (77 percent). White children are 95 percent ofthose served in Idaho.
Program rules regarding approved activities for eligibility may be more likely to qualifydifferent groups, based on their unique circumstances. For example, employment is anapproved activity in all states, but searching for a job is not. In 2014, of the 20 states wherethe black unemployment rate was higher than the average national black unemploymentrate (11.4 percent), six did not consider searching for a job an eligible activity at anytime—including when a parent loses a job—and seven more didn’t allow families to qualifyduring an initial job search. Since the black unemployment rate in those states is alsomore than double the white rate, excluding searching for a job as an eligible activity wouldbe more of a barrier to access or continuity of care for low-income African Americanfamilies.
Availability barriers that reach beyond simpleaffordabilityAffordability and availability of high-quality child care are closely related because with theexception of a few publicly funded programs, most parents pay out of pocket for someportion of child care costs (including preschool or pre-kindergarten). However, evenpublicly funded programs that offer free care manage to provide high-quality care to onlya fraction of their targeted population. For example, Head Start offers free high-qualityearly care and education services to young children in poverty, but reaches less than halfof eligible preschool-age children. Early Head Start reaches less than 5 percent of eligibleinfants and toddlers (NWLC 2015). Forty states and the District of Columbia funded pre-kindergarten programs in the 2013–2014 school year, but these programs reached only 29percent of 4-year-olds and 4 percent of 3-year-olds. In addition, only five states fundedpre-kindergarten programs that met all 10 of the key quality benchmarks identified by theNational Institute for Early Education Research (NWLC 2015).
While all parents are challenged with finding the best quality of care available andaffordable to them, options for parents with non-standard work schedules are even morelimited. These are parents who work evenings, overnight shifts, on the weekends, or havevarying work schedules that change from week to week or month to month. This group isprimarily served by home-based providers who are much more likely to offer evening,
29

overnight, or weekend care than child care centers. According to the National Survey ofEarly Care and Education, only 8 percent of center-based providers are open anytimeduring evenings, overnight, or weekends, compared with 82 percent of unlisted, unpaidhome-based providers, 63 percent of unlisted, paid home-based providers, and 34percent of listed17 home-based providers (NSECE 2015).18 Providers of all types are morelikely to provide care overnight or on weekends than during evenings. Although child carecenters are less likely to provide care during non-standard hours, those that do tend tooffer more hours of care than home-based providers.
Parents who face irregular work schedules—such as nurses and retail and fast foodworkers—also face the challenge of finding providers who are willing to be flexible withrespect to when their children can use care or that allow them to pay only for the care theyuse. While these arrangements are beneficial to parents, they often create uncertainty forproviders, who need to coordinate staffing and maintain a consistent and predictablestream of income. Parents with irregular work schedules often earn income low enough toqualify for child care subsidies, but have problems accessing child care assistance due topolicies that are structured for parents with standard work schedules.
Child Care Development Block Grant (CCDBG)reauthorization nibbles at some problems ofaffordability and access, but leaves mostproblems unaddressedThe 2014 reauthorization of the Child Care Development Block Grant (CCDBG) legislationincludes provisions to ensure the health and safety of children in child care settings,improve the quality of care, and make it easier for families to get and keep child careassistance. Some of the relevant quality provisions include:
Increases in the quality set-aside over five years and authorization of a set-aside toincrease the supply and quality of infant/toddler care
Requiring states to mandate ongoing training that provides for a progression ofprofessional development to improve the skills of providers
Requiring states to implement early learning and development guidelines
Incentives to increase the supply of high-quality care for underserved populations
Requiring states to establish payment policies and practices that reflect generallyaccepted payment practices for child care providers
Despite these positive steps to improve the availability of higher-quality child care, one ofthe biggest challenges with the new law is that it is not accompanied with a guarantee ofsignificant new federal funds, unlike the past two reauthorizations in 1990 and 1996. As aresult, states will be challenged with having to make difficult tradeoffs in order to meet thenew objectives (Matthews et al. 2015).
30

The new CCDBG reauthorization includes a number of provisions that give states greaterflexibility in meeting the needs of families with non-standard schedules. These includeincreasing the supply of providers who offer care during non-standard work hours,expanding access to child care for families whose work schedules and income fluctuate,and improving payment practices for providers who accommodate parents with irregularwork schedules. The law also requires that new health and safety standards be applied toa wider array of providers, including license-exempt providers who are more likely toprovide care during non-standard hours. States must do what they can to minimize theburden on these providers, so as not to restrict the availability of care for parents workingnon-standard hours.
Summing up current American child care policyWhile there are non-trivial efforts aimed at providing affordable ECCE interventions toAmerican children, the system has become wholly insufficient to address the realities of2016 family economics. Child care affordability is not just a problem for low-incomefamilies, and policy should adapt to this. Further, even the admirable ECCE efforts aimed atlower-income families (such as Head Start) have become too uneven in quality and needfurther investments to live up to their potential. Finally, innovations that have becomecommonplace in our advanced industrial peer countries (provision of universal affordablechild care through subsidies and extensive pre-kindergarten programs) have not yetarrived in the United States. All of this should be addressed with a major investment inAmerica’s families with children that patches holes and creates needed new institutions inour national system of ECCE.
ConclusionResources invested in childhood development and education vary enormously andpredictably across income classes. These gaps in resource investment lead to gaps inschool readiness—gaps that persist over students’ lifetimes. These school achievementgaps then translate into large gaps in later life success.
As distressing as these gaps should be for those committed to basic equality ofopportunity, they do provide an enormous potential opportunity to improve economicmobility as well as overall economic performance. But this potential opportunity can onlybe realized if we are prepared to make an ambitious national investment in America’schildren—investments aimed at providing higher-quality development and educationalopportunities for all children from birth.
This report has demonstrated that such a national investment could pay off in a number ofways. In the aggregate, such an investment would even pay off in narrow budgetary terms,making it a “free lunch” to fiscal policymakers so long as they were willing to wait adecade or so for the returns to begin arriving.
31

This report has also demonstrated that the current patchwork of American policy aimed ataiding families in finding high-quality, affordable child care is deeply flawed.Nonrefundable tax credits leave many low-income families ineligible for these credits.Direct subsidies for low-income households are too narrow in eligibility, leaving too manyeconomically stressed families behind. Worse, these subsidies are slowly withering, andare of little use to the growing number of workers with non-standard schedules. Wait listsand insufficient space in Head Start and Early Head Start programs prevent them from fullymeeting the needs of the intended population. The upside of this current patchwork is thatfinancing a truly ambitious set of investments in America’s children could be partially paid-for by rolling up some of these programs into the new investments.
But these investments are worth undertaking even if all new financing had to come fromscratch. They are worth it in the aggregate benefits they would provide the economy (andeven government budgets), they are worth it in terms of the greater economic mobilitythey would allow, and they are worth it for the help they would provide working families inbalancing work and family.
About the authorsJosh Bivens joined the Economic Policy Institute in 2002 and is currently the director ofresearch and policy. His primary areas of research include macroeconomics, socialinsurance, and globalization. He has authored or co-authored three books (including TheState of Working America, 12th Edition) while working at EPI, edited another, and haswritten numerous research papers, including for academic journals. He appears often inmedia outlets to offer economic commentary and has testified several times before theU.S. Congress. He earned his Ph.D. from The New School for Social Research.
Emma García joined the Economic Policy Institute as an economist in 2013. Shespecializes in the economics of education and education policy. Her areas of researchinclude analysis of the production of education, returns to education, program evaluation,international comparative education, human development, and cost-effectiveness andcost-benefit analysis in education. Prior to joining EPI, García conducted research for theCenter for Benefit-Cost Studies of Education and other research centers at TeachersCollege, Columbia University, and did consulting work for MDRC, the Inter-AmericanDevelopment Bank, and the National Institute for Early Education Research. García has aPh.D. in Economics and Education from Teachers College, Columbia University.
Elise Gould, senior economist, joined EPI in 2003 and is the institute’s director of healthpolicy research. Her research areas include wages, poverty, economic mobility, and healthcare. She is a co-author of The State of Working America, 12th Edition. In the past, she hasauthored a chapter on health in The State of Working America 2008/09; co-authored abook on health insurance coverage in retirement; published in venues such as TheChronicle of Higher Education, Challenge Magazine, and Tax Notes; and written foracademic journals including Health Economics, Health Affairs, Journal of Aging and SocialPolicy, Risk Management & Insurance Review, Environmental Health Perspectives,and International Journal of Health Services. She holds a master’s in public affairs from the
32

University of Texas at Austin and a Ph.D. in economics from the University of Wisconsin atMadison.
Elaine Weiss has served as the national coordinator for the Broader, Bolder Approach toEducation (BBA) since 2011, in which capacity she works with four co-chairs, a high-leveltask force, and multiple coalition partners to promote a comprehensive, evidence-based set of policies to allow all children to thrive. Elaine came to BBA from the PewCharitable Trusts, where she served as project manager for Pew’s Partnership forAmerica’s Economic Success campaign. Ms. Weiss was previously a member of theCenters for Disease Control and Prevention’s task force on child abuse, and served asvolunteer counsel for clients at the Washington Legal Clinic for the Homeless. She holds aPh.D. in public policy from The George Washington University and a J.D. from Harvard LawSchool.
Valerie Wilson is director of the Economic Policy Institute’s Program on Race, Ethnicity,and the Economy (PREE), a nationally recognized source for expert reports and policyanalyses on the economic condition of America’s people of color. Prior to joining EPI,Wilson was an economist and vice president of research at the National Urban LeagueWashington Bureau, where she was responsible for planning and directing the bureau’sresearch agenda. She has written extensively on various issues impacting economicinequality in the United States—including employment and training, income and wealthdisparities, access to higher education, and social insurance—and has also appeared inprint, television, and radio media. She has a Ph.D. in economics from the University ofNorth Carolina at Chapel Hill.
Endnotes1. These include the Nurse Family Partnership and the Infant Health and Development Program.
2. Examples of these high-quality preschool programs include the Perry Preschool Program,Abecedarian Project, Early Training Project, Chicago Parent-Child Program, the Elmira Prenatal/Early Infancy Project, The Milwaukee Project, NC Smart Start, and More at Four, among manyothers.
3. Participation also provided large benefits to the mothers.
4. Individual studies show a variety of effects on social and emotional skills: The most recentOklahoma study finds gains in social emotional skills, on reducing timidity and increasingattentiveness. At the same time, there seems to be the potential for poor-quality programs toresult in increased behavior problems (Magnuson, Ruhm, and Waldfogel 2007). Indeed, Heckmanand colleagues suggest that these early gains in so-called noncognitive skills drive many of thelasting gains we see in other domains (Heckman, Stixrud, and Urzua 2006).
5. It meets eight of the 10 NIEER quality standards (Barnett et al. 2015).
6. For the 2001–2002 cohort, however, effects on math and reading test scores had vanished by 3rdgrade (a phenomenon sometimes referred to as “fadeout”). For the 2006–2007 cohort, however,there were persistent effects on math scores of 0.18 standard deviations (there were no persistenteffects in reading).
33

7. The program’s quality has significantly improved “using essentially the same programs (2/3private) and teachers—though many teachers went back to school for degrees and specializedtraining in return for higher pay, all received coaching” (NIEER 2013).
8. Number of felonies by type and gender are reported in Table A2 (Nores et al. 2005).
9. An expansion of these benefits also considers the non-negligible costs saved to the potentialcrime victims. See Heckman et al. (2010) and Reynolds et al. (2011).
10. Bartik (2014) also points to a few shorter-term impacts that are rarely noted, such as increasedproperty values in areas in which public pre-kindergarten programs are established.
11. EPI analysis of 2015 CPS microdata.
12. Blau and Hagy (1998) examine differences in child care prices and their relationship with childcare demand and labor supply of parents, among other outcomes. They estimate an elasticity ofemployment with respect to the price of child care of -0.20. In other words, decreasing child carecosts by 1 percent increases mothers’ labor force participation by 0.2 percent.
In a recent White House paper on the economics of early childhood investments, researchers citeelasticity estimates ranging from -0.05 to 0.40. They also find that single mothers’ work decisionsappear particularly responsive to changes in child care costs. In our estimates, we use the -0.20elasticity, following the relatively conservative estimate discussed in Blau (2001), and used forsimilar purposes by Bartik (2006) in his analysis of the Chicago Child-Parent Center, and by Lynchand Vaghul (2015) in their analysis of the benefits of a hypothetical universal pre-kindergartenprogram.
13. EPI analysis of pooled Current Population Survey Outgoing Rotation Group microdata,2013–2015.
14. In EPI’s family budgets, child care costs in metropolitan areas—which constitute over 90 percentof our family budget areas—are statewide averages of the cost of center-based care. (For ruralareas, which may not have easy access to center-based care, the budgets assume family-basedcare.) Although center-based care varies in quality, it serves as the standard for child care costs inthe vast majority of our budget areas because it is the predominant form of child care (CCAA2014).
15. EPI analysis of cost estimates from CCAA (2014).
16. Currently, only Nebraska and Rhode Island use any sort of assets test.
17. “Listed” individuals appear on state or national lists of early care and education services, such aslicensed, regulated, license-exempt, or registered home-based providers.
18. These data come from interviews completed in 2012 with 5,240 home-based providers and 7,770center-based providers providing care to at least one child birth through age 5, not yet inkindergarten.
ReferencesBaker, Michael, Jonathan Gruber, and Kevin Milligan. 2005. Universal Childcare, Maternal LaborSupply and Family Well-Being. National Bureau of Economic Research, Working Paper No. 11832.
34

Barnett, W. Steven. 2008. Preschool Education and Its Lasting Effects: Research and PolicyImplications. National Institute for Early Education Research at Rutgers University.
Barnett, W. Steven, and Milagros Nores. 2015. “Investment and Productivity Arguments for ECCE.” InP.T.M. Marope and Y. Kaga (eds), Investing against Evidence: The Global State of Early ChildhoodCare and Education, UNESCO.
Barnett, W. Steven, K. Jung, M. Youn, and E.C. Frede. 2013. Abbott Preschool Program LongitudinalEffects Study: Fifth Grade Follow-Up. National Institute for Early Education Research.
Barnett, W. Steven, M.E. Carolan, J.H. Squires, K. Clarke Brown, and M. Horowitz. 2015. The State ofPreschool 2014: State Preschool Yearbook. National Institute for Early Education Research.
Bartik, Timothy J. 2006. Taking Preschool Education Seriously as an Economic DevelopmentProgram: Effects on Jobs and Earnings of State Residents Compared to Traditional EconomicDevelopment Programs. Report prepared for the Committee for Economic Development.
Bartik, Timothy J. 2014. From Preschool to Prosperity: The Economic Payoff to Early ChildhoodEducation. W.E. Upjohn Institute for Employment Research.
Belfield, Clive R., Milagros Nores, W. Steven Barnett, and Lawrence Schweinhart. 2006. “The High/Scope Perry Preschool Program: Cost-Benefit Analysis Using Data from the Age-40 Followup.” TheJournal of Human Resources, vol. 41, no. 1, 162–190.
Bertrand, Marianne, Claudia Goldin, and Lawrence F. Katz. 2009. Dynamics of the Gender Gap forYoung Professionals in the Corporate and Financial Sectors. National Bureau of Economic Research,Working Paper No. 14681.
Bivens, Josh, and Kathryn Edwards. 2010. Cheaper Than You Think—Why Smart Efforts to Spur JobsCost Less Than Advertised. Economic Policy Institute, Policy Memorandum #165.
Black, Sandra E., Paul J. Devereux, and Kjell G. Salvanes. 2011. “Too Young to Leave the Nest? TheEffects of School Starting Age.” The Review of Economics and Statistics, vol. 93, no. 2, 455–467.
Blau, David. 2001. The Child Care Problem: An Economic Analysis. Russell Sage Foundation.
Blau, David M., and Alison P. Hagy. 1998. “The Demand for Quality in Child Care.” Journal of PoliticalEconomy, vol. 106, no. 1, 104–146.
Blau, Francine D., and Lawrence M. Kahn. 2013. Female Labor Supply: Why is the US FallingBehind? National Bureau of Economic Research, Working Paper No. 18702.
Camilli, G., S. Vargas, S. Ryan, and W.S. Barnett. 2010. “Meta-Analysis of the Effects of EarlyEducation Interventions on Cognitive and Social Development.” The Teachers College Record, vol.112, no. 3.
Center for Law and Social Policy (CLASP). 2015. “Child Care Assistance: A Vital Support for WorkingFamilies.”
Center on Children, Families and the Law. 2005. Compensation of Early Childhood Teachers: WhatValue Do We Place on Young Children?
Child Care Aware of America (CCAA). 2014. Parents and the High Cost of Child Care: 2014 Report.
Child Care Aware of America (CCAA). 2015. Parents and the High Cost of Child Care: 2015 Report
35

College Board (2015). “2015 College Board Program Results.”
Council of Economic Advisers. 2014. The Economics of Early Childhood Investments.
Current Population Survey Outgoing Rotation Group microdata. Various years. Survey conducted bythe Bureau of the Census for the Bureau of Labor Statistics [machine-readable microdata file].Washington, D.C.: U.S. Census Bureau.
Dube, Arindrajit, T. William Lester, and Michael Reich. 2014. Minimum Wage Shocks, EmploymentFlows and Labor Market Frictions. IRLE Working Paper No. 149-13.
Duncan, Gregory J., and Richard Murnane. 2011. “Introduction: The American Dream, Then and Now.”In Greg J. Duncan and Richard Murnane (eds.), Whither Opportunity: Rising Inequality, Schools, andChildren’s Life Chances. Russell Sage Foundation.
Duncan, Greg J., and Katherine Magnuson. 2013. “Investing in Preschool Programs.” The Journal ofEconomic Perspectives, vol. 27, no. 2, 109–132.
Forry, Nicole, Paula Daneri, Sarah Minton, and Christin Durham. 2014. Supporting Continuity throughChild Care and Development Fund Subsidies: A Review of Select State Policies. OPRE ResearchBrief No. 2014-32.
García, Emma. 2015. Inequalities at the Starting Gate: Cognitive and Noncognitive Gaps Among the2010–2011 Kindergarten Cohort: Economic Policy Institute.
Goldin, Claudia. 2014. “A Grand Gender Convergence: Its Last Chapter.” American Economic Review,vol. 104, no. 4, 1091–1119.
Gormley, William, Deborah A. Phillips, and Ted Gayer. 2008. “Preschool Programs Can Boost SchoolReadiness.” Science, vol. 320, 1723–1724.
Gould, Elise. 2015. Child Care Workers Aren’t Paid Enough to Make Ends Meet. Economic PolicyInstitute, Issue Brief #405.
Gould, Elise, and Tanyell Cooke. 2015. High Quality Child Care is Out of Reach for Working Families.Economic Policy Institute, Issue Brief #404.
Gould, Elise, Tanyell Cooke, and Will Kimball. 2015. What Families Need to Get By: EPI’s 2015 FamilyBudget Calculator. Economic Policy Institute, Issue Brief #403.
Heckman, James J. 2008. “Schools, Skills, and Synapses.” Economic Inquiry, vol. 46, no. 3, 289–324.
Heckman, James J., and Tim Kautz. 2012. “Hard Evidence on Soft Skills.” Labour Economics, vol. 19,no. 4, 451–464.
Heckman, James J., J. Stixrud, and Sergio Urzua. 2006. “The Effects of Cognitive and NoncognitiveAbilities on Labor Market Outcomes and Social Behavior.” Journal of Labor Economics, vol. 24, no. 3,411–482.
Heckman, James J., Seong Hyeok Moon, Rodrigo Pinto, Peter A. Savelyev, and Adam Yavitz. 2010.“The Rate of Return to the HighScope Perry Preschool Program.” Journal of Public Economics, vol.94, nos. 1–2, 114–128.
Hegewisch, Ariana, and Heidi Hartmann. 2015. The Gender Wage Gap: 2014. Institute for Women’sPolicy Research, Publication No. C433.
36
Hill, Carolyn J., William T. Gormley Jr., and Shirley Adelstein. 2015. “Do the Short-Term Effects of aHigh-Quality Preschool Program Persist?” Early Childhood Research Quarterly, vol. 32, 60–79.
Ladd, Helen F., Clara G. Muschkin, and Kenneth A. Dodge. 2014. “From Birth to School: EarlyChildhood Initiatives and Third‐Grade Outcomes in North Carolina.” Journal of Policy Analysis and
Management, vol. 33, no. 1, 162–187.
Leak, James, G. Duncan, Weilin Li, Katherine Magnuson, Holly S. Schindler, Hirokazu Yoshikawa, andJack P. Shonkoff. Forthcoming. Timing in Early Childhood Education: How Program Impacts onCognition and Achievement Vary by Starting Age, Program Duration, and Time Since the End of theProgram.
Lefebvre, Pierre, and Philip Merrigan. 2005. Low-Fee ($5/Day/Child) Regulated Childcare Policy andthe Labor Supply of Mothers with Young Children: A Natural Experiment from Canada. CIRANOWorking Papers 2005s-08.
Lynch, Robert, and Kavya Vaghul. 2015. The Benefits and Costs of Investing in Early ChildhoodEducation: The Fiscal, Economic, and Societal Gains of a Universal Prekindergarten Program in theUnited States. Washington Center for Equitable Growth.
Maag, Elaine. 2013. “Taxation and the Family: How Does the Tax System Subsidize Child CareExpenses?” In The Tax Policy Briefing Book. Urban-Brookings Tax Policy Center.
Magnuson, Katherine A., Christopher Ruhm, and Jane Waldfogel. 2007. “Does PrekindergartenImprove School Preparation and Performance?” Economics of Education Review, vol. 26, no. 1,33–51.
Matthews, Hannah, Karen Schulman, Julie Vogtman, Christine Johnson-Staub, and Helen Blank.2015. Implementing the Child Care and Development Block Grant Reauthorization: A Guide forStates. National Women’s Law Center.
McKinsey and Company. 2009. The Economic Impact of the Achievement Gap in America’s Schools.
Minton, Sarah, Kathryn Stevens, Lorraine Blatt, and Christin Durham. 2015. The CCDF PoliciesDatabase Book of Tables: Key Cross-state Variations in CCDF Policies as of October 1, 2014. OPREReport #2015-95.
National Center for Education Statistics (NCES) (U.S. Department of Education). Early ChildhoodLongitudinal Study, Kindergarten Class of 2010–11 (ECLS-K:2011). Restricted-Use Data File.
National Institute for Early Education Research (NIEER). 2013. “Fact Sheet: The Abbott PreschoolProgram Longitudinal Effects Study (APPLES).”
National Survey of Early Care and Education Project Team (NSECE). 2015. “Fact Sheet: Provision ofEarly Care and Education during Non-Standard Hours.”
National Women’s Law Center (NWLC). 2014. State Child and Dependent Care Tax Provisions, TaxYear 2014.
National Women’s Law Center (NWLC). 2015. Gaps in Support for Early Care and Education.
Nores, Milagros, Clive R. Belfield, W. Steven Barnett, and Lawrence Schweinhart. 2005. “Updatingthe Economic Impacts of the High/Scope Perry Preschool Program.” Educational Evaluation andPolicy Analysis, vol. 27, no. 3, 245–261.
37

Organization for Economic Cooperation and Development (OECD). Various years. “Labour ForceStatistics.”
Reynolds, A.J., J.A. Temple, D.L. Robertson, E.A. Mann. 2002. “Age 21 Cost-Benefit Analysis of theTitle I Chicago Child-Parent Centers.” Educational Evaluation and Policy Analysis, vol. 24, no. 4,267–303.
Reynolds, A. J., J.A. Temple, B.A. White, S. Ou, and D.L. Robertson. 2011. “Age-26 Cost-BenefitAnalysis of the Child-Parent Center Early Education Program.” Child Development, vol. 82, no. 1.
Rolnick, A., and R. Grunewald. 2003. “Early Childhood Development: Economic Development with aHigh Public Return.” The Region, vol. 17, no. 4, 6–12.
Ruhm, Chistopher J. 2011. “Policies to Assist Parents With Young Children.” Future Child, vol. 21, no.2, 37–68.
Schindler, H.S., J. Kholoptseva, S. Oh, H. Yoshikawa, G.J. Duncan, K.A. Magnuson, and J.P. Shonkoff.2015. “Maximizing the Potential of Early Childhood Education to Prevent Externalizing BehaviorProblems: A Meta-Analysis.” Journal of School Psychology, vol. 53, no. 3, 243–263.
Schulman, Karen, and Helen Blank. 2015. Building Blocks: State Child Care Assistance Policies2015. National Women’s Law Center.
Shierholz, Heidi. 2014. “Paid Leave Is Good for Business.” U.S. Department of Labor Blog, December19.
Shonkoff, J.P., and D.A. Phillips. 2000. From Neurons to Neighborhoods: The Science of EarlyChildhood Development. Washington, DC: National Academies Press.
U.S. Bureau of Economic Analysis (BEA). 2016. “Gross Domestic Product (GDP) by State (Millions ofCurrent Dollars),” February.
U.S. Census Bureau American Community Survey. Various years. “S1903: Median Income in the Past12 Months (In 2014 Inflation-Adjusted Dollars).”
U.S. Department of Health and Human Services (HHS). 2014. “Fun”damentals of CCDFAdministration.
Whitebook, Marcy, Laura Sakai, Emily Gerber, and Carollee Howes. 2001. Then and Now: Changes inChild Care Staffing, 1994-2000. Center for the Child Care Workforce.
Wong, Vivian C., Thomas D. Cook, W. Steven Barnett, Kwanghee Jung. 2008. “AnEffectiveness-Based Evaluation of Five State Pre-Kindergarten Programs.” Journal of Policy Analysisand Management, vol. 27, 122–154.
38