economic outlook 2020 and 2021
TRANSCRIPT
ECONOMIC OUTLOOK 2020 AND 2021
23 June 2020

German Council of Economic ExpertsStatistisches Bundesamt65180 WiesbadenTel.: 0049 611 / 75 - 2390Fax: 0049 611 / 75 - 2538E-Mail: [email protected]: www.sachverstaendigenrat-wirtschaft.de
Published on 23 June 2020Data considered up until: 18 June 2020, 12 a.m.
© German Council of Economic Experts
This is a translated version of the original German-language publication „Konjunktur-prognose 2020 und 2021“, which is the sole authoritative text. Please cite the original German-language publication if any reference is made to this text.

Economic Outlook – June 2020
German Council of Economic Experts 1
ECONOMIC OUTLOOK FOR 2020 AND 2021
KEY MESSAGES
The German Council of Economic Experts expects the economy in Germany and the euro area to decline significantly due to the coronavirus pandemic by 6.5 % and 8.5 % in 2020, respectively.
The economic development in 2020 will be divided: After a severe slump in the first half of the year, a slow recovery is likely to set in from summer onwards, such that the German economy will grow by 4.9 % again in 2021.
The global economy is more severely affected and the containment measures in Germany have lasted longer than the German Council of Economic Experts had anticipated in its scenario calcula-tions in March.
The German Council of Economic Experts (GCEE) already published a special report on the coronavirus pandemic in March, in which the GCEE presented scenarios for the further economic development. Today, the GCEE is presenting its updated economic outlook, as the available economic data now allows a better assessment of the economic situation in 2020.
The development of the German economy is likely to be relatively close to the risk scenario described in the Special Report as a "pronounced V". However, the trough will likely be lower than expected therein. The GCEE forecasts the real gross domestic product (GDP) to decline by 6.5 % in 2020 (6.9 % calendar-adjusted). For 2021, it expects positive growth rates of 4.9 % (also 4.9 % calendar-adjusted). Consequently, GDP is unlikely to return to its pre-pandemic level before 2022. The unemployment rate will continue to rise in the coming months and will only start to decline in the course of 2021.
The weak external environment will put a significant burden on German exports this year. The global spread of the coronavirus has led to a deep recession of the world economy. For the euro area, the GCEE expects real GDP to decline by 8.5 % in 2020 and grow again by 6.2 % in 2021.
Worldwide, the pandemic has spread more strongly than initially expected and more ex-tensive containment measures have been taken, some of which are still in place. However, the reduction in the number of new infections and the gradual easing of health policy inter-ventions in Germany and of important trading partners will create the basis for a recovery later this year. In addition, the adopted stabilisation measures and economic policy stimuli are expected to have a positive effect.
The outlook for the further economic development remains subject to considerable uncer-tainty. In particular, the course of the pandemic is of major importance. A significantly longer phase of weak economic development is expected, if the number of new infections can-not be kept at low levels, for example by smart distancing, if the easing of public health in-terventions does not continue and if uncertainty of companies and households is not re-duced.

Economic Outlook – June 2020
German Council of Economic Experts 2
I. INTRODUCTION
1. The global spread of the coronavirus (SARS-CoV-2) has tipped the global econ-omy into a deep recession. Global economic output fell sharply in the first half of 2020. In Germany, the coronavirus pandemic is expected to trigger the biggest decline in economic activity in the history of the Federal Republic.
2. The GCEE already presented a Special Report on the coronavirus pandemic to the Federal Government on 22 March 2020, in which it analysed the development of the pandemic up to that point in time, the public health measures, the economic impact and different economic policy measures. In the absence of data on eco-nomic activity during the pandemic, the Special Report presented calculations for three scenarios for the economic outlook instead of the economic forecast the GCEE usually provides in March. The scenarios made different assumptions regarding the duration and intensity of the public health measures implemented to contain the virus. The calculations produced GDP growth rates for Germany in 2020 of –2.8 % in the baseline scenario, –4.5 % in the "long U" risk scenario and –5.4 % in the "pronounced V" risk scenario.
3. Data for the months of March and April are now available, allowing a point fore-cast to be made – albeit with a high degree of uncertainty – in the form of the usual economic update issued by the GCEE. For 2020, the downturn in Ger-many, estimated at –6.5 % of GDP, is likely to be somewhat more severe overall than assumed in the risk scenario “pronounced V” in the Special Report in March. This is particularly attributable to the fact that the pandemic has devel-oped more dynamically and the containment measures introduced in Germany and many other countries are more extensive and longer-lasting than initially an-ticipated. Furthermore, poorer performance abroad compared to expectations at the start of the pandemic also has an adverse effect on demand for German ex-ports.
4. Given the increasing success of efforts to contain the pandemic and the gradual easing of public health restrictions in Germany and in its important trade part-ners, the economy is likely to begin to recover in the third quarter, however. For 2021, the GCEE expects growth of 4.9 % in Germany. This corresponds to the value calculated under the "pronounced V" risk scenario in the Special Report. The outlook for the future economic development is clouded in considerable uncertainty, however. Much will hinge on the future course of the pandemic. If the number of new cases rose again significantly, this could create a renewed sense of insecurity among economic actors, particularly if the reintroduction of necessary restrictions curbed the economic recovery or even triggered a further decline in GDP.
Economic Outlook – June 2020
German Council of Economic Experts 3
II. INTERNATIONAL ECONOMY
1. Coronavirus pandemic triggers global recession
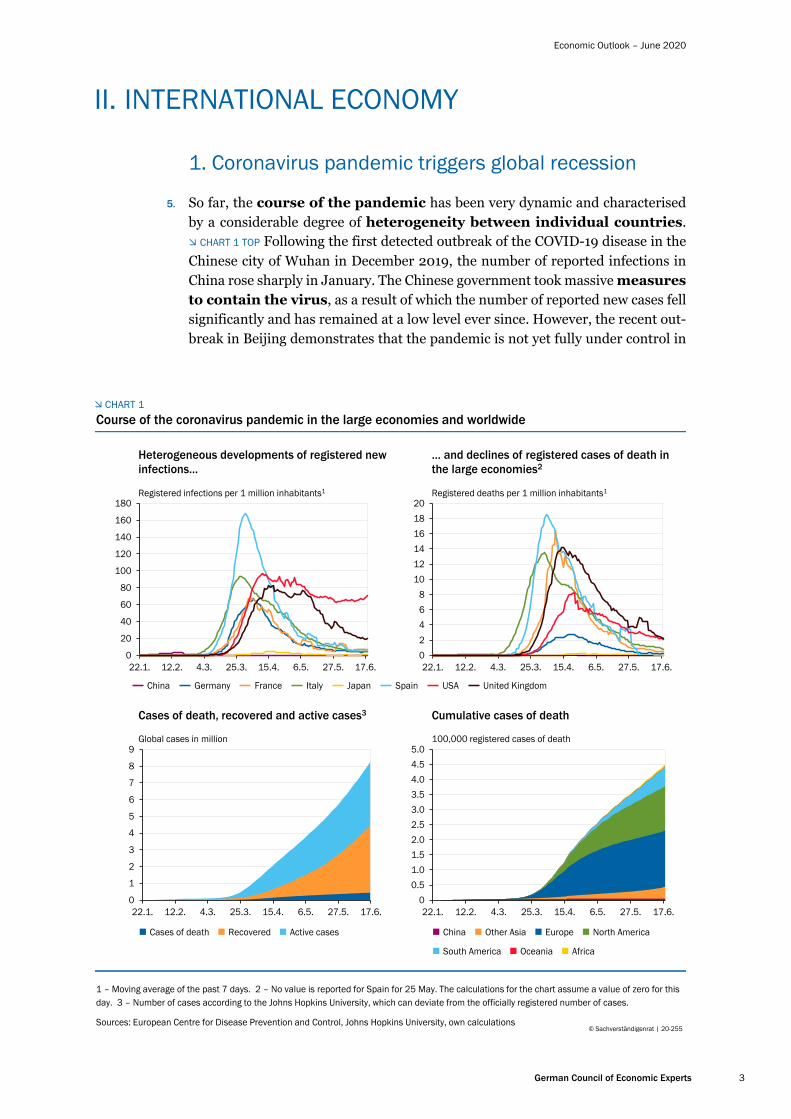
5. So far, the course of the pandemic has been very dynamic and characterised by a considerable degree of heterogeneity between individual countries. CHART 1 TOP Following the first detected outbreak of the COVID-19 disease in the Chinese city of Wuhan in December 2019, the number of reported infections in China rose sharply in January. The Chinese government took massive measures to contain the virus, as a result of which the number of reported new cases fell significantly and has remained at a low level ever since. However, the recent out-break in Beijing demonstrates that the pandemic is not yet fully under control in
CHART 1
Course of the coronavirus pandemic in the large economies and worldwide
0
20
40
60
80
100
120
140
160
180
22.1. 12.2. 4.3. 25.3. 15.4. 6.5. 27.5. 17.6.
Heterogeneous developments of registered new infections…
Registered infections per 1 million inhabitants1
02468
101214161820
22.1. 12.2. 4.3. 25.3. 15.4. 6.5. 27.5. 17.6.
… and declines of registered cases of death in the large economies2
Registered deaths per 1 million inhabitants1
China Germany France Italy Japan Spain USA United Kingdom
0
1
2
3
4
5
6
7
8
9
22.1. 12.2. 4.3. 25.3. 15.4. 6.5. 27.5. 17.6.
Cases of death, recovered and active cases3
Global cases in million
Cases of death Recovered Active cases
00.51.01.52.02.53.03.54.04.55.0
22.1. 12.2. 4.3. 25.3. 15.4. 6.5. 27.5. 17.6.
Cumulative cases of death
100,000 registered cases of death
China Other Asia Europe North America
South America Oceania Africa
1 – Moving average of the past 7 days. 2 – No value is reported for Spain for 25 May. The calculations for the chart assume a value of zero for this day. 3 – Number of cases according to the Johns Hopkins University, which can deviate from the officially registered number of cases.
Sources: European Centre for Disease Prevention and Control, Johns Hopkins University, own calculations© Sachverständigenrat | 20-255

Economic Outlook – June 2020
German Council of Economic Experts 4
China either. Europe became the second centre of the pandemic, with the coun-tries of Spain and Italy particularly badly hit at the start of March. By the end of March, the number of cases in the United Kingdom and the United States was rising sharply. At this stage, many emerging economies are also badly affected by the pandemic, which has since reached all the continents. CHART 1 BOTTOM
Most recently, the number of confirmed coronavirus cases worldwide surpassed 8 million (WHO, 2020; data as of 17 June 2020). According to the WHO, the num-ber of deaths in connection with the coronavirus amounts to over 440 thousand worldwide. With regard to data concerning the number of cases and deaths, it is important to note that differences regarding the use of testing or the defini-tion of cases limit the ability to make comparisons across countries and over time. For example, if the rate of testing is low this can result in only a small number of cases being detected and reported. Potential differences in the number of unre-ported cases would need to be taken into consideration when interpreting the data.
6. Countries around the world have taken numerous measures to contain the pan-demic (GCEE Special Report 2020 items 22 ff.), where in some cases the extent of the measures and the approach taken vary greatly from country to country. In addition to compulsory mask-wearing and physical distancing, measures include bans on large events or gatherings in larger groups, border closures and the clo-sure of schools, childcare facilities, public amenities, restaurants and some areas of retail. Some places temporarily experienced even stricter restrictions on the freedom of movement and more comprehensive closures of production facilities.
CHART 2
Containment measures and economic development during the coronavirus pandemic
0102030405060708090
100
01Jan
15Jan
29Jan
12Feb
26Feb
11Mar
25Mar
08Apr
22Apr
06May
20May
03Jun
17Jun
Countries have taken comprehensive measures to contain the pandemic
Oxford COVID-19 Government Response Stringency Index1
-12
-10
-8
-6
-4
-2
0
15.1.20 29.1.20 12.2.20 26.2.20 11.3.20 25.3.20
Pandemic and containment measures lead to significant declines in GDP
GDP growth2 in the first quarter 2020 in %
Point in time where the cumulative number of cases of registered infections exceeds 1,000
China Germany France Italy Japan Spain United States United Kingdom
1 – The index records the number and stringency of government measures to contain the pandemic without evaluating their suitability. It can take on values between 0 and 100. Beside the closing of schools, production plants or public transport, the recorded measures contain the cancellation of public events and restrictions of the freedom of movement and assembly as well as of international travel. 2 – Price-, seasonally and calendar-adjusted.
Sources: European Centre for Disease Prevention and Control, national statistical offices, Oxford COVID-19 Government Response Tracker, Blavatnik School of Government
© Sachverständigenrat | 20-258
Economic Outlook – June 2020
German Council of Economic Experts 5
The spread of the pandemic over time is reflected in the containment measures. While these already began in China in January and have been eased since the end of March, other countries only introduced measures later on and, consequently, began relaxing restrictions at a later point in time. CHART 2 LEFT In Europe, the number of new cases has dropped significantly since around the end of March, with the result that countries in Europe began easing restrictions at the start of May. While the number of cases in the United States and the United Kingdom has dropped, it is still comparatively high relative to the size of the population when compared with the larger member states of the European Union (EU). In the United States, there has, however, been a shift in the regional concentration of new cases. Restrictions are being lifted in many areas.
Serious economic consequences of the pandemic
7. The pandemic and the measures implemented to contain it have serious economic implications (GCEE Special Report 2020 items 35 ff.), which affect both the supply and demand side of the economy. For example, aggregate supply is limited because workers are absent due to illness or quarantine, or because they need to take care of their children at home due to the closure of schools and child daycare facilities. Factory closures for health policy reasons and lack of input ma-terials due to disruptions in upstream production chains also directly affect the supply side. The closure of restaurants and broad sections of retail limit opportu-nities for private consumption. On the demand side, fear of infection, increased uncertainty and lower income and income expectations are driving down demand for consumer and investment goods at home and abroad.
At this stage, a number of studies are available with macroeconomic models on the eco-nomic impact of the coronavirus pandemic. Some of the analyses -- particularly those with more extensivee models -- capture the pandemic in the form of a combination of macroeco-nomic supply and demand shocks. Other studies link an epidemiological model, the SIR model (susceptible-infected-recovered), to simple, macroeconomic equilibrium models in order to examine the economic implications of the pandemic while taking into account the interaction between economic decisions and the spread of the virus.
In their model, Eichenbaum et al. (2020) demonstrate that the voluntary reduction of con-sumption and output due to the remaining risk of infection does not suffice to contain the pandemic at an early stage. Therefore, state-imposed quarantine measures can have the effect of increasing welfare. Building on this, Krueger et al. (2020) argue that households make endogenous shifts in their consumption behaviour to sectors that have a lower risk of infection. This is consistent with the empirical results of Farboodi et al. (2020) regarding the reduction of social contacts in the United States before the introduction of government quar-antine measures.
Other studies examine how a decline in output due to quarantine measures and reduced consumption by private households due to lost income can be mutually reinforcing. Guerrieri et al. (2020) demonstrate that, in multi-sector models, the loss of income as a result of quar-antine measures in one sector can lead to an aggregate drop in demand that exceeds the drop in supply. In a related model, Bodenstein et al. (2020) find that a deeper recession can occur if a sector that is of central importance for macroeconomic output is particularly hard hit by the pandemic. In a multi-country model, Sforza and Steininger (2020) analyse how
Economic Outlook – June 2020
German Council of Economic Experts 6
global trade and production networks can lead to the international transmission of the eco-nomic shocks caused by the pandemic. In their multi-country model, McKibbin and Fernando (2020) find that the dramatic costs to the economy for all the countries studied justify early investment in prevention measures.
Apart from the direct effects of the coronavirus pandemic on demand, Bayer et al. (2020) highlight that uncertainty regarding future loss of income can lead to an increased tendency to save and therefore additionally drive down private consumption. Pfeiffer et al. (2020) demonstrate that the drop in supply and demand weigh on the gross value added of compa-nies and impedes their access to credit. Due to liquidity constraints, affected companies will reduce investment, which in turn deepens and prolongs the recession. In this context, gov-ernment liquidity assistance is likely to help stabilise the economy.
8. The estimates from the statistical offices now available indicate sharp drops in the gross domestic product (GDP) already in the first quarter of 2020. CHART 2 RIGHT As China was hit by the pandemic earlier than other countries, GDP contraction in the first quarter compared to the previous quarter was particularly pronounced in China, at 9.8 %. With figures of over 5 %, first-quarter GDP con-traction in France, Italy and Spain was also quite substantial, however, and GDP also shrank considerably in the United States and the United Kingdom. Of the major advanced economies, Japan's GDP contracted the least. However, its GDP had already declined markedly in the fourth quarter of 2019 following the increase in the sales tax.
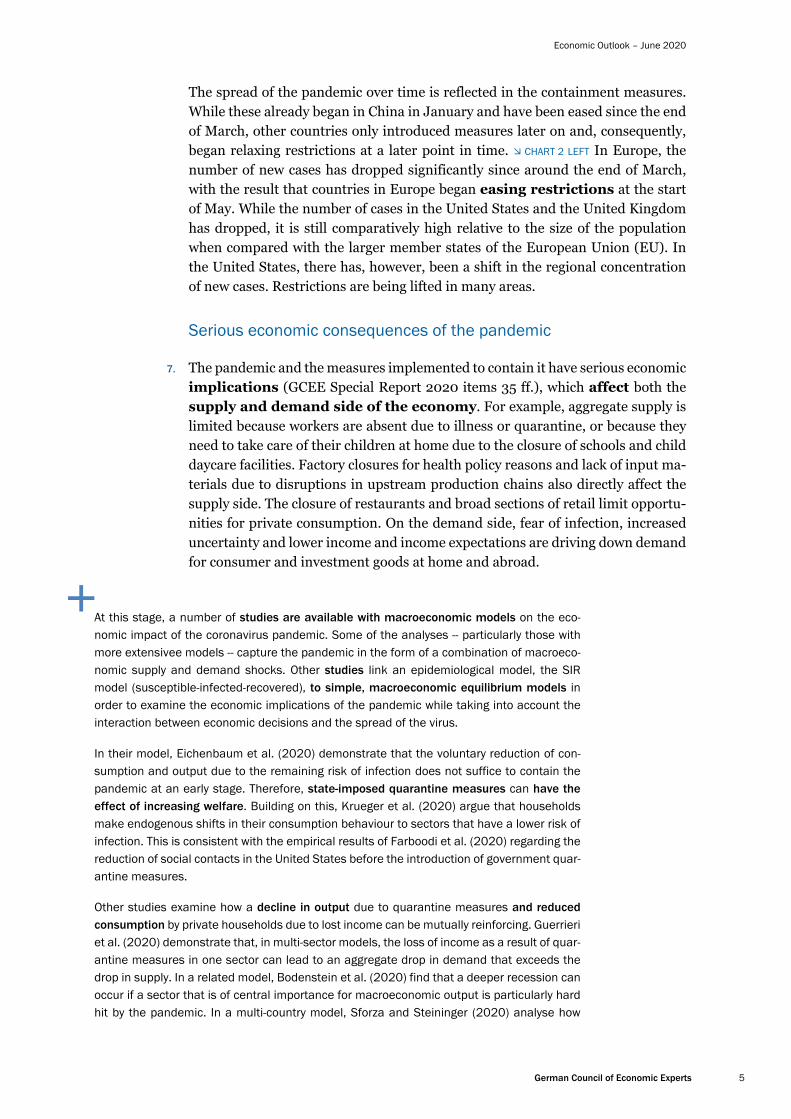
9. The global development of the pandemic and the resulting recession are also re-flected in business surveys. February saw a sharp drop in purchasing man-ager indices in China, for example. CHART 3 LEFT This was particularly pro-
CHART 3
Purchasing Managers’ Indices, uncertainty and oil price
0
10
20
30
40
50
60
January February March April May2020
Purchasing Managers’ Indices increase again after deep setback
Purchasing Managers’ Index (PMI), index points
Manufacturing USA China Euro area
Services USA China Euro area
0102030405060708090100
050
100150200250300350400450500
High uncertainty, low oil price
Index US dollar per barrel
Global Economic Policy Uncertainty Index1
Oil price (Brent, right hand scale)
2018 2019 2020
1 – Index for 21 countries weigthed by the purchasing power adjusted GDP. Average of the years 1997 to 2015 = 100.
Sources: Economic Policy Uncertainty, IHS Markit, Refinitiv Datastream, own calculations© Sachverständigenrat | 20-183
Economic Outlook – June 2020
German Council of Economic Experts 7
nounced in the service sector, which is severely affected by the public health mo-tivated restrictions. While the indices in China began to recover, they fell in the euro area and the United States in March, a drop which intensified significantly in April. In light of the easing of restrictions, the increases in the indices in May suggest that the interim trough has been reached. That said, the figures in the United States and the euro area are still below the growth threshold of 50 points. At the same time, uncertainty remains very high. CHART 3 RIGHT The price of oil recovered somewhat in May, having fallen considerably in March, in large part due to the drop in demand as a result of the pandemic and conflict between oil-producing countries regarding the volume of oil production.
2. First signs of recovery after a sharp downturn
10. The future course of the pandemic, as well as efficient containment measures, methods of treatment and vaccines, will be of vital im-portance in determining the development of the global economy. For the pur-pose of this forecast, the GCEE proceeds from the assumption that the efforts to halt the spread of new infections and to avoid a resurgence of the pandemic, which would come along with reimposing stricter measures, will become increasingly successful. If this is indeed the case, restrictions can continue to be eased and eco-nomic activity can increase again. In this scenario, the risk of infection would be kept as low as possible in a predictable manner by means of suitable measures and regulations, so that businesses and the public would quickly regain confi-dence. If the pandemic follows a different course, this could lead to significant deviations from the projected scenario for the global economy. ITEM 22 The extent to which future development is synchronised on a global scale is also likely to be crucial in determining the further course of the global economy. A lack of synchro-nisation could result in recovery in some economies being stymied by a lack of export demand. In the event of production restrictions, a shortage of intermedi-ate goods could also impede production.
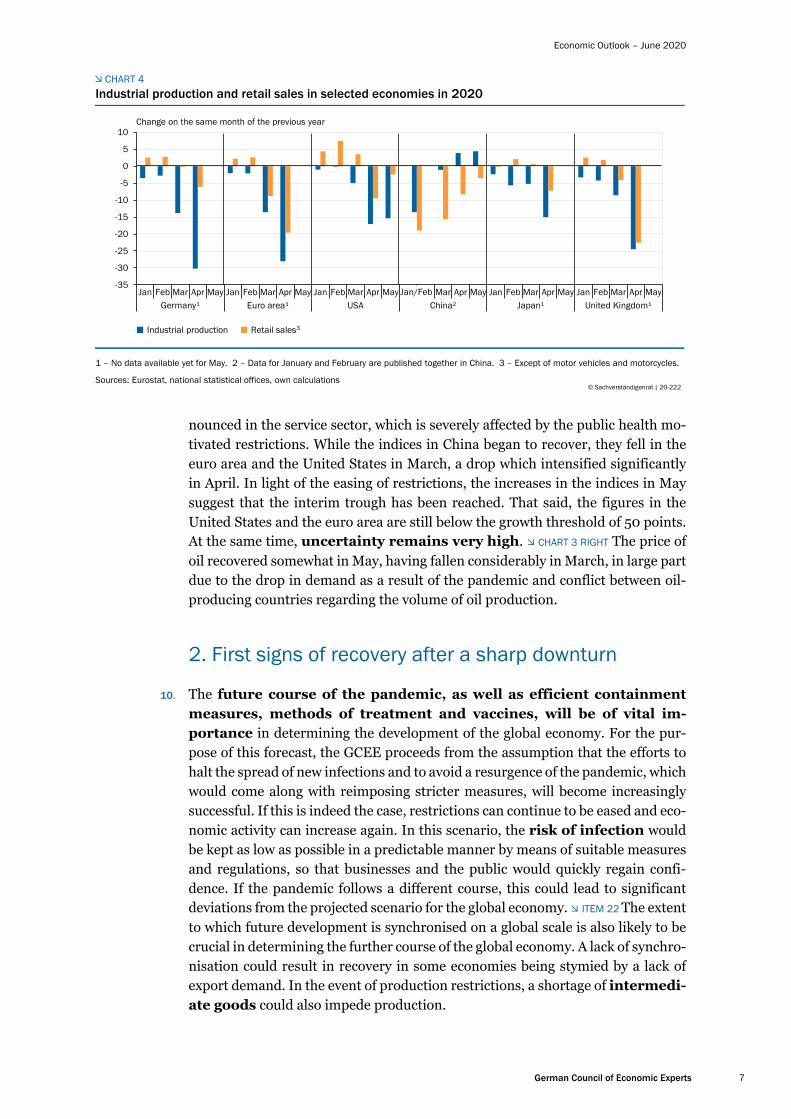
CHART 4
1 – No data available yet for May. 2 – Data for January and February are published together in China. 3 – Except of motor vehicles and motorcycles.
Sources: Eurostat, national statistical offices, own calculations© Sachverständigenrat | 20-222
-35
-30
-25
-20
-15
-10
-5
0
5
10
Jan Feb Mar Apr May Jan Feb Mar Apr May Jan Feb Mar Apr May Mar Apr May Jan Feb Mar Apr May Jan Feb Mar Apr MayGermany¹ Euro area¹ USA China² Japan¹ United Kingdom¹
Change on the same month of the previous year
Industrial production Retail sales3
Jan/Feb
Industrial production and retail sales in selected economies in 2020

Economic Outlook – June 2020
German Council of Economic Experts 8
11. Given the unique historical event that we are experiencing, a considerable amount of uncertainty persists in relation to the severity of the economic downturn during the pandemic restrictions. The monthly values available to date for indus-trial production and retail sales indicate a sharp decline in the large advanced economies CHART 4 In China, there are already some indicators of a certain degree of recovery in economic activity. In the United States, both the increased retail sales in May compared to April and changes in unemployment figures indicate that the preliminary low point could already have been reached in April. For example, the unemployment rate in the United States dropped to 13.3 %, after previously rising by more than 10 percentage points to 14.7 % in April.
12. In the context of the most recent developments, the GCEE expects to see the start of a slow economic recovery in the second half of 2020. In China, recovery may have begun as early as the second quarter of the year. Based on the very low level of activity, the growth rates are likely to be quite high initially. However, it will take most economies some time to return to pre-pandemic levels, given the persistent risk of infection, continuing restrictions, and the income losses that have been suffered. In the services sector, which was particularly badly hit by the virus containment measures, a major catch-up – leading to increased economic activity – seems less likely to occur. On the other hand, monetary and fiscal policies are likely to provide positive stimulus. Many governments and cen-tral banks, not least the Federal Reserve in the United States and the European Central Bank (ECB), have adopted extensive measures (Cavallino and Fiore, 2020; IMF, 2020a).
13. While the Chinese economy may still achieve a positive growth rate of 0.3 % for the full year 2020 and is likely to show strong growth of 8.8 % in 2021, the large advanced economies can expect GDP declines of historic proportions in 2020 TABLE 1 The GCEE anticipates a decline in GDP of 6.1 % in the United States and 4.4 % in Japan. The slump is likely to be even more severe for the large econ-omies in Europe. In 2021, all of the economies under consideration are likely to experience high positive rates of growth due to the effects of recovery. This devel-opment will be reflected in global trade. The GCEE expects the global volume of trade to fall by 9.6 % in 2020 and rise by 8.5 % in 2021, based on the data com-piled by the Bureau for Economic Policy Analysis (CPB) in the Netherlands.
TABLE 1
Growth of gross domestic product1 of selected countries
2019 2.3 6.1 0.7 1.4 1.3 0.6 1.5 0.3 2.0
20203 – 6.1 0.3 – 4.4 – 8.8 – 8.5 – 6.9 –11.0 –11.8 –11.5
20213 4.7 8.8 2.9 4.8 6.2 4.9 8.4 7.0 8.1
1 – Change on previous year in %. Price-adjusted. 2 – Due to the adjustment for calendar effects, the value for GDP growth in Germany in 2020 stated here differs from the unadjusted values stated elsewhere (see Table 4). 3 – Forecast by GCEE. Values are based on seasonal and calendar-adjusted quarterly figures.
Sources: Eurostat, national statistical offices, own calculations © Sachverständigenrat | 20-151
France Italy SpainUSA China Japan
United Kingdom
Euro area
Totalincluding:
Germany2

Economic Outlook – June 2020
German Council of Economic Experts 9
Severe impact on the euro area
14. Of the large economies in the euro area, France, Italy and Spain were particularly severely affected by the pandemic and its economic fallout. The gradual easing of restrictions beginning in May and the reopening of internal European borders in June will likely be accompanied by an increase in economic activity. The speed of easing differs between the member states. The degree to which cross-border tourism is possible and will actually take place, is likely to be of importance for the further development, in particular over the summer, as this sector is of major economic importance to some member states.
15. As most statistical data on economic activity only becomes available with a time lag after the reporting period, estimating the severity of the economic downturn and the extent of the incipient recovery presents a considerable challenge. Real-time indicators may be useful in predicting what will happen in the vari-ous sectors of the economy. These include electricity consumption and mobil-ity data gathered from mobile phones (Felbermayr et al., 2020). In the middle of March, against the backdrop of increasing numbers of infections and the start of restrictions, electricity consumption plummeted in the larger member states in the euro area and has since remained below the levels recorded for the same months in 2019 CHART 5 LEFT While electricity consumption figures have shown signs of moving towards the previous year’s levels since April, the gap is still con-siderable – indicating that industrial activity still remains significantly subdued.
16. Mobility data gathered from mobile phones may provide a point of reference for the effects of the pandemic on retail and the food service industry, for example.
CHART 5
Real-time indicators in selected member states of the euro area during the pandemic 2020
Significant declines in electricity consumption ...
1 – 7-day moving averages. Relative to the respective period in 2019. Seasonally and calendar adjusted. 2 – Deviation from the median of the respec-tive weekday in the reference period from 3 January to 6 February. 3 – Dates are based on the introduction and relaxation of restrictions in production,retail and hospitality. Germany: closure of all non-essential shops from 17 March; possibility of reopening from 6 May. France: national curfew and clo-sure of all non-essential shops from 17 March; lifting of curfew and possibility of reopening from 11 May. Italy: national curfew, closure of all non-essen-tial shops and production from 10 March; lifting of curfew, resumption of production and out-of-home catering from 4 May. Spain: national curfew andclosure of all non-essential shops from 15 March; lifting of curfew from 3 May, but large regional differences.
Germany France
© 20 215Sachverständigenrat | -Sources: ENTSO-E, Google, Meteosat, own calculations
2019 = 1001
... and in movement of passers-by in retailtrade and leisure
Deviation from the reference period2
Italy Spain
60
70
80
90
100
110
120
130
15.2. 29.2. 14.3. 28.3. 11.4. 25.4. 9.5. 23.5. 6.6. 20.6.-100
-80
-60
-40
-20
0
20
15.2. 29.2. 14.3. 28.3. 11.4. 25.4. 9.5. 23.5. 6.6. 20.6.
Start of the respective „lockdown“ and beginning of relaxation3
Economic Outlook – June 2020
German Council of Economic Experts 10
CHART 5 RIGHT In the face of rising numbers of infections and the subsequent shut-down of these sectors, there was a clear drop in mobility in all of the countries under consideration compared with the reference period. According to this data, mobility dropped by more than 80 % in Italy, France and Spain as a result of the strict restrictions on outdoor activities in these member states. Since the begin-ning of May, mobility has been slowly increasing in tandem with the gradual reo-pening of retail outlets, food service businesses and cultural institutions. Analyses of credit card and online transactions paint a similar picture. The clear decline in turnover that occurred against the backdrop of the growing pandemic and the clo-sure of a large number of physical retail outlets is indicative of a significant drop in private consumption. This was only attenuated to a small degree by the move to online retail (Carvalho et al., 2020; Federal Statistical Office, 2020a; In-see, 2020). For France and Germany, the latest data indicates that transactions in brick and mortar businesses are on the rise, while remaining stable in online re-tail.
17. Based on real-time indicators and on estimates obtained using Nowcast models BOX 1 PAGE 21, euro area member states can expect to experience strong declines in GDP in the second quarter. In Spain, Italy and France, GDP in the second quarter is likely to drop by more than 15 %. A significant portion of this reduction is attributable to the decline in economic activity in April. Moreover, growth in the reopened sectors of the economy is likely to gain momentum only slowly in May and June due to the restrictions that remain in place and the high degree of uncertainty that persists. The GCEE expects GDP for the euro area as a whole to fall by 8.5 % in 2020 (calendar-adjusted). Growth is likely to be positive in 2021, and is expected to achieve a rate of 6.2 %. Despite this increase, GDP at the end of 2021 is still likely to be below the level achieved before the coronavirus pandemic.
18. A perceptible rise in unemployment is to be expected in the euro area in the wake of the crisis. This means that the positive trend observed in the labour mar-ket over recent years is at an end for the time being. Changes in the unemployment rate are likely to differ widely between the individual member states due to the varying degrees to which their economies have been impacted and to the institu-tional differences that exist between them. For the euro area as a whole, the GCEE anticipates an annual average unemployment rate of 9.6 % in 2020 and 9.3 % in 2021. This figure was as low as 7.5 % in 2019.
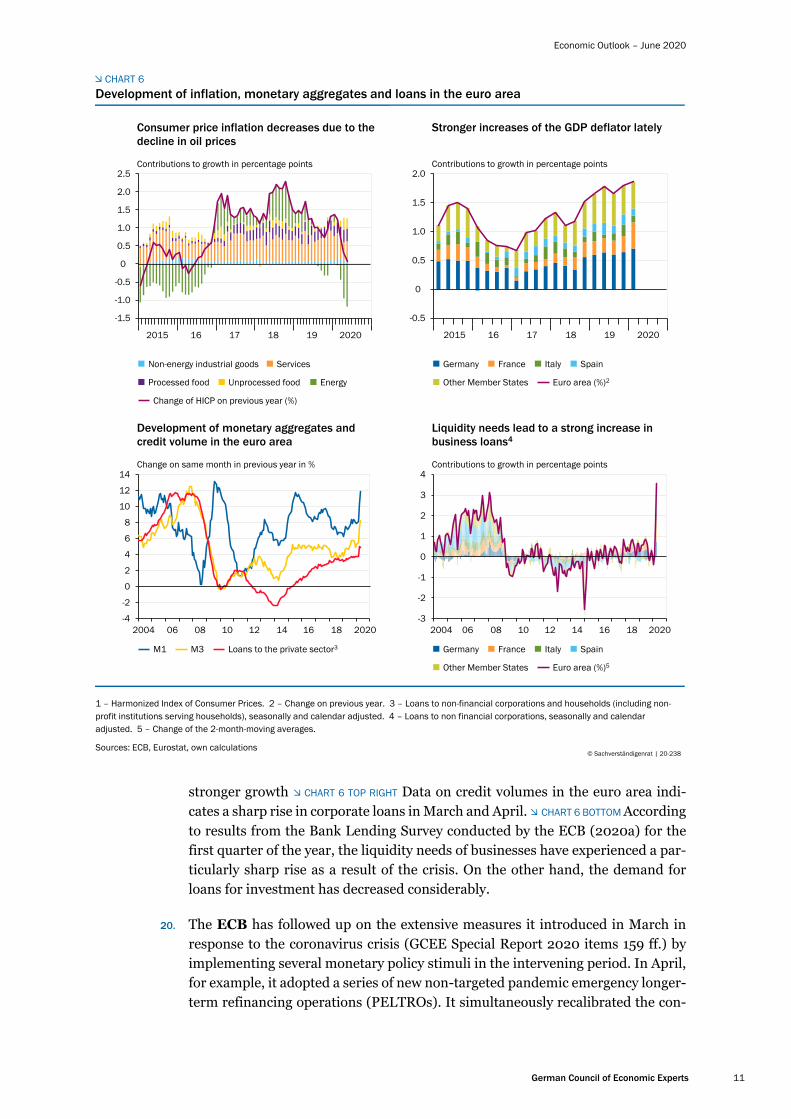
19. While limited availability may lead to rising prices for individual products as a result of the pandemic, the lower levels of demand due to the crisis and the dete-rioration in the labour market situation could have an inflation reducing effect on prices. The temporary tumble in oil prices is simultaneously having a significant effect on the energy component of the Harmonised Index of Consumer Prices (HICP). CHART 6 TOP LEFT Against this backdrop, a clear drop in consumer price inflation is to be expected. The GCEE anticipates a HICP inflation rate of 0.4 % for 2020 and 1.0 %.for 2021. Core inflation, by contrast, is unlikely to experience such a sharp decline. It is likely to reach 0.7 % in 2020 and 0.8 % in 2021. Based on year-on-year comparisons, the GDP deflator has recently shown somewhat
Economic Outlook – June 2020
German Council of Economic Experts 11
stronger growth CHART 6 TOP RIGHT Data on credit volumes in the euro area indi-cates a sharp rise in corporate loans in March and April. CHART 6 BOTTOM According to results from the Bank Lending Survey conducted by the ECB (2020a) for the first quarter of the year, the liquidity needs of businesses have experienced a par-ticularly sharp rise as a result of the crisis. On the other hand, the demand for loans for investment has decreased considerably.
20. The ECB has followed up on the extensive measures it introduced in March in response to the coronavirus crisis (GCEE Special Report 2020 items 159 ff.) by implementing several monetary policy stimuli in the intervening period. In April, for example, it adopted a series of new non-targeted pandemic emergency longer-term refinancing operations (PELTROs). It simultaneously recalibrated the con-
CHART 6
Development of inflation, monetary aggregates and loans in the euro area
-1.5
-1.0
-0.5
0
0.5
1.0
1.5
2.0
2.5
Consumer price inflation decreases due to the decline in oil prices
Contributions to growth in percentage points
Non-energy industrial goods Services
Processed food Unprocessed food Energy
Change of HICP on previous year (%)
2015 202016 17 18 19
-0.5
0
0.5
1.0
1.5
2.0
Stronger increases of the GDP deflator lately
Contributions to growth in percentage points
Germany France Italy Spain
Other Member States Euro area (%)2
2015 202016 17 18 19
-4
-2
0
2
4
6
8
10
12
14
Development of monetary aggregates andcredit volume in the euro area
Change on same month in previous year in %
M1 M3 Loans to the private sector3
2004 202006 08 10 12 14 16 18-3
-2
-1
0
1
2
3
4
Liquidity needs lead to a strong increase in business loans4
Contributions to growth in percentage points
Germany France Italy Spain
Other Member States Euro area (%)5
2004 202006 08 10 12 14 16 18
1 – Harmonized Index of Consumer Prices. 2 – Change on previous year. 3 – Loans to non-financial corporations and households (including non-profit institutions serving households), seasonally and calendar adjusted. 4 – Loans to non financial corporations, seasonally and calendar adjusted. 5 – Change of the 2-month-moving averages.
Sources: ECB, Eurostat, own calculations© Sachverständigenrat | 20-238

Economic Outlook – June 2020
German Council of Economic Experts 12
ditions attached to the targeted longer-term refinancing operations it had previ-ously announced (ECB, 2020b). At its meeting on 4 June, the Governing Council of the ECB also took the decision to increase the envelope of its Pandemic Emergency Purchase Programme (PEPP) by €600 billion t0 €1,350 billion (ECB, 2020c). In addition, the timescale for purchases under the PEPP was ex-tended by a minimum of six months to at least the end of June 2021. The maturing principal payments from securities purchased under the PEPP are to be rein-vested until at least the end of 2022. In the future, the phase out of the PEPP port-folio will be managed in such a way as to avoid interference with monetary policy direction.
21. In addition to the automatic stabilisers, far-reaching fiscal policy measures were taken in response to the crisis. At national level, these took the form of fiscal stim-uli, payment deferrals, guarantees and liquidity supports. To enable the financing of these measures by taking on new debt, the European Commission applied the exemption regulations to the fiscal rules. At European level, the European Union (EU) initially responded to the crisis in March with a package of measures with a value of €37 billion (GCEE Special Report 2020 item 126). In April, the EU mem-ber states agreed on a credit programme totalling €540 billion. In addition to the SURE short-time work scheme and the granting of corporate loans through the European Investment Bank (EIB), the European Stability Mechanism (ESM) al-lows member states to draw on a support fund of up to €240 billion via loans. Various proposals for a European reconstruction fund are also being dis-cussed. A Franco-German initiative proposes a fund for grants totalling €500 bil-lion. Other member states are calling for a smaller fund that could be accessed via loans. The European Commission has proposed a fund of €750 billion, comprising both loans and grants, most of which would not be made available until after the end of the forecast period.
3. Risks and opportunities
22. The outlook for the future economic development is surrounded by considerable uncertainty and numerous risks exist, which, if they were to materialise, would trigger developments that differ from those outlined in the forecast. A further spread of the pandemic represents one such major threat. If, contrary to the assumption in the forecast, it is not possible to keep the number of new infections at a low level, to continue the easing of restrictions and to provide greater cer-tainty, the slowdown can be expected to last much longer. Instead of the (elon-gated, asymmetrical) V-shaped path of the GDP assumed in the forecast, a U-shaped curve would then be the result. Furthermore, given the close interdepend-encies anlong the value chains, restarting production would be delayed in the event of renewed and more extensive production losses in specific areas or re-gions.
A further decline in economic activity would be likely if a strong second wave of infections were to strike, making new restrictions necessary. In these scenarios, economic output is likely to remain below the pre-crisis growth path for much
Economic Outlook – June 2020
German Council of Economic Experts 13
longer than assumed in the forecast (IMF, 2020b; OECD, 2020). A temporary re-duction in potential growth may also occur if the pandemic leads to persistent changes in behaviour that trigger structural adjustments.
23. For example, if bankruptcies were to result in extensive defaults on loans, these could put a strain on the banking system and pose a threat to financial stability. The longer the crisis continues, the more difficult states will find it to bridge this challenging period through government borrowing and support measures. In par-ticular, if a more virulent second wave of the pandemic strikes, risk assessments in relation to the financial markets could look increasingly pessimistic once again, resulting not least in a negative impact on the financing conditions for compa-nies whose level of debt in some cases has already risen considerably in recent years (ECB, 2020d).
24. The large capital outflows from emerging markets that have been observed since the beginning of the year and the associated devaluation of their currencies (IMF, 2020b) have put many emerging markets under economic pressure. Ex-porters of raw materials are affected in particular, as they are vulnerable to the effects of lower prices for crude oil and other raw materials. In addition, the coro-navirus continues to spread in many emerging markets and developing countries. A prolonged crisis could jeopardize the economic stability of these countries. At the same time, any intensification of the economic crisis in emerging markets could have adverse effects on the recovery in the rest of the world via the financial markets and scarce demand for goods. A virulent local outbreak of the virus is also likely to affect economic relations with any affected economies. It would also carry the risk of the virus returning to other regions at a later stage.
25. Other risks exist and if they were to materialise, would severely affect economies weakened by the pandemic. In addition to geopolitical risks, these risks include a renewed intensification of trade conflicts, particularly between the United States and China. With the economic downturn and political disputes surround-ing the pandemic, the arrangements under the provisional agreement regarding import volumes between the two countries are likely to be difficult to fulfil. For an international economic recovery to take place, global value chains must be al-lowed to function. A withdrawal by the European Union or other economic areas from the global division of labour by implementing protectionist measures would hamper such a recovery.
26. In Europe, there is still a risk of an unorderly withdrawal by the United Kingdom from the European single market at the end of the year (GCEE Special Report 2020 item 87). To date, there appears to have been no substantial progress in negotiations on a follow-up agreement. In the meantime, the British govern-ment has ruled out an extension of the transition period.
The economic crisis in the euro area poses a major challenge not least for the member states that were already heavily indebted before the pandemic. If the eco-nomic consequences of the pandemic cannot be kept in check, there is the risk of renewed doubts about the solvency of individual member states. Concerns about the stability and integrity of the monetary union could have a noticeable impact on the further development.
Economic Outlook – June 2020
German Council of Economic Experts 14
27. If the pandemic is suppressed more quickly than currently expected, for example with the early development of an effective vaccine, there are opportunities for stronger growth than expected in the forecast. Greater certainty and the possi-bility of resuming previously restricted activities could provide a significant stim-ulus to growth. Other opportunities may arise if the extensive monetary and fiscal policy measures put in place have a stronger impact than assumed in the forecast or if political agreements manage to reduce uncertainty in other areas of conflict. In addition, households that have so far not suffered serious income losses and that have accumulated higher savings in recent months, due to the prevailing un-certainty and limited options for consumption, could more swiftly draw on these savings and thus further boost consumption.
III. GERMAN ECONOMY
28. The outbreak of the corona pandemic, particularly the changes in behaviour it triggered and the national and international measures that were taken to contain it, led to a massive slump in economic activity in spring. In the second half of March, economic output seems to have fallen by around one sixth (Deutsche Bundesbank, 2020a; ifo Institute, 2020a). In the second quarter of 2020, season-ally adjusted GDP in Germany is likely to be almost 12 % lower than in the final quarter of 2019. Although many restrictions have been gradually eased in the meantime, economic output is likely to remain well below its potential. In ad-dition to continuing restrictions and lower incomes from employment and prop-erty, this is not least due to increased uncertainty.
Until the corona pandemic ends, for example once an effective vaccine is found, economic recovery will depend, among other things, on how well smart distanc-ing will succeed in allowing as much economic activity as possible without risk-ing a second wave of infection or renewed restrictions (Abele-Brehm et al., 2020; Grimm et al., 2020). In addition to the automatic stabilisers, like unemployment insurance and short-time work, and the support measures that were taken early on, the fiscal stimulus measures adopted in early June should have a positive effect on recovery. These measures should help ensure that unemploy-ment does not rise even further.
29. The GCEE expects GDP in Germany to fall by 6.5 % in 2020 (6.9 % after ad-justing for calendar effects). TABLE 2 This means that the economic prospects are worse than was predicted in the scenarios of the Special Report (GCEE Special Report 2020 items 54 ff.). There are essentially three reasons for the downgraded outlook. First, the indicators that have been published in the meantime and the official GDP figures for the first quarter suggest that economic activity has slumped more sharply than could be foreseen in March. Second, the easing took place later and more gradually than had been assumed in the baseline scenario of the Special Report, so that certain activities can still be expected to be partially or completely restricted in the summer. In retrospect, therefore, the duration and impact of the restrictions were closer to the assumptions of the risk scenario.

Economic Outlook – June 2020
German Council of Economic Experts 15
Third, the foreign-trade environment is much more negative than was assumed in March, and this is burdening companies' export prospects. ITEM 8 For the coming year, the GCEE expects growth of 4.9 % (no significant calendar ef-fects). A return to pre-pandemic GDP level is not to be expected before the year 2022.
1. Historic slump in economic output
30. The number of new infections with the coronavirus in Germany has fallen considerably since mid-March; at the same time, the number of people who have recovered is increasing. According to data from the Robert Koch Institute (RKI), several hundred new cases per day have been reported, lately. The figures vary from region to region. For example, no new cases were registered in 145 ad-ministrative districts from 11 to 17 June, while elsewhere there were isolated, localised outbreaks with quite a large number of cases, e.g. at religious events
TABLE 2
Key economic indicators for GermanyUnit 2018 2019 20201 20211
Gross domestic product2 Growth in % 1.5 0.6 – 6.5 4.9
Final consumption expenditure Growth in % 1.3 1.9 – 3.3 3.9
Private consumption3 Growth in % 1.3 1.6 – 5.5 4.7
Government consumption Growth in % 1.4 2.7 2.6 2.0
Gross fixed capital formation Growth in % 3.5 2.6 – 5.2 3.5
Investment in machinery & equipment4 Growth in % 4.4 0.6 – 19.3 8.1
Construction investment Growth in % 2.5 3.8 1.8 1.5
Other products Growth in % 4.3 2.7 0.5 2.6
Domestic demand Growth in % 2.1 1.2 – 3.6 3.7 Growth contribution in percentage points
Exports of goods and services Growth in % 2.1 1.0 – 14.5 8.5
Imports of goods and services Growth in % 3.6 2.5 – 8.9 5.9
Current account balance5 % 7.4 7.1 4.7 5.2
Persons employed (domestic) 1,000 44,854 45,236 44,762 44,585
Persons employed, covered by social security 1,000 32,964 33,518 33,491 33,722
Registered unemployment, stocks 1,000 2,340 2,267 2,719 2,700
Unemployment rate6 % 5.2 5.0 6.1 6.1
Consumer prices7 Growth in % 1.8 1.4 0.6 1.6
General government budget balance8 % 1.9 1.5 – 6.0 – 3.9
Gross domestic product per capita9,10 Growth in % 1.2 0.3 – 6.7 4.7
Gross domestic product, calendar-adjusted10 Growth in % 1.5 0.6 – 6.9 4.9
1 – Forecast by the GCEE. 2 – Price-adjusted. Change on previous year. Also applies to all listed components of GDP. 3 – Including non-profit insti-tutions serving households. 4 – Including military weapon systems. 5 – In relation to GDP. 6 – Registered unemployed in relation to civil labour force. 7 – Change on previous year. 8 – Regional auhorities and social security according to national accounts; in relation to GDP. 9 – Population development according to medium-term projection of the GCEE calculations. 10 – Price-adjusted. Change on previous year.
Sources: Federal Employment Agency, Federal Statistical Office, own calculations© Sachverständigenrat | 20-158
– 3.1 1.3 Net exports – 0.4 – 0.6

Economic Outlook – June 2020
German Council of Economic Experts 16
and private parties, in care homes, meat processing plants and logistics centres (RKI, 2020).
31. The measures against the spread of the coronavirus adopted by the Federal Government and the Länder from mid-March onwards had far-reaching consequences for economic activity. Many economic sectors had to cease their activities completely or could only continue to a limited extent. Particularly affected by the closures were the stationary retail trade (with exceptions for food shops, for example) and consumer-related service sectors such as catering, cul-tural and leisure facilities and tour operators. All educational institutions, such as schools and daycare centres, were also affected by the closures.
32. Since mid-April, the containment measures have been gradually eased. CHART 7 The Länder are largely responsible for deciding the details and pace of easing. The opening of facilities is in some cases subject to strict conditions, which continue to severely impair economic and social activity. For example, rules on
CHART 7
08.06.
Measures to contain the pandemics: Agreements between Bund and Länder
Sources: Agreements between Federal government and Länder, decisions of governemnts of the Länder, Kultusministerkonferenz own illustrations.
© GCEE | 20-164
Hospitality Industry/ Tourism
Cultural events/leisure
Contactrestrictions
16.03. 23.03. 30.03. 06.04. 13.04. 20.04. 27.04. 04.05. 11.05.
Visitation restrictions for clinics and nursing homes
Closing of many shops2
Constraints for gastronomy businesses and partial closings4
Opening under specific regulations6
Closing of all gastronomy businesses5
Rules for distancing/staying in public places1
Retail
18.05. 25.05. 01.06. 15.06.
New measure Aggravation Easing
1 – Minimum distance of 1,5 meters. Staying in public places is only allowed allone, with a single other person not living in the same household or withmembers of the own household. Request to reduce private contacts to people outside the own houselhold to a minimum as well. 2 – Systemicallyrelevant retail is not closed. Service providers and handcraftspersons can still pursue their occupations. Services that require physical proximity areclosed on 22 March. 3 – Opening of shops with less than 800 m2 retail space and car dealers, bicycle dealers and book stores (starting from 6 May, opening of all shops). 4 – Closing of bars, clubs, discoteques, pubs and similar establishments. Cafeterias, restaurants, inns and hotels are allowed toremain open conditionally. No overnight stays for touristic purposes. 5 – Only delivery and pick up of takeaway food for consumption at home. 6 –Gradually opening based on hygiene and distance concepts (e.g. wearing a protective mask; reduced number of customers/guests) and dependent on the infection process. 7 – Exams and exam preparation of graduating classes of the current school year should be able take place again after appropriate preparations. 8 – Under the condition that the infection process is not worsening, the Länder seek to resume normal teaching at schools(with protection and hygiene concept) after the summer holidays at the latest. 9 – Major events, where it is not possible to pursue the contacts ofparticipants and to maintain the hygiene regulations, are prohibited until the end of October 2020.
Meetings with persons from other households possible
Opening of the facilities under specific regulations6
Closing of cultural and religious facilities and sports grounds
The Länder take on responsibility for the larger part of further easing regulations the measures in coordination for the Bund (06.05.2020)
Opening under specific regulations3
Measures stay in place, partially in an eased variant
Cancellation of major events recommended (08.03.)8
Education system
Partial resumption to teaching at schools
Regulations for graduating classes7
Länder decide on closing of schools and childcare facilities
Decision on a stepwise expansion of (emergency) childcare in childcarefacilities (28.04.)
09.03.
Prohibition of major events (12.03.)9

Economic Outlook – June 2020
German Council of Economic Experts 17
distancing and hygiene continue to apply to retail, catering and other con-sumer-related services. Since the end of May, hotels, holiday apartments and holiday homes have been gradually reopening for tourism purposes in view of the upcoming holiday season, albeit with restrictions. Here, the Länder decide on the permissible degree of utilisation and the hygiene regulations that must be observed.
There are still severe restrictions on schools and kindergartens. At the meet-ing between the Federal Government and the Länder in mid-June, however, it was decided to return to normal operations (subject to hygiene requirements) at child-care facilities in the near future and at schools by the end of the summer holidays, if the number of new infections does not increase again.
33. With continued application of restrictions and in view of the global spread of the coronavirus, the outlook for the German economy has deteriorated in recent weeks and months. This has been reflected in considerable downward revi-sions of growth forecasts and scenario calculations by various institutions since early March. CHART 8 LEFT The most recent forecasts for the current year have stabilised at around –7 %. However, the range for the coming year is very wide. CHART 8 RIGHT Although now more information is available on the scale of the economic slump in spring 2020, it is still difficult to estimate how quickly any recovery will set inand how strong it will be. ITEM 47
34. GDP fell by 2.2 % in the first quarter of 2020, making this the most severe slump since the financial crisis of 2008/2009. In the Special Report, the GCEE had assumed a growth rate of –1.5 % in its baseline scenario and –2.0 % in the risk scenario.
CHART 8
GDP growth in Germany: Forecasts and calculations of scenarios at different forecast dates1
-14
-12
-10
-8
-6
-4
-2
0
2
2020%
-19
-21Jan20 Feb20 Mar20 Apr20 May20 Jun20Dec19Nov19
-2
0
2
4
6
8
10
2021%
Jan20 Feb20 Mar20 Apr20 May20 Jun20Dec19Nov19
© Sachverständigenrat | 20-050
1 – The time of the publications of the particular forecasts and scenarios are indicated on the x-axes. 2 – The 18 scenarios for 2020 of the ifo Institute from 22 March 2020 are illustrated as a bandwidth.
Other institutes and organisations(incl. risk scenarios)2
ConsensusGCEE(incl. risk scenarios)
Deutsche Bundesbank(incl. risk scenarios)
Federal Government
Economic Outlook – June 2020
German Council of Economic Experts 18
CHART 9
Selected indicators for the economic development
60
70
80
90
110
120
100
2007 08 09 10 11 12 13 14 15 16 17 18 19 2020
Consumer confidence collapsed
-30
-20
-10
10
20
30
0
85
90
95
100
105
110
115
2007 08 09 10 11 12 13 14 15 16 17 18 19 2020
Manufacturing activity as low as in 2008/2009
Retail sales (right-hand scale)6GfK consumer climate (points)5
2015 = 1001
Consumer confidence indicator (balance)4
1 – . 2 – Volume index. 3 – Seasonally adjust-Thin line: monthly values; bold line: 3-month moving averages. Seasonally and calendar adjusted valuesed values. 4 – The Consumer Confidence Indicator is based on selected questions asked of consumers in accordance with the Joint Harmonised EUProgramme of Business and Consumer Surveys. 5 – Based on about 2,000 consumer interviews per month. 6 – Real index excluding the sale of mo-tor vehicles. 7 – The purchasing managers' index is based on a monthly survey among purchasing managers and managing directors. 8 – Manufac-turing sector, service sector, trade and construction industry.
ProductionNew orders2
10
20
30
40
60
70
50
2007 08 09 10 11 12 13 14 15 16 17 18 19 2020
Sentiment indicators recovered slightly in May ...
Industry Service sector
-60-45-30-15
15304560
0
2007 08 09 10 11 12 13 14 15 16 17 18 19 2020
... however, assessment on balance still negative
Assessment of business situationBusiness climate Business expectations
© 20 163Sachverständigenrat | -Sources: European Commission, GfK, Federal Statistical Office, ifo, IHS Markit, own calculations
Purchase manager index (index points)7
ifo index (business climate balance)8
Balance/points3
2015 = 1001
Economic Outlook – June 2020
German Council of Economic Experts 19
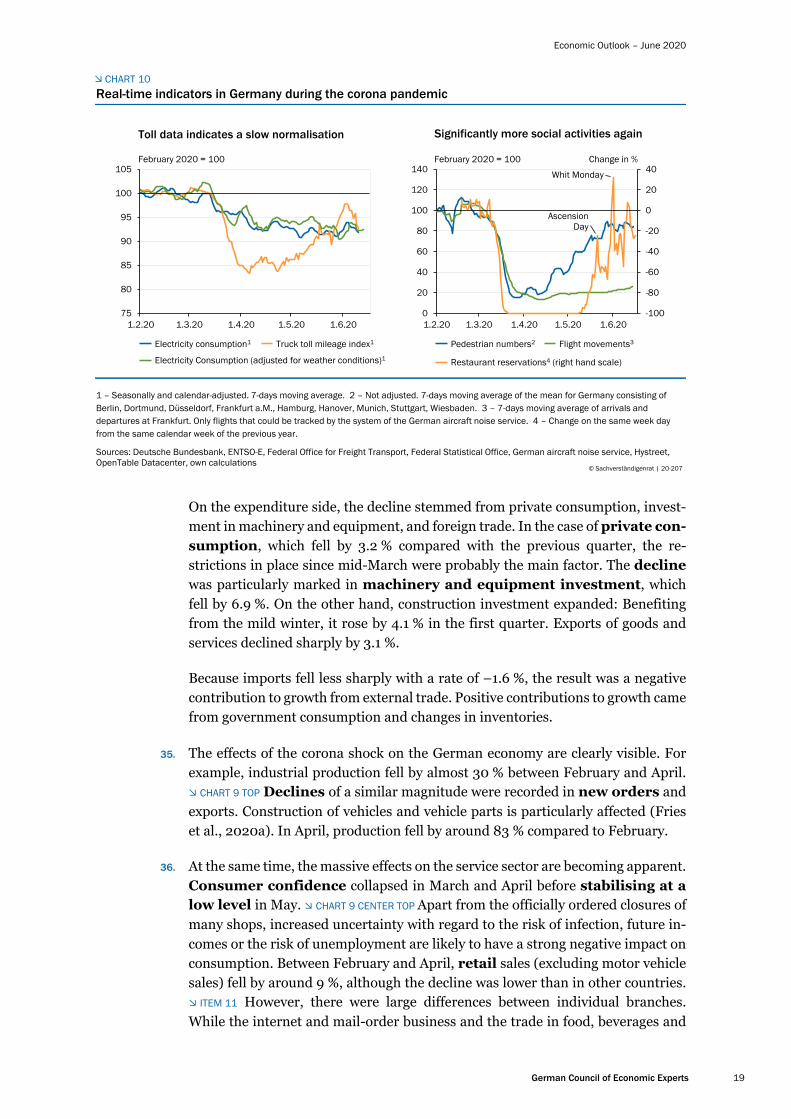
On the expenditure side, the decline stemmed from private consumption, invest-ment in machinery and equipment, and foreign trade. In the case of private con-sumption, which fell by 3.2 % compared with the previous quarter, the re-strictions in place since mid-March were probably the main factor. The decline was particularly marked in machinery and equipment investment, which fell by 6.9 %. On the other hand, construction investment expanded: Benefiting from the mild winter, it rose by 4.1 % in the first quarter. Exports of goods and services declined sharply by 3.1 %.
Because imports fell less sharply with a rate of –1.6 %, the result was a negative contribution to growth from external trade. Positive contributions to growth came from government consumption and changes in inventories.
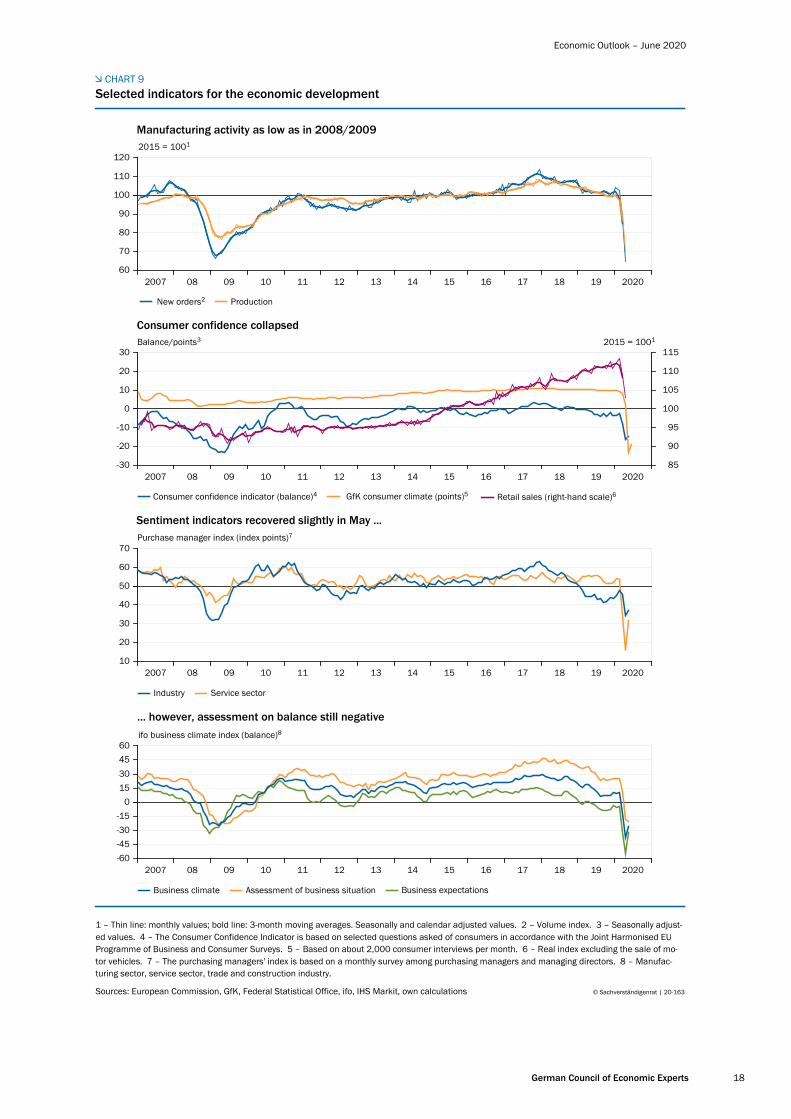
35. The effects of the corona shock on the German economy are clearly visible. For example, industrial production fell by almost 30 % between February and April. CHART 9 TOP Declines of a similar magnitude were recorded in new orders and exports. Construction of vehicles and vehicle parts is particularly affected (Fries et al., 2020a). In April, production fell by around 83 % compared to February.
36. At the same time, the massive effects on the service sector are becoming apparent. Consumer confidence collapsed in March and April before stabilising at a low level in May. CHART 9 CENTER TOP Apart from the officially ordered closures of many shops, increased uncertainty with regard to the risk of infection, future in-comes or the risk of unemployment are likely to have a strong negative impact on consumption. Between February and April, retail sales (excluding motor vehicle sales) fell by around 9 %, although the decline was lower than in other countries. ITEM 11 However, there were large differences between individual branches. While the internet and mail-order business and the trade in food, beverages and
CHART 10
1 – Seasonally and calendar-adjusted. 7-days moving average. 2 – Not adjusted. 7-days moving average of the mean for Germany consisting of Berlin, Dortmund, Düsseldorf, Frankfurt a.M., Hamburg, Hanover, Munich, Stuttgart, Wiesbaden. 3 – 7-days moving average of arrivals and departures at Frankfurt. Only flights that could be tracked by the system of the German aircraft noise service. 4 – Change on the same week day from the same calendar week of the previous year.
Sources: Deutsche Bundesbank, ENTSO-E, Federal Office for Freight Transport, Federal Statistical Office, German aircraft noise service, Hystreet, OpenTable Datacenter, own calculations
© Sachverständigenrat | 20-207
75
80
85
90
95
100
105
1.2.20 1.3.20 1.4.20 1.5.20 1.6.20
Toll data indicates a slow normalisation
February 2020 = 100
Electricity consumption1 Truck toll mileage index1
Electricity Consumption (adjusted for weather conditions)1
-100
-80
-60
-40
-20
0
20
40
0
20
40
60
80
100
120
140
1.2.20 1.3.20 1.4.20 1.5.20 1.6.20
Significantly more social activities again
February 2020 = 100 Change in %
Pedestrian numbers2 Flight movements3
Restaurant reservations4 (right hand scale)
Ascension Day
Whit Monday
Real-time indicators in Germany during the corona pandemic

Economic Outlook – June 2020
German Council of Economic Experts 20
tobacco products grew in April, parts of the stationary retail trade experienced historically unprecedented declines. The same applies to the hospitality indus-try, where turnover was almost halved in March alone.
37. Although companies' business expectations brightened somewhat in May, on balance they remain negative. CHART 9 BOTTOM The development of the purchas-ing managers' index was similar; it has recently recovered somewhat from its historic lows but still remains below the expansion threshold of 50 points. CHART 9 CENTER BOTTOM
38. For the second quarter, the available short-term indicators point to a decline in economic output of around 10 %. BOX 1 The main reason for this is the slump in economic activity between mid-March and early May. Since then, many re-strictions have been partially relaxed. In industries that have been particularly af-fected economically, such as vehicle construction, production has been slowly ramping up again since May. Real-time data also point to a gradual recovery. Elec-tricity consumption at least indicates a bottoming out, while the truck-toll mileage index has risen again significantly since the middle/end of April. CHART 10 LEFT Indicators for the services sector, such as figures for mobility on foot, or restau-rant reservations, also indicate a gradual normalisation. CHART 10 RIGHT Nev-ertheless, economic activity in June is likely to remain below pre-pandemic levels. In some sectors, such as aviation, economic activity remains at a fraction of the normal level. A slow recovery there is unlikely to set in until the summer months.
BOX 1 Nowcasting of GDP in the corona crisis
A historic slump in economic output is expected in the first half of 2020 as a result of the corona pandemic. According to initial figures from the Federal Statistical Office, German GDP fell by 2.2 % in the first quarter. For the second quarter, some estimates put the decline at more than 10 % (Boysen-Hogrefe et al., 2020a; ifo Institute, 2020a; Michelsen et al., 2020). By comparison, the biggest quar-terly decline since quarterly national accounts were first published in 1970 was 4.7 %. GDP fell by this amount between the fourth quarter of 2008 and the first quarter of 2009. While forecasts always in-volve uncertainty, this is especially true during the corona crisis. There are two main challenges for nowcasting.
First, many important indicators are not yet available for the most recent past. This applies in partic-ular to industrial production, where monthly figures are not published until over five weeks after the end of the respective reporting month; they are therefore currently only available up until April. It is therefore uncertain to what extent the downturn in industry intensified further in May, or whether a recovery has already begun. The same applies to turnover in the retail and hospitality sectors. Labour-market indicators and survey data, on the other hand, are available somewhat earlier and show the current development at the latest at the end of each month. Furthermore, real-time data on economic activity are increasingly available, e.g. the truck-toll mileage index, which is constructed by the Federal Statistical Office in cooperation with the Federal Office for Goods Transport (Cox et al., 2018). Since this spring, this index has been published with a few days delay (Federal Statistical Office, 2020b). Other data, for example on electricity consumption published by the Bundesnetzagentur (2020), are available almost immediately. Further real-time indicators include internet searches, e.g. for the term 'short-time work', or flight movements. While the explanatory power of such indicators for GDP growth

Economic Outlook – June 2020
German Council of Economic Experts 21
is usually much lower, at least compared to the industrial data normally used for GDP nowcasting (GCEE Annual Report 2019 box 3), CHART 11 LEFT they do provide early pointers for current macroeconomic activity; they can also be used to supplement missing monthly figures for other indicators such as in-dustrial production.
Second, the question arises as to how reliable the current nowcast models are (BMWi, 2020). A fairly simple forecasting model is based on the historical relationship between changes in GDP and industrial production. Although industry only accounts for about a quarter of total gross value added, its forecast-ing quality for GDP growth is usually high. One reason for that is the high procyclicality of industrial production. Another reason is that the domestic economy is normally much less volatile and less sen-sitive to economic fluctuations. For example, production or incoming orders in industry have generally fallen sharply during recessions, while large parts of the retail sector have remained fairly robust (GCEE Annual Report 2019 items 89 f.). This is not the case with the corona crisis, however. In March, for example, turnover in the hospitality industry fell by almost half against the background of the re-strictions that had been in place since the middle of the month. Activity is likely to have fallen sharply again in April. The retail sector experienced declines in sales of well over 50 % in some cases. Such collapses are unprecedented since the time series began in 1994 (Federal Statistical Office, 2020c, 2020d). Models based on earlier empirical contexts could therefore misjudge the extent of the current economic downturn.
CHART 11
In this forecast, the German Council of Economic Experts therefore uses various models based on twelve indicators. CHART 11 LEFT The aim is to adequately depict the effects of the corona shock on the macro-economy. Missing monthly values are determined on the basis of other information, such as mobility data as an indicator of trends in retail trade. Time series that show a growth trend, such as turnover or produc-tion indices, are expressed as growth rates. One way of nowcasting lies in creating a kind of synthetic GDP. For this purpose, the time series of the indicators are mean-adjusted and their variance normalised to one. The synthetic GDP growth is then the weighted average of the normalised time series. The resulting series is finally adjusted to the mean and variance of the GDP growth series. The weighting of the indicators can
Sources: Deutsche Bundesbank, DFS, ENTSO-E, Eurostat, Federal Statistical Office, Google, ifo, SMARD, own calculations
Real-time indicators and GDP nowcasting
© 20 200Sachverständigenrat | -
1 – GDP growth regressed on constant, delayed GDP growth and indicator (contemporary). Estimated period: 2005Q1–2020Q1. Coefficient ofdetermination (R ). 2 – Google search query for „short-time work“. 3 – Seasonally adjusted 4 – Change on previous quarter in %. 5 –2 Sea-sonally and calendar adjusted. 6 – Change on previous quarter in percentage points. 7 – Change on previous quarter (balance points).8 – Estimate of quarterly GDP growth. Synthetic GDP: indicators standardised, weighted and adjusted to the mean and standard deviation ofGDP growth. Principal component analysis: forecast based on the first factor of the indicators. Bottom-up: forecasts for industry, services andother sectors aggregated by their respective shares of gross value added. Single equation (industry): forecast based on industrial productiongrowth.
R2
Short-time work2
Electricity consumption3,4
Truck toll mileage index4,5
Air passengers carried4,5
Unemployment rate5,6
Vacancies4,5
Business climate (industry)3,7
Business climate (trade)3,7
New passenger car registrations4,5
Sales (retail)4,5
Production (industry)4,5
Sales (hospitality)4,5
0.2 0.4 0.6 0.80 2020Q22020Q1
%Publication
Real
-tim
eEn
dof
mon
th≥
30da
ys
Many indicators with high explanatory value for GDPgrowth available late1
Nowcast models show decline of up to11 % in Q28
-12
-10
-8
-6
-4
-2
0
GDP(officially)
SyntheticGDP
Principalcomponent
analysis
Bottom-up
Singleequation(industry)

Economic Outlook – June 2020
German Council of Economic Experts 22
be based on the correlation with GDP growth or on other considerations. Alternatively, the weights can be determined based on a principal component analysis. Another model estimates GDP using a simple bot-tom-up approach. Here, the gross value added in the industry sector, the service sector as well as other sectors is forecast individually with the help of the various indicators. The forecasts are then weighted with the sectors' respective shares of total gross value added and aggregated to form a nowcast of GDP.
The forecasts determined in this way prove to be quite accurate in an ex-post analysis, although real-time problems or missing monthly figures are not taken into account here. The coefficient of determi-nation for GDP growth – including lagged GDP growth – is above 0.8. In contrast to the simple forecast model, which is based only on industrial production, the models used can depict the extent of the de-cline in the first quarter. CHART 11 RIGHT For the second quarter, the models suggest a decline of GDP of up to –11 %. This would thus again be somewhat higher than the decline assumed in the risk sce-nario “pronounced V” of the March Special Report (GCEE Special Report 2020 item 62). The weekly activity index calculated by the Deutsche Bundesbank (2020b), which is also based on a large number of real-time indicators, most recently (15 June) showed a decline in GDP of 7.8 % over the previous 13 weeks.
2. Recovery after the economic slump
39. The good starting position on the labour market prior to the corona pandemic (GCEE Special Report 2020 items 111 ff.) and the possibility of short-time work have sustained the German labour market. However, the long-standing upward trend in employment has come to an abrupt end. In April 2020, there were about 218,000 fewer people in employment than in the same month of the previous year. The change in the number of hours worked was probably even greater. Based on its survey of companies, the ifo Institute (2020b) estimates that in May 2020 one in five employees subject to social security contributions (7.3 million peo-ple) could have been on short-time work. In May, the unemployment rate rose to 6.1 %, an increase of 1.2 percentage points compared to the same month of the previous year. About 577,000 additional people were registered as unemployed compared to May 2019.
40. The labour market is not expected to recover before the end of the year. The lead-ing indicators of the Institute for Employment Research (IAB) and the ifo Insti-tute indicate that the overall demand for personnel in the economy will con-tinue to decline in the coming months. Not least the development of closures in the coming months will determine the extent to which current short-time work leads to unemployment. Although obligations to file for insolvency have been tem-porarily eased, which is likely to slow down the pace of insolvency in the short term, companies could increasingly use the economic slump for restructuring and, for example, conduct insolvency proceedings under their own management.
The labour volume gand employment are likely to decline significantly in the current year. TABLE 6 ANNEX Due to the negative statistical overhang, employ-ment is expected to decline in the total year 2021. It is likely to rise again slightly over the course of the year, though. Since GDP is falling more sharply than total hours in 2020, there will be a marked decline in labour productivity (per hour
Economic Outlook – June 2020
German Council of Economic Experts 23
worked). It is expected to recover in 2021, but overall it will still be below pre-pandemic levels. TABLE 8 ANNEX
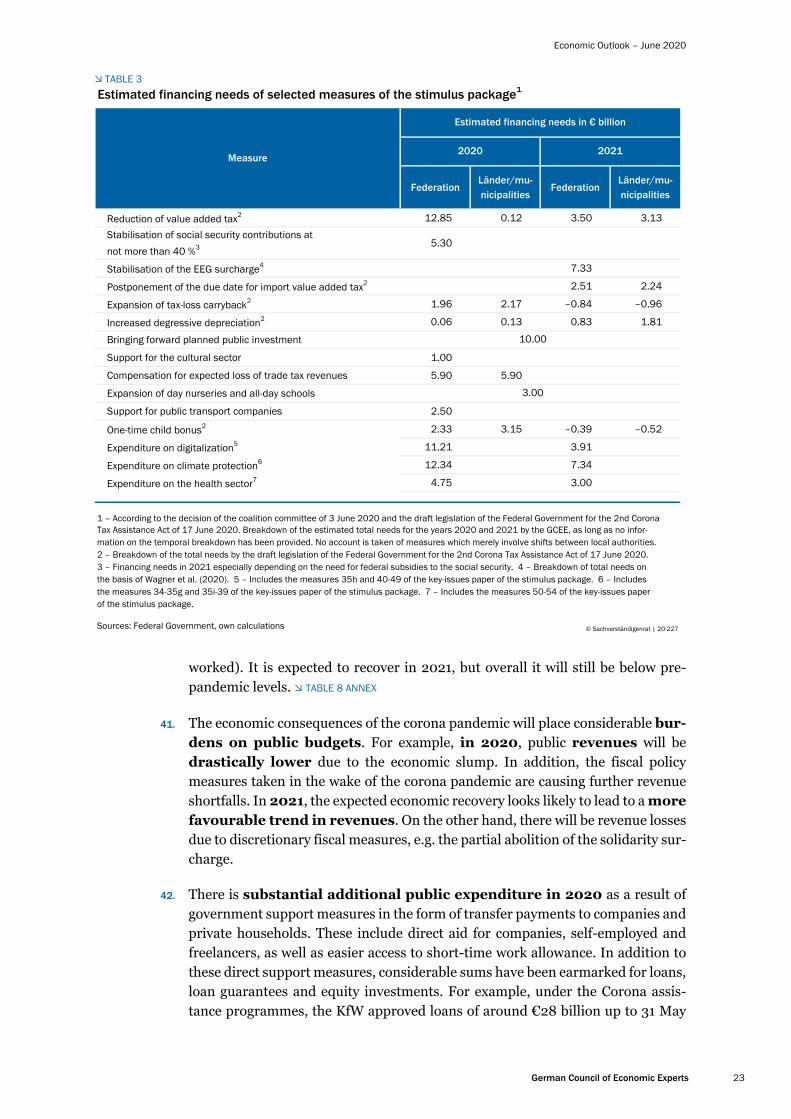
41. The economic consequences of the corona pandemic will place considerable bur-dens on public budgets. For example, in 2020, public revenues will be drastically lower due to the economic slump. In addition, the fiscal policy measures taken in the wake of the corona pandemic are causing further revenue shortfalls. In 2021, the expected economic recovery looks likely to lead to a more favourable trend in revenues. On the other hand, there will be revenue losses due to discretionary fiscal measures, e.g. the partial abolition of the solidarity sur-charge.
42. There is substantial additional public expenditure in 2020 as a result of government support measures in the form of transfer payments to companies and private households. These include direct aid for companies, self-employed and freelancers, as well as easier access to short-time work allowance. In addition to these direct support measures, considerable sums have been earmarked for loans, loan guarantees and equity investments. For example, under the Corona assis-tance programmes, the KfW approved loans of around €28 billion up to 31 May
TABLE 3
Estimated financing needs of selected measures of the stimulus package1
FederationLänder/mu-nicipalities
FederationLänder/mu-nicipalities
Reduction of value added tax2 12.85 0.12 3.50 3.13 Stabilisation of social security contributions at not more than 40 %3 5.30
Stabilisation of the EEG surcharge4 7.33
Postponement of the due date for import value added tax2 2.51 2.24
Expansion of tax-loss carryback2 1.96 2.17 –0.84 –0.96
Increased degressive depreciation2 0.06 0.13 0.83 1.81
Bringing forward planned public investment
Support for the cultural sector 1.00
Compensation for expected loss of trade tax revenues 5.90 5.90
Expansion of day nurseries and all-day schools
Support for public transport companies 2.50
One-time child bonus2 2.33 3.15 –0.39 –0.52
Expenditure on digitalization5 11.21 3.91
Expenditure on climate protection6 12.34 7.34
Expenditure on the health sector7 4.75 3.00
1 – According to the decision of the coalition committee of 3 June 2020 and the draft legislation of the Federal Government for the 2nd Corona Tax Assistance Act of 17 June 2020. Breakdown of the estimated total needs for the years 2020 and 2021 by the GCEE, as long as no infor-mation on the temporal breakdown has been provided. No account is taken of measures which merely involve shifts between local authorities. 2 – Breakdown of the total needs by the draft legislation of the Federal Government for the 2nd Corona Tax Assistance Act of 17 June 2020. 3 – Financing needs in 2021 especially depending on the need for federal subsidies to the social security. 4 – Breakdown of total needs on the basis of Wagner et al. (2020). 5 – Includes the measures 35h and 40-49 of the key-issues paper of the stimulus package. 6 – Includesthe measures 34-35g and 35i-39 of the key-issues paper of the stimulus package. 7 – Includes the measures 50-54 of the key-issues paper of the stimulus package.
Sources: Federal Government, own calculations © Sachverständigenrat | 20-227
3.00
Measure
Estimated financing needs in € billion
2020 2021
10.00

Economic Outlook – June 2020
German Council of Economic Experts 24
2020 (KfW, 2020). However, these loans initially just increase the reported gen-eral-government debt without having an impact on the general-government budget balance. The latter would occur if receivables were to be lost, for example in the course of insolvencies. The supplementary budget for 2020 adopted by the Federal Government in March has a total volume of €156 billion and provides for additional expenditure of €122.5 billion.
43. Furthermore, at the beginning of June 2020, the government coalition adopted the key points of an economic-stimulus and crisis-management package which provides for additional expenditure and tax measures, particularly for 2020 and 2021. The package includes, among other things, an expansion of direct aid to small and medium-sized enterprises, as well as fiscal liquidity support for com-panies, for example by extending tax-loss carryback and degressive depreciation. Furthermore, a temporary cut in the regular and reduced VAT rates is planned for the second half of the year. Other measures include a child bonus and extensive investment and support programmes in the fields of mobility, digitalisation, cli-mate protection and health. To support the local authorities, the Federal Govern-ment and the respective Länder will each bear half of the expected loss of trade tax revenue in 2020.
Most of the burdens on public budgets expected from the economic-stimulus and crisis-management package should focus on 2020. TABLE 3 However, the finan-cial volume estimated by the coalition committee is not the same as the fiscal impulse that these measures are likely to generate. One reason for this is that the temporary support measures are to be financed by unused funds from the first supplementary budget. In addition, some of the planned measureswill lead to a shift between the levels of government. For example, the additional burdens on the Federal Government resulting from the permanent increase in its share in the costs for accommodation and heating are offset by an equal reduction in the share of the municipalities. Last but not least, when planned investment is brought for-ward, it is unclear to what extent it can actually be realised in a timely manner. Estimates by various institutions, including the Deutsche Bundesbank (2020a), conclude that the decline in GDP this year is likely to be around 1 percentage point lower as a result of the measures of the economic-stimulus package.
According to current estimates, the stimulus package could lead to a GDP increase of between 0.8 % and 1.4 % in 2020 and between 0.4 % and 1.7 % in 2021 (Boysen-Hogrefe et al., 2020b; Deutsche Bundesbank, 2020a; IWH, 2020; Michelsen et al., 2020; Wolter et al., 2020). Two aspects are decisive when it comes to the economic impact of one of the largest individual items: the temporary reduction in value added tax from July to December 2020. First, the impact will depend on the extent to which the tax cut is passed on to consumers, thereby raising their real income. Administrative costs resulting from the price conversion and sector-specific competitive pressure are likely to lead to a partial and heterogeneously distributed shift across the sectors (Benedek et al., 2015; Benzarti and Carloni, 2019). Furthermore, Benzarti et al. (2020) show that reductions in VAT are passed on to consumers to a lesser extent than increases. If prices do not fall, there could nevertheless be a positive economic effect because corporate margins would increase.
Secondly, a credible time limit on the measure is needed in order to generate a substitution effect. In view of the expected price increases next year, consumers may prefer to spend

Economic Outlook – June 2020
German Council of Economic Experts 25
their money now (Feldstein, 2002; Hall, 2011; Christofzik et al., 2020). In this case, a noticable effect could be expected, particularly for consumer durables (D'Acunto et al., 2016, 2020; Büttner and Madzharova, 2019). This could counteract the decline in private consumption caused by the high level of uncertainty. Empirical evidence on the temporary cut in VAT in the United Kingdom between 2008 and 2009 suggests a short-term economic stimulus; however, this was followed by a sharp decline after the measure ended (Blundell, 2009; Chirakijja et al., 2009; Crossley et al., 2014).
44. The rapid reaction of monetary and fiscal policy in the spring helped to prevent self-reinforcing downward processes. The short-time-work allowance sta-bilises incomes and prevents a massive increase in unemployment. The provision of liquidity by the ECB ensures favourable financing conditions for companies, households and governments. Furthermore, credit guarantees, direct investments or, for example, regulations on tax-based loss compensation ensure that compa-nies are better able to bridge the loss of revenue during the corona crisis. A neg-ative scenario in which economic activity does not recover in autumn (GCEE Special Report 2020 items 65 f.) therefore seems unlikely.
45. Nevertheless, the overall economic conditions in Germany have deterio-rated compared to March. This applies particularly to the international envi-ronment. ITEM 8 The economic slump in important sales markets such as the rest of the euro area or the United States is likely to be much more severe than had been expected in the baseline scenario of the Special Report in March (GCEE Spe-cial Report 2020 items 68 ff.). One reason for this is that the spread of the virus was quite dynamic in many places and could only be contained slowly. ITEM 5
46. The GCEE expects an average annual GDP growth of –6.5 % (–6.9 % calen-dar adjusted) for this year, taking into account the recently announced eco-nomic-stimulus package. Economic development in the course of 2020 is divided into two parts. CHART 12 LEFT Economic output is expected to slump by more than 10 % in the first half of the year. This would be double the figure assumed in the baseline scenario of the Special Report. In addition to a possibly higher fear of infection and the resulting changes in behaviour, the longer duration of the re-strictions is a major reason for the more severe slump. To estimate the effects on private consumption, the Special Report assumed a shutdown of five weeks fol-lowed by a recovery of three weeks (GCEE Special Report 2020 items 50 ff.). How-ever, the actual development since March has been more in line with the risk sce-nario “pronounced V”, which is based on seven weeks of shutdown and five weeks of recovery.
47. With the gradual easing of restrictions and the decline in infection rates, an eco-nomic recovery looks likely to begin in the summer. A strong rebound effect would significantly boost economic activity in the third quarter. The recovery is shaped by several partially contrary effects. Larger-scale macroeconomic catch-up effects are not to be expected (GCEE Special Report 2020 items 59 ff.). In the services sector in particular, capacity bottlenecks, not least due to contin-uing restrictions, are likely to prevent any making up for lost consumption. Alt-hough catch-up effects are more likely in the case of durable goods, these effects will probably be partly offset by the increased uncertainty and income

Economic Outlook – June 2020
German Council of Economic Experts 26
losses. Nevertheless, private consumption is most likely to return to pre-corona-pandemic levels as many restrictions will be gradually lifted and the desire to shop could increase again. The prerequisite is that containment of the coronavirus con-tinues to be successful.
48. In the forecast it is assumed that it will be possible to contain a potential second wave of infection without further widespread restrictions. The recovery is likely to be positively influenced by behavioural adjustments in companies and households, which, supported by innovations such as smart distancing, will make it possible to deal better with the pandemic. A timely reopening of schools and childcare facilities was announced in June, assuming that infection levels re-main favourable. As long as schools and kindergartens remain partially closed, parents not entitled to emergency childcare would be able to reduce their working hours (Fries et al., 2020b; Fuchs-Schündeln et al., 2020). It is also likely that the combination of mobile working and the need to look after children reduces par-ents' productivity (Ernst, 2020; Fraunhofer FIT, 2020).
49. The worsened external environment will probably weigh much more heavily on German exports this year than was assumed in March. One reason is the high level of uncertainty, e.g. with regard to the duration of the corona crisis, which is likely to result in a low propensity to invest on the part of companies – after already being weak in the past two years (GCEE Annual Report 2019 items 8 f.). Consequently, demand for machinery and vehicles from Germany, for ex-ample, is likely to remain subdued. Although the risk premia for corporate bonds have fallen back from their high levels in mid-March, the loss of income in the last few months puts an additional burden on corporate equity capital or
CHART 12
Expected development in Germany
-12
-9
-6
-3
0
3
6
710
730
750
770
790
810
830
I II III IV I II III IV I II III IV I II III IV2018 2019 2020 2021
GDP growth
GDP1 in billion euro %
Current forecast Annual averages
Change on previous quarter (right hand scale)
Forecast period2
710
730
750
770
790
810
830
I II III IV I II III IV I II III IV I II III IV2018 2019 2020 2021
Comparison with GDP-Scenarios from the Special Report
GDP1 in billion euro
Current forecast
Scenarios from the Special Report March 2020:
Scenario 1 (Baseline scenario)
Scenario 2 (pronounced V)
Scenario 3 (long U)
Forecast period2
1 – Chained volumes (Reference year 2015), seasonally and calendar-adjusted. 2 – Forecast by the GCEE.
Sources: Federal Statistical Office, own calculations© Sachverständigenrat | 20-155

Economic Outlook – June 2020
German Council of Economic Experts 27
makes it more difficult to increase it. In the coming months, companies in Ger-many and worldwide are likely to react to this with a certain reluctance to invest. In addition, delays in restarting international value chains could slow down the recovery of the highly interdependent German economy (Fries et al., 2020a).
50. Similar to the risk scenario “pronounced V” in the Special Report, a return to pre-pandemic levels is currently not expected before the end of 2021. CHART 12 RIGHT For comparison: During the financial crisis, it took until the first quarter of 2011 before the economic level of activity of early 2008 was reached again. It is difficult to estimate when a complete return to (a new) normality will occur. Companies currently consider a normalisation of their business situation in just under nine months to be the most likely scenario, although there are sig-nificant differences between the economic sectors (ifo Institute, 2020a).
For 2021, the GCEE expects an average annual growth rate of 4.9 % (no sig-nificant calendar effects). The year-on-year growth rate would be 5.3 % at the end of 2021. TABLE 4 APPENDIX If an effective vaccine against the coronavirus were to become widely available quickly and immunity were achieved in a large percent-age of the population, the final lifting of restrictions and reduced uncertainty could strengthen economic recovery and allow higher growth in the coming year.
51. Possible negative effects of the corona crisis on the production potential are difficult to assess at present. Based on the medium-term projection from last autumn (GCEE Annual Report 2019 items 130 ff.), the average output gap will be –7.5 % in 2020 and –4.0 % in 2021. However, this would imply that the crisis has no structural impact and therefore does not lead to adjustments in potential out-put. In view of rising unemployment figures, possible insolvencies and fundamen-tal changes in some economic sectors, this is probably questionable. The Deutsche Bundesbank (2020a) expects a strongly negative output gap in the order of –6 % this year, which is expected to close only slightly next year.
52. On the expenditure side, large declines are expected almost across the board this year. In the case of private consumption, this decline is likely to be 5.5 % because of the slump in the first half of the year. The temporary cut in value-added tax is one of the main reasons to expect a strong increase in the second half of the year. A decline of 19.3 % is expected for investments in machinery and equipment. A double-digit slump must also be expected in exports this year. Since this is more negative than the growth in imports, at –14.5 %, contributions to growth from external trade are likely to be strongly negative this year. TABLE 5
ANNEX Although investment in construction is expected to decline in the summer half-year, it is likely to increase by 1.8 % over the year as a whole due to the ex-traordinarily strong first quarter. Government consumption is expected to grow by 2.6 % this year.
All expenditure componentens of GDP are expected to increase in the coming year. The expiry of the cut in VAT will dampen private-consumption growth in the first quarter of 2021. A recovery can nevertheless be expected there soon. By con-trast, at the end of the forecast period investment in machinery and equipment and exports are still likely to be some way below pre-corona-pandemic levels. CHART 13 ANNEX

Economic Outlook – June 2020
German Council of Economic Experts 28
53. The decline in oil prices in spring (GCEE Special Report 2020 item 78) is de-pressing the inflation rate of the consumer price index (CPI) in the course of 2020. In the second half of 2020, furthermore, the temporary cut in VAT is likely to dampen inflationary pressures, before inflation is expected to pick up again next year. Another factor here in addition to the increase in VAT will be the intro-duction of a carbon pricing for the transport and heating sectors. According to estimates, the inflation rate could be 0.5 to 1 percentage point higher next year as a result (Nöh et al., 2020). The GCEE expects an inflation rate of 0.6 % this year and 1.6 % next year. The GDP deflator looks likely to grow by 2.2 % in 2020 and 1.6 % in 2021.
The GCEE expects the unemployment rate to rise further in the coming months before falling back slowly in the course of 2021. Average unemployment rates of 6.1 % each are expected for the years 2020 and 2021. The general-gov-ernment balance (in relation to GDP) is likely to be strongly negative at –6.0 % in 2020 and –3.9 % next year. TABLE 7 ANNEX The debt to GDP ratio is ex-pected to be around 75.2 % of GDP in 2020 and to decline slightly to 73.3 % in 2021.
Economic Outlook – June 2020
German Council of Economic Experts 29
REFERENCES
Abele-Brehm, A. et al. (2020), Die Bekämpfung der Coronavirus-Pandemie tragfähig gestalten, Empfeh-lungen für eine flexible, risikoadaptierte Strategie.
Bayer, C., B. Born, R. Luetticke and G. Müller (2020), The Coronavirus Stimulus Package: How large is the transfer multiplier?, CEPR Discussion Paper DP14600, Centre for Economic Policy Research, Lon-don.
Benedek, D., R.A. de Mooij and P. Wingender (2015), Estimating VAT pass through, IMF Working Paper 15/214, International Monetary Fund, Washington, DC.
Benzarti, Y. and D. Carloni (2019), Who really benefits from consumption tax cuts? Evidence from a large VAT reform in France, American Economic Journal: Economic Policy 11 (1), 38–63.
Benzarti, Y., D. Carloni, J. Harju and T. Kosonen (2020), What goes up may not come down: Asymmetric incidence of value-added taxes, Journal of Political Economy, forthcoming.
Blundell, R. (2009), Assessing the temporary VAT cut policy in the UK, Fiscal Studies 30 (1), 31–38.
BMWi (2020), BIP-Nowcast für das 2. Quartal 2020, Schlaglichter der Wirtschaftspolitik 05/2020, Fe-deral Ministry for Economic Affairs and Energy, Berlin, p. 58.
Bodenstein, M., G. Corsetti and L. Guerrieri (2020), Social distancing and supply disruptions in a pan-demic, Covid Economics – Vetted and Real-Time Papers (19), 1–52.
Boysen-Hogrefe, J. et al. (2020a), Weltwirtschaft und deutsche Konjunktur: Interimsprognose im Früh-jahr 2020, Kiel Policy Brief, Spezial Corona-Update 3, Kiel Institute for the World Economy (IfW).
Boysen-Hogrefe, J., S. Fiedler, D. Groll, N. Jannsen, S. Kooths and S. Mösle (2020b), Deutsche Wirt-schaft vor mühsamer Erholung, Kieler Konjunkturberichte Deutschland 68 (2020 / Q2), Kiel Institute for the World Economy (IfW).
Bundesnetzagentur (2020), SMARD – Strommarktdaten, Stromhandel und Stromerzeugung in Deutsch-land, https://www.smard.de/home, retrieved 9 June 2020.
Büttner, T. and B. Madzharova (2019), Unit sales and price effects of pre-announced consumption tax reforms: Micro-level evidence from European VAT, Working Paper, Friedrich-Alexander-Universität Erlan-gen-Nuremberg.
Carvalho, V. et al. (2020), Tracking the covid-19 crisis with high-resolution transaction data, CEPR Dis-cussion Paper DP14642, Centre for Economic Policy Research, London.
Cavallino, P. and F.D. Fiore (2020), Central banks’ response to Covid-19 in advanced economies, BIS Bulletin 21, Bank for International Settlements, Basel.
Chirakijja, J., C. O’Dea, T.F. Crossley and M. Lührmann (2009), The stimulus effect of the 2008 UK tem-porary vat cut, Proceedings, 102nd Annual Conference on Taxation and Minutes of the Annual Meeting of the National Tax Association, 15–21.
Christofzik, D.I., A. Fuest and R. Jessen (2020), Macroeconomic effects of the anticipation and imple-mentation of tax changes in Germany: Evidence from a narrative account, Ruhr Economic Paper 852, RWI - Leibniz Institute for Economic Research, Essen.
Cox, M., M. Berghausen, S. Linz, C. Fries and J. Völker (2018), Digitale Prozessdaten aus der Lkw-Mauterhebung – neuer Baustein der amtlichen Konjunkturstatistiken, WISTA – Wirtschaft und Statistik 6/2018, 11–32.
Crossley, T.F., H.W. Low and C. Sleeman (2014), Using a temporary indirect tax cut as a fiscal stimulus: Evidence from the UK, IFS Working Paper W14/16, Institute for Fiscal Studies, London.
D’Acunto, F., D. Hoang and M. Weber (2020), Unconventional fiscal policy to exit the COVID-19 crisis, https://voxeu.org/article/unconventional-fiscal-policy-exit-covid-19-crisis, retrieved 8 June 2020.
D’Acunto, F., D. Hoang and M. Weber (2016), The effect of unconventional fiscal policy on consumption expenditure, NBER Working Paper 22563, National Bureau of Economic Research, Cambridge, MA.
Deutsche Bundesbank (2020a), Perspektiven der deutschen Wirtschaft für die Jahre 2020 bis 2022, Monatsbericht Juni 2020, Frankfurt am Main, 1–20.

Economic Outlook – June 2020
German Council of Economic Experts 30
Deutsche Bundesbank (2020b), Neuer Indikator liefert zeitnahes Bild der gesamtwirtschaftlichen Lage, https://www.bundesbank.de/de/aufgaben/themen/neuer-indikator-liefert-zeitnahes-bild-der-gesamt-wirtschaftlichen-lage-833518, retrieved 20 May 2020.
ECB (2020a), The euro area bank lending survey – First quarter of 2020, https://www.ecb.eu-ropa.eu/stats/ecb_surveys/bank_lending_survey/html/ecb.blssurvey2020q1~17a1b2b7d2.en.html, retrieved 28 April 2020.
ECB (2020b), Geldpolitische Beschlüsse, Press release, European Central Bank, Frankfurt am Main, 30 April.
ECB (2020c), Geldpolitische Beschlüsse, Press release, European Central Bank, Frankfurt am Main, 4 June.
ECB (2020d), Financial stability review – May 2020, European Central Bank, Frankfurt am Main, https://www.ecb.europa.eu/pub/financial-stabi-lity/fsr/html/ecb.fsr202005~1b75555f66.en.html#toc2, retrieved 26 May 2020.
Eichenbaum, M.S., S. Rebelo and M. Trabandt (2020), The macroeconomics of epidemics, NBER Work-ing Paper 26882, National Bureau of Economic Research, Cambridge, MA.
Ernst, C. (2020), Homeoffice im Kontext der Corona-Pandemie, Ad-hoc Study, Technische Hochschule Cologne.
Farboodi, M., G. Jarosch and R. Shimer (2020), Internal and external effects of social distancing in a pandemic, NBER Working Paper 27059, National Bureau of Economic Research, Cambridge, MA.
Federal Statistical Office (2020a), Kreditvergaben in der Kreditwirtschaft und Auskünfte für Online-Transaktionen, https://www.destatis.de/DE/Service/EXDAT/Datensaetze/kredite-onlinetransaktio-nen.html, retrieved 18 June 2020.
Federal Statistical Office (2020b), Lkw-Maut-Fahrleistungsindex wird vorübergehend täglich aktualisiert, Press release 129, Wiesbaden, 9 April.
Federal Statistical Office (2020c), Gastgewerbeumsatz im März 2020 um fast die Hälfte eingebrochen, Press release 175, Wiesbaden, 20 May.
Federal Statistical Office (2020d), Einzelhandelsumsatz im April 2020 real 6,5 % niedriger als im April 2019, Press release 192, Wiesbaden, 29 May.
Felbermayr, G., J. Hinz and H. Mahlkow (2020), Deutschlands Wirtschaft seit dem Corona Lockdown, Kiel Policy Brief, Spezial Corona-Update 1, Kiel Institute for the World Economy (IfW).
Feldstein, M. (2002), The role for discretionary fiscal policy in a low interest rate environment, NBER Working Paper 9203, National Bureau of Economic Research, Cambridge, MA.
Fraunhofer FIT (2020), Fraunhofer-Umfrage »Homeoffice«: Erste Ergebnisse, Press release, Fraunhofer Institute for Applied Information Technology, Sankt Augustin, 7 May.
Fries, J.L., N. Garnadt, V. Grimm and L. Nöh (2020a), Europa in der Corona-Krise: Europäische Lieferket-ten müssen europäisch wiederbelebt werden, Wirtschaftsdienst 100 (6), 410–415.
Fries, J.L. et al. (2020b), Nachfrage- und angebotsseitige Einschränkungen der wirtschaftlichen Aktivität in Deutschland infolge der Corona-Pandemie, Working Paper 02/2020, German Council of Economic Experts, Wiesbaden.
Fuchs-Schündeln, N., M. Kuhn and M. Tertilt (2020), The short-run macro implications of school and childcare closures, https://voxeu.org/article/short-run-implications-school-closures, retrieved 30 May 2020.
Grimm, V., F. Mengel and M. Schmidt (2020), Extensions of the SEIR model for the analysis of tailored social distancing and tracing approaches to cope with COVID-19, medRxiv, https://doi.org/10.1101/2020.04.24.20078113.
Guerrieri, V., G. Lorenzoni, L. Straub and I. Werning (2020), Macroeconomic implications of COVID-19: Can negative supply shocks cause demand shortages?, NBER Working Paper 26918, National Bureau of Economic Research, Cambridge, MA.
Hall, R.E. (2011), The long slump, American Economic Review 101 (2), 431–469.
ifo Institute (2020a), ifo Konjunkturprognose Frühjahr 2020 Update: Schrumpfen der Wirtschaft um 6,6 Prozent am wahrscheinlichsten, http://www.ifo.de/ifo-konjunkturprognose/20200528, retrieved 28 May 2020.

Economic Outlook – June 2020
German Council of Economic Experts 31
ifo Institute (2020b), Im Mai waren 7,3 Millionen Beschäftigte in Kurzarbeit, Press release, Munich, 2 June.
IMF (2020a), Policy responses to COVID19, International Monetary Fund, Washington, DC, https://www.imf.org/en/Topics/imf-and-covid19/Policy-Responses-to-COVID-19, retrieved 8 June 2020.
IMF (2020b), World economic outlook, April 2020: The great lockdown, International Monetary Fund, Washington, DC.
Insee (2020), Household consumption, Point de conjoncture – French economic outlook (27 May 2020), Institut national de la statistique et des études économiques, Montrouge, 10–13.
IWH (2020), Konjunktur aktuell: Wirtschaft stellt sich auf Leben mit dem Virus ein, IWH Konjunktur aktu-ell 8 (2), Halle Institute for Economic Research, 26–62.
KfW (2020), Zusagen in den Corona-Programmen (Bundesländer/Landkreise), Stichtag 31. Mai 2020, KfW Group, Frankfurt am Main.
Krueger, D., H. Uhlig and T. Xie (2020), Macroeconomic dynamics and reallocation in an epidemic, NBER Working Paper 27047, National Bureau of Economic Research, Cambridge, MA.
McKibbin, W.J. and R. Fernando (2020), The global macroeconomic impacts of COVID-19: Seven scenar-ios, CAMA Working Paper 19/2020, Centre for Applied Macroeconomic Analysis, Crawford School of Public Policy, The Australian National University, Canberra.
Michelsen, C. et al. (2020), Deutsche Wirtschaft: Schleppende Erholung nach tiefem Fall: Grundlinien der Wirtschaftsentwicklung im Sommer 2020, DIW Wochenbericht 87 (24), German Institute for Econo-mic Research, Berlin, 420–436.
Nöh, L., F. Rutkowski and M. Schwarz (2020), Auswirkungen einer CO2-Bepreisung auf die Verbraucher-preisinflation, Working Paper 03/2020, German Council of Economic Experts, Wiesbaden.
OECD (2020), Economic outlook: Volume 2020 Issue 1 – Preliminary version, OECD Publishing, Organi-sation for Economic Co-operation and Development, Paris.
Pfeiffer, P., W. Roeger and J. in ’t Veld (2020), The COVID19-pandemic in the EU: Macroeconomic trans-mission and economic policy response, ECFIN Discussion Paper, European Commission, Brussels, in press.
RKI (2020), Aktueller Lage-/Situationsbericht des RKI zu COVID-19, Robert Koch Institute, https://www.rki.de/DE/Content/InfAZ/N/Neuartiges_Coronavirus/Situationsberichte/Gesamt.html, ret-rieved 18 June 2020.
Sforza, A. and M. Steininger (2020), Globalization in the time of COVID-19, Covid Economics – Vetted and Real-Time Papers (19), 159–210.
Wagner, J., F. Arnold and S. Jeddi (2020), Einfluss der Covid-19-Pandemie auf den Großhandelsstrom-preis und die EEG-Umlage, EWI- Short analysis on behalf of E.ON SE, Institute of Energy Economics at the University of Cologne.
WHO (2020), Coronavirus disease (COVID-19) situation report 149, World Health Organization, Geneva.
Wolter, M.I., R. Helmrich, C. Schneemann, E. Weber and G. Zika (2020), Auswirkungen des Corona-Kon-junkturprogramms auf Wirtschaft und Erwerbstätigkeit, IAB Discussion Paper 18/2020, Institute for Employment Research, Nuremberg.
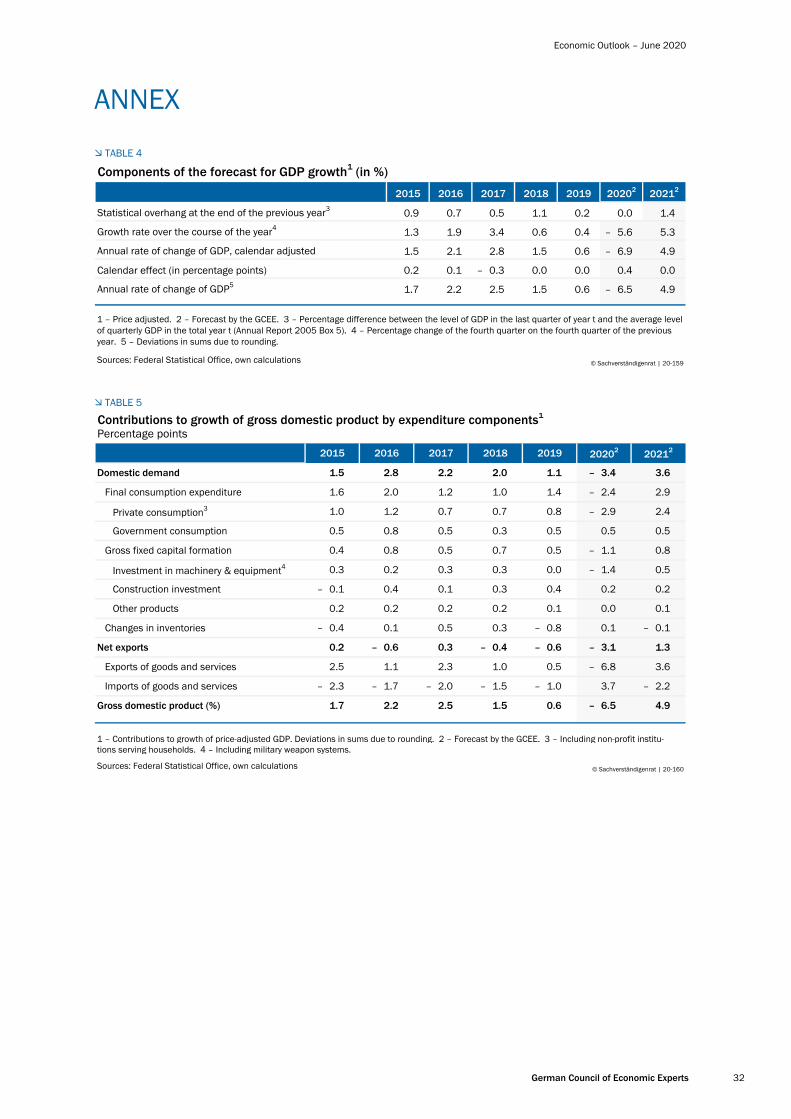
Economic Outlook – June 2020
German Council of Economic Experts 32
ANNEX
TABLE 4
TABLE 5
Components of the forecast for GDP growth1 (in %)2015 2016 2017 2018 2019 20202 20212
Statistical overhang at the end of the previous year3 0.9 0.7 0.5 1.1 0.2 0.0 1.4
Growth rate over the course of the year4 1.3 1.9 3.4 0.6 0.4 – 5.6 5.3
Annual rate of change of GDP, calendar adjusted 1.5 2.1 2.8 1.5 0.6 – 6.9 4.9
Calendar effect (in percentage points) 0.2 0.1 – 0.3 0.0 0.0 0.4 0.0
Annual rate of change of GDP5 1.7 2.2 2.5 1.5 0.6 – 6.5 4.9
1 – Price adjusted. 2 – Forecast by the GCEE. 3 – Percentage difference between the level of GDP in the last quarter of year t and the average level of quarterly GDP in the total year t (Annual Report 2005 Box 5). 4 – Percentage change of the fourth quarter on the fourth quarter of the previous year. 5 – Deviations in sums due to rounding.
Sources: Federal Statistical Office, own calculations © Sachverständigenrat | 20-159
Contributions to growth of gross domestic product by expenditure components1
Percentage points
2015 2016 2017 2018 2019 20202 20212
Domestic demand 1.5 2.8 2.2 2.0 1.1 – 3.4 3.6
Final consumption expenditure 1.6 2.0 1.2 1.0 1.4 – 2.4 2.9
Private consumption3 1.0 1.2 0.7 0.7 0.8 – 2.9 2.4
Government consumption 0.5 0.8 0.5 0.3 0.5 0.5 0.5
Gross fixed capital formation 0.4 0.8 0.5 0.7 0.5 – 1.1 0.8
Investment in machinery & equipment4 0.3 0.2 0.3 0.3 0.0 – 1.4 0.5
Construction investment – 0.1 0.4 0.1 0.3 0.4 0.2 0.2
Other products 0.2 0.2 0.2 0.2 0.1 0.0 0.1
Changes in inventories – 0.4 0.1 0.5 0.3 – 0.8 0.1 – 0.1
Net exports 0.2 – 0.6 0.3 – 0.4 – 0.6 – 3.1 1.3
Exports of goods and services 2.5 1.1 2.3 1.0 0.5 – 6.8 3.6
Imports of goods and services – 2.3 – 1.7 – 2.0 – 1.5 – 1.0 3.7 – 2.2
Gross domestic product (%) 1.7 2.2 2.5 1.5 0.6 – 6.5 4.9
1 – Contributions to growth of price-adjusted GDP. Deviations in sums due to rounding. 2 – Forecast by the GCEE. 3 – Including non-profit institu-tions serving households. 4 – Including military weapon systems.
Sources: Federal Statistical Office, own calculations © Sachverständigenrat | 20-160

Economic Outlook – June 2020
German Council of Economic Experts 33
TABLE 6
Labour market in Germany1,000 persons
2018 2019 20201 20211 20201 20211
Labour force2 46,177 46,459 46,528 46,321 0.1 – 0.4
Unemployed persons3 1,468 1,374 1,862 1,857 35.5 – 0.3
Commuter balance4 145 151 96 121 – 36.3 25.7
Employed persons5 44,854 45,236 44,762 44,585 – 1.0 – 0.4
Self employed persons 4,223 4,149 3,978 3,819 – 4.1 – 4.0
Employees 40,631 41,087 40,784 40,766 – 0.7 0.0
Employees subject to social security contributions 32,964 33,518 33,491 33,722 – 0.1 0.7
Marginally employed persons (ILO concept)6 5,277 5,181 5,072 4,963 – 2.1 – 2.2
Marginally employed persons (FEA concept)7 7,498 7,526 7,287 7,121 – 3.2 – 2.3
Exclusively marginally employed 4,671 4,579 4,375 4,200 – 4.5 – 4.0
Marginally employed in second job 2,826 2,947 2,912 2,921 – 1.2 0.3
Registered unemployed persons 2,340 2,267 2,719 2,700 20.0 – 0.7
Underemployment excluding short-time work8 3,285 3,200 3,838 3,809 20.0 – 0.8
Short-time workers (Employment equivalence) 43 47 1,512 295 3116.4 – 80.5
Labour volume (million hours)9 62,344 62,706 60,042 61,778 – 4.2 2.9
Unemployment rate (FEA)10,11 5.2 5.0 6.1 6.1 1.1 0.0
Unemployment rate (ILO)11,12 3.4 3.2 4.3 4.3 1.1 0.0
1 –Forecast by the GCEE. 2 – Persons in their working age with residence in Germany (national concept); as defined by the national accounts sys-tems. 3 – ILO concept. 4 – Difference of employed workers commuting from foreign countries to Germany and those commuting from Germany to foreign countries. 5 – Employed persons in Germany independent of their residence (domestic concept). 6 – Employees not fully subject to social security contributions but who are employed according to the ILO labour force concept, especially exclusively marginally employed workers and per-sons with employment opportunities („1-Euro-Jobs”). 7 – Employed workers with a wage up to 450 Euro (§ 8 Absatz 1 Nr. 1 SGB IV). 8 – According to the concept of underemployment by the FEA. 9 – Working hours of employed persons working in Germany. 10 – Registered unemployed persons in relation to civilian labour force. 11 – Yearly averages in %; change on previous year in percentage points. 12 – Unemployed persons in relation to the labour force, in each case persons in private households aged from 15 to 74 years.
Sources: Eurostat, Federal Employment Agency (FEA), Federal Statistical Office, Institute for Employment Research (IAB), own calculations© Sachverständigenrat | 20-209
Yearly averages Change on previous year in %

Economic Outlook – June 2020
German Council of Economic Experts 34
TABLE 7
General government revenues and expenditures and selected fiscal indicators1
2019 20202 20212 20202 20212
Total revenues 1,608.5 1,533.2 1,601.0 – 4.7 4.4
Taxes 826.6 750.6 801.7 – 9.2 6.8
Social contributions 597.6 595.8 606.9 – 0.3 1.9
Other revenues3 184.3 186.9 192.5 1.4 3.0
Total expenditures 1,558.1 1,728.7 1,737.5 10.9 0.5
Intermediate consumption 178.9 192.8 201.5 7.8 4.5
Compensation of employees 271.4 281.8 289.2 3.8 2.6
Property income (including interest) payable 27.6 25.5 24.6 – 7.4 – 3.6
Subsidies payable 30.9 91.5 54.4 195.8 – 40.5
Social benefits other than social transfers in kind 545.7 594.9 598.2 9.0 0.6
Social benefits in kind 299.9 310.8 327.6 3.6 5.4
Gross capital formation 85.5 91.5 97.4 6.9 6.5
Other expenditures4 118.0 139.9 144.6 18.5 3.3
Net borrowing/net lending 50.4 – 195.4 – 136.5 x x
Fiscal indices (%)5
Public spending ratio6 45.4 52.7 49.7 x x
Government consumption ratio 20.3 22.4 21.9 x x
Social contributions ratio7 16.2 16.9 16.1 x x
Tax ratio8 24.4 23.2 23.3 x x
Tax and contribution ratio9 40.6 40.1 39.4 x x
Net lending/net borrowing 1.5 – 6.0 – 3.9 x x
Debt-to-GDP ratio10 59.8 75.2 73.3 x x
Interest-to-tax ratio11 3.3 3.4 3.0 x x
1 – National accounts (nominal values). 2 – Forecast by the GCEE. 3 – Sales, other subsidies on production, property income, other current trans-fers, capital transfers. 4 – Other current transfers, capital transfers, other taxes on production, and net acquisition of non-financial non-produced assets. 5 – In relation to GDP. 6 - Total expenditures. 7 – Social contributions without imputed social contributions. 8 – Taxes including inherit-ance tax and taxes to the EU. 9 - Taxes including inheritance tax and taxes to the EU, and actual social contributions. 10 – Forecast by the GCEE for the general government gross debt as defined in the Maastricht Treaty. 11 – Interest payable in relation to taxes including inheritance tax.
Sources: Deutsche Bundesbank, Federal Statistical Office, own calculations© Sachverständigenrat | 20-182
Billion euroChange on previous year
in %

Economic Outlook – June 2020
German Council of Economic Experts 35
CHART 13
Components of the German GDP1
-30
-25
-20
-15
-10
-5
0
5
10
260
280
300
320
340
360
380
400
420
Exports of goods and services
Billion euro %
2018 2019 2020 2021
Change on the previous year in %2
2.1 0.92.1 1.0 -4.4 -14.5 8.53.6-30
-25
-20
-15
-10
-5
0
5
10
240
260
280
300
320
340
360
380
400
Imports of goods and services
Billion euro %
2018 2019 2020 2021
Change on the previous year in %2
3.6 1.93.6 2.5 -0.9 -8.9 5.93.1
-32
-24
-16
-8
0
8
16
35
40
45
50
55
60
65
Investment in machinery & equipment3
Billion euro %
2018 2019 2020 2021
Change on the previous year in %2
4.4 0.64.4 0.6 -6.8 -19.3 8.14.3-32
-24
-16
-8
0
8
16
74
76
78
80
82
84
86
Construction investment
Billion euro %
2018 2019 2020 2021
Change on the previous year in %2
2.5 3.92.5 3.8 2.7 1.8 1.52.2
-15
-12
-9
-6
-3
0
3
6
9
360
370
380
390
400
410
420
430
440
Private consumption4
Billion euro %
2018 2019 2020 2021
Change on the previous year in %2
1.3 1.61.3 1.6 -3.0 -5.5 4.74.5-15
-12
-9
-6
-3
0
3
6
9
140
145
150
155
160
165
170
175
180
Government consumption
Billion euro %
2018 2019 2020 2021
Change on the previous year in %2
1.4 2.61.4 2.7 2.3 2.6 2.02.0
Chained volumes5 Annual averages Change over previous quarter (right hand scale)
SR 2020 (baseline scenario)Current forecast
Current forecast SR 2020 (baseline scenario)Current forecast
Forecast period6
1 – All components of GDP reported price-adjusted. 2 – Not seasonnally and calendar adjusted. 3 – Including military weapon systems. 4 – Inclu-ding non-profit institutions serving households. 5 – Seasonally and calendar-adjusted. 6 – Forecasts by the GCEE.
Sources: Federal Statistical Office, own calculations© Sachverständigenrat | 20-162
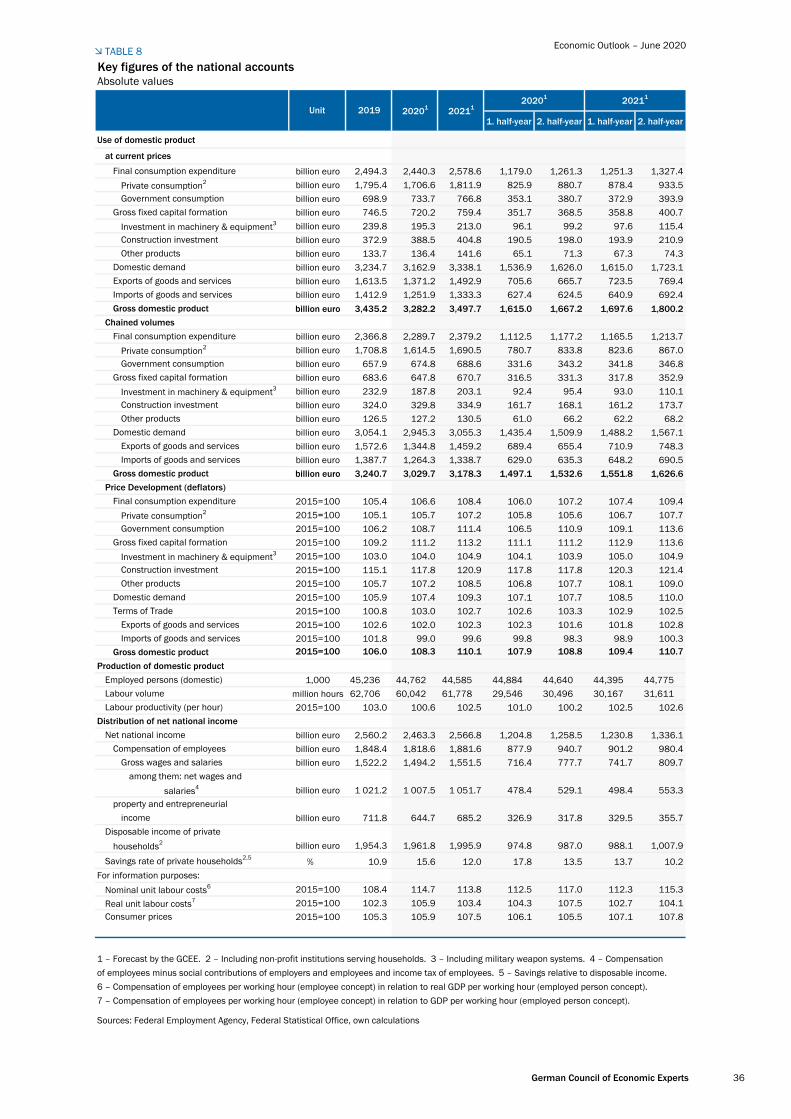
Economic Outlook – June 2020
German Council of Economic Experts 36
TABLE 8
Key figures of the national accountsAbsolute values
1. half-year 2. half-year 1. half-year 2. half-year
Use of domestic product
at current prices
Final consumption expenditure billion euro 2,494.3 2,440.3 2,578.6 1,179.0 1,261.3 1,251.3 1,327.4Private consumption2 billion euro 1,795.4 1,706.6 1,811.9 825.9 880.7 878.4 933.5Government consumption billion euro 698.9 733.7 766.8 353.1 380.7 372.9 393.9
Gross fixed capital formation billion euro 746.5 720.2 759.4 351.7 368.5 358.8 400.7Investment in machinery & equipment3 billion euro 239.8 195.3 213.0 96.1 99.2 97.6 115.4Construction investment billion euro 372.9 388.5 404.8 190.5 198.0 193.9 210.9Other products billion euro 133.7 136.4 141.6 65.1 71.3 67.3 74.3
Domestic demand billion euro 3,234.7 3,162.9 3,338.1 1,536.9 1,626.0 1,615.0 1,723.1Exports of goods and services billion euro 1,613.5 1,371.2 1,492.9 705.6 665.7 723.5 769.4Imports of goods and services billion euro 1,412.9 1,251.9 1,333.3 627.4 624.5 640.9 692.4Gross domestic product billion euro 3,435.2 3,282.2 3,497.7 1,615.0 1,667.2 1,697.6 1,800.2
Chained volumesFinal consumption expenditure billion euro 2,366.8 2,289.7 2,379.2 1,112.5 1,177.2 1,165.5 1,213.7
Private consumption2 billion euro 1,708.8 1,614.5 1,690.5 780.7 833.8 823.6 867.0Government consumption billion euro 657.9 674.8 688.6 331.6 343.2 341.8 346.8
Gross fixed capital formation billion euro 683.6 647.8 670.7 316.5 331.3 317.8 352.9Investment in machinery & equipment3 billion euro 232.9 187.8 203.1 92.4 95.4 93.0 110.1Construction investment billion euro 324.0 329.8 334.9 161.7 168.1 161.2 173.7Other products billion euro 126.5 127.2 130.5 61.0 66.2 62.2 68.2
Domestic demand billion euro 3,054.1 2,945.3 3,055.3 1,435.4 1,509.9 1,488.2 1,567.1Exports of goods and services billion euro 1,572.6 1,344.8 1,459.2 689.4 655.4 710.9 748.3Imports of goods and services billion euro 1,387.7 1,264.3 1,338.7 629.0 635.3 648.2 690.5
Gross domestic product billion euro 3,240.7 3,029.7 3,178.3 1,497.1 1,532.6 1,551.8 1,626.6Price Development (deflators)
Final consumption expenditure 2015=100 105.4 106.6 108.4 106.0 107.2 107.4 109.4Private consumption2 2015=100 105.1 105.7 107.2 105.8 105.6 106.7 107.7Government consumption 2015=100 106.2 108.7 111.4 106.5 110.9 109.1 113.6
Gross fixed capital formation 2015=100 109.2 111.2 113.2 111.1 111.2 112.9 113.6Investment in machinery & equipment3 2015=100 103.0 104.0 104.9 104.1 103.9 105.0 104.9Construction investment 2015=100 115.1 117.8 120.9 117.8 117.8 120.3 121.4Other products 2015=100 105.7 107.2 108.5 106.8 107.7 108.1 109.0
Domestic demand 2015=100 105.9 107.4 109.3 107.1 107.7 108.5 110.0Terms of Trade 2015=100 100.8 103.0 102.7 102.6 103.3 102.9 102.5
Exports of goods and services 2015=100 102.6 102.0 102.3 102.3 101.6 101.8 102.8Imports of goods and services 2015=100 101.8 99.0 99.6 99.8 98.3 98.9 100.3
Gross domestic product 2015=100 106.0 108.3 110.1 107.9 108.8 109.4 110.7Production of domestic product
Employed persons (domestic) 1,000 45,236 44,762 44,585 44,884 44,640 44,395 44,775 Labour volume million hours 62,706 60,042 61,778 29,546 30,496 30,167 31,611 Labour productivity (per hour) 2015=100 103.0 100.6 102.5 101.0 100.2 102.5 102.6
Distribution of net national incomeNet national income billion euro 2,560.2 2,463.3 2,566.8 1,204.8 1,258.5 1,230.8 1,336.1
Compensation of employees billion euro 1,848.4 1,818.6 1,881.6 877.9 940.7 901.2 980.4Gross wages and salaries billion euro 1,522.2 1,494.2 1,551.5 716.4 777.7 741.7 809.7
among them: net wages and salaries4 billion euro 1 021.2 1 007.5 1 051.7 478.4 529.1 498.4 553.3
property and entrepreneurialincome billion euro 711.8 644.7 685.2 326.9 317.8 329.5 355.7
Disposable income of private households2 billion euro 1,954.3 1,961.8 1,995.9 974.8 987.0 988.1 1,007.9
Savings rate of private households2,5 % 10.9 15.6 12.0 17.8 13.5 13.7 10.2For information purposes:
Nominal unit labour costs6 2015=100 108.4 114.7 113.8 112.5 117.0 112.3 115.3Real unit labour costs7 2015=100 102.3 105.9 103.4 104.3 107.5 102.7 104.1Consumer prices 2015=100 105.3 105.9 107.5 106.1 105.5 107.1 107.8
1 – Forecast by the GCEE. 2 – Including non-profit institutions serving households. 3 – Including military weapon systems. 4 – Compensation of employees minus social contributions of employers and employees and income tax of employees. 5 – Savings relative to disposable income. 6 – Compensation of employees per working hour (employee concept) in relation to real GDP per working hour (employed person concept). 7 – Compensation of employees per working hour (employee concept) in relation to GDP per working hour (employed person concept).
Sources: Federal Employment Agency, Federal Statistical Office, own calculations
Unit 2019 20201 2021120201 20211

Economic Outlook – June 2020
German Council of Economic Experts 37
Key figures of the national accountsChange on the previous year in %
1. half-year 2. half-year 1. half-year 2. half-year
Use of domestic product
at current prices
3.5 – 2.2 5.7 – 3.1 – 1.3 6.1 5.2 Final consumption expenditure3.0 – 4.9 6.2 – 5.9 – 4.0 6.4 6.0 Private consumption2
5.0 5.0 4.5 4.5 5.5 5.6 3.5 Government consumption5.5 – 3.5 5.5 – 2.2 – 4.8 2.0 8.7 Gross fixed capital formation1.9 – 18.6 9.1 – 17.0 – 20.0 1.5 16.4 Investment in machinery & equipment3
8.3 4.2 4.2 5.5 2.9 1.8 6.5 Construction investment4.4 2.0 3.9 2.8 1.2 3.4 4.3 Other products3.1 – 2.2 5.5 – 3.1 – 1.4 5.1 6.0 Domestic demand1.7 – 15.0 8.9 – 12.2 – 17.8 2.5 15.6 Exports of goods and services2.4 – 11.4 6.5 – 10.5 – 12.3 2.2 10.9 Imports of goods and services2.7 – 4.5 6.6 – 4.4 – 4.5 5.1 8.0 Gross domestic product
Chained volumes1.9 – 3.3 3.9 – 4.5 – 2.1 4.8 3.1 Final consumption expenditure1.6 – 5.5 4.7 – 7.1 – 4.0 5.5 4.0 Private consumption2
2.7 2.6 2.0 2.2 2.9 3.1 1.1 Government consumption2.6 – 5.2 3.5 – 4.3 – 6.1 0.4 6.5 Gross fixed capital formation0.6 – 19.3 8.1 – 18.0 – 20.6 0.7 15.3 Investment in machinery & equipment3
3.8 1.8 1.5 2.5 1.2 – 0.3 3.3 Construction investment2.7 0.5 2.6 1.2 – 0.2 2.1 3.1 Other products1.2 – 3.6 3.7 – 4.7 – 2.5 3.7 3.8 Domestic demand1.0 – 14.5 8.5 – 12.2 – 16.7 3.1 14.2 Exports of goods and services2.5 – 8.9 5.9 – 8.4 – 9.4 3.0 8.7 Imports of goods and services0.6 – 6.5 4.9 – 6.7 – 6.3 3.7 6.1 Gross domestic product
Price Development (deflators)1.6 1.1 1.7 1.5 0.8 – 0.2 2.1 Final consumption expenditure1.3 0.6 1.4 1.2 0.0 0.8 1.9 Private consumption2
2.3 2.4 2.4 2.2 2.5 2.5 2.4 Government consumption2.9 1.8 1.9 2.3 1.4 1.6 2.1 Gross fixed capital formation1.3 1.0 0.9 1.3 0.7 0.8 0.9 Investment in machinery & equipment3
4.4 2.3 2.6 3.0 1.7 2.1 3.1 Construction investment1.6 1.5 1.2 1.6 1.4 1.2 1.2 Other products1.8 1.4 1.7 1.7 1.1 1.4 2.1 Domestic demand0.9 2.2 – 0.2 2.3 2.0 0.3 – 0.8 Terms of Trade0.8 – 0.6 0.3 0.0 – 1.3 – 0.5 1.2 Exports of goods and services
– 0.1 – 2.7 0.6 – 2.3 – 3.2 – 0.9 2.0 Imports of goods and services2.1 2.2 1.6 2.5 1.9 1.4 1.7 Gross domestic product
Production of domestic product0.9 – 1.0 – 0.4 – 0.4 – 1.7 – 1.1 0.3 Employed persons (domestic)0.6 – 4.2 2.9 – 4.1 – 4.4 2.1 3.7 Labour volume0.0 – 2.4 2.0 – 2.9 – 2.0 1.5 2.4 Labour productivity (per hour)
Distribution of net national income2.3 – 3.8 4.2 – 3.0 – 4.5 2.2 6.2 Net national income4.4 – 1.6 3.5 – 0.8 – 2.3 2.7 4.2 Compensation of employees4.2 – 1.8 3.8 – 1.5 – 2.2 3.5 4.1 Gross wages and salaries
among them: net wages and 4.7 – 1.3 4.4 – 1.0 – 1.7 4.2 4.6 salaries4
property and entrepreneurial– 2.7 – 9.4 6.3 – 8.5 – 10.4 0.8 11.9 income
Disposable income of private 2.9 0.4 1.7 0.2 0.5 1.4 2.1 households2
. . . . . . . Savings rate of private households2,5
For information purposes:3.3 5.8 – 0.8 7.2 4.6 – 0.1 – 1.5 Nominal unit labour costs6
1.2 3.6 – 2.3 4.6 2.7 – 1.5 – 3.1 Real unit labour costs7
1.4 0.6 1.6 1.4 – 0.3 0.9 2.2 Consumer prices
1 – Forecast by the GCEE. 2 – Including non-profit institutions serving households. 3 – Including military weapon systems. 4 – Compensation of employees minus social contributions of employers and employees and income tax of employees. 5 – Savings relative to disposable income. 6 – Compensation of employees per working hour (employee concept) in relation to real GDP per working hour (employed person concept). 7 – Compensation of employees per working hour (employee concept) in relation to GDP per working hour (employed person concept).
© Sachverständigenrat | 20-161
20211
2019 20201 2021120201