economic integration in east africa - lund...
TRANSCRIPT

Lund University August 2009
School of Economics and Management Bachelor’s Thesis
Department of Economics Supervisor: Karin Olofsdotter
Economic Integrationin East AfricaTrade Effects of the East African CommunityElna Fredriksson

2
Abstract
Regional economic integration is widely spread in Africa, and especially in the eastern region.
Three countries in East Africa: Kenya, Uganda and Tanzania, have engaged in various forms
of integration since colonial times, and the cooperation has increased further since
independence. Today, the East African Community (EAC) has been enlarged, with Rwanda
and Burundi as new members, and a customs union is established, the EACU. This study aims
to examine the trade effects of the East African Community under the period 1990-2007 with
a quantitative study on the cooperation. In addition, a limited literature study is conducted in
order to examine the potentials of future integration in the region.
The EAC has high intra-regional trade in comparison to other regional agreements in Africa.
Since the 1990s, when the cooperation was restarted after more than a decade of non-
collaboration, the intra-trade has increased. There are signs of both trade creation (expensive
domestic production is replaced by cheaper imports from a member country) and trade
diversion (imports from a third country is replaced with more expensive imports from a
member country) in different time periods during the 1990s and the beginning of 2000, but
since 2002 there is only evidence of trade creation. As the official launch of the new EAC was
in 2000, this is a positive development showing the benefits of the cooperation. However, the
trade concentration index, a measurement that takes the size of the RIA as well as openness
against the rest of the world into account, shows that the countries have started to trade less
with each other since 2000. Furthermore, the Kenyan dominance is shown to be pressing the
cooperation, which is troublesome since this dominance was one of the main reasons for the
breakup of the first EAC in 1977. All findings agree with previous studies on the EAC
although different methods have been used. Previous studies on trade effects in developing
countries in general find that integration is negative for the participating countries and that the
increased trade is due to trade diversion and not trade creation. These results have made
successful regional integration seem like an impossible task in developing countries, but the
results from this study cannot confirm this. Although the EAC has some problems that it must
overcome in order to fulfil its ultimate goal of forming a political federation, the region as a
whole will most likely benefit from the cooperation.
Keywords: Regional integration, trade creation, trade diversion, concentration index,
developing countries, East Africa.

3
Table of Contents
Lists of Tables and Figures ........................................................................................................ 4
Abbreviations ............................................................................................................................. 4
1 Introduction......................................................................................................................... 5
2 Regional Economic Integration in Developing Countries – Theory and Previous Studies 7
2.1 Theory and Background .............................................................................................. 7
2.2 The Problem of Multiple and Overlapping Memberships........................................... 9
2.3 Previous Studies ........................................................................................................ 10
3 The East African Community – General Information and Background........................... 13
3.1 Comparison of the East African Countries................................................................ 13
3.2 The East African Community 1967-1977 ................................................................. 15
3.3 Revived Integration and the Establishment of the Current EAC .............................. 16
3.4 The Establishment of a Customs Union.................................................................... 17
3.5 Overlapping Memberships ........................................................................................ 18
4 Analysis: Trade Effects of the East African Community ................................................. 20
4.1 Intra-Trade as Share of Total Trade .......................................................................... 20
4.2 Intra- and Extra-Trade as Share of GDP ................................................................... 23
4.3 Concentration Index .................................................................................................. 25
4.4 Summary of Findings ................................................................................................ 27
5 Planning for Further Integration ....................................................................................... 29
5.1 Common Market........................................................................................................ 29
5.2 Monetary Union ........................................................................................................ 30
5.3 EAC as a Political Federation ................................................................................... 31
6 Concluding Discussion ..................................................................................................... 32
7 References......................................................................................................................... 33
Literature .............................................................................................................................. 33
Databases and Statistics ....................................................................................................... 36

4
Lists of Tables and Figures
Table 1: Comparison of the East African Countries (2007) .................................................... 14
Table 2: Top three exports of the EAC countries (2008)......................................................... 15
Table 3: Overlapping memberships ......................................................................................... 18
Table 4: Intra-exports as percent of total exports for EAC countries, 1980-2007................... 22
Table 5: Intra-exports as percent of total exports for various RIAs in Sub-Saharan Africa.... 23
Table 6: Trade concentration index for the EAC countries, 1980-2008.................................. 26
Figure 1: Intra-EAC exports as share of total exports ............................................................. 21
Figure 2: Intra-EAC imports as share of GDP......................................................................... 24
Figure 3: Extra-EAC imports as share of GDP........................................................................ 25
Figure 4: Intra-EAC export concentration index over time ..................................................... 27
Abbreviations
AU African UnionCET Common external tariffCOMESA Common Market for Eastern and Southern AfricaCU Customs unionEAC East African CommunityEACU East African Customs UnionFTA Free trade agreement (or free trade area)GDP Gross domestic productPTA Preferential trade agreementRIA Regional integration agreementROO Rules of originSADC Southern African Development Community

5
1 Introduction
Africa has been exceptionally engaged in regional integration in comparison to other
developing continents, with many countries belonging to several different agreements. The
motives are economic: to create economics of scale in order to stimulate economic growth, as
well as political: to promote human rights and democracy. However, according to a majority
of economic analyses (see e.g. Venables, 1999), the economic benefits of developing country
trade agreements are likely to be biased towards the wealthier members and will thus enhance
the inequalities. Also, the risk of trade diversion, when more expensive imports from a partner
country replace cheap imports from a third country, is a large issue for the regional integration
agreements as several studies (see e.g. World Bank, 2000) show that trade between
developing countries is likely to be trade diverting instead of trade creating. Even so, the
enthusiasm for further integration is big in Africa, with the ultimate goal of establishing an
African Economic Union by 2028.
In East Africa, Uganda, Kenya and Tanzania have engaged in various forms of regional
integration since colonial times. The East African Community (EAC) was established in 2000
with the addition of Rwanda and Burundi as new members in 2007. In 2005 the EAC
established a customs union (the EACU) and the future goals are to create a common market,
a monetary union and, ultimately, a political federation. The purpose of this study is to
examine the EAC, its effects on trade for the members and its future possibilities of further
integration. Statistical data have been used to detect trade creation and trade diversion, as well
as trade concentration. In addition to this, a limited literature study is made, to complement
the quantitative analysis and to shed light on the potentials to further integration in the region.
In the quantitative analysis, data from the period 1980-2008 are used, with few variations due
to lack of data for some variables and for some countries in certain years. Especially in the
1980s the data is unreliable due to the civil war in Uganda until late 1980s as well as the
Tanzanian transition from Ujamaa socialism to market economy in the same decade. Rwanda
and Burundi did not enter the Community until 2007 and are therefore not included in the
quantitative analysis.
The difficulties of obtaining data from African countries have implied that the quantitative
study had to be complemented with qualitative sources. Only reliable sources of data and
information have been used, such as databases from UN, the World Bank and IMF, as well as

6
articles published in well known academic journals or from these international organisations.
Also, material from the East African Community itself has been used, such as reports and
evaluations.
The analysis is focused on the static effects on trade, that is, trade creation and trade diversion
and not on dynamic effects. This is not a study of regional integration in general, even though
some conclusions can be extended to other regional agreements. Issues such as corruption and
informal trade are, although important, not considered in the analysis due to the obvious lack
of data and other difficulties. The results must therefore be handled with caution, as is true for
nearly all studies on African economies.
The disposition of the text is as follows: In chapter 2 the theories and definitions of economic
regional integration and especially regional integration in developing countries are outlined.
Chapter 3 gives a brief introduction to the East African Community and its member countries.
The quantitative analysis is carried out and explained in chapter 4, and a short investigation
on the planned further integration of the Community is conducted in chapter 5. Chapter 6
concludes with a discussion of the findings.
7
2 Regional Economic Integration in Developing Countries –
Theory and Previous Studies
The process of economic integration can be defined as removal of barriers to trade between
countries and agreement of common policies on movement of goods and labour. The term
regional integration agreement (RIA) is a broad definition including all forms of integration,
and similarly, a preferential trade agreement (PTA) includes all trading agreements that
charge members lower rates of duty on imports than third countries. A PTA can be either
partial or total in terms of duty reduction and commodity coverage. A PTA does not have to
be regional; it can be formed by any two countries, even though they are not neighbours
(Krueger, 1997).
2.1 Theory and Background
The effects of trade can be divided into static and dynamic effects. The static effects of trade
can be divided into trade creation, when imports from a partner country replace more
expensive domestic production, and trade diversion, when cheap imports from third countries
are replaced by more expensive imports from a partner country. Trade creation is thus positive
for the consumers in the country, as goods become cheaper to buy, whereas trade diversion is
negative, making consumer goods more expensive. The dynamic effects include economics of
scale, increased competition, technological progress, specialization and more rapid growth.
The benefits of dynamic effects are often much larger than those of the static effects,
sometimes five or six times as large, but are more difficult to quantify (Senior Nello,
2005:92,103).
The experience of regional economic integration is more widespread for developing countries
than for developed countries, although less successful. To make regionalization work, there is
need for political commitment, macroeconomic stability, and mechanisms to fairly distribute
the costs and benefits. These conditions are often lacking among developing countries
(OECD, 1993:21, 67). Especially in Africa, many RIAs lack these features as the countries
are characterized by inadequate geographic and financial infrastructure, poor legal
framework, small private sector, and too much governmental influence. To attract more
investments and industries, these issues must be addressed (Schiff and Winters, 2003:141).

8
The informal trade must be taken into consideration, although hard to measure. The restricted,
often complicated and expensive trade policies create incentives for illegal trade. The value of
the unrecorded trade is estimated to large shares of the gross domestic product (GDP) of
African countries, and the recorded trade is thus a significant understatement of the actual
trade (Ackello-Ogutu and Echessah, 1997:2f). This poses a big problem in analysing trade
effects in developing countries as the results only reflect a limited share of the total trade. The
problem is however unavoidable and results must thus be carefully interpreted.
The main motives for developing countries to enter into RIAs are to improve market access,
increase the gains from trade, to develop political unity, and to achieve additional trade or
economic goals (OECD, 1993:25). The small markets of Sub-Saharan Africa are a large
constraint for the integration of the continent into the global markets. Regional integration can
help diversify the economies and thus make them less vulnerable to external shocks by
widening the trade and investment environment and by protecting the local industry. This
enables economics of scale, induces backward and forward linkages, and promotes
diversification and exports within the region, thus making the industries more competitive on
the global market (UNECA, 2001:41). Regional integration strengthens thus the trading
environment and is seen as a necessity for long-run economic growth (OECD, 1993:25).
From an intra-regional view, regionalism can help political cooperation between the member
countries, ease political tensions and create a common consensus in mutual concerns, not only
in matters of trade. Cooperation in building and expanding the physical and financial
infrastructure as well as the exploitation of natural resources, are some possible non-trade
benefits. From the extra-regional point of view, the members can use the collective bargaining
power in multilateral trade negotiations and to counter-balance protectionism (OECD,
1993:26).
The internal and external comparative advantage is important to establish when the effects of
trade diversion and trade creation are to be distinguished. A group of developing countries are
mostly in the situation of having external comparative disadvantage (disadvantage compared
to the rest of the world) but one of them having internal comparative advantage (advantage in
comparison with the others) for a certain sector, e.g. manufacturing. Without any trade
agreements the countries will produce some commodities for the local market and protect this
production with high tariffs. If these countries would engage in a free trade agreement (FTA),
9
the country with internal comparative advantage would draw manufacturing out of the others.
This country will gain from the relocation since it can supply manufactured products to the
others without facing competition from the rest of the world. The other countries in the FTA
will do less well since they will suffer from trade diversion – some items that were previously
imported from the outside world now have to be imported from the country with internal
comparative advantage. The countries involved in a developing country agreement will thus
suffer if one partner country has a relatively better comparative advantage compared to the
rest of the world. In other words, an RIA formed by a group of low income countries can lead
to real income loss for the lowest income members (Venables, 1999).
An FTA membership with reduction of barriers can lead to the agglomeration of industries as
well. In developed countries, this will likely occur at a sector level and will not necessarily
cause divergences in income. In a developing country agreement, however, the agglomeration
will more likely be at the industry level and might thus cause divergence of per capita income
levels. This, in combination with the argument of comparative advantage above, gives the
conclusion that FTAs between developing countries risk causing a situation where the richer
countries will benefit on the expense on the poorer, that is, a divergence of income levels. On
the other hand, if the agreement contains developed countries as well, the result will be a
convergence of income levels instead. North-south agreements, containing a mixture of
developed and developing countries, will thus serve developing countries better than south-
south agreements – agreements between developing countries (Venables, 1999). The north-
south agreements give the developing country access to the northern market and
intermediates, both much larger than in the south. In addition, assembly and textile industries
can locate their factories in the developing country where the labour is cheap and abundant, a
solution with possible gains for both north and south (Schiff and Winters, 2003:143).
2.2 The Problem of Multiple and Overlapping Memberships
Many African countries, especially in East and Southern Africa, are members in more than
one FTA for various political and strategic reasons. This gives rise to several problems for the
members, including high membership fees, contradictory obligations and conflicting
operational mandates (UNECA, 2006:7). One problem is trade deflection, where commodities
are imported into the area in the country with the lowest tariff and then sold to the other
countries within the area. This can be averted by imposing rules of origin (ROO) that acquire
the goods to be accompanied with statements of where they originate (Senior Nello, 2005:3f).

10
However, to establish ROOs that are accepted by all members in an FTA is bureaucratically
costly and complicated, and much worse so when the memberships in various FTAs overlap
(Krueger, 1997). Legal uncertainty is of main concern as it undermines the implementation of
the agreement and implies higher transaction costs. Also, the investment climate can be
severely affected by the uncertainty and unpredictability (Jakobeit et al, 2005:22).
Multiple memberships can be a big advantage for the private sector due to the increased
possibilities of infrastructure development and physical integration of markets. Transport
costs are reduced and, in turn, competiveness enhanced. Private companies are on the other
hand severely hindered by multiple memberships due to the complicated administration that
comes along with it (Jakobeit et al, 2005:62, 65).
Membership in more than one customs union (CU) is technically impossible since a county
cannot have two different common external tariffs (CETs). One can, however, be a part of a
CU and an FTA at the same time, with the complications outlined above. On the African
continent there are several CUs (one of which is the EACU that was established in 2005). The
goal of the African Union (AU) is to integrate all the RIAs into one African Common Market
and subsequently into an African Economic Union with a single currency in 2028 (Jakobeit et
al, 2005:2, 5ff).
2.3 Previous Studies
Analyses of regional integration among developing countries are not overwhelmingly
positive. Several studies have noticed trade diversion effects and negative impact on growth
and investments. As mentioned above, Venables (1999) argues that south-south agreements
will lead to a divergence in income levels among the members due to comparative advantage
and agglomeration effects, whereas north-south agreements will lead to convergence in
income instead. The World Bank (2000) claims that south-south agreements are unlikely to be
beneficial for the partners. The non-economic benefits are doubtful and, if the external tariffs
are high, the agreement will cause trade diversion since goods imported from outside the area
will be expensive due to the high tariffs. Yeats (2000) also sees negative outcomes from intra-
regional trade among developing countries. Yeats concludes that intra-trade has adverse
effects on the industrialisation and growth of the members since the imports are diverted from
low costs sources to higher costs. Also Schiff (1996) reaches the conclusion that a country
benefits more from an agreement if it imports less from the partner countries, especially in

11
terms of welfare. Schiff further claims it is better for a country to be a small member of a
large trade agreement than to be a large member in a small trade agreement.
Cernat (2001) on the other hand, finds that many African trade agreements are trade creating
and not trade diverting, in intra-regional, as well as extra-regional trade. He explains this
result with the removal of “invisible” trade barriers, meaning that the formation of south-
south agreements will reduce several trade costs that are not tariffs. The “invisible” trade
barriers are, among others, the costs of different technical or health standards that are often
harmonized in a RIA, as well as costs of corruption and fraud that might be reduced when a
common control system is imposed. Since these cost reductions do not imply forgone tariff
revenues there will be no welfare loss. If all “invisible” trade barriers were to be reduced, the
south-south agreements would be fully justified.
In the context of economic growth however, Vamvakidis (1999) concludes that regional trade
agreements have a negative impact on growth and investments due to the fact that trade
agreements are implemented on the expense of liberalization. Broad liberalization leads to
higher investment and trade agreements lead to lower investments, and this implies that trade
agreements have negative, or zero, effects on growth. Coe and Hoffmaister (1999) analyse
whether Africa’s level of bilateral trade with industrialized countries is significantly different
from the expected level, in comparison to other developing country regions. Using a gravity
model, they find that the low level of trade is due to economic size, geographical distance and
population, and that there is evidence of African countries “overtrading” compared to other
regions. Similarly, Foroutan and Pritchett (1993) use a gravity model to examine whether the
African countries trade too little with each other. The results show that the low intra-African
trade is completely explained by the low trade potential of the countries, affected by their low
GDP. Their study finds no evidence of policy or infrastructural weakness as the cause of low
African trade.
A gravity model analysis conducted by Kirkpatrick and Watanabe (2005) on the EAC finds
no evidence of trade diversion and concludes with support for further expansion of the EAC
trade. Looking at the breakdown of the first Community, however, the authors recommend the
uneven distributions of gains to be carefully observed not to increase further. In a study by
Coulibaly (2004), a gravity model is used to analyse the trade effects of seven developing
country RIAs, three of which from Sub-Saharan Africa, including the EAC. The extended

12
gravity model separates time dimension effects from structural effects. The study examines
the effects for the individual countries in the RIAs, and finds that the majority of the members
have been affected negatively. In the EAC, Uganda has been negatively impacted, caused by
time dimension effects such as war and financial crises, whereas Kenya and Tanzania have
not been affected, neither positively or negatively. In addition, the study notices that the
structure of the EAC has increased export flows between the members relatively to third
country trading partners, but the results on whether the agreement is trade creating or trade
diverting are ambiguous.
Khorana et al (2008) use a partial equilibrium model, the WITS-SMART model, to analyse
the trade effects of the EAC. The study focuses mainly on the effects from the EACU for
Uganda. A positive net trade effect is found, with small trade diversion, and the EACU
membership is thus beneficial for Uganda. The study finds however negative net welfare
effect, presumably due to the shortages in infrastructure and energy, as well as a complicated
and corrupt bureaucracy, resulting in inflated domestic prices in Uganda. The authors also
comment on the multiple membership problem, suggesting that Uganda would benefit from a
convergence in the tariffs of the various RIAs, as the present differences lead to severe losses
in revenue as well as welfare. Also using the WITS-SMART model, McIntyre (2005)
investigates the trade effects for Kenya under the EACU. Potential benefits are found, with
net trade creation effects due to the Kenyan lowering of tariffs under the EAC CET. However,
a liberalisation of the trade policies is necessary to minimise the transitional costs, and in
facing the increased competition the efficiency and competiveness of the industries have to be
improved.

13
3 The East African Community – General Information and
Background
The three original members of the East African Community: Kenya, Uganda and Tanzania,
share a long history of trade agreements. The cooperation has intensified since the 1990s, with
the establishment of the East African Cooperation 1993-2000 and the current East African
Community in 2000. A customs union was created in 2005 and the Community was enlarged
with two new members, Rwanda and Burundi, in 2007. The future goals of the EAC are to
establish a common market by 2010, a monetary union by 2012 and ultimately a political
federation. This chapter gives the historical background of the EAC, as well as some general
information on the Community and the countries.
3.1 Comparison of the East African Countries
As can be seen in Table 1, the East African countries vary significantly in geographical size
and population size. Tanzania is the largest country, followed by Kenya and then Uganda.
Rwanda and Burundi are of rather the same size, much smaller than the other three. Kenya
and Tanzania have both a long costal stretch, and the rest are landlocked. Kenya is by far the
largest economy, with a GDP of US$ 24,2 billion, to be compared with the GDP of e.g.
Uganda, US$ 11,8 billion, or Burundi, US$ 1,0 billion. Also in comparing GDP per capita is
Kenya outstanding. Uganda and Tanzania have slightly higher growth than Kenya, both in
terms of GDP growth and per capita growth, a sign that the economic gaps between them are
diminishing, or at least not widening. Burundi is the poorest country in the region, with a
small GDP and a negative growth in GDP per capita. The life expectancy at birth can be
matched with the GDP per capita in all countries, except for Rwanda that has a remarkably
low life expectancy – a phenomenon that can be partially explained by the genocide in 1994.
Further, all five countries have high rate of inflation, unfortunately not too uncommon for
African states. Additional differences between the countries, not listed in the table, are
language, culture and tradition. Especially Rwanda and Burundi are different from the other
three in these aspects, a result of colonial heritage and less historical cooperation in
comparison with the original three members.

14
Table 1: Comparison of the East African Countries (2007)
Kenya Tanzania Uganda Rwanda BurundiArea
Thousand square kilometre 580 947 241 26 28
PopulationTotal (in millions) 37,5 40,4 30,9 9,7 8,5
Growth (annual percent) 2,6% 2,4% 3,3% 2,8% 3,9%
Density (people per sq.km) 66 46 157 395 331
Life expectancy at birth (years) 54 52 51 46 49
GDPCurrent billion US$ 24,2 16,2 11,8 3,3 1,0
Growth (annual percent) 7,0% 7,1% 7,9% 6,0% 3,6%
Per capita (current US$) 644,5 400,2 380,8 343,0 114,6
Per capita growth (annual percent) 4,2% 4,5% 4,3% 3,0% -0,3%
Structure of the economy (in percent of GDP)Agriculture 26% 45% * 24% 40% 35% **
Manufacturing 11% 7% * 8% 6% 9% **
Services 56% 37% * 50% 46% 45% **
Exports of goods and servicesCurrent billion US$ 6,3 3,1 * 2,0 0,3 0,1 *
In percent of GDP 26% 22% * 17% 10% 11% *
Imports of goods and servicesCurrent billion US$ 9,0 3,9 * 3,6 0,9 0,4 *
In percent of GDP 37% 28% * 31% 28% 48% *
InflationConsumer prices (annual percent) 9,8% 7,0% 6,1% 9,1% 8,3%
Data from 2007, except for * = 2006 and ** = 2005
Data source: World Bank: World Development Indicators
In Table 1 we can further see that services take up a large part of the economies, as well as
agriculture. Manufacturing is still a small part, a fact also seen in Table 2, where the top three
exports are listed. The table is dominated by primary and agricultural products, characteristic
for African countries. The countries have a varying degree of diversified economies, although
very low in all five cases, seen by the fact that the three main exports make up a large share of
the total exports, especially in Burundi and Rwanda.

15
Table 2: Top three exports of the EAC countries (2008)
Kenya Rwanda1 Coffee, tea, spices (1096; 19%) 1 Coffee, tea, spices (181; 45%)2 Trees, plants, cut flowers (585; 10%) 2 Ores, slag, ash (135; 34%)3 Printed books, newspapers (446; 8%) 3 Beverages, spirits, vinegar (32; 8%)
Uganda Burundi1 Coffee, tea, spices (455; 26%) 1 Pearls, precious stones, gold (61; 43%)2 Fish (119; 7%) 2 Coffee, tea, spices (46; 33%)3 Electrical machinery (89; 5%) 3 Vehicles other than railway (8; 6%)
Tanzania* Data source: UN Comtrade
1 Pearls, precious stones, gold (617; 29%) Note: Figures in parentheses are values in millions$US and percents of total export.2 Ores, slag, ash (201; 9%)
3 Fish (166; 8%) * = Data from 2007
3.2 The East African Community 1967-1977
Kenya, Uganda and Tanzania have had economic cooperation in various forms since the
beginning of the 20th century. The countries have argued from the very beginning over the
distribution of benefits from the cooperation, and the disagreements intensified as the
countries gained independence in 1961-1963 when the national interests were of greater
importance. The countries decided to form a new cooperation after the independence, to
rectify the imbalances of the former agreements. The Treaty for East African Cooperation that
established the East African Community and the East African Common Market was thus
signed in 1967 and was one of the most extensive regional agreements at that time. They
maintained a common customs tariff for extra-Community trade and abolished all restrictions
for the intra-Community trade. Also, monetary and fiscal policies were harmonized, but the
treaty did not imply free movement of labour and capital (Eken, 1979). To even out the
differences between the countries, the East African Development Bank was established to
allocate its investments in favour of Tanzania and Uganda, and some common service
headquarters were reallocated so not all would be situated in Kenya (Hazlewood, 1979).
With the Arusha Declaration from 1967, Tanzania developed a new policy, Ujamaa, based on
socialism and self-reliance, with state ownership and control as well as central planning
regulating the public sector. This shift in policy led the three partner states into different
ideological orientations and complicated the cooperation. In 1971 the Tanzanian president
Julius Nyerere refused to collaborate with the new Ugandan president Idi Amin, and this

16
jeopardized the situation remarkably since the East African Authority, a main organ which
consisted of the three presidents, had a major role in conflict-solving (Hazlewood, 1979).
In addition to the ideological differences, import restrictions and exchange controls were
imposed on the intra-Community trade 1972 (Eken, 1979). Kenya had a relative comparative
advantage against the rest of the world and this created trade diversion for Uganda and
Tanzania, in accordance with the theory of comparative advantage outlined above. In the
1960s, Kenya was producing 70 percent of the manufactured products and the sector
accounted for 10 percent of its GDP (Schiff and Winters, 2003:142). The CET of the
Community that protected manufacturing was much more beneficial to Kenya than to the
other counties (Schiff, 2000). A large share was exported to Tanzania and Uganda, whose
manufacturing sectors were only 4 percent of their respective GDP (Schiff and Winters,
2003:142). The producers in Kenya thus benefited at the expense of the consumers in
Tanzania and Uganda. In addition, the industries were clustering in Kenya and moving away
from the two other countries (Schiff, 2000).
Thus, the failure to enable all members to get a fair share of the gains of cooperation as well
as growing ideological differences made the community to collapse in 1977. The borders
closed, the Community’s assets were confiscated and the disagreements contributed to the
Tanzanian and Ugandan conflict in 1979 (Schiff, 2000).
3.3 Revived Integration and the Establishment of the Current EAC
The three countries revived the integration in the 1990s when Uganda moved toward
economic liberalism and Tanzania replaced Ujamaa by liberal and pragmatic politics. Also,
the changing political and economic situation in the world marked by the end of the cold war
in the late 1980s played a role (Jakobeit et al, 2005:17). In 1993 the East African Cooperation
came into being, an agreement in preparation for deepening the integration into the current
East African Community in 2000. The mission of the EAC is to “widen and deepen economic,
political, social and cultural integration in order to improve the quality of life of the people of
East Africa through increased competitiveness, value added production, trade and investment”
(EAC, 2005:1). With lessons learned from the collapse of the first Community, the new
agreement entailed mechanisms to, at least temporarily, protect the Tanzanian and Ugandan
industries from the more developed and efficient Kenyan producers. This infant industry
protection was controlled by internal tariffs that were to be phased out under the following

17
five years, as a preparation for the customs union that was established in 2005 (Khorana et al,
2008).
3.4 The Establishment of a Customs Union
As stipulated in article 3 of the Customs Union Protocol, the objectives of the East African
Customs Union (EACU) is to “(a) further liberalise intra-regional trade in goods on the basis
of mutually beneficial trade arrangements among the Partner States; (b) promote efficiency in
production within the Community; (c) enhance domestic, cross border and foreign investment
in the Community; and (d) promote economic development and diversification in
industrialisation in the Community” (EAC, 2004: Article 3). The evolvement into a CU from
an FTA is beneficial for the members. According to Krueger (1997) a CU is Pareto-superior
to an FTA in terms of welfare, ceteris paribus. A CU has all the welfare benefits of an FTA,
and an FTA has welfare costs that a CU does not. Also, the political economy of a CU is more
beneficial to multilateral trade liberalization than an FTA.
The EACU is however carefully constructed; the breakup in 1977 has forced the internal trade
liberalizations to be asymmetrical, with duty free imports and exports for Tanzania and
Uganda (between each other as well as exports to Kenya), and with tariffs for Kenyan exports
into the two others (EAC, 2004: Article 11). Here, the infant industry protection mentioned
previously plays a big role, to even out the economic differences between the members and
diminish the Kenyan dominance that might be intensified under the EACU. The EACU will
thus not be fully functioning until January 2010 when Uganda and Tanzania will have phased
out tariffs on 400 respective 800 goods imported from Kenya (Jakobeit et al, 2005:17).
In establishing a customs union, a common external tariff is needed against the rest of the
world. As pointed out in the Second Development Strategy of the EAC: “High CET acts as
trade protectionism which perpetuate high-cost industries thus promoting trade diversion,
impairing competitiveness based on comparative advantages, and may lead to rent seeking
activities. An extremely low CET on the other hand may introduce premature competitive
pressures on domestic industries including those which may have a chance to become
efficient over time” (EAC, 2000:12). The EAC CET was established at the same time as the
CU. In order not to repeat the mistake made in the first Community, the CET is outlined to be
beneficial for all members. In comparison to the member’s individual external tariffs before

18
the EACU, the new CET has implied a liberalisation of third-country import tariffs for Kenya,
a decrease for Tanzania and an increase for Uganda (Jakobeit et al, 2005:17).
Except for removing the internal tariffs and adopting a CET, the EACU will also imply
“removal of non-tariff barriers, adoption of common anti-dumping, countervailing and
safeguard measures, adoption of common rules of origin, and adoption of common positions
against illegal dumping of toxic waste” (EAC, 2005:16). The effects of the CET have made
larger impact on the members than the other changes implemented (Jakobeit et al, 2005:17).
3.5 Overlapping Memberships
As shown by Table 3, the EAC member states are also members of other RIAs, some of
which have conflicting interests. With slightly different import tariffs in the RIAs, the
importers can benefit by importing under the agreement with the lowest tariffs, which leads to
the problem of trade deflection. However, there are also benefits from multiple memberships
in terms of increased markets for investors. Access to the market of one country will imply
access to all the regional markets that the country is a member of (Khorana et al, 2008). The
goal of the AU is to integrate all the African RIAs into one African Economic Union. The
goals of the various RIAs are thus to speed up the economic development in the regions, to
ease the AU integration process.
Table 3: Overlapping memberships
Kenya Uganda Tanzania Rwanda Burundi
EAC x x x x x
AU x x x x x
COMESA x x x x
SADC x
Sources: Khorana (2008) and own compilation
Notes: EAC, East African Community; AU, African Union; COMESA,Common Market for Eastern and Southern Africa; SADC, SouthernAfrican Development Community.
The Kenyan, Rwandan and Burundi memberships1 in the FTA of the Common Market for
Eastern and Southern Africa (COMESA) and the Tanzanian membership of the FTA of
Southern African Development Community (SADC) could pose some problems. COMESA
1 Uganda is a member of COMESA but not of its FTA. Tanzania withdrew from COMESA in 2000 in favour to the
SADC membership.

19
launched a CU recently (in June 2009) and SADC plans to establish one in 2010. As one
country can only be part of one CU and the EACU is fully operating in 2010, the EAC
members will need to negotiate FTA agreements with COMESA and SADC as a bloc. The
present individual trade agreements with COMESA and SADC are thus seen as temporary
exceptions from the EACU, and in the meantime, EAC needs to maintain the ROOs to ensure
that goods imported in Tanzania under SADC not appear in the other EAC members (Jakobeit
et al, 2005:18, 24). A major problem is that importers can choose to import under any RIA,
implying e.g. that goods imported into Uganda are often declared under the COMESA ROO
instead of the EAC’s, due to lower tariffs. This gives incentives for corruption and informal
trade, results in lower revenue collection in Uganda and is an obstacle for the domestic
Ugandan production. There is thus pressing need for harmonisation of tariffs between the
RIAs (Khorana et al, 2008).
To solve these complications, the EAC, COMESA and SADC have in October 2008 agreed
on a common trading agreement that will include all three RIAs’ members, a total of 26
countries in Southern, Eastern and Northern Africa. The new agreement encompasses the
formation of an FTA and, eventually, a CU. In addition, the new agreement includes several
other integration measures, such as infrastructure. The cooperation is seen as a fast track into
the future AU integration. The time frame and specific outline for the common agreement is
not yet established (Ncube, 2008).

20
4 Analysis: Trade Effects of the East African Community
A major argument for forming a regional trade agreement is to increase trade in the region.
The important question is however whether the increase is due to trade creation, when
expensive domestic products are replaced by cheaper import, or to trade diversion, when
expensive import from partner countries replaces cheap import from a third country. In
measuring the trade effects of an agreement it is empirically difficult to isolate the trade
creation effects from the trade diversion. Proxies are often used; with the drawback that trade
increases found among the members tends to over-estimate the effects and reflect trade
diversion instead of trade creation (WTO, 2003:55). Gravity models are sometimes used to
isolate the trade effects by taking the size of the economies as well as the distance between
them into consideration. Here, three main proxies will be used to analyse the trade effects of
the East African Community to evaluate whether the effects are trade creating or trade
diverting. The proxies are: intra-trade as share of total trade, intra- and extra-trade as share of
GDP and the concentration index. The largest problem in analysing trade in developing
countries is the lack of data in general and the total lack of data on the informal trade in
particular. The informal trade is known to be a big share of the total trade, but is impossible to
measure adequately. This must be taken into consideration when analysing the trade effects,
as the results are incomplete.
4.1 Intra-Trade as Share of Total Trade
The first proxy to be analysed is the ratio of intra-trade over total trade2. This is the simplest
form of analysing the trade effects: a rise in the intra-exports show that the regional trade has
increased. A rise in regional trade can be due to either trade creation or trade diversion, a
distinction we cannot make with this proxy. The measure is changing as new members enter
or withdraw from the agreement, making the comparison over time flawed if the RIA has
included new members (or if members have dropped out) in the selected time period. This can
also happen if the volume of trade among members changes dramatically (WTO, 2003:56).
2 In this section, export is used as a measure of trade. The difference in using imports or exports is trivial as the
focus of interest is the intra-trade share as well as the trend, not the actual numbers.

21
In Figure 1, exports within the EAC3 are shown as share of the EAC total exports. The EAC
agreement was not in full effect during the whole period, but the countries are the same (see
note 3). The breakup in 1977 is likely reflected in the initial low number of the early 1980s,
and the increase from 1990 onwards is when the cooperation started anew. A rising trend is
distinguishable through the whole period, although the end of the 80s as well as the beginning
of the new millennium showed remarkable declines. The fall in 2000 and onwards could be a
cause of concern for the region as 2000 was the start of the new EAC. There has been a slight
increase since 2005, but it is yet too soon to tell whether that is sustainable.
Figure 1: Intra-EAC exports as share of total exports
In order to differentiate between the EAC countries, Table 4 shows the share of intra-exports
within the EAC over the period 1980-2007. Kenya is by far the largest exporter within the
region; 21.8 percent of the total Kenyan exports went to Tanzania and Uganda in this period.
The dominant position of Kenya is also seen in the exports of Tanzania and Uganda; they
exported more to Kenya than to each other and their total intra-EAC exports were only 3.4
versus 3.6 percent. The uneven trade pattern could be a cause of concern since the breakup of
the first Community in 1977 was in part caused by Kenyan economic dominance, as
explained in the previous chapter. The Kenyan dominance is explainable as Kenya is the
largest economy in the region. As we saw in Table 1 in section 3.1, the GDP of Tanzania, the
3 In this chapter, the EAC is defined as Kenya, Uganda and Tanzania. Rwanda and Burundi entered the EAC in
2007, too recently for enough data coverage.
0%
5%
10%
15%
20%
25%
1980 1983 1986 1989 1992 1995 1998 2001 2004 2007
Intra-EAC exports as share of total exports
Data source: IMF: Direction of Trade Statistics.

22
second largest economy in the region, is only two-thirds of the Kenyan GDP. The Kenyan
dominance and especially the large economic gap between the member countries must be
decreased however, in order to avoid a second breakup and to establish a sustainable future of
the EAC.
Table 4: Intra-exports as percent of total exports for EAC countries, 1980-20074
Trading partner
Exporter Kenya Uganda Tanzania TotalKenya - 14,7% 7,1% 21,8%
Uganda 2,8% - 0,8% 3,4%
Tanzania 2,3% 1,1% - 3,6%
Data source: IMF: Direction of Trade Statistics.
In Table 5 the intra-regional export share is shown for nine regional trade agreements in Sub-
Saharan Africa to compare the EAC with other African RIAs. As noted above, it is not
possible to know whether the effects we see are trade creating or trade diverting, and some of
the RIAs in the table have included new members during the period, making the measure
slightly misleading. However, as we can see in Table 5, there has been a decline in the ratio
for four of the groupings in the period 1980-2006, a sign of diminishing intra-regional trade.
The other five, including the EAC, have enjoyed an increase in regional trade. The EAC has
not changed its members, so at least we can conclude that EAC’s intra-export has increased as
a percentage of the region’s total exports. The long history of East African cooperation is
explaining the high share of intra-trade in comparison with the other regions, with the
exception of UEMOA, another region with a long tradition of cooperation, that show similar
high figures.
4 This table is inspired by Kickpatrick and Watanabe (2005), who presented data for the period 1970-1997 in a
similar table.

23
Table 5: Intra-exports as percent of total exports for various RIAs in Sub-Saharan
Africa5
1980 1990 1995 2000 2005 2006
CEMAC 1,6 2,3 2,1 1,0 0,9 0,9
CEPGL 0,1 0,5 0,5 0,8 1,2 1,3
COMESA 1,8 4,7 6,1 4,6 4,5 4,2
EAC 10,0 15,2 17,5 20,8 14,8 17,2
ECCAS 1,4 1,4 1,5 1,1 0,6 0,6
ECOWAS 9,6 8,0 9,0 7,6 9,3 8,3
MRU 0,8 0,0 0,1 0,4 0,3 0,3
SADC 0,4 3,1 10,7 9,4 9,2 9,1
UEMOA 9,6 13,0 10,3 13,1 13,4 13,1
Data sources: UNCTAD: Handbook of Statistics 2008; IMF: Direction of TradeStatistics.
Notes: CEPGL, Economic Community of the Great Lakes Countries; CEMAC,Economic and Monetary Community of Central Africa; COMESA, Common Marketfor Eastern and Southern Africa; EAC, East African Community; ECCAS,Economic Community of Central African States; ECOWAS, Economic Communityof West African States; MRU, Mano River Union; SADC, Southern AfricanDevelopment Community; UEMOA, West African Economic and Monetary Union.
4.2 Intra- and Extra-Trade as Share of GDP
As noted in the beginning of this chapter, the main concern of analyzing the trade effects is to
distinguish between trade creation and trade diversion. In this section we will try to make this
distinction by using a second proxy: the intra- and extra-trade as share of GDP. The GDP is
used as changes in apparent consumption can be approximated by changes in GDP at the
aggregate level. If the intra-trade share of GDP is increasing there is evidence of net trade
creation and the economy has become more open. If the extra-trade share of GDP falls, there
has been net trade diversion (Schiff and Winters, 2003:37).
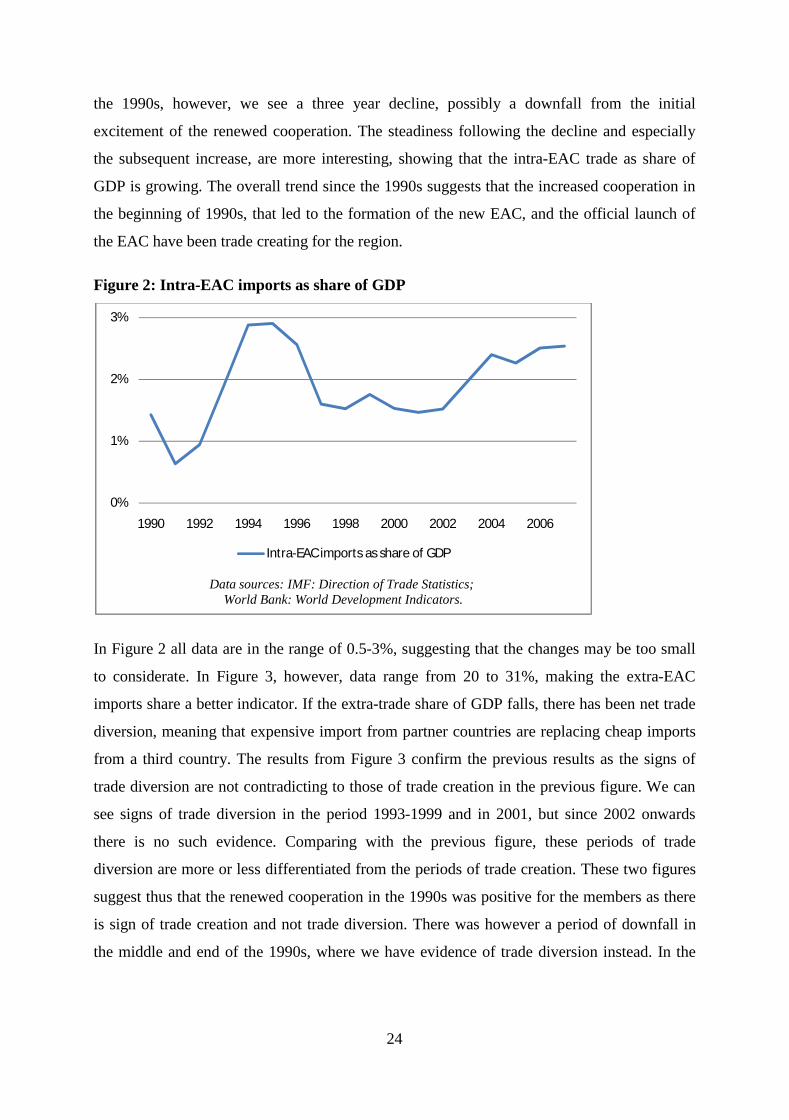
In Figure 2 the intra-EAC imports are shown as share of GDP, for the time period 1990-
20076. Here we can see an increase in the beginning of the 1990s, when the cooperation
started anew after the breakup, and from 2000 onwards, when the new EAC was officially
launched. The increases in intra-trade as share of GDP are evidence of trade creation,
implying that expensive domestic products are replaced by cheaper import. In the middle of
5 This table is inspired by Kickpatrick and Watanabe (2005), who presented data for the period 1970-1997 in a
similar table.6 Due to lack of GDP data for Tanzania in the 1980s, this section examines only the period 1990-2007.
24
the 1990s, however, we see a three year decline, possibly a downfall from the initial
excitement of the renewed cooperation. The steadiness following the decline and especially
the subsequent increase, are more interesting, showing that the intra-EAC trade as share of
GDP is growing. The overall trend since the 1990s suggests that the increased cooperation in
the beginning of 1990s, that led to the formation of the new EAC, and the official launch of
the EAC have been trade creating for the region.
Figure 2: Intra-EAC imports as share of GDP
In Figure 2 all data are in the range of 0.5-3%, suggesting that the changes may be too small
to considerate. In Figure 3, however, data range from 20 to 31%, making the extra-EAC
imports share a better indicator. If the extra-trade share of GDP falls, there has been net trade
diversion, meaning that expensive import from partner countries are replacing cheap imports
from a third country. The results from Figure 3 confirm the previous results as the signs of
trade diversion are not contradicting to those of trade creation in the previous figure. We can
see signs of trade diversion in the period 1993-1999 and in 2001, but since 2002 onwards
there is no such evidence. Comparing with the previous figure, these periods of trade
diversion are more or less differentiated from the periods of trade creation. These two figures
suggest thus that the renewed cooperation in the 1990s was positive for the members as there
is sign of trade creation and not trade diversion. There was however a period of downfall in
the middle and end of the 1990s, where we have evidence of trade diversion instead. In the
0%
1%
2%
3%
1990 1992 1994 1996 1998 2000 2002 2004 2006
Intra-EAC imports as share of GDP
Data sources: IMF: Direction of Trade Statistics;World Bank: World Development Indicators.

25
beginning of 2000, when the EAC was officially launched, there is further evidence of trade
diversion, but after 2002 onwards, there is only evidence of trade creation.
Figure 3: Extra-EAC imports as share of GDP
4.3 Concentration Index
However, the results from section 4.2 do not give the whole truth. To get a broader picture of
the trade effects the trade concentration index (sometimes referred to as the trade intensity
index) is used since it takes openness against the world as well as the size of the RIA into
account. The concentration index measures whether a country trades more with another
member of the trade agreement than it does with any other country in the world. If the index
value is close to one, the bilateral trade of the two countries is proportional to the distribution
of total trade. The more the value exceeds one, the more concentrated is the trade between the
countries (WTO, 2003:56). Naturally, the geographical distance is here of great matter, as
neighbouring countries tend to trade more with each other than countries further away from
each other. Therefore, in calculating the index for a group of neighbours, as we do here, all
figures will significantly exceed one.
Table 6 shows the average concentration indices ( ) for the individual EAC countries in the
period 1980-2008. is here defined for country ’s exports to country as the share of ’s
total exports to the world ( ⁄ ) relative to the share of ’s total imports (that is, the
15%
20%
25%
30%
35%
1990 1992 1994 1996 1998 2000 2002 2004 2006
Extra-EAC imports as share of GDP
Data sources: IMF: Direction of Trade Statistics;World Bank: World Development Indicators.

26
world’s exports to : ) in world imports ( − ), according to the equation (from
Kirkpatrick and Watanabe, 2005):
= ⁄( − )⁄Table 6: Trade concentration index for the EAC countries, 1980-20087
Trading partner
Exporter Kenya Uganda Tanzania
Kenya - 957,1 202,8
Uganda 45,5 - 23,8
Tanzania 39,8 89,2 -
Data source: IMF: Direction of Trade Statistics.
Table 6 is comparable with Table 4 (section 4.1); also implying that Kenya is trading more in
the region than the other two. However, it is more obvious in this table how much more
Kenya is trading with Uganda than it is with Tanzania. This has several reasons, the most
important being the longer historical trade cooperation between Kenya and Uganda resulting
from a longer common colonial history, and the Tanzanian Ujamaa-experience under the
1970s and 80s that to some extent distanced the country from the world economy. Table 6
also gives more evidence on how small the trade between Uganda and Tanzania is and how
little they export to each other and to Kenya. Since intra-regional trade bias can be explained
by many factors, it is important to notice the development over time (WTO, 2003:56), as we
do in Figure 4.
Figure 4 shows the intra-EAC export concentration index ( ) calculated as the ratio of
total intra-EAC export ( ) and EAC total exports ( ), divided by the ratio of
EAC total imports ( ) and the world total exports ( ), according to the
equation:
= ⁄⁄7 This table is inspired by Kickpatrick and Watanabe (2005), who presented data for the period 1970-1997 in a
similar table.

27
In Figure 4 we can see that the concentration index for the EAC is significantly different from
one. The region trades thus more than would have been expected due to the countries share in
the world trade. Figure 4 confirms the findings in previous sections that trade between the
Figure 4: Intra-EAC export concentration index over time
EAC countries is high and has increased since the 1980s. Notably, the trade concentration has
declined since 2000, after 15 years of steady rising. This is interesting as it means that the
three countries, Kenya, Uganda and Tanzania, begun to trade less with each other since the re-
establishment of the EAC in 2000. This is in line with Frankel et al (1997:31) who claims that
“the greatest increase in intraregional trade concentration often seems to take place after an
agreement has been decided but before it actually takes effect”. The rush of firms to establish
businesses in the new market is thought to explain the phenomenon. The future will tell
whether the decline is continuous and thus a cause for concern or if it is merely a stabilisation
after the pre-EAC excitement.
4.4 Summary of Findings
Firstly, trade in the region has increased since the 1990s when the cooperation was started
anew, and the intra-regional trade is high compared to other RIAs in Africa. There is,
however, a decline in the regional trade from 2000-2005, but followed by an increase.
Secondly, the Kenyan dominance in the region is confirmed, with Kenya trading much more
with the other two countries than those are with each other. Thirdly, there are signs of trade
diversion in the 1990s and in 2001, but since 2002 there is evidence of trade creation only.
0
50
100
150
200
250
1980 1985 1990 1995 2000 2005 2008
The intra-EAC export concentration ratio over time
Data source: IMF: Direction of Trade Statistics.

28
Finally, the countries have had high and rising trade concentration until 2000 when the
concentration index started to decline, meaning that the countries have begun to trade less
with each other. These results will be further discussed in chapter 6.

29
5 Planning for Further Integration
Of the future plans of the EAC (a common market, a monetary union and a political
federation) some are more possible to realize and serves a larger purpose than others. Here,
the purposes, the probable obstacles and the possibilities of the future plans are shortly
investigated, as a complement to the analysis of the EAC trade effects in the previous chapter.
5.1 Common Market
The next goal of the EAC is to form a common market by 2010 and thus further deepen the
integration in the region. A common market implies increased opening of the borders within
the area, with freedom of movement of goods, services, labour and capital (also known as the
four freedoms; see e.g. Senior Nello, 2005:3f). When the previous integration stages, such as
free trade areas and customs unions, are seen as shallow integration, a common market is
characterized as deep integration (see e.g. Frankel et al 1997:16), since the free movement of
capital and labour affects laws and institutions that need to be harmonised between the
countries.
The East African Common Market will be established in January 2010. In preparation for the
establishment, the members will “ensure the formulation of a common competition policy,
harmonized export promotion policies, co-operation in developing their capacity to compete
internationally, and to collectively build the capacity to negotiate internationally” (EAC,
2000:13). In order to fully enable a functioning business climate in the region, where rules
and costs for starting and running companies are the same in all countries, the competition
laws are important. Realising that the issue of competition might be an obstacle, a Common
Competition Policy and Law will be introduced, together with a regional authority to ensure
its implementation (EAC, 2000:14).
Other obstacles will be to harmonise social security systems and education systems to enable
the free movement of people to have a positive impact on the economy as a whole. With the
current different systems, workers and students might have less incentive to work or study in
another member country, as some systems are more advantageous than other and there is risk
of losing acquired benefits in the home country. The free movement of people is an important
measure to be taken in order to increase the region’s competiveness against the rest of the
world. The two new members, Rwanda and Burundi, cause the largest reason for change, as
the differences in history, language and traditions are larger between those two and the rest of

30
the community then between the original three members. Especially in the harmonisation of
the educational systems these differences are significant (EAC, 2007:36).
5.2 Monetary Union
After the establishment of a common market, the EAC aims to form a monetary union by
2012. This would be a revival of the old monetary union that was dissolved in 1967. The old
agreement was formed by Kenya, Uganda and Tanzania and the common currency, the East
African shilling, was linked to the British (sterling) pound (Buigut and Valev, 2009). A
common currency would diminish the ability of the individual member countries to use
monetary policy to tackle economic shocks. It will, however, reduce cross-border transaction
costs and the intra regional trade is likely to increase as studies show that countries with the
same currency trade three times as much with each other than with the rest of the world (see
e.g. Rose 2000).
The establishment of a monetary union might be beneficial for the members as economies
dependent on few export commodities are vulnerable to economic shocks. Especially when
the products are primary and have high price volatility, as is the case for many African
countries, the cost of exchange rate volatility risk is higher (Buigut and Valev, 2005). In all
the five countries in the EAC, the major share of the export consists of a few products only, as
was shown in Table 2 in section 3.1. The products are mostly primary, and all prone to high
risks on the international markets. A common currency in the EAC would reduce the volatility
risk for the individual countries as the union as a whole would depend on a wider range of
products.
According to Buigut and Valev (2005) the EAC countries were, at the time of the study, not
yet ready to form a monetary union since the supply and demand shocks were mostly
asymmetric. However, they conclude that as the regional integration proceeds the
asymmetries may diminish, and then the countries will benefit highly from a common
currency. Further, they find limited support of pegging a possible future currency to an
external currency, but, if the currency should be pegged, the Euro would be preferred to the
American dollar and the British pound. Another study, also by Buigut and Valev (2009), has
examined the future benefits of an EAC monetary union. A common monetary policy would
imply lack of independent means to counter country-specific economic shocks, and this would
lead to net welfare loss according to the study. In terms of inflation, they find that Tanzania

31
and Uganda, with high risk of inflation, would benefit from a common currency, but only on
the expense on the other three that would lose. Furthermore, all countries but Kenya and
Burundi would gain from the lower monetary policy uncertainty that would follow. It is
widely believed that Kenya would be the winner of a EAC monetary union due to its
historical and present economic dominance in the region, and a compensation fund has
therefore been suggested. However, Buigut and Valev find that the opposite is true; Kenya
would lose in a monetary union and the others would gain.
5.3 EAC as a Political Federation
The ultimate goal of becoming a political federation is the final stage in the EAC integration.
The definitions of political unions or complete economic integration are ambiguous in the
literature, but generally imply the imposing of an authority that is responsible to an elected
central parliament and has decision-making power over all the member states. Also, common
policies, not only in monetary but in fiscal and social areas have to be conducted and this
implies that the member states have to give up their sovereignty in several issues (Balassa,
1961:2 and Senior Nello, 2005:3f).
Although the EAC documents are positively discussing the possibilities of the establishment
of the EAC Political Federation, this ultimate stage of integration must be seen as the least
possible goal to fully realise. In 2004, an EAC committee suggested the combined launch of
the Customs Union, the Common Market, the Monetary Union and the Political Federation
simultaneously in 2010 (EAC, 2007:30). Realising that this was too optimistic, the date for
the Federation has been postponed to a yet unknown date.

32
6 Concluding Discussion
This study has shown that the East African Community is a regional agreement with high
potential. The intra-regional trade is high in the region compared to other RIAs in Africa. The
intra-EAC trade has increased since the new start of the cooperation in the 1990s, with signs
of trade creation in some periods and signs of trade diversion in others. Most importantly,
from 2002 onwards, two years after the EAC was officially launched, the increases are due
only to trade creation. This corresponds to other studies on the trade effects of the EAC, an
interesting result since the used methods are different. The negative results from previous
studies on trade effects of south-south RIAs can thus not be confirmed by this study.
Kenya has a continuous economic dominance in the region and is trading more with the other
members than they trade with each other. This dominance can be an obstacle for a successful
future cooperation in the region as it was the main cause for the breakup of the first EAC in
1977. Although the Ugandan and Tanzanian trade is less than the Kenyan, the region has still
a high concentration of trade even though the trade concentration has diminished in the latest
years. This might be a cause of concern but could also depend on other factors such as a
downfall from the initial excitement of the new EAC establishment. Another obstacle is
corruption, an issue not discussed much here as it lies outside the scope of the study, but still
worth mentioning as it might severely hinder the potential progresses of the region.
Looking ahead, the region might well benefit from future integration, but as the customs
union was established too recently to be fully analysed, it is too soon to know. Deeper
cooperation might also be harmful. The EAC is in a rush; the formation of a common market
is already on the way, and shortly thereafter a monetary union will be established. Due to
historical experiences of the East African Community, the cooperation might benefit from
securing one step at a time and not rush into the next too soon.

33
7 References
Literature
Ackello-Ogutu, C. and Echessah, P. (1997) Unrecorded Cross-Border Trade Between Kenya
and Uganda – Implications for Food Security, SD Publication Series, Technical Paper No. 59.
Balassa, B. (1961) The Theory of Economic Integration, George Allen & Unwin Ltd, London.
Buigut, S. and Valev, N.T. (2005) “Is the proposed East African monetary union an optimal
currency area? A structural vector autoregression analysis.” World Development, Vol. 33, No.
12, pp 2119–2133.
Buigut, S. and Valev, N.T. (2009) “Benefits from Mutual Restraints in a Multilateral
Monetary Union” World Development, Vol. 37, No. 3, pp 585-594.
Cernat, L. (2001) “Assessing Regional Trade Arrangements: Are South-South RTAs More
Trade Diverting?” Policy Issues inInternaional Trade and Commodities Study Series no. 16
United Nations, New York and Geneva.
Coe, D.T. and Hoffmaister, A.W. (1999) “North-South Trade: Is Africa Unusual?” Journal of
African Economies, Vol. 8, No. 2, pp 228-256.
Coulibaly, S. (2004) “On the Assessment of Trade Creation and Trade Diversion Effects of
Developing RTAs” Preliminary Draft.
EAC (2000) The Second EAC Development Strategy 2001-2005, East African Community
Secretariat, Arusha.
EAC (2004) Protocol on the Establishment of the East African Customs Union, East African
Community Secretariat, Arusha
EAC (2005) The Third EAC Development Strategy 2006-2010, East African Community
Secretariat, Arusha.
EAC (2007) Study on the Establishment of an East African Community Common Market, East
African Community Secretariat, Arusha.

34
Eken, S. (1979) “Breakup of the East African Community” Finance & Development, The
International Monetary Fund.
Foroutan, F. and Pritchett, L. (1993) “Intra-Sub-Saharan African Trade: is it too Little?”
Journal of African Economies, Vol. 2, No. 1, pp 74-105.
Frankel J.A, Stein E and Wei, S-J (1997) Regional Trading Blocs in the World Economic
System, Washington DC: Institute for International Economics.
Hazlewood, A. (1979) “The End of the East African Community: What are the lessons for
regional integration schemes?” Journal of Common Market Studies, Vol. XVIII, No. 1, pp.
40-58.
Jakobeit, C, Hartzenberg, T. and Charalambides, N. (2005) Overlapping Membership in
COMESA, EAC, SACU and SADC – Trade Policy Options for the Region and for EPA
Negotiations, Deutsche Gesellschaft für Technische Zusammenarbeit (GTZ), Eschborn,
Germany.
Khorana, S, Kimbugwe, K. and Perdikis, N. (2008) “The Impact of Tariff Reductions under
the East African Community Customs Union: Intra Trade Effects on Uganda” Research Series
No. 8, Research Department, Kampala, Bank of Uganda.
Kirkpatrick, C. and Watanabe, M. (2005)”Regional Trade in Sub-Saharan Africa: An analysis
of East African Trade Cooperation, 1970-2001.” The Manchester School, Vol. 73, No. 2, pp
141-164.
Krueger, A.O. (1997) “Free Trade Agreements versus Customs Unions” Journal of
Development Economics, Vol. 54, pp. 169-187.
McIntyre, M.A. (2005) “Trade Integration in the East African Community: An Assessment
for Kenya” IMF Working Paper, WP/05/143, International Monetary Fund, African
Department.
Ncube, M. (2008) “Historic EAC-COMESA-SADC Tripartite Summit” UNECA Knowledge
Sharing: http://knowledge.uneca.org/member-states/observatory-on-regional-
integration/regional-economic-commissions-in-africa/eac-comesa-sadc/historic-eac-comesa-
sadc-tripartite-summit Accessed 2009-06-15

35
OECD (1993) Regional Integration and Developing Countries, Organisation for Economic
Co-operation and Development, Paris.
Rose, A. (2000) “One money, one market: The effect of common currencies on trade”
Economic Policy, Vol. 30, pp. 7-33.
Schiff, M. (1996) “Small is Beautiful: Preferential Trade Agreements and the Impact of
Country Size, Market Share, Efficiency and Trade Policy”, Policy Research Working Paper
no. 1668. Washington DC: World Bank.
Schiff, M. (2000) “Multilateral Trade Liberalization and Political Disintegration: Implications
for the Evolution of Free Trade Areas.” Policy Research Working Paper no. 2350. World
Bank, Washington, D.C.
Schiff, M. and Winters, L.A. (2003) Regional Integration and Development, The World Bank
and Oxford University Press.
Senior Nello, S. (2005) The European Union – Economics, Policies and History, McGraw-
Hill
UNECA (2001) Transforming Africa’s Economies: Overview, Addis Ababa: Economic
Commission for Africa.
UNECA (2006) Assessing Regional Integration in Africa II – Rationalizing Regional
Economic Communities, Economic Commission for Africa, Addis Ababa.
Vamvakidis, A. (1999) “Regional Trade Agreements or Broad Liberalization: Which Path
Leads to Faster Growth?” IMF Staff Papers, 46:42-68.
Venables, A.J. (1999) “Integration Agreements: A Force for Convergence or Divergence?”
Proceedings of World Bank ABCDE Conference. Policy Research Working Paper Series
no.2260. World Bank, Washington, D.C.
World Bank (2000) Trade Blocs, New York: Oxford University Press.
WTO (2003) Trade and Development World Trade Organization: World Trade Report.

36
Yeats, A. (1998) “What Can Be Expected from African Regional Trade Arrangements? Some
Empirical Evidence”, Policy Research Working Paper No. 2004. Washington DC: World
Bank.
Databases and Statistics
IMF: Direction of Trade Statistics, accessed 2009-05-11: http://www.imfstatistics.org/dot/
UNCTAD (2008) Handbook of Statistics, TD/STAT. 33, United Nations Conference on Trade
and Development, New York and Geneva.
UN Comtrade, accessed 2009-05-04: http://comtrade.un.org/db/
World Bank, World Development Indicators Online, accessed 2009-04-20:
http://go.worldbank.org/U0FSM7AQ40