economic implications for turkey of a customs union with the european union
TRANSCRIPT
EUROPEAN ECONOMIC REVIEW
ELsJ3VIER European Economic Review 4lf1997) 861-870
Turkey’s Customs Union with the EU
Economic implications for Turkey of a Customs Union with the European Union
Glenn W. Harrison a, Thomas F. Rutherford b, David G. Tarr ‘, *
a Uniuersity of South Carolina, Columbia, SC 29208, USA
b Uniuersiq of Colorado, Boulder, CO 80309, USA
’ The World Bank, Room N-5-037, 1818 H. St. N. W., Washington D.C. 20433, USA
Abstract
With a CGE model, we quantify the impact of the Customs Union between Turkey and the European Union (EU). Since the average tariff on non-agricultural imports will be less than 2 percent, the trade diversion costs of the Customs Union are quite small. Improved access to third country markets (through reciprocal preferential access agreements of the EU) results in the largest gains from the Customs Union, estimated overall to be about l-l .5 percent of Turkish GDP. Applying the VAT uniformly (rather than raising it to compensate for the tariff revenue loss) will increase the welfare gain from joining the EU. 0 1997 Elsevier Science B.V.
JEL class$cation: F15; F14; C68
Keywords: Customs Union; Computable general equilibrium model; Regional agreements; European Union; Turkey
1. Introduction and summary
Turkey has joined in a Customs Union with the European Union. We employ a computable general equilibrium model to quantify the impact of the Customs
* Corresponding author. E-mail: [email protected], Fax: + 1 202 522-l 159, Tel.: + 1 202 473-7677.
0014-2921/97/$17X)0 Copyright 0 1997 Elsevier Science B.V. All rights reserved. PII SOO14-2921(97)00043-3
862 G. W. Harrison et al. / European Economic Reuiew 41 (1997) 861-870
Union (CU) on Turkish welfare, employment and value-added by sector, revenue implications for the government, real exchange rate effects, and other relevant
variables. Although not typically quantified in small open economy applied general equilibrium models, we quantify the impact of the most important ‘deep integration’ elements of the agreement between Turkey and the European Union
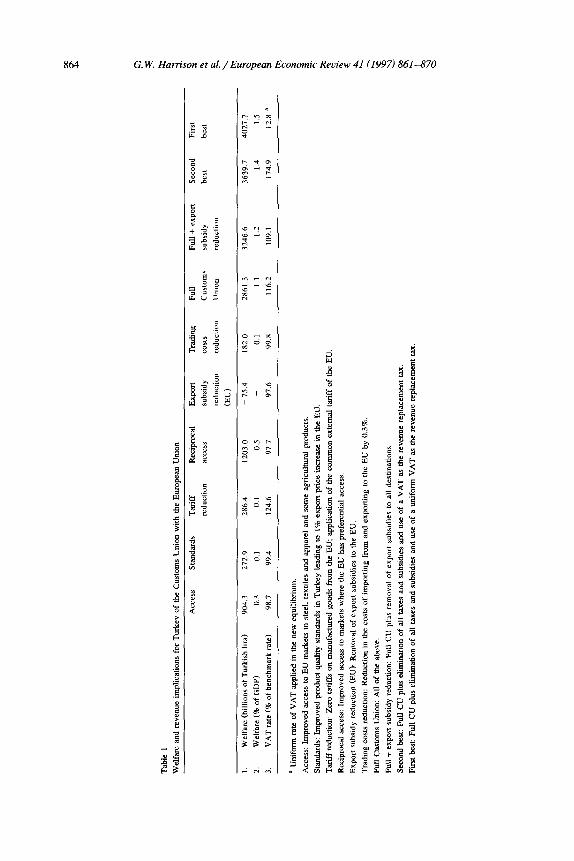
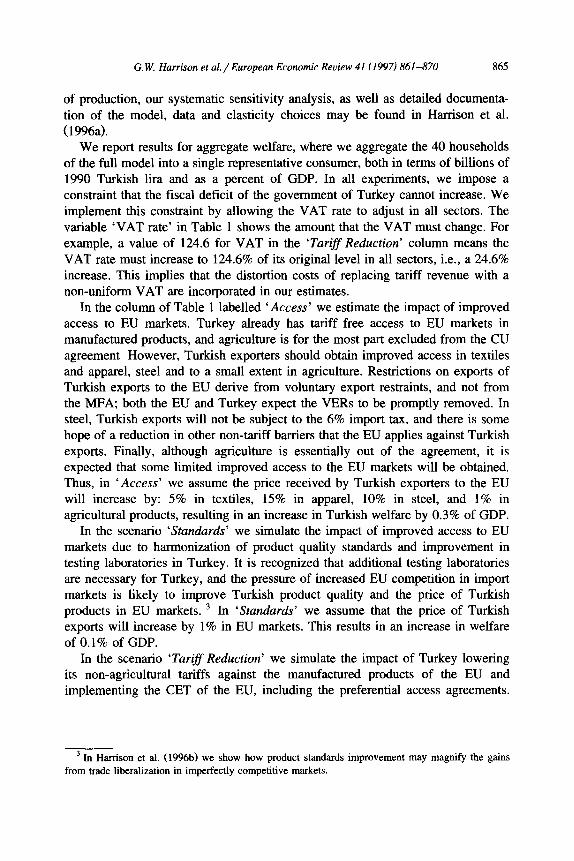
(EU), in addition to the traditional tariff changes. The model forms the basis for our policy conclusions which we believe will allow the government to optimize its entry into the CU with the EU. We begin by summarizing the principal elements that we quantify, presented in Table 1.
1.1. Low average tariffs
It is well known that the CU with the EU will imply that Turkey will eliminate its tariffs and levies on imports of manufacturing products originating from the EU. In addition, Turkey will apply the Common External Tariff (CET) of the EU on imports from third countries. It may be less understood that application of the
CET for most products will also involve a substantial reduction of tariffs against imports from third countries. In part this is true because the ‘most favored nation’ (MFN) tariff of the EU is only about 7 percent on average. But equally important, application of the EU’s CET implies that Turkey will be obligated to provide preferential access to its markets for all countries to whom the EU grants
preferential access. ’ By the year 2001, it is expected that Turkey will negotiate preferential trade agreements with all countries with whom the EU has a preferen- tial agreement. Based on Turkey’s present import shares, this means that the average tariff on non-agricultural imports will be less than 2 percent (zero for imports from the EU and slightly over 3 percent on average for third countries). Since Turkey is complementing its tariff elimination on EU imports with tariff reductions on imports from third countries, Turkey will become a relatively open economy in non-agricultural sectors. This complementary tariff reduction to third countries should be regarded optimistically since it reduces the trade diversion costs of the CU and results in additional gains from trade.
1.2. Improved access to third markets and to the EU
Since the preferential access agreements with third countries will typically be negotiated reciprocally, Turkish exporters can anticipate improved access to the markets of the third countries to whom it grants preferential access. According to
’ This includes the Eastern European countries with whom the EU has ‘Association agreements’,
Mediterranean countries subject to the EU’s Mediterranean policy, the African, Caribbean and Pacific
countries that are part of the Lome convention, as well as GSP treatment for eligible countries.
G. W. Harrison et al. /European Economic Review 41 (1997) 861-870 863
our estimates, improved access to third country markets results in gains to Turkey
that are quantitatively the most important element in the CU arrangements. This indicates that the government should expedite its negotiations with all countries with whom it will negotiate preferential agreements, analogous to the steps it has already taken with Hungary. In addition, Turkey will obtain improved access to
EU markets in selected ‘sensitive’ products.
1.3. Deep integration (product standards and reduced costs of trading)
As explained below, this includes improved terms-of-trade on sales in the EU
for Turkey due to the program on product standards (0.1% of GDP), and reduced costs of trading with the EU for reasons analogous to the reduction in border costs in the single market program (0.1% of GDP).
1.4. Overall gains
Our estimates are that the gains to Turkey of the CU with the EU are between
1% and 1.5% of its GDP per year depending on the complementary policies adopted by Turkey. These gains recur annually, and incorporate the welfare costs of imposing higher taxes to compensate for the revenue loss of the tariff. Of course, the results are dependent on the model structure. In particular, the long run
dynamic impact on the growth rate of the Turkish economy is not estimated in our model, so the gains from the CU are likely to be larger than we have estimated. 2
In Section 2 we discuss the principal quantitative results of the model. In Section 3 we quantitatively evaluate complementary policies Turkey may adopt to optimize its entry into the CU, including an analysis of the revenue replacement challenge. Finally, we note similarities in the experience of Spain and Greece
compared with the starting point of Turkey. The Greek experience shows that simply adopting the common external tariff of the EU does not guarantee a high
growth rate. Crucially, we argue, Turkey will have to reduce the role of the state in production.
2. Quantitative results for the CU
The principal results from our model are presented in Table 1. More detailed
results, such as the impact on the value added of specific sectors, returns of factors
-5---- See Baldwin (1989) and Rutherford and Tarr (forthcoming) for estimates of the dynamic gains
from trade liberalization. On the other hand, the estimates may be high to the extent that they ignore
the costs of adjustment. Estimates of the costs of adjustment, however, are typically small in relation to
the gains from trade liberalization (see Morkre and Tarr, 1980). Moreover, the EU has allocated funds
to assist Turkey in its adjustment to the CU.
Tab
le
1
Wel
fare
an
d re
venu
e im
plic
atio
ns
for
Tur
key
of
the
Cus
tom
s U
nion
w
ith
the
Eur
opea
n U
nion
AC
iXS
S
Stan
dard
s T
arif
f R
ecip
roca
l
redu
ctio
n ac
cess
Exp
ort
subs
idy
redu
ctio
n
(EU
)
Tra
ding
cost
s
redu
ctio
n
Ful
l
Cus
tom
s
Uni
on
Ful
l +
en
pon
subs
idy
redu
ctio
n
Seco
nd
best
Fir
st
best
I. W
elfa
re
(bill
ions
of
T
urki
sh
lira)
90
4.3
272.
9 28
6.4
1203
.0
- 75
.4
182.
0 28
61.3
32
46.6
36
39.7
40
27.7
2.
Wel
fare
(%
of
G
DP)
0.
3 0.
1 0.
1 0.
5 _
0.1
I 1
1.2
1.4
1.5
3.
VA
T
rate
(%
of
be
nchm
ark
rate
) 98
.7
99.4
12
4.6
97.7
97
.6
99.8
11
6.2
109.
1 17
4.9
12.8
a
a U
nifo
rm
rate
of
V
AT
ap
plie
d in
th
e ne
w
equi
libri
um.
Acc
ess:
Im
prov
ed
acce
ss
to
EU
m
arke
ts
m
stee
l, te
xtile
s an
d ap
pare
l an
d so
me
agri
cultu
ral
prod
ucts
.
Stan
dard
s:
Impr
oved
pr
oduc
t qu
ality
st
anda
rds
m
Tur
key
lead
ing
to
1%
expo
rt
pric
e in
crea
se
in
the
EU
.
Tar
iff
redu
ctio
n:
Zer
o ta
riff
s on
m
anuf
actu
red
good
s fr
om
the
EU
; ap
plic
atio
n of
th
e co
mm
on
exte
rnal
ta
riff
of
th
e E
U.
Rec
ipro
cal
acce
ss:
Impr
oved
ac
cess
to
m
arke
ts
whe
re
the
EU
ha
s pr
efer
entia
l ac
cess
Exp
ort
subs
idy
redu
ctio
n (E
U):
R
emov
al
of
expo
rt
subs
idie
s to
th
e E
U.
Tra
ding
co
sts
redu
ctio
n:
Red
uctio
n in
th
e co
sts
of
impo
rtin
g fr
om
and
expa
ting
to
the
EU
by
0.
3%.
Ful
l C
usto
ms
Uni
on:
All
of
the
abov
e.
Ful
l +
ex
port
su
bsid
y re
duct
ion:
F
ull
CL
! pl
us
rem
oval
of
ex
port
su
bsid
ies
to
all
dest
mat
ions
.
Seco
nd
best
: F
ull
CU
pl
us
elim
inat
ion
of
all
taxe
s an
d su
bsid
ies
and
use
of
a V
AT
as
th
e re
venu
e re
plac
emen
t ta
x.
Fir
st
best
: F
ull
CU
pl
us
elim
inat
ion
of
all
taxe
s an
d su
bsid
ies
and
use
of
a un
ifor
m
VA
T
as
the
rwen
ue
repl
acem
ent
tax.
G. W. Harrison et al. / European Economic Review 41(1997) 861-870 865
of production, our systematic sensitivity analysis, as well as detailed documenta-
tion of the model, data and elasticity choices may be found in Harrison et al.
(1996a). We report results for aggregate welfare, where we aggregate the 40 households
of the full model into a single representative consumer, both in terms of billions of 1990 Turkish lira and as a percent of GDP. In all experiments, we impose a constraint that the fiscal deficit of the government of Turkey cannot increase. We
implement this constraint by allowing the VAT rate to adjust in all sectors. The variable ‘VAT rate’ in Table 1 shows the amount that the VAT must change. For
example, a value of 124.6 for VAT in the ‘Tariff Reduction’ column means the VAT rate must increase to 124.6% of its original level in all sectors, i.e., a 24.6% increase. This implies that the distortion costs of replacing tariff revenue with a
non-uniform VAT are incorporated in our estimates. In the column of Table 1 labelled ‘Access’ we estimate the impact of improved
access to EU markets. Turkey already has tariff free access to EU markets in manufactured products, and agriculture is for the most part excluded from the CU agreement However, Turkish exporters should obtain improved access in textiles and apparel, steel and to a small extent in agriculture. Restrictions on exports of Turkish exports to the EU derive from voluntary export restraints, and not from the MFA; both the EU and Turkey expect the VERs to be promptly removed. In steel, Turkish exports will not be subject to the 6% import tax, and there is some hope of a reduction in other non-tariff barriers that the EU applies against Turkish exports. Finally, although agriculture is essentially out of the agreement, it is
expected that some limited improved access to the EU markets will be obtained. Thus, in ‘Access’ we assume the price received by Turkish exporters to the EU will increase by: 5% in textiles, 15% in apparel, 10% in steel, and 1% in agricultural products, resulting in an increase in Turkish welfare by 0.3% of GDP.
In the scenario ‘Standards’ we simulate the impact of improved access to EU markets due to harmonization of product quality standards and improvement in testing laboratories in Turkey. It is recognized that additional testing laboratories are necessary for Turkey, and the pressure of increased EU competition in import markets is likely to improve Turkish product quality and the price of Turkish products in EU markets. 3 In ‘Standards’ we assume that the price of Turkish exports will increase by 1% in EU markets. This results in an increase in welfare
of 0.1% of GDP. In the scenario ‘Tariff Reduction’ we simulate the impact of Turkey lowering
its non-agricultural tariffs against the manufactured products of the EU and implementing the CET of the EU, including the preferential access agreements.
3 In Harrison et al. (1996b) we show how product standards improvement may magnify the gains
from trade liberalization in imperfectly competitive markets.
866 G.W. Harrison et al./European Economic Review 41(1997) 861-870
We take as our initial equilibrium the situation that prevailed in 1993 (based on actual collections of tariffs, as opposed to MFN rates). By 1993, Turkey has already implemented a large portion of the tariff changes by phasing in the tariff
changes over a 12 year or 22 year period, depending on the product. We take as our counterfactual scenario the tariffs that will prevail in 2001, after preferential agreements have been negotiated with those countries that the EU has preferential
agreements. 4 This scenario results in an improvement of welfare equal to 0.1% of GDP. The benefits from this aspect of the CU are perhaps smaller than some would anticipate, but these estimates follow for a number of reasons: 5 First, in
our base year data, the total value of all EU imports was only about 9% of GDP, and the tariff reductions induce ‘triangles’ of consumption efficiency gains that are only a fraction of the value of the imports. Second, because tariff changes required by the CU were phased in over time and already significantly implemented in our benchmark year of 1993, there already was a low level of tariffs in Turkey in 1993. In fact, the average tariff reduction induced by the CU is only about 7%, and welfare gains from tariff reductions increase more than proportionally with the height of the initial tariff. Third, the tariffs on agricultural products are not reduced, so there are some non-uniform distortions introduced as the new tariff structure strongly favors agriculture. Finally, there are some trade diversion costs in any CU. The latter costs should not be high in Turkey’s case since third country
tariffs will not be high. The EU has negotiated preferential trade arrangements with a number of
countries, such as the central European countries and a number of Mediterranean countries. Turkey is obligated to negotiate similar preferential trade agreements with these countries. The impact of Turkey reducing its tariffs against these countries is already incorporated in the scenario ‘Tariff Reduction’. But Turkey should obtain improved access to the markets of these countries, since the tariffs of these countries will be reduced against Turkish exports. The impact on Turkey of its improved access to these third countries is estimated in the scenario ‘Reciprocal Access’. We assume that the improved access for Turkish exports in third markets will equal the improved access that Turkey will offer third country imports. This implies that improved access will increase the price Turkish exporters can obtain on exports to third countries by 4.2%. 6 Improved access to
4 Tariffs in the initial equilibrium are based on actually collected rates, and are taken from Arslan
(1995). Tariffs in the counterfactual are taken from data provided by Professor Subidey Togan.
5 These estimates are consistent with partial equilibrium calculations, see Harrison et al. (1996a, ftn.
9). 6 The difference between the ELI’s most favored nation CET and Turkey’s third country tariff,
taking into account preferences and weighted by Turkey’s trade weights is 4.2%. This may be an
underestimate of the improved access Turkey will receive in third markets since Turkish external tariffs under the CET of the EU are lower on average than the MFN rates of developing countries receiving
preferential access to the EU.
G. W. Harrison el al. /European Economic Review 41 (1997) 861-870 867
these markets results in a gain in Turkish welfare of 0.5%, which is the largest
gain of all the components. 7 In the scenario labelled ‘Export Subsidy Reduction’ we simulate elimination of
the remaining export incentives program for exports of non-agricultural products destined to the EU only. Compared with non-discriminatory reduction of export
subsidies, which appears to be the more likely policy choice, this does not affect Turkish welfare significantly (there is a negligible reduction in welfare). The reason is that with removal of export subsidies only to the EU, exporters have the
incentive to switch export markets away from the EU so they continue to receive export subsidies. Thus, the distortion costs of the export subsidy program are not reduced, unless they are reduced to all export markets. ’
In the scenario labelled ‘Trading Costs Reduction’ we simulate the impact of
reduction in the costs of trading between the EU and Turkey. As a result of the CU, closer relations with the EU will likely bring with it a possible reduction in
costs of clearing goods at the frontier. This is an effect similar to that of the single market program of the EU. The ‘Costs of Non-Europe’ studies estimated that in
the EU, border costs added 1.5% to 2% to the costs of exports. The impact should be quantitatively less important for Turkey so we assume that there will be a 0.3% reduction in the costs of goods imported from the EU and the costs of exporting to
the EU will also decline by 0.3%. This results in an improvement in Turkish welfare of 0.1%.
In the scenario ‘Full CU’ we combine all of the above elements. The overall
annual gain in Turkish welfare is equal to 1.1% of GDP. We estimate that the real exchange rate will have to depreciate by about 0.5% to maintain external balance (see Harrison et al., 1996a, for further details on the real exchange rate).
3. Conclusions and policy challenges
What complementary policies can Turkey adopt to optimize its entry into the CU? Given the crucial importance in Turkey of reducing the fiscal deficit and creating a stable macroeconomic regime, Turkey must adopt policies to confront the revenue replacement challenge. 9 We estimate that Turkey will lose tariff revenue equal to 1.4% of GDP. lo If the VAT is used to replace lost revenue, in the ‘Full CU’ we estimate that VAT rates will have to increase by 16.2% in each
’ Improved access, by improving the prices received by Turkish exporters, results in ‘rectangles’ of
gains on all previous sales in these export markets plus triangles of gains on new sales.
’ See Morkre and Tarr (1995) for a similar result.
9 For example, many hope the CU will encourage foreign direct investment. But the Mexico crisis
demonstrates that financial flows can flow out of Turkey if the macroeconomic situation deteriorates.
‘” See Krueger et al. (1995, p. 64) for a similar result.
868 G. W. Harrison et al. / European Economic Review 41 (1997) 861-870
sector to compensate for the revenue loss from implementing the full CU (for example from 10% to 11.6%). However, some tax experts in the government of Turkey believe that a VAT rate increase will generate little revenue due to tax
evasion problems driving more of the economy into the informal sector. This argues for subsidy reductions, which would serve the dual purpose of increasing efficiency directly by reducing distortions as well as reducing the revenue needs of
the state and the indirect distortions imposed by additional taxes. The CU imposes no restraints on export subsidies to third countries or in
agricultural products to any destination. In the column labelled ‘Full with Export Subsidy Reduction’ we estimate the impact of eliminating export subsidies to all destinations in addition to the elements of the CU. ” There is an additional 0.1% of GDP gain in welfare. (See Harrison et al., 1996a, for estimates of the gains from reducing agricultural tariffs.) In addition, we estimate that the VAT would have to increase by only 9.1% (rather than 16.2%) if export subsidy reduction to the rest of the world complemented implementation of the CU.
In order to assess the relative importance of other trade and tax distortions in Turkey, we also implement a scenario, called ‘Second Best’ in Table 1, in which, all tariffs, subsidies, and taxes other than the VAT are removed in addition to the elements in ‘Full’, and the VAT is used as the replacement tax. Since the welfare gain is 1.4% of GDP, removal of these other distortions results in a gain of 0.3%
over implementation of the full CU; but the existing VAT must increase by 74%. Finally, in the scenario called ‘First Best’ we impose a uniform VAT along with the other changes in ‘Second Best’. Since there are no untaxed sectors and no labor-leisure choice, the uniform VAT is equivalent to a lump sum tax with no distortions. Welfare increases another 0.1% relative to Second Best, but the uniform rate of VAT need only be 12.8% because all the exempted sectors are now included.
Probably the most important challenge from the CU is that it will result in
Turkish industries being exposed to international competition to a greater extent than has been the case to date. The increasingly competitive industrial structure brought on by the CU will further expose inefficient State Owned Enterprises (SOEs). The loss-making SOEs will likely lose even more, making it increasingly costly to maintain inefficient SOEs. The drain on the state budget and the rest of the economy would then become even more of a constraint on growth of the Turkish economy.
In summary, the reduction of state subsidies of various types and the reduction of the role of the state in production will significantly contribute to the solution of
” Any actions on export subsidy reduction in Turkey will almost certainly be taken in a non-dis-
criminatory manner, in part because there are many in Turkey who believe that the Framework
Agreement for the CU between the EU and Turkey imposes comparable restraints as GAlT/WTO rules regarding the subsidies and export incentives code.
G. W. Harrison et al. / European Economic Review 41 (1997) 861-870 869
all challenging problems identified. With participation with the EU in a CU,
Turkey now stands at historical crossroads. One road it can take at this time is the successful road taken by Spain after it decided to accede to the EU. Spain complemented its accession (and anticipated accession) to the EU with a signifi- cant reduction in the role of the state in the domestic economy.
On the other hand, despite rapid growth in the 196Os, Greece has made much less progress after its accession to the EU. Although both Greece and Spain adopted the external trade policies of the EU, Greece continued to support its SOEs to a much greater degree. Its consolidated fiscal deficit and public sector borrowing requirements rose to a large share of GDP in the 198Os, and this
crowded out private investment and contributed to stagnant growth. Moreover, even the private sector is highly regulated. As a result, between 1980 and 1992 Spain grew at over twice the rate of Greece such that by 1992 Spanish per capita income (at $14,000) was about twice the level of Greece. ‘*
Although Turkey in 1995 is a more open economy than either Greece or Spain at the start of their accession to the EU, and the precise form of state intervention in the domestic economies differed, all three economies experienced the problem of excessive state involvement in their domestic economies. In Turkey’s case, SOEs are its analogous achilles heel. The example of Greece demonstrates that simply adopting the external trade policy of the EU will not be sufficient to propel the economy forward to much higher growth rates. Bold and dramatic action to reduce the role of the state with respect to subsidies and ownership of production are crucial for a fully effective integration with the EU that will be capable of significantly boosting the growth of the Turkish economy.
Acknowledgements
The authors would like to thank: Ismail Arslan for his extensive comments and background paper; Roberto De Santis and Gazi Ozhan for preparation of the Social Accounting Matrix; Subidey Togan for his background paper and tariff calculations; Jacob Kolster and Costas Michalopoulos of the World Bank, Olivier Bodin and Bertin Martins of DGII and B. Hanbuckers of DGI in the Commission of the European Union; numerous individuals in both the private sector and government of Turkey for their helpful discussions and comments; and Minerva PateHa for logistical support. The views expressed are those of the authors and do not necessarily reflect those of the World Bank, the government of Turkey, the European Union or those acknowledged.
” See Harrison et al. (1996a) for sources and additional details regarding the Greek-Spanish
experience.
870 G. W. Harrison et al. /European Economic Review 41 (1997) 861-870
References
Arslan, I., 1995, Turkey: The CU and beyond, Background paper for the Country Economic
Memoranda, The World Bank, Ankara, mimeo.
Baldwin, R., 1989, The growth effects of 1992, Economic Policy 9, 247-281.
Harrison, G.W., T.F. Rutherford and D.G. Tam, 1996a. Economic implications for Turkey of a CU
with the European Union, Policy and research working paper no. 1599, The World Bank,
Washington, DC.
Harrison, G.W., T.F. Rutherford and D.G. Tarr, 1996b, Increased competition and completion of the
market in the European Union: Static and steady-state effects, Journal of Economic Integration, 11,
332-365.
Krueger, A.O., 0. Aktan, P. Dohlman, C. Ozden and J. Whalley, 1995, Industrial and fiscal impact on
Turkey of Customs Union with the European Union, Ankara, Treasury, mimeo.
Morkre, M.E. and D.G. Tarr, 1980, Effects of restrictions on United States imports: Five case studies
and theory (United States Government Printing Office, Washington, DC).
Morkre, M.E. and D.G. Tam, 1995, Reforming Hungarian agricultural trade policy, Weltwirtschaftliches
Archiv 131, 106-131.
Rutherford, T.F. and D.G. Tarr, forthcoming, Blueprints, spillovers and the dynamic gains from trade
liberalization in a small open economy, in: R. Baldwin and J. Francois, Eds., Dynamic issues in
applied commercial policy analysis (Cambridge University Press, Cambridge).