economic impacts of guided whitewater rafting: a study of five rivers
TRANSCRIPT
WATER RESOURCES BULLETINVOL. 32, NO.6 AMERICANWATER RESOURCES ASSOCIATION DECEMBER 1996
ECONOMIC IMPACTS OF GUIDED WHITEWATER RAFTING:A STUDY OF FIVE RIVERS'
Donald B. K English and J. M. Bowker2
ABSTRACT: This paper presents estimates of the statewide eco-nomic impacts of guided whitewater rafting on five rivers in sixstates: the Nantahala (North Carolina), Gauley (West Virginia),Kennebec (Maine), Middle Fork of the Salmon (Idaho), and Chat-tooga (Georgia-South Carolina). Except for the Chattooga and Mid-dle Fork, rafting is dependent on upstream dam releases. Guidefees range from about $15 per trip on the Nantahala to over $1,000on the Middle Fork. Economic impacts per nonresident 1000 visi-tors increase along with length of the rafting trip and remoteness ofthe river. Total industrial output per 1000 nonresident visitorsranged from $95,000 on the Nantahala to over $2.5 million on theMiddle Fork. However, because of differences in annual visitationlevels, total impacts were greatest at the Nantahala, at over $14million in 1993. Multipliers for all economic measures were rela-tively consistent over the rivers. Employment multipliers (Type Ill)ranged from 1.67 to 1.90, income multipliers from 2.0 to 2.4, andindustrial output multipliers from 2.1 to 2.5.(KEY TERMS: economic impacts; whitewater rafting; visitor expen-ditures; river recreation.)
INTRODUCTION
Whitewater rafting is among the eight fastestgrowing outdoor recreation activities tracked by theForest Service's RPA Assessment process (English etal., 1993). Activity levels are expected to at least dou-ble in the next 40 years. Hence, the consequences ofincreased whitewater recreation will be important forpolicy makers and planners. This will be especiallytrue if managers must also contend with limitingrecreational use of rivers and their corridors to pro-tect both the resource and the quality of the recre-ation experience. For both managers and policymakers, information that assists decision making iscritical.
One important criterion for choosing among policyor management alternatives regarding resources such
as rivers is the change in net economic welfare. Suchwelfare changes are measured by changes in con-sumer surplus, or the value consumers place on theuse of a resource, over and above what they actuallypay to use it. For this measure, changes in theamount or location of market economic activity associ-ated with the alternatives are largely irrelevant.
However, many public agencies also have goals ofrural development, economic stability, or economicdiversity. As a result, they may be highly concernedwith the effects on jobs, income, and economic marketactivity in a local or regional area of a policy changeor management action (Johnson and Moore, 1993;USDA Forest Service, 1995). Such regional economicimpacts measure changes in the market value ofindustrial output (goods and services) produced in theregion, as well as the effects on the region's level ofemployment (number of jobs) and earned income(wages and proprietor income) (Stoll et al., 1987).Much of the impetus for performing impact analysesoften comes from political interest or local groups.Because the focus is on where and how much marketactivity occurs, alternatives that shift jobs or produc-tion from one region to another may be consideredhighly successful regardless of any associated welfarechanges as judged by economic efficiency criteria.
Spending by visitors is the primary engine foraffecting an economy through recreation. For a recre-ation resource, the economic impacts measure thechange in the level of market activity in the localeconomy if visitation to the resource were to change.With such information, policy makers could examinethe loss to the economy of limiting recreational use ofa crowded river or, conversely, examine how much aneconomy would grow if recreational use were expand-ed.
1Paper No. 96021 of the Water Resources Bulletin. Discussions are open until June 1, 1997.2Research Social Scientists, USDA Forest Service, Southern Research Station, 320 Green St., Athens, Georgia 30602.
1319 WATER RESOURCES BULLETIN
English and Bowker
In this paper we examine state level regional eco-nomic impacts of guided whitewater rafting at fiverivers: the Chattooga (bordering Georgia and SouthCarolina), Gauley (West Virginia), Kennebec (Maine),Middle Fork of the Salmon (Idaho), and Nantahala(North Carolina). We combine detailed expendituresurveys, an input-output model, and visitation esti-mates to calculate average and aggregate measuresthe economic impacts to state economies of guidedcommercial rafting. In addition, we offer profiles foreach river and its users, and we review previous workin the area.
An important aspect of the study is that the riversvary by region and by level of difficulty, cost, crowd-ing, remoteness, and level of protection and manage-ment. Thus, we offer a range of results. Such aspectrum has potential value to policy makers andregional planners as a starting point for the creationof an impacts transfer framework analogous to theconcept of benefits transfer currently being used withnet economic surplus in demand studies (Walsh etal., 1992).
RIVER CHARACTERISTICS
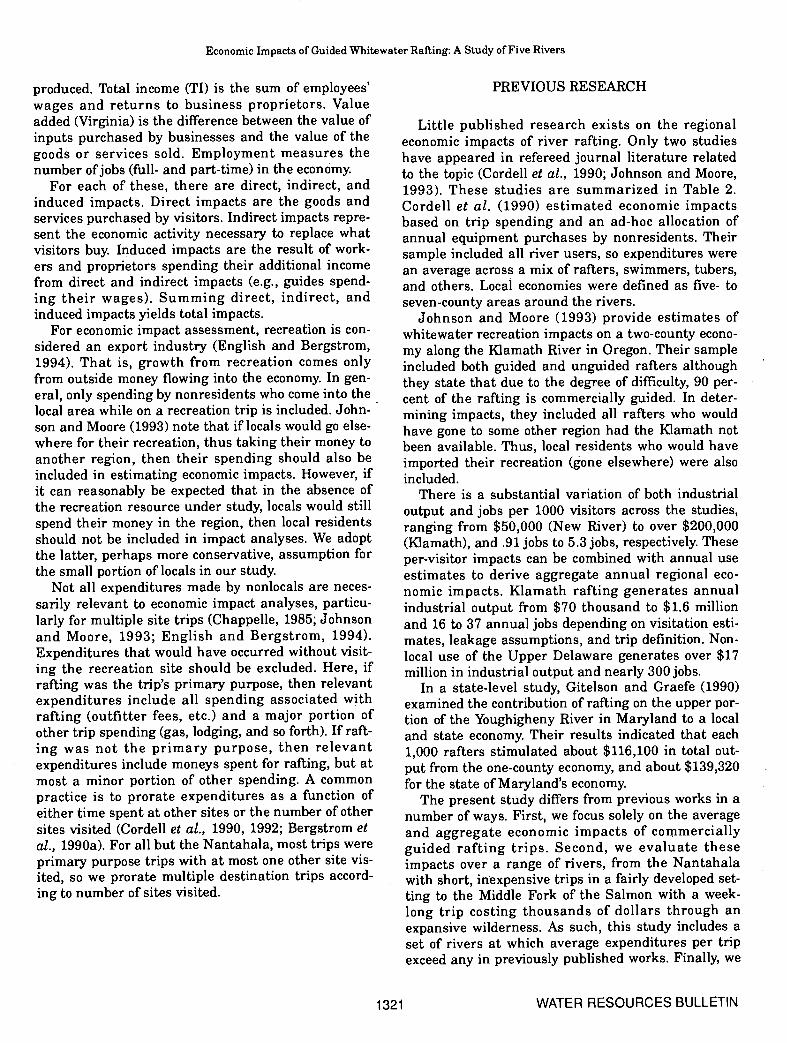
The rivers cover a wide range of trip length, diffi-culty, and market area (Table 1). The NantahalaRiver offers a short trip suitable for novices and fami-lies. At the other extreme, the Gauley requires sub-stantial previous rafting experience, and the MiddleFork significant time and money requirements (Arm-stead 1989). The Chattooga and the Middle Fork arepart of the designated National Wild and Scenic River
System, and have limits on annual commercial useand staggered start times for rafting groups. Raftingon the other three rivers depends on dam releases. Onthe Nantahala, moderate commercial use limits are inplace during mid-week days to provide rafters theopportunity for a higher quality and less crowdedexperience CM. Wilkins, December 17, 1995, PersonalCommunication with District Ranger, Wayah RangerDistrict, National Forests in North Carolina). A spe-cial draw for rafting the Middle Fork is that it entailsrafting though the heart of the 2.5 million-acre FrankChurch River of No Return Wilderness. One factor inthe Gauley's popularity is its limited use season, oftenspanning less than two months.
The Gauley and Middle Fork are two of an eliteclass of whitewater rafting opportunities (Armstead,1989). Extremely challenging rapids and very remotelocations separate these two from the other threerivers. In contrast, the Nantahala is a low-end intro-duction to the sport, accessible to both adults andchildren. The Nantahala is near several metropolitanareas, and typical trips are short, inexpensive, andrelatively tame. By far, the Nantahala is the mostcrowded of the rivers studied here. The Chattoogaand the Kennebec fall in the middle, offering chal-lenging trips to a regional audience.
ECONOMIC MEASURES OFREGIONAL IMPACTS
This paper examines four common dimensionsof economic impacts. Total industrial output (TIO)measures the market value of goods and services
TABLE 1. Characteristics of the Five Study Rivers.
.Chattooga
RiverGauleyRiver
KennebecRiver
Middle ForkRiver
NantahalaRiver
Trip LengthMiles 8-20 14-28 28 100 8Float time 1-2 days 1-2 days 1-2 days 5-6 days 3-4 hours •
Dam Controlled No Yes Yes No YesWild and Scenic Designation Yes No No Yes NoCommercial Use Limits Annual None None Annual Midweek daysDifficulty of Rapid TI-V 111-V Ill-V Ill-V H-IllNormal Use Season April-Nov. Sept.-Oct. May-Sept. May-Sopt. April-Nov.Market Region Nation Region Nation Local-RegionAnnual Commercial Use (1000's) 39 45 36 4.5 213
WATER RESOURCES BULLETIN 1320
Economic Impacts of Guided Whitewater Rafting: A Study of Five Rivers
produced. Total income (TI) is the sum of employees'wages and returns to business proprietors. Valueadded (Virginia) is the difference between the value ofinputs purchased by businesses and the value of thegoods or services sold. Employment measures thenumber ofjobs (full- and part-time) in the economy.
For each of these, there are direct, indirect, andinduced impacts. Direct impacts are the goods andservices purchased by visitors. Indirect impacts repre-sent the economic activity necessary to replace whatvisitors buy. Induced impacts are the result of work-ers and proprietors spending their additional incomefrom direct and indirect impacts (e.g., guides spend-ing their wages). Summing direct, indirect, andinduced impacts yields total impacts.
For economic impact assessment, recreation is con-sidered an export industry (English and Bergstrom,1994). That is, growth from recreation comes onlyfrom outside money flowing into the economy. In gen-eral, only spending by nonresidents who come into thelocal area while on a recreation trip is included. John-son and Moore (1993) note that if locals would go else-where for their recreation, thus taking their money toanother region, then their spending should also beincluded in estimating economic impacts. However, ifit can reasonably be expected that in the absence ofthe recreation resource under study, locals would stillspend their money in the region, then local residentsshould not be included in impact analyses. We adoptthe latter, perhaps more conservative, assumption forthe small portion of locals in our study.
Not all expenditures made by nonlocals are neces-sarily relevant to economic impact analyses, particu-larly for multiple site trips (Chappelle, 1985; Johnsonand Moore, 1993; English and Bergstrom, 1994).Expenditures that would have occurred without visit-ing the recreation site should be excluded. Here, ifrafting was the trip's primary purpose, then relevantexpenditures include all spending associated withrafting (outfitter fees, etc.) and a major portion ofother trip spending (gas, lodging, and so forth). If raft-ing was not the primary purpose, then relevantexpenditures include moneys spent for rafting, but atmost a minor portion of other spending. A commonpractice is to prorate expenditures as a function ofeither time spent at other sites or the number of othersites visited (Cordell et al., 1990, 1992; Bergstrom etal., 1990a). For all but the Nantahala, most trips wereprimary purpose trips with at most one other site vis-ited, so we prorate multiple destination trips accord-ing to number of sites visited.
PREVIOUS RESEARCH
Little published research exists on the regionaleconomic impacts of river rafting. Only two studieshave appeared in refereed journal literature relatedto the topic (Cordell et al., 1990; Johnson and Moore,1993). These studies are summarized in Table 2.Cordell et al. (1990) estimated economic impactsbased on trip spending and an ad-hoc allocation ofannual equipment purchases by nonresidents. Theirsample included all river users, so expenditures werean average across a mix of rafters, swimmers, tubers,and others. Local economies were defined as five- toseven-county areas around the rivers.
Johnson and Moore (1993) provide estimates ofwhitewater recreation impacts on a two-county econo-my along the Kiamath River in Oregon. Their sampleincluded both guided and unguided rafters althoughthey state that due to the degree of difficulty, 90 per-cent of the rafting is commercially guided. In deter-mining impacts, they included all rafters who wouldhave gone to some other region had the Kiamath notbeen available. Thus, local residents who would haveimported their recreation (gone elsewhere) were alsoincluded.
There is a substantial variation of both industrialoutput and jobs per 1000 visitors across the studies,ranging from $50,000 (New River) to over $200,000(Kiamath), and .91 jobs to 5.3 jobs, respectively. Theseper-visitor impacts can be combined with annual useestimates to derive aggregate annual regional eco-nomic impacts. Klamath rafting generates annualindustrial output from $70 thousand to $1.6 millionand 16 to 37 annual jobs depending on visitation esti-mates, leakage assumptions, and trip definition. Non-local use of the Upper Delaware generates over $17million in industrial output and nearly 300 jobs.
In a state-level study, Gitelson and Graefe (1990)examined the contribution of rafting on the upper por-tion of the Youghigheny River in Maryland to a localand state economy. Their results indicated that each1,000 rafters stimulated about $116,100 in total out-put from the one-county economy, and about $139,320for the state of Maryland's economy.
The present study differs from previous works in anumber of ways. First, we focus solely on the averageand aggregate economic impacts of commerciallyguided rafting trips. Second, we evaluate theseimpacts over a range of rivers, from the Nantahalawith short, inexpensive trips in a fairly developed set-ting to the Middle Fork of the Salmon with a week-long trip costing thousands of dollars through anexpansive wilderness. As such, this study includes aset of rivers at which average expenditures per tripexceed any in previously published works. Finally, we
1321 WATER RESOURCES BULLETIN

English and Bowker
Table 2. Summary of Previous Research on Regional Economic Impacts of River Recreation.1
DelawareWater Gap2
River
UpperDelaware
River
New RiverGorge2River
Klamath3River
Sample (user types) All Users All Users All Users Rafters Only
Mean Expenditure Per Person Per Trip inLocal Economy
$52.53 $24.95 $25.62 $157.00
LocalEconomySize(numberofcounties) 5 6 • 7 2
Economic Impacts Per 1000 Visitors:Industrial output ($1000)Jobs (number)
98.21.72
88.91.51
49.90.91
203.25.3
Nonresident Visitation (l000s of visitors) 90.7 193.1 66.0 3 to 5
Annual Economic Impacts:Industrial Output ($ million)Jobs
8.9156
17.2292
3.360
.07 to 1.616 to 37
1lmpacts for all studies are adjusted to 1992 dollars using the GDP deflator.2Source: Cordell et al., 1990.3Source: Johnson and Moore, 1993.
use an expenditure sampling procedure that avoidsthe problem of endogenous stratification common toon-site sampling.
DATA
Data were collected in cooperation with AmericaOutdoors (AO), a national organization of outfittersand guides. A random sample of names of individualswho had taken trips on any of the five rivers duringthe 1993 rafting season was selected to receive sur-veys in the mail. Name lists were provided by guidesbelonging to AO and who ran these rivers. The proba-bility of an individual being selected for the samplewas independent of the number of trips taken, so pos-sible bias resulting from endogenous stratificationwas avoided (Shaw, 1988). Data were collected regard-ing the individual's most recent trip to the river.Although we begin with a sample of users rather thantrips, we nonetheless get a reasonable proxy for asample of trips since many of the individuals in oursample took only one trip per year to the river.
Surveys contained questions about trip length,number of other sites visited, group demographics,and expenditures. Individuals were asked to reportthe amount of money they spent in total and withinthe state of their rafting experience. Response ratesfor the surveys varied by river, ranging from about 45percent for the Middle Fork to about 25 percent onthe Nantahala. Although low, these response rates
WATER RESOURCES BULLETIN 1322
are typical of other mail surveys of recreation users(e.g., Bergstrom et al., 1990a, 22 percent to 44.6 per-cent; Cordell et al., 1990, 32 percent; Loomis andKing, 1994, 35 percent; Stoll et al., 1988, 30.1 percent;Gomez and Ozuna, 1993, 36.5 percent).
METHODS
In this study, impact areas were complete states.Thus, in-state residents were not included in theimpact analyses. For the Chattooga River, separateanalyses were developed for those who used outfittersbased in Georgia and those who used outfitters basedin South Carolina. On the survey form, respondentswere asked in which state their trip was based. Onlynonresidents of that state were used for each sub-group.
For single-site trips, all trip expenses were includ-ed in calculating expenditure means. For multiple-site visits, spending other than outfitter andequipment rental were prorated as a function of thenumber of other sites visited and whether rafting wasthe primary purpose for the recreation trip. The pro-rating percentage, PP, for spending was
(1+MAJNREAS)(OTHSITEN+2)
(1)
Economic Impacts of Guided Whitewater Rafting: A Study of Five Rivers
where MAINREAS = 1 if rafting was the main reasonfor the trip and zero otherwise, and OTHSITEN is thenumber of other sites the individual visited on thetrip. Thus, if OTHSITEN = 1, then PP = 1/3 for tripswhere rafting was not the primary purpose, and PP =2/3 if rafting was the primary purpose. Expenses perperson per trip were obtained by dividing relevantexpenses by the number of people for whom expenseswere paid. The result was an estimate of expendituresper person per trip by nonresidents.
Information on the total number of outfitted use ateach river during the 1993 rafting season was sup-plied by America Outdoors. Sample percentages wereused in determining the proportion of total use thatwere nonresidents of the impact states. The resultwas an estimate of the number of person trips takenby nonresidents to each river.
Impact analysis was performed using MicrolM-PLAN, version 91-F, and 1992 base year data. Severalprevious studies, in addition to the two above, haveused IMPLAN in conjunction with spending profilesobtained from visitors, to estimate regional economicimpacts of recreation (Bergstrom et al., 1990a, b;Cordell et al., 1992; Dawson et al., 1993). The advan-tages and disadvantages of using IMPLAN in thisway have been discussed elsewhere (Aiward and Loft-ing, 1985; Alward et al., 1985; Hotvedt et al., 1988;Stevens and Rose, 1985).
Reported spending per item was allocated toIMPLAN sectors following English et al. (1995). ForIMPLAN analysis, per person per trip expendituresfor each affected IMPLAN sector were treated as afinal demand vector of commodity purchases. We usedthe default margins for trade and transportation mar-gins, as well as regional purchase coefficients.
Visitor Characteristics
RESULTS
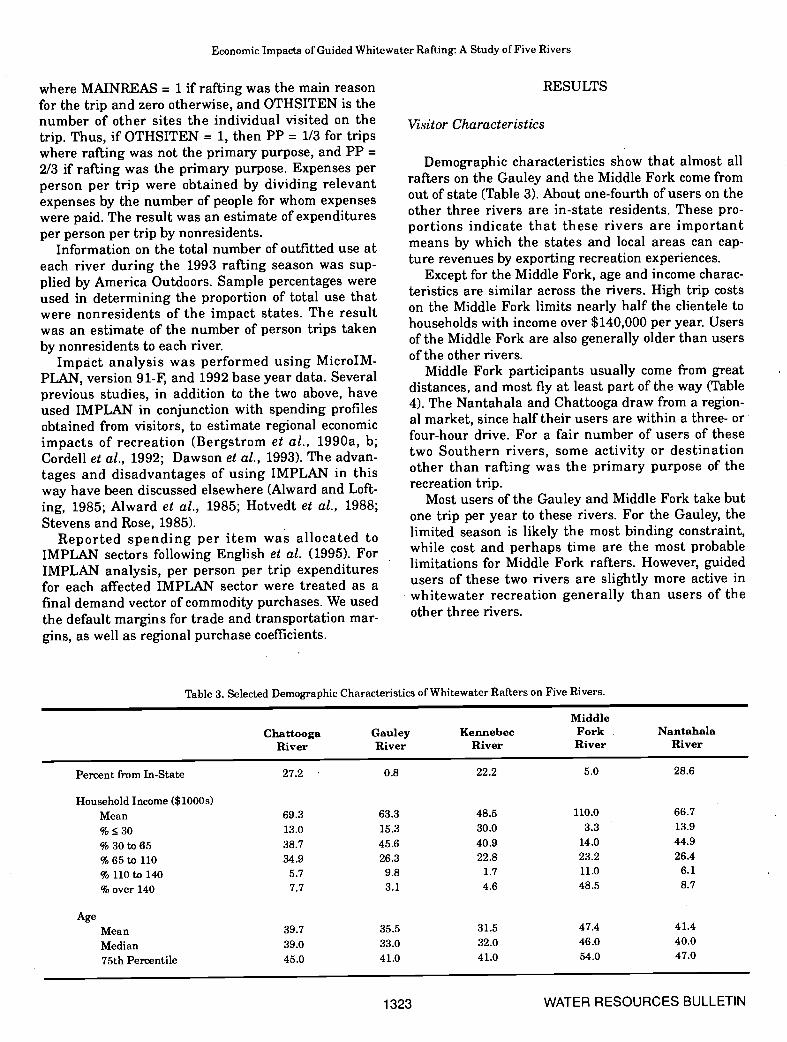
Demographic characteristics show that almost allrafters on the Gauley and the Middle Fork come fromout of state (Table 3). About one-fourth of users on theother three rivers are in-state residents. These pro-portions indicate that these rivers are importantmeans by which the states and local areas can cap-ture revenues by exporting recreation experiences.
Except for the Middle Fork, age and income charac-teristics are similar across the rivers. High trip costson the Middle Fork limits nearly half the clientele tohouseholds with income over $140,000 per year. Usersof the Middle Fork are also generally older than usersof the other rivers.
Middle Fork participants usually come from greatdistances, and most fly at least part of the way (Table4). The Nantahala and Chattooga draw from a region-al market, since half their users are within a three- orfour-hour drive. For a fair number of users of thesetwo Southern rivers, some activity or destinationother than rafting was the primary purpose of therecreation trip.
Most users of the Gauley and Middle Fork take butone trip per year to these rivers. For the Gauley, thelimited season is likely the most binding constraint,while cost and perhaps time are the most probablelimitations for Middle Fork rafters. However, guidedusers of these two rivers are slightly more active inwhitewater recreation generally than users of theother three rivers.
Table 3. Selected Demographic Characteristics of Whitewater Rafters on Five Rivers.
MiddleChattoo
Riverga Gauley
RiverKennebec
RiverForkRiver
NantahalaRiver
Percent from In-State 27.2 • 0.8 22.2 5.0 28.6
Household Income ($ l000s)Mean 69.3 63.3 48.5 110.0 66.7
% � 30 13.0 15.3 30.0 3.3 13.9
% 30 to 65 38.7 45.6 40.9 14.0 44.9
% 65 to 110 34.9 26.3 22.8 23.2 26.4
% 110 to 140 5.7 9.8 1.7 11.0 6.1
% over 140 7.7 3.1 4.6 48.5 8.7
AgeMean 39.7 35.5 31.5 47.4 41.4
Median 39.0 33.0 32.0 46.0 40.0
75th Percentile 45.0 41.0 41.0 54.0 47.0
1323 WATER RESOURCES BULLETIN

English and Bowker
Table 4. Selected Trip Characteristics of Whitewater Rafters on Five Rivers.
MiddleChattooga Gauley Kennebec Fork
River River River RiverNantahala
River
Miles traveledMean 282.6 384.2 245.4 1516.1 219.4Median 180.0 350.0 250.0 1500.0 120.075th Percentile 455.0 485.0 340.0 2000.0 300.0
PercentUsingAirTravel 1.5 2.8 4.9 67.1 1.4
Percent Whose Main Trip 80.1 98.3 91.0 97.2 66.1Purpose Was Rafting
MeanNumberofAnnual 1.5 1.1 1.6 1.1 1.7Rafting Trips to This River
Mean Number of Annual 1.2 1.8 0.5 1.7 0.9Rafting Trips to Other Rivers 1.2 1.8 0.5 1.7 0.9
TABLE 5. Per Person Expenditures for Nonresident Rafters, Total, and in the State Visited.
MiddleChattooga River Gauley Kennebec Fork
Georgia South Carolina River River RiverNantahala
River
Total Spending By ItemLodging 37.12 38.24 38.24 46.61 98.97 36.05Food 30.57 28.56 39.75 34.34 78.82 28.02Transportation 25.15 19.31 33.30 22.34 265.60 20.88Activities 237.80 128.24 343.74 150.07 2,338.89 96.07Miscellaneous 24.33 16.83 25.05 22.15 113.03 16.19TOTAL 354.97 231.18 480.08 275.15 2,895.31 19721
In State VisitedLodging 26.67 15.90 24.76 39.35 77.74 13.16Food 18.93 9.74 28.58 26.85 64.30 11.81Transportation 7.20 4.09 8.31 13.34 106.66 4.25Activities 37.16 56.76 73.40 107.90 982.67 24.80Miscellaneous 8.03 8.76 13.69 17.45 52.26 6.93TOTAL 97.99 95.25 148.74 204.89 1,283.63 60.95
Expenditure Patterns
Total per-person per-trip spending by nonresidentsfor rafting trips on the Eastern rivers ranged fromabout $200 for trips to the Nantahala to $480 for tripsto the Gauley (Table 5). Because of the river's remote-ness and much longer trip, costs for rafting the Mid-dle Fork were much higher, averaging nearly $2,900per person trip. Activity expenses, primarily outfitterand equipment rental fees, account for over 70 per-cent of total trip cost for visitors to the Gauley or Mid-dle Fork Rivers. For the Nantahala, activity expensesmake up less than half of the total trip cost.
The amount of money spent in the state visitedwhile rafting varied from about $61 per person per
trip for the Nantahala River to almost $1,300 for tripsto the Middle Fork. Except for the Kennebec, between25 and 40 percent of per-person per-trip expenditureswere made in the state visited. The percentage ofinstate spending for the Kennebec was much higher,at nearly 75 percent.
Economic Impacts
As an intermediate step and to facilitate compari-son with previous research, we calculated impactsfrom in-state spending per 1000 nonresident raftingtrips (Table 6). On average, each 1000 trips by non-residents on the Nantahala River generated about
WATER RESOURCES BULLETIN 1324
Economic Impacts of Guided Whitewater Rafting: A Study of Five Rivers
TABLE 6. Statewide Impacts Per 1000 NonresidentVisits (in thousands of 1992 dollars).
MiddleChattooga River Gauley
RiverKennebec
RiverForkRiver
NantahalaRiverGeorgia South Carolina
Direct* .
TIO ($1000) 71.9 69.6 86.4 153.0 986.9 39.6
INC ($1000) 44.3 39.4 48.6 88.0 512.7 23.7VA ($1000) 48.9 44.5 55.2 94.8 577.6 26.0EMP 2.01 2.04 2.71 5.33 29.16 1.27
IndirectTIO 17.8 15.6 15.0 33.8 246.8 9.1INC 9.6 8.2 7.5 17.1 131.9 4.6
VA 10.3 8.9 8.2 19.5 143.3 5.0
EMP 0.25 0.26 0.26 0.60 5.09 0.13
InducedTIO 72.7 59.9 108.2 193.7 1,021.1 45.8INC 40.2 32.4 59.6 108.3 555.9 25.0VA 45.3 36.9 67.6 123.1 634.7 28.4
EMP 1.19 1.12 2.17 3.76 21.02 0.79
TOTALTIO 162.5 145.2 209.5 380.5 2,254.7 94.5INC 94.1 80.1 115.6 213.4 1,200.5 53.4VA 104.5 90.3 131.0 237.4 1,355.6 59.4
EMP 3.45 3.41 5.14 9.69 55.28 2.20
*Direct impacts per 1000 visitors are less than direct expenditures per 1000 visitors due to immediate leakage out of the state for certainexpenditures included in Table 5, primarily lodging at Federally-owned campgrounds.
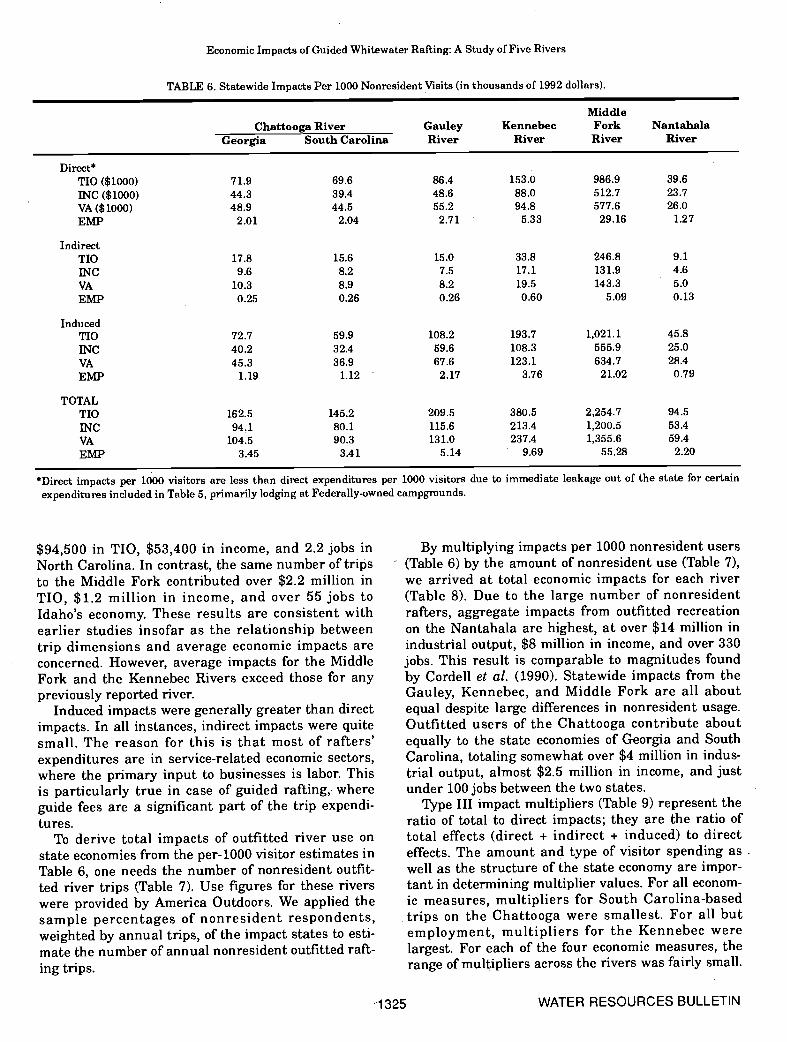
$94,500 in TIO, $53,400 in income, and 2.2 jobs inNorth Carolina. In contrast, the same number of tripsto the Middle Fork contributed over $2.2 million inTIO, $1.2 million in income, and over 55 jobs toIdaho's economy. These results are consistent withearlier studies insofar as the relationship betweentrip dimensions and average economic impacts areconcerned. However, average impacts for the MiddleFork and the Kennebec Rivers exceed those for anypreviously reported river.
Induced impacts were generally greater than directimpacts. In all instances, indirect impacts were quitesmall. The reason for this is that most of rafters'expenditures are in service-related economic sectors,where the primary input to businesses is labor. Thisis particularly true in case of guided rafting, whereguide fees are a significant part of the trip expendi-tures.
To derive total impacts of outfitted river use onstate economies from the per-1000 visitor estimates inTable 6, one needs the number of nonresident outfit-ted river trips (Table 7). Use figures for these riverswere provided by America Outdoors. We applied thesample percentages of nonresident respondents,weighted by annual trips, of the impact states to esti-mate the number of annual nonresident outfitted raft-ing trips.
By multiplying impacts per 1000 nonresident users(Table 6) by the amount of nonresident use (Table 7),we arrived at total economic impacts for each river(Table 8). Due to the large number of nonresidentrafters, aggregate impacts from outfitted recreationon the Nantahala are highest, at over $14 million inindustrial output, $8 million in income, and over 330jobs. This result is comparable to magnitudes foundby Cordell et al. (1990). Statewide impacts from theGauley, Kennebec, and Middle Fork are all aboutequal despite large differences in nonresident usage.Outfitted users of the Chattooga contribute aboutequally to the state economies of Georgia and SouthCarolina, totaling somewhat over $4 million in indus-trial output, almost $2.5 million in income, and justunder 100 jobs between the two states.
Type III impact multipliers (Table 9) represent theratio of total to direct impacts; they are the ratio oftotal effects (direct + indirect + induced) to directeffects. The amount and type of visitor spending aswell as the structure of the state economy are impor-tant in determining multiplier values. For all econom-ic measures, multipliers for South Carolina-basedtrips on the Chattooga were smallest. For all butemployment, multipliers for the Kennebec werelargest. For each of the four economic measures, therange of multipliers across the rivers was fairly small.
1325 WATER RESOURCES BULLETIN

English and Bowker
TABLE 7. Estimates of Annual Nonresidential Outfitter Use (in thousands of visitors).
River
Sample TotalCommercialUse (lOO0s) X
NonresidentProportion from
Out-of-State =CommercialUse (l000s)
Chattooga5GeorgiaSouth Carolina
19.519.5
•
.726
.73014.114.2
Gauley 45.0 .800 40.5
Kennebec 36.0 .778 .28.0
Middle Fork 4.5 .949 4.3
Nantahala 213.0 .714 152.1
5Thtal use data provided by America Outdoors.5tAut half of the sample indicated they spent most of their time during the trip in Georgia. Total commercial use of the Chattooga during
1993 was estimated at 39,000 people.
TABLE 8. Total Statewide Impacts of Outfitted River Usein Millions of 1992 Dollars, or Number of Jobs.
MiddleChattooga River Gauley Kennebec
Georgia South Carolina River RiverForkRiver
NantahalaRiver
Total Industrial Output 2.29 2.06 8.49 10.65 9.70 14.37
Total Income 1.33 1.14 4.68 5.98 5.16 8.12
Value Added 1.47 1.28 5.31 6.65 5.83 9.04
Employment 48.65 48.42 208.17 271.32 237.70 334.62
TABLE 9. Type III Multipliers (total impacts/direct impacts).
Chattooga River Gauley KennebecGeorgia South Carolina River River
MiddleForkRiver
NantahalaRiver
Total Industrial Output 2.26 2.09 2.42 2.49 2.28 2.39Total Income 2.12 2.03 2.38 2.43 2.34 2.25Value Added 2.14 2.03 2.37 2.50 2.35 2.28
Employment 1.72 1.67 1.90 1.82 1.90 1.73
TIO multipliers ranged from about 2.1 on the Chat-tooga to about 2.5 for the Kennebec, while employ-ment multipliers ranged from just under 1.7 to 1.90.
DISCUSSION
We have presented several measures of economicimpacts of commercial rafting over a variety of white-water rivers. Impacts per trip are important to identi-fy resources where small changes in the number of
trips can have large impacts to rural economies. Overthe range of rivers examined here, there was a directcorrelation between the length and difficulty of therafting trip and the impacts per trip. However,because of water flow or annual use restrictions atthese higher quality locations, total impacts can begreater for locations with )ower trip quality butgreater use levels.
As could be expected given the reported expendi-ture patterns, most of the impacts for outfitted white-water rafting trips accrue to economic sectors thatcontain businesses such as recreation services (i.e.,
WATER RESOURCES BULLETIN 1326

Economic Impacts of Guided Whitewater Rafting: A Study of Five Rivers
outfitters), lodging, restaurants, car rental, retailgasoline, and, especially for the Middle Fork, air trav-el. Because these are industries with high laborinputs, the induced effects were fairly high. Our esti-mated per-trip impacts and multipliers are somewhathigher than those reported in past studies. However,our impact regions are also larger, so we are likely toinclude a greater portion of all trip-related spending.In addition, state level economies generally have lessleakage than local economies, which are smaller andless diverse, and this can also contribute to higherimpact estimates.
Our sampling strategy allowed us to avoid any biasfrom the endogenous stratification inherent in manyon-site recreation samples. However, we were unableto analyze or correct for any possible sample selectionor nonresponse biases. Although nothing has beenpublished to date to demonstrate the effects of sampleselection on economic impact estimates, it seems pru-dent to assume that such biases may be important.Further research along these lines would seem war-ranted.
For most of the rivers examined here, the vastmajority of rafting trips were solely for the purpose ofrafting that river. However, for the Nantahala, raftingwas not the trip's primary purpose for over one-thirdof our sample, and almost all respondents visitedother recreation sites on the same trip. Like most pre-vious studies, we used an ad hoc, although intuitivelyreasonable, method to allocate trip expendituresacross multiple sites. More research is needed to eval-uate the appropriateness of such methods and toexamine the role of one site in determining totalspending and trip demand patterns.
An important use of economic impact studies foragencies and land managers is to provide examples ofresults that can be applied to similar situations inother locations. Such "impacts transfers" from oneresource to another are most appropriate if the type ofresource, type of recreation use, and size of impactarea are closely matched. Because we have measuredimpacts in a consistent manner over a range of riverresources, we feel our results are a useful addition tothe inventory of empirical results cataloguing the eco-nomic impacts of recreational uses of rivers. Clearly,however, more empirical results need to be reportedin resource journals to further expand our knowledge.
Given the wide range of rivers in this study, theoverall consistency of the multipliers is encouragingfor extrapolating our results to other rivers usingmultiplier analysis. If estimates of total or per-persondirect spending in a state on commercial rafting tripsis known for some other river, then an estimate ofstatewide TIO impacts can be obtained via our multi-pliers. Applying the range of multiplier values found
here (2.1 to 2.5) could provide lower and upper boundsfor a rough estimate of impacts at the state level.
Although our economic impact areas were entirestates, we could reasonably expect that a large por-tion of the direct and induced effects would occur closeto where the outfitters' businesses and nearby lodgingand restaurant establishments are located and alongtravel corridors to the rivers. The localized nature ofthe impacts has several consequences. Whitewaterrecreation can be a major force, good or bad, to ruralcommunities near the river. River recreation can pro-vide an environmentally friendly boost to an other-wise slow economic base, or be the centerpiece for thedevelopment of a more varied tourism-related sector.However, there are also down sides. In instances suchas the Nantahala River where the river corridor isalso the primary travel corridor, recreation use canlead to significant problems with traffic congestion,riverbank erosion, and crowding. In addition, automo-bile exhausts, runoff from roads and parking lots, andsewage treatment can have noticeable negative effectson the river ecosystem. These types of issues are par-ticularly important for river managers who wish touse river resources for rural development but mustbalance use with river and ecosystem protection.
ACKNOWLEDGMENTS
We extend our thanks to America Outdoors, its Executive Direc-tor David Brown, and Dr. H. K. Cordell for their assistance in com-pletion of this research. We gratefully acknowledge the helpfulcomments of three anonymous reviewers.
LITERATURE CITED
Alward, G. S. and E. M. Lofting, 1985. Opportunities for Analyzingthe Economic Impacts of Recreation and Tourism ExpendituresUsing IMPLAN. Contributed Paper, Annual Meeting of theRegional Science Association, Philadelphia, Pennsylvania.
Alward, G. S., H. G. Davis, K. A. Despotakis, and E. M. Lofting,1985. Regional Non-Survey Input-Output Analysis withIMPLAN. Contributed Paper, Annual Meetings of the SouthernRegional Science Association, Washington, D.C.
Armstead, L., 1989. Whitewater Rafting in Eastern North America(2nd Edition). Globe Pequot Press, Chester, Connecticut.
Bergstrom, J. C., H. K. Cordell, A. E. Watson, and G. A. Ashley,1990a. Economic Impacts of State Parks on State Economies inthe South. Southern Journal of Agricultural Economics 22:69-78.
Bergstrom, J. C., H. K. Cordell, G. A. Ashley, and A. E. Watson,1990b. Economic Impacts of Recreational Spending on RuralAreas: A Case Study. Economic Development Quarterly. 4:29-39.
Chappelle, D. E., 1985. Strategies for Developing Multipliers Use-ful in Assessing Economic Impacts of Recreation and Tourism.In: Assessing the Economic Impacts of Recreation and Tourism,D. B. Propst (Editor). Southeastern Forest Experiment Station,Asheville, North Carolina, pp. 1-5.
1327 WATER RESOURCES BULLETIN

English and Bowker
Cordell, H. K., J. C. Bergstrom, G. A. Ashley, and J. Karish, 1990.Economic Effects of River Recreation on Local Economies.Water Resources Bulletin 26:53-60.
Cordell, H. K., J. C. Bergstrom, and A. E. Watson, 1992. EcenomicGrowth and Interdependence Effects of State Parks Visitation inLocal and State Economies. Journal of Leisure Research 24:253-268.
Dawson, S. A., D. J. Blahna, and J. E. Keith, 1993. Expected andActual Regional Economic Impacts of Great Basin NationalPark. Journal of Park and Recreation Administration 11:45-49.
English, D. B. K., C. J. Betz, J. M. Young, J. C. Bergstrom, and H.K. Cordell, 1993. Regional Demand and Supply Projections forOutdoor Recreation. Gen. Tech. Rep. RM-230, USDA-Forest Ser-vice, Rocky Mountain Forest and Range Experiment Station,Fort Collins, Colorado.
English, D. B. K. and J. C. Bergstrom, 1994. The Conceptual LinksBetween Recreation Site Development and Regional EconomicImpacts. Journal of Regional Science 34:599-611.
English, D. B. K., J. M. Bowker, J. C. Bergstrom, and H. K. Cordell,1995. Estimating the Economic Impacts of Recreation Responseto Resource Management Alternatives. Gen. Tech. Rep. SE-91,USDA Forest Service, Southern Research Station, Asheville,North Carolina.
Gitelson, R. J. and A. Graefe, 1990. Economic Impacts Associatedwith Whitewater Boating on the Upper Youghigheny. Gen. TechRep. NE-145, USDA-Forest Service, Northeastern Forest Exper-iment Station, Radnor, Pennsylvania, pp. 65-69.
Gomez, I. A. and T. Ozuna, 1993. Testing for Overdispersion inTruncated Count Data Recreation Demand Functions. Journalof Environmental Management 37:117-125.
Hotvedt, J. E., R. L. Busby, and R. E Jacob, 1988. Use of IMPLANfor Regional Input-Output Studies. Presented Paper, AnnualMeetings of the Southern Forest Economic Association, BuenaVista, Florida.
Johnson, R. L. and E. Moore, 1993. Tourism Impact Estimation.Annals of Tourism Research 20:279-288.
Loomis, J. and M. King. 1994. Comparison of Mail and Telephone-Mail Contingent Valuation Surveys. Journal of EnvironmentalManagement 4 1:309-324.
Shaw, D. G., 1988. On-Site Samples' Regression: Problems of Non-Negative Integers, Truncation, and Endogenous Stratification.Journal of Econometrics 37:211-223.
Stevens, B. and A. Rose, 1985. Regional Input-Output Methods forTourism Impact Analysis. In: Assessing the Economic Impacts ofRecreation and Tourism, D. B. Propst (Editor). SoutheasternForest Experiment Station, Asheville, North Carolina, pp 16-22.
Stoll, J. R., J. C. Bergstrom, and L. L. Jones, 1988. RecreationalBoating and Its Economic Impact in Texas. Leisure Sciences10(1):51-67.
Stoll, J. R., J. Loomis, and J. Bergstrom, 1987. The Measurement ofEconomic Benefits and Beneficiaries of Outdoor Recreation.Policy Studies Review 7:443-452.
USDA Forest Service, 1995. Forest Service Program for Forest andRange Resources: Long Term Strategic Plan. Draft 1995 RPAProgram, U.S. Department of Agriculture, Forest Service, Wash-ington, D.C.
Walsh, R. G., D. M. Johnson, and J. R. McKean, 1992. BenefitTransfer of Outdoor Recreation Demand Studies, 1968-1988.Water Resources Research 28(3):707-7 13.
WATER RESOURCES BULLETIN 1328