economic impact of tourism in north dakota
TRANSCRIPT

ECONOMIC IMPACT OF TOURISM IN NORTH DAKOTA
2020
WWW.TOURISMECONOMICS.COM
Prepared for:North Dakota Department of Tourism

2
The trave l sector is an integra l part of the North Dakota economy. Vis itors genera te s ignificant economic benefits to households , bus inesses , and government a like and represent a critica l driver of North Dakota ’s future . How critica l? Tourism represents 3.3% of North Dakota ’s economy and supports 6.7% of a ll jobs in the s ta te .
By monitoring the vis itor economy, policymakers can inform decis ions regarding the funding and prioritiza tion of the sector’s deve lopment. They can a lso ca re fully monitor its successes and future needs . This is particula rly true for North Dakota as it builds upon its tourism economy. By es tablishing a base line of economic impacts , the indus try can track its progress over time .
To quantify the economic s ignificance of the tourism sector in North Dakota , Tourism Economics has prepared a comprehens ive model de ta iling the wide-reaching impacts a ris ing from vis itor spending. The results of this s tudy show the scope of the trave l sector in te rms of direct vis itor spending, as well as the tota l economic impacts , jobs , persona l income, and fisca l (tax) impacts in the broader economy.
INTRODUCTION
The ana lys is draws on the following da ta sources :
• Survey da ta , including spending and vis itor profile characte ris tics for vis itors to North Dakota
• Bureau of Economic Analys is and Bureau of Labor S ta tis tics : employment and wage da ta , by indus try
• STR: Lodging performance da ta , including room demand, room ra tes , occupancy, and room revenue
• US Census : bus iness sa les by indus try and seasona l second homes inventory
• North Dakota Department of Revenue – sa les tax da ta by indus try and other da ta points
• Bed tax revenues – loca l sources
• Nationa l and Sta te park a ttendance leve ls

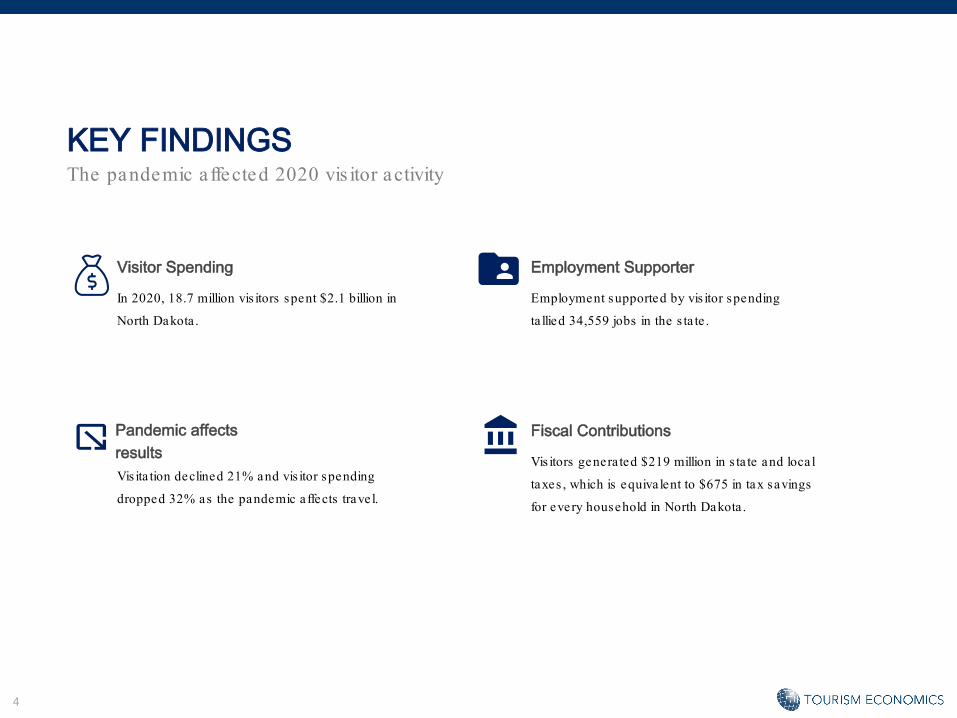
KEY FINDINGS
4
Visitor Spending
In 2020, 18.7 million vis itors spent $2.1 billion in
North Dakota .
Pandemic affects resultsVis ita tion declined 21% and vis itor spending
dropped 32% as the pandemic a ffects trave l.
Fiscal Contributions
Vis itors genera ted $219 million in s ta te and loca l
taxes , which is equiva lent to $675 in tax savings
for every household in North Dakota .
Employment Supporter
Employment supported by vis itor spending
ta llied 34,559 jobs in the s ta te .
KEY FINDINGSThe pandemic a ffected 2020 vis itor activity
VISITATION AND SPENDING
6
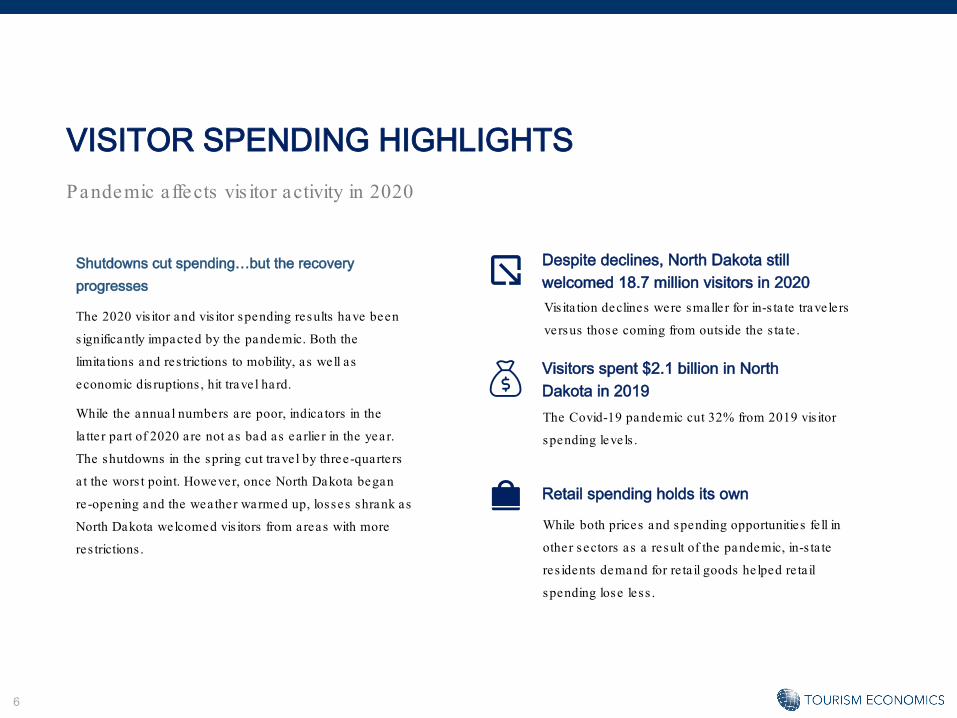
The 2020 vis itor and vis itor spending results have been
s ignificantly impacted by the pandemic. Both the
limita tions and res trictions to mobility, as well as
economic dis ruptions , hit trave l hard.
While the annual numbers a re poor, indica tors in the
la tte r part of 2020 a re not as bad as ea rlie r in the year.
The shutdowns in the spring cut trave l by three-quarters
a t the wors t point. However, once North Dakota began
re -opening and the wea ther warmed up, losses shrank as
North Dakota welcomed vis itors from areas with more
res trictions .
VISITOR SPENDING HIGHLIGHTSPandemic a ffects vis itor activity in 2020
Retail spending holds its own
Despite declines, North Dakota still welcomed 18.7 million visitors in 2020
Visitors spent $2.1 billion in North Dakota in 2019
While both prices and spending opportunities fe ll in
other sectors as a result of the pandemic, in-s ta te
res idents demand for re ta il goods he lped re ta il
spending lose less .
Vis ita tion declines were smalle r for in-s ta te trave le rs
versus those coming from outs ide the s ta te .
The Covid-19 pandemic cut 32% from 2019 vis itor
spending leve ls .
Shutdowns cut spending…but the recovery progresses
7
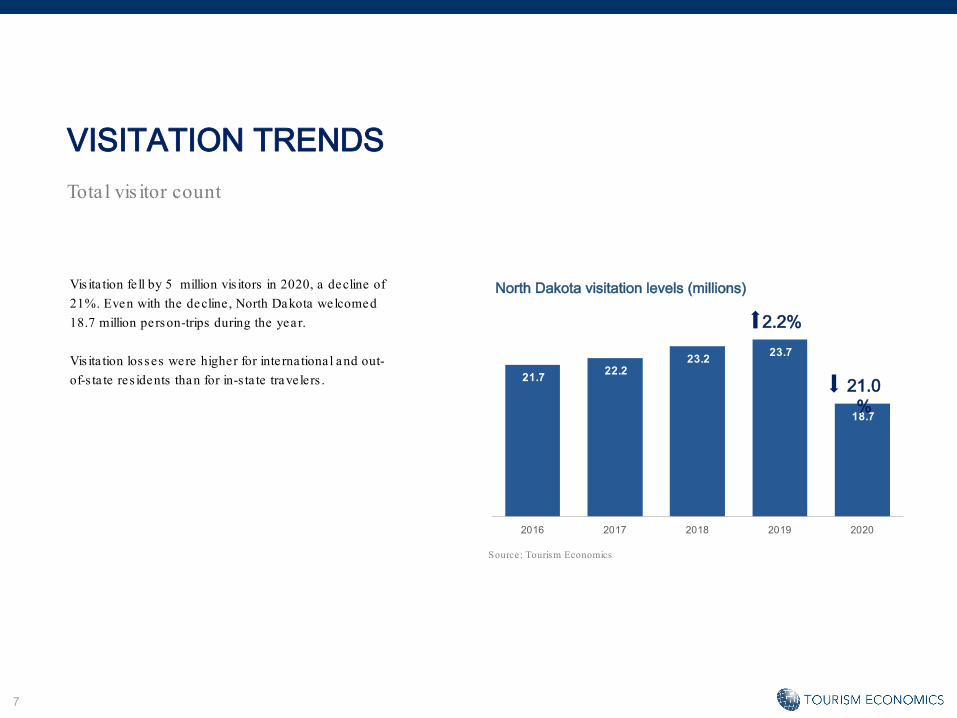
21.7 22.2 23.2 23.7
18.7
2016 2017 2018 2019 2020
2.2%
21.0%
Vis ita tion fe ll by 5 million vis itors in 2020, a decline of 21%. Even with the decline , North Dakota welcomed 18.7 million person-trips during the year.
Vis ita tion losses were higher for inte rnational and out-of-s ta te res idents than for in-s ta te trave lers .
VISITATION TRENDSTota l vis itor count
North Dakota visitation levels (millions)
Source : Tourism Economics
8
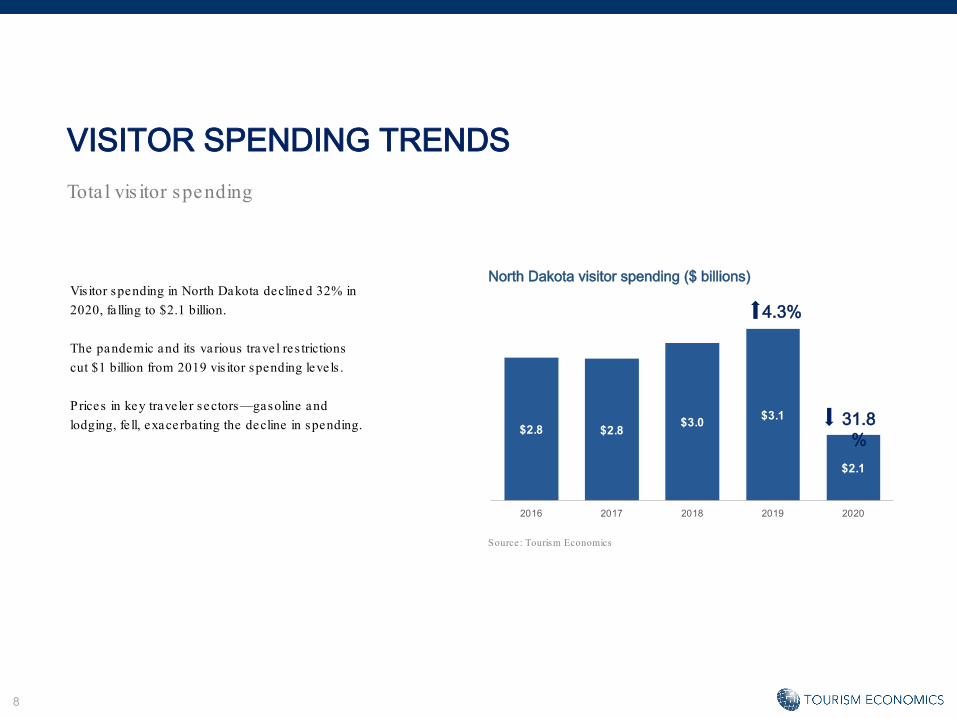
$2.8 $2.8 $3.0 $3.1
$2.1
2016 2017 2018 2019 2020
Vis itor spending in North Dakota declined 32% in 2020, fa lling to $2.1 billion.
The pandemic and its various trave l res trictions cut $1 billion from 2019 vis itor spending leve ls .
Prices in key trave ler sectors—gasoline and lodging, fe ll, exacerbating the decline in spending.
VISITOR SPENDING TRENDSTota l vis itor spending
North Dakota visitor spending ($ billions)
31.8%
4.3%
Source : Tourism Economics

9
Sales tax da ta he lps show like ly vis itor activity by examining sectors key to the vis itor.
Sa les tax collections fe ll s ignificantly in a ll the le isure and hospita lity sectors in the spring as much of the country shut down. As North Dakota reopened and the summer trave l season began, the re were smalle r losses in res taurants . As trave l shifted to more le isure and outdoor activities in 2020, lodging sa les remain depressed.
Examining sectors within the re ta il indus try he lp show changes in spending pa tterns . Re ta il is a key spending sector for in-s ta te trave le rs , a s the s ize of North Dakota means many rura l res idents trave l to find re ta il opportunities . As a portion of those sa les will be in genera l merchandise s tores like Wal-Marts and Targets , the da ta is showing tha t type of spending continued throughout the year. But more discre tionary trave l lagged, evidenced by the s low recovery in appare l s tores .
INDICATORSSales tax collections
North Dakota sales tax collections – leisure & hospitalityY-o-y growth, by quarte r, 2020
Source : Tourism Economics , North Dakota Department of Revenue
-70.0%
-60.0%
-50.0%
-40.0%
-30.0%
-20.0%
-10.0%
0.0%Q1 Q2 Q3
Accommodat ions
Restaurants
Recreat ion
-45.0%
-40.0%
-35.0%
-30.0%
-25.0%
-20.0%
-15.0%
-10.0%
-5.0%
0.0%
5.0%
10.0%Q1 Q2 Q3
General Merch
Apparel
Misc. Retail
North Dakota sales tax collections - retailY-o-y growth, by quarte r, 2020
Source : Tourism Economics , North Dakota Department of Revenue
10
SPENDING DETAILSSpending by ca tegory, 2020
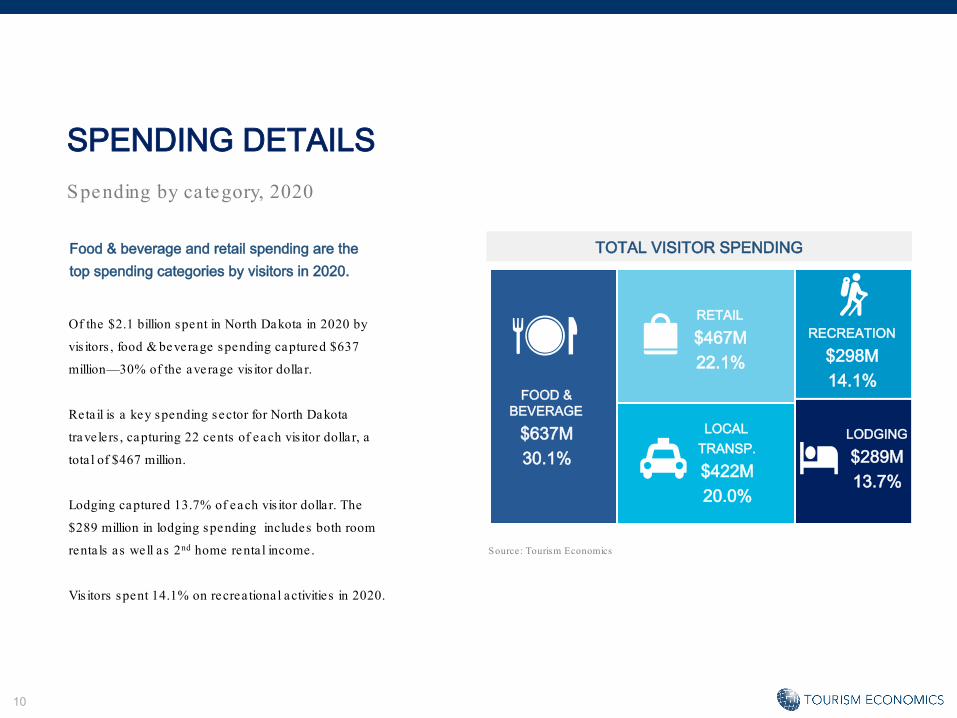
TOTAL VISITOR SPENDINGFood & beverage and retail spending are the top spending categories by visitors in 2020.
Of the $2.1 billion spent in North Dakota in 2020 by
vis itors , food & beverage spending captured $637
million—30% of the average vis itor dolla r.
Re ta il is a key spending sector for North Dakota
trave le rs , capturing 22 cents of each vis itor dolla r, a
tota l of $467 million.
Lodging captured 13.7% of each vis itor dolla r. The
$289 million in lodging spending includes both room
renta ls as well as 2nd home renta l income.
Vis itors spent 14.1% on recrea tional activities in 2020.
FOOD &BEVERAGE
$637M30.1%
LODGING
$289M13.7%
RECREATION
$298M14.1%
RETAIL
$467M22.1%
LOCAL TRANSP.
$422M20.0%
Source : Tourism Economics
11
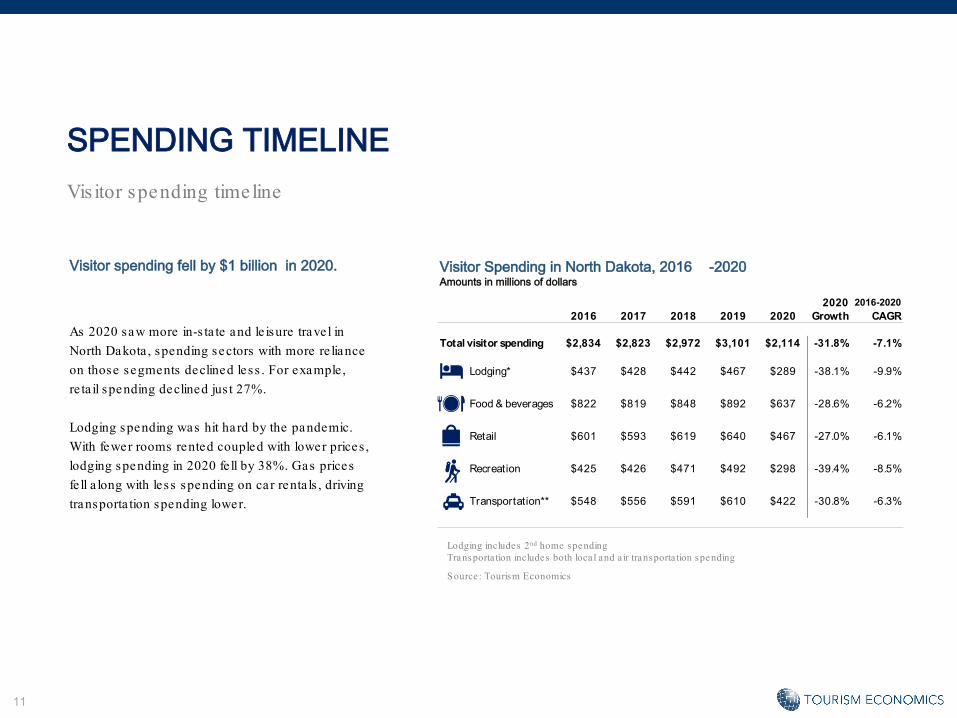
2020 2016-20202016 2017 2018 2019 2020 Growth CAGR
Total visitor spending $2,834 $2,823 $2,972 $3,101 $2,114 -31.8% -7.1%
Lodging* $437 $428 $442 $467 $289 -38.1% -9.9%
Food & beverages $822 $819 $848 $892 $637 -28.6% -6.2%
Retail $601 $593 $619 $640 $467 -27.0% -6.1%
Recreation $425 $426 $471 $492 $298 -39.4% -8.5%
Transportation** $548 $556 $591 $610 $422 -30.8% -6.3%
As 2020 saw more in-s ta te and le isure trave l in North Dakota , spending sectors with more re liance on those segments declined less . For example , re ta il spending declined jus t 27%.
Lodging spending was hit ha rd by the pandemic. With fewer rooms rented coupled with lower prices , lodging spending in 2020 fe ll by 38%. Gas prices fe ll a long with less spending on car renta ls , driving transporta tion spending lower.
SPENDING TIMELINEVis itor spending timeline
Visitor Spending in North Dakota, 2016 -2020Amounts in millions of dollars
Visitor spending fell by $1 billion in 2020.
Lodging includes 2nd home spendingTransporta tion includes both loca l and a ir transporta tion spending
Source : Tourism Economics
12
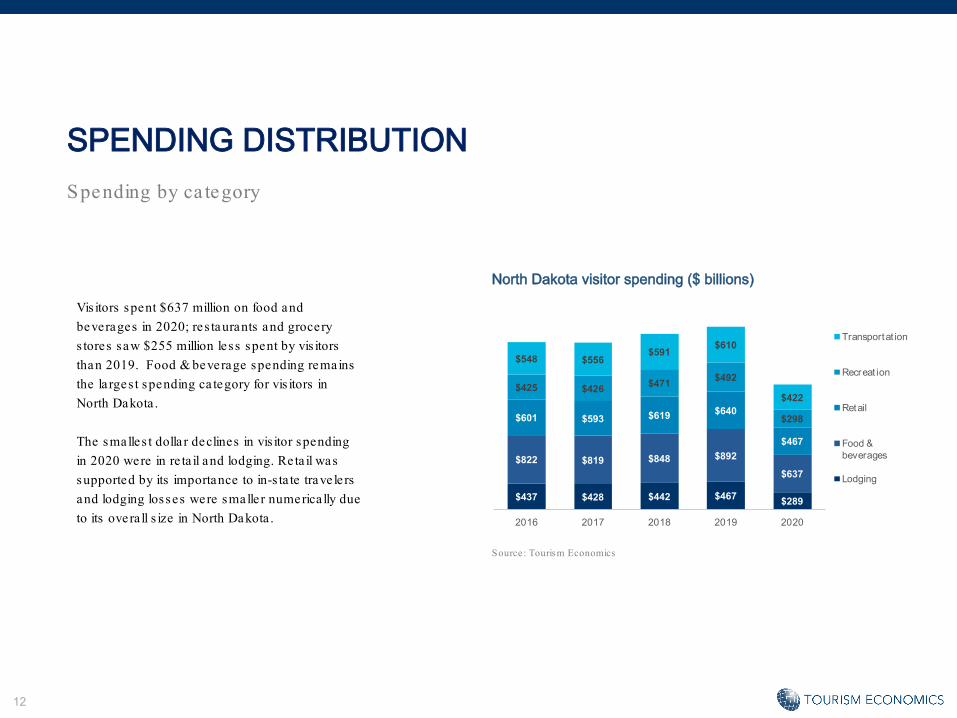
Vis itors spent $637 million on food and beverages in 2020; res taurants and grocery s tores saw $255 million less spent by vis itors than 2019. Food & beverage spending remains the la rges t spending ca tegory for vis itors in North Dakota .
The smalles t dolla r declines in vis itor spending in 2020 were in re ta il and lodging. Re ta il was supported by its importance to in-s ta te trave le rs and lodging losses were smalle r numerica lly due to its overa ll s ize in North Dakota .
SPENDING DISTRIBUTIONSpending by ca tegory
North Dakota visitor spending ($ billions)
Source : Tourism Economics
$437 $428 $442 $467 $289
$822 $819 $848 $892
$637
$601 $593 $619 $640
$467
$425 $426 $471 $492
$298
$548 $556$591 $610
$422
2016 2017 2018 2019 2020
Transportat ion
Recreat ion
Retail
Food &beverages
Lodging
13
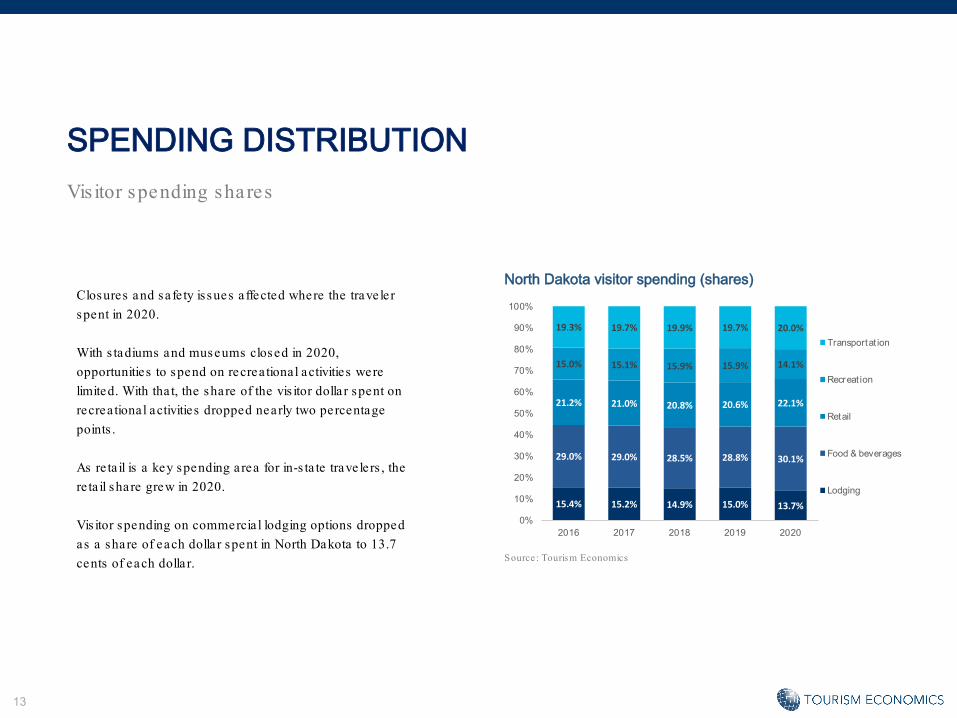
Closures and sa fe ty is sues a ffected where the trave le r spent in 2020.
With s tadiums and museums closed in 2020, opportunities to spend on recrea tional activities were limited. With tha t, the share of the vis itor dolla r spent on recrea tional activities dropped nearly two percentage points .
As re ta il is a key spending a rea for in-s ta te trave le rs , the re ta il share grew in 2020.
Vis itor spending on commercia l lodging options dropped as a share of each dolla r spent in North Dakota to 13.7 cents of each dolla r.
SPENDING DISTRIBUTIONVis itor spending shares
North Dakota visitor spending (shares)
Source : Tourism Economics
15.4% 15.2% 14.9% 15.0% 13.7%
29.0% 29.0% 28.5% 28.8% 30.1%
21.2% 21.0% 20.8% 20.6% 22.1%
15.0% 15.1% 15.9% 15.9% 14.1%
19.3% 19.7% 19.9% 19.7% 20.0%
0%
10%
20%
30%
40%
50%
60%
70%
80%
90%
100%
2016 2017 2018 2019 2020
Transportat ion
Recreat ion
Retail
Food & beverages
Lodging

14
Despite the decline in vis ita tion and vis itor spending, per-trave le r spending had a much smalle r decline . Per-trip spending fe ll to $134 from $114 in 2019.
VISITATION AND SPENDINGDay/overnight splits
Trips and spending, 2016 -2020Amounts in nominal dollars and number of visitors
Each traveler spends $114, on average, on their trip to North Dakota.
Source : Tourism Economics
2016 2017 2018 2019 2020
Total visitors (millions) 21.7 22.2 23.2 23.7 18.7
Total traveler spending ($ millions) $2,834 $2,823 $2,972 $3,101 $2,114
Per traveler spending $130 $127 $128 $131 $113

15
Spending share by market, 2020Expressed as a percentage of total expenditure per market
North Dakota spending by marketAmounts in millions of nominal dollars and percent of total
Leisure
Day
Domestic
Business
Overnight
International
SPENDINGVis itor spending by marke t
Source : Tourism Economics
Source : Tourism Economics
0%
25%
50%
75%
100%
Day/Overnight Market
Spending % of total
Stay $2,114
Day $1,097 52%Overnight $1,017 48%
Market $2,114
Domestic $2,074 98%International $40 2%

TOURISM ECONOMY

17
Spending on machinery & equipment s till regis tered $88 million in 2020 despite the pandemic cutting sa les .
As many new cons truction projects a re planned months and years in advance , new cons truction showed minimal declines in 2020, fa lling 2%.
The continued inves tment in new tourism facilitie s and moderniza tion of current vis itor-focused bus inesses will support growth in the indus try as it recovers from the pandemic.
TOURISM SATELLITE ACCOUNTInves tment
Tourism capital investment, 2016 -2020Amounts in millions of dollars
$179 million was spent on construction costs in support of the tourism industry in North Dakota.
Source : Dodge Construction; Tourism Economics
2020 2016-20202016 2017 2018 2019 2020 Growth CAGR
Construction $160 $58 $89 $93 $91 -1.9% -13.2%Machinery & Equipment $159 $150 $152 $127 $88 -30.7% -13.8%
Total $320 $209 $241 $219 $179 -18.5% -13.5%

18
TOURISM SATELLITE ACCOUNTCategory contributions , 2020
TOURISM SATELLITE ACCOUNTThe direct contributions of tourism consumption to the North Dakota economy reached $2.3 billion in 2020The direct contribution of tourism includes vis itor spending,
inves tment in tourism facilitie s , governmenta l spending in
support of vis itors , and other tourism consumption.
Domes tic vis itors provided the majority of tourism economy
spending a t $2.1 billion, 90% of the tota l.
Inves tment spending contributed 7.7% with personal
consumption spending in support of tourism adding $11 million.
Governmenta l support of tourism contributed $4 million or 0.2%
of the tota l.
With mos t borders closed for much of 2020, inte rnational
vis itors and the ir $40 million in spending accounted for 1.7% of
the tota l. In 2019, inte rnational vis itors accounted for 5.8% of
spending.
Source : Tourism Economics
DOMESTIC VISITOR
$2.1B90%
INTL. VISITOR
INVESTMENT$179M7.7%
GOVERNMENT
PCE

19
Non-vis itor priva te consumption expenditures (PCE) represent tourism consumer durables such as an RV, boat, or furniture for a vaca tion home.
Government support for tourism includes the budgets for des tina tion marke ting and other budget items in broad support of tourism.
Capita l inves tment (CAPEX) includes cons truction of hote ls and a ttractions , as well as tourism equipment and infras tructure .
TOURISM SATELLITE ACCOUNTTourism economy in North Dakota
Tourism economy spending, 2016 -2020Amounts in millions of dollars
Source : Tourism Economics
2020 2016-20202016 2017 2018 2019 2020 Growth CAGR
Domestic Visitor $2,591 $2,594 $2,746 $2,905 $2,074 -28.6% -5.4%International Visitor $243 $229 $226 $196 $40 -79.6% -36.3%
Non-Visitor PCE $28 $31 $33 $33 $11 -67.5% -21.8%Gov't Support $7 $5 $5 $6 $4 -38.3% -15.4%
Investment $320 $209 $241 $219 $179 -18.5% -13.5%Total $3,189 $3,067 $3,252 $3,359 $2,307 -31.3% -7.8%

DIRECT IMPACTS
21
Core tourismAmounts in number of jobs and millions of nomina l dolla rs
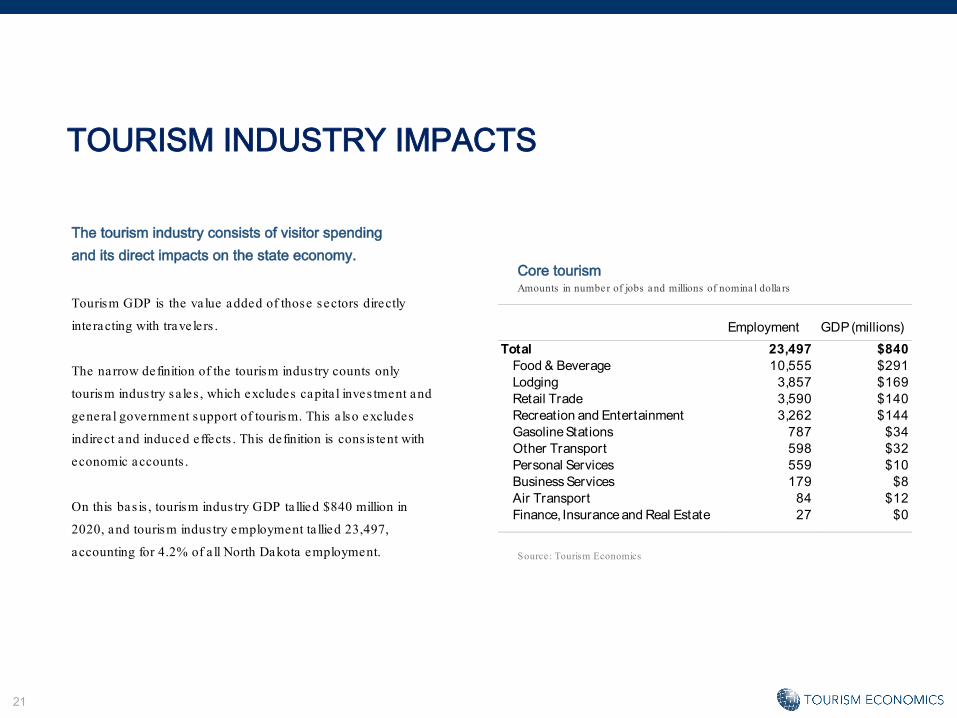
Tourism GDP is the va lue added of those sectors directly
inte racting with trave le rs .
The narrow definition of the tourism indus try counts only
tourism indus try sa les , which excludes capita l inves tment and
genera l government support of tourism. This a lso excludes
indirect and induced e ffects . This definition is cons is tent with
economic accounts .
On this bas is , tourism indus try GDP ta llied $840 million in
2020, and tourism indus try employment ta llied 23,497,
accounting for 4.2% of a ll North Dakota employment.
The tourism industry consists of visitor spending and its direct impacts on the state economy.
TOURISM INDUSTRY IMPACTS
Source : Tourism Economics
Employment GDP (millions)Total 23,497 $840
Food & Beverage 10,555 $291Lodging 3,857 $169Retail Trade 3,590 $140Recreation and Entertainment 3,262 $144Gasoline Stations 787 $34Other Transport 598 $32Personal Services 559 $10Business Services 179 $8Air Transport 84 $12Finance, Insurance and Real Estate 27 $0
22
71.0%
49.4%
40.2%
6.8% 4.2%
Lodging Recreat ion Food services Retail All indust ries
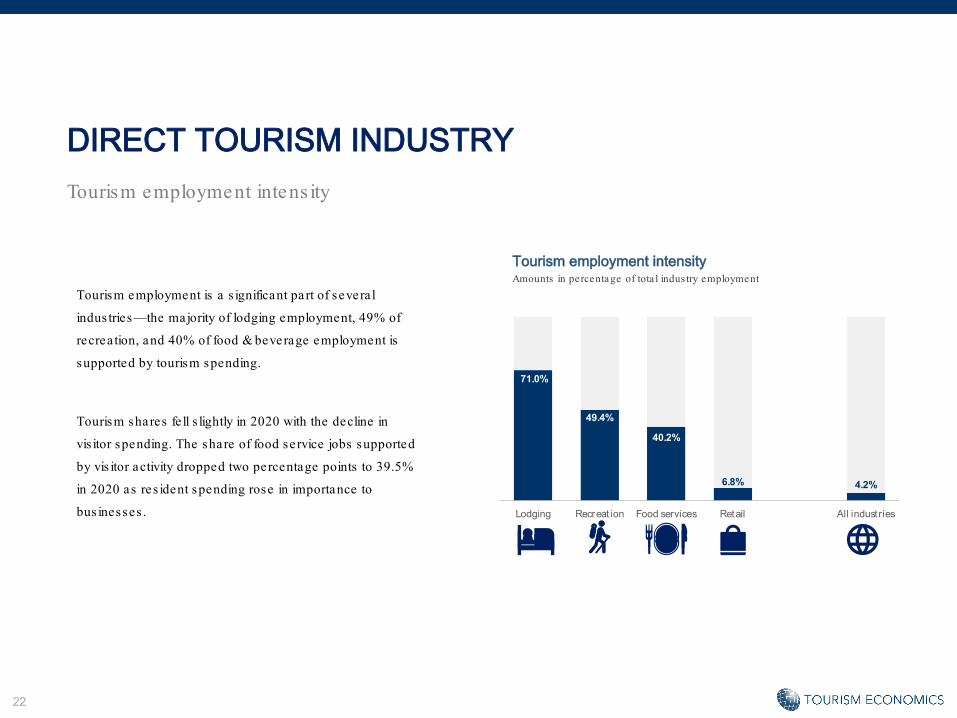
Tourism employment intensityAmounts in percentage of tota l indus try employment
Tourism employment is a s ignificant part of severa l
indus tries—the majority of lodging employment, 49% of
recrea tion, and 40% of food & beverage employment is
supported by tourism spending.
Tourism shares fe ll s lightly in 2020 with the decline in
vis itor spending. The share of food se rvice jobs supported
by vis itor activity dropped two percentage points to 39.5%
in 2020 as res ident spending rose in importance to
bus inesses .
Tourism employment intens ity
DIRECT TOURISM INDUSTRY
23
30,064 29,951 29,693 29,898
23,497
2016 2017 2018 2019 2020
DIRECT INDUSTRY EMPLOYMENT
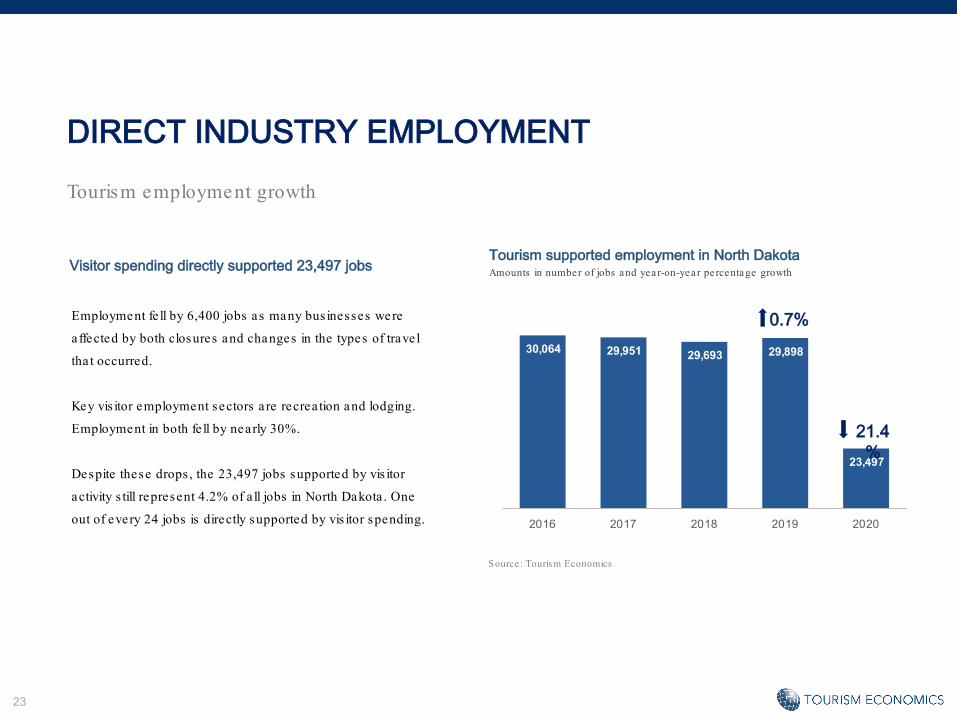
Tourism employment growth
Visitor spending directly supported 23,497 jobs
Employment fe ll by 6,400 jobs as many bus inesses were
a ffected by both closures and changes in the types of trave l
tha t occurred.
Key vis itor employment sectors a re recrea tion and lodging.
Employment in both fe ll by nearly 30%.
Despite these drops , the 23,497 jobs supported by vis itor
activity s till represent 4.2% of a ll jobs in North Dakota . One
out of every 24 jobs is directly supported by vis itor spending.
Tourism supported employment in North DakotaAmounts in number of jobs and year-on-year percentage growth
0.7%
21.4%
Source : Tourism Economics

24
MONTHLY EMPLOYMENT TRENDSTourism employment
Jobs losses from the pandemic reached 10% of a ll jobs in
North Dakota in the spring and have leve led off a t a round
6.5% declines in the la tte r part of 2020. Le isure and
hospita lity job losses were down 50% a t the ir nadir, recovered
to within 14% of 2019 leve ls in the la te summer and early fa ll,
but fe ll back a t the end of the year, regis tering -20% by the
end of the year.
To comple te the s ta te ’s recovery from the pandemic job
losses , tourism will need to recover. In the la tte r part of 2020,
27% of a ll North Dakota job losses were in the le isure and
hospita lity sector—losses of a round 8,000 North Dakota jobs .
Employment in North Dakota, by major industryY-o-y growth, by month in 2020
Leisure & hospitality jobs have seen the largest declines
LHS – Le isure and hospita litySource : Tourism Economics , BLS
-60.0%
-50.0%
-40.0%
-30.0%
-20.0%
-10.0%
0.0%
10.0%
Q1 Q2 Q3 Apr May Jun Jul Aug Sep Oct Nov Dec
Total jobs
Retail jobs
LHS jobs

25
DIRECT INDUSTRY EMPLOYMENTTourism employment
Vis itor activity directly supported 23,500 jobs in North Dakota
in 2020. Comparing this with the direct employment in other
indus try sectors , tourism would rank as the 10th la rges t
indus try.
In 2019, tourism ranked 5th.
Employment in North Dakota, by major industryAmounts in number of jobs
In 2020, tourism was the 10th largest employer in North Dakota
Source : Tourism Economics , BEA
69,100 54,880
36,420 31,660
28,390 26,740
25,480 24,870 24,800
23,500 23,250
22,200 16,470
7,310 6,600
Health care & social assistRetail trade
ConstructionAccomm. & food services
Finance and insuranceManufacturingOther services
Wholesale t radeReal estate & rental/ leasing
TourismProf. & technical services
Trans. & warehousingAdmin. and waste services
Educat ional servicesArts and recreat ion
ECONOMIC IMPACTS

27
Our analys is of tourism's impact on North
Dakota begins with actua l spending by
vis itors , but a lso cons iders the downstream
effects of this injection of spending into the
loca l economy. To de termine the tota l
economic impact of tourism in North Dakota ,
we input vis itor spending into a model of the
North Dakota economy crea ted in IMPLAN.
This move ca lcula tes three dis tinct types of
impact: direct, indirect, and induced.
The impacts on bus iness sa les , jobs , wages ,
and taxes a re ca lcula ted for a ll three leve ls of
impact.
How vis itor spending genera tes employment and income
1. Direct Impacts : Vis itors crea te direct
economic va lue within a discree t group of
sectors (e .g. recrea tion, transporta tion).
This supports a re la tive proportion of
jobs , wages , taxes , and GDP within each
sector.
2. Indirect Impacts: Each directly a ffected
sector a lso purchases goods and
se rvices as inputs (e .g. food wholesa lers ,
utilitie s ) into production. These impacts
a re ca lled indirect impacts .
3. Induced Impacts : Las tly, the induced
impact is genera ted when employees
whose wages a re genera ted wither
directly or indirectly by vis itors , spend
those wages in the loca l economy.
ECONOMIC IMPACTS

28
IMPLAN ca lcula tes these three leve ls of impact –
direct, indirect, and induced – for a broad se t of
indica tors . These include the following:
• Spending
• Wages
• Employment
• Federa l Taxes
• Sta te Taxes
• Local Taxes
Economic impact flowchart
ECONOMIC IMPACTSHow vis itor spending genera tes employment and income
Accommodation
Food & beverage
Reta il
Ente rta inment/rec
Loca l transporta tion
Air transporta tion
Goods & services purchases
Householdpurchases
VISITORSPENDING
INDIRECT EFFECTS
INDUCED EFFECTS
TOTAL IMPACTS
Production
Jobs
Wages
Taxes
Supply-s ide
e ffects
Household tax impacts
29
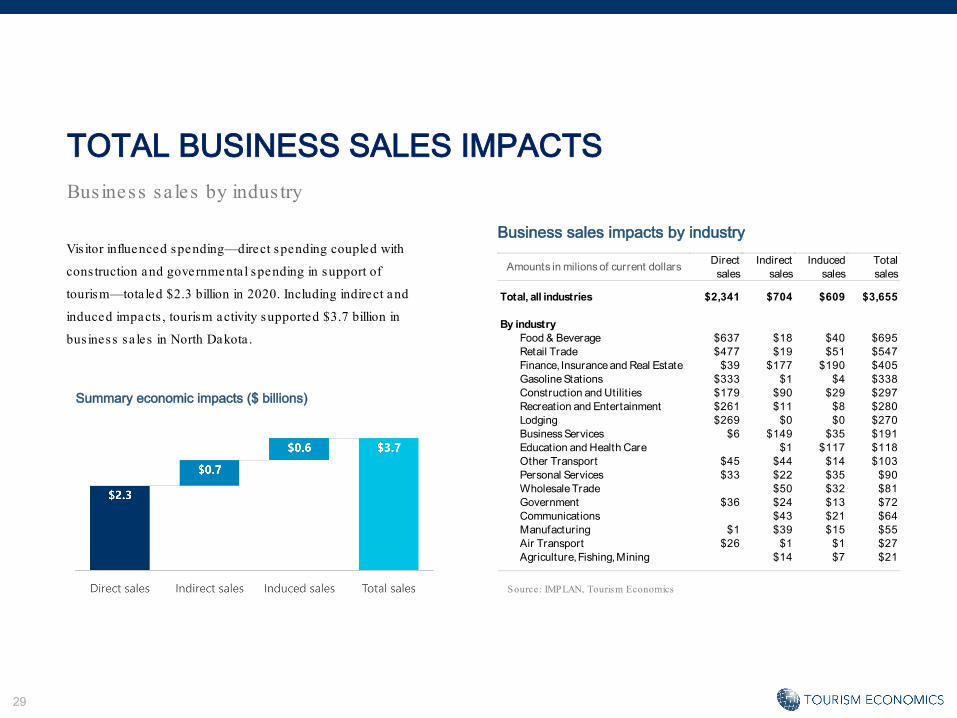
TOTAL BUSINESS SALES IMPACTSBusiness sa les by indus try
Vis itor influenced spending—direct spending coupled with
cons truction and governmenta l spending in support of
tourism—tota led $2.3 billion in 2020. Including indirect and
induced impacts , tourism activity supported $3.7 billion in
bus iness sa les in North Dakota .
Summary economic impacts ($ billions)
Business sales impacts by industry
Source : IMPLAN, Tourism Economics
Direct Indirect Induced Totalsales sales sales sales
Total, all industries $2,341 $704 $609 $3,655
By industryFood & Beverage $637 $18 $40 $695Retail Trade $477 $19 $51 $547Finance, Insurance and Real Estate $39 $177 $190 $405Gasoline Stations $333 $1 $4 $338Construction and Utilities $179 $90 $29 $297Recreation and Entertainment $261 $11 $8 $280Lodging $269 $0 $0 $270Business Services $6 $149 $35 $191Education and Health Care $1 $117 $118Other Transport $45 $44 $14 $103Personal Services $33 $22 $35 $90Wholesale Trade $50 $32 $81Government $36 $24 $13 $72Communications $43 $21 $64Manufacturing $1 $39 $15 $55Air Transport $26 $1 $1 $27Agriculture, Fishing, Mining $14 $7 $21
Amounts in milions of current dollars

30
$0 $200 $400 $600 $800
Agr iculture, Fishing, MiningAir Transpor t
ManufacturingCommunicat ions
GovernmentWholesale Trade
Personal ServicesOther Transport
Educat ion and Health CareBusiness Services
LodgingRecreat ion and Enter tainment
Const ruction and Ut ilitiesGasoline Stations
Finance, Insurance and Real EstateRetail Trade
Food & Beverage
Direct Indirect Induced
TOTAL BUSINESS SALES IMPACTSBusiness sa les by indus try
Business sales impacts by industryThe indirect and induced e ffects add a tota l of $1.3 billion in
sa les to bus inesses loca ted in North Dakota . This includes
$370 million in sa les supported by vis itor activity but not by
vis itors to finance , insurance and rea l es ta te bus inesses .
Non-gas re ta il trade bus iness sa les directly from vis itors
provided $477 million in sa les . Adding in the $70 million in
re ta il sa les from indirect and induced e ffects , and re ta il
bus inesses rece ived $550 million in sa les resulting from
vis itor activity in North Dakota .
S ignificant benefits a lso accrue in sectors like bus iness
se rvices , education & health ca re , manufacturing, and
communications from se lling to tourism bus inesses and
employees .
$ millionsSource : IMPLAN, Tourism Economics

31
TOTAL VALUE-ADDED IMPACTSGDP
Summary GDP impacts ($ billions)
GDP impacts by industry
Tourism genera ted $1.7 billion in loca l GDP in
2020, or 3.2% of the North Dakota economy. This
excludes a ll import leakages to a rrive a t the
economic va lue genera ted by trave le r activity in the
s ta te .
Source : IMPLAN, Tourism Economics
Direct Indirect Induced Totalvalue value value value
Total, all industries $964 $375 $339 $1,679
By industryFood & Beverage $291 $6 $19 $316Finance, Ins. & Real Estate $97 $114 $212Retail Trade $140 $14 $31 $184Construction and Utilities $129 $34 $11 $173Lodging $169 $0 $0 $169Recreation & Entertainment $144 $4 $3 $151Business Services $8 $92 $20 $121Education and Health Care $1 $75 $75Other Transport $32 $23 $8 $62Wholesale Trade $34 $19 $53Personal Services $10 $17 $19 $46Gasoline Stations $34 $1 $2 $37Communications $19 $11 $30Manufacturing $4 $13 $3 $21Agriculture, Fishing, Mining $11 $4 $15Air Transport $12 $0 $0 $13Government -$8 $9 -$1 $0
Amounts in milions of current dollars

32
$0 $50 $100 $150 $200 $250 $300 $350
GovernmentAir Transpor t
Agr iculture, Fishing, MiningManufacturing
Communicat ionsGasoline StationsPersonal ServicesWholesale TradeOther Transport
Educat ion and Health CareBusiness Services
Recreat ion & EntertainmentLodging
Construction and Ut ilitiesRetail Trade
Finance, Ins. & Real EstateFood & Beverage
Direct Indirect Induced
TOTAL VALUE-ADDED IMPACTSGDP
In North Dakota , res taurant spending by vis itors
crea tes the mos t loca l va lue with the finance ,
insurance & rea l es ta te indus try close ly following.
The re ta il trade indus try follows as an indus try
providing va lue to North Dakota’s economy from
vis itor activity. Ranking 4th is the cons truction
indus try, jus t ahead of the lodging indus try.
GDP impacts by industry
$ millionsSource : IMPLAN, Tourism Economics

33
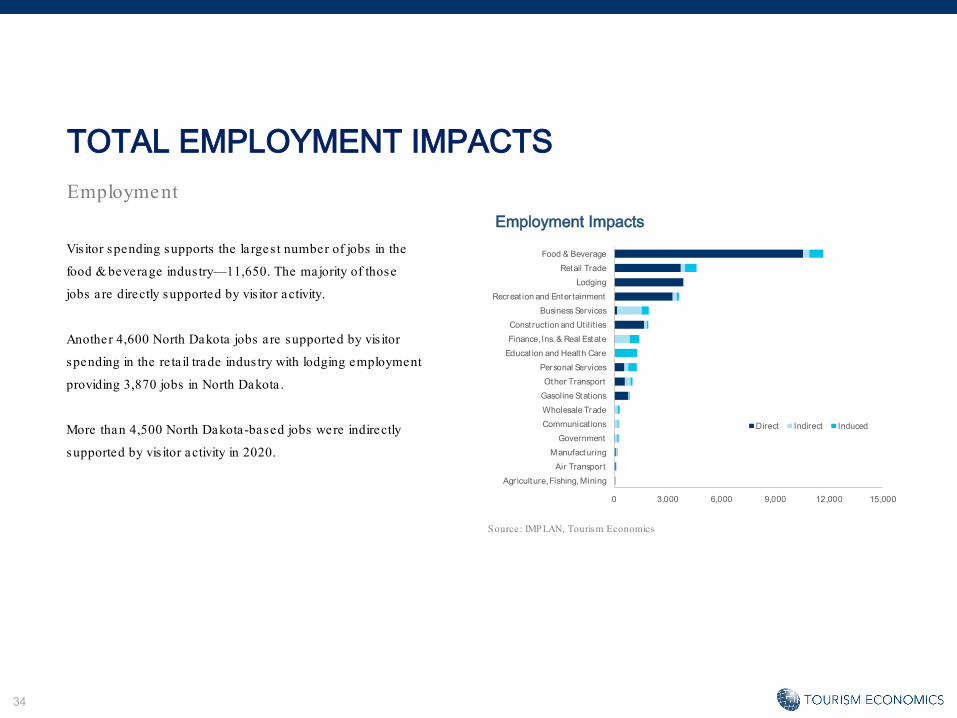
TOTAL EMPLOYMENT IMPACTSEmployment
Tourism supported a tota l of 34,559 jobs when indirect and
induced impacts a re cons idered. This represents 6.2% of a ll
jobs in the s ta te—or one out of every 16 jobs in North
Dakota .
Employment Impacts
Summary employment impacts (number of jobs)
Source : IMPLAN, Tourism Economics
Direct Indirect Induced Totaljobs jobs jobs jobs
Total, all industries 25,390 4,550 4,619 34,559
By industryFood & Beverage 10,555 349 753 11,657 Retail Trade 3,709 262 637 4,608 Lodging 3,857 7 3 3,868 Recreation and Entertainment 3,262 239 102 3,603 Business Services 179 1,367 378 1,923 Construction and Utilities 1,657 179 73 1,909 Finance, Ins. & Real Estate 27 842 530 1,398 Education and Health Care 35 1,244 1,279 Personal Services 559 231 466 1,256 Other Transport 598 326 106 1,031 Gasoline Stations 787 30 43 860 Wholesale Trade 188 115 303 Communications 187 61 247 Government 27 150 65 241 Manufacturing 89 93 19 201 Air Transport 84 2 2 88 Agriculture, Fishing, Mining 62 23 85
Amounts in total employment
34
0 3,000 6,000 9,000 12,000 15,000
Agr iculture, Fishing, MiningAir Transpor t
ManufacturingGovernment
Communicat ionsWholesale TradeGasoline StationsOther Transport
Personal ServicesEducat ion and Health CareFinance, Ins. & Real EstateConst ruction and Ut ilities
Business ServicesRecreat ion and Enter tainment
LodgingRetail Trade
Food & Beverage
Direct Indirect Induced
TOTAL EMPLOYMENT IMPACTSEmployment
Vis itor spending supports the la rges t number of jobs in the
food & beverage indus try—11,650. The majority of those
jobs a re directly supported by vis itor activity.
Another 4,600 North Dakota jobs a re supported by vis itor
spending in the re ta il trade indus try with lodging employment
providing 3,870 jobs in North Dakota .
More than 4,500 North Dakota-based jobs were indirectly
supported by vis itor activity in 2020.
Employment Impacts
Source : IMPLAN, Tourism Economics
35
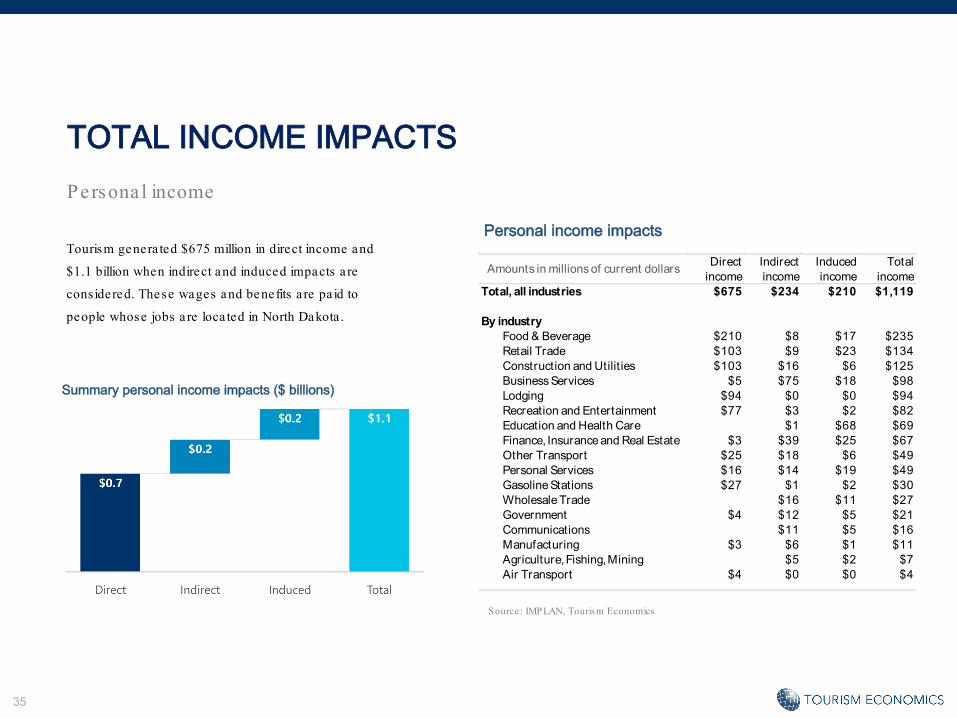
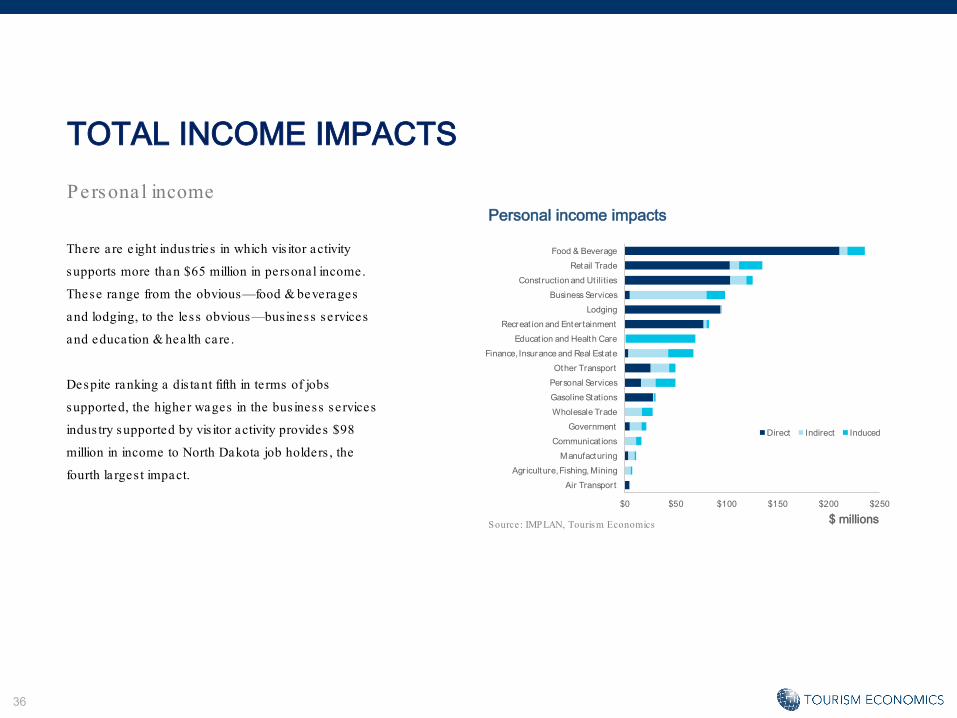
TOTAL INCOME IMPACTSPersona l income
Tourism genera ted $675 million in direct income and
$1.1 billion when indirect and induced impacts a re
cons idered. These wages and benefits a re pa id to
people whose jobs a re loca ted in North Dakota .
Personal income impacts
Summary personal income impacts ($ billions)
Source : IMPLAN, Tourism Economics
Direct Indirect Induced Totalincome income income income
Total, all industries $675 $234 $210 $1,119
By industryFood & Beverage $210 $8 $17 $235Retail Trade $103 $9 $23 $134Construction and Utilities $103 $16 $6 $125Business Services $5 $75 $18 $98Lodging $94 $0 $0 $94Recreation and Entertainment $77 $3 $2 $82Education and Health Care $1 $68 $69Finance, Insurance and Real Estate $3 $39 $25 $67Other Transport $25 $18 $6 $49Personal Services $16 $14 $19 $49Gasoline Stations $27 $1 $2 $30Wholesale Trade $16 $11 $27Government $4 $12 $5 $21Communications $11 $5 $16Manufacturing $3 $6 $1 $11Agriculture, Fishing, Mining $5 $2 $7Air Transport $4 $0 $0 $4
Amounts in millions of current dollars
36
$0 $50 $100 $150 $200 $250
Air Transpor tAgr iculture, Fishing, Mining
ManufacturingCommunicat ions
GovernmentWholesale TradeGasoline StationsPersonal ServicesOther Transport
Finance, Insurance and Real EstateEducat ion and Health Care
Recreat ion and Enter tainmentLodging
Business ServicesConst ruction and Ut ilities
Retail TradeFood & Beverage
Direct Indirect Induced
TOTAL INCOME IMPACTSPersona l income
There a re e ight indus tries in which vis itor activity
supports more than $65 million in personal income.
These range from the obvious—food & beverages
and lodging, to the less obvious—business se rvices
and education & health ca re .
Despite ranking a dis tant fifth in te rms of jobs
supported, the higher wages in the bus iness se rvices
indus try supported by vis itor activity provides $98
million in income to North Dakota job holders , the
fourth la rges t impact.
Personal income impacts
$ millionsSource : IMPLAN, Tourism Economics

37
TOTAL TAX IMPACTSFisca l (tax)
Visitor spending, visitor supported jobs, and business sales generated $446 million in governmental revenues.
Sta te and loca l taxes a lone ta llied $219 million in 2020.
Each household in North Dakota would need to be taxed an
additional $675 per year to replace the trave le r taxes
rece ived by s ta te and loca l governments .
Tax impacts
Source : IMPLAN, Tourism Economics
Amounts in millions of current dollars2018 2020
Total $600.0 $446.4
Federal $299.5 $227.6 Personal Income $86.5 $73.1 Corporate $38.3 $20.1 Indirect business $17.0 $10.2 Social insurance $157.6 $124.1
State and Local $300.5 $218.9 Sales $146.8 $105.7 Bed Tax $10.1 $6.2 Personal Income $8.9 $7.6 Corporate $5.3 $2.9 Social insurance $10.1 $8.5 Excise and Fees $85.3 $61.2 Property $33.9 $26.7
38
TOTAL TAX IMPACTSFisca l (tax)
Visitor spending, visitor supported jobs, and business sales generated significant revenues for state and local governments alike.
Vis itor activity supported $159 million in s ta te tax revenues in
2020. Local governments rece ived $60 million in revenue from
economic activity associa ted with vis itors .
For the s ta te , sa les tax rece ipts provide a la rge share of
governmenta l revenues . For loca l governments , property taxes
a long with fees , bed, and sa les taxes provide the majority of
governmenta l revenues .
State & local tax impacts
Source : IMPLAN, Tourism Economics
Amounts in millions of nominal dollars
State LocalTax Revenues $158.9 $60.0 Sales $89.0 $16.7 Bed tax $0.0 $6.2 Personal income $7.6 $0.0 Corporate $2.9 $0.0 Social insurance $8.5 $0.0 Excise and fees $50.9 $10.3 Property $0.0 $26.7

ECONOMIC IMPACT IN CONTEXT
40
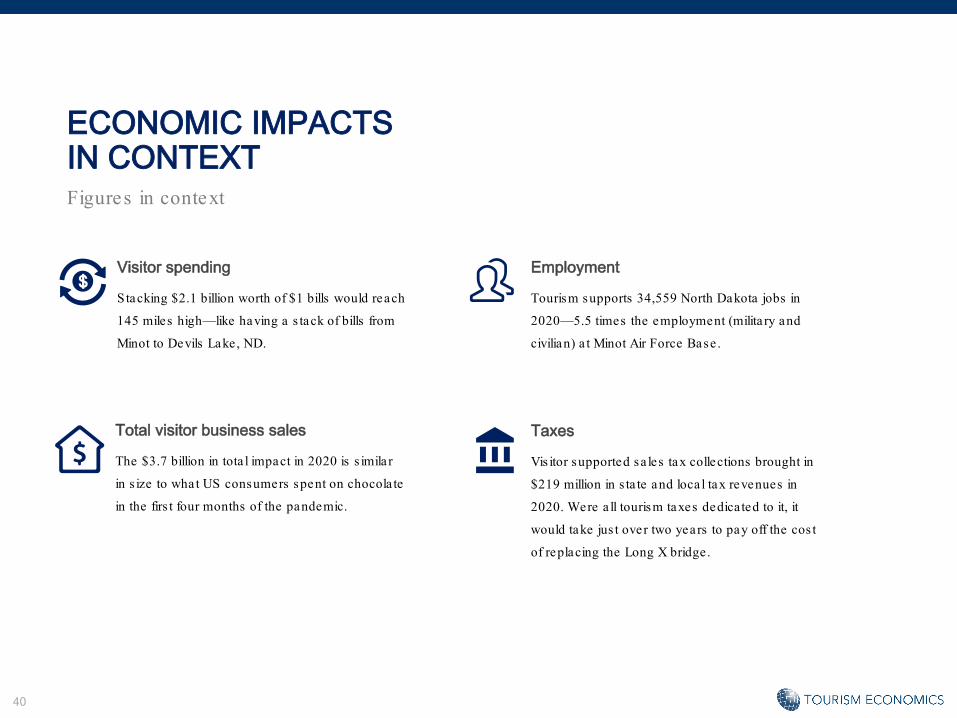
Visitor spending
Stacking $2.1 billion worth of $1 bills would reach
145 miles high—like having a s tack of bills from
Minot to Devils Lake , ND.
Total visitor business sales
The $3.7 billion in tota l impact in 2020 is s imila r
in s ize to what US consumers spent on chocola te
in the firs t four months of the pandemic.
Taxes
Vis itor supported sa les tax collections brought in
$219 million in s ta te and loca l tax revenues in
2020. Were a ll tourism taxes dedica ted to it, it
would take jus t over two years to pay off the cos t
of replacing the Long X bridge .
Employment
Tourism supports 34,559 North Dakota jobs in
2020—5.5 times the employment (milita ry and
civilian) a t Minot Air Force Base .
ECONOMIC IMPACTSIN CONTEXTFigures in context

APPENDIX

42
GLOSSARY – SPENDINGTerm Description
Lodging Includes vis itor spending in the accommodation sub-sector. This includes food and other se rvices provided by hote ls and s imila r es tablishments .
Food and beverageIncludes a ll vis itor spending on food & beverages , including a t res taurants , ba rs , grocery s tores and other food providers .
Recreation Includes vis itors spending within the a rts , enterta inment and recrea tion sub-sector.
Shopping Includes vis itor spending in a ll re ta il sub-sectors within the loca l economy.
Local transport Includes vis itor spending on loca l transport se rvices such as taxis , limos , tra ins , renta l ca rs , and buses .
Service stations Vis itor spending on gasoline .
Second homesWhere applicable , spending associa ted with the upkeep of seasonal second homes for recrea tional use as defined by the Census Bureau.

43
GLOSSARY -IMPACTS
Term Description
Direct ImpactImpacts (bus iness sa les , jobs , income, and taxes ) crea ted directly from spending by vis itors to a des tination within a discree t group of tourism-re la ted sectors (e .g. recrea tion, transporta tion, lodging).
Indirect ImpactImpacts crea ted from purchase of goods and se rvices used as inputs (e .g. food wholesa lers , utilitie s , bus iness se rvices) into production by the directly a ffected tourism-re la ted sectors (i.e . economic e ffects s temming from bus iness-to-bus iness purchases in the supply chain).
Induced ImpactImpacts crea ted from spending in the loca l economy by employees whose wages a re genera ted e ither directly or indirectly by vis itor spending.
EmploymentJobs directly and indirectly supported by vis itor activity (includes part-time and seasonal work). One job is defined as one person working a t leas t one hour per week for fifty weeks during the ca lendar year.
Personal Income Income (wages , sa la ries , proprie tor income and benefits ) supported by vis itor spending.
Value Added (GDP) The economic enhancement a company gives its products or se rvices before offe ring them to cus tomers .
Local TaxesCity and County taxes genera ted by vis itor spending. This includes any loca l sa les , income, bed, usage fees , licenses and other revenues s treams of loca l governmenta l authorities – from transporta tion to sanita tion to genera l government.
State TaxesSta te tax revenues genera ted by vis itor spending. This will include sa les , income, corpora te , usage fees and other assessments of s ta te governments .

44
ABOUT TOURISM ECONOMICS
For more information:
info@tourismeconomics .com
Tourism Economics is an Oxford Economics company with a s ingular objective : combine an unders tanding of the trave l
sector with proven economic tools to answer the mos t important ques tions facing our clients . More than 500 companies ,
associa tions , and des tination work with Tourism Economics every year as a research partner. We bring decades of
experience to every engagement to he lp our clients make be tter marke ting, inves tment, and policy decis ions . Our team of
highly-specia lized economis ts de liver:
• Global trave l da ta-se ts with the broades t se t of country, city, and s ta te coverage ava ilable
• Trave l forecas ts tha t a re directly linked to the economic and demographic outlook for origins and des tinations
• Economic impact analys is tha t highlights the va lue of vis itors , events , developments , and indus try segments
• Policy analys is tha t informs critica l funding, taxa tion, and trave l facilita tion decis ions
• Marke t assessments tha t define marke t a lloca tion and inves tment decis ions
Tourism Economics opera tes out of regional headquarters in Philadelphia and Oxford, with offices in Be lfas t, Buenos Aires ,
Dubai, Frankfurt, and Ontario.
Oxford Economics is one of the world’s foremos t independent global advisory firms , providing reports , forecas ts and
analytica l tools on 200 countries , 100 indus tria l sectors and over 3,000 cities . Our bes t-of-class global economic and indus try
models and analytica l tools give us an unpara lle led ability to forecas t exte rnal marke t trends and assess the ir economic,
socia l and bus iness impact. Headquartered in Oxford, England, with regional centers in London, New York, and Singapore ,
Oxford Economics has offices across the globe in Be lfas t, Chicago, Dubai, Miami, Milan, Paris , Philadelphia , San Francisco,
and Washington DC, we employ over 250 full-time s ta ff, including 150 profess ional economis ts , indus try experts and
bus iness editors—one of the la rges t teams of macroeconomis ts and thought leadership specia lis ts .