economic impact of oil and gas sector in bc david molinski assistant deputy minister oil and gas...
TRANSCRIPT

Economic Impact of Oil and Gas Sector in BC
David Molinski Assistant Deputy Minister
Oil and Gas DivisionMinistry of Energy and Mines
March 15, 2005Dawson Creek, BC

Objectives of the Analysis
• Identify expenditure patterns of the oil and gas industry by types of expenditures and where they are made
• Identify the significance of the oil and gas industry to both the Northeast and provincial economies
• Create economic models to assess future impact of the oil and gas industry price, fiscal and production scenarios

Key Study Components• Survey to capture expenditure data• Construction of BC Oil and Gas Model
• Approach similar to oil and gas supply model (OGSM) of the US Department of Energy Modelling System (NEMS)
• Calculates oil and gas production and investment as inputs to Macroeconomic models
• Macroeconomic models (Northeast & British Columbia)
• I/O Based General Equilibrium Models• Identifies the total impact of changes in the oil and gas sector
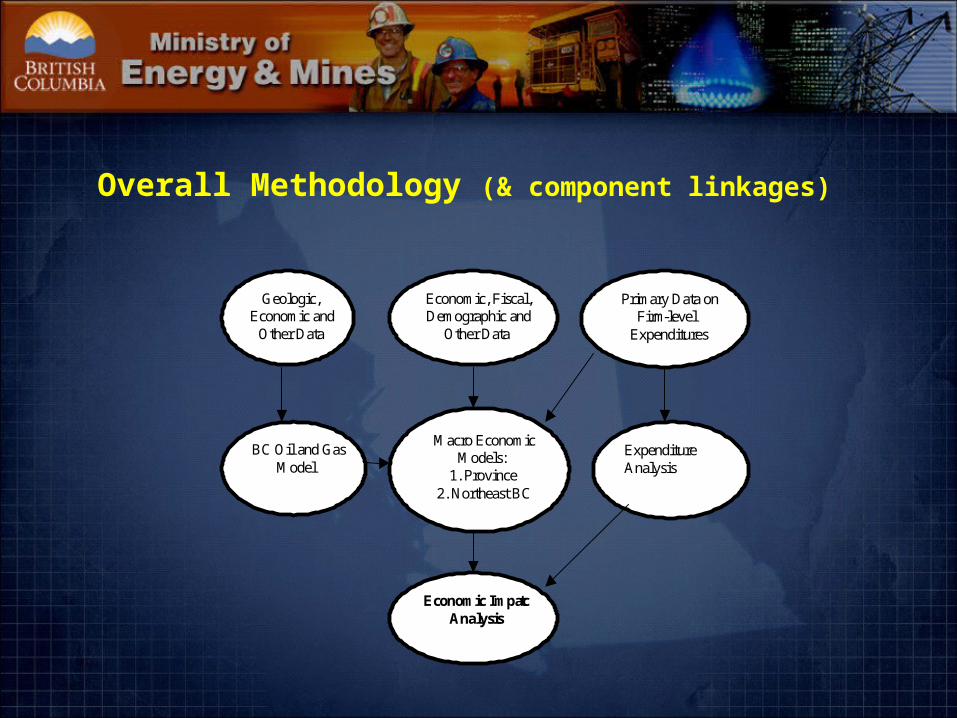
Overall Methodology (& component linkages)
Economic, Fiscal, Demographic and
Other Data
BC Oil and Gas Model
Expenditure Analysis
Macro Economic Models:
1. Province 2. Northeast BC
Economic Impac t Analysis
Primary Data on Firm - level
Expenditures
Geologic, Economic and
Other Data

Key Findings
• For each $1 additional 1997 dollars investment in natural gas well development and extraction, $2.5 additional 1997 dollars of GDP are generated in British Columbia.
• For each $1 additional 1997 dollars investment in natural gas well development and extraction, $1.29 additional 1997 dollars of GDP are generated in the Northeast.
• GDP refers to value of production that takes place within the province regardless of who actually undertakes the activity or their place of origin.
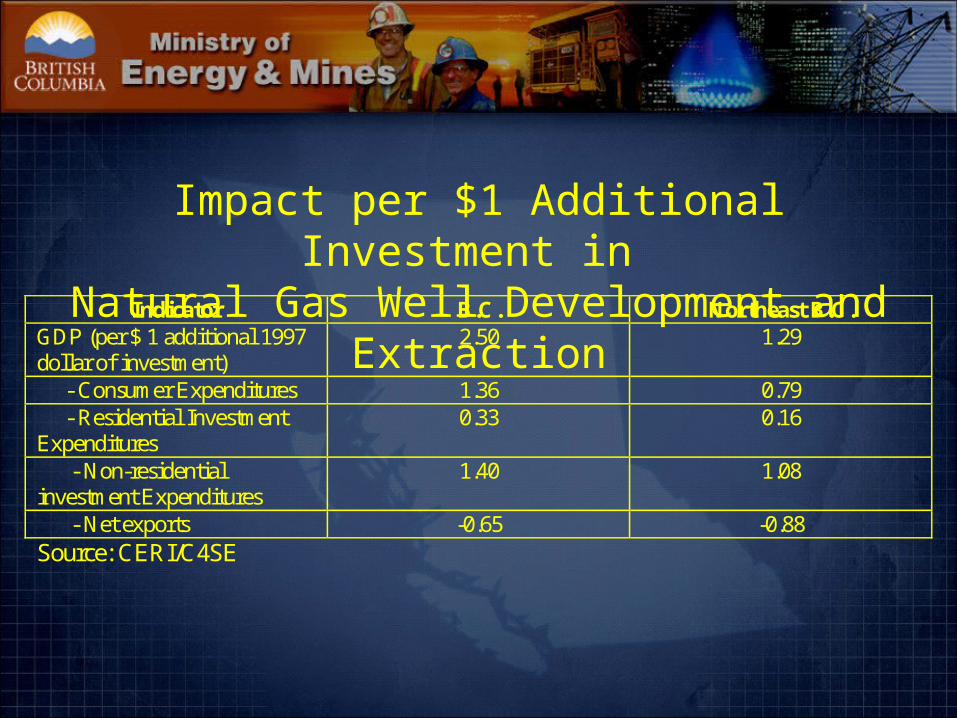
Impact per $1 Additional Investment in Natural Gas Well Development and Extraction
Indicator B.C. Northeast B.C. GDP (per $ 1 additional 1997 dollar of investment)
2.50
1.29
- Consumer Expenditures 1.36 0.79 - Residential Investment Expenditures
0.33 0.16
- Non-residential investment Expenditures
1.40 1.08
- Net exports -0.65 -0.88 Source: CERI/C4SE

Oil & Gas Sector Expenditures in BC
Expenditure (Oil & Gas Sector)
0
500
1000
1500
2000
2500
3000
3500
4000
19
85
19
86
19
87
19
88
19
89
19
90
19
91
19
92
19
93
19
94
19
95
19
96
19
97
19
98
19
99
20
00
20
01
20
02
20
03
Mil
lion
Dol
lar
• Oil and gas sector investment increased gradually between 1985 and 1999
• During 1999-2001 it increased rapidly from 1.6 billion dollars to 3.7 billion dollars.

Oil and Gas Industry Performance
Variable/Year 1996 1997 1998 1999 2000 2001 2002
GDP
($1997 Millions)
1043.1 1080.2 1176.2 1275.4 1431.8 1590.4 1637.8
Investment
($1997 Millions)
1055.5 1293.7 1302.1 941.7 1496.1 2455.7 1571.7
Gas Royalties(Current $)
131.7 174.8 180.1 293.7 876.6 1131.8 787.0
Oil Royalties(Current $)
72.9 79.6 62.7 76.1 136.4 110.7 107.0
Source: Statistics Canada and B.C. Government
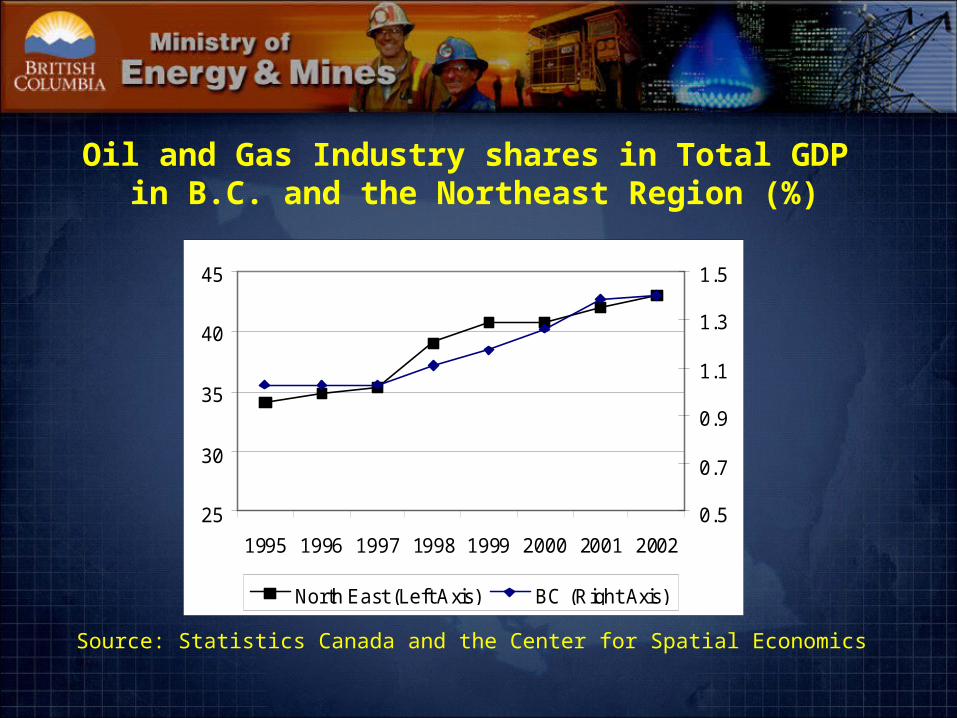
Oil and Gas Industry shares in Total GDP in B.C. and the Northeast Region (%)
25
30
35
40
45
1995 1996 1997 1998 1999 2000 2001 2002
0.5
0.7
0.9
1.1
1.3
1.5
North East (Left Axis) BC (Right Axis)
Source: Statistics Canada and the Center for Spatial Economics
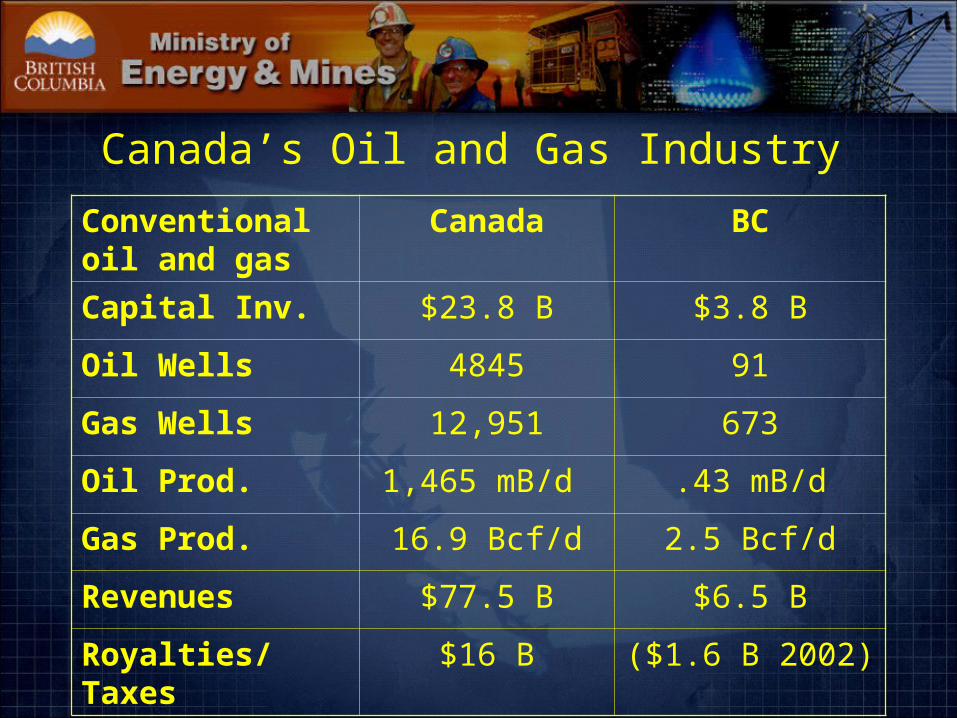
Canada’s Oil and Gas Industry
Conventional oil and gas
Canada BC
Capital Inv. $23.8 B $3.8 B
Oil Wells 4845 91
Gas Wells 12,951 673
Oil Prod. 1,465 mB/d .43 mB/d
Gas Prod. 16.9 Bcf/d 2.5 Bcf/d
Revenues $77.5 B $6.5 B
Royalties/Taxes $16 B ($1.6 B 2002)

Canadian Sedimentary Basins

Four Distinct Phases of Oil and Gas Field Development
Exploration – Searching for Petroleum– Geophysical, Seismic, Drilling
Development – Drilling wells/Laying Pipe– Engineering, Drilling, Fabrication, Construction
Production – Recovering the Resource– Engineering, Operations, Processing, Shipping
Decommissioning - Abandonment – Removal of Facilities– Engineering, Environmental, Construction

Oil and Gas Full Cycle Cash Flow

Oil and Gas Business TrendsAffecting NEBC
• Global Nature of Industry -- goods & service centres– Industry consolidation – e.g., drilling companies
• Global & North American centres• Locational & other decision factors influencing
where industry centres develop– Local service businesses– Regional service businesses– National and International service businesses
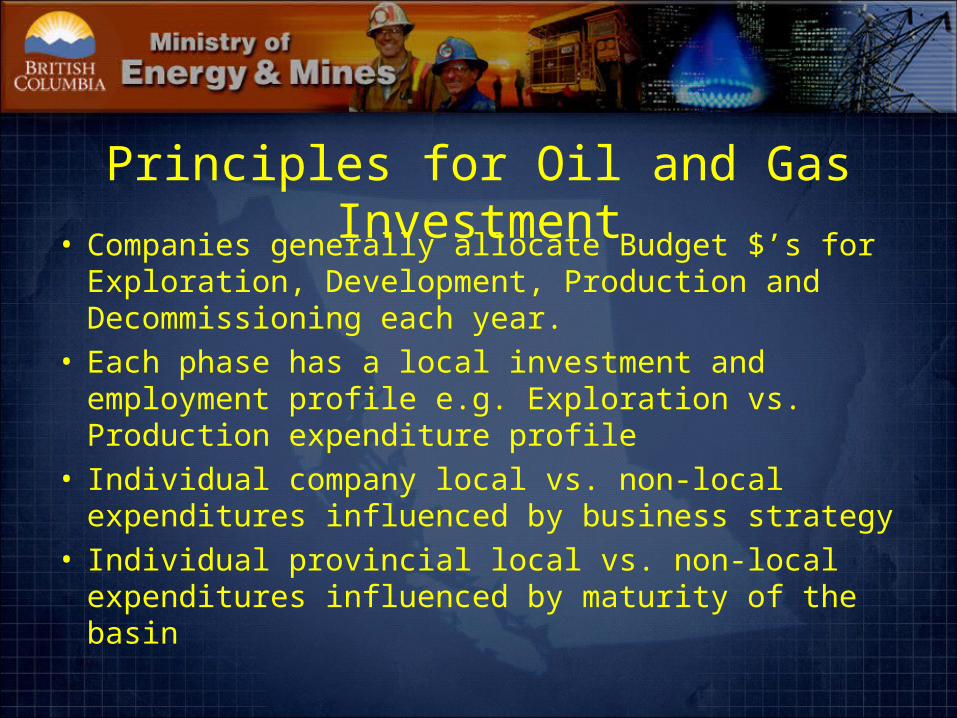
Principles for Oil and Gas Investment
• Companies generally allocate Budget $’s for Exploration, Development, Production and Decommissioning each year.
• Each phase has a local investment and employment profile e.g. Exploration vs. Production expenditure profile
• Individual company local vs. non-local expenditures influenced by business strategy
• Individual provincial local vs. non-local expenditures influenced by maturity of the basin

CERI Expenditure Analysis
• Based on survey of companies in oil and gas industry:– Large, medium and small producers– Service and Supply companies: (i) drilling, (ii) seismic
and (iii) all other service and supply companies

The Overall Survey Approach
Oil & Gas Producers
Land Acquisition & Rentals
Directly Hired Labor
Purchased Goods Purchased Services
NE BC (%) Other BC (%) Out of BC (%)
Geological &
Geophysical
Well Drilling &
Completion
Production & Operation (including
gathering & processing)
Constru-ction of
FacilitiesOthers
Drilling Companies
Labor Goods Services
NE BC (%) Other BC (%)
Out of BC (%)
Seismic Companies
Service & Supply
Companies
Service & Supply Companies

The Survey Process
Face-to-Face Meetings with Select Producers and Oil and Gas
Associations
Focus Group Meeting with Producer & Drilling Companies
Finalization of Survey Instrumentswith Input from Ministry
and Industry
Survey Mail- out
Multi-layered Follow-up
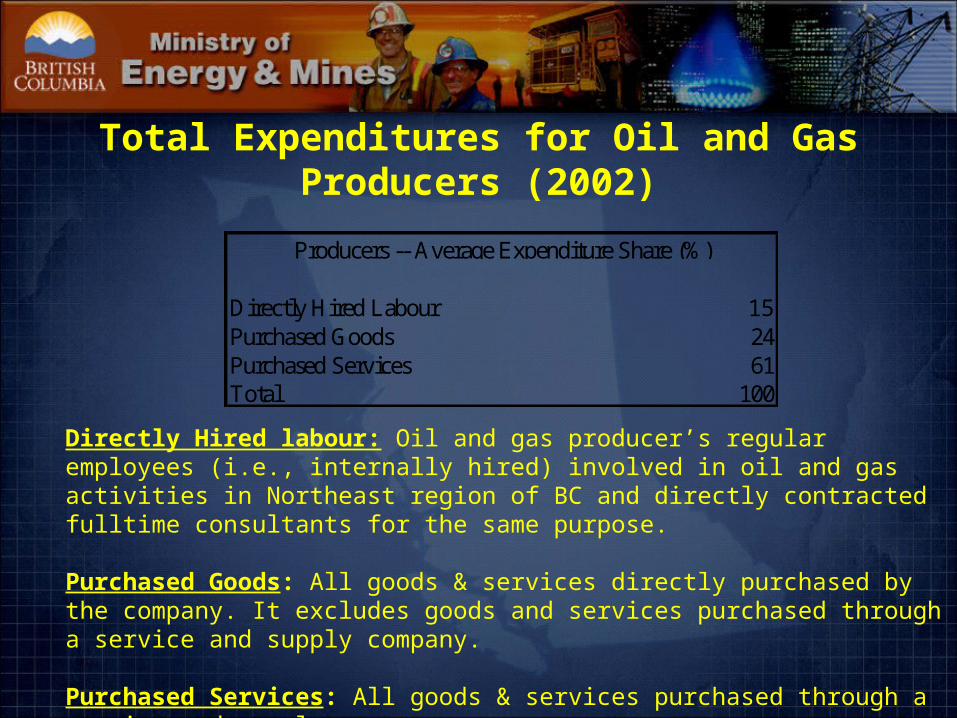
Total Expenditures for Oil and Gas Producers (2002)
Directly Hired labour: Oil and gas producer’s regular employees (i.e., internally hired) involved in oil and gas activities in Northeast region of BC and directly contractedfulltime consultants for the same purpose.
Purchased Goods: All goods & services directly purchased by the company. It excludes goods and services purchased through a service and supply company.
Purchased Services: All goods & services purchased through a service and supply company.
Directly Hired Labour 15Purchased Goods 24Purchased Services 61Total 100
Producers -- Average Expenditure Share (%)
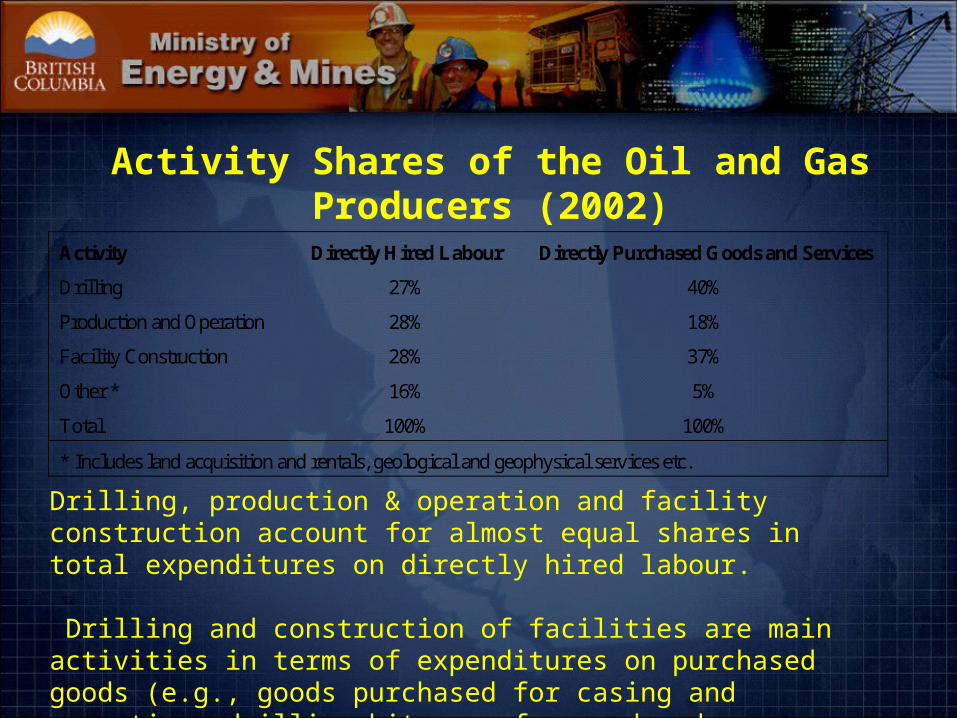
Activity Shares of the Oil and Gas Producers (2002)
Activity Directly Hired Labour Directly Purchased Goods and Services
Drilling 27% 40%
Production and Operation 28% 18%
Facility Construction 28% 37%
Other * 16% 5%
Total 100% 100%
* Includes land acquisition and rentals, geological and geophysical services etc.
Drilling, production & operation and facility construction account for almost equal shares in total expenditures on directly hired labour.
Drilling and construction of facilities are main activities in terms of expenditures on purchased goods (e.g., goods purchased for casing and
cementing; drilling bits, surface mud and chemicals).
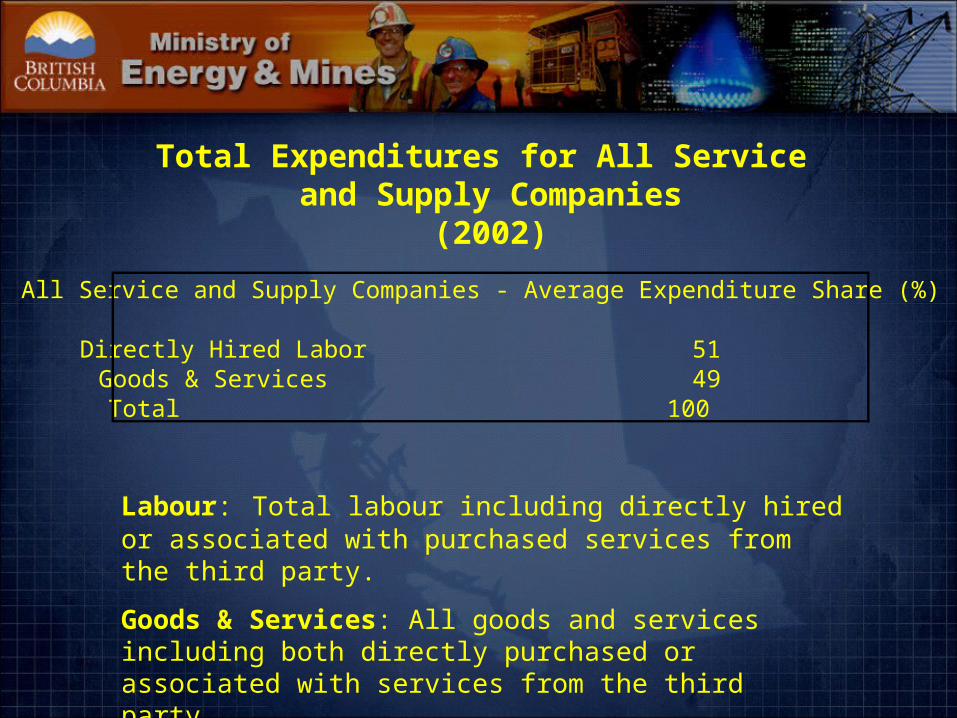
Total Expenditures for All Service and Supply Companies
(2002)
Labour: Total labour including directly hired or associated with purchased services from the third party.
Goods & Services: All goods and services including both directly purchased or associated with services from the third party.
All Service and Supply Companies - Average Expenditure Share (%)
Directly Hired Labor 51Goods & Services 49Total 100
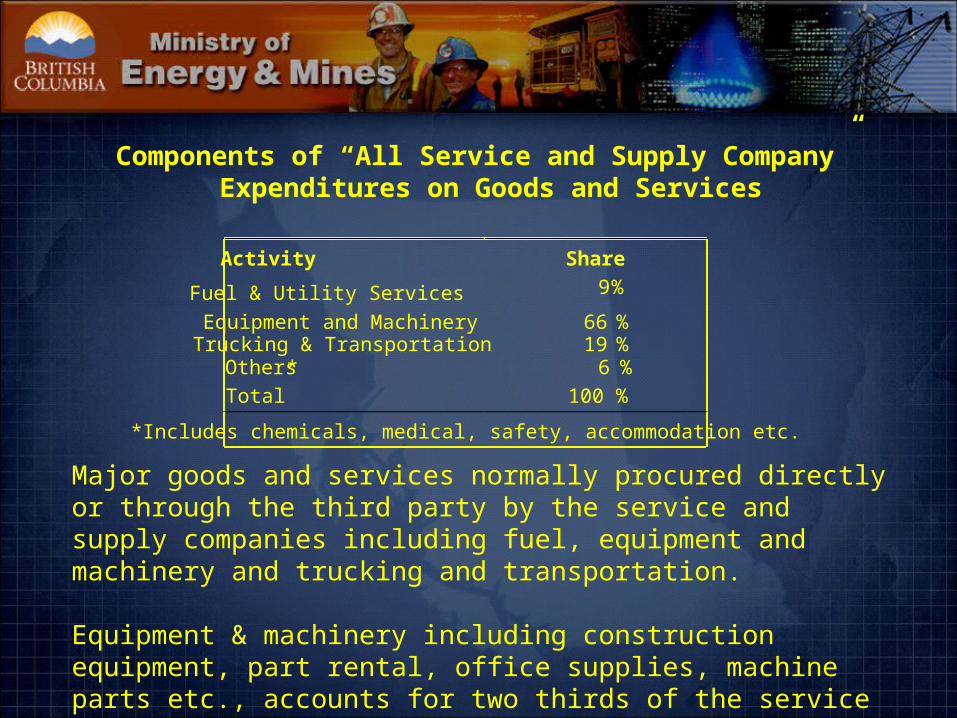
Components of “All Service and Supply Company” Expenditures on Goods and Services
Major goods and services normally procured directly or through the third party by the service and supply companies including fuel, equipment and machinery and trucking and transportation.
Equipment & machinery including construction equipment, part rental, office supplies, machine parts etc., accounts for two thirds of the service and supply companies’ total expenditure on goods and services.
Activity Share
Fuel & Utility Services 9 %
Equipment and Machinery 66 %Trucking & Transportation 19 %Others* 6 %
Total 100 %
*Includes chemicals, medical, safety, accommodation etc.

Shares of Drilling and Service Rigs
2002 2001 2000 1999 1998Drilling Rig 59 63 58 55 52Service Rig 41 37 42 45 48Total 100 100 100 100 100
Expenditure Share Drilling Rig vs. Service Rig
Drilling activities are divided into two groups based on whether the activities are related to drilling (drilling rig) or servicing (service rig).
The trend shows that the share of drilling rig is increasing, whereas the share of service rig is decreasing. This may result from deeper well drilling over the years.
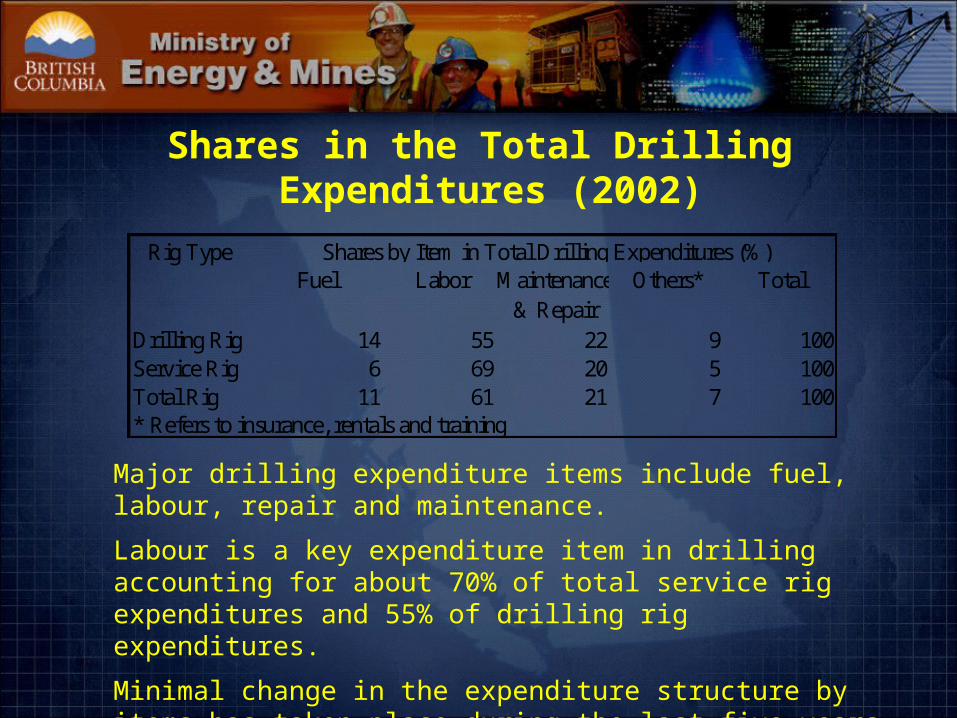
Shares in the Total Drilling Expenditures (2002)
Major drilling expenditure items include fuel, labour, repair and maintenance.
Labour is a key expenditure item in drilling accounting for about 70% of total service rig expenditures and 55% of drilling rig expenditures.
Minimal change in the expenditure structure by items has taken place during the last five years.
Rig TypeFuel Labor Maintenance Others* Total
& RepairDrilling Rig 14 55 22 9 100Service Rig 6 69 20 5 100Total Rig 11 61 21 7 100* Refers to insurance, rentals and training
Shares by Item in Total Drilling Expenditures (%)
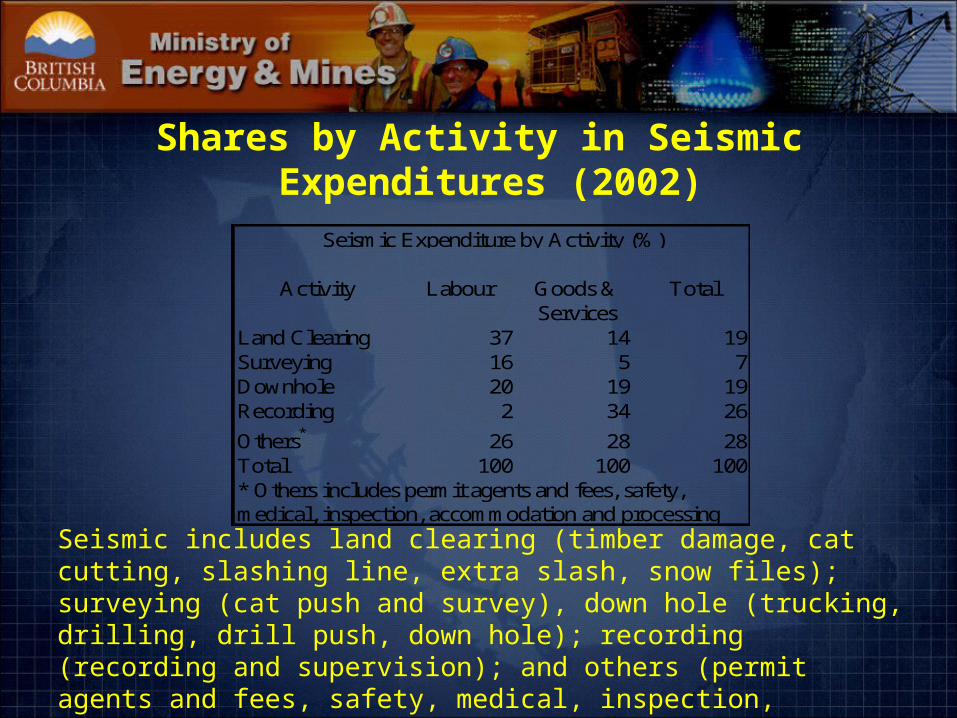
Shares by Activity in Seismic Expenditures (2002)
Activity Labour Goods & TotalServices
Land Clearing 37 14 19Surveying 16 5 7Downhole 20 19 19Recording 2 34 26
Others* 26 28 28Total 100 100 100* Others includes permit agents and fees, safety, medical, inspection, accommodation and processing
Seismic Expenditure by Activity (%)
Seismic includes land clearing (timber damage, cat cutting, slashing line, extra slash, snow files); surveying (cat push and survey), down hole (trucking, drilling, drill push, down hole); recording (recording and supervision); and others (permit agents and fees, safety, medical, inspection, accommodation and processing).
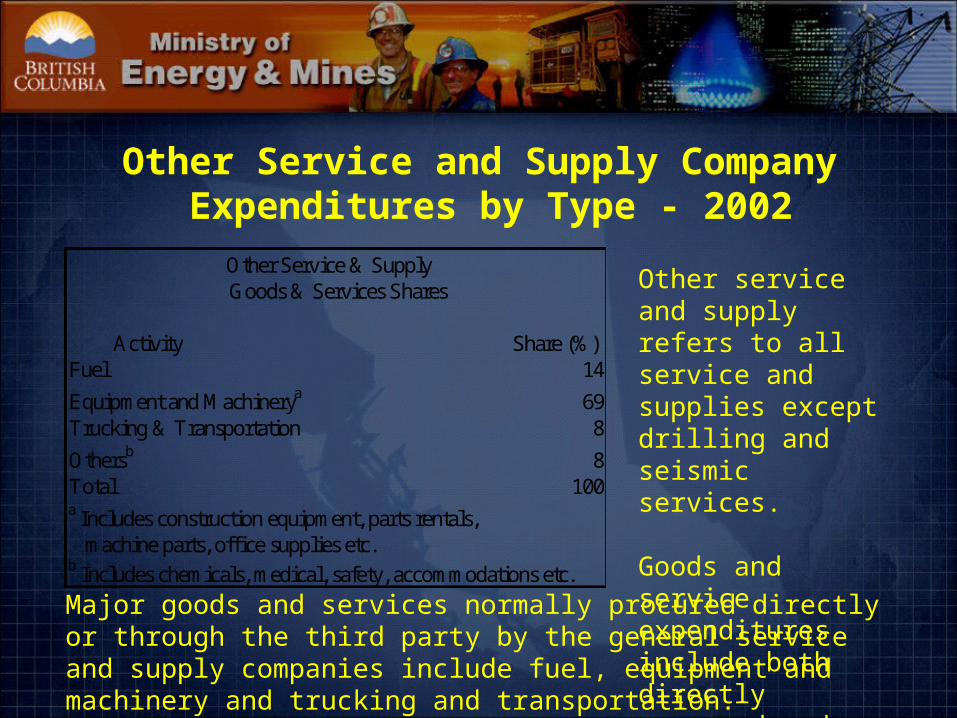
Other Service and Supply Company Expenditures by Type - 2002
Activity Share (%)Fuel 14
Equipment and Machinerya 69Trucking & Transportation 8
Othersb 8Total 100a Includes construction equipment, parts rentals, machine parts, office supplies etc.b Includes chemicals, medical, safety, accommodations etc.
Other Service & Supply Goods & Services Shares Other service and supply
refers to all service and supplies except drilling and seismic services.
Goods and service expenditures include both directly procured and third party (or indirect) purchases.
Major goods and services normally procured directly or through the third party by the general service and supply companies include fuel, equipment and machinery and trucking and transportation.

Where are goods, services and labour sourced? Why?
•Kinds of goods needed, and where they are manufactured
• exploration, development, production, abandonment
•Kinds of skills and services needed and where they are sourced
• exploration, development, production, abandonment
•Influences for expenditure decision making•Why are producers and service sector
expenditure patterns different
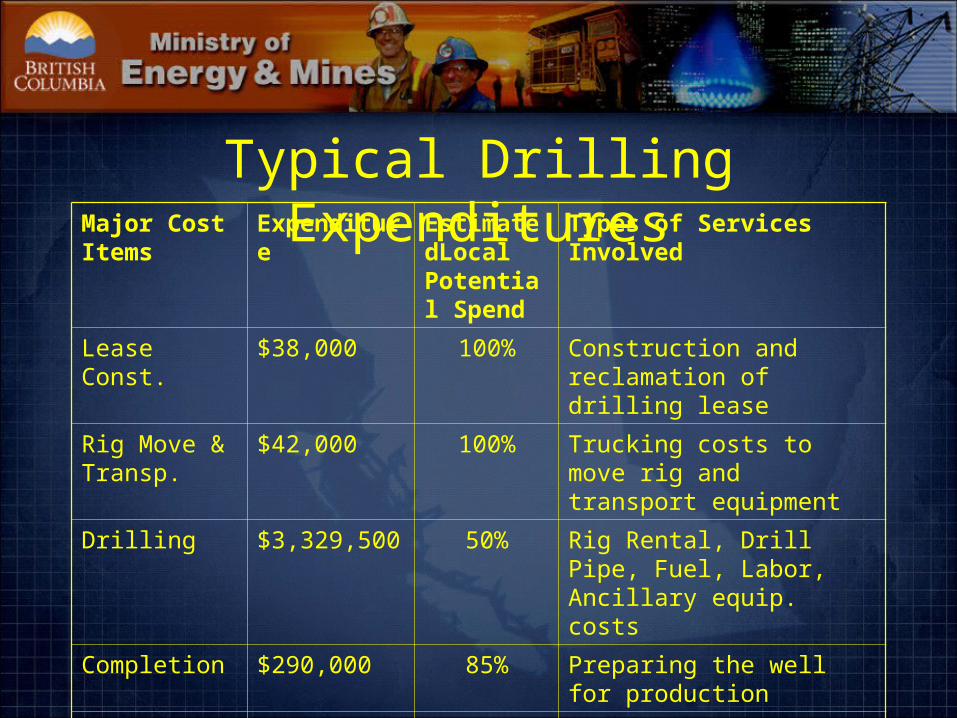
Typical Drilling ExpendituresMajor Cost Items
Expenditure EstimatedLocal Potential Spend
Types of Services Involved
Lease Const. $38,000 100% Construction and reclamation of drilling lease
Rig Move & Transp.
$42,000 100% Trucking costs to move rig and transport equipment
Drilling $3,329,500 50% Rig Rental, Drill Pipe, Fuel, Labor, Ancillary equip. costs
Completion $290,000 85% Preparing the well for production
Other $5,000 0% Geology, Engineering services
Total $3,704,500 50%
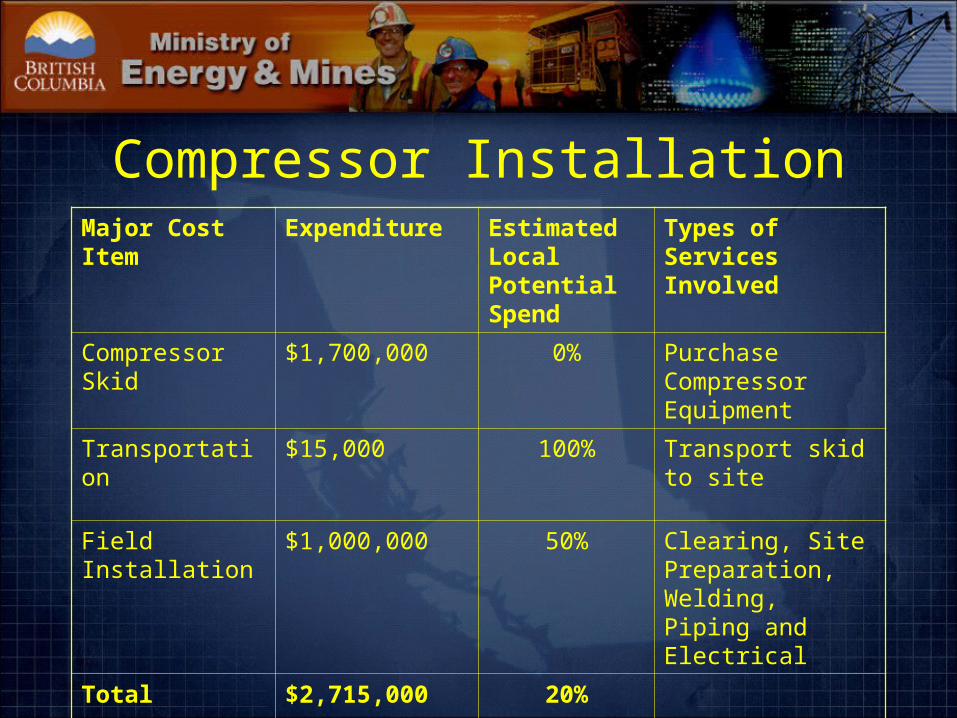
Compressor InstallationMajor Cost Item Expenditure Estimated
Local Potential Spend
Types of Services Involved
Compressor Skid $1,700,000 0% Purchase Compressor Equipment
Transportation $15,000 100% Transport skid to site
Field Installation $1,000,000 50% Clearing, Site Preparation, Welding, Piping and Electrical
Total $2,715,000 20%
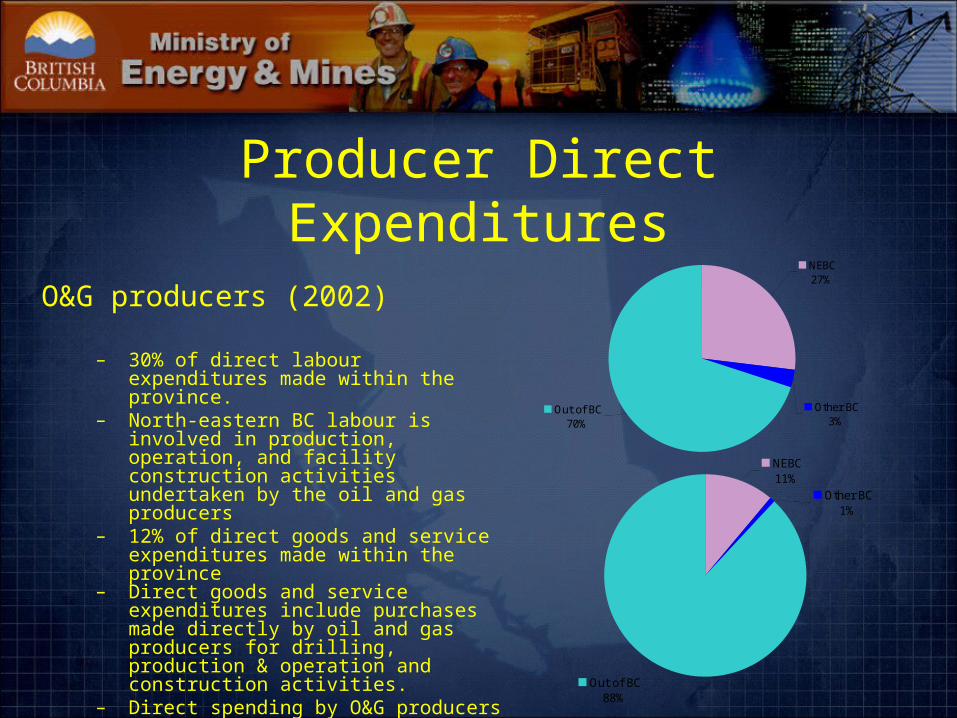
Producer Direct Expenditures
O&G producers (2002)
– 30% of direct labour expenditures made within the province.
– North-eastern BC labour is involved in production, operation, and facility construction activities undertaken by the oil and gas producers
– 12% of direct goods and service expenditures made within the province
– Direct goods and service expenditures include purchases made directly by oil and gas producers for drilling, production & operation and construction activities.
– Direct spending by O&G producers is 39% of total expenditures.
Other BC3%
NEBC27%
Out of BC70%
Other BC1%
NEBC11%
Out of BC88%
Producer Direct Expenditures (cont.)
• All personnel physically living and working in BC irrespective of their actual residence is included in labour sourced from within BC.
• Local purchases include those bought through local vendors.
• Actual goods manufacturing may take place outside the region.

“All Service and Supply Company” Expenditures
Service and supply companies (2002)
– 63% of direct labour expenditures made within the province.
– 47% of direct goods and services expenditures made within the province.
– Labour sourced in BC includes those physically working in BC, irrespective of their origins.
– The service and supply activity includes all types of service and supply including drilling, seismic, construction, well completion and testing, environmental services and such others.
Other BC2%
NEBC61%
Out of BC37%
Other BC2%
NEBC45%
Out of BC53%
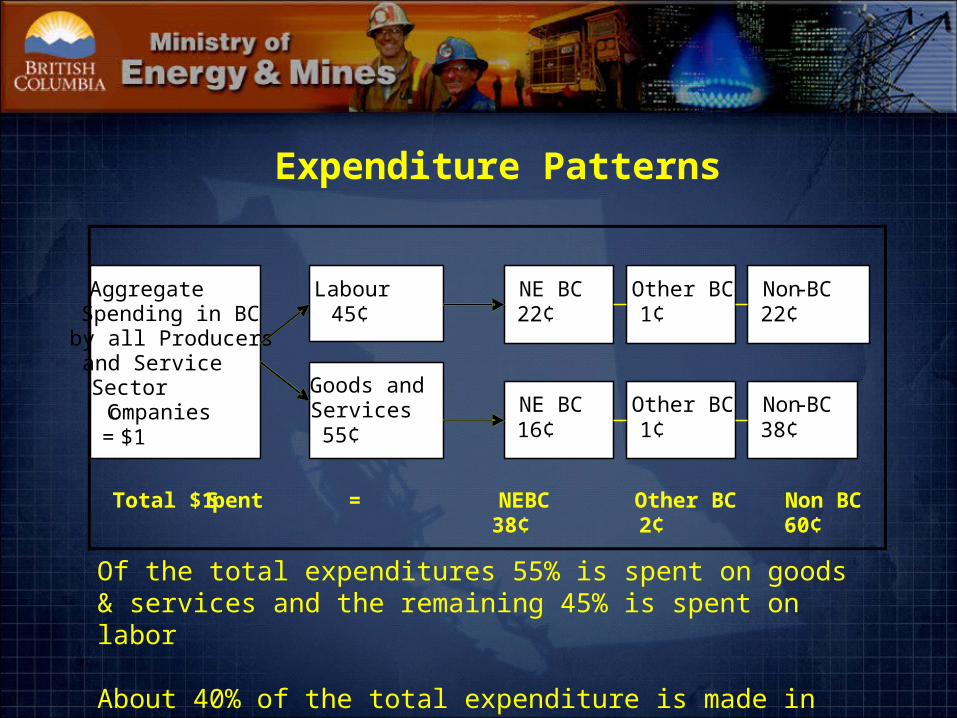
Expenditure Patterns
Of the total expenditures 55% is spent on goods & services and the remaining 45% is spent on labor
About 40% of the total expenditure is made in the province
Labour 45¢
Goods and Services 55¢
Aggregate Spending in BC by all Producers and Service Sector Companies = $1
NE BC 22¢
Other BC 1¢
Non-BC 22¢
NE BC 16¢
Other BC 1¢
Non-BC 38¢
Total $1 Spent = NEBC Other BC Non BC 38¢ 2¢ 60¢
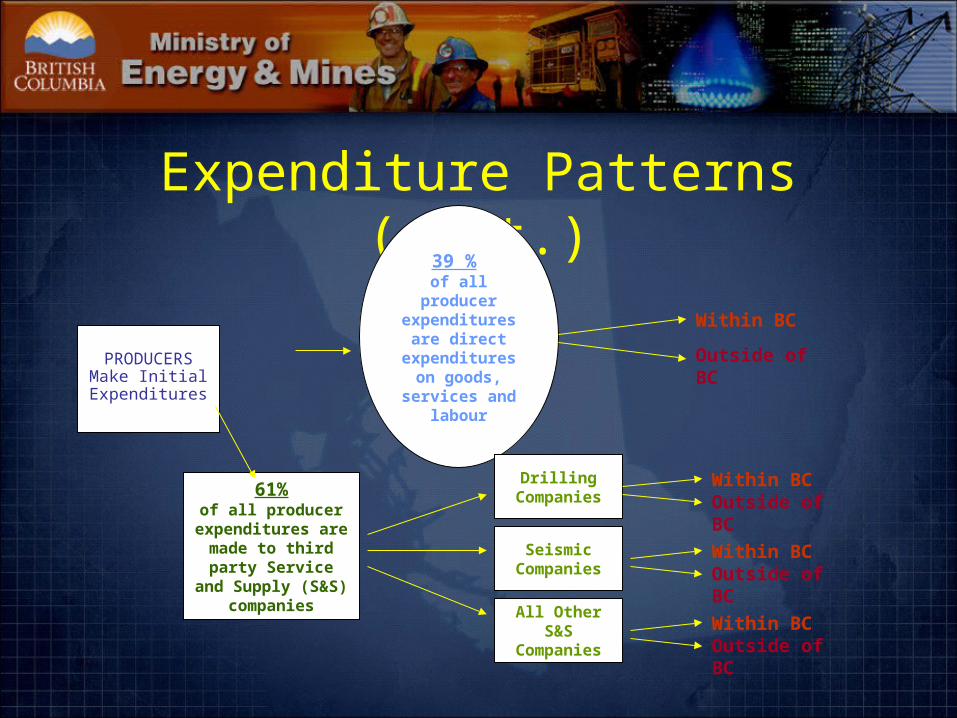
Expenditure Patterns (cont.)
39 % of all producer expenditures
are direct expenditures
on goods, services and
labour
61%of all producer
expenditures are made to third party Service and Supply (S&S) companies
PRODUCERSMake Initial
Expenditures
Drilling Companies
Seismic Companies
All Other S&S Companies
Within BC
Outside of BC
Within BCOutside of BC
Within BCOutside of BC
Within BCOutside of BC

Labour Expenditures: Producer Companies/Service and Supply
CompaniesIn a context of a rapidly growing industry, labour from within the province has basically maintained its participation between 1998 and 2002.
Service and Supply Companies Producer Companies
81 86 8677 81
1310 9
97
6 4 514 11
0%
20%
40%
60%
80%
100%
1998 1999 2000 2001 2002
NEBC Other BC Out of BC
40 35 32 29 27
23 3 3 3
58 62 65 68 70
0%
20%
40%
60%
80%
100%
1998 1999 2000 2001 2002
NEBC Other BC Out of BC

Summary• The oil and gas industry has a major impact on the
provincial economy as measured by GDP:– Per $1 additional 1997 dollars investment in natural gas well
development and extraction, $2.5 additional 1997 dollars of GDP are generated in British Columbia. For the Northeast, the impact is $1.29 additional GDP.
• About 40% ($1.4 billion) of all industry expenditures remain in BC.
• Primary reasons for sourcing labour, goods and services outside BC are: use of large, national supply contracts; shortened activity window, labour demand exceeds local supply; and provincial tax regime.
Sustaining the Growth
• Addressing the availability issue• Drilling incentives (i.e. Summer Drilling
Program, Deep Drilling Program, etc.)• Infrastructure Development• Removing Fiscal Barriers• Standardised Regulatory Regime in Western
Canada