economic highlights · • jp morgan global manufacturing pmi rebounded to expansionary territory...
TRANSCRIPT


-2
-1
0
1
2
3
4
5
2010 2011 2012 2013 2014 2015 2016 2017 2018 2019
Consumer Price Index (yoy %)
CPI ex-Food & Energy (yoy %)
49
50
51
52
53
54
55
2014 2015 2016 2017 2018 2019
Global
45
47
49
51
53
55
57
59
61
63
2014 2015 2016 2017 2018 2019
Japan US Eurozone
Economic Highlights
• JP Morgan Global Manufacturing PMI rebounded to expansionary territory at 50.1 forthe month of December
• For Q4 2019, US PMI was positive, with an average figure of 52.1 over three monthsand 52.4 in December. Europe remains in contraction territory with a Decemberresult of 46.3.
Source: RHB AM, Bloomberg, 10 January 2020
Developed Market Manufacturing PMIsJP Morgan Global Manufacturing PMI
Source: RHB AM, Bloomberg, 10 January 2020
US Core CPI Index Labor Market remained strong
• Recent inflation remained benign amid slowing economic growth, with CPI remainingat a low 2.3% in December.
• The US Fed has conducted 3 rate cuts in FY2019. However, October meeting minutesalso claimed that most participants felt that 3 was sufficient for the year and that theeconomy was in good shape.
US
Global PMI
2
Source: RHB AM, Bloomberg, 10 January 2020 Source: RHB AM, Bloomberg, 10 January 2020
1.0
1.5
2.0
2.5
3.0
3.5
4.0
2010 2011 2012 2013 2014 2015 2016 2017 2018 2019 2020
Avg. Hourly Earnings (yoy %)
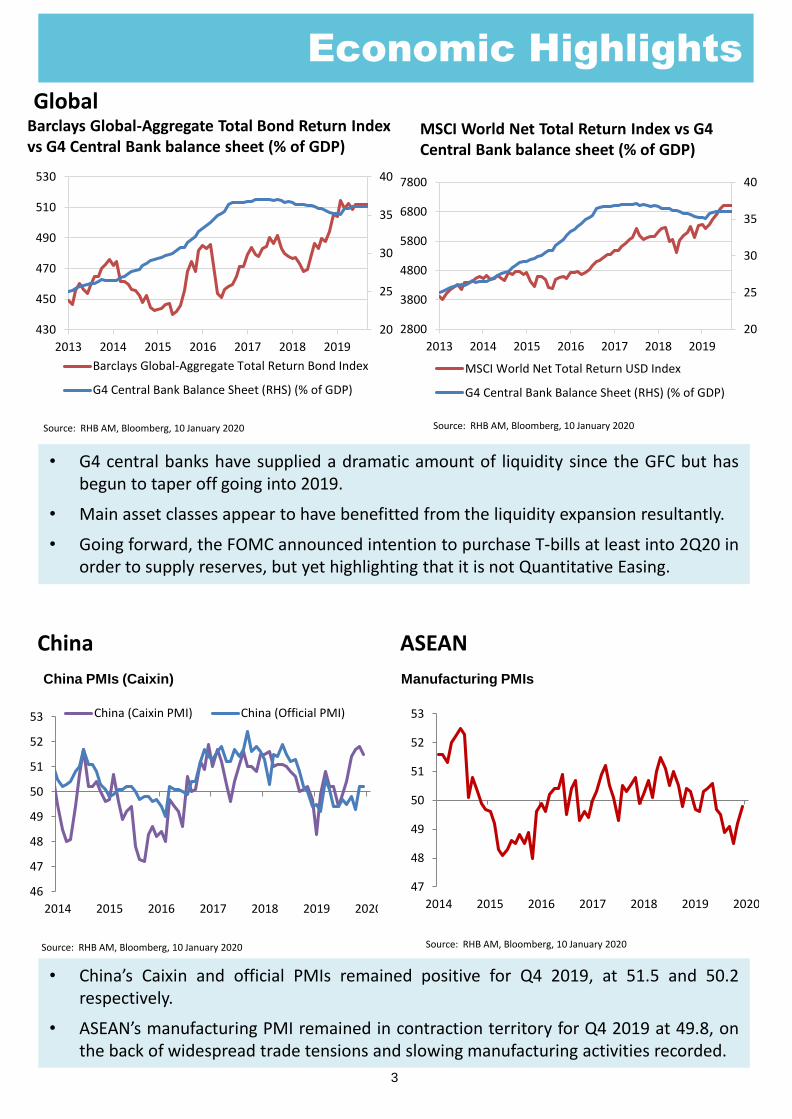
Barclays Global-Aggregate Total Bond Return Index vs G4 Central Bank balance sheet (% of GDP)
• G4 central banks have supplied a dramatic amount of liquidity since the GFC but hasbegun to taper off going into 2019.
• Main asset classes appear to have benefitted from the liquidity expansion resultantly.
• Going forward, the FOMC announced intention to purchase T-bills at least into 2Q20 inorder to supply reserves, but yet highlighting that it is not Quantitative Easing.
Global MSCI World Net Total Return Index vs G4 Central Bank balance sheet (% of GDP)
Economic Highlights
China
• China’s Caixin and official PMIs remained positive for Q4 2019, at 51.5 and 50.2respectively.
• ASEAN’s manufacturing PMI remained in contraction territory for Q4 2019 at 49.8, onthe back of widespread trade tensions and slowing manufacturing activities recorded.
China PMIs (Caixin) Manufacturing PMIs
3
Source: RHB AM, Bloomberg, 10 January 2020Source: RHB AM, Bloomberg, 10 January 2020
Source: RHB AM, Bloomberg, 10 January 2020 Source: RHB AM, Bloomberg, 10 January 2020
46
47
48
49
50
51
52
53
2014 2015 2016 2017 2018 2019 2020
China (Caixin PMI) China (Official PMI)
ASEAN
47
48
49
50
51
52
53
2014 2015 2016 2017 2018 2019 2020
20
25
30
35
40
430
450
470
490
510
530
2013 2014 2015 2016 2017 2018 2019
Barclays Global-Aggregate Total Return Bond Index
G4 Central Bank Balance Sheet (RHS) (% of GDP)
20
25
30
35
40
2800
3800
4800
5800
6800
7800
2013 2014 2015 2016 2017 2018 2019
MSCI World Net Total Return USD Index
G4 Central Bank Balance Sheet (RHS) (% of GDP)

4
Equity Market
GlobalThe market welcomed easier financial conditions and a détente of trade war tensionsbetween US and China, as global equities markets posted its fourth consecutive month ofpositive return, up 3.4% for the month of December after November’s 2.3% gains. Withinsectors, energy (5.1%), materials (5.0%) and information technology (4.8%) outperformed.On the other side, industrial (1.3%), real estate (1.8%), consumer staples (2.0%) andcommunication services (2.8%) underperformed. Within regions, Asia ex-Japan (6.4%), UK(5.0%) and Europe (3.9%) outperformed, while US (2.8%) and Japan (2.0%)underperformed.
The Federal Reserve began the purchase of Treasury bills at the rate of USD60 billion permonth in mid-October and will look to purchase bills at least into the second quarter of2020. In addition, repo operations - term operations of at least USD35 billion twice perweek and overnight operations of at least USD75 billion - will continue at least untilJanuary. The FOMC kept the target range unchanged at 1.5% - 1.755% at its Decembermeeting. The meeting went largely as expected, as the Committee expressed less concernsover “uncertainties” and indicated that the current stance of monetary policy isappropriate. The dot plot signals a rate hold through 2020, and one hike in each of 2021and 2022, and an unchanged neutral rate of 2.5%. Fed Chair Powell remained dovish duringhis press conference. The FOMC is scheduled to conclude its policy framework reviewaround mid-2020, where the adoption of some form of average inflation targeting the mostlikely outcome points to a more dovish stance.
The European Central Bank (ECB) also resumed its QE program with net purchases ofgovernment and corporate debt at a monthly pace of EUR20 billion since 1 November set afooting for Christine Lagarde, who took up her duties as the president of the ECB on thesame day. European growth is expected to pick up gradually in 2020, driven by stabilizationin the manufacturing sector, modest fiscal impulse, and a resolution of Brexit uncertainties.
On trade war front, the “Phase 1” agreement - where China would increase purchase of USagricultural products, strengthen intellectual property provisions, and issue new guidelineson how it manages its currency – is scheduled for signing on 15 January. In December, thetrade ministers of China, Japan and South Korea agreed to work towards a regional tradepact and putting a positive front to the Japan-Korea tensions. Other receded externaltension include the final iterations of the USMCA ratification, as well as the outcome of aBrexit deal in its January deadline after the UK election.

5
Equity Market
The Bank of Japan is likely to keep its monetary policy unchanged after the recentlyannounced fiscal stimulus package and the receding external risk factors. The Japanesegovernment approved a large economic package on 5 December, with total fiscal spendingof JPY9.4 trillion included in its FY2019 supplementary budget and FY2020 budget. TheDecember Tankan survey also showed non-manufacturing sectors holding in, even asmanufacturers’ sentiment slipped. China’s interest rate reform took another solid stepforward, as the PBOC guided commercial banks to convert old benchmark lending rates intoLPR for the existing and new loan books, along with the well expected 50bp RRR cut.

6
Equity Market
Singapore
Singapore 3Q19 GDP growth registered a 0.5% yoy growth, slightly higher than the 0.2%yoy growth in 2Q19. Growth in the construction, IT and financial sectors was offset by thedrag in manufacturing and retail sectors. 2019 GDP is estimated to slow to 0.7% accordingto the Prime Minister in his New Year speech, and based on the projection bythe Ministry of Trade and Industry (MTI), the Singapore economy is expected to grow by 0.5to 2.5% in 2020.
On the inflation front, the Monetary Authority of Singapore (MAS) projected for Singapore’sCPI inflation to register around 0.5% in 2019, and average 0.5–1.5% in 2020. In the nearterm outlook, external sources of inflation are likely to remain benign, amid weak demandconditions but volatility in oil prices could be expected. On the domestic side, labourmarket conditions are softening slightly and would potentially lower wage growth in 2019and 2020 as compared to 2018.
In October, Singapore equity market rallied on news that Temasek’s partial offer for Keppelat a 26% premium, pushing the oil and gas sector to join in the news of a possible strategicreform. Furthermore, a couple of broker upgrades of City Development on strongSeptember private home numbers and the Millennium and Copthorne acquisition helpedpush the index higher. The REITS sector continue to see capital raising and positive interestfrom yield hungry investors in this space. MAS has also eased its policy for the first time inApril 2016 and seems to hint at a dovish stance for further easing. However, marketdeclined alongside the rest of its ASEAN peers into November. Singapore earnings seasonwas broadly in line with consumer staples beating expectations and industrials comingbehind. The market then saw some recovery in December as the Singapore market rallied0.9% while the Singapore dollar strengthened against the greenback. In corporate news,Yangzijiang rebounded strongly on news that the executive chairman returned to worksince being away from August. Property developers were also higher as private home saleswere tracking above expectations. Generally, EPS growth expected to be around 5.2% y/ygrowth in 2020.
Currently, we favour the reflationary trades such as banks given that it is a play on themacro recovery environment. We also like selected property developers on the back ofpotential revaluation gains and strong demand seen in the residential segment. We are alsowell-positioned in plantation names. We remained neutral on the telecommunication spaceamid the ongoing structural challenges faced by the players, but like their steady dividendpolicies.
China/Hong Kong
In the month of December, both the Hang Seng Index and Shanghai Stock ExchangeComposite Index posted strong gains to close the year, recording +7.0% and +6.2%respectively. The strong run was due to mitigation of geopolitical risk where the US andChina announced on 13th December that an agreement on “Phase I” trade deal has beenreached. While the FOMC also left the US Fed rate unchanged for the month, PBOCannounced on 28th December that all new loans originated from 1st Jan 2020 onward haveto be priced based on Loan Prime Rate. This was followed closely by a the reserverequirement ratio (RRR) cut by the PBOC on New Year Day 2020, lowering rate by 50bpseffective from 6th January 2020 across the board. In Hong Kong, economic activity slowedfurther amid prolonged social unrest, which severely hit the consumption and tourism-related sectors since 3Q19. The Hong Kong government also cut its 10-year housing supplytarget to 430k units from 450k units and maintained the public-private split at 70:30. Butthe market saw some relief in the Hong Kong property market amid residential salesrecovering slightly on recent relaxation of mortgage policy and developers’ aggressivemarketing of new projects, as well as President Xi praises Macau’s stability during his trip inMacau.
On the macro front, China’s industrial production growth picked up notably to 6.2% year-on-year in the month of November from 4.7% year-on-year in October. Meanwhile,industrial profits rose 5.4% yoy, reversing the decline in October as the market saw somestabilization in the PPI. December’s NBS manufacturing PMI stayed flattish at 50.2,strengthening the case on signs of a potential bottoming of the Chinese economy and aturnaround likelihood. Separately, inflation outlook remains challenging as CPI rose 4.5%yoy on higher pork prices. Elsewhere, in Hong Kong, retail sales volume declined by 26.2%yoy in the month of October on broad-based weakness across the consumer segments,while tourist arrival plummeted 43.7% yoy with hotel occupancy rates dropping to 63%.
Equity Market
7

Equity Market
8
Indonesia
After suffered big blow in November as JCI lost -3.48% MoM, JCI recovered in December. JCIclosed its FY 2019 performance with positive gain of 1.69%. Small-Mid caps stocks,represented by IDXSMCL Index, were the winner with 7.62% gain, underperformed LQ45
Index that only delivered 3.23% gain. Foreign investor brought in IDR 8 Tn (USD 571Mn) in December, after two consecutive months of outflow. At the end of 2019,foreign investor participation recorded negative flow of USD 222 Mn or IDR 3.1 Tn.
Bond market closed FY 2019 with stunning performance. Boosted by 100bps BI rate cut,better macro figures and low inflation, along with global monetary easing trend, bondmarket consistently recorded positive return. The bond yield across the tenor fell down andthe 10-yr benchmark bond yield dropped by around 96 bps to 7.06%. As a result, IndonesiaGovernment Bond Total Return Index gained by 13.9% YoY, marked as one of the best localcurrency bond in Asian Bond Market.
USD/IDR remain stable throughout the year and IDR strengthened 3.6% YoY to go underIDR14,000 level, closed at IDR13,866/USD from last year close of IDR14,390/USD.
Move into 2020, we are turn cautiously optimistic on equity as we see several factorsneeded to be closely monitored. Possible flat GDP growth and more challengingmacro environment needs to be addressed by the government. The progress ongovernment policy to boost domestic economic growth and FDI; with the proposedof Omnibus Law, as well as better global economic growth and stability will defineinvestor confidence to Indonesia.
Having said that, we see investors will continue to positioning more on heavyweightsectors and flow-driven game, which will benefit banking, telco and consumersectors.
Bond market is expected to remain positive, although upside potential might limitedcompared to 2019’s performance. Indonesia’s bond market, compared to other EM,remain attractive, provide higher real return as inflation is expected to remain low.Low interest environment would remain in place to support economic growth.However, despite of those positive catalysts, we are cautiously aware of some risks,include prolonged US-China trade dispute, growing geopolitics tension and higher-than-expected budget deficit which could result to higher bond issuance.

Malaysia
FBMKLCI closed at 1,588 on 31 December 2019, down 6% YoY. The index was the worstperforming index in the region. While regional indices experienced PE multiple expansiondue to better earnings prospects, the FBMKLCI remained at 15.8x-15.9x range in 2019, aderating from an average of 16.4x. The index is now trading at below its mean of 1,625level. Consensus is now expecting low earnings growth of 5%-6% in 2020.
The catalyst for FBMKLCI is now corporate earnings growth which in our opinion could bedelivered by the corporate due to lean operating costs. We expect revenue to be boostedby the increased activities in manufacturing, export, higher crude palm oil (CPO) and crudeoil prices. In addition, the government’s revenue is expected to increase due to highercrude oil and CPO prices. This will help the government in pump priming the economy.Better crude oil and CPO prices will also help domestic consumption.
Malaysia's manufacturing sector is heading into 2020 on a firm footing, with survey data forDecember showing further momentum gains in output and new orders. MalaysiaManufacturing PMI increased to 50 in December 2019 from 49.5 in the previous month.This is the highest reading in 15 months. The latest reading pointed to the first expansion inthe sector since September 2018, as output expanded at the fastest pace since September2018, amid stronger demand. This will help the export and wage growth to improve in2020.
Domestic consumption is also likely to improve as manufacturing and export starts to pickup and CPO and oil prices continue its uptrend or sustain at current level. CPO price hasbeen rising strongly from July 2019, up by almost 70% due to lower inventory and strongdemand from China. We expect the rise in the CPO to help consumption in the rural areas.
Consequently if this boost to economic growth is sustainable, corporate earnings are alsolikely to improve further in 2020. Should the corporate earnings recover, we could expectthe FBMKLCI to trend upwards to around 1,670 which is back to the PE rating of 16.4x.
We are positive on cyclical sectors such as Construction, Plantations, Oil & Gas, Healthcareand Consumer. Neutral on Technology, Banks and Telecommunication. Other key themesthat are likely to feature in 2020 include M&A (possible within the banking and telecomssectors), tourism (on the back of Visit Malaysia Year 2020) and GLC restructuring (returningcapital to shareholders).
Equity Market
9

Credit Market
10
Global Bond Market
U.S. Treasuries and G10 Bonds
Overall over 2019, US Treasury yields rallied by ~70bps over the year as the Fed embarkedon a reversal of the 1% tightening in 2018 with 75bps total of rate cuts in 2019. US ChinaTrade tensions dominated most of the year but ended on a positive note as optimismtowards the signing of “Phase 1” cause Developed market bonds to pare some gains. TheFederal Open Market Committee (“FOMC”) held rates unchanged in the last meeting of theyear on 11 December 2019, the minutes showed a committee that is united around theidea of keeping rates on hold barring a “material reassessment of the outlook.” Only “afew” worried about the risks of leaving rates low while participants “generally expressedconcerns regarding inflation continuing to fall short of 2 percent.” The next FOMC meetingis scheduled for January 28-29, where a fresh voting committee will address any potentialaction for monetary policy. With the cancelation of the December 15 tariffs, moreparticipants are now split between a hold and a 25bp rate cut for 2020, as growth remainsnear potential and core inflation remains just below 2%. Global headwinds to growth arethe dominant driving factor for fixed income markets, with trade tension concerns, weakerglobal growth and tightening financial conditions being a present risk.
On US economics, the Institute of Supply Management (“ISM”) Manufacturing Index forDecember 2019 remains in contractionary territory at 47.2, due to contracting demand(seen since July) likely premised on poor global trade and the 5th consecutive month ofcontraction. Nonfarm Payrolls (“NFP”) in the United States released for November 2019showed 266k new jobs created, much higher than market expectations and much betterthan the previous 128k in October. Average Hourly Earnings for October increased by 3.1%YoY (+0.2%MoM), within consensus estimates. Unemployment Rate registered at 3.5%YoYfor November 2019. On inflation, the United States Personal Consumption Expenditure(“PCE”), the Fed’s preferred measure of inflation, rose 1.60% YoY for November 2019,unchanged from October 2019 reading, and still below the Fed’s 2% target. US October2019 trade deficit (exp. $49 Bio) narrowed slightly less than expectations, at $47.2Bio.
At the end of December 2019 close, the benchmark 2-, 5-, 10- and 30-year UST were lasttraded at 1.57% (November-2019: 1.61% -4bps), 1.69% (1.63%; +6bps), 1.92% (1.78%;+26bps) and 2.39% (2.21%; +18bps) respectively. Overall, 10y UST yields have rallied 76bpsin 2019, capping off a stellar year for fixed income markets with Investment Grade indicesshowing a 17% YTD return

Credit Market
11
Ringgit Sovereign Bond
On the local rates, both Malaysia’s sovereign papers ie; Malaysia Government Securities(“MGS”) and Government Investment Issues (“GII”) yield curve flattened during the firsthalf of the month as the 5-year yield rose 6 bps and the 10-year was flat at around 3.42% to3.45% level. Local government bonds were less affected by news of a US-China phase onetrade deal in comparison to the Ringgit as USD/MYR fell to around 4.14 from 4.16 at thestart of the month. Towards the end of the month, the yield from the belly to the longertenor of the curve lifted positively as buying interest resurfaced despite quiet trading dayswhile MYR closed the year stronger at around 4.09. Overall, the MGS and GII yield remainsupported as investors repositioned themselves ahead of holidays and year end withanticipation of seasonally strong first quarter for domestic bond market ahead. In addition,the yields were generally supported after Bank Negara Malaysia (“BNM”) released theauction calendar for 2020 suggested positive reaction from investors.
BNM has announced the auction calendar for 2020 with reopening auctions to dominatenext year. This is a major shift in auction landscape and is a positive catalyst for the localgovernment bond space as this will further enhance liquidity of the existing issuances ofMGS and GII. We see this as an additional step taken by BNM toward improving bondliquidity in mind ahead of the FTSE Russell’s decision in March 2020. With mostbenchmarks to be reopened from the existing bonds ie; only 4 new issues in 2020compared to 12 new issues in 2019, this will certainly help enhance the liquidity of off-therun bonds and increase the average tranche size which will complement an extended rolefor principal dealers to quote all off-the run bonds. Collectively, gross issuances of MGS andGII in 2020 forecasted at around MYR115 billion is to be issued via the domestic bondmarket after taking into account the second tranche of Samurai bonds which expected tobe issued in 2020. On balance, we expect demand and supply dynamics to remain healthyas combined MGS and GII maturities of around MYR70.7 billion to return as reinvestmentflows. On the other hand, net issuances of MGS and GII remain manageable at aboutMYR45 billion which will have an overall neutral impact from a net supply perspective.
Month-on-month, MGS yields bull-steepened with 10-year supported towards the end ofthe month and grinded 12 bps lower while 30-year saw upward trend in yields by 15 bps.The 3-, 5-, 7-, 10-, 15-, 20- and 30-year MGS closed the month at 3.00% (November-2019:3.04%), 3.18% (3.18%), 3.30% (3.33%), 3.30% (3.43%), 3.59% (3.68%), 3.70% (3.76%) and4.10% (3.94%) respectively. On the other hand, action on the GII – the Shariah compliantversion of MGS, was looking more stable with yields seen more defensive and holding wellacross the tenors during the period. At month end, the 3-, 5-, 7-, 10-, 15-, 20- and 30-yearGII were reported at 3.06% (November-2019: 3.13%), 3.19% (3.26%), 3.30% (3.38%), 3.42%(3.50%), 3.72% (3.78%), 3.82% (3.89%) and 4.06% (4.11%) respectively.

Credit Market
12
On the local economic front, Malaysia’s Consumer Prices Index (“CPI”) report for November2019 came out subdued at 0.9% compared to a reading of 1.1% in the prior month.However, on a year-on-year basis, the CPI index has increased in November 2019 to 122.1against 121.0 in the same month of preceding year. The increase in the overall index wasdriven by the index of Miscellaneous Goods & Services (2.5%), Housing, Water, Electricity,Gas & Other Fuels (1.7%), Education (1.6%), Food & Non-Alcoholic Beverages (1.5%),Communication (1.5%) and Furnishings, Household Equipment & Routine HouseholdMaintenance (1.5%). On a monthly basis, CPI rose 0.1% as compared to October 2019. Itwas mainly supported by the index of Housing, Water, Electricity and Gas (0.4%),Miscellaneous Goods & Services (0.4%) and Health (0.2%). Meanwhile, the CPI for theperiod of January 2019 to November 2019 registered an increase of 0.7% as compared tothe same period last year. Forecasted 2019 inflation is expected to be lower at around 0.7%to 1.0% which is in line with Bank Negara Malaysia (“BNM”) projection of 0.7% to1.7%.Nevertheless, inflation is expected to rise from January 2020 due to the targeted fuelsubsidy implementation that corresponded to the official inflation forecast of 2% next year.Nevertheless, the execution risk remains a concern as recent announcement byGovernment to postpone the targeted fuel subsidy will further derailed 2020 inflationforecast.
In other economic data, Malaysia’s Industrial Production Index (“IPI”) rose by 0.3% year-on-year in October 2019, slowing from 1.7% gain in the previous month. This was the weakestyearly increase in industrial output since a decline in December 2015 as manufacturingoutput growth slowed to 2.2% from 2.5% recorded in September 2019 mainly due totransport equipment and other manufactures (4.3 percent), non-metallic mineral products,basic metal & fabricated metal products (3.1%) and electrical and electronic products(2.4%). In addition, electricity production increased much less (0.5% vs 4.1%). At the sametime, mining output declined faster (-5.8% vs -1.6%), led by crude oil and condensate index(-5.1%) and natural gas (-6.3%). On a monthly basis industrial output fell by 1% in October,after a 0.3% drop in September 2019. Industrial Production in Malaysia averaged 2.42%from 2007 until 2019, reaching an all-time high of 12.80% in March of 2010 and a recordlow of -17.60% in January of 2009. With slower growth in IPI, expectation is for weakergrowth in 4Q19 as the data remain soft and maintained 4.5%-4.6% forecast for full year of2019.

Credit Market
13
Ringgit Corporate Bond
In the Malaysian Ringgit corporate bond/sukuk space, overall monthly trading volumeswere surprisingly higher compared to previous month despite being a seasonally illiquidmonth going into year-end. As a result of recent upward movement in yields, investors seento be selectively buying and switching for next year positioning, given further support tothe corporate bond yields. Overall secondary corporates trading volume recordedMYR11.05 billion, improved significantly compared to MYR8.25 billion recorded in previousmonth. The average daily volume recorded higher to approximately MYR526 million inDecember 2019, compared to MYR393 average daily volume recorded in correspondingmonth. Overall during the month, a combination of Government Guaranteed (“GG”) andAAA space top the transaction activities at 69% followed by AA space by 25% and single-Aor lower by 6%.
Within the Government Guaranteed (“GG”)/AAA space, Danainfra Nasional Berhad top thetransaction volume with MYR1.63 billion recorded across the tenors which saw the yieldclosed more than 5 bps lower month-over-month especially on the longer-tenor maturity(more than 15-year). Lembaga Pembiayaan Perumahan Sektor Awam (“LPPSA”) recordedthe second highest transaction volume in GG category with MYR1.55 billion changing handsacross the tenors. On average, the yield closed 8 bps downwards compared to the priormonth with 15-year to 20-year bucket saw higher demand. In AAA space, Sarawak Hidrosuccessfully garnered secondary market interest with MYR790 million transaction volumesfor an average moved of 4 bps lower up to 10-year tenor. Elsewhere in AA-rated space, YTLPower International Berhad (“YTLP”) top the trading activities with MYR240 milliontransacted across the tenor with yield averagely lower by 3 bps. In A-rated space, AffinBank Berhad paper of both the perpetual and sub-ordinated attracted some MYR180million transaction activity during the month. The yields transacted tighter by 1 bps.
In the primary issuance space, total issuances in December 2019 have been stable asissuers tapped the market before year-end at favourable financing rate, raising a total issuesize of MYR7.6 billion compared to MYR6.5 billion issued in previous month. DRB HicomBerhad rated A+/positive by MARC, raised a total of MYR1.3 billion from its 3-year, 5-year,7-year and 10-year Sukuk at 4.15%, 4.55%, 4.85% and 5.10% respectively. On the othernote, MBSB Bank Berhad which rated A3 by RAM, raised MYR1.3 billion from its MYR10billion Sukuk Programme. In its maiden debut, the bank successfully garnered stronginvestor interest from its two-tranche issuance; MYR650 million each of non-callable 5-yearand non-callable 7-year at 5.05% and 5.25% respectively. Finally, Penang Port Sdn Bhdcapitalised its MYR1 billion Islamic Medium Term Notes Programme by issuing three-tranche issuance of 7-year (MYR200 million), 10-year (MYR300 million) and 15-year(MYR500 million) with final yield of 4.30%, 4.48% and 4.68% respectively.

Credit Market
14
Outlook & Strategy
The rally we saw in US Treasury bonds throughout 2019 year due to prolonged tradetensions gradually escalating between 2 of the world’s major economies have capped off astellar year for fixed income. For the global strategy this year, we are sceptical on muchupside for global growth but expect stabilisation at these levels after a turbulent 2019, withinflation to remain largely stagnant throughout 2020. Monetary policy is likely to remainaccommodative across both Developed Market and Emerging Market economies with littlechance of monetary tightening.
The expectations are for 1 more 25bps rate cut from the Fed and the Reserve Bank ofAustralia by 1H 2020. Other DM central banks to remain on hold with BOE at 0.75%, ECB at-0.5% Depo rate and BOJ at -0.10%. EM central banks generally to remain on hold with aslight dovish bias as growth stalls, our expectations are for Asia central banks to be on holdexcept for Bank Negara Malaysia and Bank Indonesia, where we expect another 25 bps cutin 2020. We continue to expect an increased possibility of more active fiscal stimulus orsome form of Quantitative Easing (“QE”) in the major economies to stimulate growth.
There are a few downside risks to look out for – Brexit , Trump impeachment risk, USElections, continuity of Phase 2 and further trade agreement to name a few, which willcontinue to keep bond yields depressed until a clear resolution is seen. The recent macrodevelopments have created a favourable backdrop for hard currency credit. But given thestrong performance so far in 2019, the market would start to see greater differentiation incredit risk pricing going forward and credit selection remains key to outperformance Anymajor risk off events could potentially lead to ‘flight to quality’ trades that benefit U.S.Treasuries, leading to even lower US yields and overall lower corporate bond prices asinvestors search for yield. A key risk factor for fixed income currently is a sooner thanexpected successful trade deal and/or rollback of tariffs which market will interpretpositively, and given major central banks on an easing path it may spur a "risk on"sentiment in the global markets and a sell-off in UST yields.
In Malaysia, the last scheduled Monetary Policy Committee (“MPC”) meeting going into2020 was explicit in recognizing global downside risks while on the domestic frontreiterated that the growth pace should sustain going into 2020 alongside support fromBudget 2020 measures. However, the baseline projections are still subject to downsiderisks from policy uncertainties and commodity related shocks. Three days after the MPC,BNM in a surprise move has announced the reduction in the Statutory ReserveRequirement (“SRR”) ratio by 50 bps to 3.00%.

Credit Market
15
According to BNM, the decision to lower the SRR was to maintain sufficient liquidity in thedomestic financial system and to facilitate effective liquidity management by bankinginstitutions. While it was emphasized that reducing SRR is not a signal on the monetarypolicy stance, the release of liquidity (estimated at around MYR7.5 billion) into the bankingsystem is still a bond positive move and this may be seen as a precursor to an OPR cut. Atthis juncture, consensus view according to a Bloomberg survey are penciling a prospect ofanother 25 bps cut as early as the 1st Quarter of 2020 although the timing could bebrought forward or delayed depending on the US-China trade outcome which could weighon the 4.8% growth forecast for 2020. Nonetheless, we think BNM could afford to wait untilsuch time the data disappoints sufficiently to put the optimistic growth forecast at risk. Interms of the inflation outlook, CPI is expected to average at 2.0% in 2020, higher comparedto 0.9% in 2019 broadly on targeted fuel subsidy implementation. Having said that, recentannouncement by Government to delay implementation of targeted fuel subsidyprogramme will definitely have an impact on the inflation forecast in our view.Nevertheless, the inflation outlook for Malaysia is still manageable as real interest ratesremain in positive territory versus the current Overnight Policy Rate (“OPR”) level of 3.00%.
In the MYR fixed income market, we sense that local factors are still looking supportivegiven the easing bias towards monetary policy, a neutral supply profile and resilientdomestic demand for bonds given surplus liquidity in the domestic space. With 1st Quarterusually a seasonally strong quarter for domestic bond market, we think the curve will besupportive particularly if there is an explicit dovish shift in the MPC language and OPR cutmaterialises during the period on the back of slower economic activities and optimisticgrowth forecast. Nonetheless, we remain vigilant on external factors as the Fed’s mid-cycleeasing could prolong US expansion mode while the US-China partial deal may revive globalgrowth outlook hence may pose upside risk to yields. Additionally, the upcoming decisionof FTSE Russell index may result in additional volatility to the market, and hence will also beanother risk factor to eye by 1Q2020. These uncertainties may present buyingopportunities given surplus liquidity in the local bond market will eventually be supportiveand limit the upward pressure on yields. With these views, we remain positioned tocapture opportunities to actively trade in the government securities space as volatility isexpected to present value from a risk-reward perspective. In the corporate space, we willremain selectively invested and participate in the primary issuances where yield premiumis compensated. In summary, we will maintain our active management strategy where wewill be deploying cash into undervalued government bonds and selective credits where weare comfortable at with higher secondary trading prospect and liquidity potential for theflexibility of the portfolios.

16
Commodity MarketOil
During the last quarter of the year 2019, crude oil prices recovered amidst tensions in theMiddle East region, especially after Saudi Arabia’s attack and the US deploying troops in theregion. Further recovery was supported by lower crude inventory reported as suppliestightened and rise in stock draws. In December 2019, OPEC and its allies sealed a long-termpact that ensures coordination on oil production and the positive development on the tradewar front resulted in oil price surging further. In the extended pact, OPEC+ announced anadditional cut of 0.5 million barrels per day (mbpd) to 1.7mbpd from 1.2mbpd. The morepositive announcement came from Saudi Arabia which committed an additional 0.4MMbls/dsubject to other countries reaching full compliance.
Going into 2020, oil prices further surged in the first week of the year on intensified fears ofconflict in the Middle East post US airstrike that killed top Iranian general Qassem Soleimani inIraq. The risk of unrest and proxy conflict has increased particularly in the Persian Gulf,potentially impacting oil production. Fear of retaliation by Iran further exacerbated oil prices,but has since seen the market taking on a softer stance as both countries try to shift toward amore measured, diplomatic course in resolving the issue. Going forward, sustainability of oilprices at current levels is still very much dependent on potential improvement in demandcondition, US producer discipline, as well as IMO benefits. Hence, we continue to remainwatchful of these key factors that may affect oil prices.
Source: Bloomberg. 9 January 2020
Brent ($/bbl)

17
Commodity Market
Copper
In line with poor activity data in China and deepening industrial recessions in several largeeconomies, physical metals demand has weakened further. In addition to cyclical factors,China’s copper demand has been restrained by poor performance in the grid, property andtransportation sectors. We expect to see grid investment picking up strongly, but the impacton demand may not be felt before 1Q20. As a result, copper’s demand may contract this yearbefore rebounding slightly in 2020. However, given that we may see a contraction on thesupply side, the S/D dynamics should favor prices given that market will more likely to be in adeficit.
Source: Bloomberg. 10 January 2020
Gold
Gold began 4Q19 on the back foot, trending lower through 2H September following ahawkish 25 bps Fed cut amid strong USD headwinds. On the flipside, the notable weakmanufacturing and services ISM data show that the slowdown in global trade is starting tobite the US economy and we believe this will support the gold inflows and subsequentlyprices. Price looks stretched but investors and governments will likely buy into the dips amidthe concerns flagged earlier. The rolling over of leading US activity indicators and globalgrowth downgrades will reduce risk appetite, put rich equity valuations and tight creditspreads at risk and strongly position gold as a good portfolio hedge.
Source: Bloomberg. 10 January 2020

Disclosure & Disclaimer
This report has been prepared by RHB Asset Management Ltd (“RAM”) and is being disseminated by RHB Bank Berhad (“RHBBank”) solely to its Premier Banking clients in Malaysia (“Addressees”) for information purposes only. The information and/orviews contained herein are based on available data believed to be reliable at the time of writing and is on an "As Is" basis. RAMand RHB Bank do not make any representation or warranty, express or implied, as to the accuracy, completeness or timelinessof information and/or data. No part of this report is to be construed as an offer or solicitation of an offer to transact anysecurities or financial instruments whether referred to herein or otherwise. This report is general in nature and any commentaryand/or views on market outlook contained in this report does not have regard to the specific investment objectives, financialsituation and particular needs of any specific Addressee. This report is therefore not to be taken in substitution for the exerciseof judgment by the Addressees, who should obtain separate legal or financial advice or consult their banker, lawyer, stockbroker or an independent adviser to independently evaluate any particular investment and strategies. The Addressee is solelyresponsible for all investment decisions made by him/her. Past performance is not a guarantee of any future results.
RAM and RHB Bank accept no liability whatsoever for the actions of third parties in this respect.
All Rights Reserved. This report is for the use of intended recipients only and may not be reproduced, disseminated or publishedfor any purpose without prior consent in writing of RAM and RHB Bank.
This report is disseminated in Malaysia by RHB Bank Berhad (6171-M) of Level 9, Tower One, RHB Centre, Jalan Tun Razak,50400 Kuala Lumpur.
18