economic highlights 12-16-09-for web2
TRANSCRIPT

December 16, 2009
Manufacturing
Industrial Production and Capacity Utilization 1
Business Inventories 2
International Trade
U.S. International Trade 3
Trade Values with NAFTA, non-oil commodities 4
Growth of U.S. Vehicle Trade with NAFTA 4
Prices
Finished Goods Producer Price Index 5
Consumer Price Index 6
Real Estate
U.S. Home Starts 7
U.S. Single-Family Home Construction 7
Southeast Home Sales 8
Southeast Buyer Traffic 9
Consumer Spending
Retail Sales 10
Reuters/University of Michigan Consumer Sentiment Index 11
Transportation
Transportation Freight Trends 12
Growth of Total and Selective Industry Rail Carloadings 12
Economic Highlights
Economic Highlights December 16, 2009 1
Manufacturing
Summary
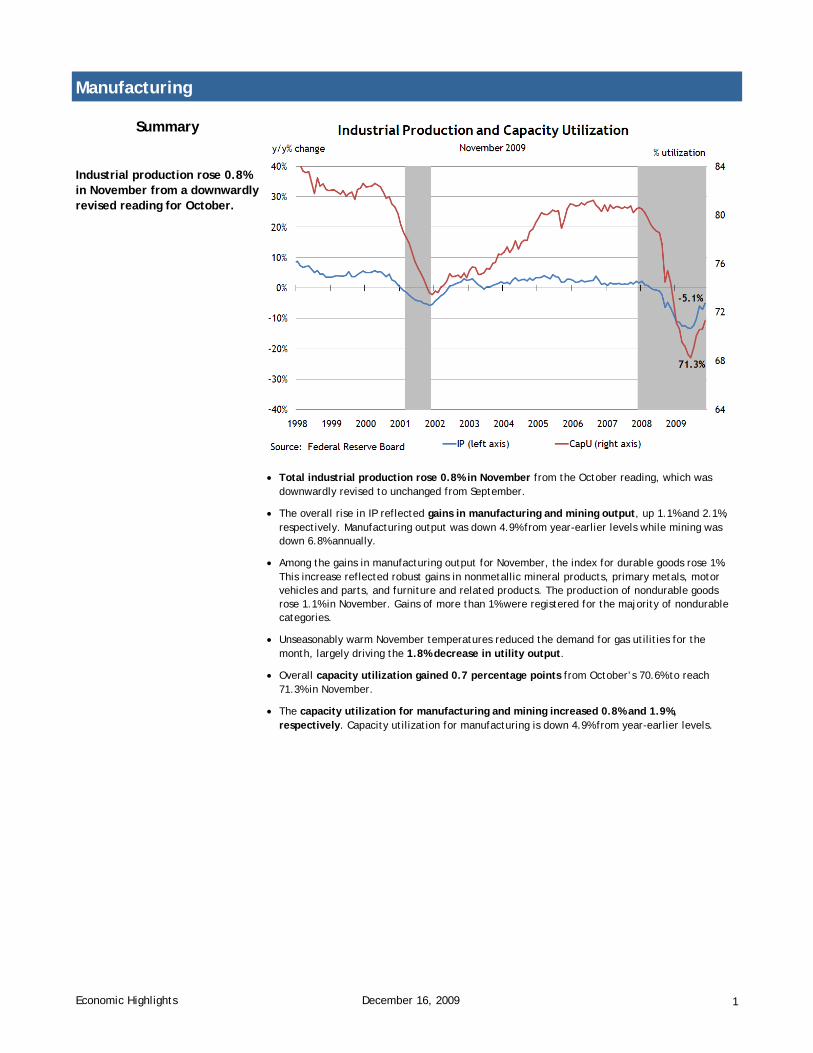
Industrial production rose 0.8% in November from a downwardly revised reading for October.
• Total industrial production rose 0.8% in November from the October reading, which was downwardly revised to unchanged from September.
• The overall rise in IP reflected gains in manufacturing and mining output, up 1.1% and 2.1%, respectively. Manufacturing output was down 4.9% from year-earlier levels while mining was down 6.8% annually.
• Among the gains in manufacturing output for November, the index for durable goods rose 1%. This increase reflected robust gains in nonmetallic mineral products, primary metals, motor vehicles and parts, and furniture and related products. The production of nondurable goods rose 1.1% in November. Gains of more than 1% were registered for the majority of nondurable categories.
• Unseasonably warm November temperatures reduced the demand for gas utilities for the month, largely driving the 1.8% decrease in utility output.
• Overall capacity utilization gained 0.7 percentage points from October’s 70.6% to reach 71.3% in November.
• The capacity utilization for manufacturing and mining increased 0.8% and 1.9%, respectively. Capacity utilization for manufacturing is down 4.9% from year-earlier levels.

Economic Highlights December 16, 2009 2
Manufacturing
Summary
Total business inventories increased 0.2% in October. Increases were seen across all categories on a monthly basis.
• In October, total business inventories increased at a monthly rate of 0.2% after September’s 0.4% decrease. Annually, total business inventories were down 8.2%.
• Manufacturing inventories posted a modest gain of 0.4% in October but were still down 11.2% from year-earlier levels.

Economic Highlights December 16, 2009 3
International Trade
Summary
U.S. nominal international trade narrowed unexpectedly in October to $32.9 billion.
• The nominal trade deficit narrowed surprisingly in October to $32.9 billion. The Bloomberg consensus expected an increase in the deficit to $37 billion. Continued solid and broad-based growth in exports and declines in price and volume of imported petroleum contributed to the narrowing of the deficit. Outside of petroleum and “other goods” category, major import categories increased in October.
• In real terms, the merchandise deficit also declined as exports rose a considerable 4.1%, while imports remained essentially unchanged.
• Sustained broad-based growth in exports over the past several months is generally in line with the ongoing improvement in economic outlook for U.S. major trading partners. Still, compared to a year earlier, U.S. exports were down 10% in October. Meanwhile, U.S. imports are recovering more slowly and were 19% below the year-earlier level.

Economic Highlights December 16, 2009 4
International Trade
Summary
The non-oil U.S. trade gap with NAFTA member countries shrank in 2009, led by a dramatic fall in imports of motor vehicles and other goods.
The recent pickup in vehicle production in North America has gradually improved the pace of U.S. vehicle exports and imports with NAFTA member countries.
• Through October 2009, the value of U.S. vehicle exports and imports with NAFTA member countries were 77% and 49%, respectively, of total global motor vehicle shipments.
• By October 2009, U.S. exports and imports with NAFTA member countries declined only 7% and 9%, respectively, from a year earlier, contrasting with double-digit drops posted in early 2009.
• Through October 2009, total U.S trade with NAFTA member countries, Canada and Mexico, were about 22% of U.S. total trade. Excluding oil, U.S. exports and imports with NAFTA were 31% and 24%, respectively, of total U.S. shipments worldwide.
• The U.S.-NAFTA trade gap, excluding oil commodities, shrank sharply in earlier months and turned positive between June and September 2009.

Economic Highlights December 16, 2009 5
Prices
Summary
Rising energy prices boosted headline producer price inflation at all stages of processing in November.
• The headline producer price index (PPI) for finished goods rose 1.8% month over month in November after rising 0.3% in October. About three-fourths of the November increase was due to higher prices for energy goods, according to the Bureau of Labor Statistics. The energy index jumped 6.9% in November (mostly because of a surge in gasoline prices), and the index for finished foods advanced 0.5%. Headline PPI is up 2.4% year over year.
• Core (less food and energy) PPI for finished goods increased 0.5% month over month in November—the largest monthly gain in more than a year. The gain was led by a 4.2% rise in the index for light motor trucks. The index for finished core PPI is up 1.2% year over year.
• Energy prices also accounted for much of the increases in intermediate and crude goods prices in November.
• Core crude goods prices declined in November for the first time since February 2009.
Economic Highlights December 16, 2009 6
Prices
Summary
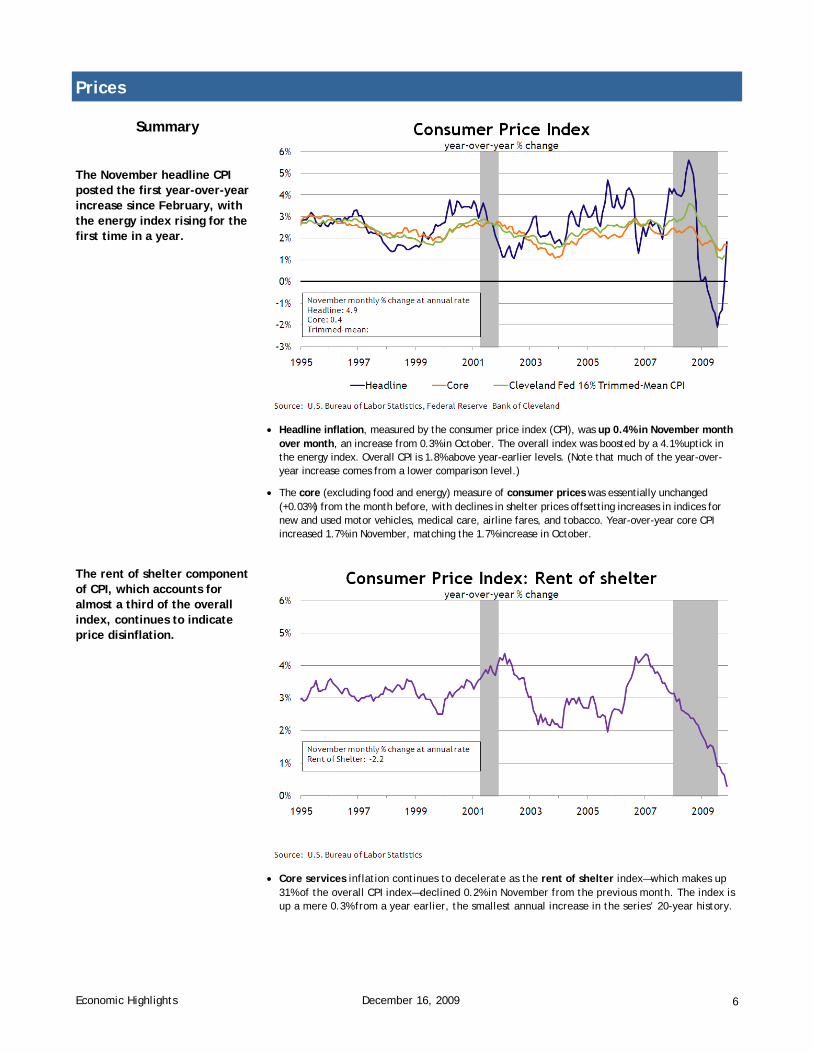
The November headline CPI posted the first year-over-year increase since February, with the energy index rising for the first time in a year.
• Headline inflation, measured by the consumer price index (CPI), was up 0.4% in November month over month, an increase from 0.3% in October. The overall index was boosted by a 4.1% uptick in the energy index. Overall CPI is 1.8% above year-earlier levels. (Note that much of the year-over-year increase comes from a lower comparison level.)
• The core (excluding food and energy) measure of consumer prices was essentially unchanged (+0.03%) from the month before, with declines in shelter prices offsetting increases in indices for new and used motor vehicles, medical care, airline fares, and tobacco. Year-over-year core CPI increased 1.7% in November, matching the 1.7% increase in October.
• Core services inflation continues to decelerate as the rent of shelter index—which makes up 31% of the overall CPI index—declined 0.2% in November from the previous month. The index is up a mere 0.3% from a year earlier, the smallest annual increase in the series’ 20-year history.
The rent of shelter component of CPI, which accounts for almost a third of the overall index, continues to indicate price disinflation.

Economic Highlights December 16, 2009 7
Summary
U.S. home starts improved in November following a sharp decline the prior month. Total starts increased 8.9% from October while single-family starts increased a more modest 2.1%.
In November, for the first time since early 2006, single-family starts and permits exceeded year-earlier levels.
Real Estate
Source: U.S. Census Bureau
Permits
Starts
Completions
November starts, SAAR
Total 574K -12.4% y/y 8.9% m/m
Single-family 482K 5.5% y/y 2.1% m/m
Multifamily 92K -53.4% y/y 67.3% m/m
November permits, SAAR Total 584K -7.3% y/y 6.0% m/m
Single-family 473K 12.1% y/y 5.3% m/m
Multifamily 111K -46.6% y/y 8.8% m/m
Source: U.S. Census Bureau

Economic Highlights December 16, 2009 8
Real Estate
Summary
November home sales continued to strengthen, according to our survey of Southeastern Realtors, while homebuilders indicated that sales weakened.
Note: The housing survey’s diffusion indexes are calculated as the percentage of total respondents reporting increases minus the percentage reporting declines. Positive values in the index indicate increased activity while negative values indicate decreased activity.
Inventories for new and existing unsold homes continued to decline in November. None of the Southeast Realtors surveyed reported an increase in unsold home inventory on a year-over-year basis, resulting in a sharp decline in the diffusion index.
Note: November survey results are based on responses from 73 Realtors and 41 homebuilders.
• Reports from Florida Realtors indicated that home sales softened somewhat in November but remained above the year-earlier level. Georgia contacts reported improvements but sales remained below the year-earlier levels. In the remainder of the Southeast, most Realtors reported that sales held steady above the year-earlier level.
• Florida and Georgia homebuilders indicated a sharp decline in new home sales during Novem-ber; more than half reported that sales declined year over year in November. Elsewhere in the Southeast, builders indicated that new home sales were similar to year-earlier levels.
• Contacts continued to note that sales were restrained by economic uncertainty. Many speculated that potential buyers are unwilling to act because of continuing job losses.

Economic Highlights December 16, 2009 9
Real Estate
Summary
Southeastern Realtors continued to experience stronger buyer traffic during November while homebuilders reported that traffic weakened further.
The outlook for sales over the next several months among Southeastern contacts improved.
Note: The November survey period was December 1-9.
• Many Realtors expressed that the extension and broadening of the housing stimulus package should continue to boost home sales.
• Builders continued to report that it remained difficult to compete with foreclosed (REO) homes and lots.

Economic Highlights December 16, 2009 10
Summary
Total retail sales experienced positive growth on a yearly basis in November for the first time since August of last year.
Retails sales came in much stronger than analysts’ projections.
• Retail sales came in strong in November, increasing 1.4% from October; Bloomberg's market consensus expectation was an increase of 0.7%. On a year-over-year basis, total retail sales are up 1.9%, the highest level since June 2008.
• From October to November, retail sales excluding autos increased 1.2%, and core retail sales increased 0.5%. On a year-over-year basis, retail sales excluding autos and core retail sales (total excluding gas, autos, and building supplies) were up 1.3% and 1.2%, respectively, from November 2008.
• The increase in retail sales was led by the strong increase in gasoline stations. Apparel and home furniture were the only components to experience declines from October to November; this decline is in line with retailer’s tepid holiday sales reports, particularly with regards to apparel.
Consumer Spending
Gains in November were dispersed across all components apart from apparel and furniture stores, which declined modestly from October.
‐15%
‐10%
‐5%
0%
5%
10%
15%
1993 1994 1995 1996 1997 1998 1999 2000 2001 2002 2003 2004 2005 2006 2007 2008 2009
Retail SalesYear‐over‐Year % Change
Total Retail Sales, Nov 09 = 1.9%
Core Retail Sales (ex auto, gas & bldg materials), Nov 09 = 1.2%
Retail Sales ex Autos, Nov 09 = 1.3%
Furniture & Home Furnishing Stores -0.75%
Clothing & Accessory Stores, -0.66%
Health & Personal Care Stores, 0.30%
Food Services & Drinking Places, 0.46%
Food & Beverage Stores, 0.96%
Total, 1.29%
Building Materials, Garden Equipment & Supply Dealers,
1.47%
Motor Vehicle & Parts Dealers, 1.58%
Electronics & Appliance Stores, 2.77%
Gasoline Stations, 6.02%
-8% -6% -4% -2% 0% 2% 4% 6% 8% 10%
U.S. Retail Sales ComponentsMonth to Month % Change
November 2009
Source: U.S. Census Bureau
Source: U.S. Census Bureau

Economic Highlights December 16, 2009 11
Summary
The Reuters/University of Michigan Consumer Sentiment Index increased in December.
• In December the Reuters/University of Michigan Consumer Sentiment Index increased from 67.4 points to 73.4, surpassing analysts’ expectations of 69. Current economic conditions surged 10.3 points to 79.1, and consumer expectations rose 3.2 points to 69.7.
• The Reuters/University if Michigan index is now approximately 18 points above its cyclical low.
• The median one-year-ahead expected inflation rate declined sharply from 2.7% to 2.1% from November to December, while the median five-to-ten year outlook decreased from 3% to 2.6%. The five-to-ten-year inflation expectations have not been below 2.6% since September 2002.
Consumer Spending
0
20
40
60
80
100
120
140
1978 1980 1982 1984 1986 1988 1990 1992 1994 1996 1998 2000 2002 2004 2006 2008
Reuters/University of Michigan Consumer Sentiment Index1966Q1= 100
Consumer Sentiment, Dec 09 = 73.4 Current Economic Conditions, Dec 09= 79.1 Consumer Expectations, Dec 09 = 69.7
Source: Reuters/University of Michigan
0
1
2
3
4
5
6
1990 1991 1992 1993 1994 1995 1996 1997 1998 1999 2000 2001 2002 2003 2004 2005 2006 2007 2008 2009
University of Michigan: Median Inflation Expectations
1 year ahead, Dec 09 = 2.1 5 to 10 years ahead, Dec 09 = 2.6Source: Reuters/University of MichiganSource: Reuters/University of Michigan
Percent

Economic Highlights December 16, 2009 12
Transportation
Summary
Year-over-year declines in freight indicators continued to moderate through November 2009.
Railroad shipments through early December continued to post steady improvements.
• The Association of American Railroads reported that total rail shipments through early December were off 5% from 2008 levels, an improvement from double-digit declines reported in previous weeks.
• Three key rail industry shipments—autos, chemicals, and metals—posted gains in recent weeks, suggesting that the worst in the decline of industrial shipments may be over. However, construction-related shipments, such as stone and gravel and lumber, continued to post declines during November and early December from comparable weeks in 2008.
• Both the ATA (truck only) and the Cass Freight indexes (a wider range of shipping companies) posted single-digit year-over– year declines in October and November, contrasting with their double-digit drops in early 2009.
• Transportation contacts speculated that the latest readings reflect an economic recovery that is still trying to gain balance but is on more solid ground than in earlier months.