economic & financial market outlook - idob · economic & financial market outlook ......
TRANSCRIPT

Economic & Financial Market Outlook
WELLS CAPITAL MANAGEMENT
James W. Paulsen, Ph.D. Chief Investment Strategist
2WELLS CAPITAL MANAGEMENT
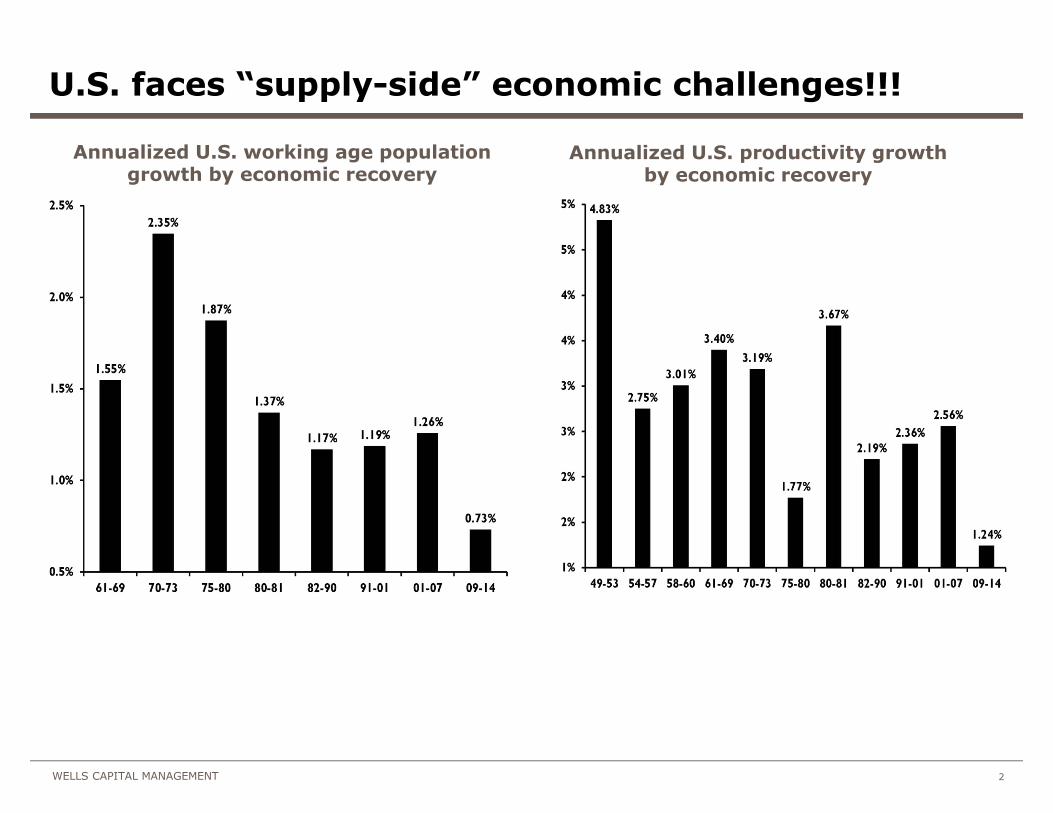
U.S. faces “supply-side” economic challenges!!!
Annualized U.S. working age population growth by economic recovery
Annualized U.S. productivity growth by economic recovery

3WELLS CAPITAL MANAGEMENT
Demand-side policies for supply-side problems!?!
Annualized U.S. real GDP growth vs. U.S. supply growth
by economic recovery

4WELLS CAPITAL MANAGEMENT
U.S. productivity needs to be rescued!?!
Detrended U.S. Productivity Index**Percent by which U.S. productivity index is above or below its post-war trend line average
5WELLS CAPITAL MANAGEMENT
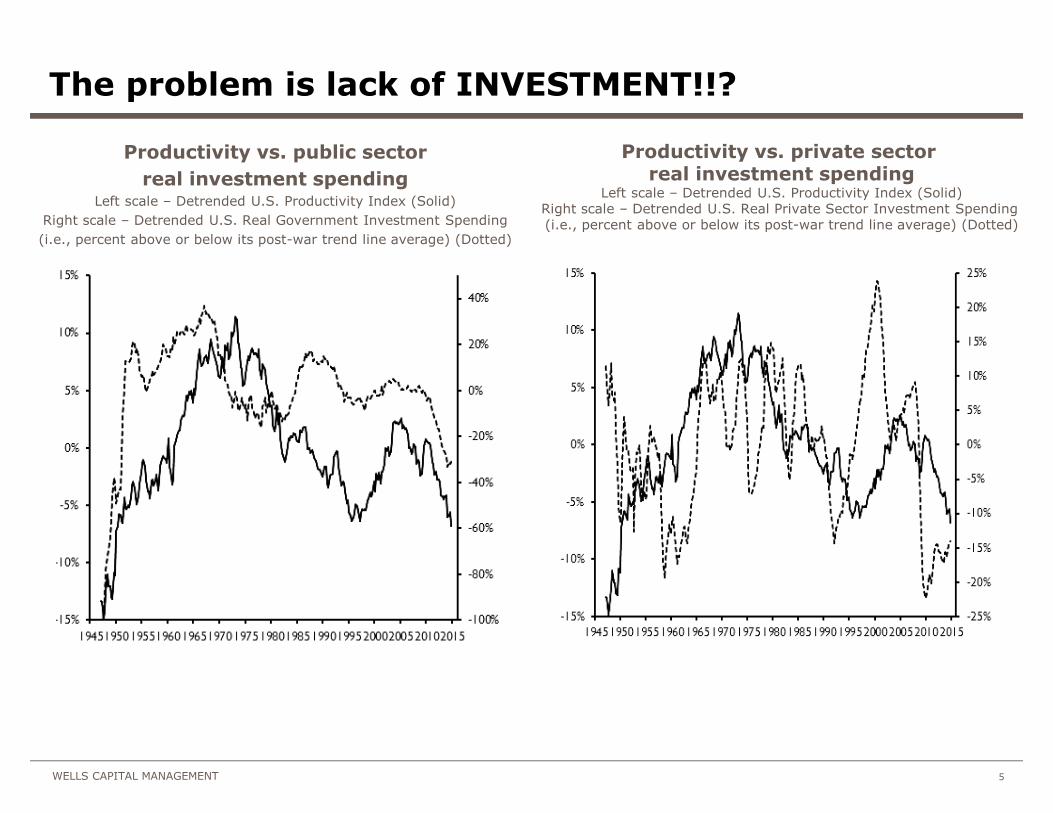
The problem is lack of INVESTMENT!!?
Productivity vs. public sector
real investment spending Left scale – Detrended U.S. Productivity Index (Solid)
Right scale – Detrended U.S. Real Government Investment Spending
(i.e., percent above or below its post-war trend line average) (Dotted)
Productivity vs. private sector real investment spending
Left scale – Detrended U.S. Productivity Index (Solid)Right scale – Detrended U.S. Real Private Sector Investment Spending (i.e., percent above or below its post-war trend line average) (Dotted)

6WELLS CAPITAL MANAGEMENT
Ample capability to drive investment!!?
Public sector investment spending as a percent of real GDP
U.S. corporate net cash flow as a percent of nominal GDP

7WELLS CAPITAL MANAGEMENT
Demand-led recovery???
U.S. demand/supply ratio

8WELLS CAPITAL MANAGEMENT
Adjusting to a demand-led economy???
U.S. demand/supply ratio
S&P 500 Composite Stock Price Index U.S. 10-year Treasury bond yield

9WELLS CAPITAL MANAGEMENT
U.S. growth sustaining near 2.75%!!
Annual U.S. real GDP growth 4-Quarter Moving Average
10WELLS CAPITAL MANAGEMENT
Five forces for U.S. growth!!!
Finally … some credit creation
Better household world
Capital spending cycle still coming
Housing starts rise another 50%
Better growth abroad

11WELLS CAPITAL MANAGEMENT
Synchronized global policy accommodation!!?
WTI crude oil spot price U.S. 10-year Treasury bond yield
12WELLS CAPITAL MANAGEMENT
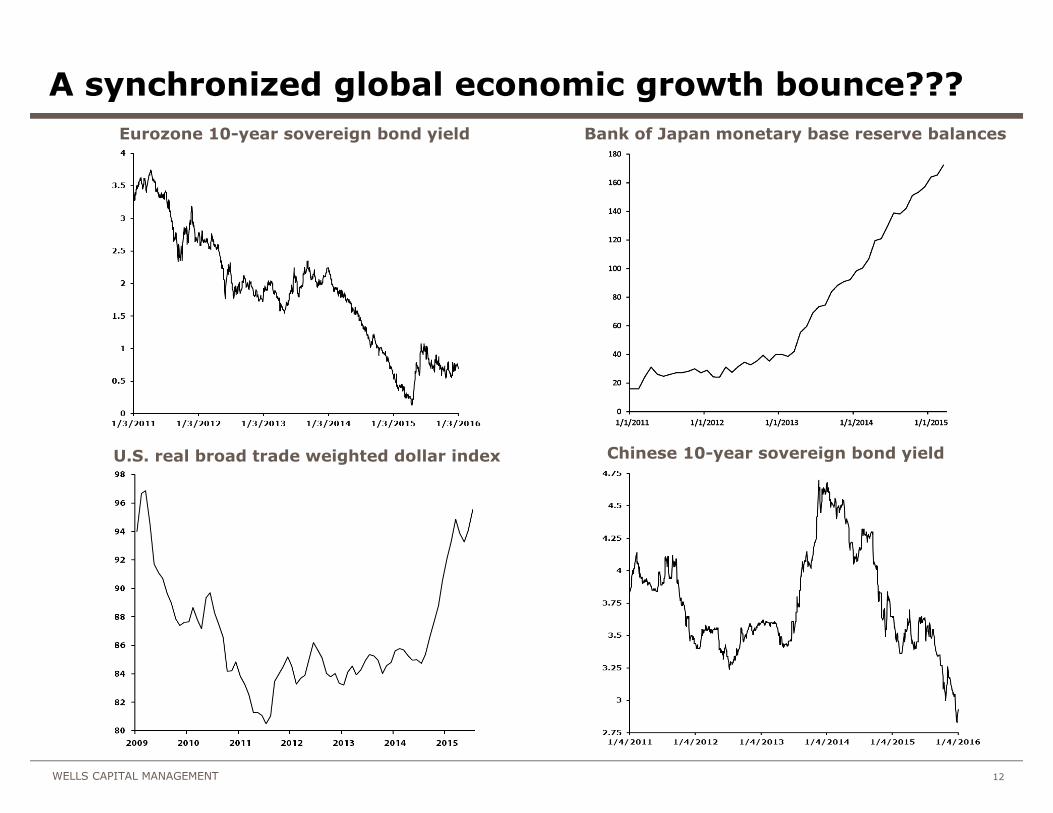
A synchronized global economic growth bounce???
Eurozone 10-year sovereign bond yield Bank of Japan monetary base reserve balances
Chinese 10-year sovereign bond yieldU.S. real broad trade weighted dollar index
13WELLS CAPITAL MANAGEMENT
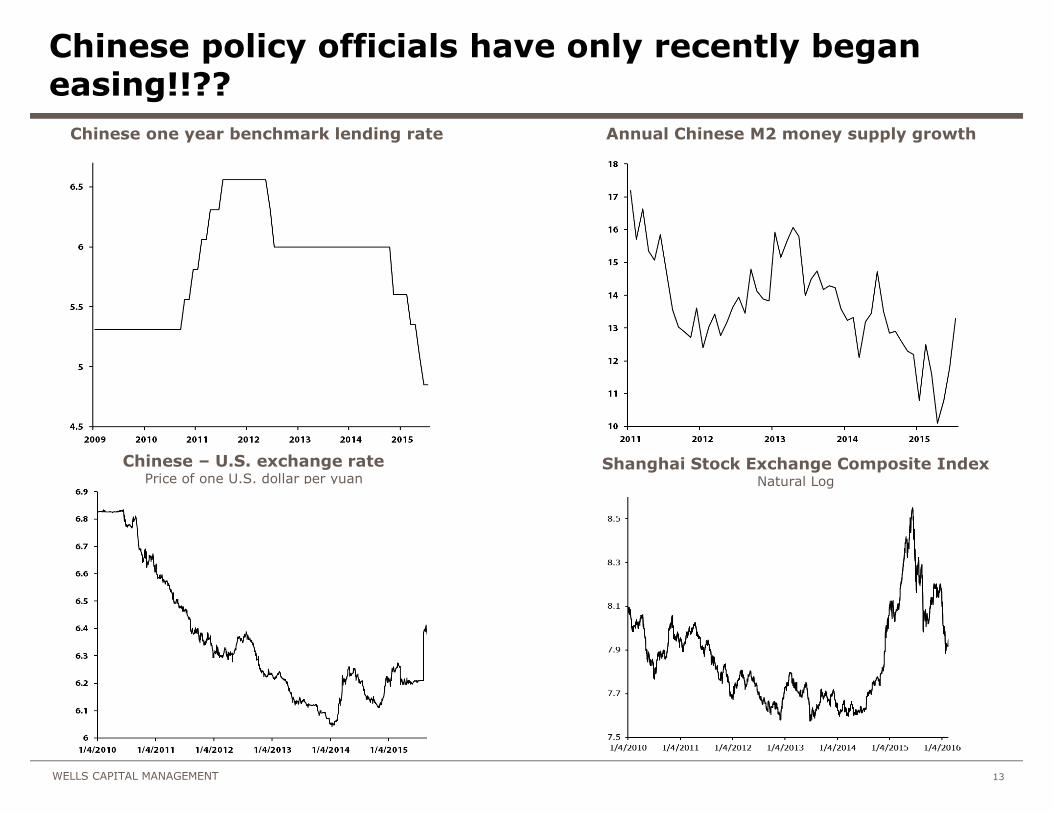
Chinese policy officials have only recently began easing!!??
Chinese one year benchmark lending rate Annual Chinese M2 money supply growth
Shanghai Stock Exchange Composite IndexNatural Log
Chinese – U.S. exchange rate Price of one U.S. dollar per yuan

14WELLS CAPITAL MANAGEMENT
Eurozone showing signs of life!?!
Euro area real gross domestic product annual growth
Euro area real household consumption expenditure annual growth
Eurozone foreign trade balanceTrailing 12-month average trade balance
European business and consumer surveysEurozone economic sentiment and Eurozone retail trade confidence
Solid(left Scale) – Eurozone economic sentiment
Dotted(right scale) – Eurozone retail trade confidence
15WELLS CAPITAL MANAGEMENT
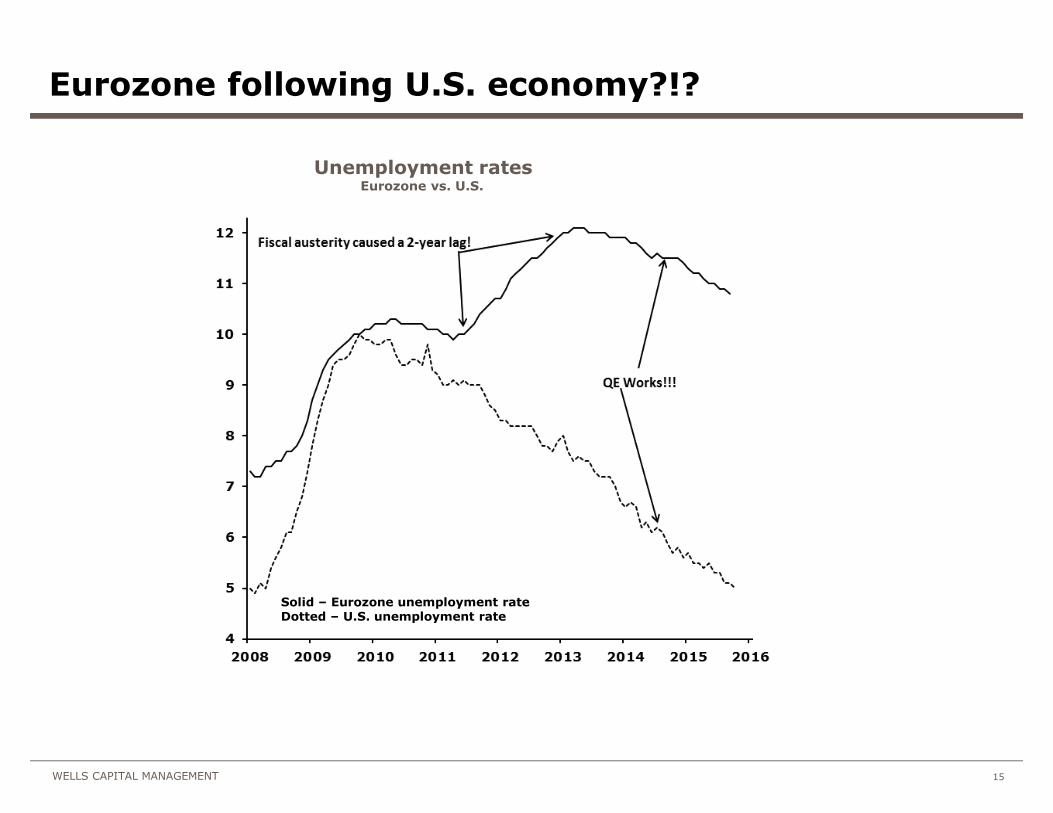
Eurozone following U.S. economy?!?
Unemployment rates Eurozone vs. U.S.
Solid – Eurozone unemployment rateDotted – U.S. unemployment rate
16WELLS CAPITAL MANAGEMENT
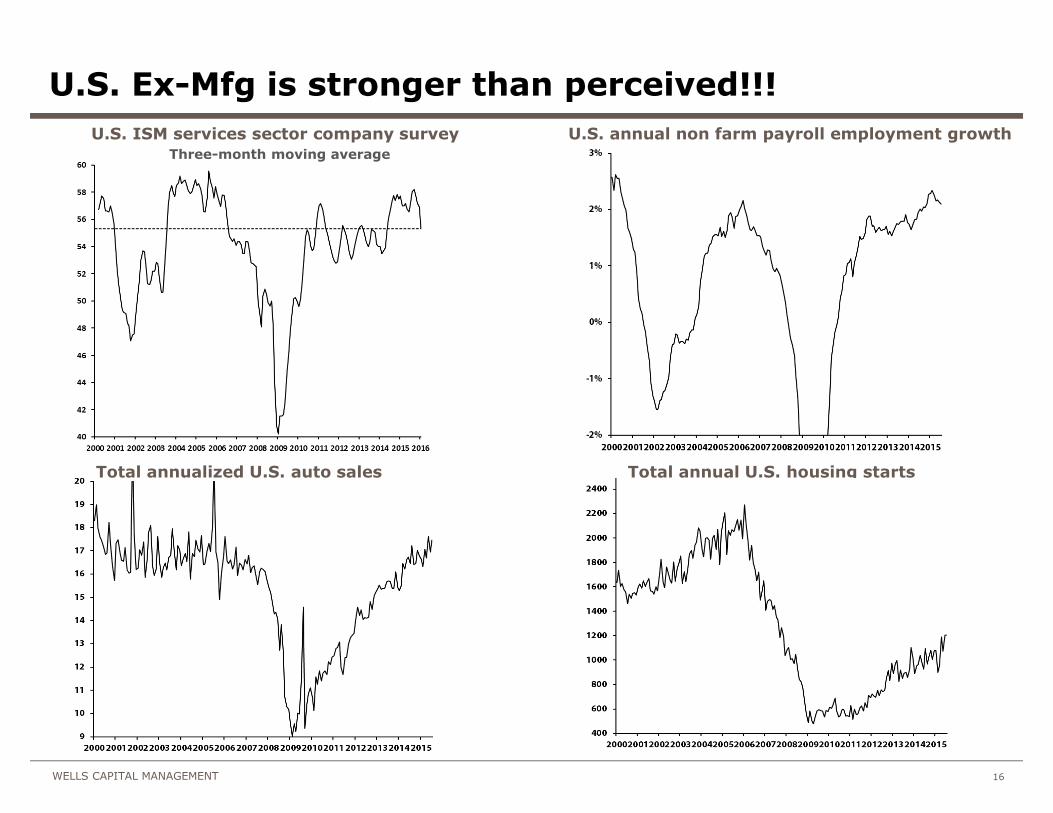
U.S. Ex-Mfg is stronger than perceived!!!
U.S. ISM services sector company survey U.S. annual non farm payroll employment growth
Total annual U.S. housing startsTotal annualized U.S. auto sales
Three-month moving average

17WELLS CAPITAL MANAGEMENT
Commodity price collapse is stimulative!!?
S&P GSCI Spot Commodity Price Index
Annual core consumer price inflation rate U.S. 10-year Treasury bond yield

18WELLS CAPITAL MANAGEMENT
$65.00 crude oil within a year??!
Crude oil price *Dark circles represents crude oil price one-year after each major bottom since 1980

19WELLS CAPITAL MANAGEMENT
When will commodity prices bottom?
U.S. commodity prices vs. U.S. Dollar IndexSolid Line (left scale) – S&P GCSI Spot Commodity Price Index, natural log scale
Dotted Line (right scale) – U.S. Real Broad Trade-Weighted Dollar Index, inverted natural log scale

20WELLS CAPITAL MANAGEMENT
U.S. Dollar Index vs. Fed funds rateSolid – Trade weighted U.S. Dollar Index
Dotted – Fed funds target interest rate
Higher interest rates = a lower dollar!!?
21WELLS CAPITAL MANAGEMENT
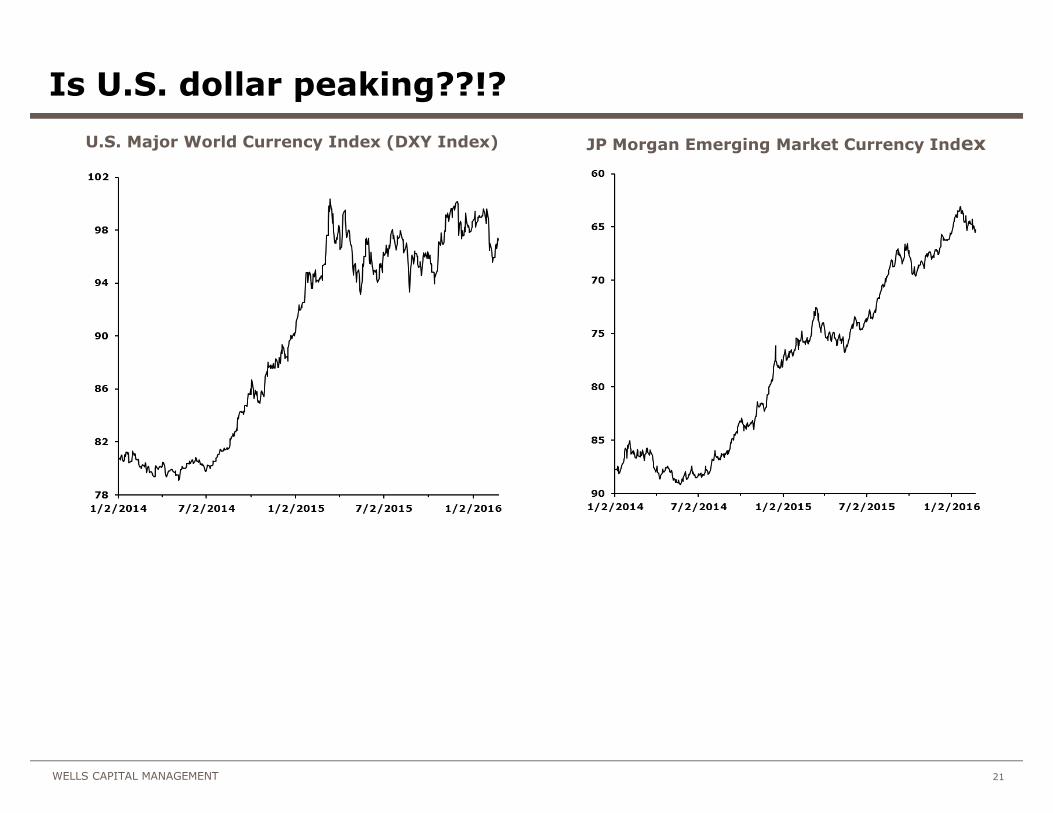
Is U.S. dollar peaking??!?
U.S. Major World Currency Index (DXY Index) JP Morgan Emerging Market Currency Index
22WELLS CAPITAL MANAGEMENT
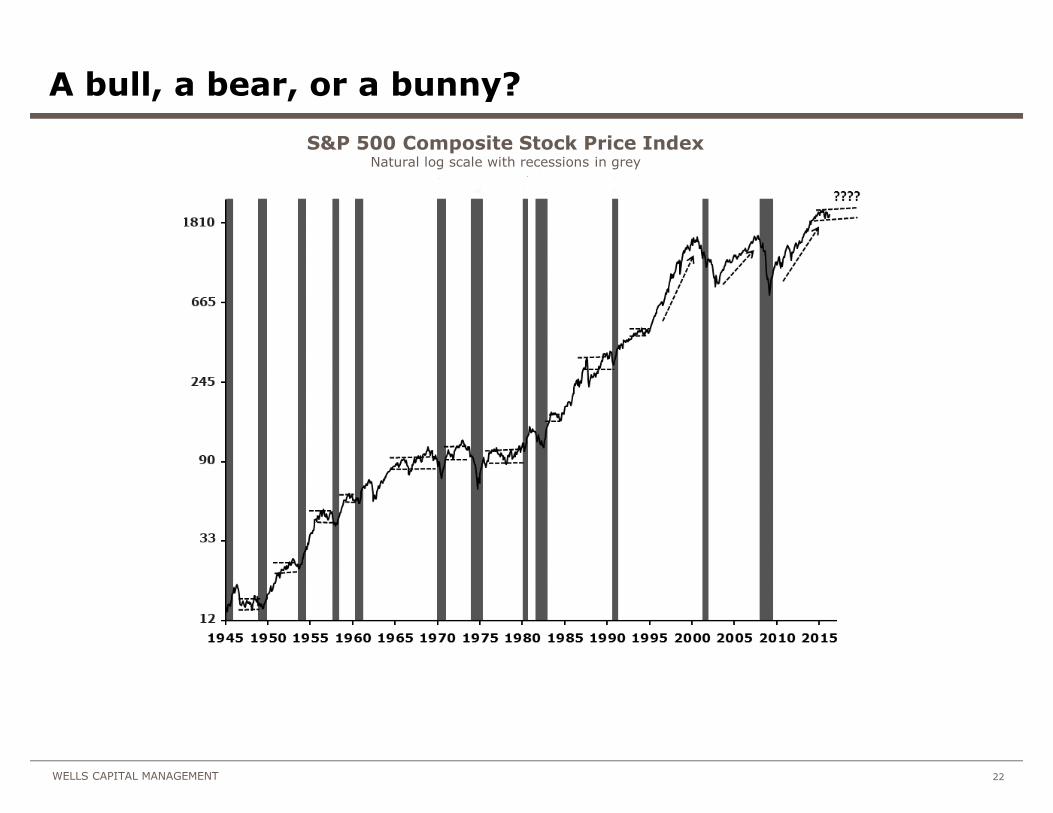
A bull, a bear, or a bunny?
S&P 500 Composite Stock Price Index Natural log scale with recessions in grey

23WELLS CAPITAL MANAGEMENT
Good news becoming bad news for stock market?
U.S. initial jobless claims Four-week moving average
S&P 500 Composite Stock Price IndexShown on a natural log scale

24WELLS CAPITAL MANAGEMENT
Wall Street crossroad …… Slack to tightness??
Full employment
Economic power switches to labor owner
Cost push pressures/wages & price pressures/margin erosion
Forced to realign interest rates
Unfriendly policy officials
Capital spending leads
Reliance on productivity

25WELLS CAPITAL MANAGEMENT
Wage pressures finally rising!?!
U.S. wage inflation 3-month average of annual inflation rate in average hourly earnings
NFIB Small Business Compensation Plans Index3-month moving average

26WELLS CAPITAL MANAGEMENT
Core Inflation a change in tone???
Japan annual core consumer price inflation rate
U.S. annual core consumer price inflation rate
U.S. annual core PCE deflator inflation rate**Assuming the PCE core deflator rose in January
(reported later this month) by the same amount as the Core CPI Index rose as reported this morning (i.e., by 0.3%).
Eurozone annual core consumer price inflation rate
U.S. Annual core services inflation rate

27WELLS CAPITAL MANAGEMENT
Crossing the threshold of full employment ?!?When unemployment rate reaches 5% or less …
Stock returns are about 45% lower and bond returns are
about 70% lower
Stock falls 20% more frequently and bond yields rise about
60% of the time
Bonds provide less diversification benefits
On average, a recession is only 1.77 years away versus 4.18
years when unemployment rate is above 5%

28WELLS CAPITAL MANAGEMENT
Repricing bond yields post Armageddon fears!!!
Real 10-year Treasury bond yield**10-year bond yield less core consumer price inflation rate

29WELLS CAPITAL MANAGEMENT
Buy some JUNK???
U.S. Junk Bond Yield Spread**Chase High Yield Bond Spread

30WELLS CAPITAL MANAGEMENT
Buy some TIPS???
U.S. 10-year TIPS embedded expected inflation rate

31WELLS CAPITAL MANAGEMENT
Bond yields can move fast!?!
10-year Treasury bond yield

32WELLS CAPITAL MANAGEMENT
Does this make sense … ???
U.S. government bond yield
33WELLS CAPITAL MANAGEMENT
Stock market vulnerabilities?!?
Investor sentiment too calm and complacent
Valuation too high for crossroads
Interest rate structure “below” equilibrium
Losing the Fed friend
Thinning participation/concentrated leadership
Pumped-up by M&As, IPOs & Buybacks
An aging EPS cycle

34WELLS CAPITAL MANAGEMENT
An aging U.S. EPS cycle
S&P 500 trailing 12-month earnings per share
35WELLS CAPITAL MANAGEMENT
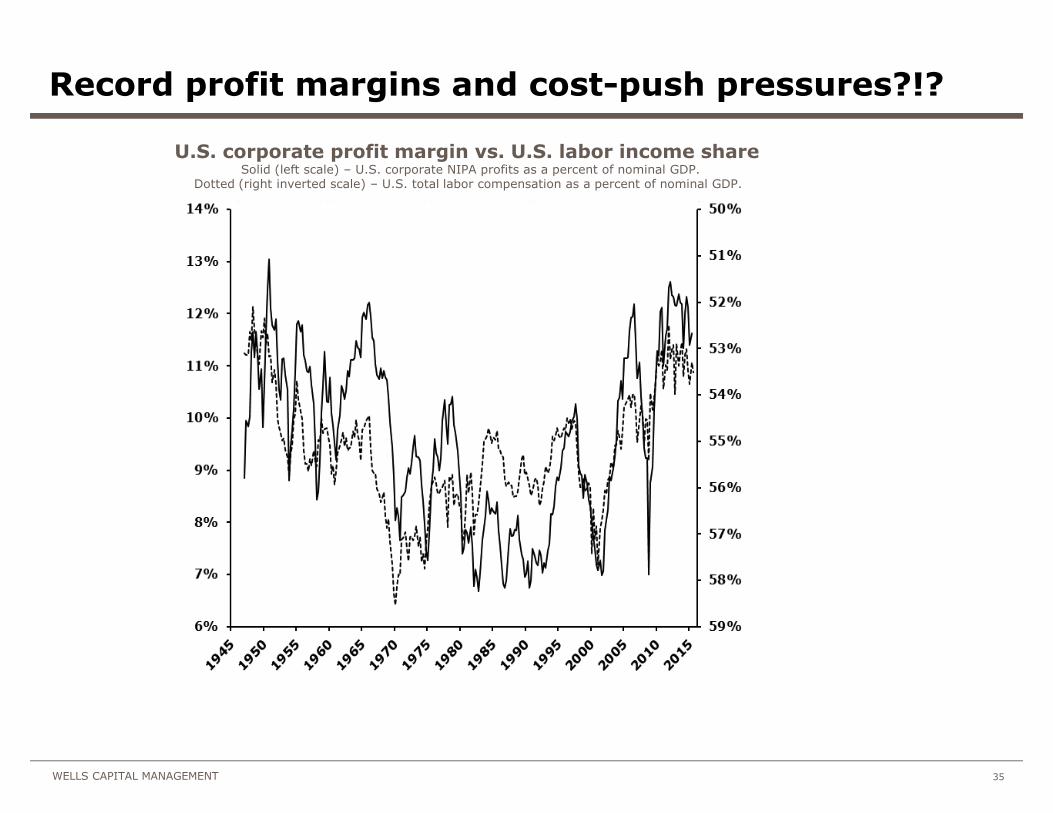
Record profit margins and cost-push pressures?!?
U.S. corporate profit margin vs. U.S. labor income share Solid (left scale) – U.S. corporate NIPA profits as a percent of nominal GDP.
Dotted (right inverted scale) – U.S. total labor compensation as a percent of nominal GDP.

36WELLS CAPITAL MANAGEMENT
Investor sentiment has been adjusted!!?
Investor sentiment AAII Bull less Bear (4-week moving average)
37WELLS CAPITAL MANAGEMENT
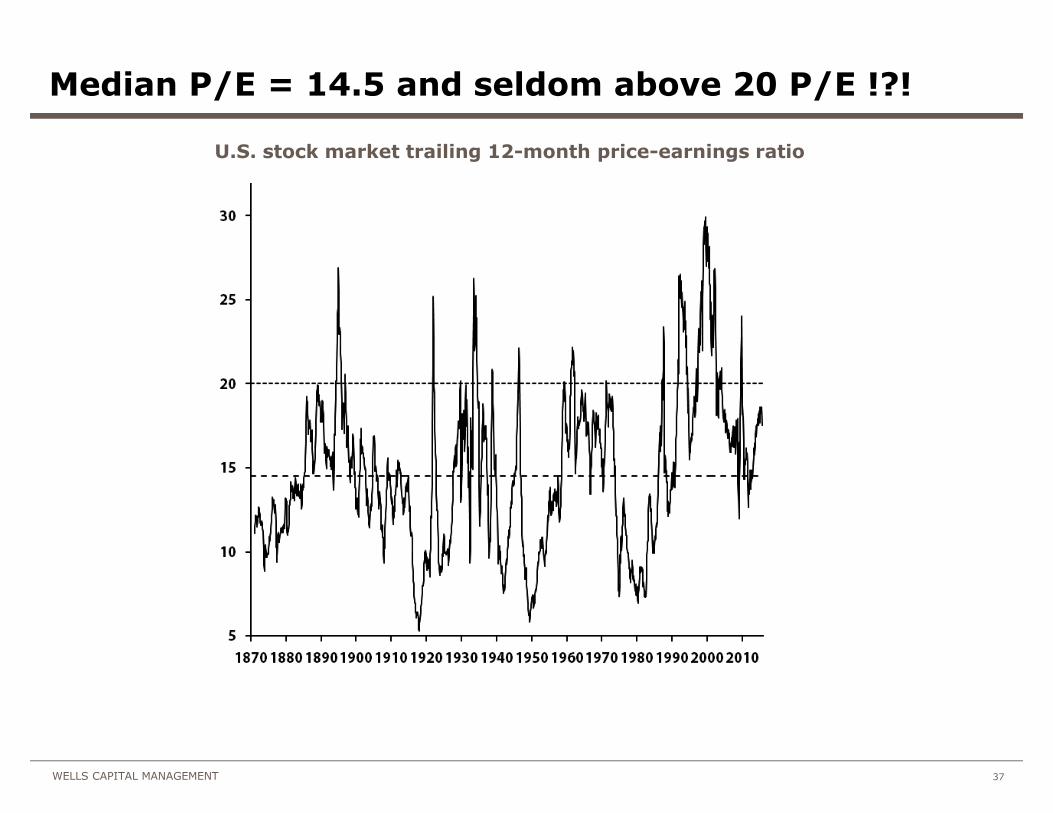
Median P/E = 14.5 and seldom above 20 P/E !?!
U.S. stock market trailing 12-month price-earnings ratio

38WELLS CAPITAL MANAGEMENT
Rule of 20!!?!
P/E Multiple vs. Rule of 20Solid – S&P 500 P/E multiple on trailing 12-month earnings per share
Dotted – 20 less the annual rate of core consumer price inflation Natural log scales

39WELLS CAPITAL MANAGEMENT
A market catalyst??!
Atlanta Fed GDPNow GDP Forecast*This concept provides an estimate of overall economic activity. It is an estimate of
current quarterly GDP growth updated daily as information is released during the quarter.

40WELLS CAPITAL MANAGEMENT
How to play coming year?
Invest to a year-end target of 2050
Maximize overweight to international stocks
Overweight mid and small caps
Add some real asset exposure
Emphasize manufacturing, commodity, energy, technology and financials
Raise proceeds on rallies from consumer discretionary, consumer staples, utilities, and health care
41WELLS CAPITAL MANAGEMENT
Overweight overseas!?!
Under owned
Better relative values
Hospitable policy officials
No negative full employment fallout
Companies in younger part of earnings cycle
42WELLS CAPITAL MANAGEMENT
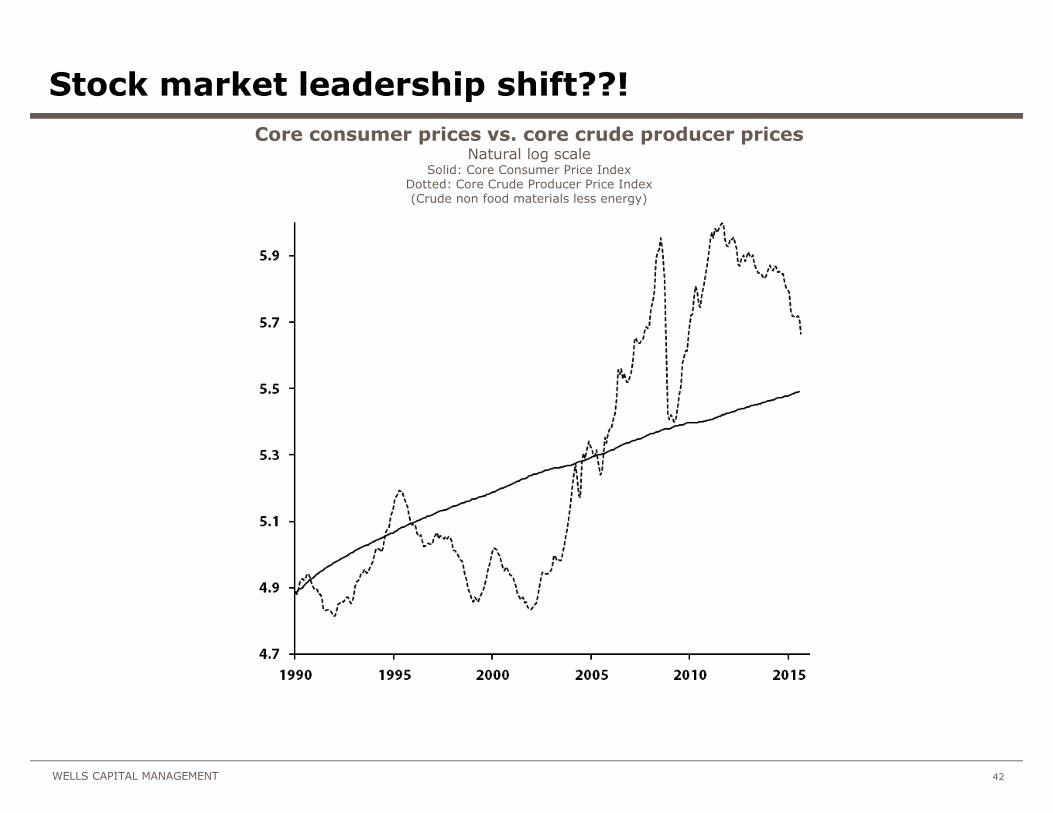
Stock market leadership shift??!
Core consumer prices vs. core crude producer pricesNatural log scale
Solid: Core Consumer Price IndexDotted: Core Crude Producer Price Index(Crude non food materials less energy)

43WELLS CAPITAL MANAGEMENT
Go international and industrial!?!
U.S. / ex-U.S. total return stock performance vs.CPI/PPI Ratio
Consumer / industrial total return stock Performance vs. CPI/PPI Ratio
Solid (left natural log scale): MSCI relative total stock market return:U.S. stock market vs. global ex-U.S. stock market in U.S. dollars
Dotted (right natural log scale): Ratio of Core Consumer Price Index divided by Core PPI Index for crude non food materials less energy
Solid (left natural log scale): Relative total return performance of consumersectors vs. industrial sectors. Data from Kenneth French 12 sector U.S. universe.Consumer sectors include consumer non durables, consumer durables, telecom, utilities and shops (retail). Industrial sectors include manufacturing, energy and
chemicals. Sectors are equal weighted. Dotted (right natural log scale): Ratio of Core Consumer Price Index divided
by Core PPI Index for crude non food materials less energy
44WELLS CAPITAL MANAGEMENT
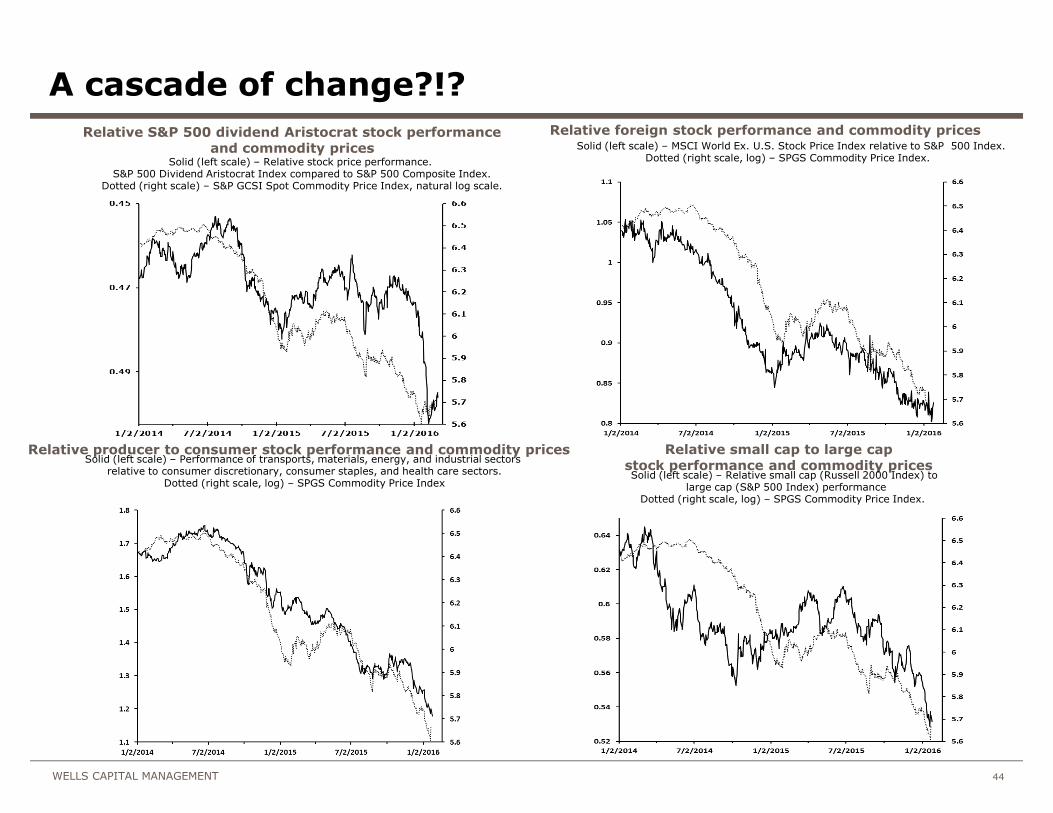
A cascade of change?!?
Relative S&P 500 dividend Aristocrat stock performance and commodity prices
Relative foreign stock performance and commodity prices
Relative small cap to large cap stock performance and commodity prices
Relative producer to consumer stock performance and commodity prices
Solid (left scale) – Relative stock price performance. S&P 500 Dividend Aristocrat Index compared to S&P 500 Composite Index.
Dotted (right scale) – S&P GCSI Spot Commodity Price Index, natural log scale.
Solid (left scale) – Performance of transports, materials, energy, and industrial sectors relative to consumer discretionary, consumer staples, and health care sectors.
Dotted (right scale, log) – SPGS Commodity Price Index
Solid (left scale) – MSCI World Ex. U.S. Stock Price Index relative to S&P 500 Index.Dotted (right scale, log) – SPGS Commodity Price Index.
Solid (left scale) – Relative small cap (Russell 2000 Index) to large cap (S&P 500 Index) performance
Dotted (right scale, log) – SPGS Commodity Price Index.
45WELLS CAPITAL MANAGEMENT
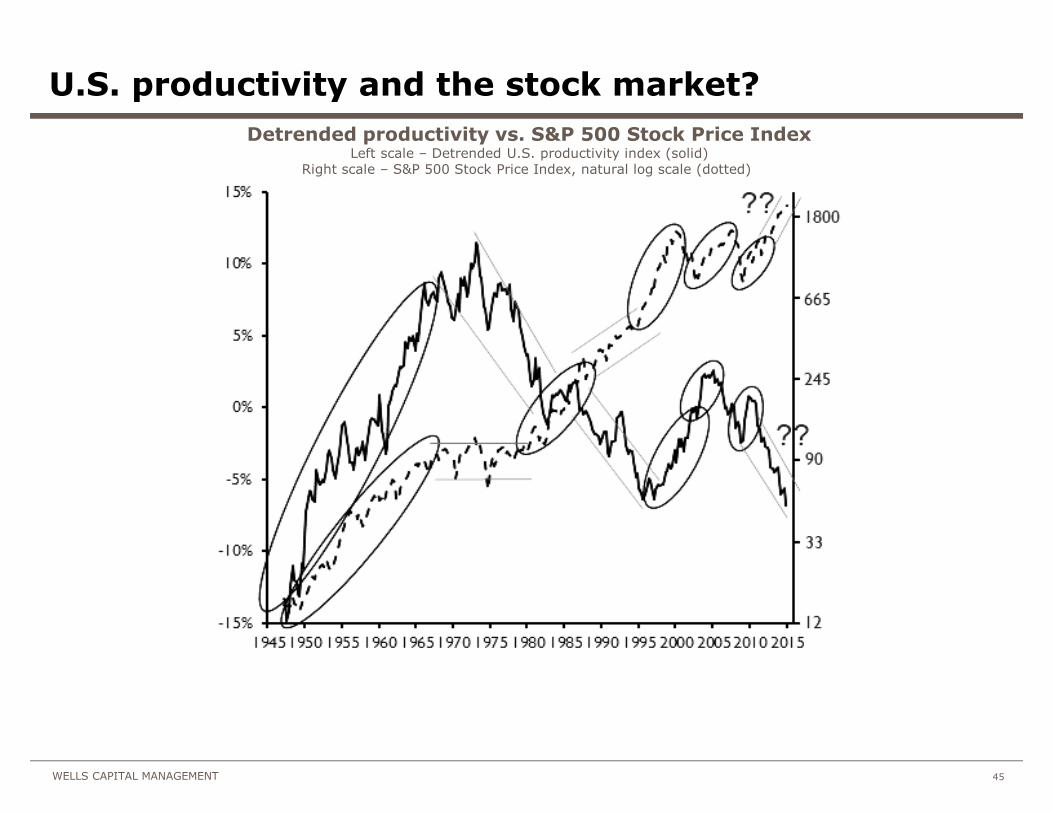
U.S. productivity and the stock market?
Detrended productivity vs. S&P 500 Stock Price IndexLeft scale – Detrended U.S. productivity index (solid)
Right scale – S&P 500 Stock Price Index, natural log scale (dotted)

46WELLS CAPITAL MANAGEMENT
10-year needs to reprice to between 4% to 5%
Bullet now & barbell as Fed gets in game
Stay below average duration
Overweight lower quality (junk)
Buy some TIPS
Investment themes—BONDS?

47WELLS CAPITAL MANAGEMENT
Investment themes—STOCKS?
Maintain secular overweight to stocks
Manage 2016 to a 2050 S&P target
Expect 5% to 7% buy and hold returns for balance of bull market
Diversify away from U.S.A.
• To a different policy cycle … Japan & eurozone
• To resource-based economics … Canada & Australia
• To emerging world
In U.S. market …
• Long term emphasize, manufacturing, commodity, energy, technology,
and financials
• Overweight small and mid caps
• Underweight consumer discretionary, consumer staples, utilities, and health care

48WELLS CAPITAL MANAGEMENT
Questions?

49WELLS CAPITAL MANAGEMENT
Disclosures
Wells Fargo Asset Management (WFAM) is a trade name used by the asset management businesses of Wells Fargo & Company. WFAM includes Affiliated Managers (Galliard Capital Management, Inc.; Golden Capital Management, LLC; Nelson Capital Management; Peregrine Capital Management; and The Rock Creek Group); Wells Capital Management, Inc. (Metropolitan West Capital Management, LLC; First International Advisors, LLC; and ECM Asset Management Ltd.); Wells Fargo Funds Distributor, LLC; Wells Fargo Asset Management Luxembourg S.A.; and Wells Fargo Funds Management, LLC.
Wells Capital Management (WellsCap) is a registered investment adviser and a wholly owned subsidiary of Wells Fargo Bank, N.A. WellsCap provides investment management services for a variety of institutions. The views expressed are those of the author at the time of writing and are subject to change. This material has been distributed for educational/informational purposes only, and should not be considered as investment advice or a recommendation for any particular security, strategy orinvestment product. The material is based upon information we consider reliable, but its accuracy and completeness cannot be guaranteed. Past performance is not a guarantee of future returns. As with any investment vehicle, there is a potential for profit as well as the possibility of loss. For additional information on Wells Capital Management and its advisory services, please view our web site at www.wellscap.com, or refer to our Form ADV Part II, which is available upon request by calling 415.396.8000.