economic facts and figures baden-württemberg 2017 · economic facts and figures baden-württemberg...
TRANSCRIPT
Economic Factsand Figures
Baden-Württemberg2017
Baden-
Württemberg
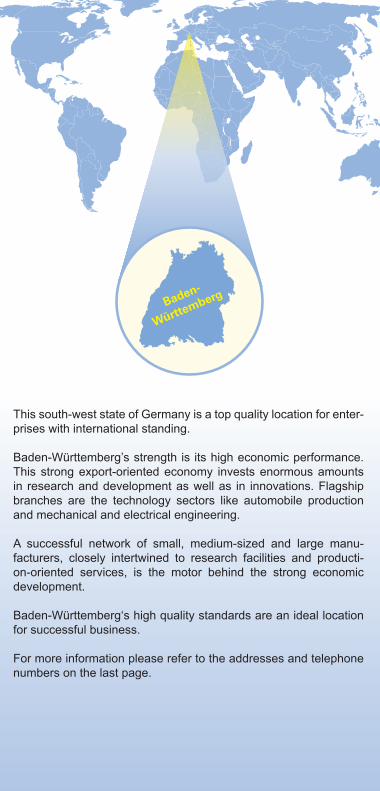
This south-west state of Germany is a top quality location for enter-prises with international standing.
Baden-Württemberg’s strength is its high economic performance. This strong export-oriented economy invests enormous amounts in research and development as well as in innovations. Flagship branches are the technology sectors like automobile production and mechanical and electrical engineering.
A successful network of small, medium-sized and large manu- facturers, closely intertwined to research facilities and producti-on-oriented services, is the motor behind the strong economic development.
Baden-Württemberg‘s high quality standards are an ideal location for successful business.
For more information please refer to the addresses and telephone numbers on the last page.
Area and Population 2005 2010 2016Unit
Area km² 35 752 35 751 35 751
Total population 1 000 10 736 10 754 10 8801)
less than 20 years 1 000 2 288 2 129 2 098
65 years and over 1 000 1 954 2 091 2 152
density of population population per km2 300 301 304
Economic StrengthGross domestic product
in current prices EUR mill. 336 269 384 913 476 760
per capita EUR 31 963 36 727 42 6231)
real economic growth % 0,6 7,7 2,2
Distribution of gross value added (current prices)
Agriculture, forestry and fishing % 0,6 0,4 0,4
Industry, excluding construction % 33,9 34,1 35,4
Manufacturing % 31,6 31,2 33,4
Construction % 3,9 4,2 4,7
Service activities % 61,6 61,3 59,5
Trade, transportation and storage, acco-modation, information and communication % 18,3 18,5 18,5
Financial, insurance and real estate activities, professional service activities % 24,9 24,5 22,9
Public administration and other service activities, education and human health % 18,5 18,3 18,1
Labor marketUnemployed 1 000 385,3 272,6 226,4
Unemployment rate (ILO) % 7,1 4,8 3,1
1) 2016: 2015.

Total employment 2005 2010 2016Unit
Total employment 1 000 5 525,8 5 710,1 6 158,6
Percentage of total employment
Agriculture, forestry and fishing % 1,5 1,3 1,1
Industry, excluding construction % 27,5 26,0 25,7
Manufacturing % 26,4 24,9 24,6
Construction % 5,4 5,2 5,2
Service activities % 65,7 67,5 68,0
Trade, transportation and storage, acco- modation, information and communication % 24,2 24,3 24,2
Financial, insurance and real estate activities, professional service activities % 14,4 15,3 15,9
Public administration and other service activities, education and human health % 27,1 27,8 27,9
Industry 2005 2010 2016(manufacturing) Unit
Local units Number 8 605 8 047 8 265
Employees 1 000 1 202 1 155 1 260
Turnover EUR mill. 261 930 272 873 349 553
Domestic Turnover EUR mill. 138 776 136 666 157 117
Foreign Turnover EUR mill. 123 155 136 207 192 435
Export rate % 47,0 49,9 55,1
Wages and salaries per employee EUR 40 633 43 319 51 774
Industrial Structure(Percentage in proportion to the turnover in manufacturing)
Manufacture of motor vehicles, trailers and semi-trailers % 20,1 25,9 30,0
Manufacture of machinery and equipment n.e.c. % 22,1 20,5 21,8
Manufacture of fabricated metal products, except machinery and equipment % 6,5 7,3 7,0
Manufacture of electrical equipment % 6,3 7,3 6,6
Manufacture of food products % 4,9 5,2 4,1
Manufacture of computer, electronic and optical products % 5,4 5,3 4,3
Manufacture of rubber and plastic products % 3,7 4,0 3,9
Manufacture of chemicals and chemical products % 3,2 3,6 3,1
Manufacture of basic pharmaceutical pro-ducts and pharmaceutical preparations % 2,6 2,7 2,8
CraftLocal units Number 100 040 106 844 108 991
Employees 1 000 715 704 746
Turnover EUR bill. 61,2 76,1 90,7
Primary Construction IndustryLocal units (June) Number 7 141 6 921 7 141
Employees (June) 1 000 86 86 96
Turnover EUR mill. 9 002 10 301 14 572
Companies in Baden-Württemberg in 2015
Economic sector
Enterprises
Number
Employees subject to
social insurance
Turnover
1 000 EUR bill.
Industry 103,1 1 758,8 528,8
Wholesale and retail trade; repair of motor vehicles and motorcycles 86,7 654,0 293,0
Transportation and storage 14,0 133,6 19,6
Accommodation and food service activities 35,4 112,9 10,3
Information and communication 16,8 148,3 29,4
Financial and insurance activities 9,8 119,7 11,4
Real estate activities 19,6 23,3 10,9
Professional, scientific and technical activities 70,8 261,1 44,8
Administrative and support service activities 25,0 216,8 20,1
Education 9,2 99,0 2,0
Human health and social work activities 30,0 507,9 7,7
Arts, entertainment and recreation 12,7 32,6 5,0
Other service activities 34,0 114,0 4,9
Total 467,2 4 182,0 987,9

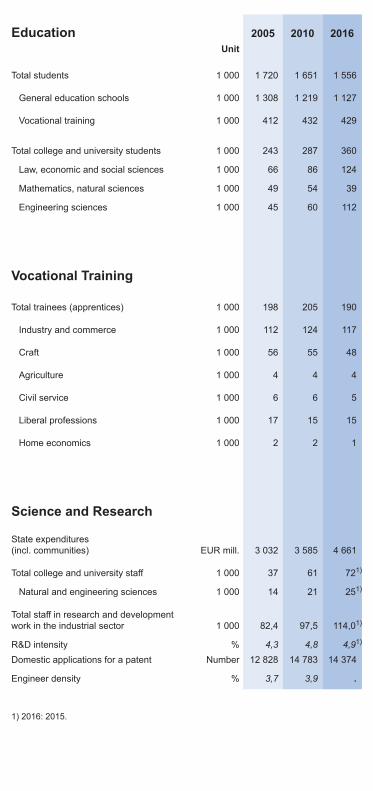
Education 2005 2010 2016Unit
Total students 1 000 1 720 1 651 1 556
General education schools 1 000 1 308 1 219 1 127
Vocational training 1 000 412 432 429
Total college and university students 1 000 243 287 360
Law, economic and social sciences 1 000 66 86 124
Mathematics, natural sciences 1 000 49 54 39
Engineering sciences 1 000 45 60 112
Vocational Training
Total trainees (apprentices) 1 000 198 205 190
Industry and commerce 1 000 112 124 117
Craft 1 000 56 55 48
Agriculture 1 000 4 4 4
Civil service 1 000 6 6 5
Liberal professions 1 000 17 15 15
Home economics 1 000 2 2 1
Science and Research
State expenditures (incl. communities) EUR mill. 3 032 3 585 4 661
Total college and university staff 1 000 37 61 721)
Natural and engineering sciences 1 000 14 21 251)
Total staff in research and development work in the industrial sector 1 000 82,4 97,5 114,01)
R&D intensity % 4,3 4,8 4,91)
Domestic applications for a patent Number 12 828 14 783 14 374
Engineer density % 3,7 3,9 .
1) 2016: 2015.
Industry 2005 2010 2016(manufacturing) Unit
Local units Number 8 605 8 047 8 265
Employees 1 000 1 202 1 155 1 260
Turnover EUR mill. 261 930 272 873 349 553
Domestic Turnover EUR mill. 138 776 136 666 157 117
Foreign Turnover EUR mill. 123 155 136 207 192 435
Export rate % 47,0 49,9 55,1
Wages and salaries per employee EUR 40 633 43 319 51 774
Industrial Structure(Percentage in proportion to the turnover in manufacturing)
Manufacture of motor vehicles, trailers and semi-trailers % 20,1 25,9 30,0
Manufacture of machinery and equipment n.e.c. % 22,1 20,5 21,8
Manufacture of fabricated metal products, except machinery and equipment % 6,5 7,3 7,0
Manufacture of electrical equipment % 6,3 7,3 6,6
Manufacture of food products % 4,9 5,2 4,1
Manufacture of computer, electronic and optical products % 5,4 5,3 4,3
Manufacture of rubber and plastic products % 3,7 4,0 3,9
Manufacture of chemicals and chemical products % 3,2 3,6 3,1
Manufacture of basic pharmaceutical pro-ducts and pharmaceutical preparations % 2,6 2,7 2,8
CraftLocal units Number 100 040 106 844 108 991
Employees 1 000 715 704 746
Turnover EUR bill. 61,2 76,1 90,7
Primary Construction IndustryLocal units (June) Number 7 141 6 921 7 141
Employees (June) 1 000 86 86 96
Turnover EUR mill. 9 002 10 301 14 572
Education 2005 2010 2016Unit
Total students 1 000 1 720 1 651 1 556
General education schools 1 000 1 308 1 219 1 127
Vocational training 1 000 412 432 429
Total college and university students 1 000 243 287 360
Law, economic and social sciences 1 000 66 86 124
Mathematics, natural sciences 1 000 49 54 39
Engineering sciences 1 000 45 60 112
Vocational Training
Total trainees (apprentices) 1 000 198 205 190
Industry and commerce 1 000 112 124 117
Craft 1 000 56 55 48
Agriculture 1 000 4 4 4
Civil service 1 000 6 6 5
Liberal professions 1 000 17 15 15
Home economics 1 000 2 2 1
Science and Research
State expenditures (incl. communities) EUR mill. 3 032 3 585 4 661
Total college and university staff 1 000 37 61 721)
Natural and engineering sciences 1 000 14 21 251)
Total staff in research and development work in the industrial sector 1 000 82,4 97,5 114,01)
R&D intensity % 4,3 4,8 4,91)
Domestic applications for a patent Number 12 828 14 783 14 374
Engineer density % 3,7 3,9 .
1) 2016: 2015.

Tourism 2005 2010 2016Unit
Guest beds 1 000 375 393 396
Overnight stays 1 000 40 501 43 515 52 043
Foreign guests 1 000 6 572 8 020 11 207
Foreign Trade
Total exports EUR mill. 123 144 152 722 191 711
Motor vehicles and parts EUR mill. . 35 108 46 962
Machinery EUR mill. . 32 572 37 956
Pharmaceutical products EUR mill. . 13 053 21 089
Data processing devices, electronic and optical products EUR mill. . 11 415 13 161
Electrical equipment EUR mill. . 10 187 13 030
Chemical products EUR mill. . 7 098 9 628
Country of destination
USA EUR mill. 14 906 13 631 23 409
EU 28 EUR mill. 72 068 80 459 99 686
France EUR mill. 11 896 12 452 14 345
Netherlands EUR mill. 6 640 11 532 13 254
United Kingdom EUR mill. 8 097 7 898 12 174
Italy EUR mill. 8 536 8 572 8 581
Switzerland EUR mill. 7 051 12 622 14 054
People´s Republic of China EUR mill. 3 618 11 079 13 911
Japan EUR mill. 3 140 2 843 4 081
Total imports EUR mill. 98 702 126 295 161 625
USA EUR mill. 8 602 10 548 12 316
EU 28 EUR mill. 59 857 71 240 95 388
France EUR mill. 9 088 10 047 11 586
Netherlands EUR mill. 4 689 6 622 12 738
People´s Republic of China EUR mill. 4 325 9 551 11 089
.
Baden-Württemberg´s 2005 2010 2016Economic Rankingin Germany
Area 10,0 10,0 10,01)
Population 13,0 13,2 13,21)
Persons in employment 14,1 13,9 14,1
Manufacturing 18,0 17,8 18,0
Self-employed 13,4 13,2 13,5
Gross domestic product (current prices) 14,6 14,9 15,2
General education school population 13,8 13,9 13,5
Vocational school population 14,2 15,3 17,0
Total college and university student population 12,2 13,0 13,0
Mathematics, natural sciences 13,8 14,0 12,6
Total staff in research and development work in the industrial sector 27,1 27,3 28,2
Domestic applications for a patent 26,5 31,3 29,7
Employees, manufacturing 20,3 20,2 20,4
Machinery 28,6 30,1 30,1
Vehicle construction 26,6 27,4 27,2
Overnight stays 11,8 11,4 11,6
Exports 15,7 16,0 15,9
Machinery . 23,0 22,4
Motor vehicles and parts . 21,8 20,6
Pharmaceutical products . 25,9 29,8
Electrical equipment . 16,9 17,2
Per capita gross domestic product (current prices) 113,0 114,3 114,81)
Per capita expenditures on research and development 188,2 196,9 193,4
Export rate (manufacturing) 115,8 112,4 115,5
Gross wages and salaries per employee 107,6 106,7 107,8
1) 2016: 2015.
Percentage (%)in proportionto Germany
Key level figures(Germany = 100)
www.wm.baden-wuerttemberg.de
www.statistik-bw.de
Ministerium für Wirtschaft,Arbeit und Wohnungsbau
Baden-WürttembergNeues Schloß, Schloßplatz 4
D 70173 StuttgartTelefon +49 711/ 123 - 0 Zentrale
Telefax +49 711/ 123 - [email protected]
in cooperation with
Statistisches LandesamtBaden-WürttembergBöblinger Straße 68D 70199 Stuttgart
Telefon +49 711/ 641- 0 ZentraleTelefax +49 711/ 641- 24 [email protected]
© Statistisches Landesamt Baden-Württemberg, Stuttgart, 2017Duplication and spreading, also in part,
with indication of source permit.
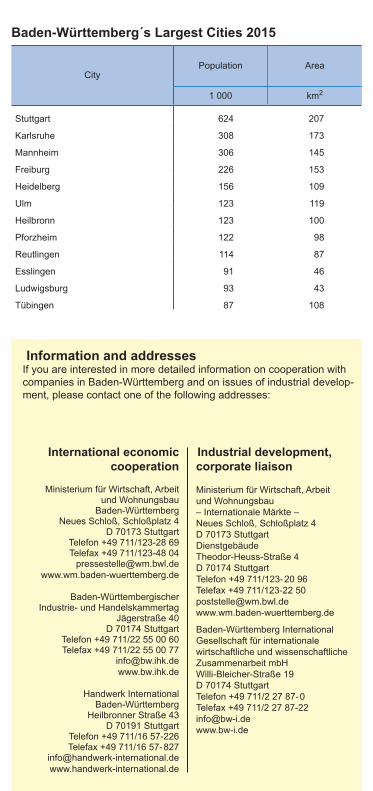
Information and addressesIf you are interested in more detailed information on cooperation with companies in Baden-Württemberg and on issues of industrial develop-ment, please contact one of the following addresses:
CityPopulation Area
1 000 km2
Stuttgart 624 207
Karlsruhe 308 173
Mannheim 306 145
Freiburg 226 153
Heidelberg 156 109
Ulm 123 119
Heilbronn 123 100
Pforzheim 122 98
Reutlingen 114 87
Esslingen 91 46
Ludwigsburg 93 43
Tübingen 87 108
Baden-Württemberg´s Largest Cities 2015
International economiccooperation
Ministerium für Wirtschaft, Arbeit und Wohnungsbau
Baden-WürttembergNeues Schloß, Schloßplatz 4
D 70173 StuttgartTelefon +49 711/123-28 69Telefax +49 711/123-48 04
Baden-WürttembergischerIndustrie- und Handelskammertag
Jägerstraße 40D 70174 Stuttgart
Telefon +49 711/22 55 00 60Telefax +49 711/22 55 00 77
Handwerk InternationalBaden-Württemberg
Heilbronner Straße 43D 70191 Stuttgart
Telefon +49 711/16 57-226Telefax +49 711/16 57- 827
Industrial development,corporate liaison
Ministerium für Wirtschaft, Arbeit und Wohnungsbau– Internationale Märkte –Neues Schloß, Schloßplatz 4D 70173 StuttgartDienstgebäudeTheodor-Heuss-Straße 4D 70174 StuttgartTelefon +49 711/123- 20 96Telefax +49 711/123-22 [email protected]
Baden-Württemberg InternationalGesellschaft für internationalewirtschaftliche und wissenschaftlicheZusammenarbeit mbHWilli-Bleicher-Straße 19D 70174 StuttgartTelefon +49 711/2 27 87- 0Telefax +49 711/2 27 [email protected]
www.wm.baden-wuerttemberg.de
www.statistik-bw.de
Ministerium für Wirtschaft,Arbeit und Wohnungsbau
Baden-WürttembergNeues Schloß, Schloßplatz 4
D 70173 StuttgartTelefon +49 711/ 123 - 0 Zentrale
Telefax +49 711/ 123 - [email protected]
in cooperation with
Statistisches LandesamtBaden-WürttembergBöblinger Straße 68D 70199 Stuttgart
Telefon +49 711/ 641- 0 ZentraleTelefax +49 711/ 641- 24 [email protected]
© Statistisches Landesamt Baden-Württemberg, Stuttgart, 2017Duplication and spreading, also in part,
with indication of source permit.
Economic Factsand Figures
Baden-Württemberg2017