economic expansion, commercial real estate-what’s next?€¦ · economic expansion & real...
TRANSCRIPT

Keynote:
Economic Expansion, Commercial Real Estate- What’s Next?

Economic Expansion & Real EstateWhat’s Next – Near Term & Long Term?Business Cycles, Technological Change, the Policy Environment, and the Future of Multifamily & Commercial Real Estate
April 30, 2019Victor Calanog PhD | Chief EconomistMoody’s Analytics | REIS

REIS, Real Estate Solutions by Moody’s Analytics
1. ECONOMIC OVERVIEW AND OUR OUTLOOK FOR THE NEAR TERM.
2. THE LATEST TRENDS FOR MULTIFAMILY, OFFICE, RETAIL, AND INDUSTRIAL. CHANGES IN DEMOGRAPHICS, USE OF SPACE, TECHNOLOGY, AND THE POLICY ENVIRONMENT THAT AFFECTS THE FUTURE OF SPECIFIC PROPERTY TYPES.
3. A DISCUSSION OF INTEREST RATES, THE YIELD CURVE, AND VARIOUS RECESSIONARY RISK FACTORS.
4. Q & A
Agenda

REIS, Real Estate Solutions by Moody’s Analytics
1.0%
1.8%
2.8%
3.8%3.3%
2.7%
1.8%
‐0.3%
‐2.8%
2.6%
1.6%2.2%
1.8%
2.5%2.9%
1.6%
2.2%
2.9%
2.3%
0.7%
3.1%
2.2% 2.2%
‐4.0%
‐3.0%
‐2.0%
‐1.0%
0.0%
1.0%
2.0%
3.0%
4.0%
5.0%
2001 2003 2005 2007 2009 2011 2013 2015 2017 2019 2021 2023
Annual GDP Growth2001 - 2023
Source: Bureau of Economic Analysis; Economy.com
Forecast

REIS, Real Estate Solutions by Moody’s Analytics
World’s Region North America Other Countries Africa Asia Australia Europe South America Middle East
The World Economy2017 GDP, $ in trillions
Source: Worldbank
REIS, Real Estate Solutions by Moody’s Analytics
0.0%
2.0%
4.0%
6.0%
8.0%
10.0%
12.0%
14.0%
16.0%
‐900
‐700
‐500
‐300
‐100
100
300
500
700
Jan2007
Jan2008
Jan2009
Jan2010
Jan2011
Jan2012
Jan2013
Jan2014
Jan2015
Jan2016
Jan2017
Jan2018
Jan2019
Payrolls (Thousands)
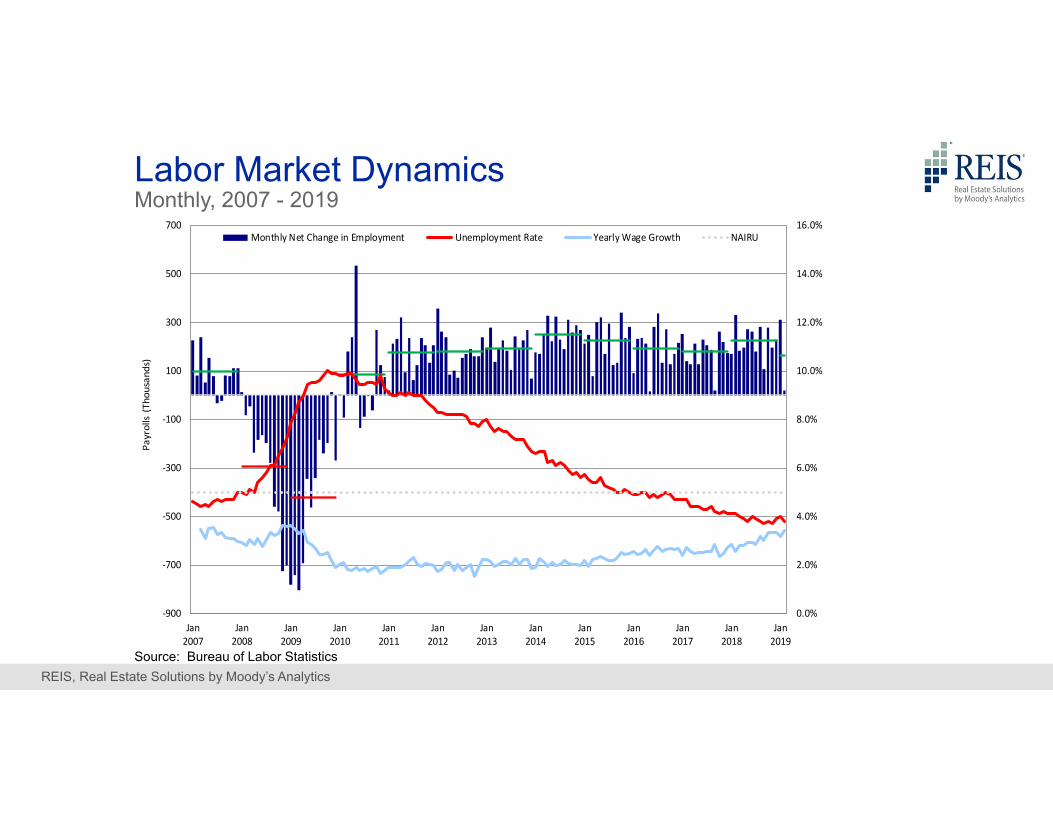
Monthly Net Change in Employment Unemployment Rate Yearly Wage Growth NAIRU
Labor Market DynamicsMonthly, 2007 - 2019
Source: Bureau of Labor Statistics

REIS, Real Estate Solutions by Moody’s Analytics
0.0%
0.5%
1.0%
1.5%
2.0%
2.5%
3.0%
3.5%
4.0%
4.5%
5.0%
5.5%
6,000
8,000
10,000
12,000
14,000
16,000
18,000
20,000
22,000
24,000
26,000
28,000
4/1/2010 4/1/2011 4/1/2012 4/1/2013 4/1/2014 4/1/2015 4/1/2016 4/1/2017 4/1/2018 4/1/2019
10‐Year Treasury Rate
Dow
Jones Industria
l Average
Dow Jones Industrial Average 10 Year Treasury Rate
DJIA vs. 10-Year Treasury RateDaily, 04/2010 – 04/2019
Source: FRED; Federal Reserve Bank of Philadelphia

REIS, Real Estate Solutions by Moody’s Analytics
The Economic Outlook
» US GDP growth for 2018 likely to have been as strong as in 2014 (the strongest growth year since the end of the last recession); consensus forecasts suggest that 2019 will drop back down to the low 2s, which has been CAGR since the end of the recession in mid‐2009.
» Moderation does not mean contraction, although this does render growth vulnerable to shocks or shifts in sentiment.
» How does all this translate to how different property types performed in late 2018 and early 2019?
» We will, however, discuss some thoughts on what will cause the next recession, towards the end of this presentation. Hang on!
Key Takeaways for 2018 and 2019

REIS, Real Estate Solutions by Moody’s Analytics
Year QtrAsking Rent
Percent Change
Effect ive Rent
Percent Change
Vacancy Rate
2011 4 $1,070 0.5% $1,019 0.6% 5.3%2012 1 $1,077 0.6% $1,028 0.9% 5.0%2012 2 $1,089 1.2% $1,043 1.4% 4.9%2012 3 $1,100 1.0% $1,053 1.0% 4.8%2012 4 $1,107 0.7% $1,061 0.7% 4.7%2013 1 $1,114 0.6% $1,068 0.7% 4.4%2013 2 $1,123 0.9% $1,078 0.9% 4.4%2013 3 $1,135 1.1% $1,090 1.1% 4.4%2013 4 $1,146 0.9% $1,100 1.0% 4.4%2014 1 $1,155 0.8% $1,110 0.8% 4.2%2014 2 $1,168 1.1% $1,123 1.2% 4.3%2014 3 $1,183 1.3% $1,137 1.3% 4.3%2014 4 $1,192 0.8% $1,146 0.8% 4.3%2015 1 $1,205 1.0% $1,158 1.1% 4.2%2015 2 $1,226 1.8% $1,179 1.7% 4.2%2015 3 $1,248 1.8% $1,199 1.8% 4.2%2015 4 $1,262 1.1% $1,212 1.1% 4.3%2016 1 $1,273 0.9% $1,223 0.9% 4.3%2016 2 $1,291 1.4% $1,239 1.3% 4.2%2016 3 $1,307 1.3% $1,254 1.2% 4.1%2016 4 $1,313 0.5% $1,260 0.4% 4.2%2017 1 $1,324 0.9% $1,268 0.6% 4.3%2017 2 $1,345 1.6% $1,285 1.4% 4.3%2017 3 $1,364 1.4% $1,301 1.3% 4.4%2017 4 $1,373 0.7% $1,309 0.6% 4.6%2018 1 $1,389 1.1% $1,324 1.1% 4.7%2018 2 $1,409 1.5% $1,342 1.4% 4.7%2018 3 $1,429 1.4% $1,360 1.3% 4.8%2018 4 $1,441 0.8% $1,371 0.8% 4.9%
National Apartment MarketQuarterly and Annual Market Conditions
Source: Reis, Real Estate Solutions by Moody’s Analytics; 79 of 275 Apartment Markets
» Vacancies continuing to rise – as expected –ending the fourth quarter at 4.9%.
» Asking and effective rents still relatively healthy at 0.8% in the fourth quarter.
» Delays have moved relief from supply glut issues to next year, as 2019 promises to be the sector’s ‘cyclical high.’ Measures of demand remain strong, however.
YearAskingRent
Percent Change
Effect ive Rent
Percent Change
Vacancy Rate
2009 $1,026 ‐2.3% $969 ‐2.5% 8.0%2010 $1,045 1.8% $992 2.4% 6.6%2011 $1,070 2.4% $1,019 2.7% 5.3%2012 $1,107 3.5% $1,061 4.1% 4.7%2013 $1,146 3.5% $1,100 3.7% 4.4%2014 $1,192 4.0% $1,146 4.2% 4.3%2015 $1,262 5.8% $1,212 5.8% 4.3%2016 $1,313 4.0% $1,260 3.9% 4.2%2017 $1,373 4.6% $1,309 4.0% 4.6%2018 $1,441 4.9% $1,371 4.7% 4.9%2019 $1,500 4.2% $1,425 4.0% 5.1%2020 $1,546 3.0% $1,466 2.9% 5.2%2021 $1,582 2.4% $1,499 2.2% 5.2%2022 $1,617 2.2% $1,530 2.1% 5.3%2023 $1,651 2.1% $1,561 2.0% 5.4%

REIS, Real Estate Solutions by Moody’s Analytics
1%
2%
3%
4%
5%
6%
7%
8%
9%
10%
‐50
0
50
100
150
200
250
300
350
400
1983 1987 1991 1995 1999 2003 2007 2011 2015 2019 2023
Vacancy Rate
Units (In Thou
sand
s)
Completions Net Absorption Vacancy Percent
Forecast
National Apartment MarketSupply & Demand Trends
Source: Reis, Real Estate Solutions by Moody’s Analytics; Top 50 Primary Apartment Markets

REIS, Real Estate Solutions by Moody’s Analytics
0%
1%
2%
3%
4%
5%
6%
7%
8%
9%
‐2
‐1
0
1
2
3
4
5
6
7
1983 1987 1991 1995 1999 2003 2007 2011 2015 2019 2023
Vacancy Rate
Units (In Thousands)
Completions Net Absorption Vacancy Percent
Forecast
DC Apartment MarketSupply & Demand Trends
Source: Reis, Real Estate Solutions by Moody’s Analytics

REIS, Real Estate Solutions by Moody’s Analytics
0
1
2
3
4
5
6
2012 2013 2014 2015 2016 2017 2018
Units
(In Thou
sand
s)
Anacostia/Northeast DC Other Capitol Hill/Southwest Downtown/Logan Circle
Completions by Submarket (DC)2012-2018, Yearly
Source: Reis, Real Estate Solutions by Moody’s Analytics

REIS, Real Estate Solutions by Moody’s Analytics
0%
1%
2%
3%
4%
5%
6%
7%
8%
9%
0
2
4
6
8
10
12
14
16
18
1983 1987 1991 1995 1999 2003 2007 2011 2015 2019 2023
Vacancy Rate
Units (In Thou
sand
s)
Completions Net Absorption Vacancy Percent
Forecast
NY Apartment MarketSupply & Demand Trends
Source: Reis, Real Estate Solutions by Moody’s Analytics

REIS, Real Estate Solutions by Moody’s Analytics
Completions by Submarket (NY)2012-2018, Yearly
Source: Reis, Real Estate Solutions by Moody’s Analytics

REIS, Real Estate Solutions by Moody’s Analytics
Demographic Tailwinds
Source: U.S. Census Bureau, Population Division
3.0
3.2
3.4
3.6
3.8
4.0
4.2
4.4
4.6
4.8
5.0
19 20 21 22 23 24 25 26 27 28 29 30 31 32 33 34 35 36 37 38 39 40 41 42
Popu
latio
n (M
illions)
Age in 2018

REIS, Real Estate Solutions by Moody’s Analytics
3%
6%
9%
12%
15%
18%
21%
24%
‐150
‐100
‐50
0
50
100
150
200
1983 1987 1991 1995 1999 2003 2007 2011 2015 2019 2023
Vacancy Rate
Square Feet (In M
illions)
Completions Net Absorption Vacancy Percent
Forecast
National Office MarketSupply & Demand Trends
Source: Reis, Real Estate Solutions by Moody’s Analytics; Top 50 Primary Office Markets
REIS, Real Estate Solutions by Moody’s Analytics
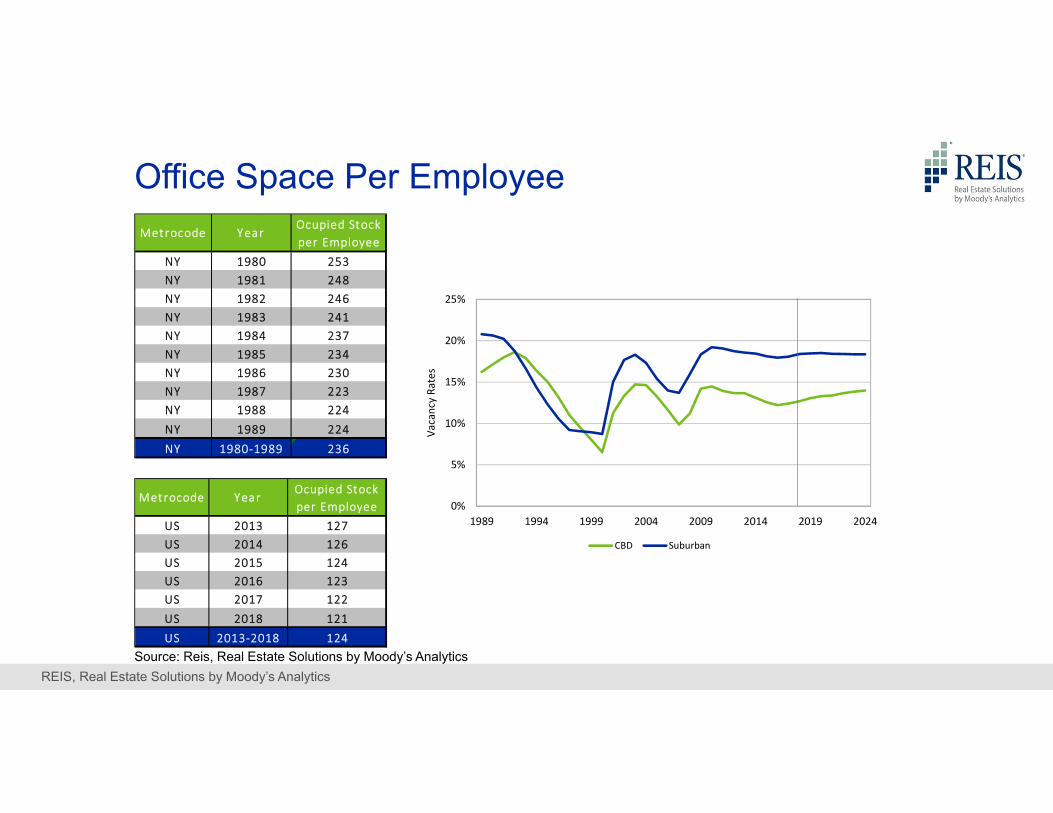
Office Space Per Employee
0%
5%
10%
15%
20%
25%
1989 1994 1999 2004 2009 2014 2019 2024
Vacancy Ra
tes
CBD Suburban
NY 1980 253NY 1981 248NY 1982 246NY 1983 241NY 1984 237NY 1985 234NY 1986 230NY 1987 223NY 1988 224NY 1989 224NY 1980‐1989 236
Metrocode YearOcupied Stock per Employee
US 2013 127US 2014 126US 2015 124US 2016 123US 2017 122US 2018 121US 2013‐2018 124
Metrocode YearOcupied Stock per Employee
Source: Reis, Real Estate Solutions by Moody’s Analytics

REIS, Real Estate Solutions by Moody’s Analytics
3.5
3.6
3.9
5.1
5.2
0 2 4 6
Bank of America/Merrill Lynch
Morgan Stanley
CitiGroup
WeWork
JPMorgan Chase & Co.
Millions of Square Feet
WeWork’s Growing InfluenceManhattan’s Largest Office Tenants by Square Footage
Source: Cushman & Wakefield(As of August 2018)
» As of September 2018, WeWork is now the largest office tenant in Manhattan with 5.3 Million Square Feet
» The Co-Sharing Company is the second largest occupier of office space in London, after government office space

REIS, Real Estate Solutions by Moody’s Analytics
2008 Y $40.48 0.3% 7.1%2009 Y $39.03 ‐3.6% 8.8%2010 Y $38.79 ‐0.6% 8.7%2011 Y $38.92 0.3% 9.2%2012 Y $39.31 1.0% 8.6%2013 Y $39.95 1.6% 7.9%2014 Y $40.66 1.8% 8.0%2015 Y $41.54 2.2% 7.8%2016 Y $42.38 2.0% 7.8%2017 Y $43.00 1.5% 8.3%2018 Y $43.35 0.8% 9.0%
Year QuarterAsking Rent
Percent Change
Vacancy Rate
2009 ‐21.5 $19.13 ‐2.0% $16.75 ‐3.7% 10.6%2010 ‐3.2 $18.99 ‐0.7% $16.51 ‐1.4% 11.0%2011 6.3 $18.99 0.0% $16.50 ‐0.1% 11.0%2012 11.3 $19.08 0.5% $16.59 0.5% 10.7%2013 12.7 $19.35 1.4% $16.83 1.4% 10.4%2014 13.4 $19.70 1.8% $17.17 2.0% 10.2%2015 12.3 $20.11 2.1% $17.55 2.2% 10.0%2016 12.4 $20.48 1.8% $17.90 2.0% 9.9%2017 9.4 $20.88 2.0% $18.27 2.1% 10.0%2018 1.4 $21.21 1.6% $18.57 1.6% 10.2%2019 5.8 $21.51 1.4% $18.84 1.5% 10.3%2020 7.5 $21.79 1.3% $19.09 1.3% 10.3%2021 7.8 $22.14 1.6% $19.39 1.6% 10.2%2022 8.1 $22.54 1.8% $19.73 1.8% 10.2%2023 8.7 $22.96 1.9% $20.09 1.8% 10.1%
Percent Change
Vacancy Rate
YearNet
Absorpt ionAsking Rent
Percent Change
Effect ive Rent
2011 4 4.5 $18.99 0.1% $16.50 0.1% 11.0%2012 1 3.5 $19.00 0.1% $16.52 0.1% 10.9%2012 2 2.7 $19.03 0.2% $16.54 0.1% 10.8%2012 3 2.1 $19.06 0.2% $16.57 0.2% 10.8%2012 4 3.1 $19.08 0.1% $16.59 0.1% 10.7%2013 1 2.9 $19.14 0.3% $16.64 0.3% 10.6%2013 2 2.9 $19.20 0.3% $16.69 0.3% 10.5%2013 3 2.2 $19.26 0.3% $16.75 0.4% 10.5%2013 4 4.6 $19.35 0.5% $16.83 0.5% 10.4%2014 1 1.2 $19.43 0.4% $16.91 0.5% 10.4%2014 2 3.3 $19.52 0.5% $16.99 0.5% 10.3%2014 3 4.1 $19.60 0.4% $17.07 0.5% 10.3%2014 4 4.8 $19.70 0.5% $17.17 0.6% 10.2%2015 1 3.6 $19.80 0.5% $17.27 0.6% 10.1%2015 2 2.5 $19.90 0.5% $17.36 0.5% 10.1%2015 3 3.7 $20.01 0.6% $17.46 0.6% 10.0%2015 4 2.5 $20.11 0.5% $17.55 0.5% 10.0%2016 1 3.1 $20.22 0.5% $17.66 0.6% 9.9%2016 2 3.8 $20.30 0.4% $17.73 0.4% 9.8%2016 3 1.1 $20.39 0.4% $17.81 0.5% 9.9%2016 4 4.4 $20.48 0.4% $17.90 0.5% 9.9%2017 1 2.7 $20.56 0.4% $17.98 0.4% 9.9%2017 2 1.1 $20.66 0.5% $18.07 0.5% 10.0%2017 3 1.9 $20.76 0.5% $18.16 0.5% 10.0%2017 4 3.6 $20.88 0.6% $18.27 0.6% 10.0%2018 1 1.2 $20.97 0.4% $18.36 0.5% 10.0%2018 2 ‐3.7 $21.03 0.3% $18.41 0.3% 10.2%2018 3 2.6 $21.13 0.5% $18.49 0.4% 10.2%2018 4 1.4 $21.21 0.4% $18.57 0.4% 10.2%
Percent Change
Vacancy Rate
Year QtrNet
Absorpt ionAsking Rent
Percent Change
Effect ive Rent
National Retail MarketQuarterly and Annual Market Conditions
Source: Reis, Real Estate Solutions by Moody’s Analytics; 77 of 190 Office MarketsNet Absorption figures are in millions of square feet.
Regional/Super Regional Malls
Neighborhood and Community Shopping Centers

REIS, Real Estate Solutions by Moody’s Analytics
5%
6%
7%
8%
9%
10%
11%
12%
‐30
‐15
0
15
30
45
60
75
1983 1987 1991 1995 1999 2003 2007 2011 2015 2019 2023
Vacancy Rate
Square Feet (in M
illions)
Completions Net Absorption Vacancy Percent
Forecast
National Retail MarketSupply & Demand Trends
Source: Reis, Real Estate Solutions by Moody’s Analytics; Top 50 Primary Retail Markets

REIS, Real Estate Solutions by Moody’s Analytics
Retail e-commerce trends
0.0%
2.0%
4.0%
6.0%
8.0%
10.0%
$0
$2
$4
$6
$8
$10
2004 2006 2008 2010 2012 2014 2016
Billion
s of Dollars in
Sales
Electronics and appliance stores
Sporting goods, hobby, musical instrument, and book stores
Clothing Stores
% of Retail Revenue from E‐commerce
Source: U.S. Census Bureau, Population Division

REIS, Real Estate Solutions by Moody’s Analytics
8%
9%
10%
11%
12%
13%
0.3%
0.4%
0.5%
0.6%
0.7%
0.8%
0.9%
1.0%
1.1%
1.2%
1.3%
2015Q4 2016Q2 2016Q4 2017Q2 2017Q4 2018Q2 2018Q4
Vacancy Rate
Effective Re
nt Growth
Effective Rent Growth Vacancy Rate
9%
10%
11%
12%
13%
14%
0.1%
0.2%
0.3%
0.4%
0.5%
0.6%
0.7%
0.8%
0.9%
1.0%
1.1%
2015Q4 2016Q2 2016Q4 2017Q2 2017Q4 2018Q2 2018Q4
Vacancy Rate
Effective Re
nt Growth
Effective Rent Growth Vacancy Rate
» Flex/R&D vacancies rose by 10 basis points to 9.8% after falling the previous quarter.
» Effective rents grew at the same clip as the past quarter.
» Warehouse/distribution vacancies fell to 9.3% in the fourth quarter.
» Some evidence of recovery on the pricing side, with effective rents growing by 0.8% (an improvement over the first half of the year).
Industrial: Upward for 2018
Source: Reis, Real Estate Solutions by Moody’s Analytics
Flex/R&D
Wareh
ouse/
Distrib
ution

REIS, Real Estate Solutions by Moody’s Analytics
‐2%
‐1%
0%
1%
2%
West Southwest South Atlantic Northeast Midwest
Year‐Over‐Year Rent Growth by Region, 2018Q4 (Non‐Climate Controlled 10x10 Units)
86%
88%
90%
92%
2015Q4 2016Q2 2016Q4 2017Q2 2017Q4 2018Q2 2018Q4
National Occupancy Rates (50 Metropolitan Areas)» Occupancies weakened by 150 basis points in the fourth quarter, ending the period at 86.6%
» Climate-controlled 10x10 unit rents fell by 2.4%, and non-climate-controlled 10x10 unit rents fell by 1.8%
» Supply concerns may ease as soon as this year, but it remains to be seen if sector fundamentals will improve significantly as it tries to absorb new deliveries.
Self-Storage in the Fourth Quarter
Source: Reis, Real Estate Solutions by Moody’s Analytics

REIS, Real Estate Solutions by Moody’s Analytics
How About All the Others?
Source: U.S. Census Bureau, Population Division
REIS, Real Estate Solutions by Moody’s Analytics
8.2%
8.3%
8.4%
8.5%
8.6%
8.7%
8.8%
8.9%
9.0%
9.1%
9.2%
9.3%
9.4%
9.5%
9.6%
2016Q4 2017Q2 2017Q4 2018Q2 2018Q4
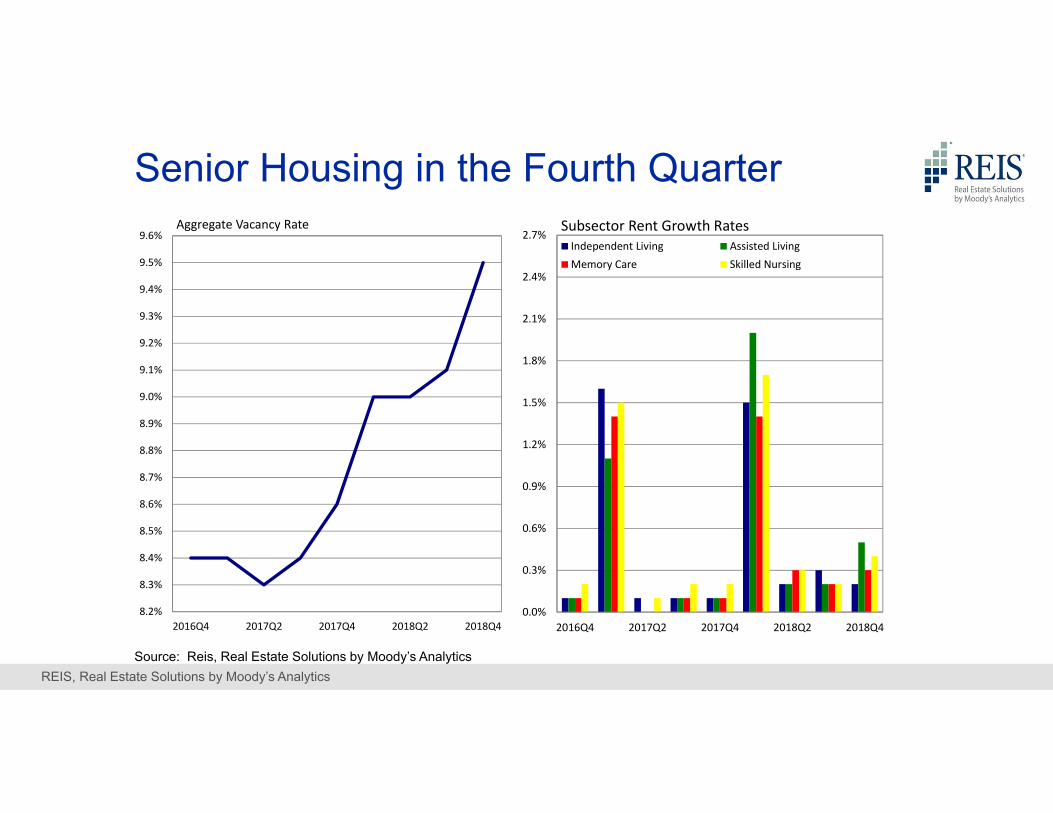
Aggregate Vacancy Rate
0.0%
0.3%
0.6%
0.9%
1.2%
1.5%
1.8%
2.1%
2.4%
2.7%
2016Q4 2017Q2 2017Q4 2018Q2 2018Q4
Subsector Rent Growth RatesIndependent Living Assisted LivingMemory Care Skilled Nursing
Senior Housing in the Fourth Quarter
Source: Reis, Real Estate Solutions by Moody’s Analytics

REIS, Real Estate Solutions by Moody’s Analytics
0
10
20
30
40
50
60
70
80
1996 1998 2000 2002 2004 2006 2008 2010 2012 20140
20
40
60
80
100
120Thousands
A Slide That Will Remain UntitledHow Did That Slide Get In There?
Source: Center for Disease Control
26

REIS, Real Estate Solutions by Moody’s Analytics
Vacancy Rate Vacancy Chg, BPS Rent Growth Inventory GrowthBed 4.6% ‐40 2.7% 5.4%Unit 2.5% ‐10 2.6% 2.6%
National Student Housing Market, Fall 2018 – Fall 2019
0% 1% 2% 3% 4% 5%
National
Northeast
South Atlantic
Midwest
Southwest
West
Regional Rent Growth, Fall 2018 – Fall 2019
Unit Bed
» Tables present Fall 2018 to Fall 2019 expected trends in vacancies and rent change.
» We expect a continued decrease in vacancies, despite strong supply growth, particularly for properties that rent by the Bed.
» We expect a good year (Fall 2018 to Fall 2019) for student housing properties – with properties in the Southwest that rent by the Unit forecasted to show the strongest rent growth.
Student Housing in the Fourth Quarter
Source: Reis, Real Estate Solutions by Moody’s Analytics

REIS, Real Estate Solutions by Moody’s Analytics
0%
1%
2%
3%
4%
5%
6%
7%
8%
9%
0.0%
0.3%
0.6%
0.9%
1.2%
1.5%
1.8%
2.1%
2.4%
2.7%
Detroit Oakland‐EastBay
Nashville Cincinnati Los Angeles US Aggregate
Vacancy RateRent Growth
Top Five Affordable Housing Markets by 2018Q4 Rent Growth
Affordable Rent Growth Market Rate Rent Growth Affordable Vacancy Market Rate Vacancy
» National aggregations for vacancies of LIHTC properties remained very tight at 2.3% (though this represents a 20 basis point increase year over year).
» Because of tax reform lowering the value of LIHTC tax credits, we estimate a 40% reduction in LIHTC deliveries over the five year forecast period – relative to baseline. What is to be done?
LIHTC in the Fourth Quarter
Source: Reis, Real Estate Solutions by Moody’s Analytics

REIS, Real Estate Solutions by Moody’s Analytics
Driverless CarsInvestor’s Expectations of AV’s Impact on Parking and Development Opportunities
Source: Deloitte

REIS, Real Estate Solutions by Moody’s Analytics
» Opportunity Zones as the latest iteration of “investing in places.”
» Who wins when places compete for business? The Amazon HQ2 story.
» How should one think of policy interventions and assess its impacts?
» What about other real estate related policy initiatives? Is infrastructure spending even part of the conversation these days (it should be)?
The Changing Policy Environment

REIS, Real Estate Solutions by Moody’s Analytics
2.3%
2.4%
2.5%
2.6%
2.7%
2.8%
2.9%
3.0%
11/25/2018 12/5/2018 12/15/2018 12/25/2018 1/4/2019 1/14/2019 1/24/2019 2/3/2019
2 Yr 3 Yr 5 Yr
2.1%
2.3%
2.5%
2.7%
2.9%
3.1%
3.3%
3.5%
11/25/2018 12/5/2018 12/15/2018 12/25/2018 1/4/2019 1/14/2019 1/24/2019 2/3/2019
2 Yr 3 Yr 5 Yr 10 Yr 20 Yr 30 Yr
Yield Curve TighteningShorter term maturities invert, longer maturities retain higher rates
Shorter term InversionShorter term yields vs. 5‐Yr TSY recently inverted
However…Longer maturities have not yet dropped below shorter term yields
Source: U.S. Department of the Treasury

REIS, Real Estate Solutions by Moody’s Analytics
» The US economy grew by 2.9% in 2018 – matching the recent cyclical high from 2014, dated from when the last recession ended.
» A climb down back to the low 2s in 2019 does not mean a contraction.
» Short of an exogenous shock, a recession (however minor) can stem from a multitude of firms and individuals cutting back, however slightly, because they are acting prudently. The systemic result, however, can be economic contraction. Are you talking yourself into a recession?
» Multifamily and Self-Storage vacancies rising because of supply conditions, but will ease as soon as next year. Student Housing and Affordable Housing properties are relatively tight; Senior Housing needs to deal with demographic challenges. Other commercial property types not doing nearly as well as multifamily (with the possible exception of Industrial).
Summary and Parting ThoughtsSo, what will cause the next recession?

Economic Expansion & Real EstateWhat’s Next – Near Term & Long Term?Business Cycles, Technological Change, the Policy Environment, and the Future of Multifamily & Commercial Real Estate
April 30, 2019Victor Calanog PhD | Chief EconomistMoody’s Analytics | REIS