economic effects of air transport liberalization in africa
TRANSCRIPT

Introduction Empirical Model and Data Results Conclusions
Economic Effects ofProgressive Air Transport
Liberalization in Africa
Megersa A. AbateSwedish National Road and Transport Research
Institute
July 17, 2014

Introduction Empirical Model and Data Results Conclusions
Outline
Introductionresearch questionmotivation
Empirical Model and Dataeconometric modelsdata
Results
Conclusions

Introduction Empirical Model and Data Results Conclusions
Two main research questions
Did liberalization of intra-African air transportmarket lead to:
1 improvement in service quality?2 reduction in airfares?
Introduction Empirical Model and Data Results Conclusions
Two main research questions
Did liberalization of intra-African air transportmarket lead to:
1 improvement in service quality?
2 reduction in airfares?
Introduction Empirical Model and Data Results Conclusions
Two main research questions
Did liberalization of intra-African air transportmarket lead to:
1 improvement in service quality?2 reduction in airfares?

Introduction Empirical Model and Data Results Conclusions
Where is Africa in global aviation?

Introduction Empirical Model and Data Results Conclusions
Why low air transport flow in Africa (1) ?
Economic realities
1 Low level of GDP ( 2/3 of air transport growth isexplained by GDP growth)
2 Low level of trade, esp. intra-African trade3 Low airline and airport capacity (SS side)4 Sparse market (DD side)

Introduction Empirical Model and Data Results Conclusions
Why low air transport flow in Africa (1) ?
Economic realities
1 Low level of GDP ( 2/3 of air transport growth isexplained by GDP growth)
2 Low level of trade, esp. intra-African trade
3 Low airline and airport capacity (SS side)4 Sparse market (DD side)

Introduction Empirical Model and Data Results Conclusions
Why low air transport flow in Africa (1) ?
Economic realities
1 Low level of GDP ( 2/3 of air transport growth isexplained by GDP growth)
2 Low level of trade, esp. intra-African trade3 Low airline and airport capacity (SS side)
4 Sparse market (DD side)

Introduction Empirical Model and Data Results Conclusions
Why low air transport flow in Africa (1) ?
Economic realities
1 Low level of GDP ( 2/3 of air transport growth isexplained by GDP growth)
2 Low level of trade, esp. intra-African trade3 Low airline and airport capacity (SS side)4 Sparse market (DD side)
Introduction Empirical Model and Data Results Conclusions
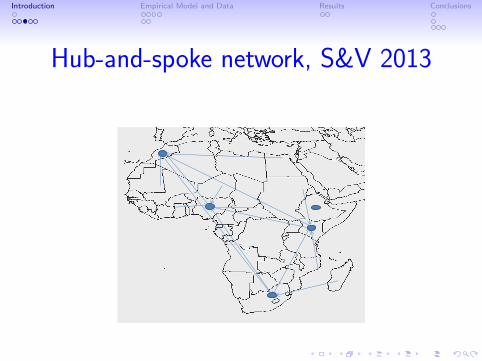
Hub-and-spoke network, S&V 2013

Introduction Empirical Model and Data Results Conclusions
Why low air transport flow in Africa (2) ?
Restrictive regulatory environment
1 Web of restrictive Bilateral Air Service Agreements2 Slow implementation of the Yamoussoukro
Decision (YD) which fully liberalized African airtransport markets in 2000- Why?
1 Lack of institutional and legal frameworks(competition policy, executing agency, and disputesettlement mechanisms)
2 Lack of adequate knowledge of the economic effectsof the full implementation of the YD

Introduction Empirical Model and Data Results Conclusions
Why low air transport flow in Africa (2) ?
Restrictive regulatory environment
1 Web of restrictive Bilateral Air Service Agreements
2 Slow implementation of the YamoussoukroDecision (YD) which fully liberalized African airtransport markets in 2000- Why?
1 Lack of institutional and legal frameworks(competition policy, executing agency, and disputesettlement mechanisms)
2 Lack of adequate knowledge of the economic effectsof the full implementation of the YD

Introduction Empirical Model and Data Results Conclusions
Why low air transport flow in Africa (2) ?
Restrictive regulatory environment
1 Web of restrictive Bilateral Air Service Agreements2 Slow implementation of the Yamoussoukro
Decision (YD) which fully liberalized African airtransport markets in 2000- Why?
1 Lack of institutional and legal frameworks(competition policy, executing agency, and disputesettlement mechanisms)
2 Lack of adequate knowledge of the economic effectsof the full implementation of the YD

Introduction Empirical Model and Data Results Conclusions
Why low air transport flow in Africa (2) ?
Restrictive regulatory environment
1 Web of restrictive Bilateral Air Service Agreements2 Slow implementation of the Yamoussoukro
Decision (YD) which fully liberalized African airtransport markets in 2000- Why?
1 Lack of institutional and legal frameworks(competition policy, executing agency, and disputesettlement mechanisms)
2 Lack of adequate knowledge of the economic effectsof the full implementation of the YD

Introduction Empirical Model and Data Results Conclusions
Rationale for Liberalization
To Maximize benefits from market competition
Facilitate better market access for airlines
Both arguments are usually forwarded in Africaimproved market access and to lower priceswhich are usually higher than world averages

Introduction Empirical Model and Data Results Conclusions
Econometric models
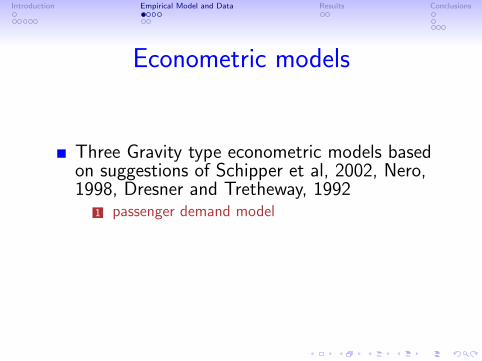
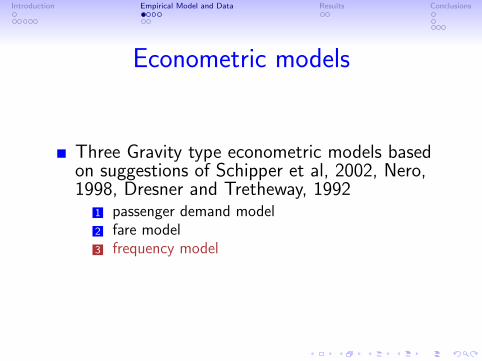
Three Gravity type econometric models basedon suggestions of Schipper et al, 2002, Nero,1998, Dresner and Tretheway, 1992
1 passenger demand model2 fare model3 frequency model
Introduction Empirical Model and Data Results Conclusions
Econometric models
Three Gravity type econometric models basedon suggestions of Schipper et al, 2002, Nero,1998, Dresner and Tretheway, 1992
1 passenger demand model
2 fare model3 frequency model

Introduction Empirical Model and Data Results Conclusions
Econometric models
Three Gravity type econometric models basedon suggestions of Schipper et al, 2002, Nero,1998, Dresner and Tretheway, 1992
1 passenger demand model2 fare model
3 frequency model
Introduction Empirical Model and Data Results Conclusions
Econometric models
Three Gravity type econometric models basedon suggestions of Schipper et al, 2002, Nero,1998, Dresner and Tretheway, 1992
1 passenger demand model2 fare model3 frequency model

Introduction Empirical Model and Data Results Conclusions
Passenger demand model
passrt = β1 + β2fare/kmrt + β3freqrt + β4incomert
+ β5poprt + β6distrt + εrt
Introduction Empirical Model and Data Results Conclusions
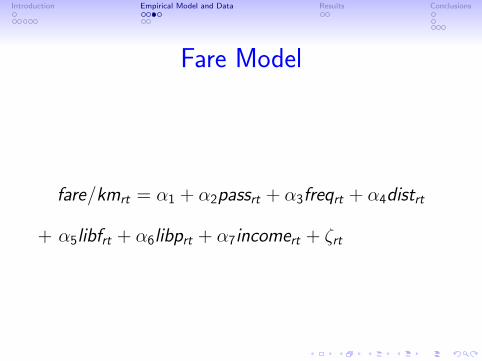
Fare Model
fare/kmrt = α1 + α2passrt + α3freqrt + α4distrt
+ α5libfrt + α6libprt + α7incomert + ζrt

Introduction Empirical Model and Data Results Conclusions
Frequency model
freqrt = λ1 +λ2passrt +λ3acsizert +λ4distrt +λ5libfrt
+λ6libprt + λ7operatorsrt + υrt

Introduction Empirical Model and Data Results Conclusions
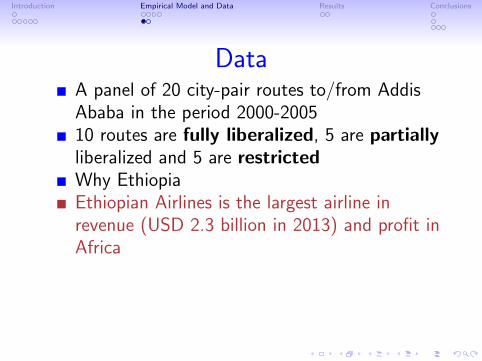
DataA panel of 20 city-pair routes to/from AddisAbaba in the period 2000-2005
10 routes are fully liberalized, 5 are partiallyliberalized and 5 are restrictedWhy EthiopiaEthiopian Airlines is the largest airline inrevenue (USD 2.3 billion in 2013) and profit inAfricaIts recent success is attributed to ”pursuit ofmore liberal bilaterals (on a reciprocal basis)”Main data sources:
1 BASAs of Ethiopia2 OAG for fare (IATA); WDI, WB.

Introduction Empirical Model and Data Results Conclusions
DataA panel of 20 city-pair routes to/from AddisAbaba in the period 2000-200510 routes are fully liberalized, 5 are partiallyliberalized and 5 are restricted
Why EthiopiaEthiopian Airlines is the largest airline inrevenue (USD 2.3 billion in 2013) and profit inAfricaIts recent success is attributed to ”pursuit ofmore liberal bilaterals (on a reciprocal basis)”Main data sources:
1 BASAs of Ethiopia2 OAG for fare (IATA); WDI, WB.

Introduction Empirical Model and Data Results Conclusions
DataA panel of 20 city-pair routes to/from AddisAbaba in the period 2000-200510 routes are fully liberalized, 5 are partiallyliberalized and 5 are restrictedWhy Ethiopia
Ethiopian Airlines is the largest airline inrevenue (USD 2.3 billion in 2013) and profit inAfricaIts recent success is attributed to ”pursuit ofmore liberal bilaterals (on a reciprocal basis)”Main data sources:
1 BASAs of Ethiopia2 OAG for fare (IATA); WDI, WB.
Introduction Empirical Model and Data Results Conclusions
DataA panel of 20 city-pair routes to/from AddisAbaba in the period 2000-200510 routes are fully liberalized, 5 are partiallyliberalized and 5 are restrictedWhy EthiopiaEthiopian Airlines is the largest airline inrevenue (USD 2.3 billion in 2013) and profit inAfrica
Its recent success is attributed to ”pursuit ofmore liberal bilaterals (on a reciprocal basis)”Main data sources:
1 BASAs of Ethiopia2 OAG for fare (IATA); WDI, WB.

Introduction Empirical Model and Data Results Conclusions
DataA panel of 20 city-pair routes to/from AddisAbaba in the period 2000-200510 routes are fully liberalized, 5 are partiallyliberalized and 5 are restrictedWhy EthiopiaEthiopian Airlines is the largest airline inrevenue (USD 2.3 billion in 2013) and profit inAfricaIts recent success is attributed to ”pursuit ofmore liberal bilaterals (on a reciprocal basis)”
Main data sources:
1 BASAs of Ethiopia2 OAG for fare (IATA); WDI, WB.

Introduction Empirical Model and Data Results Conclusions
DataA panel of 20 city-pair routes to/from AddisAbaba in the period 2000-200510 routes are fully liberalized, 5 are partiallyliberalized and 5 are restrictedWhy EthiopiaEthiopian Airlines is the largest airline inrevenue (USD 2.3 billion in 2013) and profit inAfricaIts recent success is attributed to ”pursuit ofmore liberal bilaterals (on a reciprocal basis)”Main data sources:
1 BASAs of Ethiopia
2 OAG for fare (IATA); WDI, WB.

Introduction Empirical Model and Data Results Conclusions
DataA panel of 20 city-pair routes to/from AddisAbaba in the period 2000-200510 routes are fully liberalized, 5 are partiallyliberalized and 5 are restrictedWhy EthiopiaEthiopian Airlines is the largest airline inrevenue (USD 2.3 billion in 2013) and profit inAfricaIts recent success is attributed to ”pursuit ofmore liberal bilaterals (on a reciprocal basis)”Main data sources:
1 BASAs of Ethiopia2 OAG for fare (IATA); WDI, WB.
Introduction Empirical Model and Data Results Conclusions
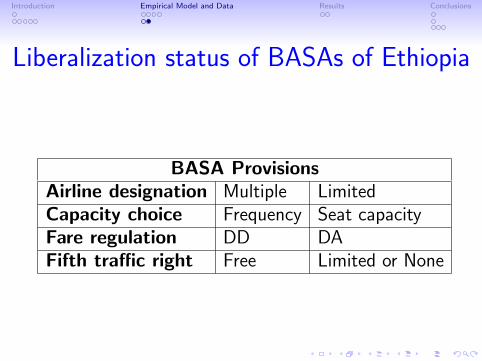
Liberalization status of BASAs of Ethiopia
BASA ProvisionsAirline designation Multiple LimitedCapacity choice Frequency Seat capacityFare regulation DD DAFifth traffic right Free Limited or None

Introduction Empirical Model and Data Results Conclusions
Econometric results
Demand Fare Frequency
1 2
Fare/km -0.719*
Distance -0.400** -0.258*** -0.306*** -0.340**
Population 0.264***
Income -0.0613 -0.117** -0.0536**
Frequency 0.593*** -0.0992** -0.0264**
No. of passengers 0.251*** 0.0222* 0.710***
Full liberalization -0.206* -0.1 0.350**
Partial liberalization -0.0783 -0.0304 0.380*
Aircraft size -0.0483**
Number of operators 0.0867
Year Effect Yes Yes Yes
Constant 2.888** -0.801 0.561 2.888**
R-squared 0.86 0.17 0.65 0.83
Observations 120 120 120 120
Introduction Empirical Model and Data Results Conclusions
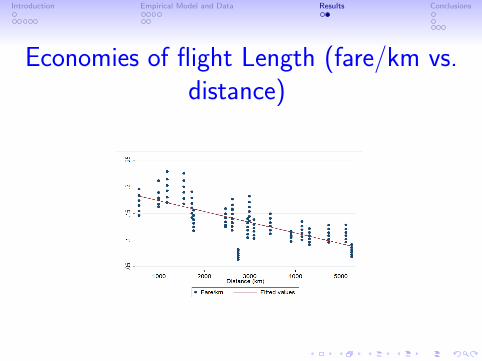
Economies of flight Length (fare/km vs.distance)

Introduction Empirical Model and Data Results Conclusions
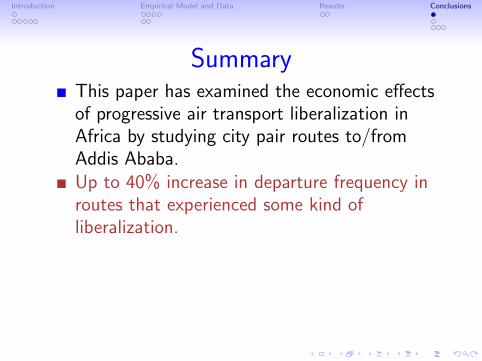
SummaryThis paper has examined the economic effectsof progressive air transport liberalization inAfrica by studying city pair routes to/fromAddis Ababa.
Up to 40% increase in departure frequency inroutes that experienced some kind ofliberalization.There is a higher increase in the number ofdeparture frequency in routes whichexperienced partial liberalization relative tofully liberalized ones.No significant effect of liberalization on fare.
Introduction Empirical Model and Data Results Conclusions
SummaryThis paper has examined the economic effectsof progressive air transport liberalization inAfrica by studying city pair routes to/fromAddis Ababa.Up to 40% increase in departure frequency inroutes that experienced some kind ofliberalization.
There is a higher increase in the number ofdeparture frequency in routes whichexperienced partial liberalization relative tofully liberalized ones.No significant effect of liberalization on fare.

Introduction Empirical Model and Data Results Conclusions
SummaryThis paper has examined the economic effectsof progressive air transport liberalization inAfrica by studying city pair routes to/fromAddis Ababa.Up to 40% increase in departure frequency inroutes that experienced some kind ofliberalization.There is a higher increase in the number ofdeparture frequency in routes whichexperienced partial liberalization relative tofully liberalized ones.
No significant effect of liberalization on fare.

Introduction Empirical Model and Data Results Conclusions
SummaryThis paper has examined the economic effectsof progressive air transport liberalization inAfrica by studying city pair routes to/fromAddis Ababa.Up to 40% increase in departure frequency inroutes that experienced some kind ofliberalization.There is a higher increase in the number ofdeparture frequency in routes whichexperienced partial liberalization relative tofully liberalized ones.No significant effect of liberalization on fare.

Introduction Empirical Model and Data Results Conclusions
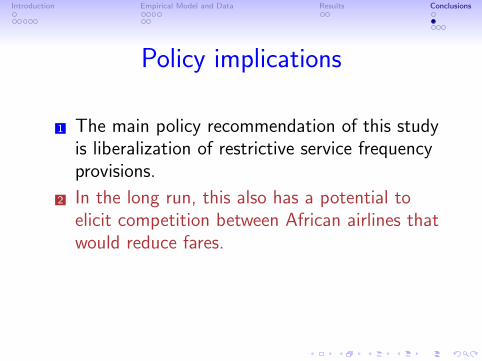
Policy implications
1 The main policy recommendation of this studyis liberalization of restrictive service frequencyprovisions.
2 In the long run, this also has a potential toelicit competition between African airlines thatwould reduce fares.
3 Address the huge knowledge gap in Africanaviation through basic research
Introduction Empirical Model and Data Results Conclusions
Policy implications
1 The main policy recommendation of this studyis liberalization of restrictive service frequencyprovisions.
2 In the long run, this also has a potential toelicit competition between African airlines thatwould reduce fares.
3 Address the huge knowledge gap in Africanaviation through basic research

Introduction Empirical Model and Data Results Conclusions
Introduction Empirical Model and Data Results Conclusions
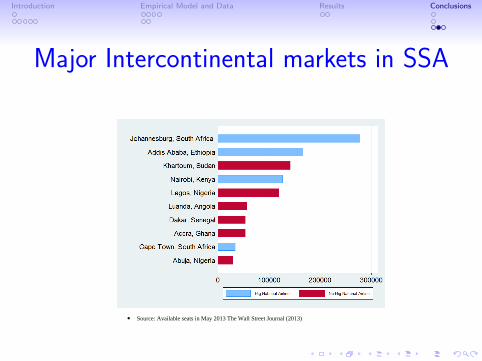
Major Intercontinental markets in SSA
Source: Available seats in May 2013 The Wall Street Journal (2013)

Introduction Empirical Model and Data Results Conclusions
Contacts
Megersa Abera Abate (Ph.D.)Swedish National Road and Transport
Research Institute
[email protected] or [email protected] for full paper:sites.google.com/site/megersabate