economic development 2013.05.24
DESCRIPTION
Economic Development 2013.05.24 . ED : Technological Catch-up * Some parts of this note are borrowed from some of the references for teaching purpose only. Semester: Spring 2013 Time: Friday 9:00~12:00 am Class Room: No. 322 Professor: Yoo Soo Hong - PowerPoint PPT PresentationTRANSCRIPT

1
Economic Development <Lecture Note 7> 2013.05.24
ED: Technological Catch-up* Some parts of this note are borrowed from some of the references for teaching
purpose only.
Semester: Spring 2013 Time: Friday 9:00~12:00 am Class Room: No. 322 Professor: Yoo Soo Hong Office Hour: By appointment Mobile: 010-4001-8060 E-mail: [email protected] Home P.: //yoosoohong.weebly.com
2
Definition of Technology
o Technology is the knowledge useful for production of goods and services.
Importance of Technology
o The history of human being is the history of knowledge (science and technology).
o Technology and productivity are the main engines of economic growth.
o Technology is the main determinant of competitiveness.
o Technology affects welfare of individuals and the society.
Technology and Development
3
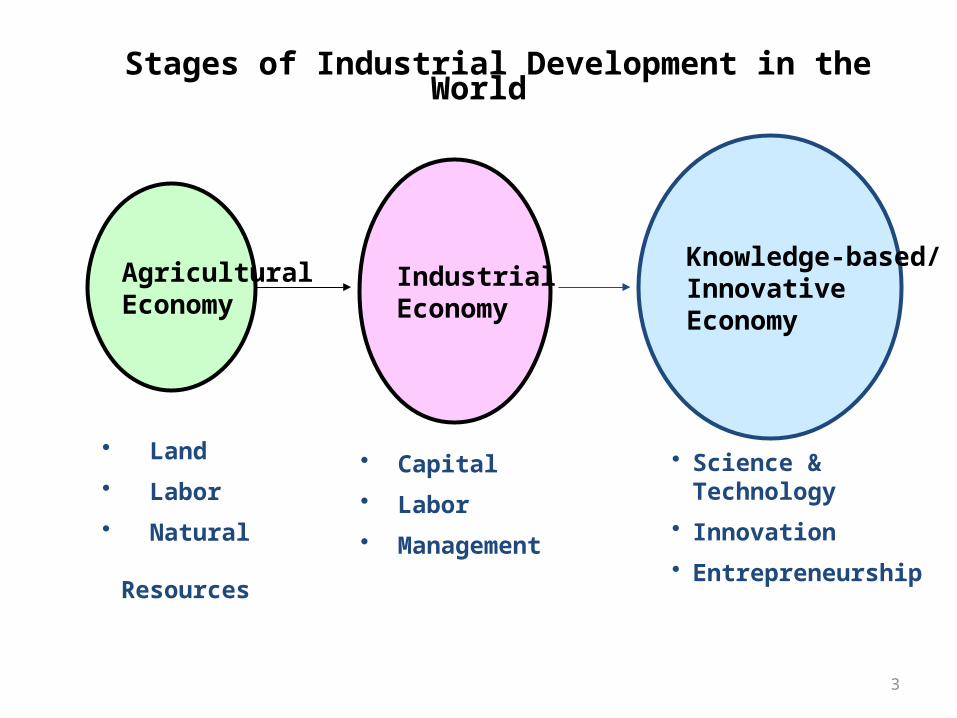
Stages of Industrial Development in the World
Agricultural Economy
IndustrialEconomy
Knowledge-based/InnovativeEconomy
• Land• Labor• Natural
Resources
• Capital• Labor• Management
• Science & Technology• Innovation• Entrepreneurship

4
Technology and Development
Social Infrastructure, Culture And Institutions
Economic Growth
Technology Development
Resources for education, health, communication,Employment
Resources for technologydevelopment
Productivitygains
Advances in medicine,communications, agriculture,energy,Manufacturing, etc.
Knowledge,creativity
Source: UNDP. 2001

5
Two Patterns (Stages) of Economic Growth o Extensive Growth - Increasing production by increasing input of production factors o Intensive Growth - Increasing production by productivity increase (More production is possible with the same resources.)
Technology, Productivity and Economic Growth
Technology → Productivity → Trade and Industry → Economic Growth
Technology and Economic Development

6
Technology and Economic Growth
Creation of Technology
Investment in Technology
Innovation
Increase in ProductivityStrengthening International CompetitivenessIncreasing Trade
Economic Growth
First Stage
Second Stage
Virtuous Circle (Increase sin Income, Demand, Investment, etc.)
7
120
100
80
60
40
20
0
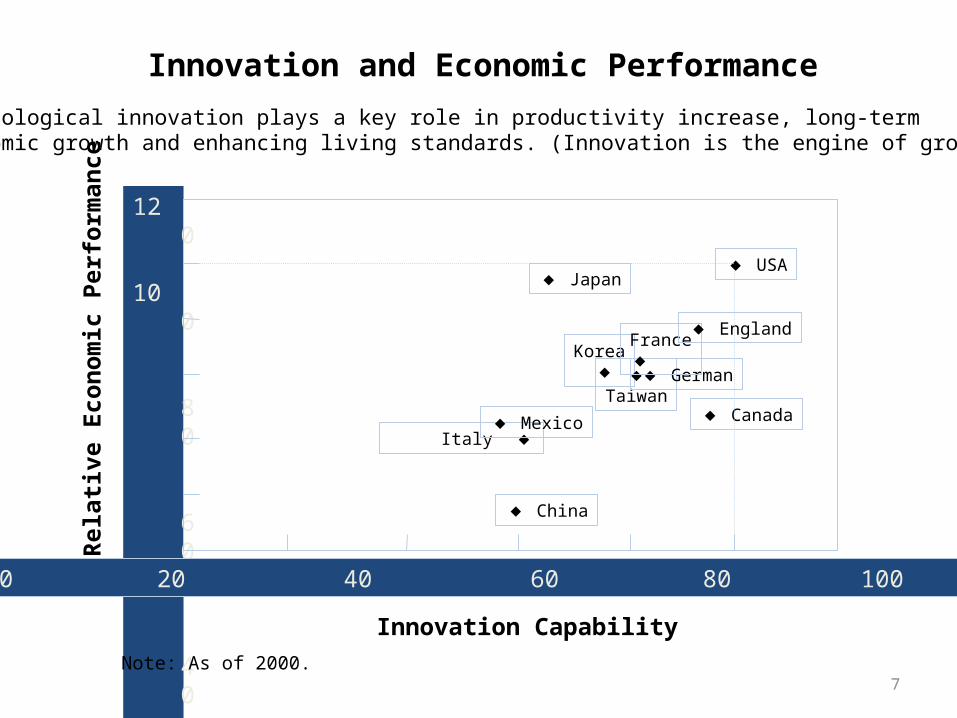
- Technological innovation plays a key role in productivity increase, long-term economic growth and enhancing living standards. (Innovation is the engine of growth.)
Innovation Capability
0 20 40 60 80 100 120
◆ China
Italy ◆ ◆ Mexico
Korea ◆
◆ Japan
◆Taiwan
◆ German
France◆
◆ Canada
◆ England
◆ USA
Innovation and Economic PerformanceR
elat
ive
Econ
omic
Per
form
ance
Note: As of 2000.

8
Two different Development Stages
Extensive Growth:Input-driven growth
Intensive Growth:Innovation (productivity)-driven Growth
- Increase in inputs (e.g. employment, education level, stock of physical capital: mobilization of resources)
- Increase in the output per unit of input (e.g. better management, better economic policy, increase in knowledge, technological progress)
- Diminishing returns - Constant returns
- Limited Growth - Sustained growth
- Based on perspiration - Based on inspiration

9
Sources of Economic Growth in Asia
Note: TFP= Total Factor Productivity Source: Japan Economic Research Center(1999)
(%)
PeriodGrowth Rate Factor Contribution
GDP Labor Capital Tech-nology Labor Capital TFP
Korea 1972~96 8.6 3.0 9.0 2.0 14 63 23
Taiwan 1972~96 8.0 2.6 10.1 0.9 13 75 11
Thailand 1972~96 7.6 2.7 9.0 1.2 14 70 15
Malaysia 1972~96 7.4 3.5 11.3 -0.8 19 92 -11
Indonesia 1978~96 6.8 2.9 8.7 0.4 n.a. n.a. n.a.
Philippines 1980~96 2.3 3.2 2.4 -0.4 54 62 -16
China 1980~96 10.1 2.8 10.8 2.4 11 65 24

10
Technology Divide
- A small number of industrialized countries provide practically all the world’s technology innovation.
- Some developing countries are able to adopt these technolo-gies in production and consumption.
- The remaining part is technologically disconnected, neither in-novating nor adopting foreign technologies.
11
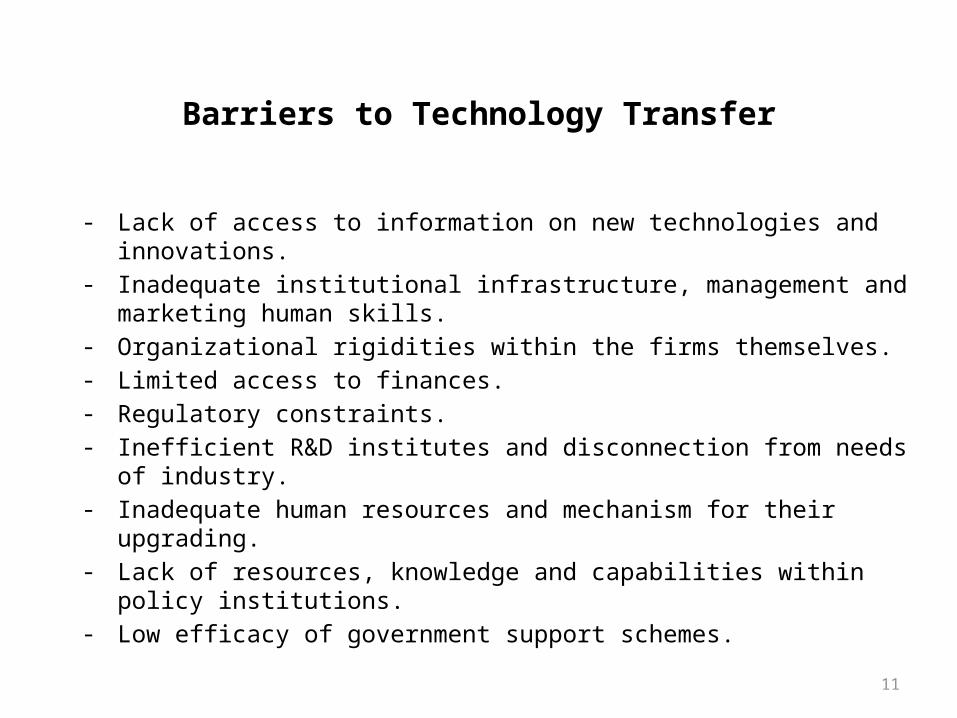
Barriers to Technology Transfer
- Lack of access to information on new technologies and innovations.- Inadequate institutional infrastructure, management and marketing human
skills.- Organizational rigidities within the firms themselves.- Limited access to finances.- Regulatory constraints.- Inefficient R&D institutes and disconnection from needs of industry.- Inadequate human resources and mechanism for their upgrading.- Lack of resources, knowledge and capabilities within policy institutions.- Low efficacy of government support schemes.
Technological Change
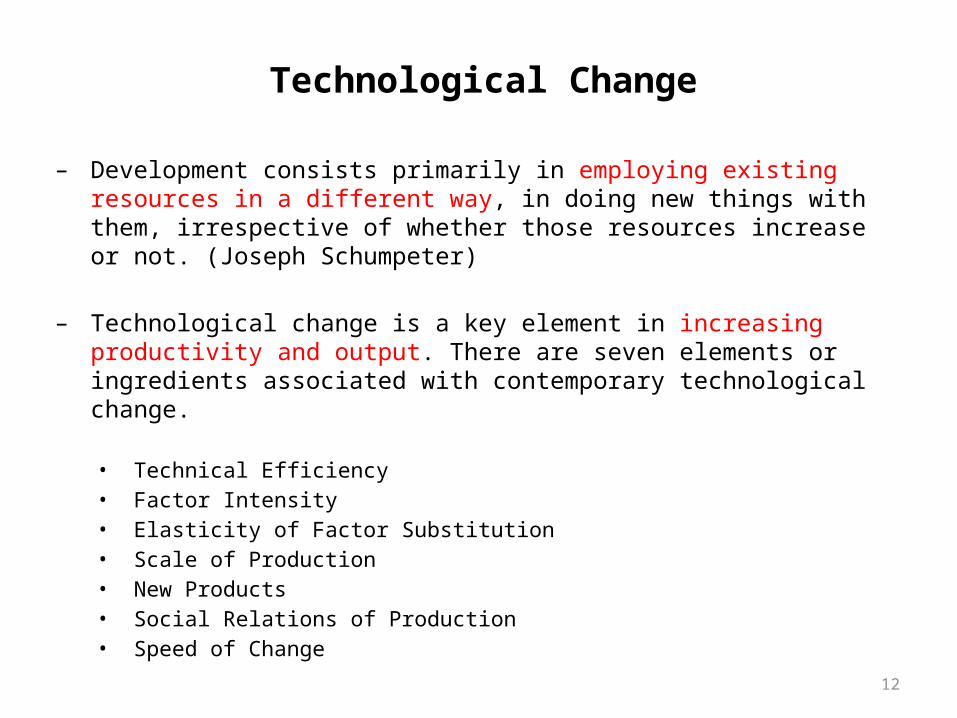
– Development consists primarily in employing existing resources in a differ-ent way, in doing new things with them, irrespective of whether those re-sources increase or not. (Joseph Schumpeter)
– Technological change is a key element in increasing productivity and output. There are seven elements or ingredients associated with contemporary technological change.
• Technical Efficiency• Factor Intensity• Elasticity of Factor Substitution• Scale of Production• New Products• Social Relations of Production• Speed of Change
12

– Increases in technical change are recognized and usually accompanied by changes in factor intensity, reductions in the elasticity of factor substitution, increases in scale, shifts in products, changes in the social relations of pro-duction, and increases in the speed of change itself.
– Diffusion of technological change takes time and involves costs, because of its complexity. The nature of technology appropriate to the development process differs from that elaborated abroad because of the different costs and prices present in rich and poor countries.
– An appropriate or intermediate technology is likely to combine labor inten-sity with other characteristics that differ form the most advanced technolo-gies of the affluent countries.
13

14
Knowledge Economy
Why knowledge now?
- “Throughout history, relative economic performance has been closely associ-ated with the capacity of countries to participate in successive technology/knowledge revolutions (agriculture, manufacturing, services, knowledge soci-eties)”;
- “Knowledge has played a critical role in differentiating the long run economic performance of countries”;
- “In the last 50 years, economic growth has been closely associated with ur-banization, emergence of new organizational forms, and regional and global trade—all these trends, in turn, are closely linked to agglomeration of people and ideas”
Concept of KBE or KE
- An economy where creation, circulation (dissemination) and utilization of knowledge is the core (engine) of growth. (OECD)
15
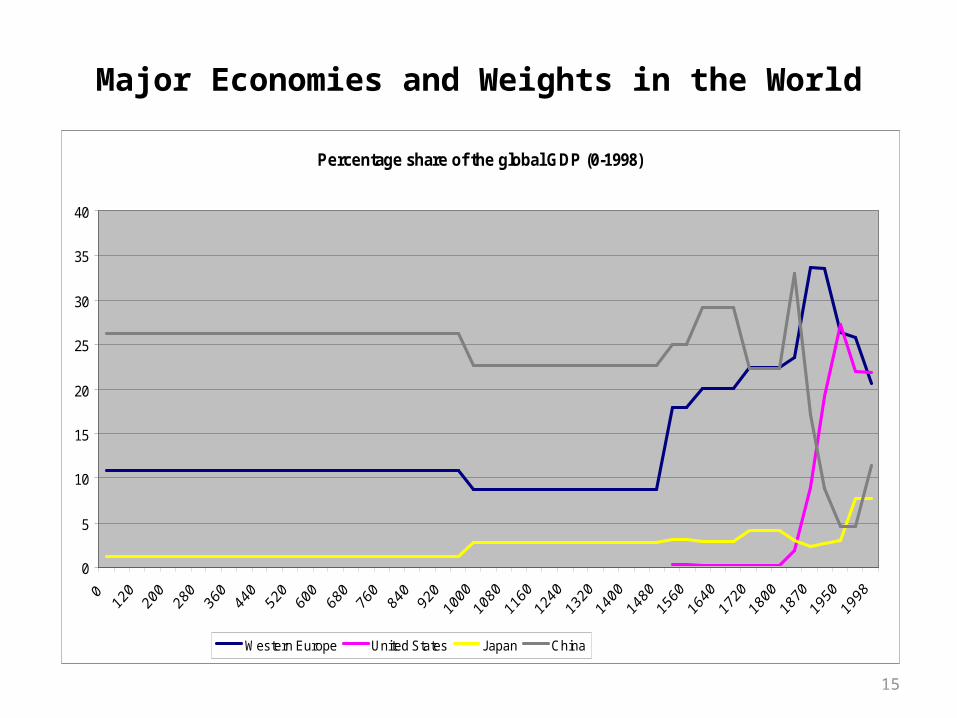
Percentage share of the global GDP (0-1998)
0
5
10
15
20
25
30
35
40
Western Europe United States Japan China
Major Economies and Weights in the World

16
0
2
4
6
8
10
12
14
1960 1965 1970 1975 1980 1985 1990 1995 2000
K n o w le d g e m a k e s th e D if fe re n c e K n o w le d g e m a k e s th e D if fe r e n c e b e tw e e n P o v e r ty a n d W e a lth . . .b e tw e e n P o v e r ty a n d W e a lth . . .
R e p . o f K o r e a
G h a n a
T h o u s a n d s o f c o n s ta n t 1 9 9 5 U S d o lla rs
D if fe re n c e a t t r ib u te d to k n o w le d g e
D if fe re n c e d u e to p h y s ic a l a n d h u m a n c a p ita l
Knowledge Gap and Wealth of Nations

17
Emerging Knowledge Economy
Facts about Knowledge Revolution:
Increased generation/codification of knowledge (e.g., patents granted in the US: from 49,971 in 1963 to 175,983 in 2000) Closer links with science base/increased rate of innovation/shorter product life cycles
Increased importance of education, up-skilling of labor force, and life long learning
Growing investment in intangibles (R&D, education, brands…) – OECD countries spend more than $520 billion per year in R&D
Value added increasingly associated with investment in intangibles such as branding, marketing, logistics/information management
Innovation and productivity increase more important in competitiveness and GDP growth
Increased Globalization and Competition
Constant change and competition implies the need of constant restructuring and upgrading: the ability to create, access and use knowledge is becoming the fundamental determinant of global competitiveness.

18
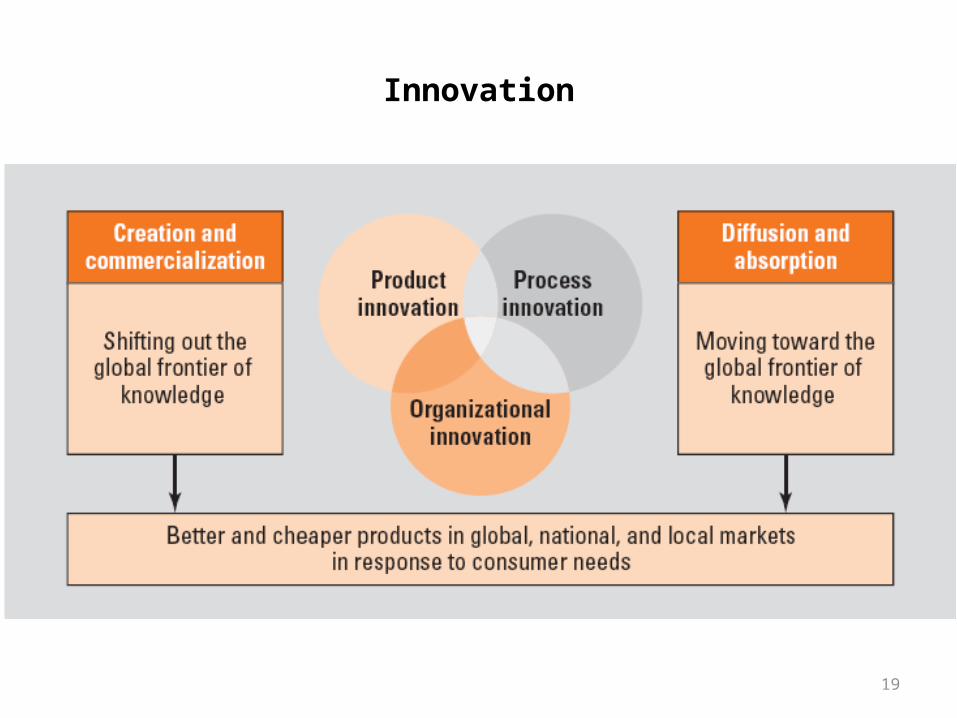
Innovation
19
20
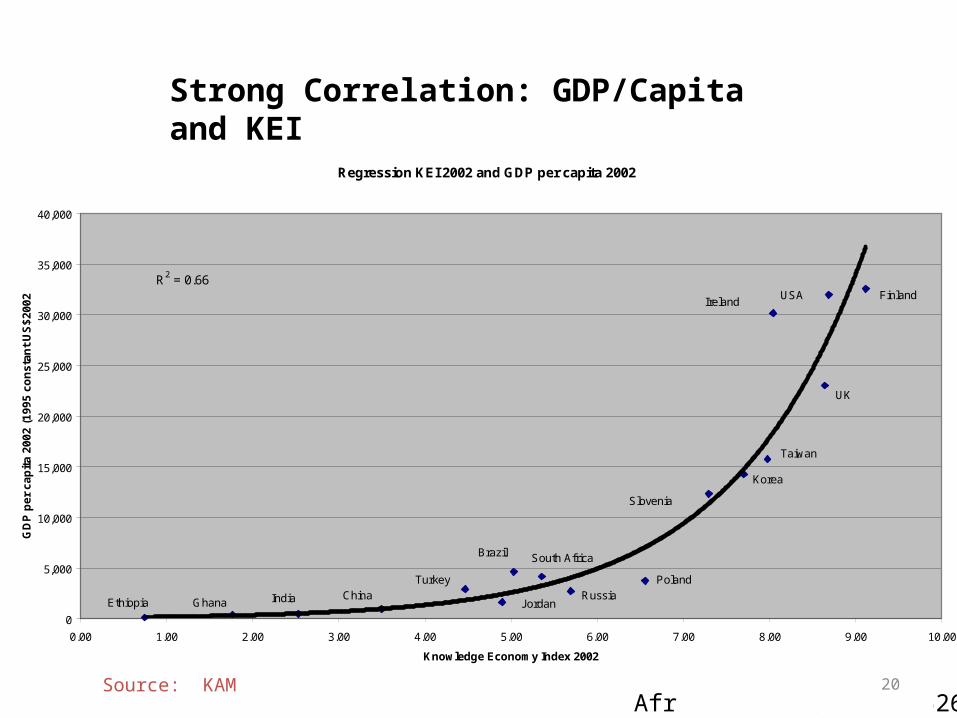
Strong Correlation: GDP/Capita and KEI
Source: KAMAfrica GDP/capita = $2624
Regression KEI 2002 and GDP per capita 2002
0
5,000
10,000
15,000
20,000
25,000
30,000
35,000
40,000
0.00 1.00 2.00 3.00 4.00 5.00 6.00 7.00 8.00 9.00 10.00
Knowledge Economy Index 2002
GD
P pe
r cap
ita 2
002
(199
5 co
nsta
nt U
S$20
02)
R2 = 0.66Finland
Brazil
ChinaIndia
Korea
RussiaJordan
Ireland
Poland
South Africa
Ethiopia Ghana
Turkey
USA
UK
Slovenia
Taiwan
21
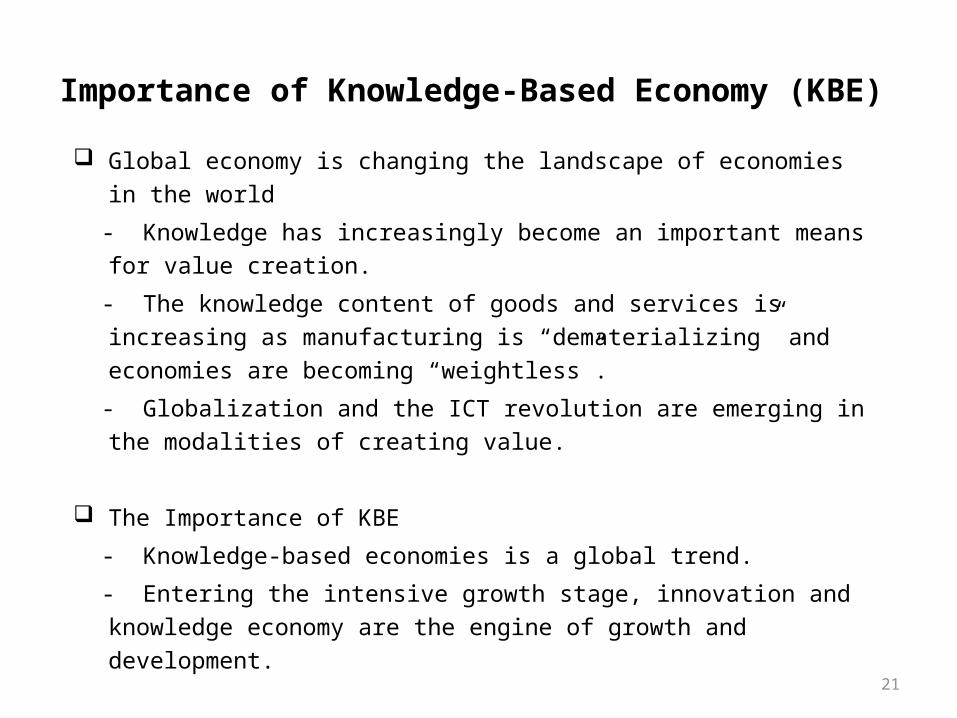
Global economy is changing the landscape of economies in the world
- Knowledge has increasingly become an important means for value cre-ation.
- The knowledge content of goods and services is increasing as manu-facturing is “dematerializing” and economies are becoming “weightless”.
- Globalization and the ICT revolution are emerging in the modalities of creating value.
The Importance of KBE
- Knowledge-based economies is a global trend.
- Entering the intensive growth stage, innovation and knowledge econ-omy are the engine of growth and development.
Importance of Knowledge-Based Economy (KBE)

22
Especially, governments in Asia are facilitating and creating opportunities to-ward a more knowledge-based economy and society.
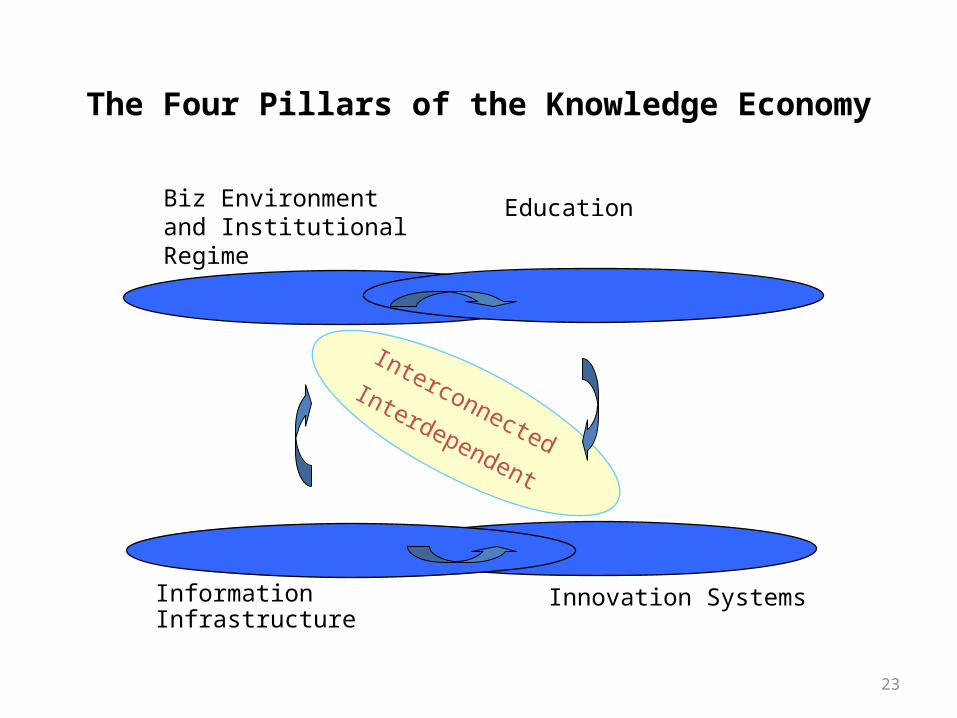
Four pillars of a KBE - Education, including building a skilled workforce
- National innovation systems, including science and technology, R&D
- Building networks, including ICT infrastructure and social networks
- Policy and regulatory (business) environment
New paradigms for managers and policy makers
- Distinction between knowledge and information
- Recognizing and managing intangibles - Attention to tacit knowledge - Stakeholder capital in a networked economy and society
- Value-driven development
23
The Four Pillars of the Knowledge Economy
Education
Innovation SystemsInformation Infrastruc-ture
InterconnectedInterdependent
Biz Environment and Institutional Regime

24
Asian governments envision and plan for a mix of KBE
- Thailand’s IT2010: “good use of ICT”
- e-Korea Vision 2006: “quantitative expansion of the Internet”
- e-Japan strategy: “knowledge-emergent society”

25
Knowledge-Based Economy Indicators for the Asian Region

26
Knowledge-Based Development
27
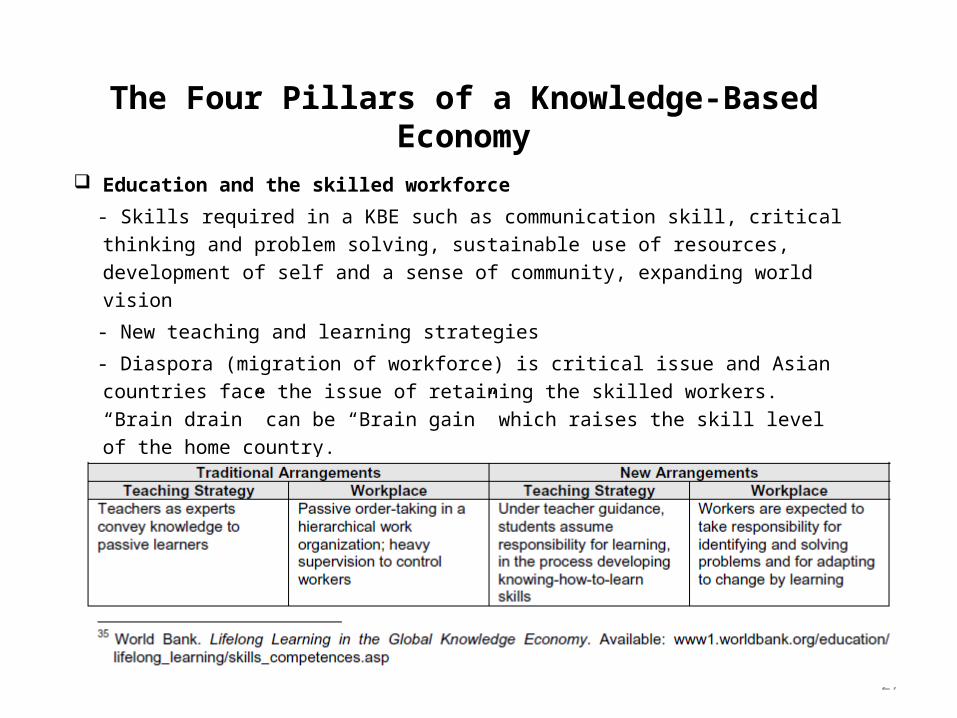
Education and the skilled workforce - Skills required in a KBE such as communication skill, critical thinking and
problem solving, sustainable use of resources, development of self and a sense of community, expanding world vision
- New teaching and learning strategies
- Diaspora (migration of workforce) is critical issue and Asian countries face the issue of retaining the skilled workers. “Brain drain” can be “Brain gain” which raises the skill level of the home country.
The Four Pillars of a Knowledge-Based Economy

28
National innovation systems (NIS) - “A subsystem of the national economy in which various organiza-
tions and institutions interact and influence each other in the carry-ing out of innovative activity.”
- Innovation and improvement in technical capacity are the result of a complex set of relationships among actors creating, acquiring, dis-seminating, and applying various kinds of knowledge.
- Actors are private enterprises, universities and public research insti-tutions, relevant financial institutions, and the government.
29
Building Networks - Capacity of ICT to support the development of networks and to establish and
maintain connections among individuals, groups, and organizations is con-sidered to be of great use of and value to others.
- Benefits of ICT and Networks (The ICT revolution has fast-tracked the inno-vation process)
- Toward an ubiquitous network society (social computing of voicemail, e-mail, online chats, and collaborative applications)
- Elements needed in building ICT are an appropriate regulatory framework, readiness and availability of human resources, research and education of IT skills.
Setting the policy and regulatory environments - Policy: legislation, organization/reorganization, and regulations - Planning: formulation of vision, strategy, and road map - Infrastructure and programs: establishing and implementing the needed
physical, institutional, and social infrastructure and programs

30
ICT holds major opportunities
for development
Business connectivity• Access to international
information for small and large business
• Logistic support; e-com
Health• Preventive health care• Curative health care
Less isolation in remote and poor areas• Community communication
centers• Wireless technologies
Government• Electronic payments
systems• Electronic government
(tax, customs)• Land titling, registries• Access to information,
democratization
Environmental and naturalresource management• Teledetection• Computerized databases• Ecologically-balanced
agricultural management
Financial sector• International payment
systems• Bulk and high value
transaction systems
ICT and Opportunities for Development
Education• Basic• Higher• Professional
31
32
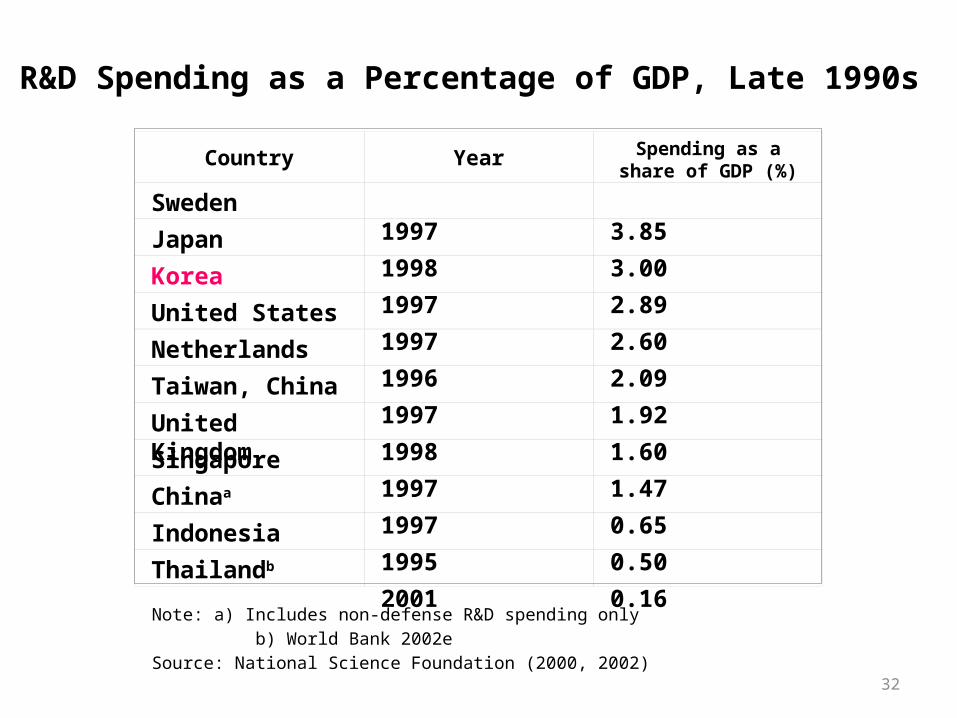
Country Year Spending as a share of GDP (%)
Sweden 1997 3.85Japan 1998 3.00Korea 1997 2.89United States 1997 2.60Netherlands 1996 2.09Taiwan, China 1997 1.92United Kingdom 1998 1.60Singapore 1997 1.47Chinaa 1997 0.65Indonesia 1995 0.50Thailandb 2001 0.16
Note: a) Includes non-defense R&D spending only b) World Bank 2002eSource: National Science Foundation (2000, 2002)
R&D Spending as a Percentage of GDP, Late 1990s
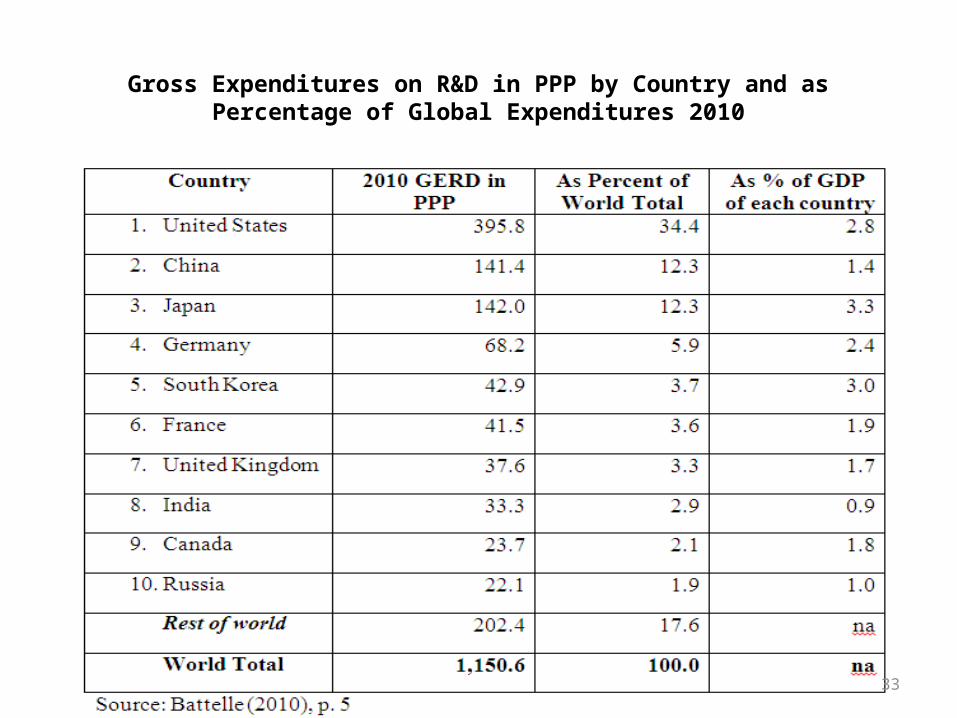
Gross Expenditures on R&D in PPP by Country and as Percentage of Global Expenditures 2010
33

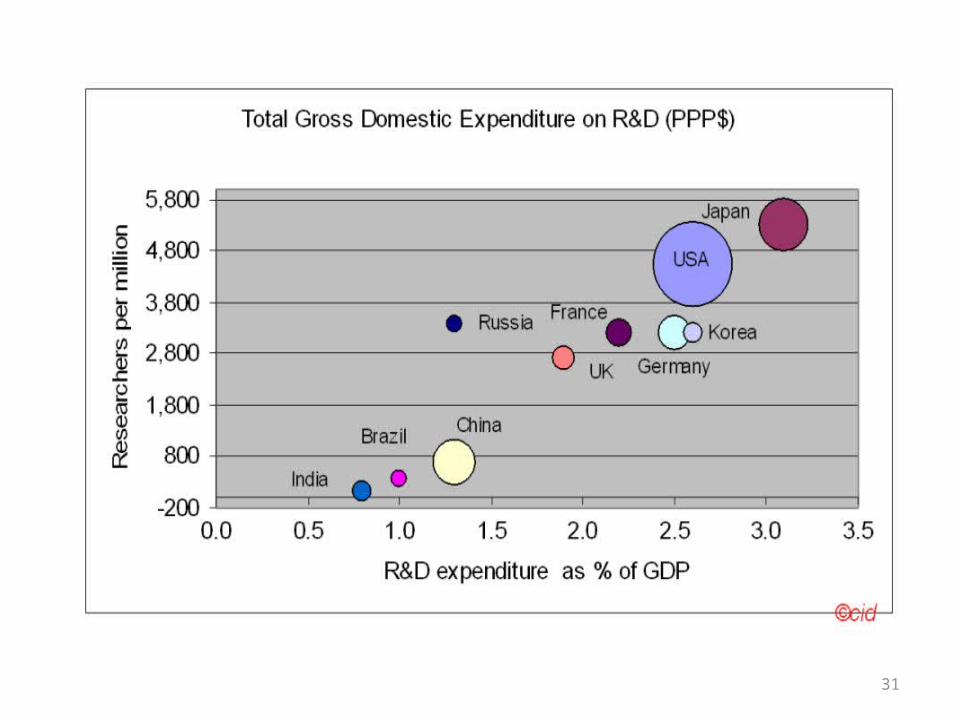
The R&D Input Landscape
34

35
Global Distribution of R&D Expenditures (1997)
Source: World Bank SIMA Database, 2002
Low income 0.8 %
Lower middle income 2.4 %
Upper middle income 4.1 %
High income 92.7 %

36
Global Distribution of Patenting (registered in the U.S., 2001)
Source: US Patent & Trademark Office (USPTO), 2001
High income 99.2 %
Low income 0.1 %
Lower middle income 0.4 %Upper middle
income 0.4 %

37
Royalty and License Fees, Payments, and Receipts (BoP, current US$, Millions)
3484
62311
5861
70862
2311997
134253 148
150219
125 2183
0 50
10000
20000
30000
40000
50000
60000
70000
80000
payments 1975 payments 2001 receipts 1975 receipts 2001
Source: World Bank SIMA Database
High income Low incomeLower middle income
Upper middle income
0.05

38Source: World Economic Forum, The Global Information Technology Report 2002-2003
Network Readiness Index(rankings of 82 countries, 02/03)
Networked Readiness Index Rank
Market, Regulatory and Infrastructure Environments
Individual, Business and Government
Usages
Individual, Business and Government
ReadinessFinland 1 2 1 2United States 2 1 4 3Singapore 3 8 2 1Sweden 4 6 3 4Korea 14 26 8 12Brazil 29 32 26 33South Africa 36 38 35 44India 37 34 43 40Thailand 41 40 47 36China 43 51 51 35Mexico 47 60 37 52Dominican Republic 57 46 63 53Trinidad and Tobago 58 50 62 58Colombia 59 50 58 61Jamaica 60 62 66 50Venezuela 66 63 50 72Russia 69 68 78 60Bolivia 78 75 76 79Honduras 81 80 79 78Haiti 82 82 80 82
39
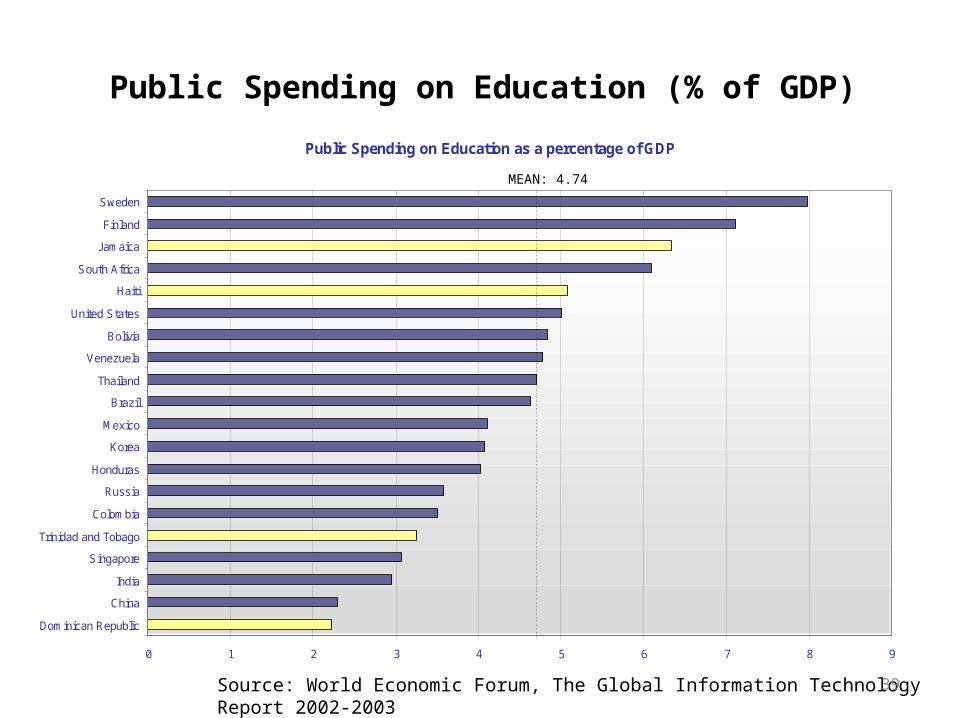
Public Spending on Education (% of GDP)
Source: World Economic Forum, The Global Information Technology Report 2002-2003
Public Spending on Education as a percentage of GDP
0 1 2 3 4 5 6 7 8 9
Dominican Republic
China
India
Singapore
Trinidad and Tobago
Colombia
Russia
Honduras
Korea
Mexico
Brazil
Thailand
Venezuela
Bolivia
United States
Haiti
South Africa
Jamaica
Finland
Sweden
MEAN: 4.74
40Source: World Economic Forum, The Global Information Technology Report 2002-2003
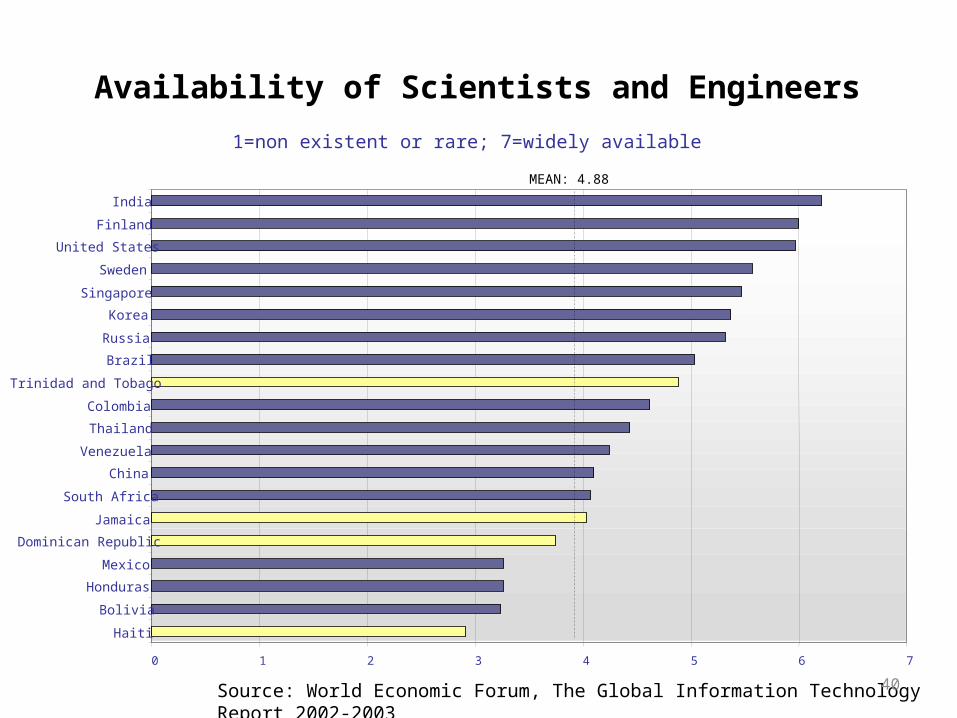
Availability of Scientists and Engineers
0 1 2 3 4 5 6 7
Haiti
Bolivia
Honduras
Mexico
Dominican Republic
Jamaica
South Africa
China
Venezuela
Thailand
Colombia
Trinidad and Tobago
Brazil
Russia
Korea
Singapore
Sweden
United States
Finland
India
MEAN: 4.88
1=non existent or rare; 7=widely available

41Source: World Economic Forum, The Global Information Technology Report 2002-2003
Brain Drain
1= normally leave to pursue opportunities in other countries, 7= almost always remain in the country
0 1 2 3 4 5 6 7
Haiti
Bolivia
Jamaica
Colombia
South Africa
Venezuela
Honduras
India
Mexico
Dominican Republic
Russia
China
Trinidad and Tobago
Korea
Thailand
Sweden
Brazil
Singapore
Finland
United StatesMEAN: 3.76

42
MEAN:3.8
Source: World Economic Forum, The Global Information Technology Report 2002-2003
Public Access to the Internet
1= very limited; 7= most people have frequent Internet access
0 1 2 3 4 5 6 7
Russia
Jamaica
China
Dominican Republic
South Africa
Mexico
Brazil
Venezuela
Haiti
Trinidad and Tobago
Thailand
Colombia
India
Bolivia
United States
Korea
Singapore
Sweden
Finland
MEAN: 3.82
43Source: World Economic Forum, The Global Information Technology Report 2002-2003
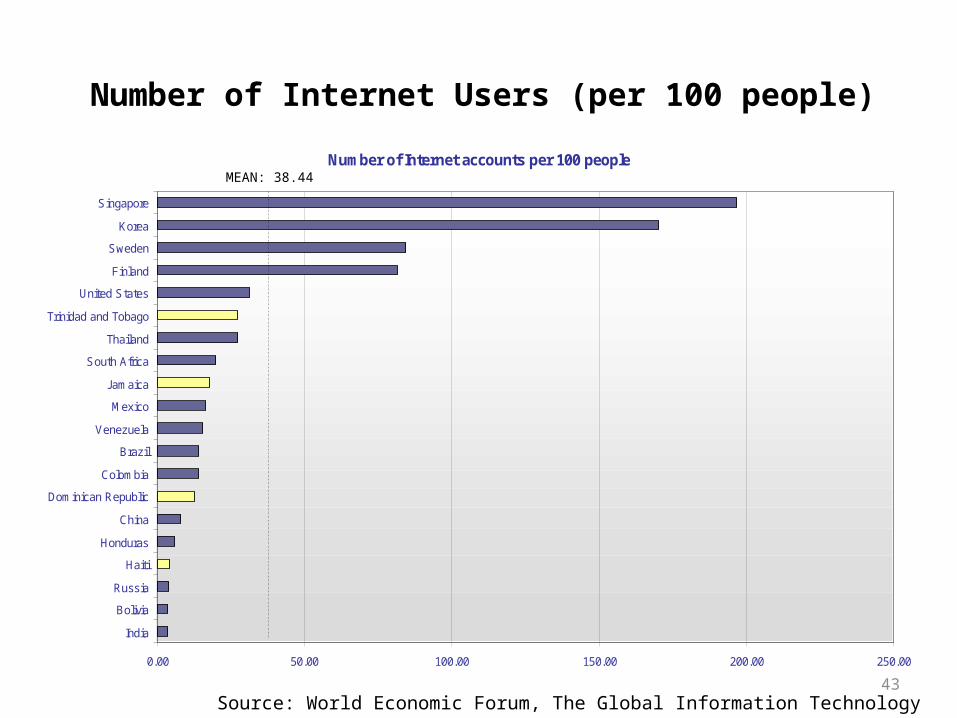
Number of Internet Users (per 100 people)
Number of Internet accounts per 100 people
0.00 50.00 100.00 150.00 200.00 250.00
India
Bolivia
Russia
Haiti
Honduras
China
Dominican Republic
Colombia
Brazil
Venezuela
Mexico
Jamaica
South Africa
Thailand
Trinidad and Tobago
United States
Finland
Sweden
Korea
Singapore
MEAN: 38.44
44
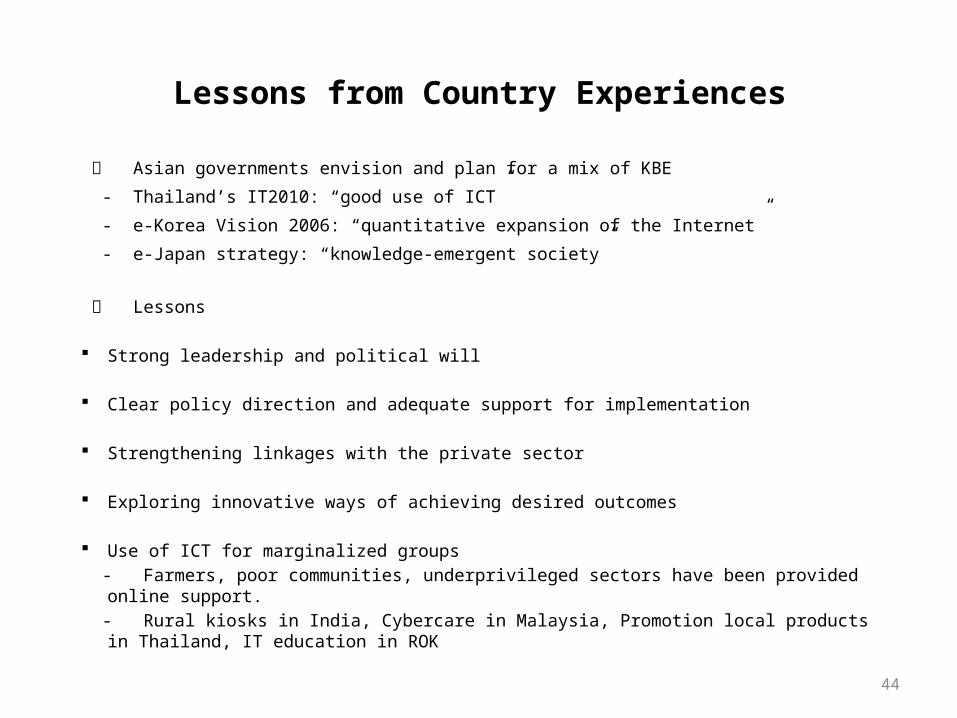
Lessons from Country Experiences
Asian governments envision and plan for a mix of KBE
- Thailand’s IT2010: “good use of ICT”
- e-Korea Vision 2006: “quantitative expansion of the Internet”
- e-Japan strategy: “knowledge-emergent society”
Lessons
Strong leadership and political will
Clear policy direction and adequate support for implementation
Strengthening linkages with the private sector
Exploring innovative ways of achieving desired outcomes
Use of ICT for marginalized groups - Farmers, poor communities, underprivileged sectors have been provided online support. - Rural kiosks in India, Cybercare in Malaysia, Promotion local products in Thailand, IT education
in ROK

45
Knowledge can make a critical difference in the development process.
The risks of a growing knowledge divide, require special attention from policy-mak-ers. In this context, one needs to focus on:
- The importance of an effective institutional and economic regime that fosters the creation, dissemination and use of knowledge;
- Investments in education so that the population can use knowledge effectively;
- The operation of the innovation system (involving R&D centers, universities, li-braries, private firms, etc.);
- The implementation of a dynamic ICT infrastructure that fosters information dis-semination, transparency and digital literacy.
Policy Implications

46
In the process of knowledge generation, dissemination and use in a networked environment, special attention needs to be given to:
- The balance between protection of intellectual property rights and the preservation of fair use and access to resources in the “commons”;
- The challenges of promoting digital literacy;
- The potential of public-private partnerships;- - The growing demand for transparency;- - The importance of context/localization; and- The role of leadership.
Increasing globalization: reduction of transportation and communication costs, increasing global information, increasingly mobile FDI.
Rapid pace of technological change and innovation: Half life of technology is getting shorter. Keep up or fall behind – these are the only options
Increasing competition: driven by trade liberalization and increasingly larger players (e.g., China, Korea, India) plus laggards that want to catch up – Viet-nam, Mozambique, Rwanda
Networking and disintegration of production
There is No Choice “The world is moving fast…with or without you!”
47

Stages of Economic Development
48
Factor-driven Economy
Investment- driven Economy
Innovation- driven Economy
• Basic factor conditions (low cost labor, natural re-sources, geographic loca-tion) are the dominant sources of competitive advantage
• Technology is assimilated through imports, FDI and imitation
• Companies have limited roles in the value chain, and focus on assembly, labor intensive manufac-turing, and resource ex-traction
• The economy is highly sensitive to world eco-nomic cycles, commodity prices, and exchange rates
• Innovative products and services at the global technology frontier are the dominant sources of competitive advantage
• Characterized by strengths in all areas to-gether with the presence of deep clusters
• Companies compete with unique strategies that are often global in scope
• The economy has a high service share, and is re-silient to external shocks
• Efficiency in producing standard products and services is the dominant source of competitive ad-vantage
• Foreign technology is ac-cessed through licensing, joint ventures, FDI, and imitation
• The nation is not only as-similating foreign tech-nology, but has the capac-ity to improve on it
• Heavy investment is made in efficient infrastructure, modern production process, and ease of do-ing business
Source: Porter, Michael E. Competitive Advantage of Nations, 1990.
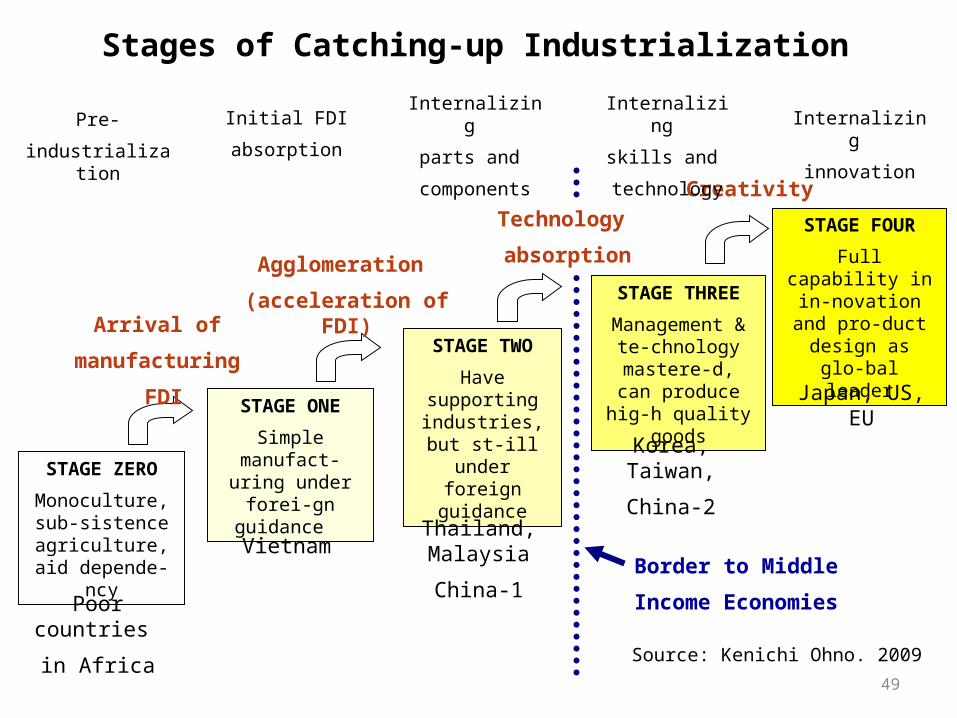
STAGE ONESimple manu-fact-uring un-der forei-gn guidance
STAGE TWOHave support-ing industries, but st-ill under foreign guid-
ance
STAGE THREEManagement &
te-chnology mastere-d, can produce hig-h quality goods
STAGE FOURFull capability in in-novation and pro-duct design
as glo-bal leader
Vietnam Thailand, MalaysiaChina-1
Korea, Taiwan,China-2
Japan, US, EU
Agglomeration (acceleration of
FDI)
Creativity
Border to Middle Income Economies
Stages of Catching-up Industrialization
Initial FDI absorption
Internalizing parts and
components
Technology absorption
Internalizing skills and technology
Internalizing innovation
STAGE ZEROMonoculture, sub-sistence
agriculture, aid depende-ncy
Pre-industrialization
Arrival of manufacturing
FDI
Poor countries in Africa
49Source: Kenichi Ohno. 2009

Catch-Up Oriented Industrial Technological Capabilities in Developing Countries
Accelerate Enhancement
Aim for Independent Innovation
Firm-Level National-Project-Level Take Leaders
as Reference
In-dus-try-Level
Coordinated Development of System
CapabilityEnhance-
ment
ExternalSupports InternalEfforts
CapabilityEnhance-ment
IndependentDevelopment
Closing toAdvanced Level
Capability Enhancement
Core Technologies, Advanced Technologies…
Industry Planning, Policy, Effects
Source: Hong, Su, Lu 50

S&T Capacity Building-Actors
National Policy Making • Fundacion Chile, MOST,• Technology diffusion institutions• Technology Foresight
S&T Capacities in Universities and R&D Institutes
• R&D vs. ERC• Centers of Excellence
Enterprises • In-house research• Supplier development• Innovation capacity improvement
Labor Force • Vocational training, secondary ed.• Skills Development Centers• Life-long learning
Education Sector • Primary education• Secondary education• Higher education
51

S&T Capacity Building-Institutions
Scientific research Technology adoption, adaptation, and diffusion
Supply• MSI Centers of Excellence• Instrumentation Centers• Higher Education projects/ESW
• Engineering Research Centers• Technology Transfer and Diffusion Institutes
Demand • Tax incentives for in-house research • Industrial labs • Grant programs for industrial research
• Modernization of industrial firms• Agriculture technology projects• Industrial credit lines
52

Acquisition
Assimilation
Improvement
Creation
Capacity Building Stages and Model
DevelopingCountry
Newly-IndustrializingCountry
AdvancedCountry
Imitation internalization generatingS&T & R&D Stages
DevelopmentStages
53

Royalties and License Fees (Annual, 2000-2008)
YEAR 2000 2001 2002 2003 2004 2005 2006 2007 2008ECONOMYChina 0.26 0.33 0.33 0.23 0.38 0.21 0.22 0.28 0.39
China, Hong Kong SAR 0.26 0.48 0.51 0.73 0.4 0.38 0.36 0.42 0.41Germ any 3.5 3.75 3.76 3.65 3.78 4.36 3.65 3.64 4.06
Indonesia _ _ _ .. 1.84 2.04 0.12 0.25 0.18Japan 14.77 16.22 15.86 15.81 16.09 16.02 17.13 17.99 17.28
Korea, Republic of 2.25 3.18 2.94 3.98 4.44 4.23 4.1 2.74 3.13
Philippines 0.21 0.03 0.03 0.12 0.3 0.13 0.09 0.05 ..Singapore 0.3 0.64 0.69 0.54 1.06 1.17 1 1.02 1.01Source : UNCTAD, UNCTADstat
54

Levels of Innovation
Frontier Innovation
Technology Improvement and Monitoring
Significant Adaptation
Basic Production–use technology
55
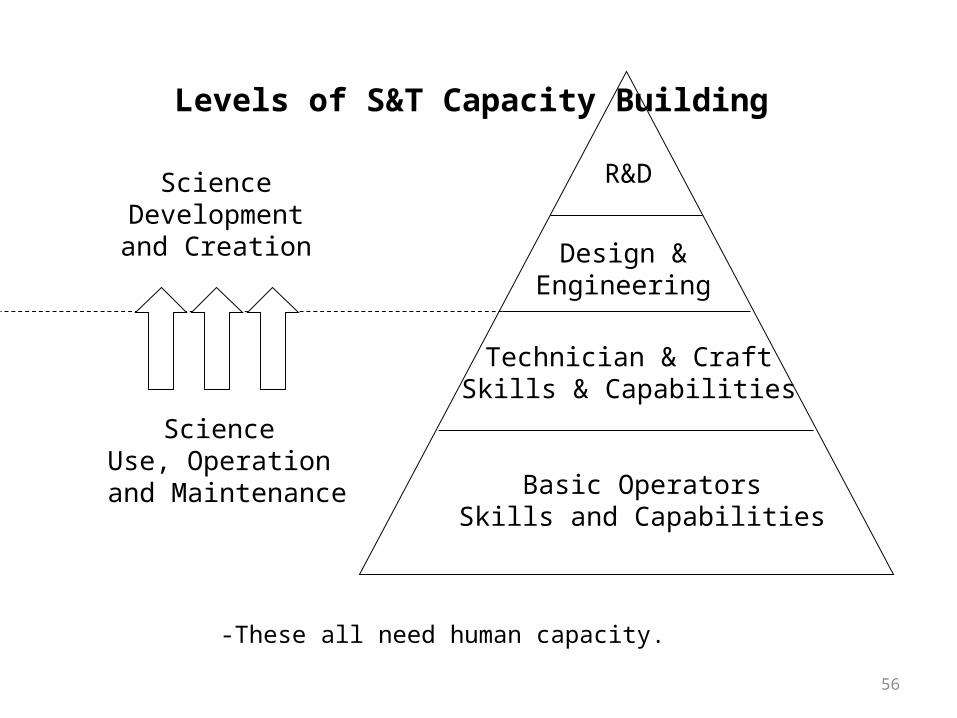
R&D
Design &Engineering
Technician & CraftSkills & Capabilities
Basic OperatorsSkills and Capabilities
ScienceDevelopmentand Creation
ScienceUse, Operation
and Maintenance
-These all need human capacity.56
Levels of S&T Capacity Building
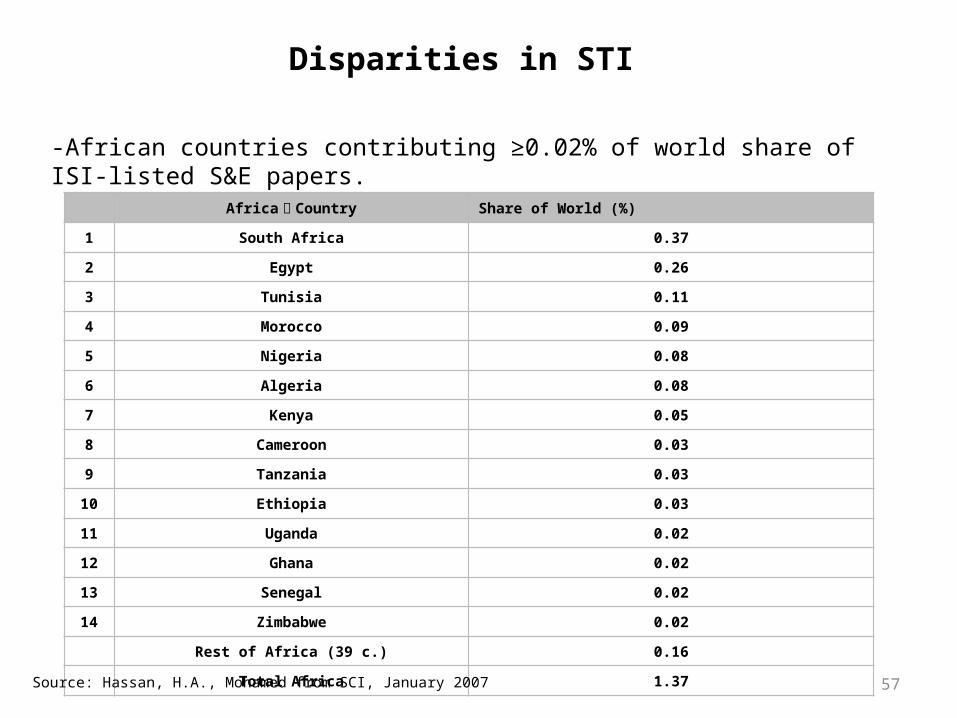
Disparities in STI
Africa你 Country Share of World (%)
1 South Africa 0.37
2 Egypt 0.26
3 Tunisia 0.11
4 Morocco 0.09
5 Nigeria 0.08
6 Algeria 0.08
7 Kenya 0.05
8 Cameroon 0.03
9 Tanzania 0.03
10 Ethiopia 0.03
11 Uganda 0.02
12 Ghana 0.02
13 Senegal 0.02
14 Zimbabwe 0.02
Rest of Africa (39 c.) 0.16
Total Africa 1.37
Source: Hassan, H.A., Mohamed from SCI, January 2007
-African countries contributing ≥0.02% of world share of ISI-listed S&E papers.
57

Science Technology and Innovation
Science is the process of generating knowledge based on evidence. While it implicitly includes both natural sciences (biology, chemistry, physics, mathe-matics and related disciplines) and social sciences (economics, sociology, anthropology, politics, law), we will focus in this book largely on natural sci-ence disciplines.
Technology is the application of scientific knowledge, and frequently in-volves invention, i.e, the creation of a novel object, process or technique.
Innovation is the process by which inventions are produced, which may in-volve the bringing together of new ideas and technology, or finding novel ap-plications of existing technologies. Generally, innovation means developing new ways of doing things in a place or by people where they have not been used before. Modern innovation is usually stimulated by innovation systems and pathways.
The phrase ‘Science and Innovation’ in this book implicitly includes sci-ence, engineering, technology and the production systems which deliver them.
58
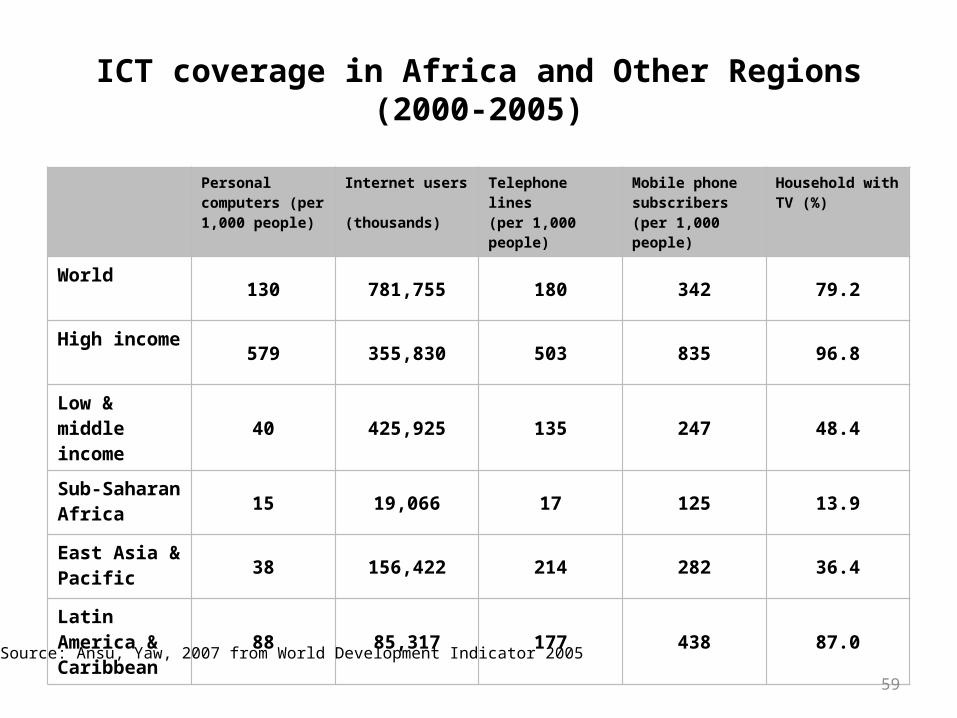
ICT coverage in Africa and Other Regions (2000-2005)
Personal com-puters (per 1,000 people)
Internet users (thousands)
Telephone lines(per 1,000 peo-ple)
Mobile phone subscribers (per 1,000 peo-ple)
Household with TV (%)
World130 781,755 180 342 79.2
High income579 355,830 503 835 96.8
Low & middle income 40 425,925 135 247 48.4
Sub-Saharan Africa 15 19,066 17 125 13.9
East Asia & Pacific 38 156,422 214 282 36.4
Latin America & Caribbean 88 85,317 177 438 87.0
Source: Ansu, Yaw, 2007 from World Development Indicator 200559

Five Dimensions of STI Capacity
National (and local)government capacity to formulate and implement coherentS&T programs and policies
Enterprise capacity toutilize knowledge to innovate and producehigher value added,globally competitivegoods and services
Technologically andscientifically skilledworkforce trained to equipment andproduction processes
Production of newknowledge via R&D
Import, adapt, andadopt knowledgeproduced outside thecountry
Source: Ansu, Yaw, 2007 60

Observations and Lessons
- Ability to produce new knowledge (R&D) is important, but the ability to absorb and utilize existing knowledge may be even more important at early stages of de-velopment – National systems of economic learning and technology diffusion.
- Absorptive capacity of enterprises and labor force must be developed – spillovers (from FDI) are not automatic.
- S&T capacity building policies should be devised within the context of an overall industrial development strategy – not separately
- Getting basics right-rule of law, business climate, etc. - is absolutely necessary but not sufficient.
- Goal of universal primary education should be complemented by expanded access to vocational, secondary and tertiary education.
- Political commitment is needed since it takes a long time for capacity building to affect economic development and poverty.
61
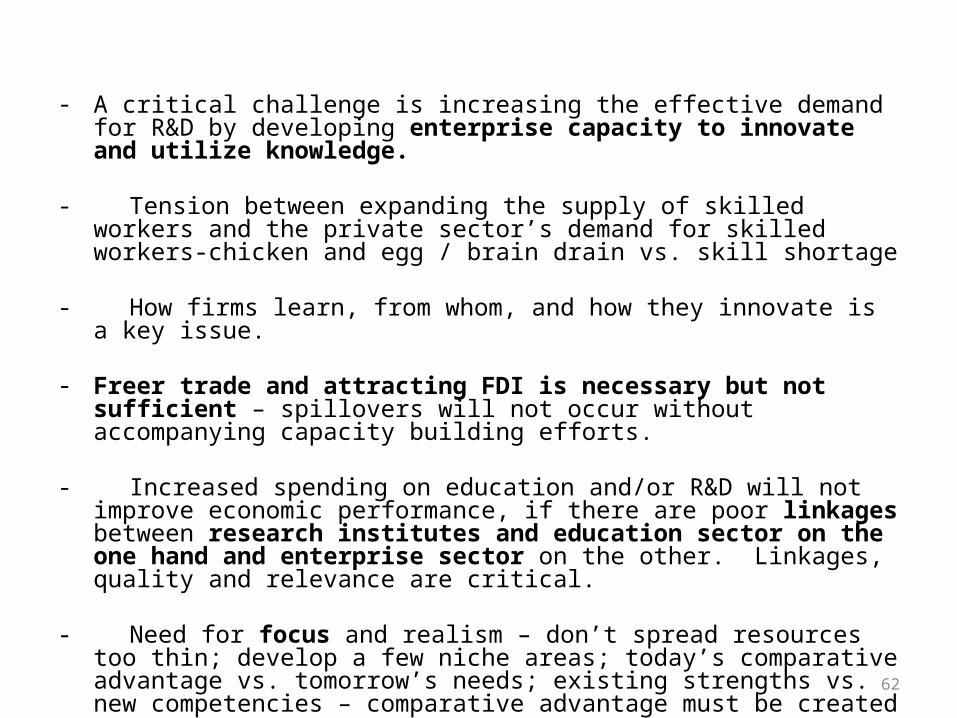
- A critical challenge is increasing the effective demand for R&D by develop-ing enterprise capacity to innovate and utilize knowledge.
- Tension between expanding the supply of skilled workers and the private sector’s demand for skilled workers-chicken and egg / brain drain vs. skill shortage
- How firms learn, from whom, and how they innovate is a key issue.
- Freer trade and attracting FDI is necessary but not sufficient – spillovers will not occur without accompanying capacity building efforts.
- Increased spending on education and/or R&D will not improve economic performance, if there are poor linkages between research institutes and education sector on the one hand and enterprise sector on the other. Linkages, quality and relevance are critical.
- Need for focus and realism – don’t spread resources too thin; develop a few niche areas; today’s comparative advantage vs. tomorrow’s needs; existing strengths vs. new competencies – comparative advantage must be created
62

GDP share of R&D expenditure in certain countries
Source: OECD, Main Science and Technology Indicators (http://www.research.fi/en/resources/R_D_expenditure/GDP_share_of_RD_expenditure_in_certain_countries)
63

Technological Capability
Evolution of TC as a path dependent process:
– Production Engineering: (learning by doing followed by learning by adapting, aiming at augmenting productivity through efficient utilisation and adaptation of technologies at the shop floor )
– Reverse Engineering (learning by design and learning by improved de-sign, aiming at replicating processes and designs for better understand-ing and further improvement of given technologies)
– Basic (frontier) research
64

Technological Capability
- Presence of MNC subsidiaries in LDCs may also contribute to the TC acqui-sition by domestic firms through spillover gains.
Extent of gains depends on – vintage of technologies transferred to MNC subsidiaries– Absorptive capacity of domestic firms (PE RE or BR)
65

□ Can poor countries catch up through technology?
- There are significant gaps in technological development across countries.
- Poor countries are not catching up.
- Poor countries can catch up, if they generate economic conditions con-ducive to investment and a climate of civil liberties.
- They are likely to see inequality increase and the effect on economic growth is likely to be delayed.
66
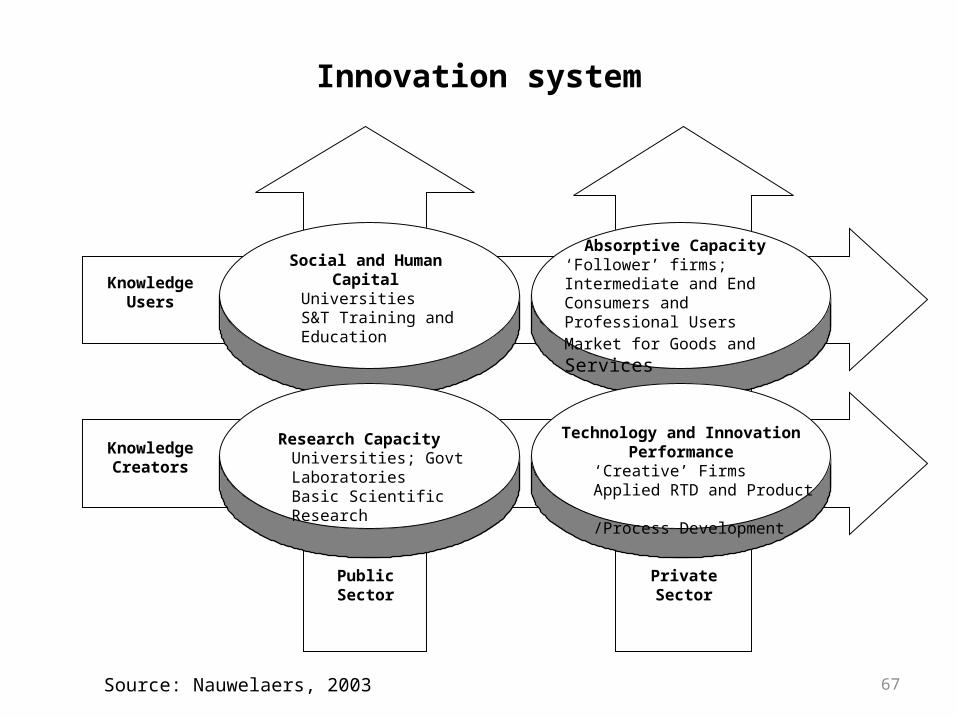
Innovation system
Social and Human Cap-ital
UniversitiesS&T Training and Education
Absorptive Capacity‘Follower’ firms; Intermediate and End Consumers and Pro-fessional UsersMarket for Goods and Services
Research CapacityUniversities; Govt LaboratoriesBasic Scientific Research
Technology and Innovation Performance
‘Creative’ FirmsApplied RTD and Product /Process Development
Knowledge Users
Knowledge Creators
Public Sector Private Sec-tor
Source: Nauwelaers, 2003 67

Policies for enhancing the Innovation system
Source: The Impact of RTD on Competitiveness and Employment (IRCE). EC. 2003
68

Critical Lessons
- Investing in S&T capacity is not a luxury for the rich; it is an absolute ne-cessity for poor countries that wish to become richer – there is no choice.
- The time to start investing and building capacity is when you are poor.
- Countries at different stages of development, and employing different learn-ing strategies, need to invest in different aspects of S&T capacity – plugging in, catching up, innovating: different tasks and challenges for different stages of development.
69

High Tech Is Not the Only (or Best) Route to Prosperity and Competitiveness.
Vietnam
Thailand
Sri Lanka
Philippines
Pakistan
Mexico
Malaysia
Indonesia
IndiaColombia
China
Chile
Brazil
Bangladesh
Argentina
0
15
30
45
60
75
0.00 20.00 40.00 60.00 80.00 100.00
Manufactures exports (% of merchandise exports)
Hig
h-te
chno
logy
exp
orts
(% o
f man
ufac
ture
d ex
ports
)
70
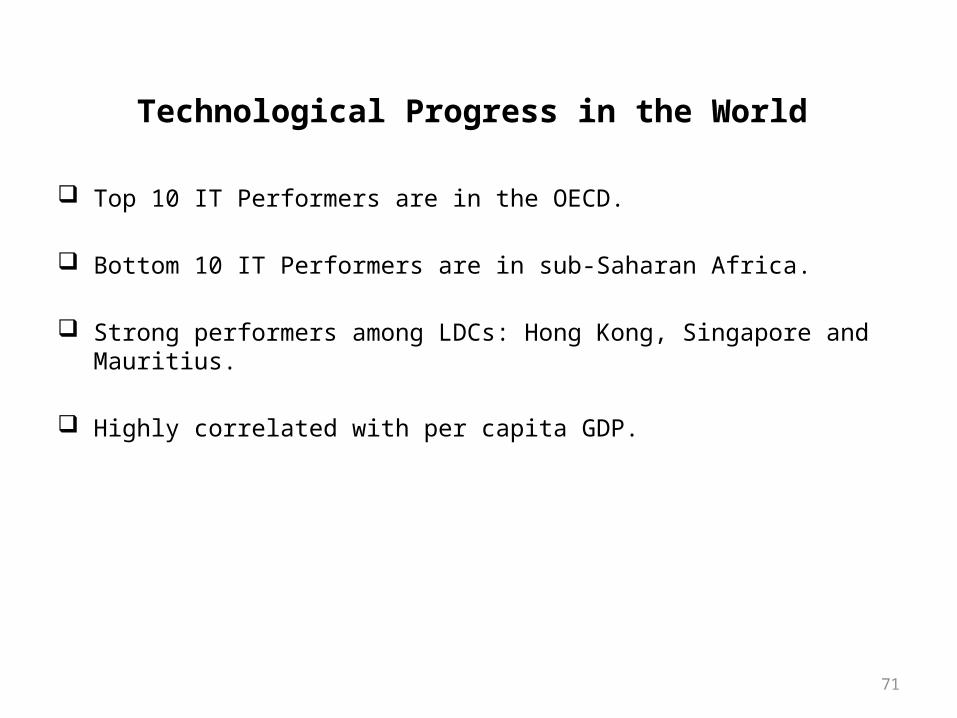
Technological Progress in the World
Top 10 IT Performers are in the OECD.
Bottom 10 IT Performers are in sub-Saharan Africa.
Strong performers among LDCs: Hong Kong, Singapore and Mauritius.
Highly correlated with per capita GDP.
71

Productivity Catch Up: East Asia
1950 % of USA 2003 % of USA Growth Rate
U.S.A 12.00 100.0% 33.97 100.0% 2.00%
Japan 2.30 19.2% 24.78 73.0% 4.57%
1973 % of USA 2003 % of USA
Hong Kong 7.49 35.0% 22.28 4.74%
Korea 3.64 17.0% 14.25 42.0% 5.93%
Singapore 6.80 31.8% 19.63 57.8% 4.61%
Taiwan 4.37 20.4% 18.77 55.2%6.33%
72
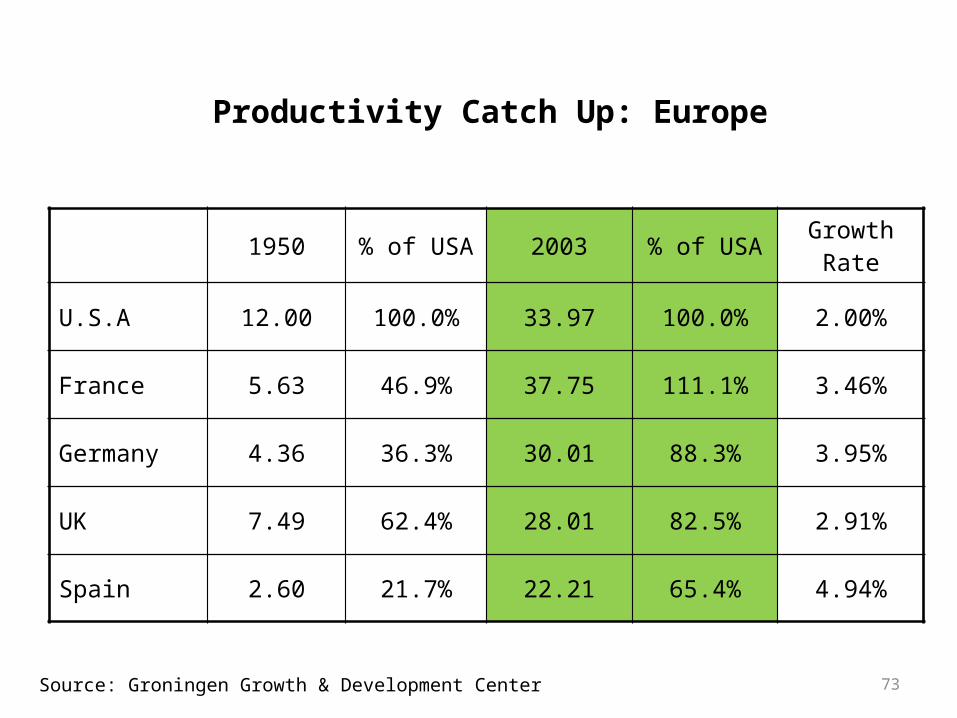
Productivity Catch Up: Europe
1950 % of USA 2003 % of USA Growth Rate
U.S.A 12.00 100.0% 33.97 100.0% 2.00%
France 5.63 46.9% 37.75 111.1% 3.46%
Germany 4.36 36.3% 30.01 88.3% 3.95%
UK 7.49 62.4% 28.01 82.5% 2.91%
Spain 2.60 21.7% 22.21 65.4% 4.94%
73Source: Groningen Growth & Development Center

Productivity Catch Up: Latin America
1950 % of USA 2003 % of USA Growth Rate
U.S.A 12.00 100.0% 33.97 100.0% 2.00%
Argentina 6.16 51.4% 10.57 31.1% 1.04%
Brazil 2.48 20.7% 7.81 23.0% 2.21%
Chili 4.66 38.9% 14.07 41.4% 2.12%
Mexico 3.56 29.7% 10.24 30.1% 2.03%
74
References
Brad, Carlos A. P. 2003. “Leveraging the Knowledge Economy”, World Bank (PPT, Google).
Crafts, Nick. Divergence Big Time: Economic Growth Since 1870, (PPT, Google).
Paic, Alan. 2011. Enhancing South East Europe Competitiveness through innovation and human capital development, Bank of Greece-University of Oxford (SEESOX) Confer-ence Athens (PPT, Google).
Ray, A, S & Bhaduri, S. A game theoretic model of optimum IPR regime and technological capability: Implications of TRIPS for developing countries, Jawaharlal Nehru Univ., India (PPT, Google).
Rodriguez, Francisco & Wilson, Ernest J. III. “Are Poor Countries Losing the Information Revolution?”, University of Maryland at College Park (PPT, Google).
Watkins, Alfred. 2005. Building Science, Technology, and Innovation Capacity for Devel-opment, S&T Program Coordinator HDNED, Presentation to STI Thematic Group (PPT, Google).
75