economic costs of youth disadvantage and...
TRANSCRIPT

ECONOMIC COSTS OF YOUTH DISADVANTAGE AND HIGH-RETURN
OPPORTUNITIES FOR CHANGE
July 2015
**Draft**
Contents Executive Summary ....................................................................................................................................... 1
I. Barriers to Success Faced by Disadvantaged Youth ................................................................................... 4
The Lasting Impacts of Family Income, Socioeconomic Status, and Neighborhood ................................ 5
Long-Standing Disparities in Education .................................................................................................... 9
Long-Standing Inequalities in Exposure to the Juvenile and Criminal Justice System ............................ 11
Barriers in Education and the Justice System Lower Later Employment and Activity Rates .................. 12
II. Economic Costs of Disadvantage ............................................................................................................ 16
Economic Costs from Crime .................................................................................................................... 17
III. Programs that Successfully Counter the Challenges of Disadvantage ................................................... 19
Milestones 1 and 2: Entering School Ready to Learn and Reading at Grade Level by Third Grade ....... 19
Milestone 3: Graduating High School Ready for Career and College ..................................................... 21
Milestones 4 and 5: Completing Postsecondary Education and Training and Successfully Entering the Workforce ............................................................................................................................................... 21
Milestone 6: Reducing Violence and Providing a Second Chance .......................................................... 23
Conclusion ................................................................................................................................................... 25
Technical Appendix: Changes in GDP Associated with Greater Educational Attainment .......................... 33

Executive Summary The President believes that, in America, everyone should be empowered to make of their lives what they will – not limited by the circumstances of their birth. But today, millions of American youth face persistent gaps in opportunity that prevent them from reaching their potential and contributing fully to their communities and the economy. These disparities affect not only individuals, but our economy as a whole, through lost productivity and economic potential. In order for the United States to successfully compete in a 21st-century global economy, all of America’s youth must have the opportunity to be safe, healthy, educated, and prepared to succeed in their careers. It’s simple: to win in our new economy, America needs to field a full team. This report examines the barriers that disadvantaged youth, particularly young men of color, face and quantifies the enormous costs this poses to the U.S. economy. In particular, this report focuses on the significant disparities in education, exposure to the criminal justice system, and employment that persist between young men of color and other Americans. In addition to their vast human cost, the opportunity gaps facing youth of color hold back the U.S. economy, lowering aggregate earnings, shrinking the labor market, and slowing economic growth. This report outlines why it is important for our Nation – from business, faith and civic leaders to local law enforcement – to invest in the lives of our Nation’s young people. In launching the My Brother’s Keeper initiative, the President and his entire Administration are doing just that. By tackling a range of issues, from ensuring children are able to read at grade level to preparing young people for college and career readiness and to finding ways to decrease the number of young people involved with the criminal justice system, President Obama is ensuring that his Administration is meeting the needs of all youth. Closing these opportunity gaps and lowering barriers to achievement would result in substantial economic gains:
• If we closed the gap in educational attainment between working-age (25-64) men of color and non-Hispanic white men of the same age:
o The share of working-age men of color who have a bachelor’s degree or above would double;
o Men of color would earn as much as $170 billion more annually; o Average weekly earnings among U.S. workers overall would increase by 3.6
percent; and o Total U.S. GDP would increase by 1.8 percent.
• If we closed the gap in labor force participation between 16-to-54 year-old men of color
and non-Hispanic white men of the same age: o Total U.S. GDP would increase by 2 percent.
1
• A number of programs show exceptional promise in improving outcomes and increasing opportunity for disadvantaged youth.
o Over the life of impacted youth, these programs can generate benefits that are more than three times their costs, exceeding the rates of return seen in many private sector business investments.
Improving opportunities available to disadvantaged youth and investing in their success through proven programs would greatly benefit the U.S. economy and individual communities. Some of the most important disparities facing young men of color include: Disparities in Education
• High school graduation rates vary sharply across the country, ranging from under 60 percent in the District of Columbia to nearly 90 percent in other States, and there are even greater differences across counties. Sharp disparities also exist along racial lines: graduation rates for black and Hispanic students fall below those of white students by 16 percentage points and 12 percentage points, respectively.
• Young men of color are also less likely to complete a college degree. For instance, only 12 percent of Hispanic men and 21 percent of black men have a college degree by their late 20s, compared to nearly 40 percent of white men. Some of this disparity is driven by differences in high school completion. Although black Americans who graduate from high school are now just as likely as white high school graduates to enroll in college, black Americans are less likely to graduate from high school in the first place, and are less likely to complete college once they enroll.
Disparities in Exposure to the Juvenile and Criminal Justice System • In 2011, the majority of State and Federal prisoners were minorities— black and Hispanic
prisoners alone accounted for over 60 percent of total prisoners, far greater than their share of the total U.S. population. Over 875,000 minors were arrested in 2013, and young boys and men of color make up a substantial share of those arrested.
• Inequalities in arrests and sentencing contribute to overrepresentation of black and Hispanic Americans in the incarcerated population. Even when there is little difference in the likelihood of committing a crime, individuals of color are much more likely to be arrested. If convicted, black offenders are more likely to be sentenced to incarceration than white offenders and to receive longer sentences for the same offenses.
• The cost of incarceration is substantially higher than investing in education or other programs to increase opportunity, even before one takes the returns to the investments into account. The annual cost of incarceration for a single juvenile is over $100,000— almost twice as high as tuition, room and board, and fees at the most expensive college in the country and nearly 100 times as expensive as a year of intensive mentoring.
2

Disparities in Employment
• A black male born 25 years ago has only a roughly 1 in 2 chance of being employed today as a result of early death, incarceration, low labor force participation, and high unemployment. Opportunity gaps and exposure to the criminal justice system have significant effects on lifetime outcomes, particularly for young black men, but these impacts are not limited to any particular group of young people.
• Disparities in education and justice system involvement that begin during youth contribute to substantial challenges in the labor market throughout life. Young people who face these barriers to success tend to participate less often in the labor force, experience higher rates of unemployment when they participate, and earn less when they find work.
• Prime-age black men are 13 percentage points less likely to be employed than prime-age white men, a gap that could be as large as 24 percentage points if black men who are missing due to incarceration or early death were counted as not employed.
Today, millions of young people of color struggle to succeed despite obstacles at many stages of life. The disparities outlined in this report provide compelling evidence that the United States must work to improve opportunities for all youth and for young men of color in particular. Investing in young people through high-return programs can not only improve the outcomes of specific individuals and communities but can also substantially boost the U.S. economy as a whole. The President’s My Brother’s Keeper initiative aims to take advantage of this opportunity to help our young people reach their full potential and strengthen our economy.
3

I. Barriers to Success Faced by Disadvantaged Youth Millions of American youth face persistent opportunity gaps and barriers that prevent them from reaching their full potential. Young people who grow up in disadvantaged settings, such as living in poverty, often face barriers from the start of life that compound over time and may be exacerbated by unequal treatment in the juvenile and criminal justice systems.1 By the time youth who have experienced these challenges reach adulthood, they are less likely to have the educational attainment and labor market skills critical to success in today’s economy. As a result, they tend to participate less often in the labor force, experience higher rates of unemployment when they do participate, and earn less when they find work. Statistics on the life outcomes of young men of color, for example, help put this in perspective: incarceration, early death, high unemployment, and low labor force participation remove half of 25-year-old black men from employment, and in some States and cities these factors lower the share who are employed even further. Yet these challenges also present opportunity: for example, CEA calculations suggest that closing education gaps between men of color and non-Hispanic white men could boost GDP by at least 1.8 percent. Many programs show exceptional promise in improving outcomes and increasing opportunity for disadvantaged youth. Over the life of impacted youth, these programs can generate benefits that are more than three times their costs, exceeding annual rates of return seen in private-sector business investments. These high-return investments make it clear that greater action to close opportunity gaps is necessary for the long-run benefit of our economy as well as our society. In launching the My Brother’s Keeper Initiative, President Obama called on both the private and public sectors to identify evidence-based approaches to ensuring that all of America’s young people can reach their full potential, regardless of who they are, where they live, or the circumstances into which they were born. Their success is critical to our Nation’s long-term welfare. If all of our youth are not safe, healthy, educated, and prepared to succeed in their careers, society loses out in terms of lost productivity and potential, and we will not be able to compete in a 21st-century global economy. This report examines the barriers that disadvantaged youth face and describes the enormous costs of that disadvantage for them, their communities, and our Nation as a whole. Alleviating these opportunity gaps and barriers to achievement is important for all youth who face them. A growing literature has documented the lifetime challenges that children in areas with greater opportunity gaps face. Recent work has found that children in disadvantaged communities are less likely to graduate from high school, are less likely to be employed, are less likely to marry, and are less likely to make it out of the bottom quintile of the income distribution.2 A disproportionate number of young people facing these challenges are youth of color. Moreover, research has shown that young men of color in particular face unique challenges, particularly because young men of color are overrepresented in the criminal justice system. As a
4
result, this report highlights statistics on black and Hispanic boys and young men.i However, the issues documented and discussed throughout apply widely to disadvantaged youth.ii
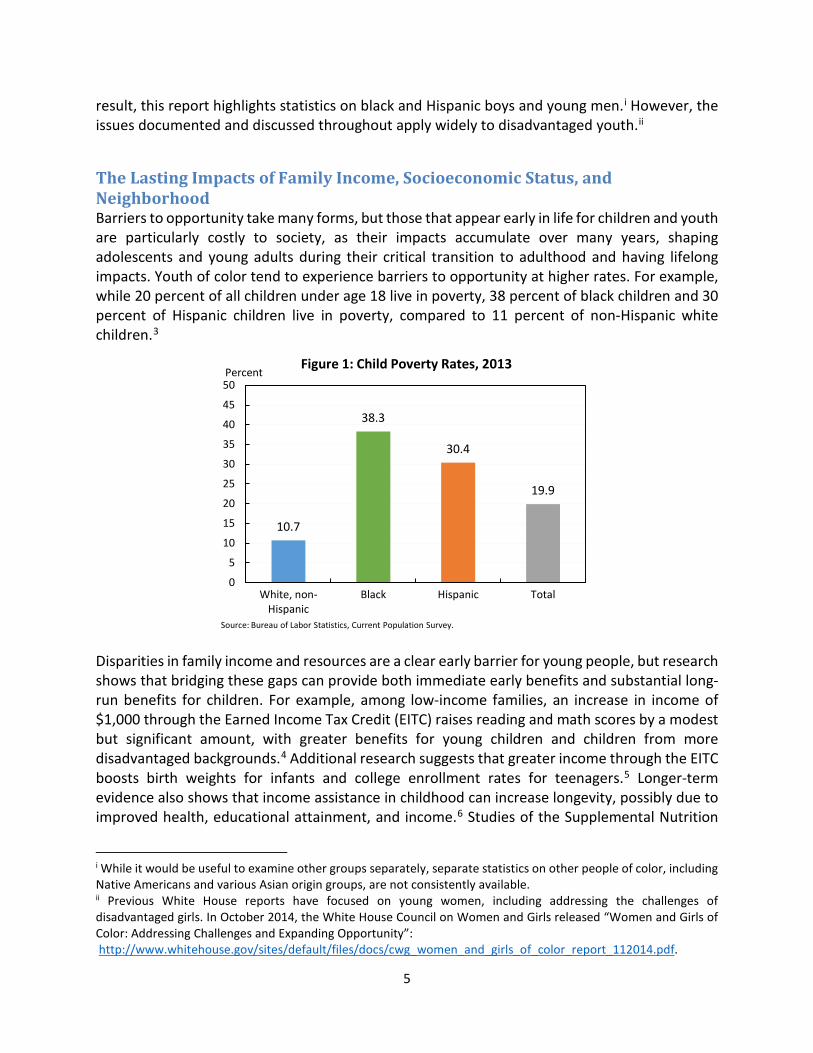
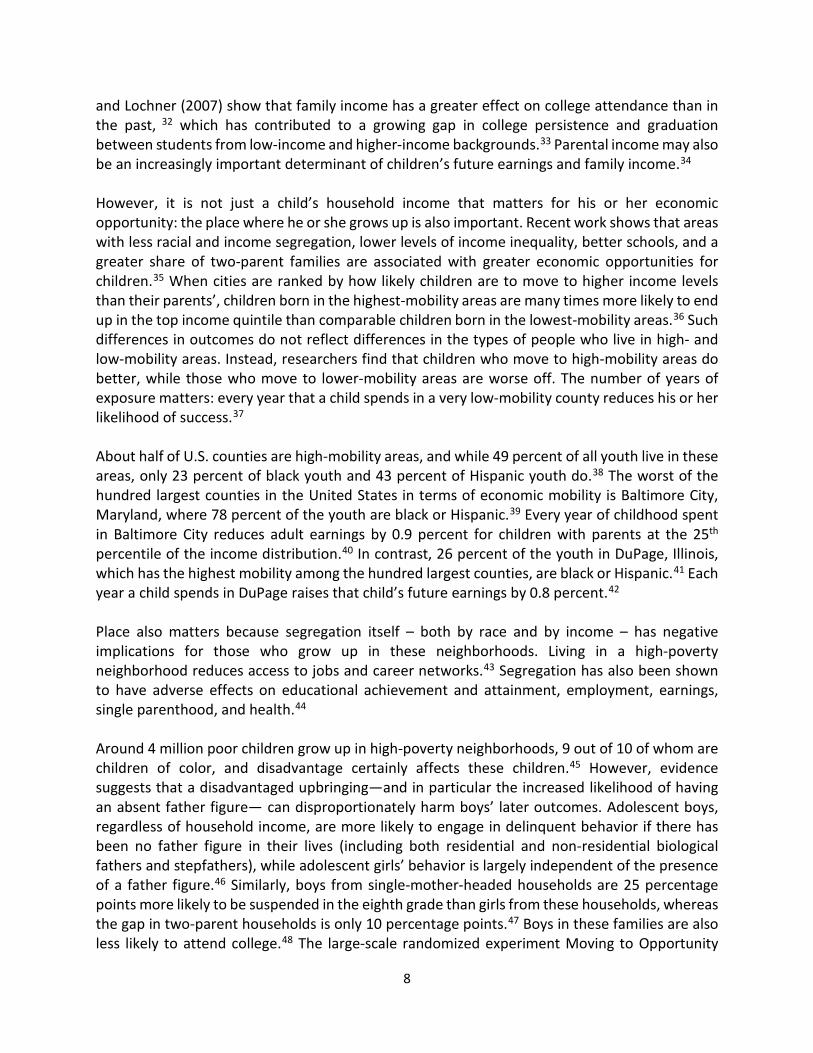
The Lasting Impacts of Family Income, Socioeconomic Status, and Neighborhood Barriers to opportunity take many forms, but those that appear early in life for children and youth are particularly costly to society, as their impacts accumulate over many years, shaping adolescents and young adults during their critical transition to adulthood and having lifelong impacts. Youth of color tend to experience barriers to opportunity at higher rates. For example, while 20 percent of all children under age 18 live in poverty, 38 percent of black children and 30 percent of Hispanic children live in poverty, compared to 11 percent of non-Hispanic white children.3
Disparities in family income and resources are a clear early barrier for young people, but research shows that bridging these gaps can provide both immediate early benefits and substantial long-run benefits for children. For example, among low-income families, an increase in income of $1,000 through the Earned Income Tax Credit (EITC) raises reading and math scores by a modest but significant amount, with greater benefits for young children and children from more disadvantaged backgrounds.4 Additional research suggests that greater income through the EITC boosts birth weights for infants and college enrollment rates for teenagers.5 Longer-term evidence also shows that income assistance in childhood can increase longevity, possibly due to improved health, educational attainment, and income.6 Studies of the Supplemental Nutrition
i While it would be useful to examine other groups separately, separate statistics on other people of color, including Native Americans and various Asian origin groups, are not consistently available. ii Previous White House reports have focused on young women, including addressing the challenges of disadvantaged girls. In October 2014, the White House Council on Women and Girls released “Women and Girls of Color: Addressing Challenges and Expanding Opportunity”: http://www.whitehouse.gov/sites/default/files/docs/cwg_women_and_girls_of_color_report_112014.pdf.
10.7
38.3
30.4
19.9
0
5
10
15
20
25
30
35
40
45
50
White, non-Hispanic
Black Hispanic Total
Figure 1: Child Poverty Rates, 2013Percent
Source: Bureau of Labor Statistics, Current Population Survey.
5
Assistance Program indicate that nutritional assistance can improve health outcomes in childhood and adulthood, as well as economic self-sufficiency in adulthood, even if an individual received only temporary income support during childhood.7 Other investments in early childhood also have substantial impacts on adult earnings and outcomes. For instance, Head Start and other early education programs have been found to increase high school graduation, college attendance, and labor force participation rates.8 Finally, health insurance for children has been shown to increase their earnings as adults: a single additional year of Medicaid/CHIP eligibility in childhood increases earnings enough to generate additional tax payments that cover a substantial fraction of the program cost.9 Moreover, there is evidence that in recent decades, family income has become more important in shaping children’s outcomes. As overall income inequality has increased, inequality among households with children has increased at even higher rates: from 1975 to 2005, income inequality among families with children increased by about two-thirds compared to 60 percent among all families.10 Three factors contribute to the rise in inequality among families with children:
(1) Income inequality has risen among adults overall, with the top ten percent income share, including capital gains, increasing from 35 percent in 1980 to 49 percent in 2013;11
(2) Parents with greater educational attainment (and higher average incomes) are delaying having children until they are in their late 20s or early 30s, while adults with lower levels of educational attainment are having children in their early- to-mid 20s. Regardless of educational attainment, those who have children at older ages tend to have higher income simply because earnings tend to rise as people age and gain workplace experience. The increase in earnings as one gains experience, however, is sharper for those with more education, such that earnings inequality is typically greater among 30 year olds than it is among 20 year olds.12 Taken together, parents with less education have both lower average lifetime earnings and tend to have children earlier in their careers when their earnings are lower;13 and
(3) Higher-earning, more highly educated parents are more likely to be in two-parent
households, while less educated, lower-earning parents are disproportionately likely to be single parents.14 Among mothers with children under 18 at home, nearly 9 in 10 college-educated mothers are married compared to around two-thirds of less-educated mothers.15 Therefore, some of the differences among children raised in two-parent versus one-parent homes are likely related to factors such as these that accompany single parenthood, rather than single parenthood itself.
Parents’ socioeconomic status can affect parental behavior and children’s outcomes through several channels. Financial expenditure is one obvious pathway. As income inequality has grown, so has inequality in child-related expenditures. Parents in the top income quintile now spend seven times more on children’s materials and enrichment activities—such as books, computers,
6

summer camps, and music lessons—than families in the bottom income quintile, and other research suggests that this inequality in expenditure has grown over time.16 Moreover, studies of income assistance have found that increased resources lead families to increase spending on educational expenses, such as tuition and computer supplies.17 The quantity and quality of time parents spend with children is another channel through which inequality can affect long-term outcomes and school readiness.18 Living in poverty means that parents must spend time and cognitive resources dealing with its many impacts, time and emotional energy that parents not living in poverty can spend in other ways, including on their children.19 On the other hand, while today all parents are increasingly spending more time with their children, more-educated parents have increased their time to a greater degree than parents with less education.20 A number of studies find differences in the ways parents with more and less education are able to spend time with their children. More highly educated parents are more likely to spend time developing their children’s reading and problem-solving skills and on other teaching activities that benefit their children’s development.21 For example, higher-income parents are more likely to engage in extensive early conversation with their children, such that children from higher income families are exposed to roughly 30 million more words than their lower-income peers, contributing to differences in early vocabulary growth.22 More highly educated parents are also more likely to convene family dinners and spend more time on engaged interaction with their children.23 These disparities in parental time investment are important because activities with children have been shown to lead to improvements in long-run outcomes. For example, time with children has been shown to increase children’s cognitive test scores.24 Family dinners have been linked to lower rates of substance abuse, violence, and suicidal thoughts, as well as higher grade-point averages.25 And a study of mother-child reading found that an additional year of daily reading raises children’s reading test scores in middle grades by 41 percent of a standard deviation.26 Income levels also affect the probability of abuse and neglect.27 Given this fact and the high proportion of youth of color in low-income environments, abuse and neglect disproportionately affect minority youth. There were over 650,000 children in 2013 who were victims of abuse or neglect, 21 percent of whom were black and 22 percent of whom were Hispanic.28 Inequality in family financial and non-financial resources contributes to achievement gaps that manifest as early as infancy and grow as children age.29 Much of the income gap in school test scores emerges before age 5, but remains relatively level throughout elementary school and beyond.30 Some researchers argue that these gaps have grown over the past 50 years, but this remains an active area of research.iii,31 Other work also shows that along some dimensions, family income has become a more important determinant of later-life outcomes. For example, Belley
iii There is some disagreement on the comparability of test score gaps across studies over time. While some studies suggest gaps in test scores across socioeconomic groups stabilize from primary school (Reardon 2011), others argue that differences in academic achievement based on the standardization of test scores are not comparable over time, and that when test scores are standardized across time in a different way, the achievement gap has narrowed (Nielsen 2015).
7
and Lochner (2007) show that family income has a greater effect on college attendance than in the past, 32 which has contributed to a growing gap in college persistence and graduation between students from low-income and higher-income backgrounds.33 Parental income may also be an increasingly important determinant of children’s future earnings and family income.34 However, it is not just a child’s household income that matters for his or her economic opportunity: the place where he or she grows up is also important. Recent work shows that areas with less racial and income segregation, lower levels of income inequality, better schools, and a greater share of two-parent families are associated with greater economic opportunities for children.35 When cities are ranked by how likely children are to move to higher income levels than their parents’, children born in the highest-mobility areas are many times more likely to end up in the top income quintile than comparable children born in the lowest-mobility areas.36 Such differences in outcomes do not reflect differences in the types of people who live in high- and low-mobility areas. Instead, researchers find that children who move to high-mobility areas do better, while those who move to lower-mobility areas are worse off. The number of years of exposure matters: every year that a child spends in a very low-mobility county reduces his or her likelihood of success.37 About half of U.S. counties are high-mobility areas, and while 49 percent of all youth live in these areas, only 23 percent of black youth and 43 percent of Hispanic youth do.38 The worst of the hundred largest counties in the United States in terms of economic mobility is Baltimore City, Maryland, where 78 percent of the youth are black or Hispanic.39 Every year of childhood spent in Baltimore City reduces adult earnings by 0.9 percent for children with parents at the 25th percentile of the income distribution.40 In contrast, 26 percent of the youth in DuPage, Illinois, which has the highest mobility among the hundred largest counties, are black or Hispanic.41 Each year a child spends in DuPage raises that child’s future earnings by 0.8 percent.42 Place also matters because segregation itself – both by race and by income – has negative implications for those who grow up in these neighborhoods. Living in a high-poverty neighborhood reduces access to jobs and career networks.43 Segregation has also been shown to have adverse effects on educational achievement and attainment, employment, earnings, single parenthood, and health.44 Around 4 million poor children grow up in high-poverty neighborhoods, 9 out of 10 of whom are children of color, and disadvantage certainly affects these children.45 However, evidence suggests that a disadvantaged upbringing—and in particular the increased likelihood of having an absent father figure— can disproportionately harm boys’ later outcomes. Adolescent boys, regardless of household income, are more likely to engage in delinquent behavior if there has been no father figure in their lives (including both residential and non-residential biological fathers and stepfathers), while adolescent girls’ behavior is largely independent of the presence of a father figure.46 Similarly, boys from single-mother-headed households are 25 percentage points more likely to be suspended in the eighth grade than girls from these households, whereas the gap in two-parent households is only 10 percentage points.47 Boys in these families are also less likely to attend college.48 The large-scale randomized experiment Moving to Opportunity
8
showed that for young boys, moving from high-poverty public housing to lower poverty communities did not improve behavioral or health outcomes as much as it did for girls.49 Researchers have argued that this gender difference in outcomes may be partly due to increased distance from father figures and other differences in social experiences that may contribute to gender differences in the impacts of these moves.50
Long-Standing Disparities in Education Even today, wide disparities exist in funding across schools. Youth of color are disproportionately likely to attend a poorly-funded school, as fewer State and local dollars are spent on districts with a higher percentage of minority students in 20 States.51 Youth of color are also more likely to attend a school where more than 75 percent of students are eligible for free or reduced-price meals.52 Data from the National Assessment of Educational Progress indicates that 8th grade students who attend high-poverty schools score lower on reading and math assessments than students in low-poverty schools.53 Students of color are also more likely to attend schools which do not offer important courses: for instance, a quarter of high schools with the highest percentage of black and Hispanic students do not offer Algebra II.54 (Reflecting data availability, these statistics apply to both boys and girls.) Additionally, the school discipline system has become more closely linked to the juvenile justice system as a result of increasing zero-tolerance policies in schools that disproportionately discipline and criminalize youth of color.55 These overly punitive policies have created what is known as the “school-to-prison pipeline,” meaning that affected disadvantaged youth can suffer the results of justice system involvement before they ever enter the labor market. Given these disparities in educational investments and persistent school segregation and their associated impacts on student achievement, it is not surprising that youth and young men of color lag their peers on most measures of labor market readiness and success. Of particular concern are substantial disparities in credential completion. Among those ages 25-29, over 95 percent of non-Hispanic white men have a high-school diploma, compared to 93.5 percent of black men and 72.4 percent of Hispanic men,56 although high school completion rates for Hispanic and black youth have notably increased since the mid-1990s.57 High school degree attainment is even lower among American Indian/Alaskan Native men ages 16 and older, around one-third of whom lack a high school diploma.58 Young men of color are also less likely to complete a college degree. For instance, only 12.4 percent of Hispanic men and 20.8 percent of black men ages 25 to 29 have a college degree, compared to 37.7 percent of non-Hispanic white men.59 These substantial disparities in educational opportunity and attainment fuel inequities for young men of color that persist into adulthood. Statistics from the Current Population Survey show similar gaps in educational attainment occur for women.
9

Despite these disparities, there are signs of progress. For example, high school completion has risen rapidly for Hispanic Americans in recent decades. Twenty years ago, less than 60 percent of young Hispanic men had high school degrees, compared to 74 percent of black men and 87 percent of non-Hispanic white men. Today, high school completion among Hispanic youth nearly equals that among black youth.60 At the same time, college-going rates have increased among young black students. White and black students who have graduated from high school enroll in college at approximately equal rates, a fact that highlights that high school graduation remains an important point of vulnerability for youth of color.61 Helping more disadvantaged young people achieve the milestone of high school completion will help ensure that more of them continue on the path to higher education, which is critical since almost half of all occupations typically require some postsecondary education for entry.62 However, there are also challenges to successful college completion—like insufficient high school preparation, bad matching to schools, and lack of support—that can be larger for disadvantaged youth. Low-income students are less likely to meet readiness benchmarks on college entrance exams, with half of low-income students meeting none of the four ACT benchmarks.iv,63 Low-income students are also more likely to “undermatch,” or attend a school that is less selective than one matching their achievement and potential, which is negatively associated with completion.64 Enhanced on-campus student supports combined with scholarship aid have been shown to promote persistence and completion for low-income students, counteracting some of the difficulties that affect the persistence of low-income college students.65 Even among those graduating from college, there are differences in the subjects that students study. Science, engineering, technology, and math (STEM) fields, which tend to have higher earnings potential, have larger gaps than other fields. While 16.4 percent of white students study STEM subjects, only 11.5 and 14.5 percent of black and Hispanic students, respectively, do.66 If
iv For instance, ACT has done work to demonstrate that low-income students are less likely to meet benchmarks for college-readiness across subjects such as reading, mathematics, and science compared to their higher income peers.
0
10
20
30
40
50
60
70
80
90
100
Non-Hispanic WhiteMen
Black Men Hispanic Men
High School Degree or HigherBachelor's or Higher
Figure 2: Educational Attainment by Ages 25-29 in 2014Percent
Source: Bureau of Labor Statistics, Current Population Survey; Department of Education calculations.
10

black and Hispanic men studied STEM subjects at the same rate as white students, there would be an additional 3,800 STEM college graduates each year, an increase of 2 percent in the total number of STEM graduates.67 Part of the problem is attrition: white students who begin a STEM major are much more likely than black students to complete the major and are slightly more likely than Hispanic students to do so.68 Ensuring a population of STEM graduates is important to the future of the American economy. While it is difficult to separate out causality, areas with more STEM workers are more likely to have lower unemployment rates and higher median household income. These areas also have more patents generated per million residents.69
Long-Standing Inequalities in Exposure to the Juvenile and Criminal Justice System Some disparities in educational attainment result from inequities in other areas. One reason that high school completion among men of color lags is because too many encounter uneven application of criminal or disciplinary procedures both inside and outside of school from very young ages. For example, black children represent 18 percent of preschool enrollment but 48 percent of preschool children receiving more than one out-of-school suspension. These trends continue as children age, as black and Hispanic teen males are disproportionately likely to be suspended or expelled from school or to have interactions with the criminal justice system.70 Black individuals are nearly four times more likely to be incarcerated than non-Hispanic white individuals, and Hispanic individuals have only recently seen their incarceration rates fall to those of non-Hispanic white individuals, down from more than double the rate of non-Hispanic white incarceration in the early 1990s. The Nation’s incarceration rate has spiked over the last few decades, a trend that has been particularly pronounced in minority communities. In 1984, the majority of State and Federal prisoners were white.71 In 2011, the majority of the more than 1.5 million prisoners were minorities, including 930,000 prisoners who were black or Hispanic (61 percent).72 Even when there is little difference in the likelihood of committing a crime, individuals of color are much more likely to be arrested. For example, a black individual is nearly four times as likely as a white individual to be arrested for marijuana possession, even though black and white individuals reported using marijuana at similar rates in 2010.73 Even though incarceration rates have fallen for people of color in the last half-decade, over 875,000 minors were arrested in 2013, and young boys and men of color make up a substantial share of those arrested.
11

Inequalities in the application of formal disciplinary actions by schools and the legal system at nearly every stage contribute to inequalities in involvement with the justice system overall. For instance, black drivers are more likely than white or Hispanic drivers to be pulled over, and even after a stop, white drivers are ticketed and searched at lower rates than black and Hispanic drivers.74 Of those convicted of a crime, 84 percent of black offenders were sentenced to incarceration versus 79 percent of white offenders in 2011-2012, and conditional on conviction and offense type, black offenders tend to receive longer sentence lengths.75 Another example shows that these inequities exist even among juvenile offenders: a Department of Justice investigation in Shelby County, TN found that, compared to white children, black children were less likely to receive the benefits of more lenient judicial and non-judicial options, more likely to be detained, and more likely to have their cases transferred to adult criminal court, and that this disproportionate impact could not be explained by factors other than race.76 Minorities account for a larger proportion of the population at each stage in the criminal justice process. For example, black individuals made up 16 percent of Federal arrestees77 but 36 percent of the Federal prison population in 2012.78 Black individuals also served more time for nearly every category of criminal offense in 2009, amounting to an average additional sentence length of 6 months—23 percent longer—and serving a larger percentage of the maximum sentence for their offense.79
Barriers in Education and the Justice System Lower Later Employment and Activity Rates The disparities in educational investment and justice system application have consequences for the opportunities that young men of color have when they join the labor market as adults. These labor market consequences begin immediately. For example, even as youth, young men of color are less likely to find employment and have lower earnings than young white men. In 2014, 10 percent of male youth of color were unemployed but looking for work while 45 percent were employed, indicating that 55 percent participated in the labor market. Among non-Hispanic white
Male, Overall
White
Black
Hispanic
0
100
200
300
400
500
600
700
800
900
1990 1995 2000 2005 2010
Figure 3: Incarceration Rates, 1990-2013Incarceration rate (per 100,000 people)
Source: Bureau of Justics Statistics; Census Bureau; CEA calculations. Data for racial and ethnic groups include both men and women.
12
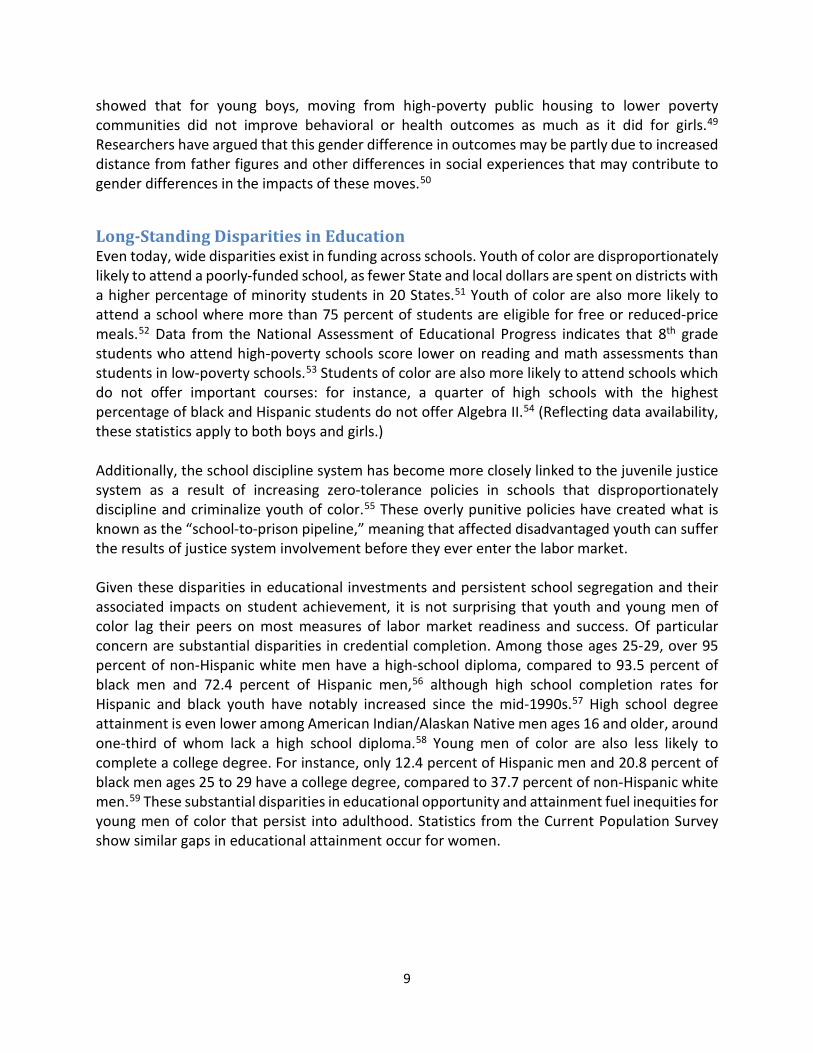
male youth, only 7 percent were unemployed and looking for work, and 52 percent of them were employed, with a total of 59 percent participating.80 Unemployment remains a particular challenge for youth who drop out of high school. In 2014, 24 percent of young high school dropouts were unemployed, compared to 13 percent of young high school graduates. For young men of color, unemployment among dropouts is even worse. Among young black men who drop out of high school, unemployment is 47 percent versus 22 percent among those who graduate.81 The difficult odds in the labor market may discourage young men of color and other youth from participating at all. As a result, young men of color are less likely to be “active”—either participating in the labor force or enrolled in school. In the last decade, both young non-Hispanic white men and young men of color have seen declines in being active. The decline has been larger among young non-Hispanic white men, however, leading to a slight narrowing of the difference. Today, the activity gap primarily reflects the fact that young men of color are less likely to participate in the labor force than young non-Hispanic white men, since the school enrollment gap between these groups has essentially closed in recent years.
The challenges that young men of color face in the labor market and educational system as teens and very young adults continue to shape their adult labor market experiences. Throughout their lives, participation rates are lower for black men than for non-Hispanic white men. Among adults 25-34, non-Hispanic black men are 8 percentage points less likely to participate in the labor market and nearly 15 points less likely to be employed than non-Hispanic white men. Moreover, official labor market statistics do not count people who are incarcerated. If the 6 percent of young black men ages 15-24 incarcerated in adult and juvenile correctional facilities were treated as not employed, then the employment rate among this age group would fall by 2.0 percentage points. Among prime-aged black men, if those missing due to incarceration or early death were included as not employed, the black-white employment gap could be as high as 24 percentage points, as
80
85
90
95
100
1994 1998 2002 2006 2010 2014
Figure 4: Share of Young Men Ages 16-19 Either Engaged in the Labor Force or in School
Percent
Source: Bureau of Labor Statistics, Current Population Survey; CEA calculations.
Non-Hispanic White
Hispanic
Black
13
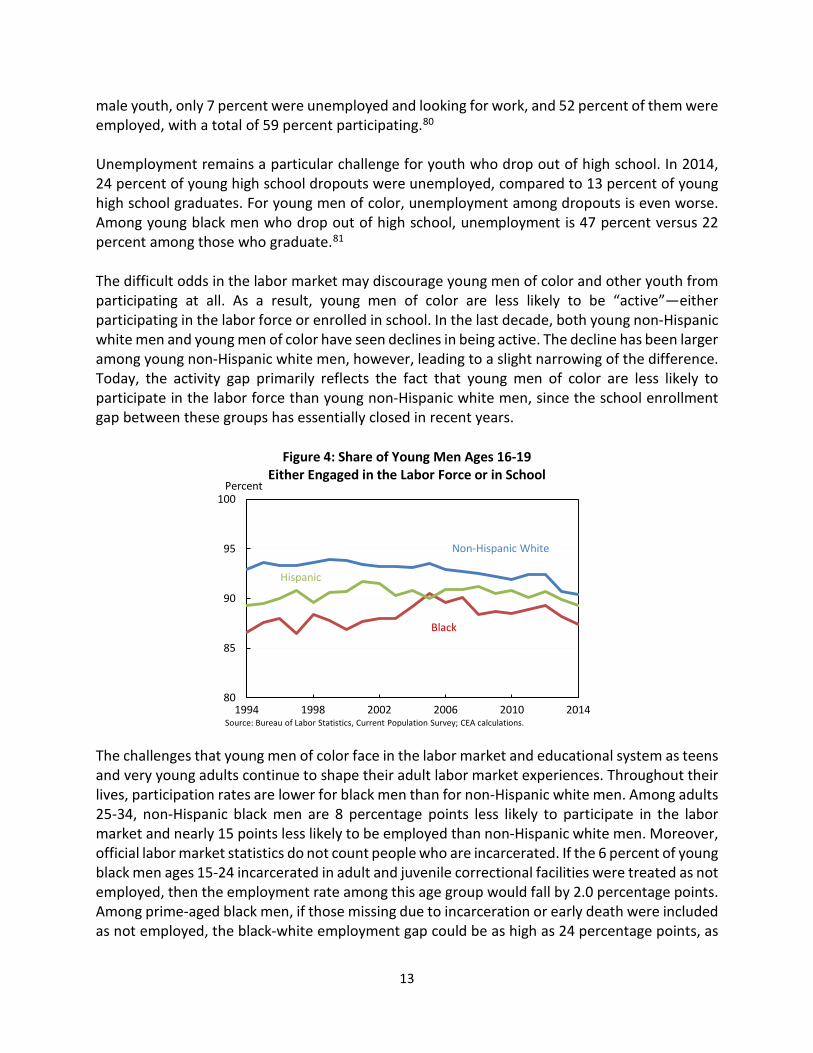
compared to 13 percentage points using only individuals observed in the Current Population Survey.82 Low wage prospects may discourage men from participating in the labor force. Over the last three decades, low-skill men have participated at lower rates as their wages have fallen, while high skill men have participated at higher rates as their wages have risen, suggesting that worsening economic conditions for a larger share of men of color have contributed to lower participation rates.83
Gaps in participation, employment, education, and involvement with the criminal justice system all translate into gaps in weekly earnings. Even among those who participate in the labor force and are able to find a job, weekly earnings among young non-Hispanic white men are 40 percent higher than black men. Although employment rates among young Hispanic men are similar to young non-Hispanic white men, the earnings gap between Hispanic and non-Hispanic white men is large. These earnings gaps are only partially explained by differences in the number of hours worked each week: even among those working full-time, year-round, median weekly earnings among white men are more than 30 percent higher than among black men.84 Although barriers to early learning and educational attainment can lead young men of color to enter the labor market with fewer skills than their white counterparts, a large body of research shows that the disparities in employment and earnings are not fully explained by differences in skills. Studies have shown that otherwise identical resumes with stereotypically “white” names receive more callbacks for interviews than resumes with stereotypically “black” names.85 This and other instances of discrimination in the job-finding process for black individuals carry through into lower wages and lifetime earnings even once a job is offered, with at least one-quarter of the racial wage gap attributable to discrimination.86
-100
-60
-20
20
60
100
140
-10
-6
-2
2
6
10
14
Black Hispanic
Participation Gap (left axis)Employment Gap (left axis)Unemployment Gap (left axis)Weekly Wage Ratio (right axis)
Figure 5: Male Labor Market Outcome Gaps, 2014, Ages 25-34Percentage Points (White-Non-White) Ratio (White/Non-White)
Note: "White" excludes those of Hispanic origin.Source: Bureau of Labor Statistics, Current Population Survey; CEA calculations.
14

In addition to the consequences of inequities in the educational system, early involvement with the criminal justice system can lead to further disparities in later employment, pay growth, and job stability.87 Differences in incarceration also have long-term impacts on communities and labor market opportunities in the future. Not only are over a million young boys and men of color missing from their communities, but when they return, the legacy of a criminal record follows them. Formerly-incarcerated and other justice-involved individuals face ongoing barriers to employment after release, including a lack of safe, drug-free housing; lack of job placement assistance; loss of aid eligibility; lack of other networks and forms of support; and legal barriers to holding certain jobs.88 Additionally, ex-offenders face additional scrutiny from employers. Only about 60 percent of employers in one survey said they might consider hiring an ex-offender.89 A resume audit study found that employers act based on this apprehension: applicants with criminal records were less likely to be called back for an interview or offered a job, and the negative response was especially large for black and Hispanic men with criminal records.90
15

II. Economic Costs of Disadvantage These disparities in education, earnings, employment, and involvement with the criminal justice system mean that the potential achievements of millions of Americans are cut short by disadvantage. They are an injustice for those directly affected and a drag on the American economy, resulting in lower aggregate earnings, a smaller labor market, and slower economic growth. To take one example, suppose barriers to labor market participation fell, and men of color were to participate in the labor market at the same rates as white men of the same age group without any change in their unemployment rates. The employment gap between young men of colorv and young white men would fall from 5.2 percentage points to 2.8 percentage points, and among prime-age men (those 25 to 54) from 4.4 percentage points to 2.3 percentage points.91 This suggests that even absent other changes, lowering barriers that reduce participation could substantially lower the employment disparities between white men and men of color. Additionally, if both young men and prime-age men of color (those ages 16-54) participated in the workforce at the same rates as non-Hispanic white men their age, GDP would rise 2 percent—or by roughly $350 billion.vi This estimate of the impact on GDP ignores the additional participation that could arise if men of color, particularly black men, were more fully represented in the civilian population. Currently, as many as 1 in 6 prime-age black men are missing, largely due to either incarceration or early death.92 If these men were added to the civilian population totals, the effect on GDP would be larger. These lower participation rates reflect accumulated barriers from early youth to adulthood. To put this in stark terms, a black male child born 25 years ago has only a roughly 1 in 2 chance of being employed. Incarceration, early death, high unemployment, and low labor force participation remove half of the potential young black men in their mid-twenties from employment.93 These statistics differ markedly over location of birth. Across the ten States with the largest African-American populations, the employment rate of 25-year-old black male State natives in 2013 ranged from 35 percent to 65 percent. The low of 35 percent was from Maryland, where over 20 percent of the African-American population lives in the Baltimore area. By contrast, for Virginia the figure is 65 percent. Participation among working-aged men of color is centrally important to the American economy, and America could grow its economy for all by bringing these men more fully into the labor force. However, addressing barriers to educational opportunity and attainment can begin to prevent the labor participation gap before it starts. Following a recent approach by the Hamilton Project, the Council of Economic Advisers calculated the impacts of closing the educational attainment
v Defined here as black or Hispanic men ages 16-24. vi CEA calculated this using a growth account formula that relates the level of output to the supply of labor. Using the Current Population Survey, CEA calculated the increase in hours worked by black and Hispanic men aged 16 to 54, assuming that the average product of labor remains unchanged.
16

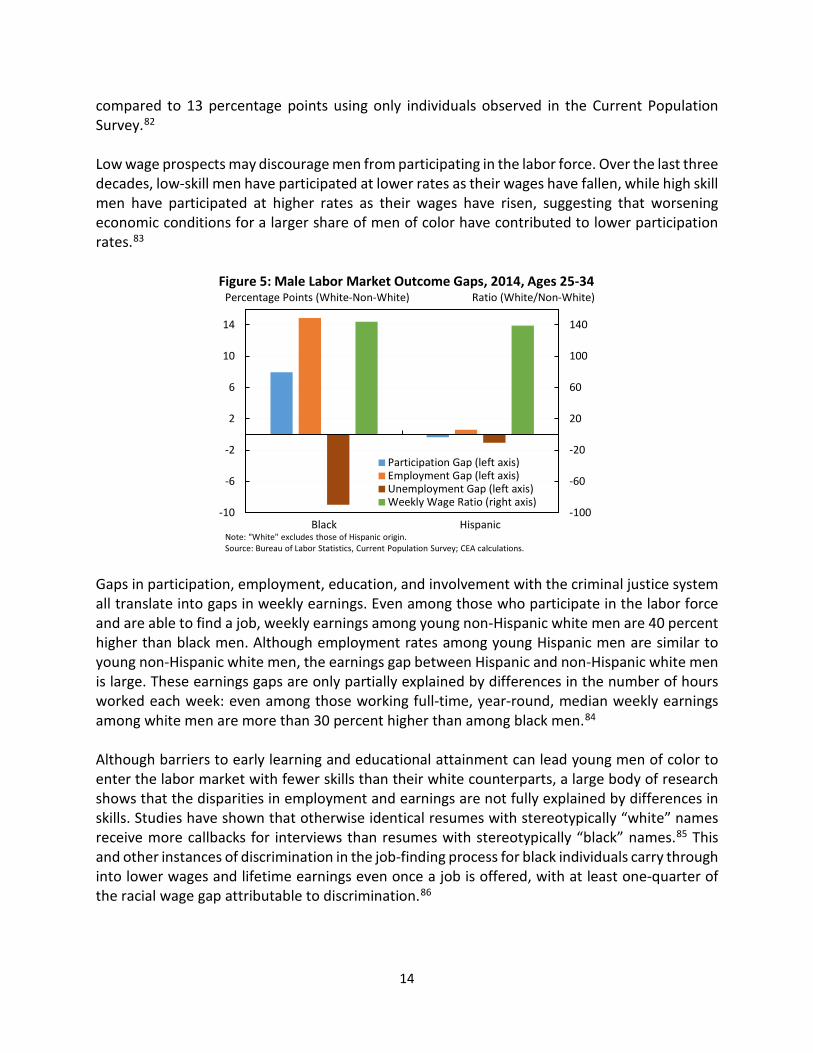
gap on earnings and employment.vii If the educational attainment of working-aged men of color matched that of non-Hispanic white men, the share of working-aged non-white Hispanic and black men who have a BA or above would double.
The impact of equalizing educational attainment would generate higher employment rates and greater earnings among men of color. The employment increases from closing education gaps would modestly boost GDP by at least 0.3 percent. Since individuals with greater educational attainment earn more on average, closing these gaps would mean substantially higher earnings for men of color. As much as $170 billion in increased annual earnings would flow to men of color as a result of expanding their educational attainment to match that of non-Hispanic white men. The added earnings would raise average weekly earnings for U.S. workers overall by 3.6 percent, and it is reasonable to assume that this boost in earnings reflects productivity gains from a more-educated black and Hispanic male workforce. By contrast with the employment gains, the productivity gains would generate an increase in GDP of at least 1.5 percent, for a total increase in GDP of 1.8 percent at minimum. Of course, if the gaps were closed among all disadvantaged groups, the gains to our economy would be even larger.
Economic Costs from Crime Crime has many structural determinants, like lead pollution and poverty.94 However, the strength of local economies is also an important factor. When well-paying jobs are scarce, crime rises, which confers substantial costs to the wider community. Between 1979 and 1997, wages for less-educated men fell by 20 percent and property crime rose by 21 percent, while violent crime rose by 35 percent; research has found that around half of this increase in crime was due to decreased wages for low-skilled men.95 Similarly, other work finds that approximately 40 percent of the decline in property crime during the late 1990s was due to increased employment
vii For methodological details, see Technical Appendix.
36
17
37
8177 81
$1,173
$794$950
0200400600800100012001400
0
20
40
60
80
100
Non-Hispanic White Black or Hispanic Black or Hispanic withWhite education
distribution
Actual After closing gaps
Share with BA or above (left axis)Employment rate (left axis)Average weekly earnings (right axis)
Figure 6: Male Employment, Education, and Earnings, 2014
Percent 2014$
Note: Methodology adapted from Hershbein, Kearney, and Summers (2015). Calculation is for those ages 25 to 64. Employment is defined as having positive weekly earnings. All figures are rounded to the nearest whole number.Source: Bureau of Labor Statistics, Current Population Survey; CEA calculations.
17

opportunities.96 The relationship between economic opportunity and crime is not wholly clear-cut. For instance, crime fell throughout the most recent recession. Nevertheless, experience of past decades suggests that improving economic opportunity can also help lower crime rates. This means that barriers to full participation and success in the labor market can contribute to higher crime levels. Although crime has fallen in recent years, researchers estimate that combined Federal, State, and local corrections expenditures were about $75 billion in 2008.97 The average annual cost of incarceration for a single juvenile is over $100,000—far more costly than the sticker price of tuition at the most expensive college in the country or a year of intensive mentoring. This suggests that government expenditures on crime could be redirected toward higher-return investments that generate larger benefits for the wider economy.
In addition, there are costs to incarceration beyond government expenditures. For instance, a 2010 Bureau of Justice Statistics report estimated that 2.3 percent of children have a parent in prison, and this share has nearly doubled since 1991.98 About half of these parents provided primary financial support to their children prior to their incarceration. In addition to a loss of financial resources, the incarceration of a parent has been linked to a variety of negative outcomes for children, including diminished cognitive abilities and behavioral problems.99 Communities with high levels of incarceration also suffer. For example, each additional percentage point of ex-offenders in the population reduces employment and labor force participation of young black men by about 0.1 to 0.25 percentage points, likely both due to discrimination against potential offenders and to the degeneration of networks that help people find jobs.100 Incarceration can reduce employment and earnings long after a person is released.101 Moreover, incarceration, combined with higher mortality rates of young black men, has undermined relationships and reduced marriage rates among black women.102
$112,423
$31,231$22,958
$12,813$1,353 $1,320 $1,194
0
20,000
40,000
60,000
80,000
100,000
120,000
YouthIncarcerationfor 12 Months
Tuition andFees at Four-Year PrivateUniversity,Non-Profit
Tuition andFees at Four-Year PublicUniversity,
Out-of-State
Public School(K-12)
Big BrothersBig SistersMentoringProgram
One SummerPlus (OSP)
Becoming aMan (BAM)
Figure 7: Annual Cost of Juvenile Incarceration vs. Other Youth InvestmentsDollars (2014$)
Source: American Correctional Assocation; College Board; National Center for Education Statistics; Big Brothers Big Sisters of America; Heller et al. (2013)
18
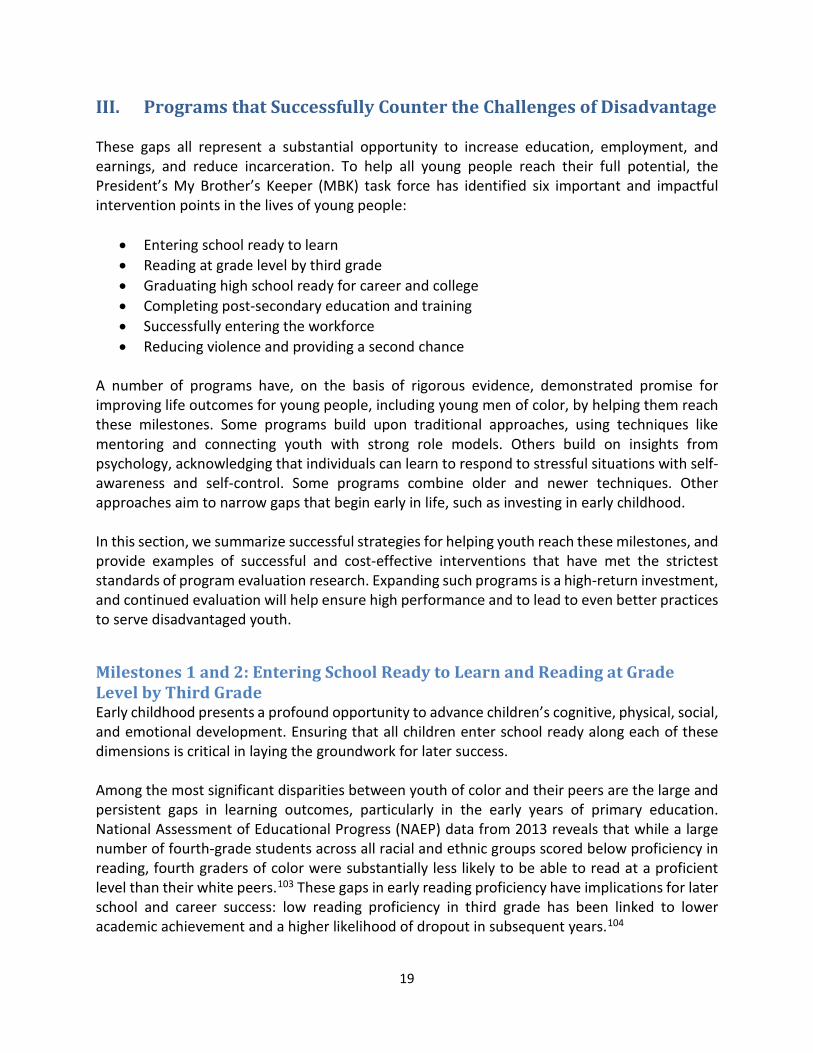
III. Programs that Successfully Counter the Challenges of Disadvantage These gaps all represent a substantial opportunity to increase education, employment, and earnings, and reduce incarceration. To help all young people reach their full potential, the President’s My Brother’s Keeper (MBK) task force has identified six important and impactful intervention points in the lives of young people:
• Entering school ready to learn • Reading at grade level by third grade • Graduating high school ready for career and college • Completing post-secondary education and training • Successfully entering the workforce • Reducing violence and providing a second chance
A number of programs have, on the basis of rigorous evidence, demonstrated promise for improving life outcomes for young people, including young men of color, by helping them reach these milestones. Some programs build upon traditional approaches, using techniques like mentoring and connecting youth with strong role models. Others build on insights from psychology, acknowledging that individuals can learn to respond to stressful situations with self-awareness and self-control. Some programs combine older and newer techniques. Other approaches aim to narrow gaps that begin early in life, such as investing in early childhood. In this section, we summarize successful strategies for helping youth reach these milestones, and provide examples of successful and cost-effective interventions that have met the strictest standards of program evaluation research. Expanding such programs is a high-return investment, and continued evaluation will help ensure high performance and to lead to even better practices to serve disadvantaged youth.
Milestones 1 and 2: Entering School Ready to Learn and Reading at Grade Level by Third Grade Early childhood presents a profound opportunity to advance children’s cognitive, physical, social, and emotional development. Ensuring that all children enter school ready along each of these dimensions is critical in laying the groundwork for later success. Among the most significant disparities between youth of color and their peers are the large and persistent gaps in learning outcomes, particularly in the early years of primary education. National Assessment of Educational Progress (NAEP) data from 2013 reveals that while a large number of fourth-grade students across all racial and ethnic groups scored below proficiency in reading, fourth graders of color were substantially less likely to be able to read at a proficient level than their white peers.103 These gaps in early reading proficiency have implications for later school and career success: low reading proficiency in third grade has been linked to lower academic achievement and a higher likelihood of dropout in subsequent years.104
19

Inequality in early child development is reflected in, and exacerbated by, differences in access to and utilization of early care and education programs by race, income, and educational attainment. For instance, though Hispanic children make up a quarter of three- and four-year olds, they have the lowest preschool participation rates of any major racial or ethnic group. Forty-one percent of Hispanic children participate in preschool, compared to 53 percent of black children and 56 percent of non-Hispanic white children.105 Gaps in access to high-quality early education persist and contribute to large gaps in later school achievement. Improving access to quality early childhood education will help more children of all backgrounds enter school ready to learn, regardless of who they are and where they live. Overall, across a large body of studies and time periods, early childhood education has been shown to increase cognitive and achievement scores by 0.35 standard deviations on average, or nearly half the black-white difference in the kindergarten achievement gap.106 Since higher-income children are more likely to have access to high-quality early education, expanding access to all would narrow the achievement gap. By improving cognitive and socio-emotional development, investments in early childhood education help reduce inequalities that appear by the time children enter kindergarten, creating lifelong benefits for children and parents, as well as society. A series of landmark experiments studying low-income, primarily minority youth in the 1960s and 1970s established that preschool has high short-term and long-run returns for disadvantaged youth. In the Abecedarian Project (ABC) study, poor children born in North Carolina between 1972 and 1977 were randomly assigned to receive full-time, high-quality education from infancy through age five. Children’s cognitive and achievement gains from ABC persisted through adolescence and adulthood, which led to higher college graduation rates and higher earnings of over 60 percent relative to the control group.107 Similarly, the High/Scope Perry Preschool program provided preschool to low-income black children at high risk of failing in school in Ypsilanti, Michigan during the 1960s. Perry increased IQ scores at school entry, and other gains persisted while students were in school and into adulthood.108 Participants’ high school graduation rates rose by about 17 percentage points, and when they entered the workforce, Perry participants had earnings about 25 percent higher than their control group counterparts through age 40.109 A larger-scale early childhood education intervention for low-income youth in Chicago found similarly positive results; since 1967, the Chicago Child-Parent Centers (CPC) have provided comprehensive early childhood education and family supports to low-income children and parents. Due to the significant increases in achievement and educational attainment, participants in the CPC preschool program saw increases in annual earnings measured in their late 20s of about 7 percent. The benefit-cost ratios for these landmark programs range from $3.80 to $8.60 for every $1 spent.viii,110
Modern universal preschool programs have shown similar large impacts on cognition and achievement, especially for low-income children. Universal State-level preschool programs in
viii Benefit-cost ratio for Abecedarian is 3.8 (Masse and Barnett 2002), for Perry is 8.6 (Heckman et al. 2010), and for CPC preschool is 7.1 (Reynolds et al. 2002) using a 3 percent discount rate.
20

Georgia and Oklahoma have shown promising cognition and achievement results for their participants, suggesting similar impacts to programs like ABC, Perry, and CPC, with the largest impacts for low-income students. Students who attended preschool in Georgia and Oklahoma are not yet old enough to directly measure earnings; however, researchers have used achievement gains to estimate that adult earnings for these children will likely increase by 1.3 to 3.5 percent.111 Summing the value of increased future earnings over the average participant’s lifetime from these programs implies that there are substantial benefits for each child, likely at least $2.70 to $7.20 in benefits for every $1 spent.ix
Milestone 3: Graduating High School Ready for Career and College As discussed above, disparities in educational attainment have lasting impact on the career outcomes for young people. Research has identified a number of pathways for ensuring that students, especially those at a disadvantage, not only graduate from high school, but do so prepared for both postsecondary education and the workforce. One such pathway, according to multiple studies, is through the use of high-performing charter schools. Several intensive charter school approaches have shown large test scores increases among disadvantaged youth. These include the Promise Academy in the Harlem Children’s Zone, the KIPP Academies, and the SEED urban boarding school.112 Results from the evaluation of SEED, for example, show that SEED increased both reading and math test scores by over 0.2 standard deviations per year of attendance. Researchers then used the relationship between higher test scores and a predicted 3.8-percent increase in future earnings per year of attendance to find that returns on investment were as high as 4.6 to 6.4 percent.113 More recently, research has shown that these score gains extend to a range of medium-run outcomes, including on-time high school completion and college enrollment, teen pregnancy, and incarceration.114 While high-performing charter schools stand as important successes, they are necessarily limited in the number of youth they can reach. However, researchers have outlined five best practices that highly successful charters share: (a) provision of frequent feedback to teachers; (b) the use of data-driven monitoring systems to track student achievement in order to guide instruction; (c) high-dosage tutoring for struggling students; (d) increased instructional time through an extended school day and an extended school year; and (e) creating a culture of high expectations. Analysis finds that implementation of these practices is more strongly associated with school effectiveness than traditional resource-based inputs.115
Milestones 4 and 5: Completing Postsecondary Education and Training and Successfully Entering the Workforce Making sure that students of all backgrounds not only graduate from high school and enroll in college but also successfully complete their postsecondary education is critical to ensuring that they are able to make use of their full potential when they enter the labor force. Some opportunity gaps have narrowed over the years. For example, among black and white students
ix Cascio and Schanzenbach (2013) use a 3.4 percent discount rate.
21

who graduate from high school, rates of college enrollment are now roughly equal.116 Although the enrollment gap has nearly closed, completion gaps persist. In the 2012-2013 school year, the high school graduation rate was 87 percent for non-Hispanic white youth but only 71 percent for black youth and 75 percent for Hispanic youth. 117 There are several avenues to increasing the likelihood that young people who enter college are able to complete their degree. For example, a body of research finds that reducing college costs—through a variety of mechanisms—helps low-income students stay in college through completion.118 Studies have shown that scholarship programs can increase degree completion and overall schooling attainment for lower-income students. Evidence for these impacts comes from a variety of State merit- and need-based scholarship programs and variation in Federal Pell grants.119 Recently, researchers have begun studying the impact of combining scholarship eligibility with performance incentives, such as credit hour and GPA requirements, and enhanced services, such as peer advising. Early analysis shows that lowering financial barriers while simultaneously providing support services can further encourage retention.120 In particular, individualized student coaching has been found to increase degree completion.121 One specific program that has been shown to increase student persistence is the Opening Doors program, run by MDRC. The Opening Doors program in New Orleans offered students $1,000 for each of two semesters if the students, who were low-income parents, were enrolled in community college at least half-time and maintained at least an average grade of C. Counselors also met with students periodically to monitor progress and disburse checks. Among the first wave of students in the program, the program not only increased registration through the study period by 6.5 percentage points, but it also increased the likelihood of earning a GPA of at least 2.0 by 11 percentage points.122 Community colleges are an important provider of education for low-income individuals. Although access to community colleges has expanded, graduation rates remain extremely low, especially for students referred to developmental (remedial) courses. The City University of New York’s (CUNY’s) Accelerated Study in Associate Programs (ASAP), a comprehensive program to support students at high risk of dropout, required students to attend college full-time and encouraged them to take their developmental courses early, allowing them to graduate in three years. The program supplemented the requirements with comprehensive advising, enhanced career services, and tutoring; offered blocked or linked courses and a life skills course; and provided transportation subsidies and free use of textbooks. The program also provided a tuition waiver to fill any gap between financial aid and college tuition and fees. ASAP improved students’ academic outcomes over three years, nearly doubled graduation rates, and increased the likelihood of subsequent enrollment in a four-year school by nearly 50 percent.123 Research also suggests that the quality of a post-secondary school is an important factor in student retention.124 However, even modest interventions that help students stay on track can have important effects. One study sent personalized text message reminders about annual renewal of the Free Application for Federal Student Aid (FAFSA) to a group of subjects at both two- and four-year
22
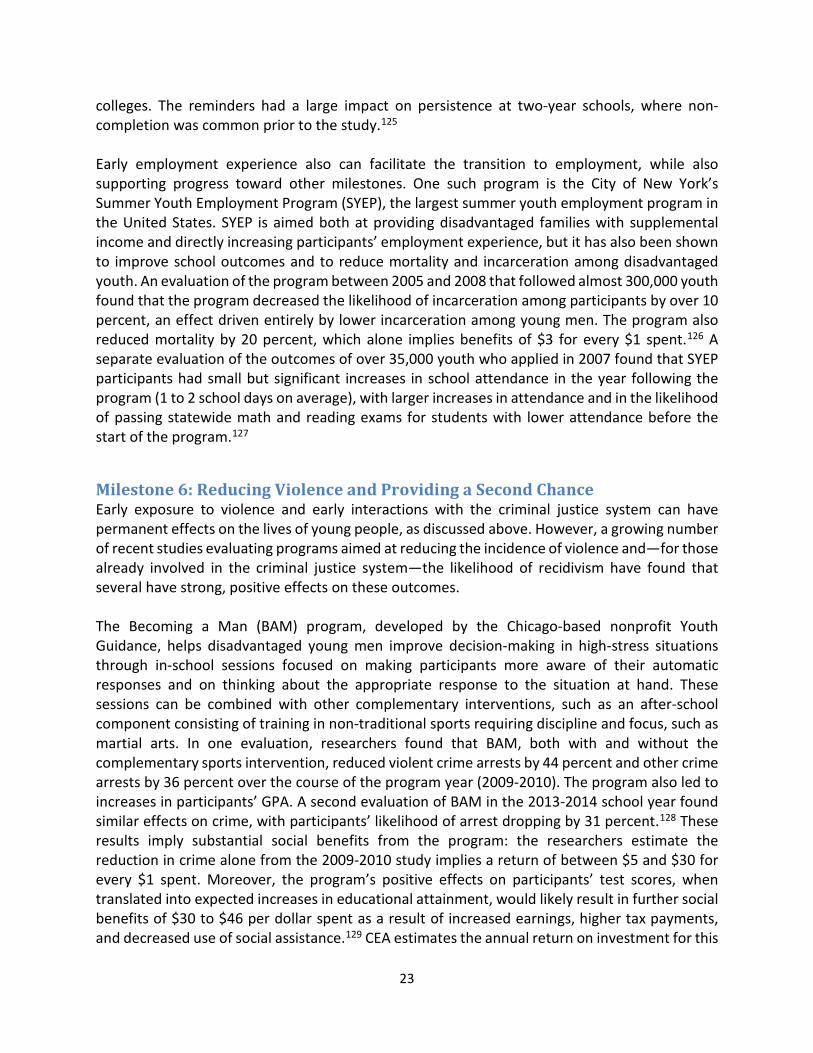
colleges. The reminders had a large impact on persistence at two-year schools, where non-completion was common prior to the study.125 Early employment experience also can facilitate the transition to employment, while also supporting progress toward other milestones. One such program is the City of New York’s Summer Youth Employment Program (SYEP), the largest summer youth employment program in the United States. SYEP is aimed both at providing disadvantaged families with supplemental income and directly increasing participants’ employment experience, but it has also been shown to improve school outcomes and to reduce mortality and incarceration among disadvantaged youth. An evaluation of the program between 2005 and 2008 that followed almost 300,000 youth found that the program decreased the likelihood of incarceration among participants by over 10 percent, an effect driven entirely by lower incarceration among young men. The program also reduced mortality by 20 percent, which alone implies benefits of $3 for every $1 spent.126 A separate evaluation of the outcomes of over 35,000 youth who applied in 2007 found that SYEP participants had small but significant increases in school attendance in the year following the program (1 to 2 school days on average), with larger increases in attendance and in the likelihood of passing statewide math and reading exams for students with lower attendance before the start of the program.127
Milestone 6: Reducing Violence and Providing a Second Chance Early exposure to violence and early interactions with the criminal justice system can have permanent effects on the lives of young people, as discussed above. However, a growing number of recent studies evaluating programs aimed at reducing the incidence of violence and—for those already involved in the criminal justice system—the likelihood of recidivism have found that several have strong, positive effects on these outcomes. The Becoming a Man (BAM) program, developed by the Chicago-based nonprofit Youth Guidance, helps disadvantaged young men improve decision-making in high-stress situations through in-school sessions focused on making participants more aware of their automatic responses and on thinking about the appropriate response to the situation at hand. These sessions can be combined with other complementary interventions, such as an after-school component consisting of training in non-traditional sports requiring discipline and focus, such as martial arts. In one evaluation, researchers found that BAM, both with and without the complementary sports intervention, reduced violent crime arrests by 44 percent and other crime arrests by 36 percent over the course of the program year (2009-2010). The program also led to increases in participants’ GPA. A second evaluation of BAM in the 2013-2014 school year found similar effects on crime, with participants’ likelihood of arrest dropping by 31 percent.128 These results imply substantial social benefits from the program: the researchers estimate the reduction in crime alone from the 2009-2010 study implies a return of between $5 and $30 for every $1 spent. Moreover, the program’s positive effects on participants’ test scores, when translated into expected increases in educational attainment, would likely result in further social benefits of $30 to $46 per dollar spent as a result of increased earnings, higher tax payments, and decreased use of social assistance.129 CEA estimates the annual return on investment for this
23

program to range from 18 to 24 percent, reflecting the benefits to earnings gains that accrue over a lifetime compared to a very small program cost. Traditional models of community-based mentoring have also been shown to have positive effects for disadvantaged youth. The nationally-recognized Big Brothers Big Sisters (BBBS) mentoring program pairs youth from disadvantaged backgrounds with a volunteer mentor for several hours each month. Program evaluations show that mentees skipped school less often, felt more confident in their ability to complete schoolwork, and had higher GPAs after participating.130 Students receiving mentoring have also been shown to be less likely to engage in violent behavior towards peers or to use drugs or alcohol.131 Recently, innovative programs have shown marked success in reducing recidivism among juveniles in detention. One recent approach delivers mentoring through a program of study and discussion of classical texts on virtue. This program, called Reading for Life (RFL), shows large impacts on reducing recidivism for first-time juvenile offenders. In RFL, a volunteer mentor leads reading groups, with literature-based discussions on classical virtue theory and moral development. A randomized evaluation of 500 juveniles charged with low-level offenses found that RFL participants were 38 percent less likely to be arrested again.132 As with the Becoming a Man program, this reduction in crime implies large social gains from the program, with $4 saved for every $1 spent. Separately, another curriculum that uses insights from cognitive behavioral therapy was tested on over 3,000 youth in the Cook County Juvenile Temporary Detention Center (JTDC) in Chicago between 2009 and 2011. Youth participated in programming provided by trained staff that focused in part on responding consciously to high-stress situations and received incentives for good behavior. The benefits of these reforms far exceeded the costs: recidivism to the JTDC 18 months after participants’ release fell by 21 percent.133
24

Conclusion On multiple dimensions—in family earnings, educational attainment, involvement with the criminal justice system, and employment in adulthood—too many of our youth still face barriers to success. The President announced the My Brother’s Keeper initiative and launched a task force with representatives from across Federal agencies both to work together and to partner with other members of the public and private sectors in order to address persistent opportunity gaps as part of ensuring that all young people can reach their full potential. The initiative has brought focus to key milestones in every young person’s life where we can apply evidence-based practices, and proven strategies, to improve outcomes for our children. When America misses these milestones, we fail our youth – and imperil our economic future. The gains we can achieve together by hitting these milestones are substantial, and they are possible with concerted investment in proven strategies for improving youth opportunities and outcomes.
25

Endnotes 1 Corcoran, Mary. 1995. "Rags to Rags: Poverty and Mobility in the United States." Annual Review of Sociology (1995): 237-267. http://www.jstor.org/stable/2083411; Astone, Nan Marie, and Sara S. McLanahan. 1991. "Family Structure, Parental Practices and High School Completion." American Sociological Review 56(3): 309-320; Pager, Devah. 2003. "The Mark of a Criminal Record." American Journal of Sociology 108(5) : 937-975. http://www.jstor.org/stable/10.1086/374403; Office for Civil Rights, Department of Education. 2014. “Civil Rights Data Collection Data Snapshot: School Discipline.” Issue Brief No. 1. http://www2.ed.gov/about/offices/list/ocr/docs/crdc-discipline-snapshot.pdf. 2 Chetty, Raj, and Nathaniel Hendren. 2015. “The Impacts of Neighborhoods on Intergenerational Mobility: Childhood Exposure Effects and County-Level Estimates.” http://www.equality-of-opportunity.org/images/nbhds_paper.pdf. 3 U.S. Census Bureau. 2014. “Income and Poverty in the United States: 2013.” Table B-2. http://www.census.gov/content/dam/Census/library/publications/2014/demo/p60-249.pdf. 4 Dahl, Gordon B. and Lance Lochner. 2012. “The Impact of Family Income on Child Achievement: Evidence from the Earned Income Tax Credit.” American Economic Review 102(5): 1927-1956. 5 Hoynes, Hilary W., Douglas L. Miller, and David Simon. 2012. “Income, the Earned Income Tax Credit, and Infant Health. American Economic Journal 7(1): 172-211; Manoli, Dayanand S. and Nicholas Turner. 2014. “Cash-on-Hand & College Enrollment: Evidence from Population Tax Data and Policy Nonlinearities.” NBER Working Paper No. 19836. http://www.nber.org/papers/w19836. 6 Aizer, Anna, Shari Eli, Joseph P. Ferrie, and Adriana Lleras-Muney. 2014. “The Long Term Impact of Cash Transfers to Poor Families.” NBER Working Paper No. 20103. http://www.nber.org/papers/w20103. 7 Hoynes, Hilary W., Diane Whitmore Schanzenbach, and Douglas Almond. 2012. “Long Run Impacts of Childhood Access to the Safety Net.” NBER Working Paper No. 18535. http://www.nber.org/papers/w18535. 8 Deming, David. 2009. “Early Childhood Intervention and Life-Cycle Development: Evidence from Head Start.” American Economic Journal: Applied Economics 1(3): 111-134. 9 Brown, David W., Amanda E. Kowalski, and Ithai Z. Lurie. 2015. “Medicaid as an Investment in Children: What is the Long-Term Impact on Tax Receipts?” NBER Working Paper No. 20835. http://www.nber.org/papers/w20835. 10 Duncan, Greg J., and Richard J. Murnane, eds. 2011. Whither Opportunity? Rising Inequality, Schools, and Children’s Life Chances. New York: Russell Sage Foundation; Western, Bruce, Christine Percheski, and Deirdre Bloome. 2008. “Inequality among American Families with Children, 1975 to 2005.” American Sociological Review 73(6): 903-920. 11 Alvaredo, Facundo, Anthony B. Atkinson, Thomas Piketty and Emmanuel Saez. The World Top Incomes Database. http://topincomes.g-mond.parisschoolofeconomics.eu/. 12 Carnevale, Anthony P., Stephen J. Rose, and Ban Cheah. 2011. “The College Payoff: Education, Occupations, Lifetime Earnings.” Georgetown University Center on Education and the Workforce. http://www2.ed.gov/policy/highered/reg/hearulemaking/2011/collegepayoff.pdf. 13 Council of Economic Advisers. 2015. “The Economics of Early Childhood Investments.” http://www.whitehouse.gov/sites/default/files/docs/early_childhood_report_update_final_non-embargo.pdf. 14 Howard, Kimberly and Richard V. Reeves. 2014. “The Marriage Effect: Money or Parenting?” The Brookings Institution. http://www.brookings.edu/blogs/social-mobility-memos/posts/2014/09/04-marriage-social-mobility-parenting-income-reeves. 15 Bureau of Labor Statistics, Current Population Survey (2014 Annual Social and Economic Supplement); CEA calculations. 16 Duncan and Murnane (2011); Putnam, Robert. 2015. Our Kids: The American Dream in Crisis. New York, New York: Simon & Schuster. 17 Jones, Lauren E., Kevin S. Milligan, and Mark Stabile. 2015. “Child Cash Benefits and Family Expenditures: Evidence from the National Child Benefit.” NBER Working Paper No. 21101. http://www.nber.org/papers/w21101. 18 Price, Joseph. 2010. "The Effects of Parental Time Investments: Evidence from Natural Within-Family Variation." Brigham Young University working paper. http://byuresearch.org/home/downloads/price_parental_time_2010.pdf.
26

19 Mullainathan, Sendhil and Eldar Shafir. 2013. Scarcity: Why Having Too Little Means So Much. New York: Times Books. 20 Ramey, Garey and Valerie A. Ramey. 2010. "The Rug Rat Race." Brookings Papers on Economic Activity 41(1): 129-176. The Brookings Institution. http://www.brookings.edu/~/media/Projects/BPEA/Spring%202010/2010a_bpea_ramey.PDF. 21 Kalil, Ariel, Rebecca Ryan, and Michael Corey. 2012 "Diverging Destinies: Maternal Education and the Developmental Gradient in Time with Children." Demography 49(4): 1361-1383. 22 Hart, Betty, and Todd R. Risley. 2003. "The Early Catastrophe: The 30 Million Word Gap by Age 3." American Educator 27(1): 4-9. https://www.aft.org/sites/default/files/periodicals/TheEarlyCatastrophe.pdf. 23 Putnam (2015). 24 Villena-Roldán, Benjamín and Cecilia Ríos-Aguilar. 2011. “Causal Effects of Maternal Time-Investment on Children’s Cognitive Outcomes.” Documentos de Trabajo 285, Centro de Economía Aplicada, Universidad de Chile, Santiago. http://www.dii.uchile.cl/wp-content/uploads/2012/02/Causal-Effects-of-Maternal-Time-Investment-on-Childrens-Cognitive-Outcomes-Benjamiiin-Villena-y-Cecilia-Riiios-Aguilar.pdf.. 25 Council of Economic Advisers. 2000. Teens and Their Parents in the 21st Century: An Examination of Trends in Teen Behavior and the Role of Parental Involvement. http://clinton3.nara.gov/WH/EOP/CEA/html/Teens_Paper_Final.pdf. 26 Price (2010). 27 Cancian, Maria, Kristen Shook Slack, and Mi Youn Yang. 2010. “The Effect of Family Income on Risk of Child Maltreatment.” Social Service Review 87(3): 417-437. Madison, WI: Institute for Research on Poverty, University of Wisconsin-Madison. 28 Department of Health and Human Services. 2015. Child Maltreatment 2013. http://www.acf.hhs.gov/sites/default/files/cb/cm2013.pdf. 29 Halle, Tamara, Nicole Forry, Elizabeth Hair, Kate Perper, Laura Wandner, Julia Wessel, and Jessica Vick. 2009. “Disparities in Early Learning and Development: Lessons from the Early Childhood Longitudinal Study – Birth Cohort (ECLS-B).” Washington, DC: Child Trends. http://www.elcmdm.org/Knowledge%20Center/reports/Child_Trends-2009_07_10_FR_DisparitiesEL.pdf; Council of Economic Advisers (2015); Reardon, Sean F. 2011. “The Widening Academic Achievement Gap between the Rich and the Poor: New Evidence and Possible Explanations.” In Duncan, Greg J., and Richard J. Murnane, eds,. Whither Opportunity? Rising Inequality, Schools, and Children’s Life Chances (2011), New York: Russell Sage Foundation, 91-116. 30 Council of Economic Advisers (2015). 31 Reardon (2011); Nielsen, Eric. 2015. “The Income-Achievement Gap and Adult Outcome Inequality.” Finance and Economics Discussion Series 2015-041. Washington, DC: Federal Reserve Board of Governors. http://dx.doi.org/10.17016/FEDS.2015.041. 32 Belley, Philippe, and Lance Lochner. 2007. “The Changing Role of Family Income and Ability in Determining Educational Achievement.” Journal of Human Capital 1(1): 37-89. The University of Chicago Press. 33 Bailey, Martha and Susan Dynarski. 2011. “Inequality in Postsecondary Education.” In Duncan, Greg J., and Richard J. Murnane, eds,. Whither Opportunity? Rising Inequality, Schools, and Children’s Life Chances (2011), New York: Russell Sage Foundation. 34 Duncan, Greg, Ariel Kalil, and Kathleen Ziol-Guest. 2015. “Parent Income-Based Gaps in Schooling, Earnings and Family Income: Cross-Cohort Trends in the NLSYs and the PSID.” Working paper. http://sites.uci.edu/gduncan/files/2013/06/RSF-Memo-Duncan-et-al-010815.pdf. 35 Chetty, Raj, Nathaniel Hendren, Patrick Kline, and Emmanuel Saez. 2014a. "Where is the Land of Opportunity? The Geography of Intergenerational Mobility in the United States." Quarterly Journal of Economics 129(4): 1553-1623. 36 Chetty, Raj, Nathaniel Hendren, Patrick Kline, and Emmanuel Saez. 2014b. “Mobility in All Commuting Zones.” The Equality of Opportunity Project. http://www.equality-of-opportunity.org/index.php/city-rankings/city-rankings-all; Chetty et al. (2014a). 37 Chetty, Raj and Nathaniel Hendren. 2015. “The Impacts of Neighborhoods on Intergenerational Mobility: Childhood Exposure Effects and County-Level Estimates.” http://www.equality-of-opportunity.org/images/nbhds_paper.pdf. 38 CEA calculation using 2009-2013 American Community Survey five-year population estimates for all counties, as well as positive causal effects on mobility based on Chetty and Hendren (2015) Online Data Table 2: Preferred Estimates of Causal Place Effects by County. http://www.equality-of-opportunity.org/index.php/data.
27

39 CEA calculations using five-year estimates from the 2013 American Community Survey. Youth are under 18. 40 Chetty and Hendren (2015), Table XI. 41 CEA calculations using five-year estimates from the 2013 American Community Survey. Youth are under 18. 42 Chetty and Hendren (2015). 43 Spaulding, Shayne, Robert Lerman, Harry Holzer, and Lauren Eyster. 2015. “Expanding Economic Opportunity for Young Men and Boys of Color through Employment and Training.” Urban Institute. http://www.urban.org/research/publication/expanding-economic-opportunity-young-men-and-boys-color-through-employment-and-training/view/full_report. 44 Cutler, David and Edward Glaeser. 1997. “Are Ghettos Good or Bad?” Quarterly Journal of Economics 112(3): 827-872. http://www.jstor.org/stable/2951257; Card, David and Jesse Rothstein. 2007. “Racial Segregation and the Black-White Test Score Gap.” Journal of Public Economics 91(11-12): 2158-2184; Dickerson, Niki T. 2007. "Black Employment, Segregation, and the Social Organization of Metropolitan Labor Markets." Economic Geography 83(3): 283-307; Subramanian, S. V., Dolores Acevedo-Garcia, and Theresa L. Osypuk. 2005. "Racial Residential Segregation and Geographic Heterogeneity in Black/White Disparity in Poor Self-Rated Health in the US: A Multilevel Statistical Analysis." Social Science and Medicine 60(8): 1667-1679; Acevedo-Garcia, Dolores, and Kimberly A. Lochner. 2003. "Residential Segregation and Health." In Ichiro Kawachi and Lisa F. Berkman, eds., Neighborhoods and Health. New York: Oxford University Press. 45 Rawlings, Lynette. 2015. “Understanding the Environmental Contexts of Boys and Young Men of Color.” Urban Institute. http://www.urban.org/sites/default/files/alfresco/publication-pdfs/2000096-Understanding-the-Environmental-Contexts-of-Boys-and-Young-Men-of-Color.pdf. 46 Cobb-Clark, Deborah and Erdal Tekin. 2011. “Fathers and Youth’s Delinquent Behavior.” Review of Economics of the Household 12(2): 327-358. 47 Bertrand, Marianne and Jessica Pan. 2013. “The Trouble with Boys: Social Influences and the Gender Gap in Disruptive Behavior.” American Economic Journal: Applied Economics 5(1): 32-64. 48Jacob, Brian A. 2002. “Where the Boys Aren’t: Non-cognitive Skills, Returns to School and the Gender Gap in Higher Education.” Economics of Education Review 21(6): 589-598; Buchmann, Claudia and Thomas DiPrete. 2006. “The Growing Female Advantage in College Completion: The Role of Family Background and Academic Achievement.” American Sociological Review 71(4): 515-541. 49 Kling, Jeffrey R., Jeffrey B. Liebman, and Lawrence F. Katz. 2007. “Experimental Analysis of Neighborhood Effects.” Econometrica 75(1): 83-119. 50 Clampet-Lundquist, Susan, Jeffrey Kling, Kathryn Edin, and Greg Duncan. 2011. “Moving Teenagers out of High-Risk Neighborhoods: How Girls Fare Better than Boys.” American Journal of Sociology 116(4): 1154-1189. 51 Department of Education. 2015. “It’s Time for Equitable Spending of State and Local Dollars.” http://www.ed.gov/blog/2015/02/its-time-for-equitable-spending-of-state-and-local-dollars. 52 National Center for Education Statistics, Department of Education. 2015. “Free or Reduced Price Lunch: A Proxy for Poverty?” http://nces.ed.gov/blogs/nces/post/free-or-reduced-price-lunch-a-proxy-for-poverty. 53 National Center for Education Statistics, Department of Education. 2010. “The Condition of Education: 2010 Spotlight: High-Poverty Public Schools.” http://nces.ed.gov/programs/coe/analysis/2010-figures.asp. 54 Office for Civil Rights, Department of Education. 2014. “Data Snapshot: College and Career Readiness.” http://ocrdata.ed.gov/Downloads/CRDC-College-and-Career-Readiness-Snapshot.pdf. 55 Torres, Mario S. and Jacqueline A. Stefkovich. 2009. “Demographics and Police Involvement: Implications for Student Civil Liberties and Just Leadership.” Education Administration Quarterly 45(3): 450-473; Office for Civil Rights. 2012. “The Transformed Civil Rights Data Collection: Revealing New Truths about our Nation’s Schools.” Department of Education. http://www2.ed.gov/about/offices/list/ocr/docs/crdc-2012-data-summary.pdf. 56 National Center for Education Statistics, Department of Education. “Digest of Education Statistics.” https://nces.ed.gov/programs/digest/d14/tables/dt14_104.20.asp?current=yes. 57 National Center for Education Statistics, Department of Education. “Digest of Education Statistics.” https://nces.ed.gov/programs/digest/d14/tables/dt14_104.20.asp. 58 Bureau of Labor Statistics; Current Population Survey; CEA calculations. 59 National Center for Education Statistics, Department of Education. “Digest of Education Statistics.” https://nces.ed.gov/programs/digest/d14/tables/dt14_104.20.asp?current=yes. 60 Bureau of Labor Statistics, Current Population Survey; CEA calculations. Calculation includes men ages 19-21.
28

61 Bureau of Labor Statistics. 2015. “College Enrollment and Work Activity of 2014 High School Graduates.” http://www.bls.gov/news.release/pdf/hsgec.pdf. Statistics for combined population of men and women. White and black both include those who identify as Hispanic. 62 Bureau of Labor Statistics. “Education and training assignments by detailed occupation, 2012.” http://www.bls.gov/emp/ep_table_112.htm. 63 ACT. 2014. “The Condition of College Readiness: Low-Income Students Class of 2013.” National Council for Community and Education Partnerships. http://www.act.org/newsroom/data/2013/states/pdf/LowIncomeStudents.pdf. 64 Smith, Jonathan, Matea Pender, Jessica Howell, and Michael Hurwitz. 2012. “Getting Into College: Postsecondary Academic Undermatch.” College Board Advocacy and Policy Center. http://media.collegeboard.com/digitalServices/pdf/nosca/collegekeys-brief-getting-into-college-postsecondary-undermatch.pdf; Roderick, Melissa, Jenny Nagaoka, Vanessa Coca, and Eliza Moeller. 2008. “From High School to the Future: Potholes on the Road to College.” Consortium on Chicago School Research. http://ccsr.uchicago.edu/sites/default/files/publications/CCSR_Potholes_Report.pdf; Bowen, William G., Matthew M. Chingos, and Michael S. McPherson. 2009. Crossing the Finish Line: Completing College at America's Public Universities. Princeton: Princeton University Press; Cohodes, Sarah and Joshua Goodman. 2013. “Merit Aid, College Quality and College Completion: Massachusetts’ Adams Scholarship as an In-Kind Subsidy.” American Economic Journal: Applied Economics 6(4): 251-285. 65 Deming, David and Susan Dynarski. 2010. “Into College, Out of Poverty? Policies to Increase the Postsecondary Attainment of the Poor.” In Phil Levine and David Zimmerman, eds., Targeting Investments in Children: Fighting Poverty When Resources are Limited, NBER Conference Report. 66 Department of Education. 2014. “Profile of Undergraduate Students: 2011-12.” 2011-12 National Postsecondary Student Aid Study (NPSAS:12). http://nces.ed.gov/pubs2015/2015167.pdf. 67 CEA calculations based on National Center for Education Statistics, Department of Education, 2011-12 National Postsecondary Student Aid Study (NPSAS:12) and National Center for Education Statistics, Department of Education. 2012. The Condition of Education 2012 (NCES 2012-045), Table A-47-2. 68 National Center for Education Statistics, Department of Education. 2014. “STEM Attrition: College Students’ Paths Into and Out of STEM Fields.” Table 2. 69 Rothwell, Jonathan. 2013. “The Hidden Stem Economy.” The Brookings Institution. http://www.brookings.edu/research/reports/2013/06/10-stem-economy-rothwell. 70 Office for Civil Rights (2014). 71 Cahalan, Margaret W. 1986. “Historical Corrections Statistics in the United States, 1850-1984.” Bureau of Justice Statistics, Department of Justice. http://www.bjs.gov/content/pub/pdf/hcsus5084.pdf. 72 Carson, Ann and William Sabol. 2012. “Prisoners in 2011.” Bureau of Justice Statistics, Department of Justice. http://www.bjs.gov/content/pub/pdf/p11.pdf. 73 American Civil Liberties Union. 2013. “The War on Marijuana in Black and White: Billions of Dollars Wasted on Racially Biased Arrests.” https://www.aclu.org/files/assets/aclu-thewaronmarijuana-rel2.pdf. Rates of marijuana use from the Substance Abuse and Mental Health Administration, Table 1.19B, 2009-2010, http://archive.samhsa.gov/data/NSDUH/2k10NSDUH/tabs/Sect1peTabs1to46.htm. 74 Langton, Lynn and Matthew Durose. 2013. “Policy Behavior during Traffic and Street Stops, 2011.” Bureau of Justice Statistics, Department of Justice. http://www.bjs.gov/content/pub/pdf/pbtss11.pdf. 75 Motivans, Mark. 2015. “Federal Justice Statistics, 2012 – Statistical Tables,” Tables 5.3 and 5.4. Bureau of Justice Statistics, Department of Justice. http://www.bjs.gov/content/pub/pdf/fjs12st.pdf. White and black include those of Hispanic origin. Exceptions include offenses classified as “violent” and “other.” 76 Civil Rights Division, Department of Justice. 2012. “Investigation of the Shelby County Juvenile Court.” http://www.justice.gov/crt/about/spl/documents/shelbycountyjuv_findingsrpt_4-26-12.pdf. 77 Bureau of Justice Statistics (2015), Table 1.3. White and black include those of Hispanic origin. 78 Bureau of Justice Statistics (2015), Table 7.10. White and black include those of Hispanic origin. 79 Bureau of Justice Statistics. “National Corrections Reporting Program: Sentence Length of State Prisoners by Offense, Admission Type, Sex and Race.” http://www.bjs.gov/index.cfm?ty=pbdetail&iid=2056. 80 Bureau of Labor Statistics, Current Population Survey, 2014; CEA calculations. Male youth of color defined as black or Hispanic youth ages 16-24.
29

81 Bureau of Labor Statistics, Current Population Survey, 2014; CEA calculations. Unemployment rates calculated for black, non-Hispanic young men ages 16-24. High school dropouts are defined as those without a high school degree who are not enrolled in school. 82 Wolfers, Justin, David Leonhardt, and Kevin Quealy. 2015. “1.5 Million Missing Black Men.” http://www.nytimes.com/interactive/2015/04/20/upshot/missing-black-men.html; Annie E. Casey Foundation. 2005. “Reentry: Helping Former Prisoners Return to Communities.” http://www.aecf.org/resources/reentry-helping-former-prisoners-return-to-communities. To calculate an upper bound on missing men, we used rates of missing by race among prime-age men from Wolfers, Leonhardt, and Quealy (2015). The 24 percentage-point difference therefore represents the gap if both missing black and white men were represented in the population as not employed. 83 Autor, David and Melanie Wasserman. 2013. “Wayward Sons: The Emerging Gender Gap in Labor Markets and Education.” Third Way. http://content.thirdway.org/publications/662/Third_Way_Report_-_NEXT_Wayward_Sons-The_Emerging_Gender_Gap_in_Labor_Markets_and_Education.pdf. 84Bureau of Labor Statistics, Current Population Survey. “Median weekly earnings of full-time wage and salary workers by selected characteristics.” http://www.bls.gov/cps/cpsaat37.pdf. White and black include those of Hispanic origin. 85 Bertrand, Marianne and Sendhil Mullainathan. 2004. "Are Emily and Greg More Employable Than Lakisha and Jamal? A Field Experiment on Labor Market Discrimination." American Economic Review 94(4): 991-1013. 86 Charles, Kerwin Kofi and Jonathan Guryan. 2008. "Prejudice and Wages: An Empirical Assessment of Becker’s The Economics of Discrimination." Journal of Political Economy 116(5): 773-809; Fryer, Roland, Devah Pager, and Jorg Spenkuch. 2013. "Racial Disparities in Job Finding and Offered Wages." Journal of Law and Economics 56(3): 633-690. 87 Bureau of Labor Statistics, Employment Projections 2014; Grogger, Jeffrey. 1995. “The Effect of Arrests on the Employment and Earnings of Young Men.” Quarterly Journal of Economics 110(1): 51-71; Nagin, Daniel and Joel Waldfogel. 1995. “The Effects of Criminality and Conviction on the Labor Market Status of Young British Offenders.” International Review of Law and Economics 15(1): 109-126. 88 Wolfers, Leonhardt, and Quealy (2015). 89 Holzer, Harry J., Steven Raphael, and Michael A. Stoll. 2004. “How willing are employers to hire ex-offenders?” Focus 23(2). http://www.irp.wisc.edu/publications/focus/pdfs/foc232h.pdf. 90 Decker, Scott H., Cassia Spohn, Natalie R. Ortiz, and Eric Hedberg. 2014. “Criminal Stigma, Race, Gender and Employment: An Expanded Assessment of the Consequences of Imprisonment for Employment.” Department of Justice. https://www.ncjrs.gov/pdffiles1/nij/grants/244756.pdf. 91 Bureau of Labor Statistics, Current Population Survey; CEA calculations. Data are for 2015:Q1, and white includes those of Hispanic origin. 92 Wolfers, Leonhardt, and Quealy (2015) estimate 1.5 million missing men. Lerman and Martin estimate this population to be smaller, at 775,000. Lerman, Robert I. and Steven Martin. “Urban Wire: Let’s Capture a More Accurate Picture of America’s Missing Black Men.” April 29, 2015. http://www.urban.org/urban-wire/lets-capture-more-accurate-picture-americas-missing-black-men. 93 CEA calculations based on data from 1988 Vital Statistics and the 2013 American Community Survey. 94 Reyes, Jessica Wolpaw. 2007. "Environmental Policy as Social Policy? The Impact of Childhood Lead Exposure on Crime." BE Journal of Economic Analysis & Policy 7(1): 1-43; Berk, Richard, Kenneth Lenihan, and Peter Rossi. 1980. “Crime and Poverty: Some Experimental Evidence from Ex-Offenders.” American Sociological Review 45(5): 766-786. 95 Gould, Eric D., Bruce A. Weinberg, and David B. Mustard. 2002. "Crime Rates and Local Labor Market Opportunities in the United States: 1979–1997." Review of Economics and Statistics 84(1): 45-61. 96 Raphael, Steven, and Rudolf Winter-Ebmer. 2001. "Identifying the Effect of Unemployment on Crime." Journal of Law and Economics 44(1): 259-283 97 Schmitt, John, Kris Warner, and Sarika Gupta. 2010. “The High Budgetary Cost of Incarceration.” Center for Economic Policy and Research. http://www.cepr.net/documents/publications/incarceration-2010-06.pdf. 98 Glaze, Lauren E. and Laura M. Maruschak. 2010. “Parents in Prison and Their Minor Children.” Bureau of Justice Statistics. Department of Justice. http://www.bjs.gov/content/pub/pdf/pptmc.pdf. 99 Parke, Ross D. and K. Alison Clarke-Stewart. 2003. "The Effects of Parental Incarceration on Children." In Jeremy Travis and Michelle Waul, eds., Prisoners Once Removed: The Impact of Incarceration and Reentry on Children, Families, and Communities. Washington: Urban Institute Press.
30

100 Holzer, Harry J., Paul Offner, and Elaine Sorensen. 2005. "Declining Employment Among Young Black Less-Educated Men: The Role of Incarceration and Child Support." Journal of Policy Analysis and Management 24(2): 329-350. 101 Holzer, Harry J. 2007. "Collateral Costs: The Effects of Incarceration on the Employment and Earnings of Young Workers." IZA Discussion Paper No. 3118. http://repec.iza.org/dp3118.pdf; Pager, Devah. 2003. “The Mark of a Criminal Record.” American Journal of Sociology 108(5): 937-975. 102 Charles, Kerwin Kofi and Ming Ching Luoh. 2010. "Male Incarceration, the Marriage Market, and Female Outcomes." Review of Economics and Statistics 92(3): 614-627. 103 National Center for Education Statistics, Department of Education. “The Nation’s Report Card: Reading: 2013 State Snapshot.” http://nces.ed.gov/nationsreportcard/subject/publications/stt2013/pdf/2014464OH4.pdf. 104 Hernandez, Donald. 2011. “Double Jeopardy: How Third-Grade Reading Skills and Poverty Influence High School Graduation.” The Annie E. Casey Foundation. http://gradelevelreading.net/wp-content/uploads/2012/01/Double-Jeopardy-Report-030812-for-web1.pdf. 105 U.S. Census Bureau. 2014. School Enrollment: CPS October 2013. Table 3. https://www.census.gov/hhes/school/data/cps/2013/tables.html. These rates exclude students enrolled in kindergarten. 106 Duncan, Greg J. and Katherine Magnuson. 2013. “Investing in Preschool Programs.” Journal of Economic Perspectives 27(2): 109-132. 107 Campbell, Frances A., Elizabeth P. Pungello, Kristen Kainz, Margaret Burchinal, Yi Pan, Oscar Barbarin, Joseph J. Sparling, and Craig T. Ramey. 2012. “Adult Outcomes as a Function of an Early Childhood Educational Program: An Abecedarian Project Follow-Up.” Developmental Psychology, 48(4): 1033-1043. 108 Schweinhart, Lawrence J., Jeanne Montie, Zongping Xiang, William S. Barnett, Clive R. Belfield, and Milagros Nores. 2005. Lifetime Effects: The High/Scope Perry Preschool Study Through Age 40. Ypsilanti, MI: High/Scope Press. http://www.highscope.org/file/Research/PerryProject/specialsummary_rev2011_02_2.pdf. 109 Heckman, James J., Seong Hyeok Moon, Rodrigo Pinto, Peter A. Savelyev, and Adam Yavitz. 2010. "Reanalysis of the High/Scope Perry Preschool Program." Quantitative Economics 1(1): 1-46. 110 Masse, Leonard N. and W. Steven Barnett. 2002. “A Benefit Cost Analysis of the Abecedarian Early Childhood Intervention.” New Brunswick, NJ: National Institute for Early Education Research http://nieer.org/resources/research/AbecedarianStudy.pdf; Heckman et al. (2010); Reynolds, Arthur J., Judy A. Temple, Dylan L. Robertson, and Emily A. Mann. 2002. "Age 21 Cost-Benefit Analysis of the Title I Chicago Child-Parent Centers." Educational Evaluation and Policy Analysis 24(4): 267-303. 111 Cascio, Elizabeth U. and Diane Whitmore Schanzenbach. 2013. “The Impacts of Expanding Access to High-Quality Preschool Education.” Brookings Papers on Economic Activity 47(2): 127-192. 112 Dobbie, Will and Roland G. Fryer. 2011. “Are High-Quality Schools Enough to Increase Achievement Among the Poor? Evidence from the Harlem Children's Zone.” American Economic Journal: Applied Economics 3(3): 158-187; Angrist, Joshua D., Susan M. Dynarski, Thomas J. Kane, Parag A. Pathak, and Christopher R. Walters. 2010. “Inputs and Impacts in Charter Schools: KIPP Lynn?” American Economic Review Papers and Proceedings 100:1-5. http://economics.mit.edu/files/5176; Tuttle, Christina Clark, Bing-ru Teh, Ira Nichols-Barrer, Brian P. Gill, and Philip Gleason. 2010. “Student Characteristics and Achievement in 22 KIPP Middle Schools: Final Report.” Mathematica Policy Research. http://www.mathematica-mpr.com/publications/PDFs/education/KIPP_fnlrpt.pdf; Curto, Vilsa and Roland G. Fryer. 2014. “The Potential of Urban Boarding Schools for the Poor: Evidence from SEED.” Journal of Labor Economics 32(1): 65-93 113 Curto and Fryer (2014), Appendix C. 114 Dobbie, Will and Roland G. Fryer. 2014. “The Medium-Term Impacts of High-Achieving Charter Schools.” Working paper. http://scholar.princeton.edu/sites/default/files/wdobbie/files/dobbie_fryer_hcz.pdf. 115 Dobbie, Will and Roland G. Fryer. 2013. “Getting Beneath the Veil of Effective Schools: Evidence from New York City.” American Economic Journal: Applied Economics 5(4): 28-60. 116 Bureau of Labor Statistics. 2015. “College Enrollment and Work Activity of 2014 High School Graduates.” http://www.bls.gov/news.release/pdf/hsgec.pdf. Statistics for combined population of men and women. White and black both include those who identify as Hispanic. 117 National Center for Education Statistics, Department of Education, Common Core of Data. https://nces.ed.gov/ccd/tables/ACGR_RE_and_characteristics_2012-13.asp.
31

118 Deming, David, and Susan Dynarski. 2010. “College Aid.” In Targeting Investments in Children: Fighting Poverty When Resources are Limited, ed. Phillip Levine and David Zimmerman. http://www.nber.org/chapters/c11730.pdf; Bettinger, Eric. 2004. “How Financial Aid Affects Persistence.” In College Choices: The Economics of Where to Go, When to Go, and How to Pay for It, 207-238. University of Chicago Press. http://www.nber.org/chapters/c10101.pdf. 119 Dynarski, Susan. 2008. “Building the Stock of College-Educated Labor.” Journal of Human Resources 43(3): 576-610; Scott-Clayton, Judith. 2011. “On Money and Motivation: A Quasi-Experimental Analysis of Financial Incentives for College Achievement.” Journal of Human Resources 46(3): 614-646; Castleman, Benjamin L. and Bridget T. Long. 2013. “Looking Beyond Enrollment: The Causal Effect of Need-Based Grants on College Access, Persistence and Graduation. NBER Working Paper No. 19306. http://www.nber.org/papers/w19306; Bettinger, Eric. 2004. “How Financial Aid Affects Persistence.” In College Choices: The Economics of Where to Go, When to Go, and How to Pay for It, 207-238. http://www.nber.org/chapters/c10101.pdf. 120 Scott-Clayton, Judith. 2011. “On Money and Motivation: A Quasi-Experimental Analysis of Financial Incentives for College Achievement.” Journal of Human Resources 46(3): 614-646; Angrist, Joshua, Daniel Lang, and Philip Oreopoulos. 2009. “Incentives and Services for College Achievement: Evidence from a Randomized Trial.” American Economic Journal: Applied Economics: 136-163; Richburg-Hayes, Lashawn, Thomas Brock, Allen LeBlanc, Christina Paxson, Cecilia Elena Rouse, and Lisa Barrow. 2009. “Rewarding Persistence: Effects of a Performance-Based Scholarship for Low-Income Parents.” MDRC. http://www.mdrc.org/sites/default/files/rewarding_persistence_fr.pdf. 121 Bettinger, Eric and Rachel Baker. 2014. “The Effects of Student Coaching: An Evaluation of a Randomized Experiment in Student Advising.” Educational Evaluation and Policy Analysis 36(1): 3-19. 122 Richburg-Hayes et al. (2009). 123 Scrivener, Susan, Michael Weiss, Alyssa Ratledge, Timothy Rudd, Colleen Sommo, and Hannah Fresques. 2015. “Doubling Graduation Rates: Three-Year Effects of CUNY’s Accelerated Study in Associate Programs (ASAP) for Developmental Education Students.” MDRC. http://www.mdrc.org/sites/default/files/doubling_graduation_rates_fr.pdf. 124 Cohodes, Sarah, and Joshua Goodman. 2014. “Merit Aid, College Quality, and College Completion: Massachusetts’ Adams Scholarship as an In-Kind Subsidy.” American Economic Journal: Applied Economics 6(4): 251-285. https://www.aeaweb.org/articles.php?doi=10.1257/app.6.4.251. 125 Castleman, Benjamin L. and Lindsay C. Page. 2014. “Freshman Year Financial Aid Nudges: An Experiment to Increase FAFSA Renewal and College Persistence.” University of Virginia EdPolicyWorks Working Paper. http://curry.virginia.edu/uploads/resourceLibrary/29_Freshman_Year_Financial_Aid_Nudges.pdf. 126 Gelber, Alexander, Adam Isen, and Judd B. Kessler. 2014. “The Effects of Youth Employment: Evidence from New York City Summer Youth Employment Program Lotteries.” NBER Working Paper No. 20810. http://www.nber.org/papers/w20810. 127 Leos-Urbel, Jacob. 2014. “What Is a Summer Job Worth? The Impact of Summer Youth Employment on Academic Outcomes.” Journal of Policy Analysis and Management 33(4): 891-911. 128 Heller, Sara B., Anuj K. Shah, Jonathan Guryan, Jens Ludwig, Sendhil Mullainathan, and Harold A. Pollack. 2015. “Thinking, Fast and Slow? Some Field Experiments to reduce Crime and Dropout in Chicago.” NBER Working Paper. No. 21178. http://www.nber.org/papers/w21178. 129 Heller, Sara, Harold A. Pollack, Roseanna Ander, and Jens Ludwig. 2013. “Preventing Youth Violence and Dropout: A Randomized Field Experiment.” NBER Working Paper No. 19014. http://www.nber.org/papers/w19014. 130 Tierney, Joseph P., Jean Baldwin Grossman, and Nancy L. Resch. 1995. “Making a Difference: An Impact Study of Big Brothers Big Sisters.” Public/Private Ventures, Philadelphia, PA. http://www.issuelab.org/fetch/publicprivate_ventures_104.pdf. 131 Grossman, Jean Baldwin, and Joseph P. Tierney. 1998. "Does Mentoring Work? An Impact Study of the Big Brothers Big Sisters Program," Evaluation Review 22(3): 403-426. 132 Seroczynski, A.D., William N. Evans, Amy D. Jobst, Luke Horvath, and Giuliana Carozza. 2015. “Reading for Life and Adolescent Re-Arrest: Evaluating a Unique Juvenile Diversion Program.” Working paper. 133 Heller et al. (2015).
32
Technical Appendix: Changes in GDP Associated with Greater Educational Attainment This exercise follows the method used by the Hamilton Project1 to construct an alternative (counterfactual) earnings distribution under various changes to the educational distribution. We use earnings data on men between the ages of 25 and 64 from the 2014 Current Population Survey Outgoing Rotation Groups to construct the actual earnings distribution. In order to simulate what the earnings distribution would look like with greater educational attainment among men of color, we then reassign individuals to have employment and earnings from a different education group. “White” is defined as white, non-Hispanic, and employment is defined as having positive earnings in the previous week. Those who are listed as currently not employed (either unemployed or not in the labor force) and have weekly earnings that are missing or “not applicable” are assigned zero earnings. Those who are employed but have missing earnings are dropped; this group consists entirely of the self-employed and those working without pay. We then construct the counterfactual earnings distribution under the assumption that the black and Hispanic male educational distribution matches the white male educational distribution. To do this, we first identify an individual’s actual educational category: less than a high school diploma, high school diploma or equivalent, some college, or bachelor’s degree or higher. Then, black and Hispanic individuals are selected at random to have greater educational attainment until the non-white education distribution matches the white distribution. Specifically, individuals are “moved up” from the next lowest educational category: for example, in order to achieve the same share of individuals in the black and Hispanic distribution as in the white distribution that have a bachelor’s degree or higher, some individuals with some college experience are randomly assigned to have a bachelor’s degree. Then, in order to match the “some college” distribution, individuals with a high school degree are randomly assigned to move up. Black and Hispanic individuals are then randomly assigned a new wage from the earnings distribution for their new educational category from the existing black and Hispanic earnings distribution within that new category. Following Hershbein, Kearney, and Summers (2015), earnings for all individuals are adjusted to account for the differences in the supply of college graduates and non-college graduates once the black and Hispanic educational distribution is shifted. To do so, we use a CES model with sigma equal to 5/3, the multiplier for non-college graduates equal to 1, and the multiplier for college graduates equal to 1.6. Again following Hershbein, Kearney, and Summers (2015), this
1 Hershbein, Brad, Melissa S. Kearney, and Lawrence H. Summers. 2015. “Increasing Education: What It Will and Will Not Do for Earnings and Earnings Inequality.” The Hamilton Project. http://www.hamiltonproject.org/files/downloads_and_links/impact_of_edu_earnings_inequality_hershbein_kearney_summers.pdf.
33

DRAFT - DELIBERATIVE
analysis uses Acemoglu and Autor (2010)’s estimates that the college wage premium falls 6 percent for every 10 percent increase in supply.2 This counterfactual exercise only shifts the education distribution of black and Hispanic men between the ages of 25 and 64, but calculations for overall changes in GDP and the wage bill reflect the impact of our simulated earnings changes for these men between the ages of 25 and 64 on aggregate earnings for the total population. We calculate the GDP impact of the additional employment under the counterfactual as the percent increase in overall employment generated by the change to the counterfactual. We calculate the GDP impact of the added earnings under the counterfactual as the percent change in earnings for black and Hispanic men times their share of total employment under the counterfactual. In other words, we assume that the earnings increases due to increased educational attainment reflect increases in aggregate productivity. Both impacts derive from a supply-side expression for GDP.
2 Acemoglu, Daron and David Autor. “Skills, Tasks and Technologies: Implications for Employment and Earnings.” NBER Working Paper No. 16082. http://www.nber.org/papers/w16082.
34